Embed Size (px)
Citation preview

PART 2
Transportation Earthworks: Compaction, Specification, and
Construction with Nontraditional Materials and Methods
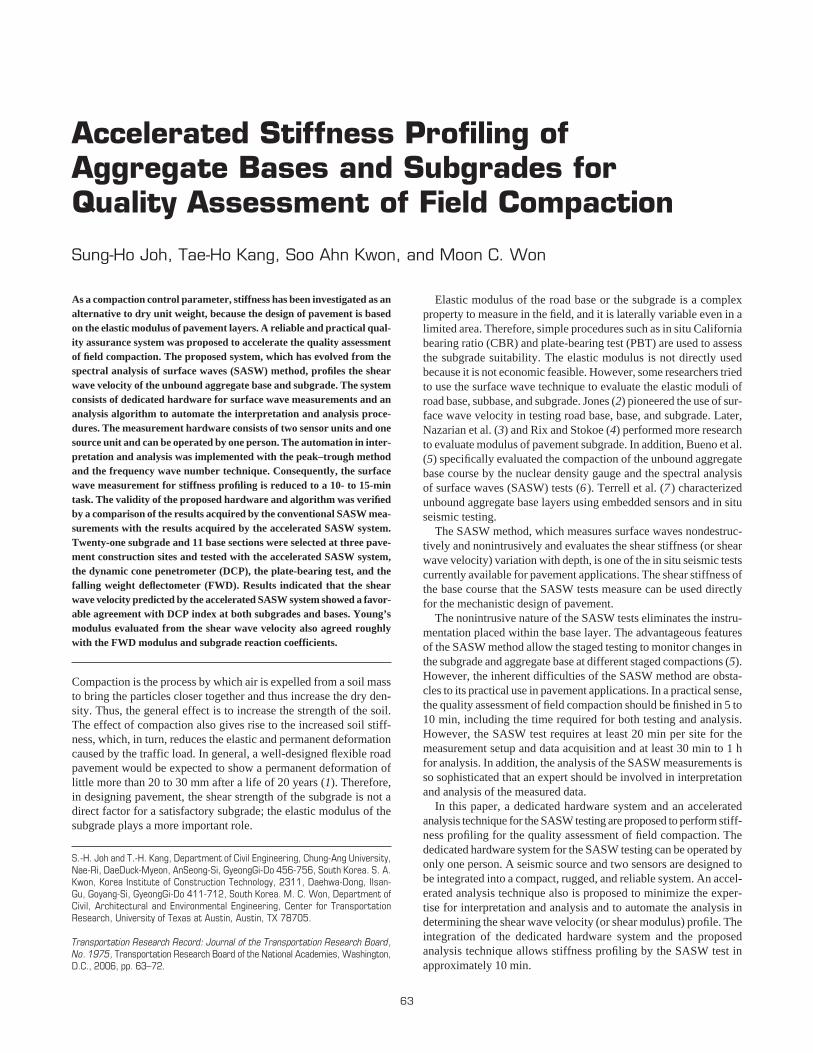
As a compaction control parameter, stiffness has been investigated as analternative to dry unit weight, because the design of pavement is basedon the elastic modulus of pavement layers. A reliable and practical qual-ity assurance system was proposed to accelerate the quality assessmentof field compaction. The proposed system, which has evolved from thespectral analysis of surface waves (SASW) method, profiles the shearwave velocity of the unbound aggregate base and subgrade. The systemconsists of dedicated hardware for surface wave measurements and ananalysis algorithm to automate the interpretation and analysis proce-dures. The measurement hardware consists of two sensor units and onesource unit and can be operated by one person. The automation in inter-pretation and analysis was implemented with the peak–trough methodand the frequency wave number technique. Consequently, the surfacewave measurement for stiffness profiling is reduced to a 10- to 15-mintask. The validity of the proposed hardware and algorithm was verifiedby a comparison of the results acquired by the conventional SASW mea-surements with the results acquired by the accelerated SASW system.Twenty-one subgrade and 11 base sections were selected at three pave-ment construction sites and tested with the accelerated SASW system,the dynamic cone penetrometer (DCP), the plate-bearing test, and thefalling weight deflectometer (FWD). Results indicated that the shearwave velocity predicted by the accelerated SASW system showed a favor-able agreement with DCP index at both subgrades and bases. Young’smodulus evaluated from the shear wave velocity also agreed roughlywith the FWD modulus and subgrade reaction coefficients.
Compaction is the process by which air is expelled from a soil massto bring the particles closer together and thus increase the dry den-sity. Thus, the general effect is to increase the strength of the soil.The effect of compaction also gives rise to the increased soil stiff-ness, which, in turn, reduces the elastic and permanent deformationcaused by the traffic load. In general, a well-designed flexible roadpavement would be expected to show a permanent deformation oflittle more than 20 to 30 mm after a life of 20 years (1). Therefore,in designing pavement, the shear strength of the subgrade is not adirect factor for a satisfactory subgrade; the elastic modulus of thesubgrade plays a more important role.
Elastic modulus of the road base or the subgrade is a complexproperty to measure in the field, and it is laterally variable even in alimited area. Therefore, simple procedures such as in situ Californiabearing ratio (CBR) and plate-bearing test (PBT) are used to assessthe subgrade suitability. The elastic modulus is not directly usedbecause it is not economic feasible. However, some researchers triedto use the surface wave technique to evaluate the elastic moduli ofroad base, subbase, and subgrade. Jones (2) pioneered the use of sur-face wave velocity in testing road base, base, and subgrade. Later,Nazarian et al. (3) and Rix and Stokoe (4) performed more researchto evaluate modulus of pavement subgrade. In addition, Bueno et al.(5) specifically evaluated the compaction of the unbound aggregatebase course by the nuclear density gauge and the spectral analysisof surface waves (SASW) tests (6 ). Terrell et al. (7 ) characterizedunbound aggregate base layers using embedded sensors and in situseismic testing.
The SASW method, which measures surface waves nondestruc-tively and nonintrusively and evaluates the shear stiffness (or shearwave velocity) variation with depth, is one of the in situ seismic testscurrently available for pavement applications. The shear stiffness ofthe base course that the SASW tests measure can be used directlyfor the mechanistic design of pavement.
The nonintrusive nature of the SASW tests eliminates the instru-mentation placed within the base layer. The advantageous featuresof the SASW method allow the staged testing to monitor changes inthe subgrade and aggregate base at different staged compactions (5).However, the inherent difficulties of the SASW method are obsta-cles to its practical use in pavement applications. In a practical sense,the quality assessment of field compaction should be finished in 5 to10 min, including the time required for both testing and analysis.However, the SASW test requires at least 20 min per site for themeasurement setup and data acquisition and at least 30 min to 1 hfor analysis. In addition, the analysis of the SASW measurements isso sophisticated that an expert should be involved in interpretationand analysis of the measured data.
In this paper, a dedicated hardware system and an acceleratedanalysis technique for the SASW testing are proposed to perform stiff-ness profiling for the quality assessment of field compaction. Thededicated hardware system for the SASW testing can be operated byonly one person. A seismic source and two sensors are designed tobe integrated into a compact, rugged, and reliable system. An accel-erated analysis technique also is proposed to minimize the exper-tise for interpretation and analysis and to automate the analysis indetermining the shear wave velocity (or shear modulus) profile. Theintegration of the dedicated hardware system and the proposedanalysis technique allows stiffness profiling by the SASW test inapproximately 10 min.
Accelerated Stiffness Profiling ofAggregate Bases and Subgrades forQuality Assessment of Field Compaction
Sung-Ho Joh, Tae-Ho Kang, Soo Ahn Kwon, and Moon C. Won
S.-H. Joh and T.-H. Kang, Department of Civil Engineering, Chung-Ang University,Nae-Ri, DaeDuck-Myeon, AnSeong-Si, GyeongGi-Do 456-756, South Korea. S. A.Kwon, Korea Institute of Construction Technology, 2311, Daehwa-Dong, Ilsan-Gu, Goyang-Si, GyeongGi-Do 411-712, South Korea. M. C. Won, Department ofCivil, Architectural and Environmental Engineering, Center for TransportationResearch, University of Texas at Austin, Austin, TX 78705.
63
Transportation Research Record: Journal of the Transportation Research Board,No. 1975, Transportation Research Board of the National Academies, Washington,D.C., 2006, pp. 63–72.
The accelerated SASW system based on the devised hardwareand analysis algorithm was applied to several pavement projects inSouth Korea. The measured shear wave velocities and the evaluatedYoung’s moduli of road bases and subgrades were compared withthe results of the conventional quality control procedures, includ-ing PBT, dynamic cone penetrometer (DCP), and falling weightdeflectometer (FWD); they are presented here.
PHASE VELOCITY AS INDICATOR OF SUBGRADE MODULUS
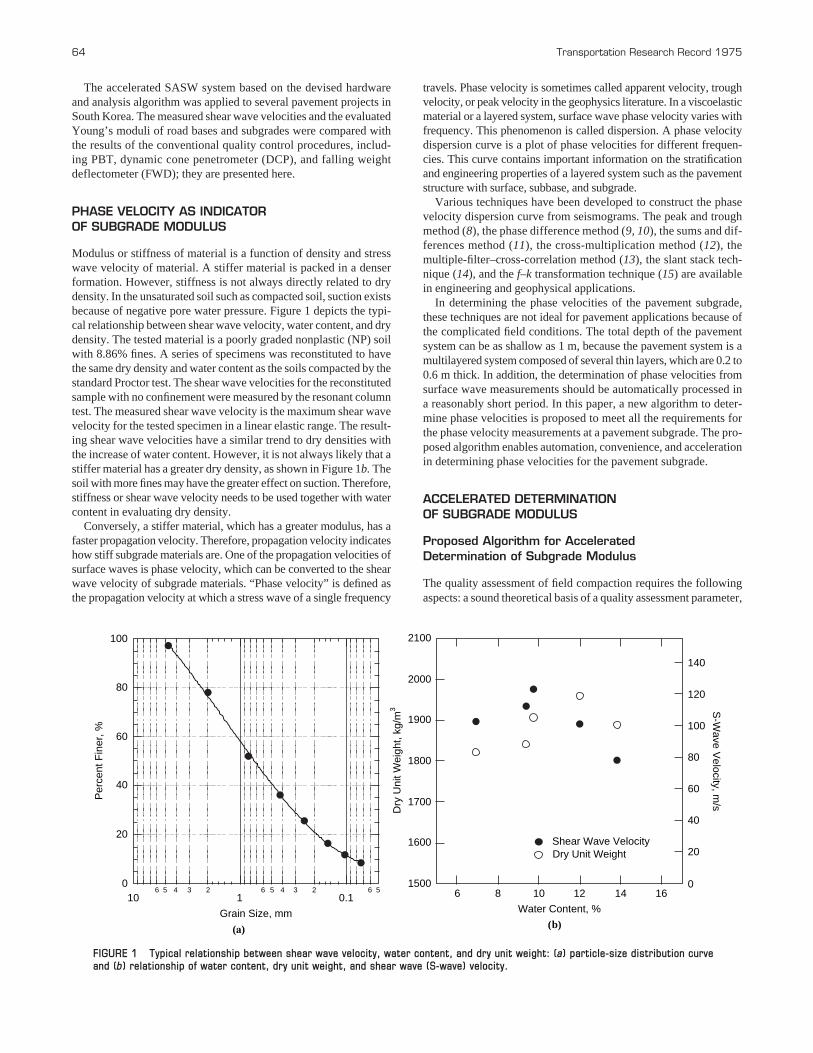
Modulus or stiffness of material is a function of density and stresswave velocity of material. A stiffer material is packed in a denserformation. However, stiffness is not always directly related to drydensity. In the unsaturated soil such as compacted soil, suction existsbecause of negative pore water pressure. Figure 1 depicts the typi-cal relationship between shear wave velocity, water content, and drydensity. The tested material is a poorly graded nonplastic (NP) soilwith 8.86% fines. A series of specimens was reconstituted to havethe same dry density and water content as the soils compacted by thestandard Proctor test. The shear wave velocities for the reconstitutedsample with no confinement were measured by the resonant columntest. The measured shear wave velocity is the maximum shear wavevelocity for the tested specimen in a linear elastic range. The result-ing shear wave velocities have a similar trend to dry densities withthe increase of water content. However, it is not always likely that astiffer material has a greater dry density, as shown in Figure 1b. Thesoil with more fines may have the greater effect on suction. Therefore,stiffness or shear wave velocity needs to be used together with watercontent in evaluating dry density.
Conversely, a stiffer material, which has a greater modulus, has afaster propagation velocity. Therefore, propagation velocity indicateshow stiff subgrade materials are. One of the propagation velocities ofsurface waves is phase velocity, which can be converted to the shearwave velocity of subgrade materials. “Phase velocity” is defined asthe propagation velocity at which a stress wave of a single frequency
64 Transportation Research Record 1975
travels. Phase velocity is sometimes called apparent velocity, troughvelocity, or peak velocity in the geophysics literature. In a viscoelasticmaterial or a layered system, surface wave phase velocity varies withfrequency. This phenomenon is called dispersion. A phase velocitydispersion curve is a plot of phase velocities for different frequen-cies. This curve contains important information on the stratificationand engineering properties of a layered system such as the pavementstructure with surface, subbase, and subgrade.
Various techniques have been developed to construct the phasevelocity dispersion curve from seismograms. The peak and troughmethod (8), the phase difference method (9, 10), the sums and dif-ferences method (11), the cross-multiplication method (12), themultiple-filter–cross-correlation method (13), the slant stack tech-nique (14), and the f–k transformation technique (15) are availablein engineering and geophysical applications.
In determining the phase velocities of the pavement subgrade,these techniques are not ideal for pavement applications because ofthe complicated field conditions. The total depth of the pavementsystem can be as shallow as 1 m, because the pavement system is amultilayered system composed of several thin layers, which are 0.2 to0.6 m thick. In addition, the determination of phase velocities fromsurface wave measurements should be automatically processed ina reasonably short period. In this paper, a new algorithm to deter-mine phase velocities is proposed to meet all the requirements forthe phase velocity measurements at a pavement subgrade. The pro-posed algorithm enables automation, convenience, and accelerationin determining phase velocities for the pavement subgrade.
ACCELERATED DETERMINATION OF SUBGRADE MODULUS
Proposed Algorithm for AcceleratedDetermination of Subgrade Modulus
The quality assessment of field compaction requires the followingaspects: a sound theoretical basis of a quality assessment parameter,
100
80
60
40
20
0
Per
cent
Fin
er, %
560.1
234561
2345610
Grain Size, mm
140
120
100
80
60
40
20
0
S-W
ave Velocity, m
/s
1614121086
Water Content, %
2100
2000
1900
1800
1700
1600
1500
Dry
Uni
t Wei
ght,
kg/m
3
Shear Wave Velocity Dry Unit Weight
(a) (b)
FIGURE 1 Typical relationship between shear wave velocity, water content, and dry unit weight: (a) particle-size distribution curveand (b) relationship of water content, dry unit weight, and shear wave (S-wave) velocity.
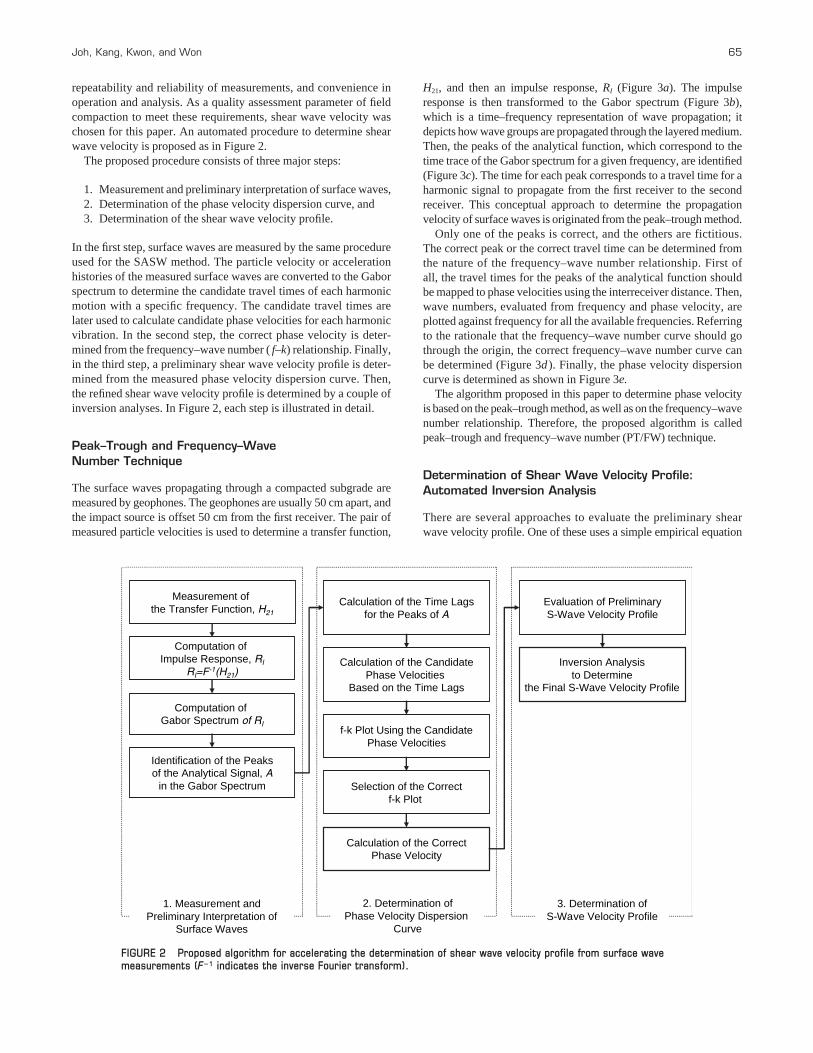
repeatability and reliability of measurements, and convenience inoperation and analysis. As a quality assessment parameter of fieldcompaction to meet these requirements, shear wave velocity waschosen for this paper. An automated procedure to determine shearwave velocity is proposed as in Figure 2.
The proposed procedure consists of three major steps:
1. Measurement and preliminary interpretation of surface waves,2. Determination of the phase velocity dispersion curve, and3. Determination of the shear wave velocity profile.
In the first step, surface waves are measured by the same procedureused for the SASW method. The particle velocity or accelerationhistories of the measured surface waves are converted to the Gaborspectrum to determine the candidate travel times of each harmonicmotion with a specific frequency. The candidate travel times arelater used to calculate candidate phase velocities for each harmonicvibration. In the second step, the correct phase velocity is deter-mined from the frequency–wave number ( f–k) relationship. Finally,in the third step, a preliminary shear wave velocity profile is deter-mined from the measured phase velocity dispersion curve. Then,the refined shear wave velocity profile is determined by a couple ofinversion analyses. In Figure 2, each step is illustrated in detail.
Peak–Trough and Frequency–WaveNumber Technique
The surface waves propagating through a compacted subgrade aremeasured by geophones. The geophones are usually 50 cm apart, andthe impact source is offset 50 cm from the first receiver. The pair ofmeasured particle velocities is used to determine a transfer function,
Joh, Kang, Kwon, and Won 65
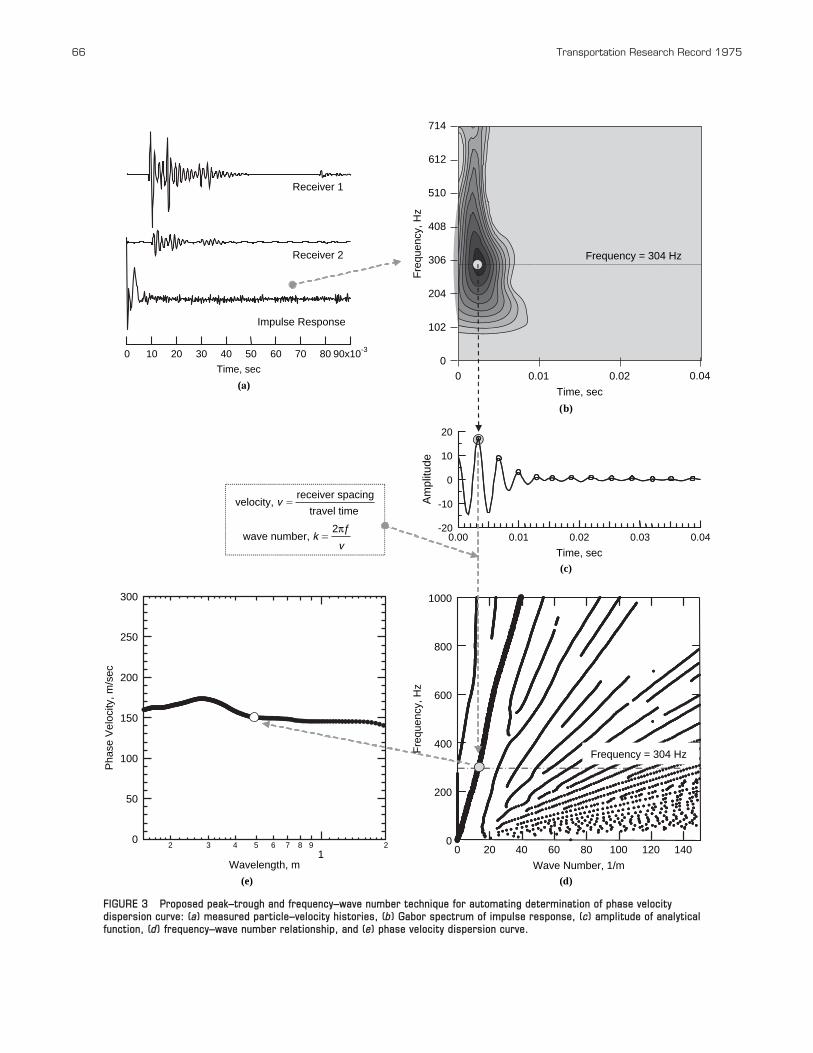
H21, and then an impulse response, RI (Figure 3a). The impulseresponse is then transformed to the Gabor spectrum (Figure 3b),which is a time–frequency representation of wave propagation; itdepicts how wave groups are propagated through the layered medium.Then, the peaks of the analytical function, which correspond to thetime trace of the Gabor spectrum for a given frequency, are identified(Figure 3c). The time for each peak corresponds to a travel time for aharmonic signal to propagate from the first receiver to the secondreceiver. This conceptual approach to determine the propagationvelocity of surface waves is originated from the peak–trough method.
Only one of the peaks is correct, and the others are fictitious.The correct peak or the correct travel time can be determined fromthe nature of the frequency–wave number relationship. First ofall, the travel times for the peaks of the analytical function shouldbe mapped to phase velocities using the interreceiver distance. Then,wave numbers, evaluated from frequency and phase velocity, areplotted against frequency for all the available frequencies. Referringto the rationale that the frequency–wave number curve should gothrough the origin, the correct frequency–wave number curve canbe determined (Figure 3d ). Finally, the phase velocity dispersioncurve is determined as shown in Figure 3e.
The algorithm proposed in this paper to determine phase velocityis based on the peak–trough method, as well as on the frequency–wavenumber relationship. Therefore, the proposed algorithm is calledpeak–trough and frequency–wave number (PT/FW) technique.
Determination of Shear Wave Velocity Profile:Automated Inversion Analysis
There are several approaches to evaluate the preliminary shearwave velocity profile. One of these uses a simple empirical equation
Measurement ofthe Transfer Function, H21
Computation ofImpulse Response, RI
RI=F-1(H21)
Computation ofGabor Spectrum of RI
Calculation of the Time Lagsfor the Peaks of A
Calculation of the CandidatePhase Velocities
Based on the Time Lags
f-k Plot Using the CandidatePhase Velocities
Selection of the Correctf-k Plot
1. Measurement andPreliminary Interpretation of
Surface Waves
2. Determination ofPhase Velocity Dispersion
Curve
3. Determination ofS-Wave Velocity Profile
Calculation of the CorrectPhase Velocity
Evaluation of PreliminaryS-Wave Velocity Profile
Identification of the Peaksof the Analytical Signal, A
in the Gabor Spectrum
Inversion Analysisto Determine
the Final S-Wave Velocity Profile
FIGURE 2 Proposed algorithm for accelerating the determination of shear wave velocity profile from surface wavemeasurements (F�1 indicates the inverse Fourier transform).
66 Transportation Research Record 1975
300
250
200
150
100
50
0
Pha
se V
eloc
ity, m
/sec
2 3 4 5 6 7 8 91
2
Wavelength, m
0 0.01 0.02 0.040
204
306
612
714
Time, sec
Fre
quen
cy, H
z
102
408
510
Frequency = 304 Hz
90x10-380706050403020100
Time, sec
-20
-10
0
10
20A
mpl
itude
0.040.030.020.010.00
Time, sec
1000
800
600
400
200
0140120100806040200
Wave Number, 1/m
Frequency = 304 Hz
v
2πƒwave number, k
travel time
receiver spacingvelocity, v
Receiver 1
Receiver 2
Impulse Response
(a)
(b)
(c)
(d)(e)
Fre
quen
cy, H
z
FIGURE 3 Proposed peak–trough and frequency–wave number technique for automating determination of phase velocitydispersion curve: (a) measured particle–velocity histories, (b) Gabor spectrum of impulse response, (c) amplitude of analyticalfunction, (d) frequency–wave number relationship, and (e) phase velocity dispersion curve.
developed by Hewkelom and Foster (16); another approach uses theconcept of a Gibson half space implemented by Rix and Leipski (17).Foinquinos (18) developed a scheme to evaluate the preliminaryshear wave velocity profile by using a given experimental dispersioncurve. The same algorithm is introduced in this paper with a slightmodification.
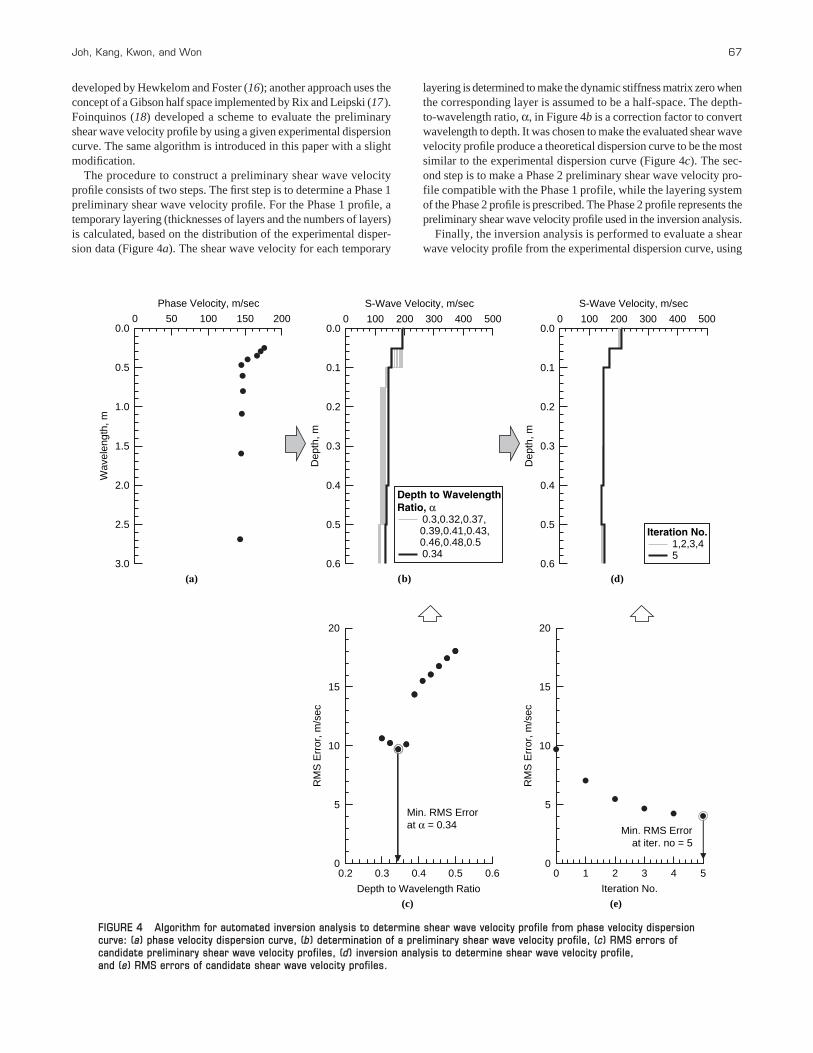
The procedure to construct a preliminary shear wave velocityprofile consists of two steps. The first step is to determine a Phase 1preliminary shear wave velocity profile. For the Phase 1 profile, atemporary layering (thicknesses of layers and the numbers of layers)is calculated, based on the distribution of the experimental disper-sion data (Figure 4a). The shear wave velocity for each temporary
Joh, Kang, Kwon, and Won 67
layering is determined to make the dynamic stiffness matrix zero whenthe corresponding layer is assumed to be a half-space. The depth-to-wavelength ratio, α, in Figure 4b is a correction factor to convertwavelength to depth. It was chosen to make the evaluated shear wavevelocity profile produce a theoretical dispersion curve to be the mostsimilar to the experimental dispersion curve (Figure 4c). The sec-ond step is to make a Phase 2 preliminary shear wave velocity pro-file compatible with the Phase 1 profile, while the layering systemof the Phase 2 profile is prescribed. The Phase 2 profile represents the preliminary shear wave velocity profile used in the inversion analysis.
Finally, the inversion analysis is performed to evaluate a shearwave velocity profile from the experimental dispersion curve, using
Dep
th, m
Iteration No. 1,2,3,4 5
0.6
0.5
0.4
0.3
0.2
0.1
0.05004003002001000
S-Wave Velocity, m/sec
Dep
th, m
0.6
0.5
0.4
0.3
0.2
0.1
0.05004003002001000
S-Wave Velocity, m/sec
Depth to WavelengthRatio, α
0.3,0.32,0.37,0.39,0.41,0.43,0.46,0.48,0.5 0.34
543210
Iteration No.
3.0
2.5
2.0
1.5
1.0
0.5
0.0
Wav
elen
gth,
m
200150100500
Phase Velocity, m/sec
(a) (b) (d)
(e)
20
15
10
5
0
RM
S E
rror
, m/s
ec
20
15
10
5
0
RM
S E
rror
, m/s
ec
0.60.50.40.30.2
Depth to Wavelength Ratio
Min. RMS Errorat α = 0.34
(c)
Min. RMS Errorat iter. no = 5
FIGURE 4 Algorithm for automated inversion analysis to determine shear wave velocity profile from phase velocity dispersioncurve: (a) phase velocity dispersion curve, (b) determination of a preliminary shear wave velocity profile, (c) RMS errors ofcandidate preliminary shear wave velocity profiles, (d) inversion analysis to determine shear wave velocity profile, and (e) RMS errors of candidate shear wave velocity profiles.
the preliminary shear wave velocity profile in Figure 4b. The inver-sion analysis used in this paper is the maximum likelihood method(19). Figure 4d shows an example of the shear wave velocity pro-files determined at the iterations of the inversion analysis. Amongthese shear wave velocity profiles, the one to give the minimumroot-mean-square (RMS) error, which is the difference betweenthe theoretical dispersion curve and the experimental dispersioncurve, is determined to be the final shear wave velocity profile(Figure 4e).
DEVICE FOR SURFACE WAVE MEASUREMENTS
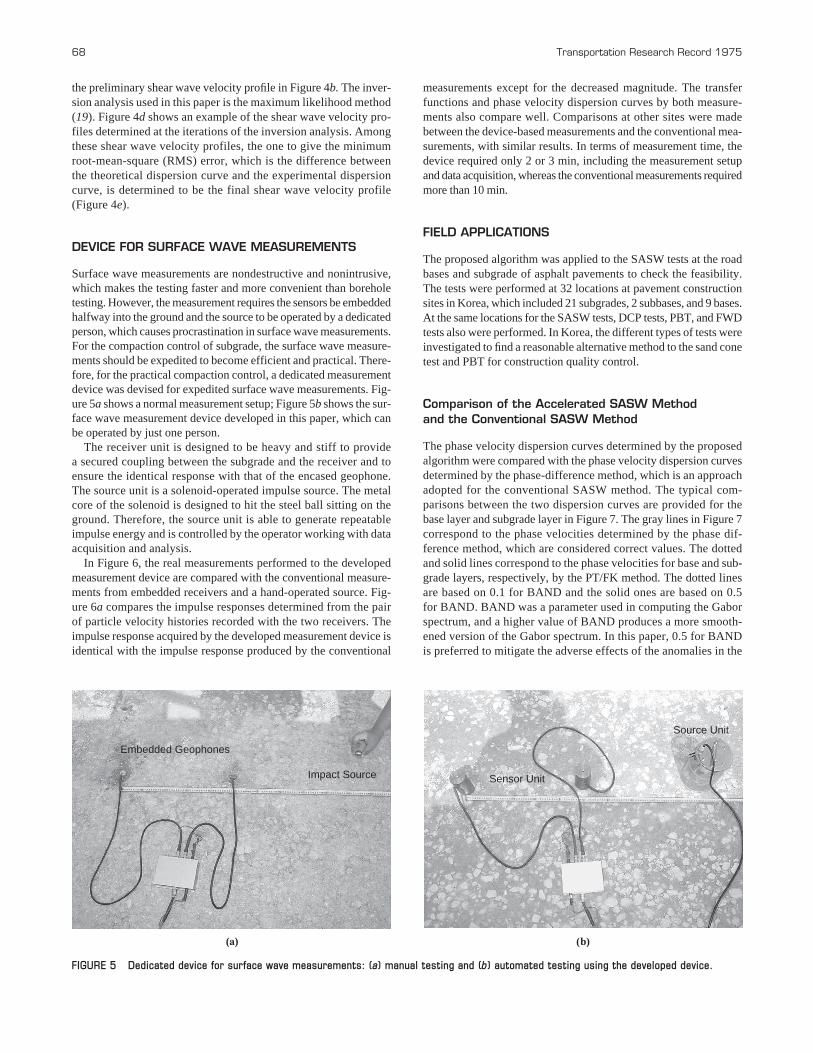
Surface wave measurements are nondestructive and nonintrusive,which makes the testing faster and more convenient than boreholetesting. However, the measurement requires the sensors be embeddedhalfway into the ground and the source to be operated by a dedicatedperson, which causes procrastination in surface wave measurements.For the compaction control of subgrade, the surface wave measure-ments should be expedited to become efficient and practical. There-fore, for the practical compaction control, a dedicated measurementdevice was devised for expedited surface wave measurements. Fig-ure 5a shows a normal measurement setup; Figure 5b shows the sur-face wave measurement device developed in this paper, which canbe operated by just one person.
The receiver unit is designed to be heavy and stiff to provide a secured coupling between the subgrade and the receiver and toensure the identical response with that of the encased geophone.The source unit is a solenoid-operated impulse source. The metalcore of the solenoid is designed to hit the steel ball sitting on theground. Therefore, the source unit is able to generate repeatableimpulse energy and is controlled by the operator working with dataacquisition and analysis.
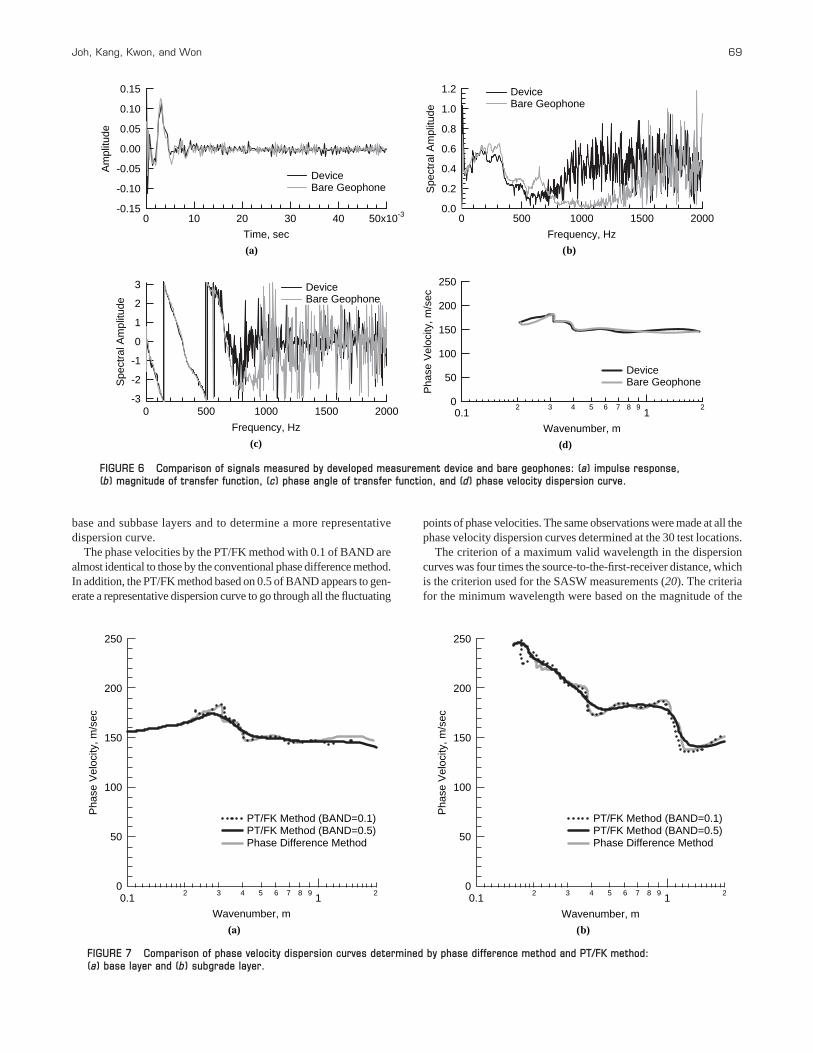
In Figure 6, the real measurements performed to the developedmeasurement device are compared with the conventional measure-ments from embedded receivers and a hand-operated source. Fig-ure 6a compares the impulse responses determined from the pairof particle velocity histories recorded with the two receivers. Theimpulse response acquired by the developed measurement device isidentical with the impulse response produced by the conventional
68 Transportation Research Record 1975
measurements except for the decreased magnitude. The transferfunctions and phase velocity dispersion curves by both measure-ments also compare well. Comparisons at other sites were madebetween the device-based measurements and the conventional mea-surements, with similar results. In terms of measurement time, thedevice required only 2 or 3 min, including the measurement setupand data acquisition, whereas the conventional measurements requiredmore than 10 min.
FIELD APPLICATIONS
The proposed algorithm was applied to the SASW tests at the roadbases and subgrade of asphalt pavements to check the feasibility.The tests were performed at 32 locations at pavement constructionsites in Korea, which included 21 subgrades, 2 subbases, and 9 bases.At the same locations for the SASW tests, DCP tests, PBT, and FWDtests also were performed. In Korea, the different types of tests wereinvestigated to find a reasonable alternative method to the sand conetest and PBT for construction quality control.
Comparison of the Accelerated SASW Methodand the Conventional SASW Method
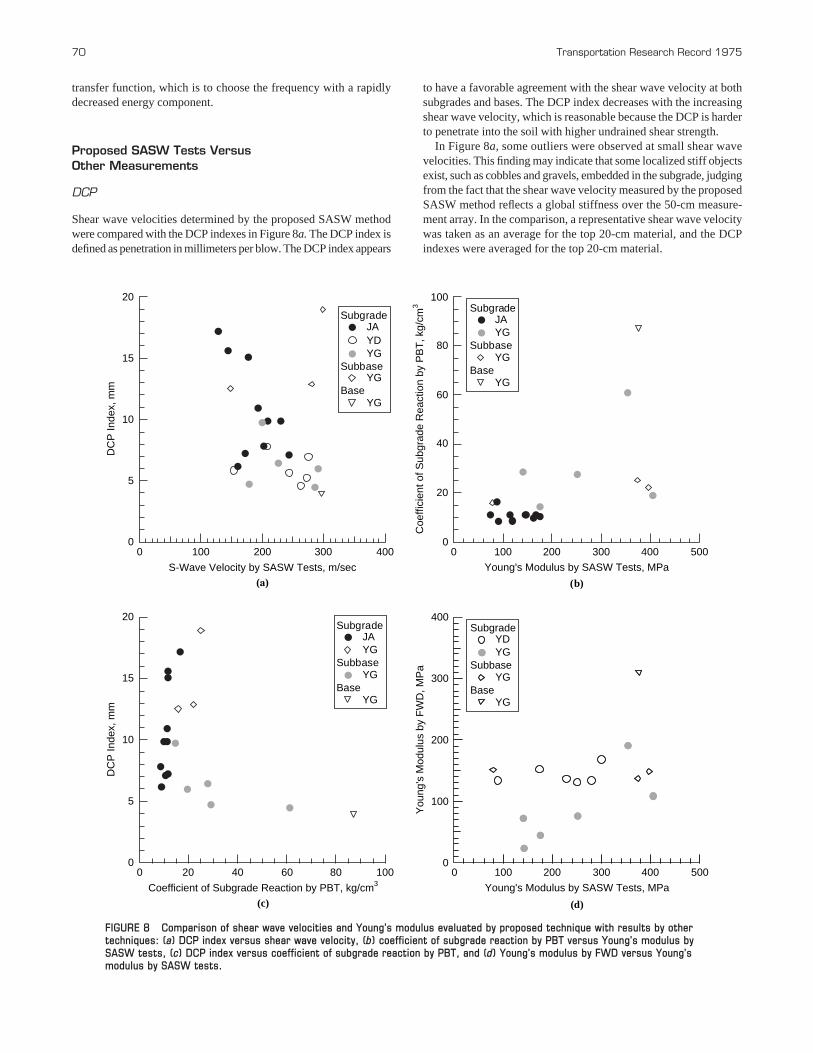
The phase velocity dispersion curves determined by the proposedalgorithm were compared with the phase velocity dispersion curvesdetermined by the phase-difference method, which is an approachadopted for the conventional SASW method. The typical com-parisons between the two dispersion curves are provided for thebase layer and subgrade layer in Figure 7. The gray lines in Figure 7correspond to the phase velocities determined by the phase dif-ference method, which are considered correct values. The dottedand solid lines correspond to the phase velocities for base and sub-grade layers, respectively, by the PT/FK method. The dotted linesare based on 0.1 for BAND and the solid ones are based on 0.5 for BAND. BAND was a parameter used in computing the Gaborspectrum, and a higher value of BAND produces a more smooth-ened version of the Gabor spectrum. In this paper, 0.5 for BANDis preferred to mitigate the adverse effects of the anomalies in the
Embedded Geophones
Impact Source
(a)
Source Unit
Sensor Unit
(b)
FIGURE 5 Dedicated device for surface wave measurements: (a) manual testing and (b) automated testing using the developed device.
base and subbase layers and to determine a more representativedispersion curve.
The phase velocities by the PT/FK method with 0.1 of BAND arealmost identical to those by the conventional phase difference method.In addition, the PT/FK method based on 0.5 of BAND appears to gen-erate a representative dispersion curve to go through all the fluctuating
Joh, Kang, Kwon, and Won 69
points of phase velocities. The same observations were made at all thephase velocity dispersion curves determined at the 30 test locations.
The criterion of a maximum valid wavelength in the dispersioncurves was four times the source-to-the-first-receiver distance, whichis the criterion used for the SASW measurements (20). The criteriafor the minimum wavelength were based on the magnitude of the
250
200
150
100
50
0
Pha
se V
eloc
ity, m
/sec
0.12 3 4 5 6 7 8 9
12
Wavenumber, m
Device Bare Geophone
-0.15
-0.10
-0.05
0.00
0.05
0.10
0.15
Am
plitu
de
50x10-3403020100
Time, sec
Device Bare Geophone
1.2
1.0
0.8
0.6
0.4
0.2
0.0
Spe
ctra
l Am
plitu
de
2000150010005000
Frequency, Hz
Device Bare Geophone
-3
-2
-1
0
1
2
3
Spe
ctra
l Am
plitu
de
2000150010005000
Frequency, Hz
Device Bare Geophone
(a) (b)
(c) (d)
FIGURE 6 Comparison of signals measured by developed measurement device and bare geophones: (a) impulse response, (b) magnitude of transfer function, (c) phase angle of transfer function, and (d) phase velocity dispersion curve.
0.12 3 4 5 6 7 8 9
12
Wavenumber, m
250
200
150
100
50
0
Pha
se V
eloc
ity, m
/sec
250
200
150
100
50
0
Pha
se V
eloc
ity, m
/sec
0.12 3 4 5 6 7 8 9
12
Wavenumber, m
PT/FK Method (BAND=0.1) PT/FK Method (BAND=0.5) Phase Difference Method
PT/FK Method (BAND=0.1)PT/FK Method (BAND=0.5)Phase Difference Method
(a) (b)
FIGURE 7 Comparison of phase velocity dispersion curves determined by phase difference method and PT/FK method: (a) base layer and (b) subgrade layer.
transfer function, which is to choose the frequency with a rapidlydecreased energy component.
Proposed SASW Tests Versus Other Measurements
DCP
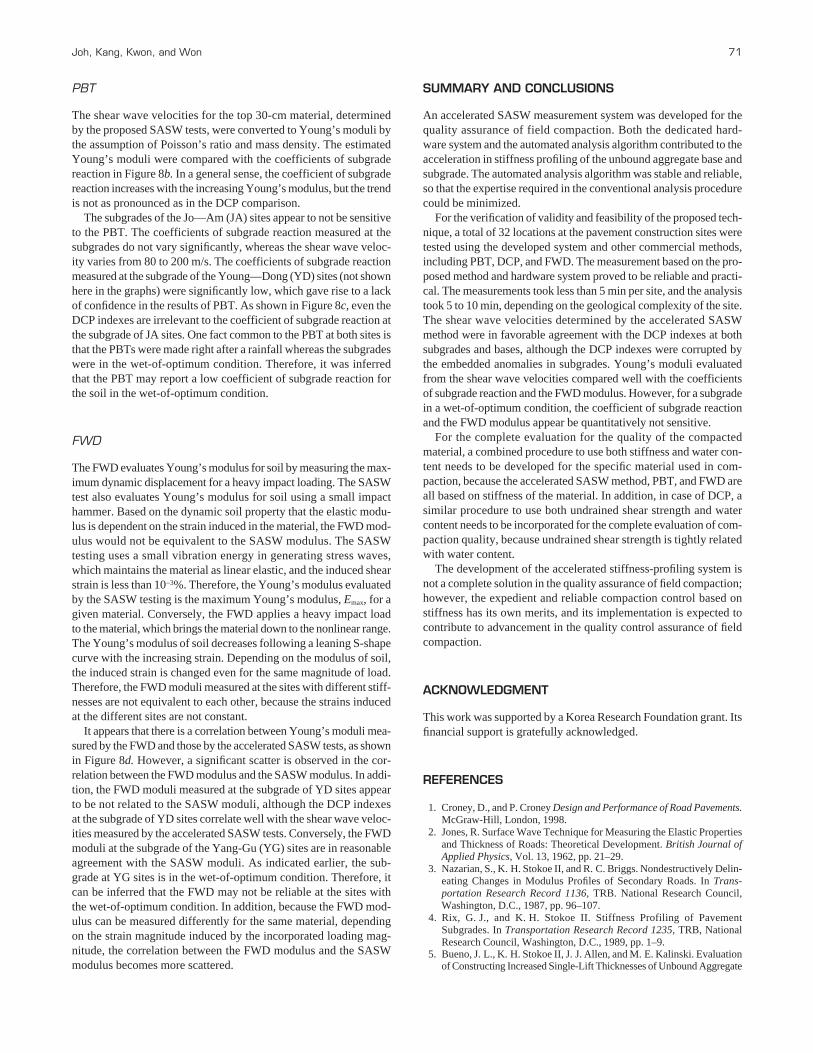
Shear wave velocities determined by the proposed SASW methodwere compared with the DCP indexes in Figure 8a. The DCP index isdefined as penetration in millimeters per blow. The DCP index appears
70 Transportation Research Record 1975
to have a favorable agreement with the shear wave velocity at bothsubgrades and bases. The DCP index decreases with the increasingshear wave velocity, which is reasonable because the DCP is harderto penetrate into the soil with higher undrained shear strength.
In Figure 8a, some outliers were observed at small shear wavevelocities. This finding may indicate that some localized stiff objectsexist, such as cobbles and gravels, embedded in the subgrade, judgingfrom the fact that the shear wave velocity measured by the proposedSASW method reflects a global stiffness over the 50-cm measure-ment array. In the comparison, a representative shear wave velocitywas taken as an average for the top 20-cm material, and the DCPindexes were averaged for the top 20-cm material.
100
80
60
40
20
0
Coe
ffici
ent o
f Sub
grad
e R
eact
ion
by P
BT
, kg/
cm3 Subgrade
JA YG
Subbase YG
Base YG
4003002001000
S-Wave Velocity by SASW Tests, m/sec
Subgrade JA YD YG
Subbase YG
Base YG
20
15
10
5
0
DC
P In
dex,
mm
20
15
10
5
0
DC
P In
dex,
mm
100806040200
Coefficient of Subgrade Reaction by PBT, kg/cm3
Subgrade JA YG
Subbase YG
Base YG
(c)
(a) (b)
400
300
200
100
0
You
ng's
Mod
ulus
by
FW
D, M
Pa
5004003002001000
Young's Modulus by SASW Tests, MPa
5004003002001000
Young's Modulus by SASW Tests, MPa
Subgrade YD YG
Subbase YG
Base YG
(d)
FIGURE 8 Comparison of shear wave velocities and Young’s modulus evaluated by proposed technique with results by othertechniques: (a) DCP index versus shear wave velocity, (b) coefficient of subgrade reaction by PBT versus Young’s modulus bySASW tests, (c) DCP index versus coefficient of subgrade reaction by PBT, and (d) Young’s modulus by FWD versus Young’smodulus by SASW tests.
PBT
The shear wave velocities for the top 30-cm material, determinedby the proposed SASW tests, were converted to Young’s moduli bythe assumption of Poisson’s ratio and mass density. The estimatedYoung’s moduli were compared with the coefficients of subgradereaction in Figure 8b. In a general sense, the coefficient of subgradereaction increases with the increasing Young’s modulus, but the trendis not as pronounced as in the DCP comparison.
The subgrades of the Jo—Am (JA) sites appear to not be sensitiveto the PBT. The coefficients of subgrade reaction measured at thesubgrades do not vary significantly, whereas the shear wave veloc-ity varies from 80 to 200 m/s. The coefficients of subgrade reactionmeasured at the subgrade of the Young—Dong (YD) sites (not shownhere in the graphs) were significantly low, which gave rise to a lackof confidence in the results of PBT. As shown in Figure 8c, even theDCP indexes are irrelevant to the coefficient of subgrade reaction atthe subgrade of JA sites. One fact common to the PBT at both sites isthat the PBTs were made right after a rainfall whereas the subgradeswere in the wet-of-optimum condition. Therefore, it was inferredthat the PBT may report a low coefficient of subgrade reaction forthe soil in the wet-of-optimum condition.
FWD
The FWD evaluates Young’s modulus for soil by measuring the max-imum dynamic displacement for a heavy impact loading. The SASWtest also evaluates Young’s modulus for soil using a small impacthammer. Based on the dynamic soil property that the elastic modu-lus is dependent on the strain induced in the material, the FWD mod-ulus would not be equivalent to the SASW modulus. The SASWtesting uses a small vibration energy in generating stress waves,which maintains the material as linear elastic, and the induced shearstrain is less than 10−3%. Therefore, the Young’s modulus evaluatedby the SASW testing is the maximum Young’s modulus, Emax, for agiven material. Conversely, the FWD applies a heavy impact loadto the material, which brings the material down to the nonlinear range.The Young’s modulus of soil decreases following a leaning S-shapecurve with the increasing strain. Depending on the modulus of soil,the induced strain is changed even for the same magnitude of load.Therefore, the FWD moduli measured at the sites with different stiff-nesses are not equivalent to each other, because the strains inducedat the different sites are not constant.
It appears that there is a correlation between Young’s moduli mea-sured by the FWD and those by the accelerated SASW tests, as shownin Figure 8d. However, a significant scatter is observed in the cor-relation between the FWD modulus and the SASW modulus. In addi-tion, the FWD moduli measured at the subgrade of YD sites appearto be not related to the SASW moduli, although the DCP indexesat the subgrade of YD sites correlate well with the shear wave veloc-ities measured by the accelerated SASW tests. Conversely, the FWDmoduli at the subgrade of the Yang-Gu (YG) sites are in reasonableagreement with the SASW moduli. As indicated earlier, the sub-grade at YG sites is in the wet-of-optimum condition. Therefore, itcan be inferred that the FWD may not be reliable at the sites withthe wet-of-optimum condition. In addition, because the FWD mod-ulus can be measured differently for the same material, dependingon the strain magnitude induced by the incorporated loading mag-nitude, the correlation between the FWD modulus and the SASWmodulus becomes more scattered.
Joh, Kang, Kwon, and Won 71
SUMMARY AND CONCLUSIONS
An accelerated SASW measurement system was developed for thequality assurance of field compaction. Both the dedicated hard-ware system and the automated analysis algorithm contributed to theacceleration in stiffness profiling of the unbound aggregate base andsubgrade. The automated analysis algorithm was stable and reliable,so that the expertise required in the conventional analysis procedurecould be minimized.
For the verification of validity and feasibility of the proposed tech-nique, a total of 32 locations at the pavement construction sites weretested using the developed system and other commercial methods,including PBT, DCP, and FWD. The measurement based on the pro-posed method and hardware system proved to be reliable and practi-cal. The measurements took less than 5 min per site, and the analysistook 5 to 10 min, depending on the geological complexity of the site.The shear wave velocities determined by the accelerated SASWmethod were in favorable agreement with the DCP indexes at bothsubgrades and bases, although the DCP indexes were corrupted bythe embedded anomalies in subgrades. Young’s moduli evaluatedfrom the shear wave velocities compared well with the coefficientsof subgrade reaction and the FWD modulus. However, for a subgradein a wet-of-optimum condition, the coefficient of subgrade reactionand the FWD modulus appear be quantitatively not sensitive.
For the complete evaluation for the quality of the compactedmaterial, a combined procedure to use both stiffness and water con-tent needs to be developed for the specific material used in com-paction, because the accelerated SASW method, PBT, and FWD areall based on stiffness of the material. In addition, in case of DCP, asimilar procedure to use both undrained shear strength and watercontent needs to be incorporated for the complete evaluation of com-paction quality, because undrained shear strength is tightly relatedwith water content.
The development of the accelerated stiffness-profiling system isnot a complete solution in the quality assurance of field compaction;however, the expedient and reliable compaction control based onstiffness has its own merits, and its implementation is expected tocontribute to advancement in the quality control assurance of fieldcompaction.
ACKNOWLEDGMENT
This work was supported by a Korea Research Foundation grant. Itsfinancial support is gratefully acknowledged.
REFERENCES
1. Croney, D., and P. Croney Design and Performance of Road Pavements.McGraw-Hill, London, 1998.
2. Jones, R. Surface Wave Technique for Measuring the Elastic Propertiesand Thickness of Roads: Theoretical Development. British Journal ofApplied Physics, Vol. 13, 1962, pp. 21–29.
3. Nazarian, S., K. H. Stokoe II, and R. C. Briggs. Nondestructively Delin-eating Changes in Modulus Profiles of Secondary Roads. In Trans-portation Research Record 1136, TRB. National Research Council,Washington, D.C., 1987, pp. 96–107.
4. Rix, G. J., and K. H. Stokoe II. Stiffness Profiling of Pavement Subgrades. In Transportation Research Record 1235, TRB, NationalResearch Council, Washington, D.C., 1989, pp. 1–9.
5. Bueno, J. L., K. H. Stokoe II, J. J. Allen, and M. E. Kalinski. Evaluationof Constructing Increased Single-Lift Thicknesses of Unbound Aggregate
Bases: Case Study in Georgia. In Transportation Research Record:Journal of the Transportation Research Board, No. 1673, TRB, NationalResearch Council, Washington, D.C., 1999, pp. 95–102.
6. Stokoe, K. H., II, S. G. Wright, J. A. Bay, and J. M. Röesset. Character-ization of geotechnical sites by SASW method. Geophysical Character-istics of Sites. ISSMFE, Technical Committee 10 for XIII ICSMFE.International Science Publishers, New York, 1994, pp. 15–25.
7. Terrell, R. G., B. R. Cox, K. H. Stokoe II, J. J. Allen, and D. Lewis.Field Evaluation of the Stiffness of Unbound Aggregate Base Layersin Inverted Flexible Pavements. In Transportation Research Record:Journal of the Transportation Research Board, No. 1837, Transporta-tion Research Board of the National Academies, Washington, D.C., 2003,pp. 50–60.
8. Sheriff, R. E. Encyclopedic Dictionary of Exploration Geophysics, 2nded. Society of Exploration Geophysics, Tulsa, Okla., 1984.
9. Nazarian, S. and K. H. Stokoe, II. Nondestructive Testing of PavementsUsing Surface Waves. In Transportation Research Record 993, TRB,National Research Council, Washington, D.C., 1984, pp. 67–79.
10. Pilant, W. L., and L. Knopoff. Inversion of Phase and Group Slowness Dis-persion. Journal of Geophysical Research, Vol. 75, 1970, pp. 2135–2136.
11. Bloch, S., and A. L. Hales. New Techniques for the Determination ofSurface Wave Phase Velocities. Bulletin of the Seismological Society ofAmerica, Vol. 58, 1968, pp. 1021–1034.
12. Dziewonski, A. M., S. Bloch, and M. Landisman. A Technique for theAnalysis of Transient Seismic Signals. Bulletin of the SeismologicalSociety of America, Vol. 59, 1969, pp. 427–444.
72 Transportation Research Record 1975
13. Al-Huniadi, M. O. Analysis of Dispersed Multi-Mode Signals of theSASW Method Using Multiple Filter/Cross-Correlation Technique. SoilDynamics and Earthquake Engineering. Vol. 13, 1994, pp. 13–24.
14. McMechan, G. A., and M. J. Yedlin. Analysis of Dispersive Waves byWave Field Transformation. Geophysics, Vol. 46, 1981, pp. 869–874.
15. Nolet, G., and G. Panza. Array Analysis of Seismic Surface Waves:Limits and Possibilities. Pageoph, Vol. 114, 1976, pp. 775–790.
16. Hewkelom, W., and C. R. Foster, Dynamic Testing of Pavements. Jour-nal of the Structural Division, Proceedings of the American Society ofCivil Engineers, Vol. 86, 1960, pp. 1–28.
17. Rix, G. J., and E. A. Leipski. Accuracy and Resolution of SurfaceWave Inversion. In Recent Advances in Instrumentation, Data Acquisi-tion and Testing in Soil Dynamics (S. K. Bhatia and G. W. Blaney, eds.),American Society of Civil Engineers, New York, 1991, pp. 17–32.
18. Foinquinos, M. R. Analytical Study and Inversion for the SpectralAnalysis of Surface Waves Method. Master’s thesis. University of Texasat Austin, 1991.
19. Joh, S.-H. Advances in Interpretation and Analysis Techniques forSpectral-Analysis-of-Surface Waves (SASW) Method. Ph.D. disser-tation. University of Texas at Austin, 1996.
20. Joh, S.-H., D. W. Jang, T. H. Kang, and I. H. Lee. Evaluation of Stiff-ness Profile for a Subgrade Segment by the CAP (Common-Array-Profiling) SASW Technique. Journal of Korean Geotechnical Society,Vol. 21, No. 4, 2005, pp. 71–82.
The Transportation Earthworks Committee sponsored publication of this paper.