Embed Size (px)
Citation preview

General rights Copyright and moral rights for the publications made accessible in the public portal are retained by the authors and/or other copyright owners and it is a condition of accessing publications that users recognise and abide by the legal requirements associated with these rights.
Users may download and print one copy of any publication from the public portal for the purpose of private study or research.
You may not further distribute the material or use it for any profit-making activity or commercial gain
You may freely distribute the URL identifying the publication in the public portal If you believe that this document breaches copyright please contact us providing details, and we will remove access to the work immediately and investigate your claim.
Downloaded from orbit.dtu.dk on: Jun 06, 2020
Accelerated rain erosion of wind turbineblade coatings
Zhang, Shizhong
Publication date:2014
Document VersionPublisher's PDF, also known as Version of record
Link back to DTU Orbit
Citation (APA):Zhang, S. (2014). Accelerated rain erosion of wind turbine blade coatings. Danmarks Tekniske Universitet(DTU).

Shizhong ZhangPh.D. ThesisAugust 2014
Accelerated rain erosion of wind turbine blade coatings

Accelerated rain erosion of wind turbine blade coatings
Ph.D. Thesis by
Shizhong Zhang
Supervisors:Assoc. Prof. Søren Kiil, DTU Chemical Engineering
Prof. Kim Dam-Johansen, DTU Chemical Engineering Protective R&D Manager, Pablo L Bernad Jr., Hempel A/S
CHEC Research Center Department of Chemical and Biochemical Engineering
Technical University of Denmark, DTU, Denmark August 2014
1

2
Copyright©: Shizhong Zhang
August 2014
Address: Centre of Combustion and Harmful Emission Control
Department of Chemical and
Biochemical Engineering
Technical University of Denmark
Søltofts Plads, Building 229
DK-2800 Kgs. Lyngby
Denmark
Phone: +45 4525 2800
Fax: +45 4525 4588
Web: www.chec.kt.dtu.dk
Print: J&R Frydenberg A/S
København
January 2015
ISBN:
Copyright©:
Address: Centre of Combustion and Harmful Emission Control
Department of Chemical and
Biochemical Engineering
Technical University of Denmark
Søltofts Plads, Building 229
DK-2800 Kgs. Lyngby
Denmark
Phone: +45 4525 2800
Fax: +45 4525 4588
Web: www.chec.kt.dtu.dk
Print: J&R Frydenberg A/S
København
January 2015
ISBN:

I
Preface
This dissertation summarizes the outcome of my last 3 years of research and is
submitted as a partial fulfillment of the requirements for obtaining the Ph.D. degree at
the Technical University of Denmark. The work was carried out at the Combustion
and Harmful Emission Control (CHEC) center of the Department of Chemical and
Biochemical Engineering at the Technical University of Denmark in collaboration
with coating producer Hempel A/S. The work has been supervised by Associate
Professor Søren Kiil and Professor Kim Dam-Johansen from CHEC. The external
supervision of the work was carried out by Pablo L Bernad Jr. from Hempel A/S. The
project was funded by the Technical University of Denmark and the Hempel
Foundation.
I would like to thank my main supervisor Søren Kiil for the numerous constructive
discussions on the experiments. Søren also spent a lot of time on reviewing and
correcting my article manuscripts and literature survey. Without his encouragement
and support, the project would not have been conducted at a good pace. I am also
grateful to Kim for his valuable suggestions on the project.
I am grateful to Pablo L Bernad Jr. for his correcting on my written English and help
to arrange the experiments. I would like to thank Per Aggerholm Sørensen and Sten
Nørkjær who used to work for Hempel A/S and took the role as co-supervisor. They
always gave fast feedback no matter what I asked for. I would also like to thank all
the colleagues whom I worked with in Hempel A/S, all of them were friendly and
willing to help. Thank you, Linda, Erik, Jeanne, and Alicia.
I would like to thank colleagues from our workshop and CHEC technicians for the
work done during the construction of the rig and the trouble shooting during the
operation. Thank you, Ivan, Jens, Michael, Nikolaj and Rasmus.
Thank you also to all the PhD students who gave me advice, shared knowledge and
encouraged me during the research.
Finally, I would like to thank my family for their caring and understanding over the
last 3 years.
Shizhong Zhang
Kgs. Lyngby, August 2014
3

II
Summary
During operation, the fast-moving blades of wind turbines are exposed to continuous
impacts with rain droplets, hail, insects, or solid particles. This can lead to erosion of
the blades, whereby the electrical efficiency is compromised and expensive repairs
may be required. One possible solution to this problem is elastic blade coatings,
which are able to absorb the impact energy without crack formation. The purpose of
the work presented in this thesis has been to design and construct a laboratory
experimentation device, which allows an accelerated and reliable evaluation of
existing or novel blade coating formulations. Results of experiments are compared to
data obtained in the larger-size whirling arm rig, which is the present industrial
standard for blade coating evaluation. The whirling arm rig consists of three fast-
moving horizontal rotors rotating in a heavy artificial rain fall.
There are four chapters in the thesis. In chapter 1, a literature survey provides
background information to the field. Topics discussed are the global wind energy
development, possible wind turbine constructions, blade structures and materials,
blade coatings, and liquid erosion mechanisms. In chapter 2, the design, construction
and evaluation of a new laboratory setup for fast screening of 22 coating samples
simultaneously is described. The device is based on a principle of discrete water jet
slugs. A review of previous rain erosion testing equipment is also included. To
provide a basis for comparison of the new setup with the whirling arm rig, a
dimensional analysis was conducted and experiments with two polyurethane-based
blade coatings carried out. Results showed that water jet slug velocity and impact
frequency are the most influential parameters on the coating erosion rate.
Furthermore, very small coating surface defects, often present on the specimens
tested, appeared to play an important role in the erosion mechanism. The evaluation
of the coatings under conditions where impact frequency and water hammer pressure
were “matched” could not be directly correlated with the results obtained with the
whirling arm rig. This may be attributed, among other contributing factors, to the
different contact modes in the two setups, i.e. the movement of coated panels against
rain drops versus the movement of water drops against coated specimens. The results
endorse the complex nature of the rain erosion phenomenon, which is the
consequence of the simultaneous combination of complex mechanisms and as such, it
is difficult to reproduce at the laboratory scale.
4

III
In chapter 3, the experimental investigation was expanded to a study on the effects of
three important process parameters on coating erosion: water cushioning, substrate
curvature, and water nozzle-coating distance. In addition, to map the influence of
physical properties on rain erosion, mechanical measurements to characterize selected
blade coatings, including tensile strength, flexibility, impact, hardness, and abrasion
experiments, were conducted. The investigations showed that in some cases water
cushioning (the presence of a liquid film on the coating surface prior to impact) is
important. Contrary to this, substrate curvature and the water nozzle-coating distance
(< 10 cm) did not influence the results to any significant degree. The ranking of
abrasion resistance of the blade coatings was in agreement with the ranking of rain
erosion resistance measured in the whirling arm rig and is an interesting indication for
future work.
Finally, in chapter 4, conclusions are drawn and suggestions for further work
provided.
5

IV
Dansk Resumé (Summary in Danish)
Under drift udsættes de hurtigt roterende vinger på vindmøller for gentagne
kollisioner med regndråber, hagl, insekter eller partikler. Det kan føre til erosion af
vingerne, hvilket går udover den elektriske effektivitet, og dyre reparationer kan blive
nødvendige. En mulig løsning på dette problem er elastiske vingecoatings, der er i
stand til at absorbere kollisionsenergien uden at revner eller andre skader dannes.
Formålet med arbejdet, der præsenteres i denne afhandling, har været at designe og
konstruere en eksperimentel laboratorieopstilling, der muliggør en accelereret og
pålidelig evaluering af eksisterende og nye vingecoatings-formuleringer. Resultater
fra eksperimenterne sammenlignes med data fra den større ”roterende arm” opstilling
(på engelsk whirling arm), der er den nuværende industrielle standard til evaluering af
vingecoatings. Den ”roterende arm” opstilling består af tre hurtigt drejende
horisontale rotorer, der bevæger sig igennem et kraftigt, kunstigt pålagt, ”regnvejr”.
Afhandlingen indeholder fire kapitler. I kapitel 1 gives i et litteraturstudium
baggrundsinformation om området. Emner, der diskuteres er den globale
vindenergiudvikling, mulige vindmølle konstruktioner, vingestrukturer og -materialer,
vingecoatings og mekanismer for væskeerosion. I kapitel 2 beskrives design,
konstruktion og evaluering af en ny laboratorieopstilling til hurtig simultan screening
af 22 coatingsprøver. Apparatet er baseret på et princip med diskrete vandstråler. En
gennemgang af tidligere forsøgsudstyr til test af regnerosion er også inkluderet.
For at give basis for sammenligning af den nye opstilling med den ”roterende arm”
opstilling, blev en dimensionsanalyse samt eksperimenter med to polyurethan-
baserede vingecoatings udført. Resultater viste, at vandstrålehastighed og
kollisionsfrekvens er de vigtigste parametre for erosionshastigheden af coatings.
Ydermere lader det til, at meget små defekter i coatingoverfladen, der ofte er til stede
i de testede enheder, spiller en betydelig rolle for erosionsmekanismen. Evalueringen
af coatings, under forhold hvor kollisionsfrekvens og vandhammertryk var ”bevaret”,
kunne ikke direkte korreleres med resultater opnået med den ”roterende arm”
opstilling. Blandt andre medvirkende faktorer kan det muligvis tilskrives forskellige
kontaktformer i de to opstillinger, dvs. bevægelse af coatede paneler mod regndråber,
kontra bevægelse af vanddråber mod coatede paneler. Resultaterne viser den
komplekse natur af regnerosionsfænomenet, der er en konsekvens af simultan
6

V
kombination af komplekse mekanismer, som derfor er vanskelige at reproducere i
laboratorieskala.
I kapitel 3 blev den eksperimentelle undersøgelse udvidet med et studie af effekter af
tre vigtige procesparametre på coatingserosion: vandafbødning, substratkrumning, og
afstanden mellem vanddyse og coating overflade. Ydermere, for at kortlægge
indflydelsen af fysiske egenskaber på regnerosion, blev der udført mekaniske
målinger til karakterisering af udvalgte vingecoatings. De mekaniske målinger
inkluderer elasticitetsstyrke-, kollisions-, hårdheds- og slidstyrkeeksperimenter.
Undersøgelserne viste, at i nogle tilfælde er vandafbødning (tilstedeværelsen af en
væskefilm på coatingoverfladen inden kollisionen) vigtig. Derimod påvirkede
substratkrumning og afstanden mellem vanddyse og coating (<10 cm) ikke
resultaterne i væsentlig grad. Rangering af slidstyrke af vingecoatings var i god
overensstemmelse med ranglisten for regnerosionsstyrken målt i den ”roterenede
arm” opstilling, hvilket er en interessant indikation for fremtidigt arbejde.
I kapitel 4 drages der afslutningsvis konklusioner samt gives forslag til fremtidigt
arbejde.
7

VI
Table of Contents
Preface ........................................................................................................................... I
Summary ...................................................................................................................... II
Dansk Resumé (Summary in Danish) ...................................................................... IV
Table of Contents ....................................................................................................... VI
Chapter 1 - Literature survey on wind turbines, liquid erosion, and blade coatings.......................................................................................................................... 1
1.1 Introduction .......................................................................................................... 1
1.2 Wind turbines ....................................................................................................... 2
1.3 Blade structure and materials ............................................................................... 5
1.4 Leading edge erosion phenomenon ...................................................................... 7
1.5 Coatings ................................................................................................................ 9
1.5.1 Resins ............................................................................................................. 9
1.5.2 Solvents .......................................................................................................... 9
1.5.3 Pigments ......................................................................................................... 9
1.5.4 Additives ...................................................................................................... 10
1.6 Blade coatings .................................................................................................... 10
1.7 Liquid erosion ..................................................................................................... 13
1.7.1 Effect of impact variables ............................................................................ 14
1.7.1.1 Impact velocity..................................................................................... 14
1.7.1.2 Drop size and shape ............................................................................. 14
1.7.1.3 Impact angle ......................................................................................... 14
1.7.1.4 Sample shape and roughness ............................................................... 15
1.7.1.5 Wet surface .......................................................................................... 15
1.7.1.6 Temperature ......................................................................................... 15
1.7.2 Effect of material properties ........................................................................ 16
1.7.3 Liquid erosion mechanism ........................................................................... 17
1.7.4 Liquid erosion of various materials ............................................................. 20
1.8 Conclusions ........................................................................................................ 22
References for chapter 1 .............................................................................................. 24
Chapter 2 - Erosion of wind turbine blade coatings - Design and analysis of jet-based laboratory equipment for performance evaluation ..................................... 28
2.1 Abstract ............................................................................................................... 28
8

VII
2.2 Introduction ........................................................................................................ 29
2.3 Previous experimental setups simulating liquid impact erosion ........................ 31
2.3.1 Impacting continuous water jets .................................................................. 33
2.3.2 Water jet provoked impacting droplets ........................................................ 33
2.3.3 Impacting water jet slugs ............................................................................. 33
2.3.4 Moving samples impacting falling water droplets ....................................... 34
2.4 Design criteria for water jet setup ...................................................................... 35
2.5 Experimental procedures .................................................................................... 36
2.5.1 Design and construction of water jet erosion rig ......................................... 36
2.5.2 Details of coated steel panels ....................................................................... 39
2.5.3 Comparative experimentation in whirling arm rig ....................................... 40
2.5.4 Characterization methods ............................................................................. 41
2.5.5 Experimental erosion procedure .................................................................. 41
2.5.6 Mathematical model linking process parameters in water jet setup ............ 42
2.6 Results and discussion ........................................................................................ 43
2.6.1 Erosion of coatings by continuous flat fan jet ............................................. 46
2.6.2 Erosion of coatings by discrete straight jet .................................................. 49
2.6.2.1 Effect of water jet velocity ................................................................... 49
2.6.2.2 Effect of impact frequency ................................................................... 50
2.6.2.3 Measurements of adhesion strength ..................................................... 51
2.6.2.4 Mechanistic discussion of coating degradation ................................... 52
2.7 Conclusions ........................................................................................................ 53
2.8 Acknowledgements ............................................................................................ 54
References for chapter 2 .............................................................................................. 56
Chapter 3 - Rain erosion of wind turbine blade coatings using discrete water jets: effects of water cushioning, substrate geometry, and coating properties ............. 59
3.1 Abstract ............................................................................................................... 59
3.2 Introduction ........................................................................................................ 60
3.3 Mechanisms of liquid erosion ............................................................................ 61
3.4 Strategy of investigation ..................................................................................... 63
3.5 Experimental procedures .................................................................................... 63
3.5.1 Modification of water jet erosion rig ........................................................... 63
3.5.1.1 Water cushioning ................................................................................. 65
3.5.1.2 Sample geometry ................................................................................. 65
9

VIII
3.5.1.3 Impact distance .................................................................................... 66
3.5.2 Details of coating samples used in erosion experiments ............................. 66
3.5.2.1 Samples for cushioning effect and impact distance experiments ........ 66
3.5.2.2 Samples for curvature effect experiments ............................................ 66
3.5.3 Investigation of physical properties of coatings .......................................... 67
3.5.3.1 Stress-strain (tensile strength) .............................................................. 67
3.5.3.2 Mandrel bending experiments.............................................................. 68
3.5.3.3 Impact experiments .............................................................................. 68
3.5.3.4 Pendulum hardness experiments .......................................................... 68
3.5.3.5 Taber abrasion experiments ................................................................. 69
3.5.3.6 Other relevant characterization methods ............................................. 69
3.6 Results and Discussion ....................................................................................... 69
3.6.1 Effects of water cushioning ......................................................................... 70
3.6.2 Effect of sample curvature ........................................................................... 72
3.6.3 Effect of impact distance ............................................................................. 73
3.6.4 Characterization of coatings ........................................................................ 74
3.6.4.1 Stress-strain behavior of blade coatings .............................................. 74
3.6.4.2 Mandrel bending experiment (flexibility) ............................................ 75
3.6.4.3 Impact experiments .............................................................................. 76
3.6.4.4 Pendulum hardness test ........................................................................ 77
3.6.4.5 Taber abrasion experiments ................................................................. 79
3.7 Conclusions ........................................................................................................ 79
3.8 Acknowledgements ............................................................................................ 80
References for chapter 3 .............................................................................................. 82
Conclusions ................................................................................................................. 83
Future work ................................................................................................................ 84
Appendix A Detailed instructions for using the water jet erosion equipment ...... A
10

1
Chapter 1 - Literature survey on wind turbines, liquid erosion, and
blade coatings
1.1 Introduction
Energy resources can be classified into three categories: fossil fuels, renewable
resources, and nuclear resources. Fossil fuels are at present the dominant energy
source, especially coal, oil and natural gas. Fossil fuels supplied about 78% of global
electricity production in 2013 as shown in Figure 1.1.
Figure 1.1 Estimated renewable energy share of global electricity production by the end of 2013. Solar PV is solar photovoltaic. CSP is the concentrated solar power. Reproduced from [1].
The reserves of fossil fuels are limited and their large-scale use is associated with
environmental issues such as acid precipitation, stratospheric ozone depletion, and the
global climate change. The results have been a rapid growth in the level of
greenhouse gas concentration in the atmosphere and an increase in fuel prices, which
are the main driving forces behind efforts to utilize renewable energy sources [2].
Renewable energy sources include biomass, biofuels, solar radiation, wind,
hydropower, and geothermal energies. About 22% of the global electricity was in
2013 generated by renewable energy (Figure 1.1) [1].
Wind energy is attracting global interest. Figure 1.2 shows its growth in the last 18
years. The installed worldwide wind capacity has increased dramatically in the last
decade, and reached 318,137 MW in the year 2013 [3]. Wind energy presently covers
around 0.2% of the total global energy demand and only 1.8% of the world’s
11

2
electricity is being generated by wind energy. The latter is by far the most efficient
and most clean of all the known renewable energies, and is expected to lead the shift
from fossil fuels to renewable energies [4].
Figure 1.2 Global cumulative installed wind capacity 1996-2013. Reproduced from [3].
For many years, the wind industry has been driven by five big markets: China, USA,
Germany, Spain, and India. These countries have had the largest shares of wind power
during the last two decades. In 2012, they represented 207 GW, or 73 % of the
worldwide wind capacity [5]. Denmark is the leader in terms of installed wind power
capacity per person; the country has an installed wind capacity of 752 W per person in
2012. Spain, Portugal, Sweden, Germany, and Ireland rank in the top ten. The USA
ranks 12, with close to 200 W per person, and China ranks 36, with 56 Watt per
person, both far behind their absolute position but still above world average. India is
at position 52 with 15 W per person, below the global average. If all countries had the
same density like today Germany or Denmark, the world would see a total installed
capacity of 12,000,000 MW, more than enough to cover the world’s complete
electricity demand. There is still a huge potential to harvest wind power [5].
The remaining of this chapter will provide insights into the wind turbine, wind turbine
blade structure, materials and coatings, leading edge blade erosion, and material
degradation mechanisms.
1.2 Wind turbines
Wind turbines convert the kinetic energy of wind into mechanical power and a
generator converts it into electricity. The use of wind turbines to generate electricity
began with a few technical innovations such as the use of synthetic materials to build
rotor blades, and continued with developments in the field of aerodynamics,
12

3
mechanical and electrical engineering, and control technology. Electronics provided
the technical basis for wind turbines commonly used today. Since 1980, wind power
has been the fastest growing energy technology in the world [6].
There are two main types of wind turbines, the horizontal axis wind turbines
(HAWTs) and vertical axis wind turbines (VAWTs). The main types of wind turbines
are shown in Figure 1.3.
Figure 1.3 Wind turbine configurations. (a) Horizontal axis wind turbines. (b) Vertical axis wind turbines. Reproduced from [7].
Most modern wind turbines have a horizontal axis with blades resembling airplane
propellers. Horizontal-axis units account for almost all utility-scale turbines, for
example, 100 kilowatts or several megawatts [5]. The most feasible design offering
the lowest cost is the two-blade type. However, the major drawback of both one and
two blade designs is the high level of noise generated [4]. It was found that the three-
blade rotor is the most efficient for power generation by large wind turbines compared
to all the other turbine types. It allows for a better distribution of mass, which makes
rotation smoother with lower noise and an acceptable cost. The alternative is the
VAWTs. Their weight is supported by a ground level bearing and both the gearbox
and the generator can be at ground level, which makes maintenance easier compared
to HAWTs. Vertical-axis machines are good for pumping water and other high torque
low-speed applications and are usually not connected to the electric power grid. The
13
4
blades of VAWTs are susceptible to resonant vibration and have lower efficiencies [7,
8].
Wind turbines are considered a mature technology and are provided commercially in a
wide range of capacities from 400 W to 7.5 MW [9]. The theoretical maximum
aerodynamic conversion efficiency of wind turbines from wind to mechanical power
is 59%. However, the peak efficiency is about 45% in practice. The average annual
efficiency of most turbines is about half this number. This is due to the need to shut
down the wind turbine in low or high winds and to limit the power once the rated
level is reached. It may also be caused by generator loss and the fact that the machine
does not always operate in its optimum working point [7].
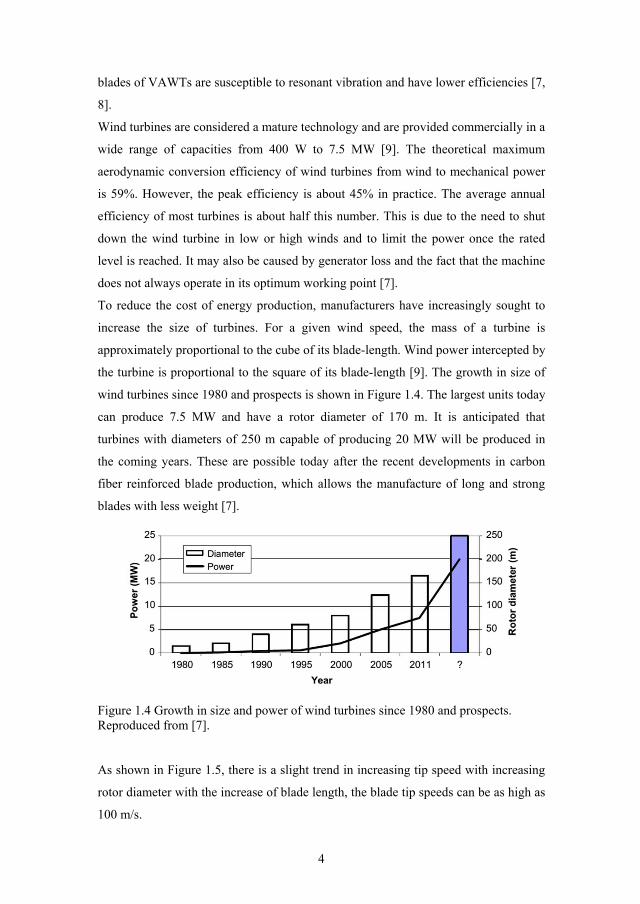
To reduce the cost of energy production, manufacturers have increasingly sought to
increase the size of turbines. For a given wind speed, the mass of a turbine is
approximately proportional to the cube of its blade-length. Wind power intercepted by
the turbine is proportional to the square of its blade-length [9]. The growth in size of
wind turbines since 1980 and prospects is shown in Figure 1.4. The largest units today
can produce 7.5 MW and have a rotor diameter of 170 m. It is anticipated that
turbines with diameters of 250 m capable of producing 20 MW will be produced in
the coming years. These are possible today after the recent developments in carbon
fiber reinforced blade production, which allows the manufacture of long and strong
blades with less weight [7].
Figure 1.4 Growth in size and power of wind turbines since 1980 and prospects. Reproduced from [7].
As shown in Figure 1.5, there is a slight trend in increasing tip speed with increasing
rotor diameter with the increase of blade length, the blade tip speeds can be as high as
100 m/s.
14

5
Figure 1.5 Blade tip speed versus rotor diameter for various utility scale wind turbine blades. Reproduced from [10].
It should also be noticed that the tip speed only represents the maximum possible
values; the blades may only operate at these speeds for a limited time. However, these
high speeds can cause erosion much faster than the slow speeds. Advanced blade
materials and blade coatings are required to survive 20 years life span under those
new challenging conditions [11].
During continuous operation, the blades are not only exposed to different
environmental factors, but also to constant fatigue loading. Additionally, during this
period, the frequency of maintenance and access to the blades has to be kept at a
minimum to reduce the production and financial losses associated with turbine down
time [10].
1.3 Blade structure and materials
The maximum blade length of a turbine is limited by both the strength and stiffness of
its material. There is a need to develop stronger and lighter composite materials. To
reduce material cost and weight, the blade is hollow in the middle. The blades are
subject to a wide range of loads including flapping, tension, compression and
twisting, and must be stiff enough to avoid impacting the towers. The stiffness is
determined by both the internal structure and material of the blade [8, 12]. One of the
blade structures is shown in Figure 1.6.
15

6
Figure 1.6 Wind turbine blade structure. The root is for connecting with wind turbine hub. The shell is to provide the aerodynamic shape and a structural role in stiffness and strength. The shear web and spar caps form the spar enhancing structure strength of a blade. The coating is for protecting the blade from environmental threats such as UV radiation and impacts from foreign bodies. Reproduced from [13].
The high material stiffness is also needed to maintain optimal aerodynamic
performance. A low density is needed to reduce gravity forces and long fatigue life is
needed to reduce material degradation [14]. The majority of wind turbine blades use
composite materials of thermosetting polymer matrix reinforced with fibers. The glass
fiber, having a good combination of stiffness, strength and density, has been used
since the early days of blade manufacturing. Carbon fibers are now attracting
attention due to their superior mechanical properties compared with glass fiber and
decreasing price. Other potentially interesting fibers are aramid, polyethylene, and
cellulose, all of which have moderate mechanical properties, and low or very low
densities [14]. Different fibers can also be mixed to achieve the required stiffness,
strength, and weight. Fibers are used in various forms to support different structures
[14]. These materials, compared with conventional structural materials such as steel
and wood, exhibit characteristics such as low density, stiffness, and high strength,
good anticorrosion properties, fatigue resistant, and low manufacturing cost [8, 15].
The polymeric matrix also plays an important role in the composites, supporting the
fibers and bonding them together. The fibers must be kept in the desired orientation,
so the composite can satisfy the structural purpose. The matrix resins most commonly
used can be divided into three major classes: polyester, epoxy and vinyl ester. The
16
7
resulting composite materials are commonly referred to as glass-reinforced plastic
(GFRP) and carbon fiber-reinforced plastic (CFRP). Blades made of wood or hybrid
of wood and carbon fibers are normally impregnated with epoxy resin [8]. Reinforced
thermoplastics offer significant advantages over thermosets when used to produce
recyclable rotor blades for utility-scale wind turbines. At the end of service life,
thermoplastic blades can be recycled by heating and forming them into something
else. Thermoplastics for composites for rotor blades have been under development for
the past 10-15 years [16]. The composite properties are generally governed by the
fibers, the matrix and the interface between these components. The general
requirements for future composites used in wind turbine blades are enhanced
mechanical properties especially stiffness and fatigue, improved processing time, low
cost as conventional fabrics, and improved reliability [15, 17].
1.4 Leading edge erosion phenomenon
Composite wind turbine blades are designed to last for about 20 years in the field.
However, the composite materials are susceptible to heat, moisture, UV radiation, and
erosion from both solid particles and rain. They also suffer from impacts with wild
life such as birds and insects [10, 11]. These influencing factors will deteriorate or
contaminate surface coatings. The early roughness created can increase the extent of
transitional flow as well as increasing turbulence intensity near the wall. The
roughness size, density and location are the most important parameters influencing
wind turbine performance, which tends to decrease with increasing roughness size and
density [18, 19]. The most susceptible part of a blade is at the tip, where the speed is
the highest. Evidence of this was e.g. seen on an investigation of an 11.6 m length
DEBRA-25 wind turbine blade after almost 20 years of operation [20].
Depending on operating conditions, erosion of rotor blade leading edges (Figure 1.7)
can affect wind turbine energy generation efficiency.
17
8
Figure 1.7 Leading edge erosion of a wind turbine blade. Reproduced from [21].
Erosion can happen as soon as two years after installation [10, 22]. The erosion
process on wind turbine blades typically starts with the formation of small pits or
from small tears or scratches in the leading edge which may act as initiation sites for
further erosion. The defects will increase in size and density over time and combine to
cause delamination of the leading edge [19, 21]. If repairs are not done early, damage
to the underlying laminate will be present as early as after five years. It was found that
a polyester resin exhibited a decrease of 15% in average failure strain, a decrease of
30% in ultimate strength and an 18% decrease in tensile modulus after exposed to
moisture and UV light. Carbon reinforced epoxy composite under UV exposure
resulted in a 29% reduction in the transverse tensile strength [10]. If these failures are
not repaired there is potential for imbalance in the blade set, strain on the nacelle, and
the additional wear being exerted on the bearing. There is also the additional potential
for loss in blade stiffness and the risk of a catastrophic failure caused by impact with
the tower [11]. If water enters the core material of the blade, the core expands and
contracts as the freeze-thaw cycles occur and the core will separate from the laminate.
When a blade is damaged at this level, the blade must be brought to the ground to be
repaired, which will cost a minimum of 75,000 US dollars per set, or new blades have
to be purchased, which will be even more expensive [21]. In fact, every defect on the
surface of a wind blade disrupts its aerodynamic efficiency and, as a result, reduces
the power production of the turbine. Researches have shown that leading edge erosion
can produce substantial airfoil performance degradation, yielding a large increase in
drag coupled with a significant loss in lift near the upper corner of the drag polar (the
relationship between the lift on an airfoil and its drag), which is critical for
maximizing wind turbine energy production [19].
18

9
1.5 Coatings
In this section, a brief general introduction to coatings is provided. The following
section deals more specifically with blade coatings. A coating is to provide surface
protection, decorative finishes and numerous special functions for commodities and
merchandise formulated with organic and/or inorganic chemicals. The liquid coating
materials contain the same basic compositional components: resin, solvents, pigments
and additives [23, 24].
1.5.1 Resins
The resin is the most important component of the coating and is responsible for
providing substrate adhesion, binding the pigment, and for ensuring the right chemical
and physical properties [23]. The resins can be made from natural oils. However, most
of the resins are synthetic organic polymers such as epoxies, urethanes, vinyls, and
alkyds [24]. Thermoplastic coatings are formed from high molecular weight polymers
drying physically by the evaporation of solvents. An increase in the molecular mass of
the binder in the polymer film improves properties such as elasticity, hardness and
impact deformation. Chemically cured thermoset coatings are formed by a chemical
reaction between a resin reactant and a crosslinker or curing agent [25].
1.5.2 Solvents
Solvents are used primarily to make application of the coating possible. In chemically
curing systems, the volume of solvent also controls the reactivity of the system
(potlife). Solvent systems are most often blends of different solvents, most of them
are low molecular weight, organic chemicals [23].
1.5.3 Pigments
Most of the pigments are inorganic compounds such as oxides and silicates, many of
the brighter colors are complex organic compounds. Pigments such as titanium
dioxide, carbon black, and iron oxide add color and opacity to the paint. Pigments can
also provide improved durability and weathering, corrosion resistance, antifouling or
fire retardence [23, 26]. Extender pigments or fillers such as talc and clay cannot add
opacity or color, but they can provide mechanical strength, gloss control, and pigment
volume adjustment [23]. The shape of the pigments can be spherical or lamellar; they
can give different barrier properties. The pigments have a big influence on the
19

10
viscosity of the coating. The desired coating properties are optimized with mixtures of
pigments and other components [27].
1.5.4 Additives
The coating additives are auxiliary components added in low concentrations to
improve specific properties. Catalysts are added to accelerate curing. Leveling agents
are used to promote the formation of a smooth and uniform surface. Wetting agents
consist of dispersants and anti-settling agents, they are used to reduce the surface
tension between the binder solution and the pigment surface, they also aid wetting of
the pigments and prevent flocculation of the pigment particles [24, 27].
1.6 Blade coatings
Wind turbine blade coatings, although accounting for a small part of total cost of a
new wind turbine set, play an important role in mitigating leading edge erosion. The
coating can protect the composite material from environmental factors such as UV
radiation, moisture, and heat, and can also protect the composites from foreign body
impacts. Many manufacturers offer protection in the form of a tape or a coating. The
small increase in cost with leading edge protection is estimated to be worthwhile
throughout the life of a wind turbine [21].
The high performance wind turbine blade coatings are becoming increasingly critical
to wind farm operation over long periods with the use of larger blades. Wind turbine
blades have to be repaired to keep them operating at maximum efficiency when
erosion happens. With a growing number of blades now in service, blade maintenance
is becoming a major issue. However, the repair is time consuming, and the down time
reduces the revenue of wind farms [11, 28].
There are two ways to apply a surface coating. The first one is called the in-mould
application. A surface coating layer is added to the surface of the blade as part of the
molding process. For manufacturing reasons, the coating formed through this
approach typically consists of a layer of material similar to that of the matrix material
used in the substrate. The other method is called post-mould application; coatings are
applied by painting or spraying. This approach allows more flexibility with materials;
one common application is an elastic polyurethane material [10].
Epoxies and urethanes have been widely used in the protection of wind turbine
blades; the emphasis continues to be on epoxies and polyurethanes nowadays, and
20

11
with a growing interest in waterborne formulations which is being driven by the need
to meet increasingly strict environmental regulations [29]. The coating producer PPG
has claimed that its thin film system with epoxy primers and polyurethane topcoat
deliver long term, low maintenance asset protection in any operating environment
including desert or offshore. The thin-film system provides protection with reduced
film thickness, and therefore reduces VOC emissions, blade weight, cost and process
time [30]. BASF has also claimed that its polyurethane compounds based topcoat
exhibits high erosion resistance against rain, sand and hail. It can be used both
onshore and offshore [31]. The material company 3M has developed a two component
polyurethane tape coating that should provide erosion protection in a single layer.
However, these tapes must be replaced frequently, otherwise they fail to adequately
absorb the impact energy of the particulate matter. The tapes are suitable for small
turbines because they can increase the aerodynamic drag on the blade surface [32].
The edges of polymeric tapes are also vulnerable to water impact, and tests have
revealed de-bonding of tapes due to water droplets striking the edges of tapes, causing
them to lift [33]. Similar to the wind turbine blades, aircrafts are also exposed to
erosive environments. To protect the aircrafts in a similar way, most of the aerospace
coatings systems also use epoxy as primer and polyurethane as topcoat.
Fluoropolymer-based coatings also have attractive properties for wind turbine blades.
A company named “The 21st Century Coatings” has claimed that fluorinated coatings
with low surface energy reduces the drag. Their products have proven field
performance for over 15 years in harsh environments like desert climate, immersion,
and urban areas with pollution, rain, snow, and heat. Although the coating may have
attractive properties, fluoropolymer-based coatings are not yet used extensively in
wind energy applications [29]. Waterbased hybrid resin technology has become
commercially available by combining poly(vinylidene fluoride) (PVDF) copolymers
and acrylic resins, and is regarded as a potential technology for use in wind turbine
blade coatings. In the preliminary studies, evidence has been found that Taber
abrasion resistance is improved by urethane crosslinking of PVDF hybrids [34].
Siloxane-based coatings are also claimed to exhibit good erosion resistance
performance. A patent imparts an erosion-resistant coating composition comprising a
cross linked epoxy polymer interpenetrated by a siloxane polymer. A good resilience
(energy absorption) ensures erosion resistance and was achieved by the long linear
siloxane segments present in sufficient quantity, obtained by silanes having two
21

12
hydrolysable groups per silicon. With hard particles such as diamond, alumina and
silica incorporated, the composite will provide strength and resistance to abrasion
[35]. Karl Erik Wiedemann et al. patented a simple formulation comprising silanol
fluid, fumed silica, solvent, catalyst, pigment, and silane as crosslinking agent. The
coating can be applied directly on the metal substrate or an epoxy substrate and it is
claimed that it can provide superior erosion resistance to glass-fiber reinforced epoxy,
aluminum, nickel, stainless steel and polyurethane tape [36]. However, the use of
fluoropolymer- and siloxane-based formulations for blade coatings is strongly limitted
by their high material cost.
Another application is the use of nanocomposite layers to the leading edge of an
airfoil. Nanocomposites form very high contact angles with water and the reinforced
polymer acts to absorb and dissipate the impact energy from the repeated impacts of
particulate matter. Reinforcing the polymeric network by nanoparticles with a certain
diameter could increase the liquid impact resistance due to the increase of inorganic
cross-linking, but this is not a universal rule to improve erosion resistance. It also
depends on the synergistic effect with other groups. For example, higher organic
content of the system can limit inorganic cross-linking of particle and matrix which
will disturb the homogeneous network leading to surface defects that act as initial
points for further erosion [37]. There exists a wide variety of nano-scale pigments
based on titania, alumina, silica, clays and carbon nanotubes. The coating properties
depend strongly on the geometry of the pigments [33]. A nanocomposite coating
technology roadmap is shown in Figure 1.8.
22

13
Figure 1.8 A proposed nanocomposite coating technology roadmap. Reproduced from [33].
1.7 Liquid erosion
Investigations into the material aspects of steam turbine blade erosion (Figure 1.9)
began in the early 20th century when the tip velocities of the blades of steam turbines
became high enough to cause erosion [38].
Figure 1.9 Steam turbine blade erosion. Reproduced from [39].
Rain erosion became a problem in the 1940s. It was noticed that plastic, glass,
ceramic and even metallic surfaces of an aircraft could be damaged when flying
through heavy rain [40]. Droplets impinging at a high speed onto the surface of a solid
can exert forces of a magnitude sufficient to permanently deform and fracture the
solid. The erosion is a complicated process and the type and extent of the erosion
23

14
damage depends on a number of factors from both liquids and the solid materials [40,
41].
1.7.1 Effect of impact variables
1.7.1.1 Impact velocity
There have been many attempts to discover a general relationship between impact
velocity of water droplets and erosion damage which could be valid for a wide range
of materials. Presently there is no such numerical relationship which can be applied to
materials other than those to which the measurements refer. In general, as the impact
velocity is increased, the erosion is also increased [42].
1.7.1.2 Drop size and shape
Large drops can cause erosion at considerably smaller velocities than those required
for small drops. Large drops cause faster erosion damage due to the larger hammer
pressure on the surface and the possibility of varying the pressure distribution over the
impacted area [40, 42]. However, Gohardini claims that damages due to an impacting
water drop are strongly dependent on the radius of curvature at the point of contact
and not so much the mass of a distorted water drop. Distorted drops with radii of
curvature greater than their initial diameters will therefore be proportionately more
damaging [43].
1.7.1.3 Impact angle
A general conclusion is that the normal component of impact velocity of a droplet is
mainly responsible for the damage (see Figure 1.10); the tangential component in
most circumstances has little effect [38, 40]. However, for ceramics and hard
polymers at high impact velocities, the tangential components may cause substantial
damage of equal magnitude to the normal component [44].
24

15
Figure 1.10 Erosion of the leading edge of a wind turbine blade removed from service. Leading edge dimensions shown are 44 mm horizontally and 20 mm vertically. Reproduced from [45].
1.7.1.4 Sample shape and roughness
Samples with different radii of curvature, from the airfoil shape to the planar, were
investigated and it was found that the erosion rate increased when the impact surface
was made concave [40]. However, research also shows that a plane surface was more
rapidly eroded than a convex one. A slightly roughened surface will erode faster than
a surface with less roughness [40, 42].
1.7.1.5 Wet surface
The liquid can be trapped in the bottom of pits formed on eroded surfaces. The
trapped liquid will act as a cushion for oncoming impacts. The presence of a liquid
film might also reduce erosion damage by cushioning the impact. When a wet surface
is struck by a drop, the liquid film deforms and the pressure on the solid is less than it
would have been if the surface was dry. Another explanation is that the impact
pressure is reduced because the pressure wave diverges as it passes through the liquid
layer [40, 42].
1.7.1.6 Temperature
The erosion rate will be affected by the temperature of the environment and the liquid
drops. Experiments have shown that the erosion rate increases when the temperature
25

16
of the water increases. This might be due to the reduction in the viscosity of the
liquid. As the viscosity increases, the velocity of the outward flowing liquid increases
and the surface will experience more shear damage [38, 42].
1.7.2 Effect of material properties
Researchers have been searching for appropriate material properties to correlate with
erosion resistance. There is relatively little correlation between the erosion resistance
and macroscopic mechanical properties [41, 46]. Limited success in correlation with
some of the material properties has been based on individual cases [47]. It is
advocated in ASTM G73-10 that the erosion resistance should not be regarded as a
precisely-definable property of a material, but rather as a complex mix of properties
whose relative importance may differ depending on the variables of impacting
conditions and materials [48]. For polymers, a large number of factors can affect the
erosion resistance including the crystallinity, physical and chemical network
characteristics, thermal conductivity, glass transition temperature, mechanical
properties, such as hardness, tensile strength, modulus of elasticity, fracture
toughness, yield stress, rebound resilience, friction coefficient, ultimate strength and
elongation [32].
Materials with anti-erosive properties can be extremely hard and tough such that the
impacting particle is unable to make any impression on the surface. However, highly
elastic materials can also be used so that the kinetic energy of the particle is
dissipated. Thus, no general statement for erosion properties of a polymer can be
easily made without additional research focused on revealing the appropriate
combination of properties necessary for a material to be truly anti-erosive [32]. The
homogeneity of the surface is one of the important factors affecting resistance to rain
erosion [49]. For the same resilient coatings, the thicker coatings can protect the
adhesive bond between coating and substrate more effectively than thin coatings by
stretching the coating to dissipate the stress [50]. A method of predicting the average
period between raindrop impacts is illustrated in Figure 1.11. The upper curve shows
an idealized series of applied stress pulses, spaced a period T apart. The lower curves
compare the strain versus time of two different elastomeric coatings. Material A,
which has a relaxation time, tA, greater than the impact period T, does not have time
to fully recover before the next impact. As a consequence, the successive impacts
cause cumulative strain in Material A. The recovery of Material B, with tB less than T,
26

17
is essentially complete after each impact. Therefore, after several impacts Material A
has reached a strain greater than Material B. The relation between relaxation time
and impact period may be as important as the ability of the material to withstand a
single impact [51].
Figure 1.11 Relation between raindrop impact interval T and relaxation time, t, of elastomeric materials. After several impacts Material A, with tA>T, reaches a strain
greater than Material B, with tB<T [51].
1.7.3 Liquid erosion mechanism
During a high velocity impact of a liquid drop on a solid target, high pressure
develops at the interface between the solid and liquid. The pressure generates stress
waves. Consequently, intensive stress produces damage at local sites [52].
When a water drop impacts a plane rigid surface, the overall impact sequence can be
divided into two phases: the pressure build-up phase prior to fully develop lateral
outflow jetting and the pressure release phase as the drop collapses onto the surface.
As shown in Figure 1.12, at the initial stage of the impact, the contact edge travels
across the surface of the target at a velocity, VC, which is greater than the shock wave
velocity propagating into the water drop. The water behind the shock front is
compressed because there are no free surfaces for the pressure release [37].
27

18
Figure 1.12 Droplet after initial impact: water drop is compressed due to lack of a free surface. VC is the contact edge velocity. C is the shock wave velocity. Reproduced from [37].
The pressure exerted on the surface of a rigid target is known as the water hammer
pressure, , which is given by
(1)
where is the density of the liquid, is the acoustic wave velocity in the liquid, and
is the liquid impact velocity. The water hammer pressure is one dimensional,
representing the impact between the planar surface of a semiinfinite liquid body
striking a semiinfinite rigid body. No account is taken of the geometry of the
impacting mass on the characteristics of the compression wave propagating into the
liquid. The water hammer pressure is responsible for most of the damage resulting
from liquid impact [41].
As illustrated in Figure 1.13, when the shock envelope overtakes the contact edge, a
free surface is generated which allows the compressed region to release.
Figure 1.13 Droplet after shock wave has over-taken contact edge allowing decompression and jetting. Vj is jetting velocity. Vrelease is the release wave velocity. Reproduced from [37].
28
19
The release waves propagate into the water drop from the free surfaces, reducing the
pressure which is approximately the incompressible Bernoulli pressure [37]
(2)
Lateral jets are produced in a second step of impact causing shear stress (Figure 1.14).
The contact edge between the target surfaces slows down and is overtaken by the
shock front. Thus, water trapped in the compressed region can escape which generates
water jets across the surface causing a high velocity sideways jet of fluid. This fluid
has a velocity Vj which is faster than the impact velocity [37].
Figure 1.14 Damage effects of lateral jetting [37].
Lateral outflow jetting will not contribute to the initiation or extension of damage
unless there is a preexisting surface irregularity with which it can interact [41, 52].
Hydraulic penetration of the water in a drop impacting over a preexisting crack or
erosion pit is the most damaging mode for material removal, since it has the capacity
to propagate submicrometer size crack and surface pits to measurable dimensions, on
the order of several millimeters, and is effective throughout the material removal
process [41].
The actual mechanism of material removal is a complicated series of interactions
between an impacting water drop and the changing material surface, and possibly
involving all of the mechanisms mentioned above. Failure modes inherent in the
target material are intimately associated to the damage process. It is therefore difficult
to establish a clear connection between the overall dynamics of the impact process
and the erosion response of the material. More details in terms of interactions between
pressure waves can be found in Chapter 3.
The rate of erosion due to liquid impact is not constant with time, but exhibits several
erosion rate-time patterns. In the ASTM G73-10, four stages corresponding to
incubation period, accelerating stage, steady-state, and the decelerating stage are
defined. The most common mass loss/exposure curve is shown in Figure 1.15.
29

20
Figure 1.15 Cumulative erosion-time curve. Reproduced from [48].
There is an initial period, the incubation period, during which there is a slight or an
absence of material loss, although there will usually be some plastic or brittle
deformation of the surface. During the next period, material is removed at an
accelerated rate until a maximum rate, after a time, the erosion rate begins to
decrease, tending to a lower and approximately constant rate [38, 40]. However, the
actual pattern varies with the conditions of impact and the material. The significance
of the various stages can differ according to the intended service applications of the
materials being tested. In most practical situations, the initial three periods are of
concern. The major problem centers on events taking place during the incubation
period, and improvements in material performance are accomplished by modifying
the material to extend the incubation period [41]. The incubation time is the most
important for coatings because service life is usually terminated by initial surface
damage even though the mass loss is very limited [48].
1.7.4 Liquid erosion of various materials
One critical aspect that seems to be a common cause for the failure of existing
polymeric coatings is surface shearing as the water droplet is deflected outward across
the surface following normal impact. This can cause a radial pattern of deformation.
Another aspect is penetration of water into tiny surface defects. Surface shearing
could eventually cause surface defects due to tearing and fatigue cracking which can
then be penetrated by the water, causing a rapid failure of the coating [33, 53]. At
high speeds, water droplets have been shown to behave like hammers, which also
30

21
opens the possibility of impact induced de-bonding of the coating from the substrate,
increasing the likelihood of tearing and fatigue damage. The substrate could also be
damaged due to the transmission of pressure pulses with coatings left undamaged [33,
54]. The polymers must resist formation of cracks as a consequence of fatigue in
repetitive yielding under random impacts of rain [47].
Low modulus or high resilience coatings such as elastomers will reduce the stress at
the impact surface and thereby reduce the stress in the coating. These materials need
to have mechanical strength with sufficiently high value to withstand the shear
stresses of a single impact but also recover fast enough to be able to absorb the
stresses of additional impact [52]. Therefore the recovery time and frequency of
impact are important parameters since elastomeric materials are sensitive to multiple
impingement effects [52, 54]. The attenuation of the impact stress wave will increase
with coating thickness owing to the increased damping capacity of the material and
the possible divergence of the stress wave so that there is a loss in the energy density
before the wave arrives at the substrate [52]. In addition, the material must not lose its
ability to absorb repeated impact stresses over long periods of exposure [50].
The void content and type of reinforcement in elastomeric coatings are shown to
influence the behavior of fiber reinforced composite structure. The addition of
reinforcement to thermoplastics is detrimental to erosion performance because the
fibers tend to break out under repeated impingement enhancing the mass loss. The
thermosetting polymers benefit from reinforcement because the fibers reduce massive
breakage and chunking of the brittle resin [47].
Ductile materials such as most metals and thermoplastic polymers exhibit non-brittle
behavior of surface depressions with upraised edges. These edges are susceptible to
the lateral outflow jetting from the impacting drop leading to erosion pit nucleation
[47]. Corrosion can be observed when steel is eroded by water [55], the combined
erosion-corrosion process may have different failure mechanism compared with pure
liquid erosion process. A high modulus metal coating on a composite is known to
reduce the transmitted stress because it only transmits a very low stress pulse to the
substrate [54].
Hard, rigid materials such as ceramic, glasses, uncoated composite and thermosetting
plastics cannot mitigate to any notable degree, the impact and shear stresses that the
colliding drop exerts. The response of rigid materials to liquid impact is typically
cracking due to the direct deformation [47]. To have erosion resistance, rigid
31

22
materials must be able to withstand these combined stresses. The fracture or yield
strength dominates the ability to withstand the unmitigated stresses [50].
1.8 Conclusions
Wind energy is one of the most promising renewable energy sources. Continued fast
growth is anticipated and wind turbines with larger blades will be produced. This
requires higher performance blade coatings to resist the more severe rain erosion
environment. Erosion mechanisms have been studied in the past 100 years; however,
due to the complex interaction in the erosion process, few correlations have been
developed to help the production of more erosion-resistant materials. High
performance blade coatings may prolong the life time of the blades and improve or
maintain the electricity production. The ultimate target is to find the erosion
mechanisms of elastic polymeric coatings when they are exposed to rain droplets. It
seems worthwhile to invest time and resources in this area.
In the remaining part of this thesis, two studies are presented. In Chapter 2, a novel
water jet based erosion test rig for fast screening of wind turbine blade coatings is
presented and analyzed. In Chapter 3, evaluation of the erosion performance of the
water jet rig continued by changing the erosion parameters such as water cushioning,
sample geometry and impact distance. Tensile strength, flexibility, impact, hardness
and abrasion experiments were conducted to characterize the coatings. Finally, in
Chapter 4, conclusions are drawn and suggestions for further work provided.
32

23
NomenclatureC shock wave velocity
acoustic wave velocity in the liquid water hammer pressure Bernoulli pressure
T raindrop impact interval tA relaxation time of material A tB relaxation time of material B V droplet impact velocity VC contact edge velocity Vj jetting velocity Vrelease release wave velocity
Greek strain of material A density of the impact liquid
33

24
References for chapter 1
[1] REN21. 2014. Renewables 2014 Global Status Report (Paris: REN21 Secretariat). ISBN 978-3-9815934-2-6.
[2] G.S. Alemán-Nava, V.H. Casiano-Flores, D.L. Cárdenas-Chávez, R. Díaz-Chavez, N. Scarlat, J. Mahlknecht, J. Dallemand, R. Parra, Renewable energy research progress in Mexico: A review, Renewable and Sustainable Energy Reviews. 32 (2014) 140-153.
[3] Global wind statistics 2013, note published by Global wind energy council (2014) 1-4, Brussels, Belgium.
[4] Tabassum-Abbasi, M. Premalatha, T. Abbasi, S.A. Abbasi, Wind energy: Increasing deployment, rising environmental concerns, Renewable and Sustainable Energy Reviews. 31 (2014) 270-288.
[5] S. Gsänger, J.D. Pitteloud, World Wind Energy Annual Report 2012, World Wind Energy Association (www.wwindea.org), (2013) 1-19, Bonn, Germany.
[6] M.G. Molina, J.M.G. Alvarez, Technical and regulatory exigencies for grid connection of wind generation, Wind farm (2011) 1-30.
[7] S.A. Kalogirou, Chapter 13 - Wind Energy Systems, in: S.A. Kalogirou (Ed.), Solar Energy Engineering (Second Edition), Academic Press, Boston, 2014, 735-762.
[8] B. Hayman, J. Wedel-Heinen, P. Brøndsted, Materials challenges in present and future wind energy, MRS Bulletin. 33 (2008) 343-353.
[9] Technology roadmap of wind energy 2013 edition, International Energy Agency (2013) 1-58, Paris, France.
[10] M.H. Keegan, D.H. Nash, M.M. Stack, On erosion issues associated with the leading edge of wind turbine blades, J. Phys. D. 46 (2013) 1-20.
[11] D. Cripps, The future of blade repair, Reinforced Plastics. 55 (2011) 28-32.
[12] P. Hogg, Wind turbine blade materials, http://www. supergen-wind. org. uk/presentations. html (Accessed 15.07. 2014).
[13] P. Roth-Johnson, R.E. Wirz, E. Lin, Structural design of spars for 100-m biplane wind turbine blades, Renewable Energy. 71 (2014) 133-155.
[14] P. Brøndsted, H. Lilholt, A. Lystrup, Composite materials for wind power turbine blades, Annu. Rev. Mater. Res. 35 (2005) 505-538.
[15] J. Zangenberg, P. Brøndsted, M. Koefoed, Design of a fibrous composite preform for wind turbine rotor blades, Mater Des. 56 (2014) 635-641.
34

25
[16] G. Marsh, Could thermoplastics be the answer for utility-scale wind turbine blades?, Reinforced Plastics. 54 (2010) 31-35.
[17] J.G. McGowan, R.W. Hyers, K.L. Sullivan, J.F. Manwell, S.V. Nair, B. McNiff, B.C. Syrett, A review of materials degradation in utility scale wind turbines, Energy Materials. 2 (2007) 41-46.
[18] E. Sagol, M. Reggio, A. Ilinca, Issues concerning roughness on wind turbine blades, Renewable and Sustainable Energy Reviews. 23 (2013) 514-525.
[19] A. Sareen, C.A. Sapre, M.S. Selig, Effects of leading edge erosion on wind turbine blade performance, Wind Energy (2013), John Wiley & Sons, Ltd. DOI: 10.1002/we
[20] F. Sayer, F. Bürkner, B. Buchholz, M. Strobel, A.M. van Wingerde, H. Busmann, H. Seifert, Influence of a wind turbine service life on the mechanical properties of the material and the blade, Wind Energy. 16 (2013) 163-174.
[21] L. Rampel, Rotor blade leading edge erosion – real life experiences, Wind Systems Magazine (Issue date 24.10.2012) 22-24.
[22] K. Wood, Blade repair: Closing the maintenance gap, Compos. Technol. (2011). http://www.compositesworld.com/articles/blade-repair-closing-the-maintenance-gap, (Accessed on 29.08.2014).
[23] C.H. Hare (Ed.), Protective Coatings - Fundamentals of Chemistry and Composition, SSPC 94-17 ed., The Society for Protective Coatings, Pittsburgh, USA, 1994.
[24] A. Goldschmidt, H.J. Streitberger (Eds.), BASF handbook on basics of coating technology, 2nd edition, Vincentz Network, Hannover, Germany, 2007.
[25] R. Lambourne, T.A. Strivens (Eds.), Paint and Surface Coatings-Theory and Practice, 2nd edition, Woodhead, Cambridge, 1999.
[26] D. Stoye, W. Freitag (Eds.), Paints, Coatings and Solvents, second edition ed., Wiley-VCH, Germany, 1998.
[27] Ullmann's Encyclopedia of Industrial Chemistry, Revised 2002., Wiley-VCH Verlag GmbH&Co., 2002.
[28] G. Marsh, Meeting the challenge of wind turbine blade repair, Reinforced Plastics. 55 (2011) 32-36.
[29] C. Challener, Coatings critical for wind energy efficiency. http://www.thefreelibrary.com/Coatings+critical+for+wind+energy+efficiency.-a0218660845 (Accessed 15.07. 2014).
[30] http://www.ppg.com/corporate/ppgwind/products/Pages/default.aspx. (Accessed 10.04.2014).
35

26
[31] http://www.basf.com/group/corporate/wind-energy/en/microsites/wind-energy/technologies/blades (Accessed 10.04.2014).
[32] N. Dalili, A. Edrisy, R. Carriveau, A review of surface engineering issues critical to wind turbine performance, Renewable and Sustainable Energy Reviews. 13 (2009) 428-438.
[33] H.X. Peng, Polyurethane nanocomposite coatings for aeronautical applications, in: J.S. Leng, A.K. Lau (Eds.), multifunctional polymer nanocomposites, CRC press, Boca Raton; London; New york, 2011, 337-388.
[34] M. Durali, K. Wood, D. Battocchi, M. Halzenbeller, Current developments, European Coatings Journal. 10 (2011) 30-34.
[35] B.M. Sanders, K.E. Wiedemann, Composite coatings for imparting particle erosion resistance. US patent 2004/6706405 B2.
[36] K.E. Wiedemann, R. Sivakumar, B.M. Sanders, Erosion resistant silicone coatings. US patent 2004/0225079 A1.
[37] M. Grundwürmer, O. Nuyken, M. Meyer, J. Wehr, N. Schupp, Sol–gel derived erosion protection coatings against damage caused by liquid impact, Wear. 263 (2007) 318-329.
[38] M. Ahmad, M. Casey, N. Sürken, Experimental assessment of droplet impact erosion resistance of steam turbine blade materials, Wear. 267 (2009) 1605-1618.
[39] C.R.F. Azevedo, A. Sinátora, Erosion-fatigue of steam turbine blades, Eng. Failure Anal. 16 (2009) 2290-2303.
[40] J.H. Brunton, M.C. Rochester, Erosion of solid surfaces by the impact of liquid drops, in: C.M. Preece (Ed.), Treatise on materials science and technology, Academic press, New York, 1979, 186-248.
[41] W.F. Adler, The mechanics of liquid impact, in: C.M. Preece (Ed.), treatise on materials science and technology, Academic Press, New York, 1979, 127-185.
[42] O.G. Engel, Mechanism of rain erosion, Wright Air Development Center, USA. Report No. 53-192 (1953) 1-54.
[43] W.F. Adler, Particulate impact damage predictions, Wear. 186–187, Part 1 (1995) 35-44.
[44] O. Gohardani, Impact of erosion testing aspects on current and future flight conditions, Prog. Aerospace Sci. 47 (2011) 280-303.
[45] K. Gharali, D.A. Johnson, Numerical modeling of an S809 airfoil under dynamic stall, erosion and high reduced frequencies, Appl. Energy. 93 (2012) 45-52.
36

27
[46] W.F. Adler, Rain impact retrospective and vision for the future, Wear. 233–235 (1999) 25-38.
[47] F. George, J. Schmitt, Liquid and solid particle impact erosion, Air Force Materials Laboratory, USA. Report AFML-TR-79-4122 (1979) 1-74.
[48] Standard test metod for liquid impingement erosion using rotating apparatus, American Society for Testing and Materials. ASTM G73-10 (2010) 1-19.
[49] C.B. Reilly, M. Orchin, Preparation and properties of polyurethane coatings, J Ind Eng Chem. 48 (1956) 59-63.
[50] N.E. Wahl, Investigation of the phenomena of rain erosion at subsonic and supersonic speeds, Bell Aerosystems Company, New York. Report ML-TR-65-330 (1965) 1-55.
[51] A.F. Conn, A. Thiruvengadam, Dynamic response and adhesion failures of rain erosion resistant coatings, Journal of Materials. 5 (1970) 698-718.
[52] J. Zahavi, S. Nadiv, G.F. Schmitt Jr., Indirect damage in composite materials due to raindrop impact, Wear. 72 (1981) 305-313.
[53] W.F. Adler, J.W. Morris, N.E. Wahl, Supersonic rain and sand erosion research: characterization and development of erosion resistant materials. Air Force Materials Laboratory, USA. Report AFML-TR-72-85 (1972) 1-277.
[54] G.F. Schmitt, Materials parameters that govern the rain erosion behavior of polymeric coatings and composites at subsonic velocities, Air Force Materials Laboratory, USA. Report AFML-TR-71-197 (1971) 1-105.
[55] R. McGechaen, M.M. Stack, A study of raindrop erosion of steel and polymer based composites: application to wind turbines. Wear. ISSN 0043-1686 (Submitted).
37

28
Chapter 2 - Erosion of wind turbine blade coatings - Design and
analysis of jet-based laboratory equipment for performance
evaluation
This charpter was submitted with the title “Erosion of wind turbine blade coatings -
Design and analysis of jet-based laboratory equipment for performance evaluation” to
the journal Progress in Organic Coatings, April 2014. (authors Shizhong Zhang, Kim
Dam-Johansen, Sten Nørkjær, Pablo L Bernad Jr., Søren Kiil)
2.1 Abstract
Driven by the growth of the wind power industry during the last decade, the size of
wind turbines has grown considerably and single-turbine power can nowadays reach a
capacity of 8 MW with rotor diameters exciding 160 m. Rain erosion is a considerable
threat to the mechanical integrity of the blades in such equipment. To reduce
expensive blade maintenance repairs and to avoid out-of-service periods, energy-
absorbing blade coatings are required to protect rotor blades from rain erosion. In this
work we describe the design, construction and evaluation of a laboratory setup for fast
screening of up to 22 coating samples that is based on water jet slugs. Our objective is
to study the effect of the parameters involved in the rain erosion process and to
correlate our experimental results with data obtained with the complex and expensive
whirling arm rig, which has become the industry standard method of test for rain
erosion. Our results showed that water slug velocity and impact frequency are the
most influential parameters in the coating erosion rate. Coating defects, often present
on the specimens tested, appeared to play an important role in the erosion mechanism.
Two particular experimental blade coatings were investigated using the proposed
experimental design. The evaluation of the coatings under conditions where impact
frequency and water hammer pressure were “matched” could not be directly
correlated with the results obtained with the whirling arm rig. This result may be
attributed, among other contributing factors, to the different contact modes in the two
setups, i.e. the movement of coated panels against rain drops versus the movement of
water drops against coated specimens. Additional factors that require further
investigation are the specimen geometries and the potential significance of the
presence of a thin water film on the coated surfaces.
38

29
Our results endorse the complex nature of the rain erosion phenomenon, which is the
result of the simultaneous combination of complex mechanisms and as such, it is
difficult to reproduce at the laboratory scale.
2.2 Introduction
Erosion of industrial materials by impacting water droplets is a well-known event.
One of the first reports on this topic goes back to the 1920s, when the erosion of
steam turbine blades by water droplets present in the wet steam was reported and
investigated [1]. During the 1940s, with the development of the aeronautical industry,
it was observed that exposure to rain was the origin of severe material damage. Rain
erosion damage was particularly severe on the forward facing components of aircrafts
such as leading edges, radomes and infrared-transmitting windows. Rain erosion in
aircrafts has now been minimised or even eliminated by the use of metallic shields
and polymeric coatings or tapes on the components susceptible to damage [2].
Likewise, blades in wind turbines are exposed to rain erosion. Research in this field is
growing, driven by the rapid development of the wind power industry during the last
10-15 years. Global wind power capacity was larger than 282 GW in 2013, with over
45 GW installed in 2012 alone. The largest wind turbine industry is placed in China
while Denmark leads the wind power generation capacity per capita. Driven by the
market growth, the size of wind turbines has increased dramatically in recent years.
Today turbines up to 8.0 MW and over 160 m rotor diameter are available, where the
tip velocity of the blades can reach a linear speed of 100 m/s (360 km/h).
In the case of offshore wind turbines, blade erosion is particularly problematic; the
repair or the replacement of blades is very costly. Due to seawater aerosols, blade
erosion rates for offshore wind turbines are approximately twice as high as the rates
observed on inland wind turbines.
As an example, over the past three years, more than 200 blades on 80 wind turbines
have been repaired at the wind turbine park Horns Rev off Blåvands Huk in Denmark
[3]. The wind turbines were put into operation in 2002. Repairs have also taken place
at other wind turbine parks: in Denmark at Rødsand and Middelgrunden, in Sweden at
Lillgrund, in Germany at Baltic, in Britain at Barrow, North Hoyle, Kentish Flats,
Scroby Sands, Thanet, and Robin Rigg, and in the Netherlands at OWEZ [3]. In
addition to maintenance penalties, mechanical damage to the wind blades reduces the
electrical efficiency of the wind turbines. Wind tunnel experiments estimate a 5%
39

30
reduction of the total energy capture, depending of factors such as the type and degree
of surface roughness of the blade [3].
Wind turbine blades are primarily made of fiberglass reinforced polymer composites.
Skins are typically double-bias or triaxial fiberglass and the core is made of balsa or
some kind of foam structure. Epoxy-based materials have been the preferred choice of
binder due to their high strength, easy production and low cost. Carbon fibres are
often used for local reinforcement. Compared to epoxy-based materials, carbon fibres
have higher modulus, lower density, higher tensile strength and lower fatigue
sensitivity [4].
Although there is no precise data available, a substantial fraction of the new large-
blade wind turbine installations uses blade coating systems. These coating systems
have the ability to absorb the energy from impacting droplets and are expected to
provide efficient and long term, cost-effective protection against rain erosion.
However, commercial blade coating technology is relatively recent and performance
data for long term exposure (>15 years) are not available.
Current blade coating systems consist, typically, of a putty layer which is applied for
filling pores in the composite substrate, a primer to secure good adhesion of the
subsequent coat and a flexible topcoat, usually a polyurethane-based formulation [5].
The preferred method for evaluating rain erosion has been the so-called “whirling
arm” test, developed by the Radiation Laboratory at MIT in 1946 [6]. Fundamentally,
the whirling arm consists of a rotor, 2 m in diameter, rotating in an imposed artificial
rainfall. Erosion data obtained in the whirling arm setup for polyurethane and
neoprene aircraft coatings correlated very well with actual flight tests [7, 8]. In recent
years, the whirling arm rig has been used for testing coating systems for wind turbine
blades. The tip speed of wind turbine blades can presently get up to 100 m/s, about
one third the speed of commercial passenger flights and about one fifth the speed of
fighter jets. Whirling arm tests last for a few hours with a tip speed of 150 m/s and in
most cases three samples, one on each rotor blade, are used simultaneously. It is not
clear that in the case of wind blades the accelerated whirling arm test will provide
representative data (3 hours of accelerated “heavy rainfall” versus up to 20 years
natural exposure), but in absence of alternatives the whirling arm test has become an
acknowledged test method for the approval of coating systems for wind blades.
However, we understand that coating companies do not have whirling arm equipment
40

31
available in-house and therefore must rely on external laboratories for the testing of
their coating systems.
The purpose of this work is to design, construct and run a simple laboratory setup
based on the water jet principle. The proposed setup may be used for the initial
screening experiments of blade coating systems prior to the final approval in the
whirling arm rig. The setup must involve low capital and operational costs, have a low
footprint, are able to run many samples simultaneously and, most importantly, must
be able to produce data that correlates satisfactorily with the experimental data
obtained with the whirling arm test. Various modifications of the original prototype
have been evaluated in an attempt to produce such a good correlation.
2.3 Previous experimental setups simulating liquid impact erosion
There have been many previous attempts to simulate liquid erosion in the laboratory.
In this paragraph, a concise overview of the various types of equipment is presented
to provide background knowledge. More detailed and chronological descriptions are
available in previous review articles (from 2002 or older) [2, 9-13]
A variety of test rigs have been proposed. The basic difference among these rigs is the
active/passive impact mode between water droplets/jets and test specimens. Each
facility has its own advantages and drawbacks and the selection of the specific type of
equipment is based on the pertinent application and specific requirements for
efficiency and cost. Table 2.1presents a comparison of the various available setups.
41

32
Tabl
e 2.
1 H
isto
rical
ove
rvie
w o
f liq
uid
eros
ion
expe
rimen
ts.
Typ
e of
wat
er
eros
ion
Rig
nam
es
Rel
evan
t pa
ram
eter
s A
dvan
tage
s D
raw
back
s Fi
rst
time
repo
rted
Im
pact
ing
cont
inuo
us
wat
er je
ts
Whe
el a
nd je
t [14
-16]
Je
t dia
met
er 0
.3 -
2.5
mm
. M
axim
um im
pact
vel
ocity
600
m/s
. Si
mpl
e fa
bric
atio
n an
d op
erat
ion.
Po
or re
prod
ucib
ility
. 19
24
WJA
(con
vent
iona
l wat
er je
t ero
sion
ap
para
tus)
[44]
Im
pact
vel
ocity
0-4
0 m
/s.
Impa
ct a
ngle
90º
. 19
97
Wat
er je
t pro
voke
d im
pact
ing
drop
lets
N
ot a
vaila
ble
[18-
22]
Impa
ct v
eloc
ity 0
-350
m/s
. Im
pact
ang
le 9
0º.
Dro
plet
size
1
mm
.
Che
ap to
fabr
icat
e an
d op
erat
e.
Goo
d te
st re
sults
for s
ome
mat
eria
ls.
Low
repr
oduc
ibili
ty.
Low
test
eff
icie
ncy.
U
ncon
trolla
ble
ambi
ent c
ondi
tions
.
2007
Impa
ctin
g w
ater
jet
slug
s M
IJA
(mul
tiple
impa
ct je
t app
arat
us)
[6, 2
3, 2
6, 3
0, 3
6, 3
8]
Impa
ct v
eloc
ity 3
0-60
0 m
/s.
Noz
zle
orifi
ce to
spec
imen
10
mm
. 20
impa
cts p
er m
inut
e.
Inex
pens
ive
rig.
Wel
l con
trolle
d te
stin
g pa
ram
eter
s. R
epro
duci
ble
resu
lts.
Rep
rodu
cibl
e je
t pro
file.
N
arro
w v
eloc
ity sp
read
(0.5
-1.5
%).
Flex
ible
sam
ple
size
, sha
pe a
nd m
ater
ial.
Hig
h ex
perim
enta
l ski
lls re
quire
d.
Onl
y je
ts c
an b
e ge
nera
ted.
19
91
Dis
cret
e je
t (or
inte
rrup
ted
jet)
[1, 6
, 31
, 32]
N
ot a
vaila
ble
Che
ap to
fabr
icat
e an
d op
erat
e.
Use
ful f
or a
lim
itted
rang
e of
mat
eria
ls.
Inac
cura
te re
sults
. 19
57
Mov
ing
sam
ples
im
pact
ing
falli
ng
wat
er d
ropl
ets
Whi
rling
arm
[7-9
, 27,
33-
38]
Cha
ract
eris
tic d
ropl
et si
ze 2
mm
. R
ainf
all 2
5.4
mm
/h.
Impa
ct a
ngle
0-6
0°.
Impa
ct v
eloc
ity 0
-300
m/s
.
Rep
rodu
cibl
e re
sults
. R
esul
ts c
orre
late
wel
l with
pra
ctic
al fl
ight
te
stin
g.G
ood
for c
ompa
rison
of r
elat
ive
eros
ion
resi
stan
ce.
Expe
nsiv
e fa
bric
atio
n an
d op
erat
ion.
C
ompl
ex a
erod
ynam
ic e
nviro
nmen
t. A
ssum
ed p
rede
term
ined
impa
ct e
nviro
nmen
t ch
ange
s as v
eloc
ity c
hang
es.
Act
ual d
rop
size
diff
eren
t with
prd
eter
min
ed si
ze.
Not
pre
cise
for e
rosi
on m
echa
nism
stud
y.
Poor
inte
rcha
ngea
bilit
y of
test
resu
lts a
mon
g rig
s of
sam
e ty
pe.
Low
test
eff
icie
ncy.
1946
GR
CI B
allis
tic ra
nge
[6, 2
3, 3
6, 3
8]
Dro
plet
size
1.5
-5.0
mm
. Im
pact
ang
le 0
-60°
. Im
pact
vel
ocity
100
-100
0 m
/s.
Max
imum
cyl
inde
r dia
met
er 2
0 m
m.
Bot
h sp
heric
al a
nd d
isto
rted
wat
er d
rops
can
be
gene
rate
d.
Bot
h si
ngle
and
mul
tiple
impa
cts m
odes
av
aila
ble.
Exce
llent
repr
oduc
ibili
ty.
Hig
h ve
loci
ty a
vaila
ble.
C
onsi
sten
t cor
rela
tions
bet
wee
n im
pact
ve
loci
ty, d
ropl
et si
ze a
nd im
pact
ang
le.
Dire
ct c
orre
latio
n be
twee
n ca
use
and
effe
ct.
Exce
llent
for e
rosi
on m
echa
nism
stud
y.
Expe
nsiv
e fa
bric
atio
n.
Low
test
eff
icie
ncy.
O
nly
smal
l sam
ples
pos
sibl
e.
Hig
h ex
perim
enta
l ski
lls.
1976
Win
d tu
nnel
[6]
Arti
ficia
l rai
nfal
l 0.3
l/s.
Wat
er c
once
ntra
tion
50-1
00 ti
mes
hi
gher
than
real
env
ironm
ent.
Impa
ct v
eloc
ity 2
00-2
75 m
/s.
Use
ful t
est t
ime
100
s. Sp
ecim
en d
iam
eter
260
mm
.
Res
ults
cor
rela
te w
ell w
ith p
ract
ical
flig
ht
test
ing.
Expe
nsiv
e fa
bric
atio
n.
Low
test
vel
ocity
. Sh
ort u
sefu
l tes
ting
time.
U
nrea
listic
dro
plet
con
cent
ratio
n.
Tem
pera
ture
diff
icul
t to
cont
rol.
Dro
plet
size
har
d to
con
trol.
Res
ults
diff
icul
t to
com
pare
with
oth
er ri
gs.
1965
Hol
lom
an R
ocke
t sle
d [6
, 36,
38]
R
ainf
ield
1800
m.
Max
imum
vel
ocity
200
0 m
/s.
Impa
ct a
ngle
0-7
0°.
Con
sist
ent d
ata.
R
esul
ts c
orre
late
with
pra
ctic
al fl
ight
test
ing.
Ex
trem
ely
high
impa
ct v
eloc
ity p
ossi
ble.
Sm
all t
o fu
ll-sc
ale
obje
cts c
an b
e ex
pose
d.
Extre
mel
y ex
pens
ive
to fa
bric
ate
and
test
. Sa
mpl
es su
ffer
ing
from
shoc
k w
ave
effe
ct.
Diff
eren
t wat
er d
rop
conc
entra
tion
dist
ribut
ion.
Lo
w te
st e
ffic
ienc
y.
1957
42

33
2.3.1 Impacting continuous water jets
The first experimental investigation of liquid erosion by repeated impact is the so-
called “wheel-and-jet”, which has been used in various forms since the 1920s. The
principle is to attach specimens on the periphery of a rotating disk or arm and let the
specimens pass through one or more continuous liquid jets [6, 14-16]. This method
has been used for liquid erosion of alloys. A modified version keeps the sample
material at rest and let a continuous liquid jet deliver the impact [16]. The jet is
produced by a high pressure pump. The continuous jet was useful for studying erosion
mechanisms and provided a ranking of selected materials, such as alloys and brittle
polymeric coatings (PMMA). Careful calibration and correlation experiments are
needed to ensure meaningful results.
2.3.2 Water jet provoked impacting droplets
A liquid jet leaving a nozzle into an ambient atmosphere is unstable and will, at some
distance, break into droplets of sizes comparable with the jet diameter or much
smaller [17]. Some researchers, in recent years, used this method to investigate
erosion mechanisms and compare material (e.g. alloys and polymeric coatings)
performances [18-22]. The distance between nozzle and specimen is critical for
proper droplet formation. However, droplet sizes have been characterized by doppler
anemometry and found to be much less than a typical rain droplet diameter of 2 mm
[23].
2.3.3 Impacting water jet slugs
Theoretical and experimental studies have indicated that short liquid jets (so-called jet
slugs) can be used to simulate droplet impact [11, 24]. The reason is that the central
core of a short coherent liquid jet has a smooth, slightly curved, front profile, which
allows a reasonable representation of a water droplet. Bowden and Brunton [25]
devised such a rig, SIJA (single impact jet apparatus), where sample materials were
kept at rest and short jets of liquid were used for impact. Materials investigated were
hard polymers for aircrafts. Results showed that evaluation of high velocity erosion by
this rig can be achieved. An advanced water jet impact rig named MIJA (multiple
impact jet apparatus) with computer control and multiple impacts was devised and
tested between 1982 and 1991 [26-29]. It produced a jet every 5 s with velocities
ranging from 30 to 600 m/s. The jet slug is formed by extruding liquid through an
43

34
orifice [30]. The damage produced can be correlated very well with that occuring
during an actual flight at high velocity through a rainfall [28].
Another way to generate jet slugs is by the use of a discrete jet (or interrupted jet)
apparatus. The first description of such a rig was provided by Olive in 1953 [1]. In
this setup, a high pressure pump forces a continuous jet of water, at a selected
velocity, through nozzles with specific diameters, thereby generating a specific jet
cylinder radius. A slotted rotating stainless steel disk chops the jet into discrete slugs.
Photographic characterization showed that the jets are cigar-shaped [1]. Recently, this
principle was used for water erosion evaluation of alloys [31]. It is claimed that this
technique can provide valuable data on the relative erosion resistance of different
alloy samples and that a good correlation exists with whirling arm test results [31, 32].
2.3.4 Moving samples impacting falling water droplets
The principle of this type of equipment is to simulate the impact taking place when a
moving object is exposed to a rainfall. The most well-known rig is probably the
whirling arm equipment, which has been used extensively for rain erosion
experiments since the 1940s. The erosion is achieved by rotating three arms (“rotors”)
at high velocity in an artificial rainfall, formed by spraying water through nozzles
[33]. Average droplet diameters of 2 mm appear to have been adopted by most
investigators as the “standard” droplet size and 25.4 mm/hour (1 inch/hour) as the
standard rainfall rate [8]. A series of real flight tests in rain have shown that whirling
arm test results could be correlated well with the actual flight test results without
negative effects from the high centrifugal force of the whirling arm [7]. Experiments
showed not only the same ranking, but also the same failure mode for the materials
investigated [6]. According to several authors [2, 6-9, 27, 34-37], the whirling arm
facility is a very useful tool for evaluating the erosion-resistance of materials (e.g.
screening tests). A simple equation for the whirling arm rig, providing a relationship
between impact frequency, fw (impacts/m2s), impact velocity, vw, and liquid volume
fraction of the experimental chamber, w, can be derived
3 3
6 6
ow
T sw ww
p p
lvt vvf
d d (1)
44

35
where the ratio, lo/tT, is the rainfall rate and vs is the steady state water droplet
sedimentation velocity in the air chamber. For a droplet diameter of 2 mm (equivalent
to a sedimentation velocity of about 7 m/s according to “Newton’s sedimentation
law”), a rainfall rate of 25.4 mm/h, and an impact velocity of 150 m/s, the water
droplet impact frequency can be calculated to 36101 impacts/(m2·s).
To achieve a well-controlled impact environment, another rig has been constructed,
where a material sample is attached in the front of a so-called sabot (i.e. “like a
bullet”), which can be propelled down a tube using a small charge of gunpowder. The
material sample then impacts a falling water droplet, which has a well-controlled size
and shape. The complex process requires high experimental skills [6, 9, 38]. This
method is a further development of the old suspended water droplet principle, which
can cause distortion of the water droplet. Another variation of this equipment involves
a gun barrel, a rain section and a breaking section, and the specimen is launched by
gun powder or a compressed air blast. These ballistic range techniques can achieve
the velocity with a controlled temperature and pressure which produce well controlled
parameters for mechanistic studies of water erosion. The drawbacks are the time and
expense per shot and the restriction in the sample size. Useful information on water
droplet erosion has also obtained by this technique [6].
The erosion test facilities “rock sled” and the wind tunnel are based on a similar
principle by propelling the material sample through an artificial rain field.
Disregarding its huge size, these techniques allow the use of very high velocities and
aerodynamically appropriate geometries [6]. However, due to the huge costs of
construction and operation of the facility, those techniques are restricted to very few
research centers.
2.4 Design criteria for water jet setup
We have not found any previous studies of water droplet erosion of blade coatings in
laboratory setups. It was decided to base the new setup on continuous water jets and
impacting water jet slugs. In an attempt to obtain some kind of correlation between
the whirling arm rig and the new water jet setup, design criteria need to be chosen.
However, there is a fundamental difference between a coated panel moving in a heavy
rainfall, as in the whirling arm rig, and a continuous or discontinuous water jet
impacting a slowly moving coated panel. For a setup similar to the whirling arm rig, it
has been shown, using a high-speed camera [39], how a water drop of average size 2
45

36
mm is shattered into thousands of smaller drops upon impact with a coated panel
moving at high velocities. A similar, but not identical, event takes place when a
discontinuous water jet impacts a coated panel and it is an assumption of this work
that the mechanisms are sufficiently similar to allow a correlation between the two
setups. The assumption will be discussed in more detail in the results and discussion
section.
The impact of liquid will generate several different pressure waves in the coating that
can cause material damages [25, 40]. It has been chosen to scale the two rigs based on
the water hammer pressure and the impact frequency. The water hammer pressure is
given by the equation
(2)
where and are the density and acoustic velocity of the water, respectively, and v is
the impact velocity. To match the water hammer pressure in the two rigs, the rotor tip
and jet velocity simply need to be identical. The droplet or jet impact frequency
[measured in the unit impacts/(m2·s)] is also essential because of the importance of
relaxation times in coatings. The ability and rate of a coating to absorb and distribute
the energy from an impact (resiliency) can vary tremendously and this difference will
be expressed via the impact frequency. The latter can be approximately matched by a
proper choice of process parameters in the jet setup as will be shown later. There are
also differences between the two rigs, which are expected to cause secondary effects.
The most important ones are probably the geometry or curvature of the coated panels
and the potential presence of a thin water film on the coating, formed by the previous
impacting droplet or jet slug. In the whirling arm rig, the panels have a curved shape,
similar to wind turbine blades, and the fast movement of the rotor may rapidly remove
any water film, whereas an imposed “wind” will need to be arranged in the jet setup to
realize a similar situation. Finally, droplet geometry and size, impact angle, and water
temperature may also be of importance. The new setup should be able to run many
samples simultaneously.
2.5 Experimental procedures
2.5.1 Design and construction of water jet erosion rig
Initially, a setup based on a continuous flat fan jet, was constructed. A schematic
illustration of the equipment line is shown in Figure 2.1.
46

37
Figure 2.1 Rig V1- Schematic illustration of the continuous flat fan water jet erosion rig. Water for the jet is taken from a tank (not shown in figure) holding about 50 liters of water (no recycle was used).
The rig utilizes a high pressure plunger pump, UDOR MSC 16/20 S, to produce the
jet. The fan size formed is dependent on the nozzle fan angle. The PNR1686 nozzle
with 25º fan angle and 1.12 mm equivalent orifice diameter was used for the flat fan
jets. The safety relief valve was installed to avoid building up too high pressures. Tap
water was used as the eroding liquid for all the experiments. The average linear water
jet velocity (in m/s) at the orifice of the nozzle can be calculated from the volumetric
water flow rate (in m3/s) divided by the cross section area (in m2) of the nozzle. The
instantaneous pressure readout was monitored by a pressure gauge. The distance of
nozzle orifice to sample surface was kept at 10 cm so that the decrease of jet velocity,
due to air friction within this short distance, could be neglected. The high pressure
water jet will cause a water temperature increase, but this was avoided by using either
a once-through principle for the water or a thermostated water bath.
To obtain a more realistic physical situation than the continuous jet, a modification of
parts of the setup was conducted. The Lechler 546 nozzle with 0.84 mm orifice
diameter was used for the continuous straight jets. A close-up of this part is shown in
Figure 2.2.
47

38
Figure 2.2 Rig V2 – Schematic illustration (vertical cross-sectional view) of water jet erosion rig, including the disk, which ensures discrete water jets. The water recirculation tank holds about 50 liters of water.
The moving wheel (diameter of 52 cm) in the middle of the chamber, holding up to 22
coated steel panels, is driven by an electronic motor (power input of 0.25 kW),
allowing for various rotation velocities (0.1-4.5 RPM). The water flow rate can be
varied by regulating a by-pass unload valve, whereby the water jet velocity at the
nozzle orifice can be controlled. The pulsation dampener ensures a stable jet. A digital
flow meter was installed to measure the water flow rate. A rotating stainless steel disk
(diameter of 10 cm), with 10 mm holes as shown in Figure 2.3(1) or with 1 mm slots
as shown in Figure 2.3(2), was incorporated into the rig to chop the continuous
straight water jet into slugs; the modification is shown in Figure 2.3(3). This addition
enabled an investigation of effect of droplet impact frequency and size of jet slugs.
The moving wheel holding the coated panels is shown in Figure 2.3(4).
48

39
Figure 2.3 Disks with (1) 10 mm diameter holes and (2) 1 mm slots for chopping water jets. The smaller holes seen in the disk are used for fixation of the disk in the jet setup. Insert (3) shows the disk position in the rig and insert (4) the wheel with 22 coated panels.
2.5.2 Details of coated steel panels
Flat steel panels of dimensions 7.0 × 15.0 cm and a thickness of 2 mm were used as
substrate. The latter was firstly coated by an epoxy primer followed by two different
polyurethane-based blade coatings (topcoats), termed coatings A and B. Both coatings
contain xylene and polar solvents (butyl acetate type). The binder of coating A
consists of a common commercial polyester polyol cured with a common commercial
flexibilized isocyanate trimer. For Coating B, the same polyester polyol as for coating
A was used and the curing agent was a standard isocyanate trimer. Both coatings
contain colouring pigments (mainly TiO2) and standard extenders. Coating application
was done using airless spray at 200 bars and cured at 23 C for 7 days, following one
hole drilled on each end of the panel to attach them to the moving wheel. The total dry
film thickness (DFT) of primer and topcoats, measured using an Elcometer Model 355
3
disk
nozzle
wheel
1 2
4
10 mm hole 1 mm slot
49

40
Top, calibrated for 450 μm thickness, was 423.3±51 μm for the coating A system
based on 30 separate samples and 421.6±91 μm for the coating B system (also 30
separate samples).
2.5.3 Comparative experimentation in whirling arm rig
For the purpose of comparison, the two coating systems were also tested externally in
a whirling arm rig at a controlled temperature of 20-25 C. The rotor blade radius was
0.915 m and the rainfall intensity 30-35 mm/hour. The water droplet size was 1-2 mm
and the tangential velocity of the coated steel panel, due to the radial dependency,
ranged from 126 to 160 m/s. The coated steel panel, with a curved geometry that
simulated a rotor blade leading edge, is shown in Figure 2.4. Coating A Coating B
Figure 2.4 Results of rain erosion experiments in a whirling arm rig with two blade coatings. The highest impact velocity (rotor tip) was to the left on the panels, where erosion damage is most visible. The three left hand photos show Coating A before (1) and after erosion (2-3). To the right, Coating B, before (4) and after erosion (5-6), is seen. The scale shown in the figures is in cm.
1 4
2 5
3 6
8
0 hr erosion
1.5 hrs erosion
3 hrs erosion
0 hr erosion
1.5 hrs erosion
3 hrs erosion
50

41
The special curvature of the panels was established prior to coating application. For
efficient use of the rather expensive curved steel substrates, coatings were removed by
sand blasting after experimentation and reused. The length of a test panel is 22.5 cm.
Erosion was evaluated by inspecting samples every half an hour with all total test
duration of 3 hours.
2.5.4 Characterization methods
Incubation time, defined here as the time period prior to erosion damage appearing, is
critical for blade coatings. Surface defects may result in a loss of aerodynamic balance
of the wind turbine and the coating erosion rate is likely to accelerate after a damage
appear [41, 42]. Therefore, attention was paid to incubation time and this output
parameter was recorded during each experimental series.
During our initial experiments, where an even flat fan jet and wheel rotation were
used, weight loss measurements were recorded at regular intervals. Coating samples
were removed from the rig at predetermined time intervals, gently washed with fresh
tap water to remove any loose coating remains and finally gently wiped to remove any
residual water. Then samples were dried in a forced-convection oven at 50 ºC for 1
hour, until a constant sample weight was obtained. Using this method, it was actually
possible to quantify the erosion rate, but when using a straight jet (and a rotating
wheel), the area eroded was too small for an accurate detection and the approach was
abandoned.
Once erosion occurs, morphology change will appear. This change can be detected on
a photo of the damaged coating using the software ImageJ, whereby the eroded area
can be calculated. This characterization method was investigated in one of the
experimental series. In addition, the morphology of coating surface was characterized
with and without erosion by Alicona infinite focus optical surface metrology.
The adhesion (pull-off strength) of the coating system was investigated by gluing a
so-called “dolly” (metal object with a flat base) onto the coating surface, using epoxy
glue, followed by a machine-driven pull-off removal of the dolly, while recording the
force required. This technique is known as pull-off adhesion test method.
2.5.5 Experimental erosion procedure
Using rig V1 (see figure 2.1), the two wind turbine blade coatings were exposed to jet
erosion at stationary conditions. Experiments were initiated by filling the hold up tank
51

42
with water, turning on the wheel and/or the disk to the selected rotation velocities, and
finally the high pressure pumps, driving the water jet, were started and adjusted to the
required pressure (jet velocity). The jet is focused on a small area on the coating
surface. During experimentation in rig V2 (see figure 2.2), where the coating sample
is continuously being moved in front of the jet by the wheel, the coating area exposed
to the flat fan jet (in one pass) is approximately 4.4 × 7.0 cm, when the distance
between the coating surface and the nozzle orifice is 10 cm. The coating exposed to
the straight jet (and wheel rotation) is only damaged in a small area of about 2 mm × 7
cm, however, this area was more than enough to detect erosion damage and the non-
exposed coating area may be exploited for additional experiments in a more flexible
equipment. The experiment was periodically put to a halt to examine potential coating
failures, such as cracking, fracture, cratering, pitting, penetration to the substrate,
adhesion loss between coatings or delamination at the coating substrate interphase.
Photos of the coating surfaces were regularly recorded.
2.5.6 Mathematical model linking process parameters in water jet setup
As described in an earlier section, it is important to approximately match the water
hammer pressure and the impact frequency in the two rigs. This is only possible when
the rotating disk is employed (i.e. for a non-continuous jet). A mathematical model is
required to link the different parameters in the water jet setup. The impact frequency
of a discrete water jet, fj (impacts/m2s), can be expressed as
(3)
where tB is the time between two impacts and A is the exposed coating area during
this time interval. From the definition of velocity one gets
(4)
where lB is the distance between two holes on the disk and fD and RD is the frequency
and radius of the disk, respectively. The exposed coating area is given by
(5)
with
(6)
52

43
where lwh is the distance moved by a coating panel during time tB. If the wheel is not
moving then lwh=0. If the impact frequency of the whirling arm rig is fw then
the ratio of the two impact frequencies will be
(7)
where fw can be calculated from equation (1) (an example is provided in section
2.3.4). The impact frequencies of the two setups will be matched when fj=fw (or
fj/fw=1) and the following parameters in the jet setup can be adjusted to realize that: fD,
RD, lB, dh, fwh and Rwh. Practical considerations in the design of the setup have put
constraints on RD, lB, dh, and Rwh, fD and fwh are left as free parameters that can be
used to adjust the conditions to fj/fw=1.
2.6 Results and discussion
A series of experiments was conducted using the new water jet setup. Two blade
coatings, termed A and B, were selected for the development of the experimental
setup. In Figure 2.5, a schematic flow chart of the experimentation strategy (as it
developed) is shown.
53

44
Figure 2.5 Overview of experiments conducted in the water jet setup. The chronological order of the experiments was from Experiment 1 - Experiment 9.
First, we conducted initial trials with a continuous jet, a flat fan nozzle, and a static
wheel (Experiment 1). The proposed setup was then modified including a moving
wheel and employing 22 panels simultaneously (Experiment 2). Secondly, the
advanced rig with a slotted (10 mm) disk and a circular nozzle was used for
experimentation with discrete jet slugs (Experiment 3). The remaining experiments
were done using a smaller disk gap size (1 mm), first with a static (Experiment 4) and
then with a moving wheel (Experiment 5-9). In Experiments 5-9, the influence of the
jet velocity and the disk rotation frequency were investigated. All water jet results are
summarized in the Table 2.2.
54

45
Table 2.2 Overview of process parameters and results for experiments in water jet erosion rig. The result “Coating B > Coating A” means that the performance of coating B was better than that of coating A.
ExperimentNo.
NozzleDiameter (mm)
Jet type Jet velocity
(m/s)
Disk gap size(mm)
Diskrotation(rpm)
Wheelrotation(rpm)
Ratio of impact frequencies
Experimentationtime (hrs)
Damage description
Result(ranking)
1 1.12 Continuous flat fan jet
157 (200 bar)
N/A No disk 0 1/6 Coating A startedpitting in 30 secs Coating B startedpitting in 10 mins
Coating B Coating A
2 1.12 Continuous flat fan jet
157 (200 bar)
N/A No disk 4.5 4 Coating A startedpitting in 2/3 hrs Coating B no damage in 4 hrs
Coating B Coating A
3 0.84 Discrete straight jet
167 (150 bar)
10 420 4.5 14.0 3 Coating A startedpitting in 1/3 hrs Coating B no damage in 3 hrs
Coating B Coating A
4 0.84 Discrete straight jet
140 (100 bar)
1.0 840 0 4200.0 8 Coating A damaged in 3 hrs Coating B no damage in 8 hrs
Coating B Coating A
5 0.84 Discrete straight jet
15 (20 bar)
1.0 19 4 1.0 66 No erosion for both samples
N/A
6 0.84 Discrete straight jet
140 (100 bar)
1.0 19 4 1.0 66 No erosion for both samples
N/A
7 0.84 Discrete straight jet
140 (100 bar)
1.0 252 4 157.0 66 No erosion for both samples
N/A
8 0.84 Discrete straight jet
167 (150 bar)
1.0 252 4 157.0 66 Coating A startedpitting in 60 hrs Coating B no damage in 66 hrs
Coating B Coating A
9 0.84 Discrete straight jet
167 (150 bar)
1.0 840 4 1349.0 66 Coating A startedpitting in 25 hrs Coating B no damage in 66 hrs
Coating B Coating A
55

46
In the whirling arm rig, coating A showed higher erosion-resistance than coating B
(approximately the same for three replicates of each coating) as shown in Figure 2.4.
After 1.5 h, the length of the damaged areas in sample A and B were approximately 5
and 19 cm, respectively. After 3 hours of experimentation, the length of the damaged
area for the coatings A and B were about 10 cm and the entire coated panel 22.5 cm,
respectively.
The erosion damages of the coatings take place in 3 hours in the whirling arm
experiments (samples continuously exposed). Therefore, with 22 panels fitting in the
new setup (continuous operation, but samples exposed sequentially on the wheel), the
erosion should take place in not more than 66 hours for the panel exposure time to be
identical in the two setups. Data from the water jet setup will now be discussed in
more detail.
2.6.1 Erosion of coatings by continuous flat fan jet
The preliminary experiment (Experiment 1) with a continuous flat fan water jet was
done in rig V1 (Figure 2.1) using the parameter values shown in Table 2.2. Erosion
was very rapid; for coating A it started after only 30 s and for coating B it started after
about 10 minutes. The failure of the two coatings is shown in Figure 2.6.
56

47
Coating A Coating B
Figure 2.6 Microscopic photos of coating A after 30 seconds exposure and coating B after 10 minutes exposure using a continuous water jet. To the left, Coating A before (1) and after erosion (2-4) is shown. To the right, Coating B before (5) and after erosion (6-8) is seen.
200 m 200 m
200 m 200 m
200 m 200 m
100 m 100 m
1 5
2 6
3 7
4 8
red primer red primer
microholes
microholes
57
48
Prior to exposure, Coating A had microholes in the surface, but otherwise showed no
sign of defects. Following the experiment the sample showed delamination and
cracking and the underlying primer was visible. Cracking appear to run through or to
initiate from the microholes. Coating B no defects were visible prior to exposure, but
it was partly delaminated after the failure mechanism had set in and cracks were also
visible, although to a lesser extent than for coating A. The underlying red primer was
also visible after exposure in this case. Even though both coatings failed, coating B
lasted about 20 times longer than coating A. This result is in contradiction with that
obtained in the whirling arm, where the ranking was opposite.
The next experiment, Experiment 2, was conducted in the rig V2 (Figure 2.2) which
incorporated a rotating wheel. The average velocity of the flat fan jet was about 157
m/s and three replicates of each coating was used so that the repetability of the
experiments could be investigated. Figure 2.7 shows the average eroded surface area
of the three samples of each coating system, measured using image analysis.
Figure 2.7 Experimental data of fraction of exposed coating area eroded in water jet setup. Standard deviations are shown as error bars. Coating B coincides with the x-axis.
Note that in all cases, less than 1 % of the coating surface area exposed was visually
damaged. The incubation period of coating A, during which the erosion of the
specimen cannot be measured, was found to be between 20 and 40 minutes only,
whereas for coating B there was no erosion visible even after 6 hours. Coating B
58

49
exhibited excellent water jet erosion resistance. In Figure 2.8, the average weight loss
versus experimentation time for coating A and B is shown as a supplementary
evaluation method.
Figure 2.8 Experimental data of weight losses from coatings as a function of experimentation time. Standard deviations are shown as error bars.
The weight loss changes gradually with time and is repeatable. For this method,
Coating B also showed superior erosion performance over Coating A. In fact, the
weight loss was so low that it was almost comparable to the accuracy of the weighing
scale. In this case, the erosion resistance ranking for the two investigated coatings is
also opposite to the ranking of the coatings in the whirling arm rig.
2.6.2 Erosion of coatings by discrete straight jet
Experiment 3 and 4 were done in the V2 setup with variations in the disk gap size,
disk velocity, jet velocity and wheel velocity (parameter values employed are shown
in Table 2.2 and Figure 2.5). The results were similar in these two experiments with
no erosion observed in coating B and fast (20 min) to fairly fast (3 hours) erosion of
coating A.
2.6.2.1 Effect of water jet velocity
In Experiment 5, parameters were set so as to “equalize” the impact frequency of the
two setups (water jet and whirling arm), while keeping a low water jet velocity. In this
case, however, there was no erosion after 66 hours on both coatings. Then the impact
59

50
velocity was increased to 140 m/s (Experiment 6) and the disk frequency was
increased to 252 RPM (Experiment 7) with other parameters remaining constant. Also
in those two cases there was no erosion of any of the coatings. The impact velocity
was then increased to 167 m/s (Experiment 8) and erosion of coating A was found
after 60 hours (visual evidence is shown in Figure 2.9) while Coating B did not show
erosion. This indicates that there is a critical jet velocity for the initiation of erosion at
least for Coating A. Below this velocity; the coatings did not show erosion even after
prolonged exposure. Impact velocity, in good agreement with equation (1), appears to
be the most critical element governing the initiation of erosion.
Figure 2.9 Photo of Coating A showing erosion damage after 60 hours. The scale is in centimeter. The area between the two solid lines was exposed to the water jet slugs.
2.6.2.2 Effect of impact frequency
Elastic coatings for blades have unique properties compared with rigid polymeric
materials. Their ability to recover mechanically between impacts gives them their
superior erosion resistance. If the time between successive droplet impacts is shorter
Erosiondamage
60

51
than the relaxation time, it will cause cumulative strain in the coating, which
eventually leads to failure. Therefore, impact frequency is expected to be an important
parameter. However, the results of Experiment 6 and 7, where the impact frequency
varied by a factor of 157 (fj/fw=1 in experiment 6), showed no erosion of the two
coatings.
When the disk frequency increased from 252 RPM (Experiment 8) to 840 RPM
(Experiment 9), corresponding to an additional factor of 8.6 on the impact frequency,
the time to initiation of erosion decreased from 60 to 25 hours for coating A (no
erosion for coating B). Thus, impact frequency does matter, but in a more complex
way than anticipated. However, if the jet velocity is not high enough for erosion
initiation, then an increase of impact frequency did not influence coating erosion or
damage even after long exposure time.
2.6.2.3 Measurements of adhesion strength
To analyse for less visible defects, pull off adhesion evaluation experiments were
conducted on the non-exposed coatings. Photos of the visual adhesion losses observed
are shown in Figure 2.10 and analysis results are provided in Table 2.3.
Figure 2.10 Photos showing results of pull-off adhesion experiments on non-exposed coatings. The bases of the detached dollies are shown to the right in each photo.
Coating A Coating B
1
2
3
1
2
3
61
52
Table 2.3 Results of pull-off adhesion analysis. The values reported represent the percent failure of the area covered by the dolly base.
Coating A (failure by percent of area) Coating B (failure by percent of area) Dolly 1 Dolly 2 Dolly 3 Dolly 1 Dolly 2 Dolly 3 Cohesive failure of topcoat
90 90 90 80 80 10
Adhesive failure between topcoat and glue
10 10 10 15 15 10
Cohesive failure of primer
0 0 0 5 5 0
Adhesive failure between primer and substrate
0 0 0 0 0 80
No adhesive failure between topcoat and primer was observed for the non-exposed
coatings. However, for exposed panels, delamination between topcoat and primer was
observed for both blade coatings as shown in Figure 2.6(4) and 2.6(8). Therefore, the
delamination between topcoat and primer was caused by repeated water jet impacts.
2.6.2.4 Mechanistic discussion of coating degradation
Prior to water jet exposure, blade coating A had various “conventional defects”
(microholes) as shown under microscope in Figure 2.6(1). These defects may
originate from the application procedure, incompatibility of coating ingredients, or
some kind of surface contamination (e.g. dust particles with a low surface energy).
After water jet exposure, small cracks are seen to connect some of the microholes in
the coating [Figure 2.6(2)]. Therefore, the microholes are potentially weak points and
may act as sites for crack initiation when the samples are exposed to droplet impacts.
It may be noted that a similar degradation mechanism has been observed for
cavitation erosion of coatings [2]. The initial cracks are likely to propagate and at
some point cause a visual failure. The growth of cracks in the polyurethane coating,
shown in Figure 2.6(3), may occur through progressive chipping of material from the
border of the delaminated area. Lateral jets impacting the periphery of the pit can
cause additional damage.
The failure in the material may also be the consequence of cumulative fatigue
produced by the repeated impacts of the water jet slugs. During the impact, the shear
stress exerted on the coating may deform the upper layer of the coating by stretching
the coating from the point of droplet impact. Some coatings, depending on the
mechanical properties (e.g. resiliency), may be able to release the stored energy as
heat, whereas others will induce small imperfections in the surface by the formation
62

53
of small cracks or pits. These failures can enlarge during further exposure. This may
be the reason for the erosion of coating B, shown in Figure 2.6(6) and (7). The
unexposed coating B, Figure 2.6(5), does not show any visible surface defects (as
opposed to coating A).
It was also observed in the experiments that the erosion of a given coating did not
start over the entire sample area at the same time, but began in a single point and then
spread to the remaining area exposed to water jet impacts. The reason is probably that
there are weak points in the matrix resin of the coating that are more sensitive to
impacts. This is somewhat similar to degradation of epoxy coatings by sunlight,
where damages also spread from weak points in the matrix [43]. Once a defect
appears, the erosion can accelerate because of increasing pressures building up on
irregularities in the coating surface when water jet slugs impact.
2.7 Conclusions
A new water jet erosion rig that may potentially supplement erosion experiments in
the whirling arm apparatus was designed and constructed. The performance of two
coating systems, which were also tested in a whirling arm rig, was investigated. The
new rig can run with 22 panels simultaneously. The water jet velocity was found to be
the most critical parameter for initiation of erosion, though very high velocities (about
167 m/s) were required. Surprisingly, a “matching” of the impact frequency and the
impact velocity did not produce similar results in the two setups. In fact, one of the
coatings was not damaged, even if the impact frequency of the jet setup was increased
by a factor of more than 1300, relative to the whirling arm rig. It was found that
original “defects” in the non-exposed coating may act as initiation points and lead to
subsequent failure during exposure. Additionally, the cumulative fatigue caused by
repeated impacts may induce small imperfections in the surface, leading to visual
damage during continued exposure.
In summary, it has, so far, not been possible to directly correlate the results of the
whirling arm rig with those of a discrete water jet. Further work will focus on the
effects of panel geometry, which are different in the two setups, and the potential
significance of the presence of a thin water film on the coating, formed by the
previous impacting droplet or jet slug.
63

54
2.8 Acknowledgements
Financial support by The Hempel Foundation and Hempel A/S is gratefully
acknowledged. The authors wish to thank Jakob Rasmussen from DTU MEK for
assisting with the microscopy measurements.
64

55
Nomenclature the exposed area of coating in unit time (m2)
C acoustic velocity of water (m/s) the gap size of slots in the disk (m)
the water droplet size in whirling arm test (mm) disk rotation frequency (Hz=s-1) discrete water jet impact frequency (impacts/m2s) impact frequency in whirling arm test (impacts/m2s) wheel rotation frequency (Hz=s-1)
arc length between two adjacent slots in the disk (m) lo amount of rainfall (mm)
the length of coating exposed area by water jet in unit time water hammer pressure (Pa)
disk radius (m) wheel radius (m)
the time between two adjacent impacts (s) time during which, lo rain falls (s) impact velocity of water droplets (m/s)
disk rotation velocity (m/s) water jet velocity (m/s)
steady state sedimentation velocity of rain drops (m/s) tip velocity of whirling arm rotor (m/s) wheel rotation velocity (m/s)
Greekliquid volume fraction in the whirling arm test chamber (m3 water/m3 chamber)
density of water (kg/m3)
Subscript disk for chopping jets
wheel for holding sample panels
65

56
References for chapter 2
[1] O.G. Engel, Mechanism of rain erosion, Wright Air Development Center, USA. Report No. 53-192 (1953) 1-54.
[2] J.H. Brunton, M.C. Rochester, Erosion of solid surfaces by the impact of liquid drops, in: C.M. Preece (Ed.), Treatise on materials science and technology, Academic press, New York, 1979, 186-248.
[3] S. Wittrup, Vingeforkanter er som dækkene på en bil (in Danish), Weekly Danish newspaper “Ingeniøren” (Nov. 11. 2013) 10-11.
[4] P.S. Veers, T.D. Ashwill, H.J. Sutherland, D.L. Laird, D.W. Lobitz, D.A. Griffin, J.F. Mandell, W.D. Musial, K. Jackson, M. Zuteck, A. Miravete, S.W. Tsai, J.L. Richmond, Trends in the Design, Manufacture and Evaluation of Wind Turbine Blades, Wind Energy. 6 (2003) 245-259.
[5] N. Dalili, A. Edrisy, R. Carriveau, A review of surface engineering issues critical to wind turbine performance, Renew. Sust. Energ. Rev. 13 (2009) 428-438.
[6] C.R. Seward, S.J. Pickles, E.J. Coad, M. Watt, J.E. Field, Studies of rain erosion mechanisms in a range of IR transmitting ceramics - including coated samples, University of Cambridge. Report SPC-92-4032 (1994) 1-206.
[7] G.F. Schmitt, Flight test-whirling arm correlation of rain erosion resistance of materials, Air Force Materials Laboratory, USA. Report AFML-TR-67-420 (1968) 1-31.
[8] C.J. Hurley, G.F. Schmitt, Development and calibration of a mach 1.2 rain erosiion test apparatus, Air Force Materials Laboratory, USA. Report AFML-TR-70-240 (1970) 1-68.
[9] W.F. Adler, The mechanics of liquid impact, in: C.M. Preece (Ed.), treatise on materials science and technology, Academic Press, New York, 1979, 127-185.
[10] C.M. Preece, M.H. Macmillan, Erosion, Annu. Rev. Mater. Sci. 7 (1977) 95-121.
[11] M.B. Lesser, J.E. Field, The impact of compressible liquids, Annu. Rev. Fluid Mech. 15 (1983) 97-122.
[12] M. Lesser, The impact of a compressible liquid, in: M. Rein (Ed.), CISM Courses and Lectures, Springer-Verlag Wien, Vienna; Sachsenplatz 4-6, A-1201 Vienna, Austria, 2002, 39-102.
[13] S. Zwaag, J.P. Dear, S.M. Walley, Rain and solid particle erosion damage mechanisms and materials evaluations, Air Force Wright Aeronautical Laboratory, USA. Report AFWAL-TR-86-4032 (1986) 1-95.
66

57
[14] B.S. Mann, V. Arya, An experimental study to corelate water jet impingement erosion resistance and properties of metallic materials and coatings, Wear. 253 (2002) 650-661.
[15] Standard test metod for liquid impingement erosion using rotating apparatus, American Society for Testing and Materials. ASTM G73-10 (2010) 1-19.
[16] G.M.C. Lee, The erosion resistance of plain carbon steels under water droplet impact conditions, Wear. 141 (1990) 185-201.
[17] R.D.R. S.P. Lin, Droplet and spray formation from a liquid jet, Annu. Rev. Fluid Mech. 30 (1998) 85-105.
[18] Y.I. Oka, S. Mihara, H. Miyata, Effective parameters for erosion caused by water droplet impingement and applications to surface treatment technology, Wear. 263 (2007) 386-394.
[19] Y.I. Oka, H. Miyata, Erosion behaviour of ceramic bulk and coating materials caused by water droplet impingement, Wear. 267 (2009) 1804-1810.
[20] Y.I. Oka, H. Hayashi, Evaluation of erosion resistance for metal–ceramic composites and cermets using a water-jet testing apparatus, Wear. 271 (2011) 1397-1403.
[21] M. Grundwürmer, O. Nuyken, M. Meyer, J. Wehr, N. Schupp, Sol–gel derived erosion protection coatings against damage caused by liquid impact, Wear. 263 (2007) 318-329.
[22] P.H. Shipway, K. Gupta, The potential of WC-Co hardmetals and HVOF sprayed coatings to combat water-droplet erosion, Wear. 271 (2011) 1418-1425.
[23] O. Gohardani, Impact of erosion testing aspects on current and future flight conditions, Prog. Aerospace Sci. 47 (2011) 280-303.
[24] M.B. Lesser, Analytic Solutions of Liquid-Drop Impact Problems, Proceedings of the Royal Society of London. Series A, Math. Phys. Sci. 377 (1981) 289-308.
[25] J.E. Field, ELSI conference: invited lecture: Liquid impact: theory, experiment, applications, Wear. 233–235 (1999) 1-12.
[26] O. Gohardani, D.M. Williamson, D.W. Hammond, Multiple liquid impacts on polymeric matrix composites reinforced with carbon nanotubes, Wear. 294–295 (2012) 336-346.
[27] A.A. Déom, A. Luc, S. Amara, D.L. Balageas, Towards more realistic erosion simulation tests for high velocity EM and IR windows, Wear. 233–235 (1999) 13-24.
[28] A. Déom, R. Gouyon, C. Berne, Rain erosion resistance characterizations: Link between on-ground experiments and in-flight specifications, Wear. 258 (2005) 545-551.
67

58
[29] M.K. Lee, W.W. Kim, C.K. Rhee, W.J. Lee, Liquid impact erosion mechanism and theoretical impact stress analysis in TiN-coated stream turbine blade materials, Metall. Mater. Trans. A. 30 (1999) 961-968.
[30] C.R. Seward, C.S.J. Pickles, J.E. Field, Single and multiple impact jet apparatus and results, Window and dome technologies and materials. 1326 (1990) 280-290.
[31] E.F. Tobin, T.M. Young, D. Raps, O. Rohr, Comparison of liquid impingement results from whirling arm and water-jet rain erosion test facilities, Wear. 271 (2011) 2625-2631.
[32] B. Luiset, F. Sanchette, A. Billard, D. Schuster, Mechanisms of stainless steels erosion by water droplets, Wear. 303 (2013) 459-464.
[33] M. Ahmad, M. Casey, N. Sürken, Experimental assessment of droplet impact erosion resistance of steam turbine blade materials, Wear. 267 (2009) 1605-1618.
[34] J. Zahavi, S. Nadiv, G.F. Schmitt Jr., Indirect damage in composite materials due to raindrop impact, Wear. 72 (1981) 305-313.
[35] C.J. Hurley, J. Zahavi, G.F. Schmitt Jr., UV radiation exposure effects on the rain erosion resistance of coated monolithic poly(carbonate) transparencies, Wear. 87 (1983) 9-28.
[36] W.F. Adler, Particulate impact damage predictions, Wear. 186–187, Part 1 (1995) 35-44.
[37] C. Westmark, G.W. Lawless, A discussion of rain erosion testing at the United States Air Force rain erosion test facility, Wear. 186–187, Part 2 (1995) 384-387.
[38] W.F. Adler, Rain impact retrospective and vision for the future, Wear. 233–235 (1999) 25-38.
[39] Protection from wind and weather: rotor blades of wind turbines with chemicals by BASF, http://www. basf-coatings. com/global/ecweb/en/ (Accessed 20.12.2013).
[40] M. Lesser, Thirty years of liquid impact research: a tutorial review, Wear. 186–187, Part 1 (1995) 28-34.
[41] M H Keegan and D H Nash and,M.M.Stack, On erosion issues associated with the leading edge of wind turbine blades, J. Phys. D. 46 (2013) 383001.
[42] A. Sareen, C.A. Sapre, M.S. Selig, Effects of leading edge erosion on wind turbine blade performance, Wind Energy (2013). DOI: 10.1002/we.1649.
[43] S. Kiil, Model-based analysis of photoinitiated coating degradation under artificial exposure conditions, J. Coat. Technol. Res. 9(4) (2012) 375-398.
[44] B.J. Briscoe, M.J. Pickles, K.S. Julian, M.J. Adams, Erosion of polymer-particle composite coatings by liquid water jets, Wear. 203–204 (1997) 88-97.
68

59
Chapter 3 - Rain erosion of wind turbine blade coatings using
discrete water jets: effects of water cushioning, substrate geometry,
impact distance, and coating properties
This chapter is prepared for submission for publication in Wear with the title “Rain
erosion of wind turbine blade coatings using discrete water jets: effects of water
cushioning, substrate geometry, and coating properties” (authors Shizhong Zhang,
Kim Dam-Johansen, Pablo L Bernad Jr., Søren Kiil)
3.1 Abstract
Rapid and reliable rain erosion screening of blade coatings for wind turbines is a
strong need in the coatings industry. One possibility in this direction is the use of
discrete water jets, where so-called jet slugs are impacted on a coating surface.
Previous investigations have mapped the influence of water jet slug velocity and
impact frequency. In the present work, the effects on coating erosion of water
cushioning, substrate curvature, and water nozzle-coating distance were explored. The
investigations showed that in some cases water cushioning (the presence of a liquid
film on the coating surface prior to impact) influences the erosion. Contrary to this,
substrate curvature and the water nozzle-coating distance (< 10 cm) did not influence
the results to any significant degree.
Mechanical measurements to characterize selected blade coatings, including tensile
strength, flexibility, impact, hardness, and abrasion experiments, were also conducted.
The ranking of abrasion resistance of the blade coatings was in agreement with the
ranking of rain erosion resistance measured in the whirling arm rig (an industrial
standard).
Results of this work, with more pertinent parameters explored, confirm the conclusion
from our previous investigation that a direct correlation of data from discrete water jet
experiments with those obtained in the whirling arm rig does not seem possible. The
underlying mechanisms of rain erosion are substantially different in a setup based on
impacting water jet slugs and a setup where a rotor arm impacts falling water droplets.
69

60
3.2 Introduction
During service life, the blades of wind turbines are exposed to continuous impacts
with rain droplets, hail, insects, or solid particles (e.g. sand) carried by the wind. This
can lead to erosion of the blades, whereby the electrical efficiency and weight
balancing are reduced and expensive repairs may be required. This is particular
problematic offshore, where access time, due to bad weather, can be limited and
maintenance in general is very expensive. Blade tip velocities on modern wind
turbines can get close to 100 m/s and means to protect the blades from (rain) erosion
are required. One possible solution is somewhat elastic blade coatings, which are able
to absorb the impact energy without crack formation [1-4]. Crude estimations in the
industry suggest that about 50 % of new large (>3 MW) wind turbines are specified
with blade coatings.
Fast, reliable, and cost effective evaluation of new blade coating formulations is
essential. Presently, the industrial standard, the so-called whirling arm rig, is mostly
used for experimentation [1]. It consists of a rotor, 2 m in diameter, rotating in an
imposed artificial “heavy” rainfall. Experimentation time is about three hours, and
rotor tip speeds up to 150 m/s are used. However, a fast-working, laboratory-size
screening device that can be used directly in the coating companies to evaluate many
samples simultaneously is highly desired. A variety of experimental erosion rigs,
mainly aimed at materials for aircrafts, have been designed and constructed in the past
100 years or so and were reviewed in [1].
In our earlier work [1], a setup based on discrete water jet slugs was presented and the
effects on erosion of water jet slug velocity and droplet impact frequency were
investigated. An important observation was that micrometer-size coating defects,
present prior to experimentation, appears to play an important role for the erosion
mechanism. Another finding for the two coating types investigated, under conditions
where impact frequency and water hammer pressure are “matched”, was that results
could not be directly correlated with those obtained in the whirling arm rig. In the
present work, additional experiments have been conducted with water jet slugs in
pursue of a correlation between the two setups. Parameters investigated are water
cushioning, substrate curvature, and water nozzle-coating distance. Measurements of
mechanical coating properties, including tensile strength, flexibility, impact, hardness,
and abrasion experiments, to characterize blade coatings, were also conducted.
70

61
The purpose has been to focus on testing methodology and to correlate erosion results
with selected mechanical properties. More detailed studies of the localized
mechanisms of rain erosion were beyond the scope of the work.
3.3 Mechanisms of liquid erosion
The underlying mechanisms behind drop impact erosion involve interactions of
several stress (pressure) waves in combination with successive drop impacts. A
schematic illustration of a single water drop impact is shown in Figure 3.1.
Figure 3.1 Schematic drawing of liquid droplet and rigid solid surface impact interaction. (A) shows the three main waves generated by the impact and (B) shows the deformation (outflow) of the compressed droplet. Reproduced from [8] with permission from Elsevier.
The failure, caused by impact, is divided into two regimes [5]. One occurs at the very
impact site and may initiate material deformation and cracks in the surface. The other
takes place when high velocity lateral water jets tear away any unevenness in the
surface material near the impact site [5].
The first damage can occur when the contact (drop-surface) edge travels across the
impacted surface (horizontally in Figure 3.1) at a velocity greater than that of the
reflected (shock) wave propagating into the water drop [Figure 3.1 (A)]. Due to lack
of a free surface where the pressure can be released, the water behind the shock front
is compressed and energy stored. Under the impact conditions considered here, the
pressure exerted on the target surface is known as the water hammer pressure and is a
function of the liquid density and impact velocity. It can cause direct cracks in the
coating surface. The impact pressure may reach values three times the central water
hammer pressure [6,7].
Later in the impact event, the second stage of the erosion mechanism sets in. The
contact edge between the target surface slows down and is overtaken by the shock
71

62
front [5]. Thereby, water trapped in the compressed region can escape, which
generates water jets (Rayleigh wave) across the surface causing a high velocity
sideways jet of fluid. Irregularities greater than 100 nm, originating from surface
roughness or damage, can be torn away resulting in material loss or further extension
of cracks. In total, there are three stress waves generated in the surface by the impact:
compression wave, shear wave and Rayleigh surface wave (see Figure 3.1). The
compression wave has little effect on the damage pattern. The overall interaction of
these waves can be complex and depends upon impact conditions and material
properties [8]. Details are available in other sources e.g. [8].
The complex phenomena described above suggest that the contact mode, when
experimenting with rain erosion, can be very important. In this work, focus is on the
fundamental difference between movement of coated panels against rain drops (i.e.
whirling arm rig) versus movement of water drops against coated panels (i.e. discrete
water jets).
Another aspect that is central for the work presented in subsequent sections is that of
so-called “water cushioning”, which refers to a potential lower erosion rate of a
wetted compared to a dry surface. In the case of wind turbine blade coatings under
natural exposure, a water film, originating from an impacting drop, might not be
allowed to form, will exist for a very short time only, or be very thin because of the
high tip speeds prevailing, which force-blows away any residual water. However, in
any water drop erosion setup based on static, or almost static, coated panels (such as
the ones of this work), a thin water film is indeed expected to form and be present
when consecutive water drops impact. In both cases, the shattering of water drops into
thousands of smaller drops, which are sent in all directions, must also be kept in mind.
In mechanistic terms, a water film can be formed when the rate at which liquid arrives
at the surface is high enough to balance the losses due to air friction, rotational
removal, and water evaporation. Brunton and Rochester [9] have suggested two
reasons why the presence of a liquid film might reduce rain erosion damage of a
surface: (i) When it is struck by a water drop, the liquid film deforms, so that the
pressure on the surface is less than it would have been if the surface had been dry.
However, the effect will only be significant if the liquid film thickness is above a
certain critical value (not quantified). (ii) The impact pressure is reduced because the
pressure wave diverges as it passes through the liquid layer. If the layer is thick
72
63
compared with the diameter of the drop, attenuation will vary as the square of the
layer thickness.
3.4 Strategy of investigation
In this experimental study, the following rig parameters are investigated: the water
cushioning effect, the geometry of coating samples, and the nozzle-coating distance.
The water cushioning effect is evaluated by incorporating an air nozzle that can, fast
and continuously, remove the water film formed upon droplet impact on the coating
surface. To investigate the effect of coating panel geometry (curvature), steel panels
with the shape of a wind turbine blade (leading edge), normally used for the whirling
arm erosion rig, were used. For the nozzle-coating distance effect, the length between
the water jet nozzle orifice and the coating panel was decreased by 50 % (relative to
the distance of 10 cm used in earlier work).
In an attempt to correlate physical coating properties with erosion performance, three
blade coatings, with different behaviors in the whirling arm experiment, were
thoroughly characterized and two of them used in the water jet experiments.
3.5 Experimental procedures
3.5.1 Modification of water jet erosion rig
In a previous publication [1], the design and construction of the water jet erosion rig
were described in detail. Only a summary of the major features and operating
parameters of that equipment is provided here. The basic configuration is shown in
Figure 3.2.
73

64
Figure 3.2 Schematic illustration of water jet erosion rig after modification with curved coating panels. Details of the setup are provided in [1].
The basic principle is a water jet, driven by a high pressure pump. The jet generated is
dependent on the nozzle type and angle used. Tap water is used as the eroding liquid
for all the experiments. The standard distance of nozzle orifice to coating sample
surface is 10 cm. The water can be recycled from a hold up tank and reused after
filtration. A thermostated water bath is used to control the water temperature. The
moving wheel (diameter of 52 cm) in the middle of the chamber, holding up to 22
coated steel panels, is driven by an electronic motor, allowing for various rotation
velocities (0.1-4.5 RPM). The water flow rate can be varied. A rotating stainless steel
disk (diameter of 10 cm), with 10 mm holes or 1 mm slots, is used to chop the
continuous straight water jet into slugs. Erosion is evaluated by inspecting samples at
predetermined time intervals. The potential erosion damage was recorded every 5
hours when using the 1 mm disk. For the experiments with the 10 mm disk, erosion
was much more aggressive and inspection was conducted every 10 min in the early
phase and at longer times every 2 hours. Erosion failure is defined by the incubation
time of the coatings, defined here as the time period prior to erosion damage
appearing. A number of modifications to the original setup have taken place and will
be discussed in the coming sections.
74

65
3.5.1.1 Water cushioning
To evaluate the water cushioning effect, blade coatings applied on flat steel panels
with dimensions 7.0 × 15.0 cm and a thickness of 2 mm were used for erosion
experiments. A separate air nozzle using pressurized air at 2 bars was incorporated
into the rig. The air flow from the nozzle points in direction to the small area where
the water jet slugs impact as shown in Figure 3.3. This ensures that the water film
formed on the coating surface upon droplet impact can be rapidly removed; thereby
simulating what takes place on a real wind turbine blade moving at high velocities.
The water film removal was verified by visual inspection.
Figure 3.3 Photo showing the position of the air and water nozzles in the rig. The white panels to the left are blade coating samples attached to the large, slowly rotating, wheel.
3.5.1.2 Sample geometry
In the whirling arm experiment, coating samples, simulating the leading edge
curvature of wind turbine blades, are used. Contrary to this, in our previous water jet
experiments [1], flat steel panels were used. The geometry (curvature) may have an
effect on the erosion behavior of the coatings and therefore the effect of this
parameter was investigated. Suitable curved panels were obtained simply by using the
metal substrates from the whirling arm rig. A close-up photo of these substrates can
be seen in Figure 2.4 in [1], and a schematic illustration of their placement in the
water jet rig is shown in Figure 3.2.
jet nozzle
Air nozzle
Disk
75

66
3.5.1.3 Impact distance
To evaluate the effect of jet nozzle-coating gap, the distance was decreased from 10 to
5 cm. Experiments were based on coated flat steel panels of dimensions 7.0 × 15.0
cm, in the presence of air blowing.
3.5.2 Details of coating samples used in erosion experiments
3.5.2.1 Samples for cushioning effect and impact distance experiments
Flat steel panels of dimensions 7.0 × 15.0 cm and a thickness of 2 mm were used as
substrate. They were firstly coated by an epoxy primer followed by two different
polyurethane-based blade coatings (topcoats), termed coatings A and B. Both coatings
contain xylene and polar solvents (butyl acetate type). The binder of coating A
consists of a common commercial polyester polyol cured with a common commercial
flexibilized isocyanate trimer. For Coating B, the same polyester polyol as for coating
A was used and the curing agent was a standard isocyanate trimer. Both coatings
contain colouring pigments (mainly TiO2) and standard extenders.
A hole was drilled at each end of the panel allowing for attachment to the moving
wheel. Coating application was done using airless spray at 200 bars and coatings
cured at 23 C for 7 days. The total DFT of primer and topcoats, measured using an
Elcometer Model 355 Top, calibrated for 500 μm thickness, was 517.0±51.6 μm for
the coating A system based on 13 separate samples and 349.0±39.4 μm for the coating
B system (also 13 separate samples). The panels used for water jet nozzle-coating
distance experiments had a total film thickness of 508±50.2 μm for Coating A based
on 3 samples and 369.5±40.0 μm for Coating B based on 3 samples.
3.5.2.2 Samples for curvature effect experiments
The special curvature of the panels was established prior to coating application. The
curved panel was first coated by a primer and then a topcoat (either Coating A or B).
Coating application was done using airless spray at 200 bars and cured at 23 C for 3
weeks. The total DFT of primer and topcoats was 454.0±25.9 μm for the coating A
system (3 replicates) and 413.0±18.5 μm for the coating B system. The length of a
coated test sample is 22.5 cm.
76

67
3.5.3 Investigation of physical properties of coatings
Physical properties of interest for blade coatings are: (1) tensile strength experiments,
to investigate the stress-strain behavior of coatings. (2) Pendulum damping
experiments, to investigate the hardness based on the principle that the amplitude of
the pendulum's oscillation will increase when supported on a harder surface. (3)
Mandrel bending experiments, to investigate the extent to which it resists deformation
(cracking) in response to an applied force. (4) Taber abrasion experiments, to
investigate the abrasion resistance of coatings, and (5) impact experiments, to
investigate the resistance of coatings to the effects of rapid deformation.
A third coating sample, coating C (also polyurethane- and solvent-based), was
included to expand the mapping of properties against erosion behaviour. The binder of
Coating C was a common commercial acrylic polyol cured with a standard isocyanate
trimer. Coating C was not evaluated in the water jet setup, but past experience has
shown that its performance in the whirling arm setup is poor in comparison to coating
B. Coating A performs better than coating B in the whirling arm rig.
In the subsequent sections, all coating sample preparations and subsequent curing
were done at a temperature of 23 2 C and a relative humidity of 50 5%.
3.5.3.1 Stress-strain (tensile strength)
The tensile strength experimentation is based on ASTM D 2370-92. It was performed
using a Zwick Universal Testing Machine Z2.5/TS1S-2000 equipped with load cells
providing up to 500 N. The three coatings were applied on thin plastic foils and cured
for 3 weeks. Coated foils were cut into a strip dimension of 30 100 mm before
removing the coating films from the special backing foil. This was done to minimize
the risk of damaging the edges of the strips. 10 replicate strips were prepared for each
coating. The thickness of each coating was measured before the experiments. Coating
C formed a rather brittle film on the foils, not very suitable for tensile strength
experimentation, and only Coating A and B could be used. Before operating the
equipment, a strip was placed and aligned between the two “jaws” used for fixation of
the test specimen. The lower jaw was kept static and the upper one moved at a
predetermined displacement velocity. For all films investigated, the maximum
displacement velocity of 100 mm/min was chosen. Young’s modulus (material
77
68
stiffness) was estimated from the linear part of the stress-strain curves (elastic region
at low strains).
3.5.3.2 Mandrel bending experiments
The three blade coatings were applied on steel panels of dimension 70 150 0.8
mm, and cured for 3 weeks. To conduct the experiment, a coated panel was inserted
and clamped into the conical mandrel (model Erichsen 312), and was bent in an even
movement through 180º in about 1 s. Three replicate panels were used for each
coating. Elongation at break was calculated according to ASTM D522. The bent panel
was evaluated using optical microscopy (10x magnification): the crack farthest away
from the small end of the conical mandrel was marked and the distance from the
farthest end of the crack to the small end of the mandrel was measured. The average
distance of 3 replicate panels was used to determine the percent elongation. The film
thickness was measured before the experiment and all experiments were conducted at
the same controlled temperature (23 2 C) and relative humidity (50 5%).
3.5.3.3 Impact experiments
Impact experiments were performed using an Erichsen variable impact tester model
304 following ASTM D2794. Coating A, B and C were applied on steel substrates
with dimension 200 300 1.5 mm and cured for 3 weeks. To perform the impact
test, the coated panel was placed on the support with a hole of 16.3 mm and a falling
hemispherical impact head (15.9 mm diameter, 453.6 g weight) was then allowed to
impact the coating and substrate centered under the indenter. The impact is on the
coating side and the indentation in this case is an intrusion. When the indenter strikes
the panel it deforms the coating and the substrate. By gradually increasing the
distance the weight drops, the point at which failure occurs can be determined. The
impact strength value is recorded as the highest impact energy which results in no
visible cracks and detachment of the film.
3.5.3.4 Pendulum hardness experiments
The pendulum hardness experiment is based on the principle that the amplitude of the
pendulum’s oscillation is dependent on the hardness of the surface. The harder the
surface, the greater the amplitude of pendulum oscillation. A König pendulum
78

69
hardness tester (Sheen Instruments Ltd, UK) was used to measure the surface
hardness of the cured film. The three coatings were applied on glass panels with
dimension 100 150 mm and cured for 7 days. The pendulum oscillation times from
6º to 3º was measured at the same temperature and humidity as the curing. The
measurement was repeated at three different positions. The DFT was measured before
the experiment.
3.5.3.5 Taber abrasion experiments
Experiments of abrasion resistance of the three coatings were conducted according to
ASTM D4060-10. Three coatings were applied on steel substrates with dimension
100 100 mm, and cured for 3 weeks. Three replicates of each coating were prepared
and DFT was measured. The experiment was performed using Taber 5130 abraser
with the abrasive wheel CS-17. To perform the experiment, the panel was first
weighted and then mounted on the horizontal turnable platform. The surface was
abraded by rotating the panel under 1 kg load abrasive wheels for 500 cycles. The
platform rotated at a speed of 1 cycle per second. After exposure, the panels were
gently brushed to remove any residual dust and abradings and then weighted.
Afterwards, the panel was put back in the platform for further 500 cycles of abrasion.
3.5.3.6 Other relevant characterization methods
Another coating parameter of interest is the relaxation time. As discussed by Conn
[9], repeated impacts can accumulate stresses in a coating until it fails. If the
relaxation time of the coating is short, relative to the time between two successive
impacts, the coating may be able to regain its impact absorption capability (resilience)
between two impacts and show good performance as a blade coating. On the other
hand, if the relaxation time is too long, stresses can accumulate and failures occur.
The pertinent relaxation times during rain erosion are of the order of 1-3 μs [9], which
are very difficult to measure. Conn [9] has done investigations with relaxation times
of about 100 μs.
3.6 Results and Discussion
A series of experiments was conducted using the water jet setup. Two blade coatings,
termed A and B, were selected for the investigation. The results are summarized in
Table 3.1. An experimentation time of 66 hours with 22 sample positions on the
79

70
moving wheel, corresponds to three hours of exposure per sample in the whirling arm
rig [1].
Table 3.1 Overview of process parameters and results for experiments in water jet erosion rig. The result “Coating B > Coating A” means that the performance of coating B was better than that of coating A. Three replicates were used in each of the experiments (1-4). The results under damage description were the same for all samples in each experiment. Experiments 1-6 were all conducted with a nozzle diameter of 0.84 mm, a discrete straight jet, and a jet velocity of 167 m/s (150 bar).
Experiment No.
Purpose of experiment
Coatedpanelshape
Com-parison withexp. no.
Diskgap size (mm)
Diskrotation(rpm)
Wheelrotation(rpm)
Nozzle-coatingdistance(mm)
Airblowing
Exp. time (hrs)
Damage description
Result(ranking)
1 Effect of watercushioning
Flat 5 1.0 840 4 100 Yes 132 Coating B startedpitting in 58 hrs Coating A no damage in 66 hrs
Coating A Coating B
2 Effect of watercushioning
Flat 5 1.0 840 4 100 Yes 132 No erosion for both samples
Coating A =Coating B
3 Effect of sample shape
Curved 4 10.0 420 4.5 100 Yes 10 Coating A eroded in 30 mins, Coating B eroded in 10 hours
Coating B Coating A
4 Effect of impact distance
Flat 6 10.0 420 4.5 50 Yes 16 Coating A eroded in 20 mins, Coating B eroded in 16 hours
Coating B Coating A
5 Data from [1]
Flat - 1.0 840 4 100 No 66 Coating A startedpitting in 25 hrs Coating B no damage in 66 hrs
Coating B Coating A
6 Data from [1]
Flat - 10 420 4.5 100 No 3 Coating A startedpitting in 1/3 hrs Coating B no damage in 3 hrs
Coating B Coating A
3.6.1 Effects of water cushioning
As discussed in section 3.3, when using a continuous or discrete water jet to impact
coated panels, the potential presence of a thin water film on the coating surface may
influence the results. The water film is formed when the preceding water jet slug
80
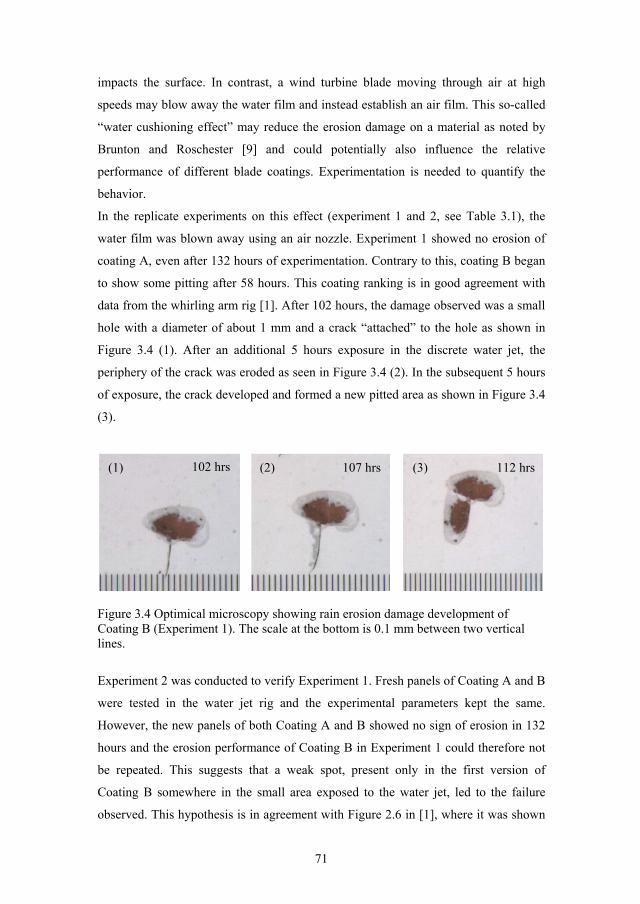
71
impacts the surface. In contrast, a wind turbine blade moving through air at high
speeds may blow away the water film and instead establish an air film. This so-called
“water cushioning effect” may reduce the erosion damage on a material as noted by
Brunton and Roschester [9] and could potentially also influence the relative
performance of different blade coatings. Experimentation is needed to quantify the
behavior.
In the replicate experiments on this effect (experiment 1 and 2, see Table 3.1), the
water film was blown away using an air nozzle. Experiment 1 showed no erosion of
coating A, even after 132 hours of experimentation. Contrary to this, coating B began
to show some pitting after 58 hours. This coating ranking is in good agreement with
data from the whirling arm rig [1]. After 102 hours, the damage observed was a small
hole with a diameter of about 1 mm and a crack “attached” to the hole as shown in
Figure 3.4 (1). After an additional 5 hours exposure in the discrete water jet, the
periphery of the crack was eroded as seen in Figure 3.4 (2). In the subsequent 5 hours
of exposure, the crack developed and formed a new pitted area as shown in Figure 3.4
(3).
Figure 3.4 Optimical microscopy showing rain erosion damage development of Coating B (Experiment 1). The scale at the bottom is 0.1 mm between two vertical lines.
Experiment 2 was conducted to verify Experiment 1. Fresh panels of Coating A and B
were tested in the water jet rig and the experimental parameters kept the same.
However, the new panels of both Coating A and B showed no sign of erosion in 132
hours and the erosion performance of Coating B in Experiment 1 could therefore not
be repeated. This suggests that a weak spot, present only in the first version of
Coating B somewhere in the small area exposed to the water jet, led to the failure
observed. This hypothesis is in agreement with Figure 2.6 in [1], where it was shown
102 hrs 107 hrs 112 hrs(1) (2) (3)
81

72
(for coating A) that cracking initiates from defects already present in the non-exposed
coating. In summary, damages may develop from an existing imperfection or from a
damage induced by cumulative fatigue under continuous impacts.
A previous experiment from [1] (included as Experiment 5 in Table 3.1), using the
same process parameters as in Experiment 1 and 2, but in the absence of any air blow
showed erosion of coating A in 25 hours). Since no erosion of coating A appeared in
Experiment 1 and 2 in the present work (even after 132 hours of exposure), the air
blow has an effect, at least for coating A. Apparently, water cushioning accelerates
erosion, but the actual mechanism cannot be deduced from the present limited data
set. This observation is rather surprising in light of the discussion in section 3.3 where
it was mentioned that other researchers have seen the opposite effect for water drop
erosion on steam turbine blades. However, this may be attributed to the physical
conditions. Brunton and Roschester [9] used rotating blades and radial flow, whereas
the setup of this work is based on jet slugs on slowly moving panels. It is
recommended to use the air nozzle in water jet experiments because this situation is
closer to both whirling arm and real blade coating exposure.
3.6.2 Effect of sample curvature
The effect of substrate curvature was evaluated using curved panels as shown
schematically in Figure 3.2. Experiment 3 in Table 3.1 was conducted to evaluate the
curvature effect. Note that the disk gap size in this case is higher than in Experiment 1
and 2, corresponding to longer and heavier jet slugs and thereby a more aggressive
exposure. For comparasion with Experiment 3, Experiment 4 with a flat panel should
be considered. Note that the nozzle-coating distance is not the same in Experiment 3
and 4 (100 and 50 mm, respectively), but as shown in a later section, the erosion
results are the same for those two (small) nozzle-coating distances. In both
Experiment 3 and 4, air blowing was included.
For Experiment 4, using flat steel substrates, coating A eroded in 20 min, whereas
coating B eroded in 16 hours. Experiment 3, using curved steel substrates, gave
similar results with erosion of coating A after 30 min and erosion of coating B after
10 hours. For Experiment 3, the erosion of Coating A (three replicates) initiated in the
middle of the convex surface where the water jet impacts the panel from a
perpendicular direction (see the setup in Figure 3.2). The failure type in the three
identical Coating A samples are small pits as shown in Figure 3.5, and the damage
82

73
repeatable. In summary, Coating B is superior to coating A with respect to erosion
and substrate curvature does not change this ranking. The ranking obtained is not in
agreement with results from the whirling arm rig (for details of those results see [1])
and the mechanisms of erosion must therefore be of a different nature for the two
coatings considered in the erosion experiments.
Figure 3.5 Digital camera photos of water jet erosion damage of Coating A when using curved panels (Experiment 3). Photos were taken after 30 minutes of experimentation. (1)-(3) refer to repititions. The scale at the bottom is 1 mm between two vertical lines. In photo (1), the red underlying primer is visible in the large pit and the damage has penetrated the blade coating.
3.6.3 Effect of impact distance
The distance from the water jet inlet (nozzle) to the coating surface is another process
parameter of interest. It is expected that reducing this distance may increase the rate of
erosion significantly because air friction slows down the water jet slugs. The distance
was decreased from 10 to 5 cm in the presence of air blowing (other conditions are
shown in Table 3.1, Experiment 4). It was found that Coating A started pitting in 20
minutes (see Figure 3.6), whereas Coating B showed no sign of erosion for the first 16
hours.
(1) (2) (3)
83

74
Figure 3.6 Optical microscopy of water jet erosion failure of Coating A applied on flat steel panels and using a water nozzle-coating distance of only 5 cm (Experiment 4).
The time and type of failure and the performance ranking are consistent with the
experiments conducted at an impact distance of 10 cm presented in our earlier work
[1]. The explanation for this result is probably that both 5 and 10 cm impact distance
is very short. Increasing to distances higher than 10 cm will, at some critical distance,
result in less or no erosion, but that is not of vital interest for this work and it was not
investigated further.
3.6.4 Characterization of coatings
To enable a scientific understanding of the erosion behaviours of the different
coatings, various mechanical experiments were conducted to characterize the
coatings. All three coatings are polyurethane-based top coats and contain pigments.
When evaluated in the whirling arm rig, the ranking was (best performing coating
first): Coating A > Coating B > Coating C. It is not known if these whirling arm data
correlate with natural (real life) data, but it is an underlying assumption. Due to the
very long constants of natural exposure, it has not been possible to test that
assumption in this work.
3.6.4.1 Stress-strain behavior of blade coatings
84

75
Table 3.2 Average (10 replicates) stress-strain data for Coating A and B. Strain is defined as the ratio of the change in length of the sample to its original length.
n =10 Coating
Samples
Strain at Fmax
(mm)
Strain at break
(%)
Ultimate tensile
Strength (MPa)
Young’s
Modulus
(N/mm2=MPa)
Coating A 96.49±7.07 96.49±7.07 7.13±1.32 12.19±1.95
Coating B 75.18±4.76 75.18±4.76 9.52±0.78 17.93±0.48
The average tensile strength experimental data of 10 replicate samples of Coating A
and B are shown in Table 3.2. For both coatings, it can be observed that the maximum
strain and strain at break are the same. The fracture happened at the maximum strain
value.
Coating A has a strain value of 96.49 %, which is higher than that of Coating B,
measured to 75.18 %. This means that Coating A has a better ability to resist shape
changes without crack formation. Coating B is found to be less elastic than Coating A
as evidenced by the Young’s modulus values, though the difference is not large. By
comparing the ultimate tensile strength, it can be found that less force is needed for
Coating A to fracture. Young’s modulus at ambient temperature for an epoxy
adhesive is about 2461 MPa [10] and that of rubber is 10-100 MPa [11]. In
comparison, the blade coatings have a Young’s modulus similar to rubber. In the
whirling arm rig, Coating A has better erosion resistance than Coating B.
3.6.4.2 Mandrel bending experiment (flexibility)
Blade coatings must have a certain degree of flexibility. This can be of relevance for
droplet impacts, but also during start up and shut downs of the wind turbine where the
blades are somewhat displaced from their equilibrium position. Strong winds may
also displace the blades. The mandrel experiment can help estimating how resistant a
coating is to cracking and detachment from the substrate. The average DFT of
Coating A, B, and C was 243, 209, and 151 μm, respectively. Coating A and B
showed no cracking or detachment at all. Coating C, however, showed cracking at
scale 2 as shown in Figure 3.7. The elongation at break was found to be 8.1%. In
summary, Coating C exhibited least cracking resistance compared with Coating A and
B and a similar performance ranking was found in the rain erosion experiment
85
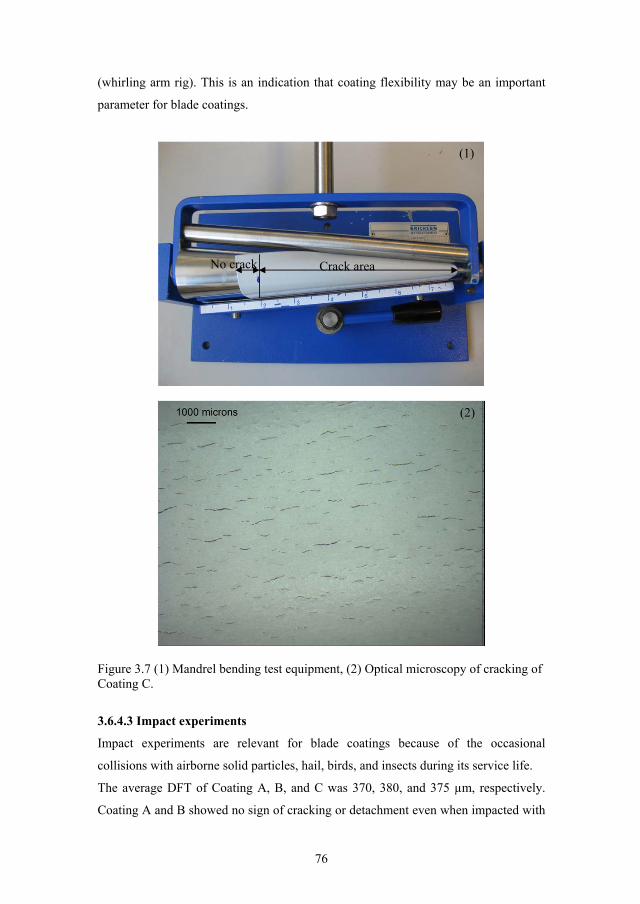
76
(whirling arm rig). This is an indication that coating flexibility may be an important
parameter for blade coatings.
Figure 3.7 (1) Mandrel bending test equipment, (2) Optical microscopy of cracking of Coating C.
3.6.4.3 Impact experiments
Impact experiments are relevant for blade coatings because of the occasional
collisions with airborne solid particles, hail, birds, and insects during its service life.
The average DFT of Coating A, B, and C was 370, 380, and 375 μm, respectively.
Coating A and B showed no sign of cracking or detachment even when impacted with
Crack areaNo crack
(1)
(2)
86

77
the maximum energy of 14.5 J. Coating C, however, detached from the substrate at an
impact energy of only 2.6 J. Photos of the performance of the three coatings are
shown in Figure 3.8. The ranking of impact resistance is Coating B = Coating A >
Coating C. This suggests that Coating A and B both limit the chance of impact
induced failures such as cracking and detachment, which can give weak spots for
further erosion by rain droplets.
Figure 3.8 Digital camera photos of impact damages of the three non-exposed blade coatings. The scale at the bottom is 1 mm between two vertical lines.
3.6.4.4 Pendulum hardness test
Another parameter of interest is the hardness of the blade coatings. It is generally
believed that blade coatings should not be too hard because the ability to absorb rain
droplet energy (resiliency) will then be compromised. Here, the pendulum hardness is
investigated over time. In Figure 3.9, the change in surface hardness, expressed as
oscillation times versus time, is shown.
Coating A Coating B Coating C
87

78
Figure 3.9 Measurements of pendulum hardness for the three blade coatings over time.
The average DFT of Coating A, B, and C was 290, 270, and 240 μm, respectively.
The experiment ran over 91 days. Initially, it was found that Coating A and B had
very similar pendulum hardness while Coating C had a softer surface to begin with.
However, the hardness of both Coating A and B declined fast in the first about 20
days to reach a more or less constant value, while the Coating C hardness increased
rapidly and after about 25 days exceeded the hardness of both Coating A and B.
Coating C also reached a more or less constant value after about 25 days. The
behavior observed could be due to residual solvent contents of the coatings [12],
which may be released during the first 20-30 days. The steady state values show that
Coating C has the highest hardness value followed by Coating A and finally Coating
B. This ranking is in agreement (softer is better) with the water jet erosion ranking
(only Coating A and B were investigated). However, it is not in agreement with the
whirling arm ranking, where coating A did best, so it is not possible to reach a
conclusion on any correlation between pendulum hardness and rain erosion resistance.
88

79
3.6.4.5 Taber abrasion experiments
Abrasion resistance is a relevant parameter to explore because blade coatings may not
only crack and delaminate during rain erosion, but also simply suffer from a steady
thickness reduction over time. Results are shown in Figure 3.10, and it can be seen
that Coating A has better abrasion resistance than Coating B (about 10 times higher
after 1000 cycles) even though the absolute values in both cases is rather small.
Coating C, on the other hand, has a much higher weight loss (about 13 times higher
than that of Coating B). This ranking of abrasion resistance, Coating A Coating B
Coating C, is in perfect agreement with the whirling arm rain erosion results. It
would be interesting (but expensive) to explore this correlation on a much larger data
set.
Figure 3.10 Weight loss data for the three blade coatings when exposed to abrasion cycles.
3.7 Conclusions
A series of experimental investigations with a new water jet erosion rig has been
performed. In particular, the effects on coating erosion of water cushioning, substrate
curvature, and water nozzle-coating distance were investigated. The main results are:
1) Water cushioning can be of importance at not too aggressive conditions and it
is recommended to include air blowing when using water jet slugs to simulate
rain erosion.
89

80
2) Substrate curvature does not influence erosion rate and flat panels, which are
easier to handle during practical preparations, can be used.
3) The water nozzle-coating distance (< 100 mm) does not affect the erosion rate.
Several mechanical experiments to characterize blade coatings were also conducted.
Abrasion resistance appears to be an interesting property to correlate with rain erosion
data. The ranking of coatings from this particular test method was in agreement with
the ranking based on rain erosion rate data from the whirling arm rig.
Results of this work, with more pertinent parameters explored, confirm the conclusion
from the previous investigation that a direct correlation of data from discrete water jet
experiments with those obtained in the whirling arm is not possible (at least not for
the coatings of this work). The mechanism of impact and the associated energy
absorption appear to be too different in the two setups. The recommendation is
therefore that continuous or discrete water jets can be used for a fast initial and crude
screening of ideas for new formulations (e.g. a new pigment, binder or filler material),
but for actual rankings of different binders or formulations, close to
commercialization of a product, the whirling arm or similar rigs should be used.
3.8 Acknowledgements
Financial support by The Hempel Foundation and Hempel A/S is gratefully
acknowledged. The authors wish to thank Alicia Gutierrez and Jeanne Larsen from
Hempel A/S for assisting with the characterization experiments.
90

81
Nomenclature the gap size of slots in the disk (m) disk rotation frequency (Hz=s-1)
wheel rotation frequency (Hz=s-1) the maximum force applied during the tensile test
number of tested panels, n=10 standard deviation
water jet velocity (m/s) average value of 10 samples in table 3.2, various units
Subscripts disk for chopping jets
wheel for holding sample panels
91

82
References for chapter 3
[1] S.Z. Zhang, K. Dam-Johansen, S. Nørkjær, P.L. Bernad Jr., S. Kiil, Erosion of wind turbine blade coatings – Design and analysis of jet-based laboratory equipment for performance evaluation, submitted to Prog. Org. Coat. , April 2014.
[2] D. Cripps, The future of blade repair, Reinforced Plastics. 55 (2011) 28-32.
[3] G. Marsh, Meeting the challenge of wind turbine blade repair, Reinforced Plastics. 55 (2011) 32-36.
[4] J.G. McGowan, R.W. Hyers, K.L. Sullivan, J.F. Manwell, S.V. Nair, B. McNiff, B.C. Syrett, A review of materials degradation in utility scale wind turbines, Energy Materials. 2 (2007) 41-46.
[5] M. Grundwürmer, O. Nuyken, M. Meyer, J. Wehr, N. Schupp, Sol–gel derived erosion protection coatings against damage caused by liquid impact, Wear. 263 (2007) 318-329.
[6] M. Lesser, The impact of a compressible liquid, in: M. Rein (Ed.), CISM Courses and Lectures, Springer-Verlag Wien, Vienna; Sachsenplatz 4-6, A-1201 Vienna, Austria, 2002, 39-102.
[7] J. Zahavi, S. Nadiv, G.F. Schmitt Jr., Indirect damage in composite materials due to raindrop impact, Wear. 72 (1981) 305-313.
[8] O. Gohardani, Impact of erosion testing aspects on current and future flight conditions, Prog. Aerospace Sci. 47 (2011) 280-303.
[9] J.H. Brunton, M.C. Rochester, Erosion of solid surfaces by the impact of liquid drops, in: C.M. Preece (Ed.), Treatise on materials science and technology, Academic press, New York, 1979, 186-248.
[10] H. Cease, P.F. Derwent, H.T. Diehl, J. Fast, D. Finley, Measurement of mechanical properties of three epoxy adhesives at cryogenic temperatures for CCD construction, Fermi National Accelerator Laboratory. Fermilab-TM-2366-A (2006) 1-19.
[11] Modulus of elasticity - Young's Modulus for some common materials, http://www. engineeringtoolbox. com/young-modulus-d_417. html. (Accessed 15.07.2014).
[12] S. Kiil, Quantification of simultaneous solvent evaporation and chemical curing in thermoset coatings, Journal of Coatings Technology and Research. 7 (2010) 569-586.
92
83
Conclusions
The wind power industry has grown fast during the last decade and the future
development is expected to bring very large towers and blades to the market. In this
thesis, it has been discussed how rain droplets can damage wind turbine blades and it
was emphasized that blade coatings can prolong the blade life time by reducing
erosion rates.
As with most coating systems, accelerated testing of novel blade coating formulations
is an essential requirement. Preferably, testing times should be measured in hours or
days as opposed to a service life time of about 20 years. In addition, experimentation
costs should not be prohibitive. It has been the aim of the present work to explore the
possibilities of designing a novel laboratory setup for blade coating investigations. A
discrete water jet principle was chosen and commercial polyurethane-based blade
coatings selected for the experiments. Comparison of results with erosion data from
the industrial standard, the whirling arm rig, has been part of the research.
The new experimental rig, which uses discrete water jets, is capable of fast screening
of up to 22 coating samples simultaneously. A mathematical model was developed to
“match” the water hammer pressure and the impact frequency with those of the
whirling arm rig. The water jet velocity was found to be the most important parameter
for initiation of erosion. Impact frequency, though of less importance, also played a
role. However, a simultaneous match of impact velocity and impact frequency did not
produce similar coating rankings in the two setups.
Further investigations were conducted on the effects of water cushioning (presence of
water film on the coating), substrate curvature, and water nozzle-coating distance. It
was found that water cushioning, in some cases, is important and it is recommended
to include air blowing (to remove the water film) when using water jet slugs to
simulate rain erosion. However, the ranking of coating erosion performance is not a
function of water cushioning. Substrate curvature and the water nozzle-coating
distance (< 10 cm) did not influence results significantly.
The lack of correlation between the two setups may be attributed to the different
erosion modes. The underlying mechanisms of rain erosion are apparently
93

84
substantially different in a setup based on impacting water jet slugs and a setup where
a rotor arm impacts falling water droplets. Our recommendation is therefore that
continuous or discrete water jets can be used for a fast initial and crude screening of
ideas for new formulations, but for actual rankings of different binders or
formulations, close to commercialization of a product, the whirling arm or similar rigs
should be used.
It was found that original defects in the coating and/or the induced small
imperfections caused by cumulative fatigue, due to repeated impacts, may act as
initiation points and lead to subsequent coating failure during exposure.
Several mechanical measurements to characterize selected blade coatings, including
tensile strength, flexibility, impact, hardness, and abrasion experiments, were
conducted. Abrasion resistance was found to be an interesting property to correlate
with rain erosion data, whereas the other properties investigated did not show any
correlation.
Future work
A number of issues are still open and would benefit from further research. These are:
1. A detailed investigation of the whirling arm rig with an emphasis on
correlation between laboratory and natural exposure (i.e. full-scale wind
turbines). An assumption of this work is that such a correlation exists, but this
has not been explored. The investigation is very time-consuming, but over
time, data from natural exposure should start to appear, hopefully also in the
open literature.
2. Effects of substrate material on rain erosion of blade coatings would be useful
to explore. In this work, steel substrates only, which are actually not the most
realistic substrate, have been used. Other composite materials should be
investigated.
3. High speed camera can be used to record the erosion process, characterize the
water jet size and impact velocity. However, the high level humidity in the
chamber will be an issue.
94

85
4. Other contacting modes could be investigated in the search for a correlation.
Scaling down the whirling arm to laboratory-size equipment is probably not
realistic due to issues of turbulence and the required amount of droplet
generation.
5. Microscopic photos can be taken on whirling arm samples to compare the
erosion failure with the one in water jet rig.
95

A
Appendix A Detailed instructions for using the water jet erosion equipment
This water jet based erosion equipment was designed and constructed in the
Department of Chemical and Biochemical Engineering, the Technical University of
Denmark. Depending on the nozzle size, the rig can create water discrete and
continuous jets with speed up to 200 m/s, and 22 panels can be tested simultaneously.
Figure 1 Schematic illustration (vertical cross-sectional view) of water jet erosion rig, including the disk, which ensures discrete water jets. The water recirculation tank holds about 50 liters of water.
To operate the equipment, the following steps should be followed:
1. Check the filter.
2. Connect the electricity supply.
3. Choose the right nozzle and disk; Open the lid of the erosion chamber, screw them
in place.
4. Screw the sample panels in the wheel (panel dimension 70 150 mm), switch on
the wheel rotation in the control box to rotate the wheel if more panels have to be
fixed, close the lid.
5. Connect the water tank with tap water supply and fill the tank with 50 L water.
6. Switch on water pump circulation to keep the water temperature at about 25 .
7. Switch on the wheel and disk rotation at your wanted speeds, and turn on the air
supply for the air nozzle and adjust it to your wanted pressure.
96

B
8. Switch on the high pressure pump, the pressure will be shown on the pressure
gauge, regulate the by-pass unload valve to adjust the pressure to your
expectation. A stop watch should be started at the same time to record the elapsed
time.
9. To stop the experiment, switch off the water pump first, and then turn off the air
pressure, wheel and disk rotation. Switch off the circulation pump.
10. Open the lid to observe the panels, or take off the panels.
11. Disconnect the electricity supply and drain off the water in tank.
97

Centre of Combustion and Harmful Emission Control
Department of Chemical and
Biochemical Engineering
Technical University of Denmark
Søltofts Plads, Building 229
DK-2800 Kgs. Lyngby
Denmark
Phone: +45 4525 2800
Fax: +45 4525 4588
Web: www.chec.kt.dtu.dk
ISBN : 978-87-93054-49-3


![Waterborne Epoxy Based Coating Materials · friendly coatings like powder coatings, solventless coatings, UV curable coatings and waterborne coatings [6]. The first step in this process](https://img.pdfslide.us/doc/110x75/600912c2a8aea319421a2c7d/waterborne-epoxy-based-coating-materials-friendly-coatings-like-powder-coatings.jpg)