Embed Size (px)
Citation preview

A NATIONAL MEASUREMENT
GOOD PRACTICE GUIDE
No. 103
Accelerated Environmental Ageing of Polymeric Materials

Measurement Good Practice Guide No. 103
Accelerated Environmental Ageing of Polymeric Materials
W R Broughton and A S Maxwell Industry and Innovation Division
National Physical Laboratory ABSTRACT Whilst the life expectancy of products in non-demanding applications have traditionally been predicted from previous in-service experience (i.e. service conditions considered identical to those of which data already exists), long-term or critical applications require the use of accelerated ageing regimes to generate data commensurate with the engineering requirements and life expectancy of the component. This Good Practice Guide is intended to give guidance on accelerated ageing and performance testing of polymeric materials for generating design data and for quality assurance purposes. The document is primarily concerned with polymers (thermosets and thermoplastics) and fibre-reinforced plastics, and considers a range of hostile environments including artificial weathering, hot/wet and chemical (inc. solvents, caustic and acidic solutions) exposure.

© Crown Copyright 2007 Reproduced by permission of the Controller of HMSO
ISSN 1368-6550
March 2007
National Physical Laboratory Teddington, Middlesex, United Kingdom, TW11 0LW


Contents Introduction and Scope 1 Ageing Mechanisms In Polymeric Materials 3
2.1 Introduction ............................................................................................................... 4 2.2 Temperature .............................................................................................................. 5 2.3 Moisture .................................................................................................................... 5 2.4 Natural Weathering ................................................................................................... 9 2.5 Ionising Radiation ................................................................................................... 10 2.6 Chemical Degradation............................................................................................. 10 2.7 Biological Degradation ........................................................................................... 13 2.8 Environmental Stress Cracking (ESC).................................................................... 13 2.9 Stress Corrosion of Fibres ....................................................................................... 14
Environmental Conditioning and Testing 15
3.1 Introduction ............................................................................................................. 16 3.2 Temperature ............................................................................................................ 16 3.3 Moisture Conditioning and Testing......................................................................... 18 3.4 Fickian Diffusion..................................................................................................... 22 3.5 Measurement of Moisture Expansion Coefficient .................................................. 26 3.6 Mechanical Testing of Conditioned Specimens...................................................... 27 3.7 Fibre Bundles and Impregnated Strands ................................................................. 28 3.8 Design and Planning an Accelerated Test Programme ........................................... 29
Stress Rupture 31
4.1 Introduction ............................................................................................................. 32 4.2 Static Fatigue........................................................................................................... 32
Environmental Stress Cracking (ESC) of Plastics 36
5.1 Introduction ............................................................................................................. 37 5.2 Bent Strip Tests ....................................................................................................... 37 5.3 Bent Strip for Flexible Materials............................................................................. 38 5.4 Ball and Pin Impression .......................................................................................... 38 5.5 Constant Tensile Deformation ................................................................................ 39 5.6 Slow Strain Rate Testing......................................................................................... 39 5.7 Constant Load Tests ................................................................................................ 40 5.8 C-Ring Tests............................................................................................................ 43 5.9 Strain Hardening Tests ............................................................................................ 43
Accelerated Weathering 45
6.1 Introduction ............................................................................................................. 46 6.2 Artificial Weathering Apparatus ............................................................................. 46 6.3 Accelerated Weathering Test Procedures ............................................................... 50 6.4 Performance Testing ............................................................................................... 50

Accelerated Testing in Aqueous and Chemical Environments 58 7.1 Introduction .............................................................................................................. 59 7.2 Test Methods and Standards ................................................................................... 59 7.3 Environmental Testing ............................................................................................ 62 7.4 Design and Selection Considerations...................................................................... 65 7.5 Test Data Analysis .................................................................................................. 65
Handling, Storage and Documentation 67
8.1 Handling and Storage of Materials and Chemicals ................................................. 68 8.2 Handling and Storage of Adhesives, Resins and Prepreg ....................................... 68 8.3 Handling and Storage of Adherends ....................................................................... 70 8.4 Handling, Storage and Disposal of Chemicals........................................................ 70 8.5 Documentation (Record Keeping) .......................................................................... 71
Standards and Contacts 72 References 82 Acknowledgements & Contact Details 88

List of Tables Table 1 Moisture Content and Glass Transition Temperature (Tg)......................................... 52 Table 2 Gloss Measurements for Artificially Weathered Glass/Polyester.............................. 53 Table 3 Four-Point Flexure Results of Artificially Weathered GRP ...................................... 55 Table 4 Criteria for Chemical Resistance ............................................................................... 61 Table 5 Determination of Partial Design Factor, A2 .............................................................. 62
List of Figures Figure 1 Glass transition temperature of F922 epoxy as a function of moisture content ......... 7 Figure 2 Schematic of the osmotic process – leading to delaminations/blistering ................... 7 Figure 3 Osmotic blistering of a boat hull................................................................................. 8 Figure 4 Chlorine degradation (left) and HCl induced blistering (right) of a GRP pipe ........ 12 Figure 5 Crazing of PMMA .................................................................................................... 13 Figure 6 Fickian diffusion curve ............................................................................................. 22 Figure 7 Fickian curve fit to moisture absorption of an epoxy resin ...................................... 22 Figure 8 Transverse diffusivity versus temperature plot for T300/924 carbon/epoxy............ 24 Figure 9 Moisture absorption in continuous unidirectional T300/924 carbon/epoxy............. 25 Figure 10 Tensile stress-strain curves for different water immersion periods........................ 26 Figure 11 Composite rod specimen with adhesively bonded composite end tabs .................. 29 Figure 12 Tensile creep fixtures.............................................................................................. 32 Figure 13 Self-stressing flexure rig with specimens ............................................................... 34 Figure 14 Bent strip technique for flexible polymers ............................................................. 38 Figure 15 Stress relaxation curves obtained using progressively smaller levels of deformation (1 > 5) until consecutive curves superimpose on one another (4 and 5)................................. 39 Figure 16 Typical stress-strain plot showing the difference in stress/strain profile for material exposed in air and in the test medium..................................................................................... 40 Figure 17 Illustration of typical apparatus used for a constant load test................................. 41 Figure 18 Typical environmental cell used for the constant load test..................................... 41 Figure 19 Test specimens used in the full notch creep test ..................................................... 42 Figure 20 Time to failure of three grades of LLDPE full notch creep specimens .................. 42 Figure 21 C-ring test methods for assess ESC in pipe-sections.............................................. 43 Figure 22 True stress – draw ratio curves used to determine the relative ESC resistance of two polyethylene grades in the strain hardening technique ........................................................... 44 Figure 23 Spectrum of carbon-arc lamp (continuous line), carbon-arc lamp with a Cordex D filter (dashed) and noonday Chicago sunlight (dotted) [25] ................................................... 47 Figure 24 Xenon lamp spectrum (fine) compared with noonday Miami sunlight (bold) [25] 48 Figure 25 UV-A and UV-B fluorescent lamp spectra compared with standard noonday Miami sunlight [25] ............................................................................................................................ 48 Figure 26 Barcol hardness versus exposure time for artificially weathered GRP .................. 52 Figure 27 Gloss retention versus exposure time (60º angle measurements) ........................... 53 Figure 28 Colour change in glass/polyester due to artificial weathering................................ 54 Figure 29 Total reflectance of artificially weathered glass/polyester rods (normalised with respect to the “as-received” material) ..................................................................................... 54

Figure 30 Flexural strength versus exposure time .................................................................. 55 Figure 31 Flexural strength versus surface reflectance for weathered and “as-received” glass/polyester)........................................................................................................................ 56 Figure 32 Flexural strength versus Barcol hardness for weathered and “as-received” glass/polyester ......................................................................................................................... 57 Figure 33 FTIR spectra for 0, 3 and 6 months weathering of glass/polyester (courtesy of ElmerPerkin) ........................................................................................................................... 58 Figure 34 Strain corrosion test apparatus................................................................................ 62 Figure 35 Chemical tank with motorised stirrer...................................................................... 64

Glossary of Terms Accelerated ageing test: Short-term test designed to simulate the effects of longer-term service conditions. Adherend: Body that is or intended to be held to another body by an adhesive. Adherend failure: Failure of a joint in the body of the adherend. Adhesion (or adherence): State in which two surfaces are held together by interfacial bonds. Adhesive: Non-metallic substance capable of joining materials by surface bonding (adhesion), the bonding possessing adequate internal strength (cohesion). Adhesive failure: Failure of an adhesive bond, such that separation appears to be at the adhesive/adherend interface. Ageing: Entirety of all irreversible chemical and physical processes occurring in a material in the course of time. Amorphous: Non-crystalline, or devoid of crystalline structure. Amorphous regions: Regions within a polymeric material that, on the basis of X-ray diffraction or other suitable techniques, do not show any evidence of crystalline structure. Artificial weathering: Exposure to cyclic laboratory conditions involving changes in temperature, relative humidity and radiant energy, with or without direct water spray, in an attempt to produce changes in the material similar to those observed after long-term, continuous, outdoor exposure. ASTM: American Society for Testing and Materials. Blister: Elevation of the surface of varied contour and dimensions, with a cavity beneath. Bond: The union of materials by adhesives. Bond-line: The layer of adhesive, which attaches two adherends. Bond strength: The unit of load applied to tension, compression, flexure, peel, impact, cleavage, or shear, required to break an adhesive assembly with failure occurring in or near the plane of the bond. Breaking stress: Stress at the moment of rupture of a specimen. Brittle failure: Failure in which the fracture surface exhibits no permanent material deformation to the naked eye (e.g. stretching, elongation and necking down). BSI: British Standards Institute Bulk adhesive: The adhesive unaltered by the adherend. Cleavage: Mode of application of a force to a joint between rigid adherends, which is not uniform over the whole area, but results in a stress concentrated at one edge. Cohesion: The ability of the adhesive to resist splitting or rupture. Cohesive failure: Failure within the body of the adhesive (i.e. not at the interface). Composite: Solid product consisting of two or more distinct phases, including a binding material (matrix) and a particulate or fibrous material. Conditioning: A series of operations intended to bring a sample or specimen into a reference state with regard to temperature and humidity. Coupling agent: Substance (e.g. organosilane) that promotes or establishes stronger bond at the interface of the resin matrix and the reinforcement. Coupling size: Size designed to obtain a good bond between the fibre surface and surrounding resin matrix. Crack: Fissure that may or may not penetrate the external surface of the material or its entire thickness, the polymeric material being completely separated between the crack walls.

Craze: Defect at or under the surface of a plastic attributable to apparent cracks, bridged by polymeric material of reduced (apparent) density. Creep: The time-dependent increase in strain resulting from a sustained load. Crystallinity: Presence of three-dimensional order at the level of molecular dimensions. Cure: To set or harden by means of a chemical reaction. Cure time: Period of time required for an adhesive, an assembly or a polymeric composition to cure under specified conditions of temperature or pressure, or both. Cure temperature: Temperature at which an adhesive, an assembly or a polymeric composition achieves a state of cure. Degradation: Change in the chemical structure of a polymeric material involving a deleterious change in properties. Delamination: Separation of layers (i.e. planar defect) in a laminate because of failure in or near the adhesive joint. Deterioration: Permanent change in the physical properties of a material evident by impairment of these properties. Diffusivity: The proportionality constant that describes the ability of chemical species, such as a liquid, to diffuse through a solid. Diffusivity is generally temperature dependent. Dimensional stability: Consistency of dimensions of a material part or specimen under environmental conditions. Discolouration: Colour change that involves lightening or darkening and/or change in hue. Dry strength: Strength of a polymeric material part or specimen after drying under specified conditions. Ductile failure: Failure in which the fracture surface clearly exhibits permanent deformation with stretching, elongation and necking. Durability: The endurance of a material or structural strength relative to the required service conditions. Elastic limit: Greatest stress, which a material is capable of sustaining without any permanent strain remaining upon complete release of stress. Electromagnetic radiation/radiation: Wave motions of characteristic wavelength, including gamma radiation, X-rays, ultraviolet, visible light, infrared and radio waves. Elongation: Increase in length of a specimen under tension, usually expressed as a percentage of the original length. Embedding: Process of encasing completely an article, such as a sensor, in a polymeric material. EN: European Norm Environmental test: Test to assess the performance of an assembly under service conditions. Fibre: Unit of matter of relatively short length, characterised by a high ratio of length to thickness or diameter. Filler: Relatively inert material (e.g. talc) added to a plastic or resin to modify its strength, fire resistance or other qualities, or to lower costs. Fillet: Portion of an adhesive that bridges the adherends outside the bond-line. Glass transition: A reversible change in an amorphous polymer or in amorphous regions of a partially crystalline polymer from (or to) a viscous or rubbery condition to (or from) a hard and relatively brittle one. Glass (surface) veil: Thin layer made from glass filaments (continuous or chopped) held together with a binder. Gloss: Degree to which, a surface approaches perfect optical smoothness in its capacity to reflect light.

Hardness: Resistance of a material to indentation or scratching. Hygroscopic: Material capable of absorbing and retaining environmental moisture. Infrared (IR): The region of electromagnetic radiation of wavelengths from 800 nm to 1 mm. IR can be divided into near infrared (800 nm to 2500 nm), mid infrared (2500 nm to 25 μm) and far infrared (25 μm to 1 mm). ISO: International Standards Organisation. Laminate: Product made by bonding together two or more layers (plies) of material or materials. Lay-up: Assembly of layers of resin-impregnated material for processing. Ligament area: Cross-sectional area remaining after notching. Mat: Product made of filaments, staple fibres or strands, cut or uncut, oriented or not, held together in the form of a sheet. Peel: Mode of application of a force to a joint in which one or both of the adherends is flexible and which the stress is concentrated at a boundary. Permeability: Property of a material transmitting gases and liquids by passage through one surface and out at another surface by diffusion and sorption processes. Plastic deformation: That part of the strain in a stressed plastic, which remains after the applied stress has been removed. Plasticisation: Increase in softness, flexibility, and extensibility of an adhesive. Post-cure: Further treatment by time and/or temperature of an adhesive to obtain the required properties by curing. Porosity: A condition of trapped pockets of air, gas or vacuum within a solid material. Prepreg: Admixture of resins (with or without fillers), additives, and reinforcements in woven and filamentous form, ready for moulding. Primer: A coating applied to a surface, prior to the application of an adhesive, to improve the performance of the bond. Profile: Extruded or pultruded polymeric product, excluding film and sheet, having a characteristic constant axial section. Pultrusion: Process of making continuous lengths of reinforced plastic profiles with high unidirectional strength by pulling continuous strands of resin-impregnated rein-forcing material through a heated die and then through a heating chamber if necessary, to postcure the resin. Reinforced plastic: Polymer (plastic) with high-strength fibres embedded in the composition, resulting in some strength properties greatly superior to those of the base resin. Roving: Collection of parallel strands (assembled roving) or parallel filaments (direct roving) assembled without intentional twist. Semi-crystalline: Polymer containing crystalline and amorphous phases. Size (coupling size): Material applied to fibres or filaments during the course of their manufacture. Spectrophotometer: An instrument for measuring the transmittance or absorbance/optical density at different wavelengths. Strain: Unit change due to force in size of body relative to its original size. Stress-strain diagram (or curve): A diagram in which the corresponding values of stress and strain are plotted against each other. Stress: Force exerted per unit area at a point within a plane. Structural bond: A bond, which is capable of sustaining in a structure a specified strength level under a combination of stresses for a specified time.

Substrate: An adherend, a material upon which an adhesive is applied. Surface preparation (or treatment): Physical and/or chemical treatments applied to adherends to render them suitable or more suitable for adhesive bonding. Swelling: Increase in volume of a test specimen immersed in a liquid or exposed to a vapour. Thermoset: A resin that is substantially infusible and insoluble after being cured. Thermoplastic: A material that can be repeatedly softened by heating. Toughness: That property of a material by virtue of which it can absorb energy, generally implying absence of brittleness and relatively high elongation to break. Traveller: A test specimen used for example to measure moisture content as a result of conditioning. True stress: Stress calculated from the supporting area at the time of measurement rather than from the original area. Ultraviolet (UV): The region of the electromagnetic spectrum at shorter wavelengths than blue light, generally taken to be between 100 nm and 400 nm. Due to atmospheric absorption UV measurements can only be carried out below 190 nm in a vacuum environment. Viscoelasticity: Stress response of a material acting as though it were a combination of an elastic-solid and a viscous fluid with flow dependent on time, temperature, load and rate of loading. Visible light: The region of the electromagnetic spectrum that can be seen by the human eye, generally taken to be between 400 nm and 800 nm. Wavelength: The length of the waves associated with the electromagnetic radiation. Weathering: Effects of exposure of a material to outdoor conditions. Wet strength: Strength of a polymeric material determined immediately after removal from a liquid in which it has immersed under specified conditions. Wetting: A surface is considered completely wet by a liquid if the contact angle is zero, and incompletely wet if the contact angle has a finite value. Yield stress: The stress (either normal or shear) at which a marked increase in deformation occurs without an increase in load. Yield strain: The strain, below which a material acts in an elastic manner, and above which it begins to exhibit permanent deformation.


Introduction and Scope
11
2 Good Practice Guide 103 Chapter 1
1.1 Introduction Polymer and polymer composites are increasingly being used in a wide range of applications where long-term or critical applications require the use of accelerated ageing regimes to generate data commensurate with the engineering requirements and life expectancy of the component. As a consequence, there is growing demand for manufacturers to guarantee the life expectancy of their products, particularly where inspection can be difficult or failure catastrophic. Examples of such applications include gas pipelines, chemical storage tanks, underground cabling, aerospace components, personnel safety equipment and medical implants. Stringent product guarantees are also increasingly being demanded for engineering components in products such as cars and domestic appliances, where consumers often view extended lifetime warranties as a sign of product quality. Whilst the life expectancy of products in non-demanding applications have traditionally been predicted from past experience, the use of polymeric materials in long-term or critical applications requires a far better understanding of the failure mechanisms to enable lifetime predictions for these materials. 1.2 Scope This measurement guide aims to provide guidance to technologists, engineers and designers on accelerated ageing and performance testing of polymeric materials for generating design data and for quality assurance purposes. The document is primarily concerned with polymers (thermosets (including adhesives) and thermoplastics) and fibre-reinforced plastics (FRPs), and considers a range of hostile environments including artificial weathering, aqueous (liquid and vapour) and chemical (i.e. solvents, caustic and acidic solutions) exposure. Guidance is provided on static and creep rupture testing at ambient and non-ambient temperatures. The intention of the guide is to provide designers and users with sufficient information, which when coupled with their own expertise and a suitable accelerated test regime can be used to produce design data and enable screening of materials and manufacturing processes (e.g. adhesive/adherend surface treatments). The document provides guidance of the use of test methods that can be used to measure physical changes resulting from exposure to hostile environments, and techniques that can be used to relate laboratory testing to actual service conditions. If the intention is to generate design data, then the guide should be used in conjunction with the appropriate structural design codes and standards. The guide assumes some basic knowledge of the materials and mechanical engineering, and is not intended as a textbook or as a design protocol. There are a number of published works, which provide a comprehensive coverage of plastics, adhesives and composites technology, and testing and preliminary design [1-28]. Other NPL Measurement Good Practice Guides [29-36], provide advice on issues relating to the preparation and testing of plastics, adhesives and adhesive joints. The intention of the guide is to complement these published works. Relevant information on composites and adhesives can also be obtained from the MaterialsSolutions (http://www.materialssolutions.info/) and Adhesive Design Toolkit (http://www.adhesivestoolkit.com) websites. It is recommended that specialist advice be sought from manufacturers and suppliers on material selection, and use of associated technologies and health and safety requirements. Organisations that can provide specialist advice are listed at the back of the guide along with relevant standards and publications.

Ageing Mechanisms In Polymeric Materials
IN THIS CHAPTER
22
Temperature
Moisture
Natural Weathering
Ionising Radiation
Chemical Degradation
Biological Degradation
Environmental Stress Cracking

4 Good Practice Guide 103 Chapter 2
2.1 Introduction In order to determine the chemical resistance of different polymeric systems, processing variables and surface treatments, it may be necessary to expose a material or structure to various environmental and loading conditions that simulate actual service conditions. The resistance of the polymeric material to degradation agents often becomes apparent within a short period. In some circumstances, only a few hours of exposure may lead to catastrophic failure or seriously compromise structural integrity (see also Measurement Good Practice Guide Number 28 [30]). Irreversible property changes in polymeric materials can be induced by any number of degradation agents (see list below) acting alone or collectively. • Thermal - static heat ageing, sub-zero exposure or thermal cycling • Humidity (including hot/wet) exposures • Complete immersion in water at ambient and elevated temperatures • Freeze/thaw and dry/wet cyclic conditions • Continuous or intermittent saltwater immersion or spray • Weathering (including rain and sand erosion) • Combined load (i.e. stress) and environmental exposures • Chemical (including water, fuel, acids, alkalis, solvents and oxygen) • Ultraviolet (UV) and high-energy radiation • Electrical stress (e.g. lightning stress and galvanic reactions) • Micro-organisms (e.g. fungi) In many applications, engineering components/structures will be exposed to a combination of two or more factors, often resulting in complex synergistic degradation of the material. Accelerated degradation may be caused by the combined action of two or more vectors (e.g. temperature and humidity). The relative importance of each agent will depend on the agents present and their levels. Degradation from one agent can also reduce resistance to other agents, similar to biological systems. The predominant factors in climatic exposure are humidity, temperature and solar (ultraviolet) irradiation. The severity of these factors will depend on geographical location, and need to be taken into account when designing with these materials. Failure of a FRPs, insofar as it is no longer fit for purpose, may occur because of cumulative damage to the thermoset or thermoplastic matrix, interfacial separation between fibres and matrix, chemical attack of the fibre reinforcement or a combination of two or more of these processes. The net effect is loss of stiffness and mechanical integrity. It is recommended that when comparing the effects of material systems, surface treatments and processing variables on the durability of components in hostile environments, that all specimens are prepared and conditioned together to account for any variability in the conditioning environment. Also, control specimens are recommended to check changes in systems performance.

Chapter 2 Good Practice Guide 103 5
2.2 Temperature Prolonged, or even short-term, exposure to elevated temperatures will often produce irreversible chemical and physical changes within polymeric materials. Increased temperature accelerates most of the degradation processes that occur in polymeric materials, such as oxidation, chemical attack and mechanical creep. As the temperature increases, mechanical properties such as stiffness and strength tend to decrease. Oxidation is generally considered to be the most serious problem when using polymers at elevated temperatures with the rate of degradation increasing with the amount of oxygen present [22, 26]. In adhesively bonded joints, the primary path for oxygen diffusion is through the adhesive, which can be relatively rapid at elevated temperatures. Metallic adherends are impermeable to oxygen, thereby providing a barrier to the gas. In contrast, FRPs are permeable to atmospheric gases, and hence the rate of degradation can be expected to be higher. Elevated temperatures also depolymerise resins and degrade the fibre-matrix interface. The overall degradation process will often involve a relatively long induction period during which little degradation is observed [22-23]. At the end of this period, there is a rapid increase in degradation leading to a significant reduction in the mechanical properties of the polymer. This induction period is temperature sensitive and is reduced significantly at elevated temperatures. The induction period of the degradation process can normally be regarded as the serviceable lifetime of the polymer. Other physical changes can occur in polymers as a result of temperature, one of the most common being thermal expansion. Thermal expansion is a reversible process, provided no damage occurs as a result of the change in temperature. In FRPs, differences in thermal expansion between fibre and matrix can induce residual stresses, thereby reducing fibre-matrix bond efficiency and resulting in thermo-mechanical degradation during thermal cycling. Similar mechanisms may also occur in adhesive joints. A sudden brief exposure to high temperatures can result in a phenomenon known as thermal spiking, which can lead to excessive localised stresses with deleterious effects on structural performance. Exposure to low temperatures can result in embrittlement of plastics, fibre-matrix interfacial cracking in FRPs and debonding in adhesive joints. Rapid failure can occur in environmentally degraded polymeric materials at sub-zero temperatures, e.g. due to the formation of ice particles from absorbed water initiating internal fractures. Complete interfacial debonding may occur in multiple component systems exposed to cryogenic temperatures through, for example, the combined effects of differential thermal contraction and embrittlement. 2.3 Moisture Most polymeric materials will absorb small, but potentially damaging amounts of moisture from the surrounding environments with the degree of degradation that occurs often being linked directly with the amount of moisture absorbed. The absorbed water may adversely affect the material in a number of ways: • Dimensional changes (swelling) • Reduction in the glass transition temperature (Tg)
6 Good Practice Guide 103 Chapter 2
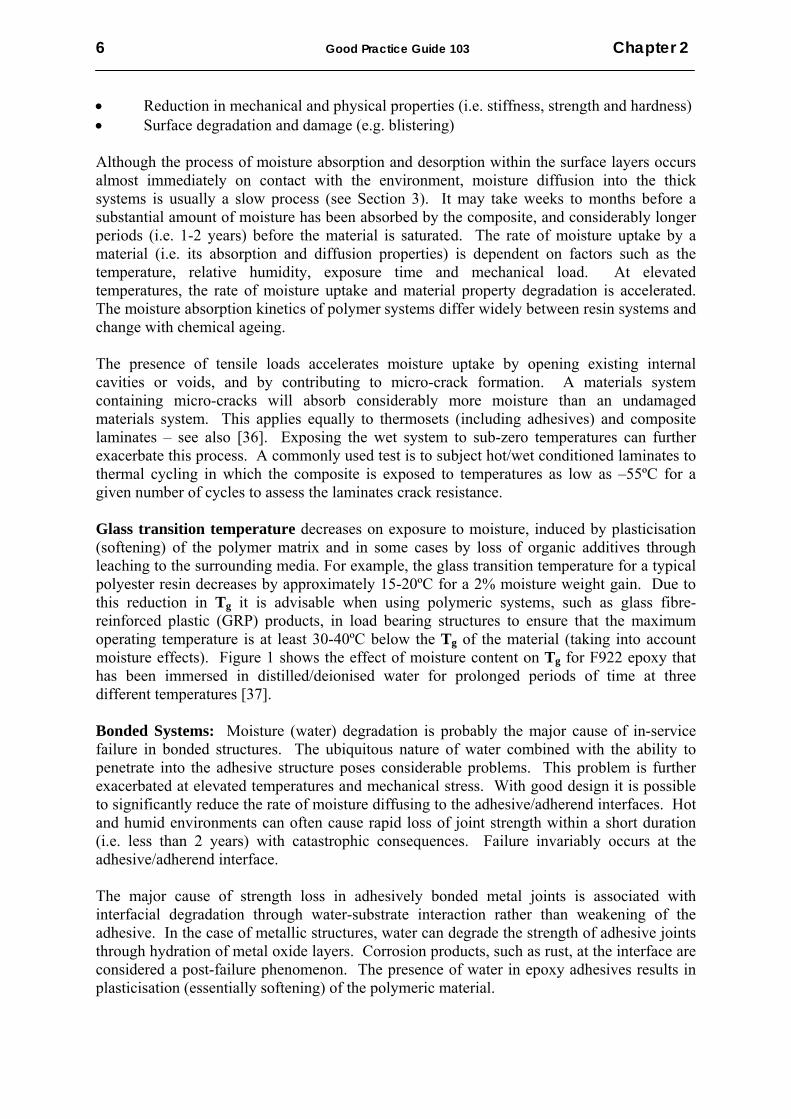
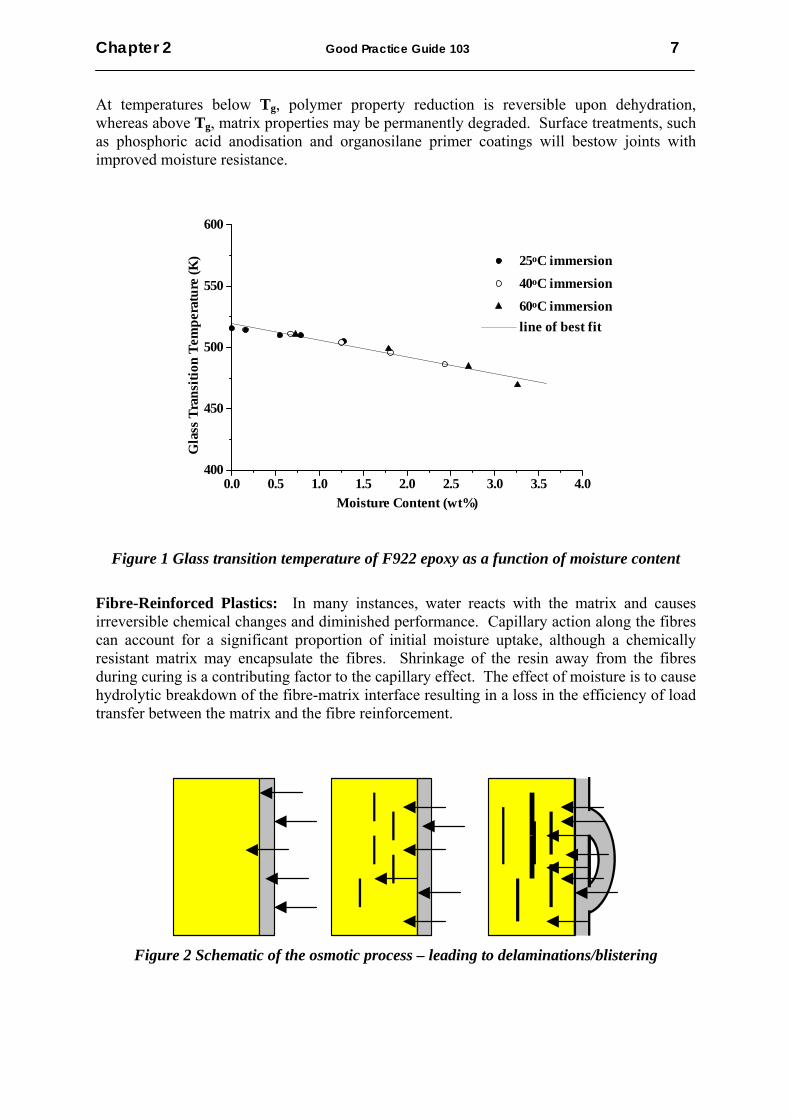
• Reduction in mechanical and physical properties (i.e. stiffness, strength and hardness) • Surface degradation and damage (e.g. blistering) Although the process of moisture absorption and desorption within the surface layers occurs almost immediately on contact with the environment, moisture diffusion into the thick systems is usually a slow process (see Section 3). It may take weeks to months before a substantial amount of moisture has been absorbed by the composite, and considerably longer periods (i.e. 1-2 years) before the material is saturated. The rate of moisture uptake by a material (i.e. its absorption and diffusion properties) is dependent on factors such as the temperature, relative humidity, exposure time and mechanical load. At elevated temperatures, the rate of moisture uptake and material property degradation is accelerated. The moisture absorption kinetics of polymer systems differ widely between resin systems and change with chemical ageing. The presence of tensile loads accelerates moisture uptake by opening existing internal cavities or voids, and by contributing to micro-crack formation. A materials system containing micro-cracks will absorb considerably more moisture than an undamaged materials system. This applies equally to thermosets (including adhesives) and composite laminates – see also [36]. Exposing the wet system to sub-zero temperatures can further exacerbate this process. A commonly used test is to subject hot/wet conditioned laminates to thermal cycling in which the composite is exposed to temperatures as low as –55ºC for a given number of cycles to assess the laminates crack resistance. Glass transition temperature decreases on exposure to moisture, induced by plasticisation (softening) of the polymer matrix and in some cases by loss of organic additives through leaching to the surrounding media. For example, the glass transition temperature for a typical polyester resin decreases by approximately 15-20ºC for a 2% moisture weight gain. Due to this reduction in Tg it is advisable when using polymeric systems, such as glass fibre-reinforced plastic (GRP) products, in load bearing structures to ensure that the maximum operating temperature is at least 30-40ºC below the Tg of the material (taking into account moisture effects). Figure 1 shows the effect of moisture content on Tg for F922 epoxy that has been immersed in distilled/deionised water for prolonged periods of time at three different temperatures [37]. Bonded Systems: Moisture (water) degradation is probably the major cause of in-service failure in bonded structures. The ubiquitous nature of water combined with the ability to penetrate into the adhesive structure poses considerable problems. This problem is further exacerbated at elevated temperatures and mechanical stress. With good design it is possible to significantly reduce the rate of moisture diffusing to the adhesive/adherend interfaces. Hot and humid environments can often cause rapid loss of joint strength within a short duration (i.e. less than 2 years) with catastrophic consequences. Failure invariably occurs at the adhesive/adherend interface. The major cause of strength loss in adhesively bonded metal joints is associated with interfacial degradation through water-substrate interaction rather than weakening of the adhesive. In the case of metallic structures, water can degrade the strength of adhesive joints through hydration of metal oxide layers. Corrosion products, such as rust, at the interface are considered a post-failure phenomenon. The presence of water in epoxy adhesives results in plasticisation (essentially softening) of the polymeric material.
Chapter 2 Good Practice Guide 103 7
At temperatures below Tg, polymer property reduction is reversible upon dehydration, whereas above Tg, matrix properties may be permanently degraded. Surface treatments, such as phosphoric acid anodisation and organosilane primer coatings will bestow joints with improved moisture resistance.
0.0 0.5 1.0 1.5 2.0 2.5 3.0 3.5 4.0400
450
500
550
600
25oC immersion
40oC immersion
60oC immersion line of best fit
Gla
ss T
rans
ition
Tem
pera
ture
(K)
Moisture Content (wt%)
Figure 1 Glass transition temperature of F922 epoxy as a function of moisture content
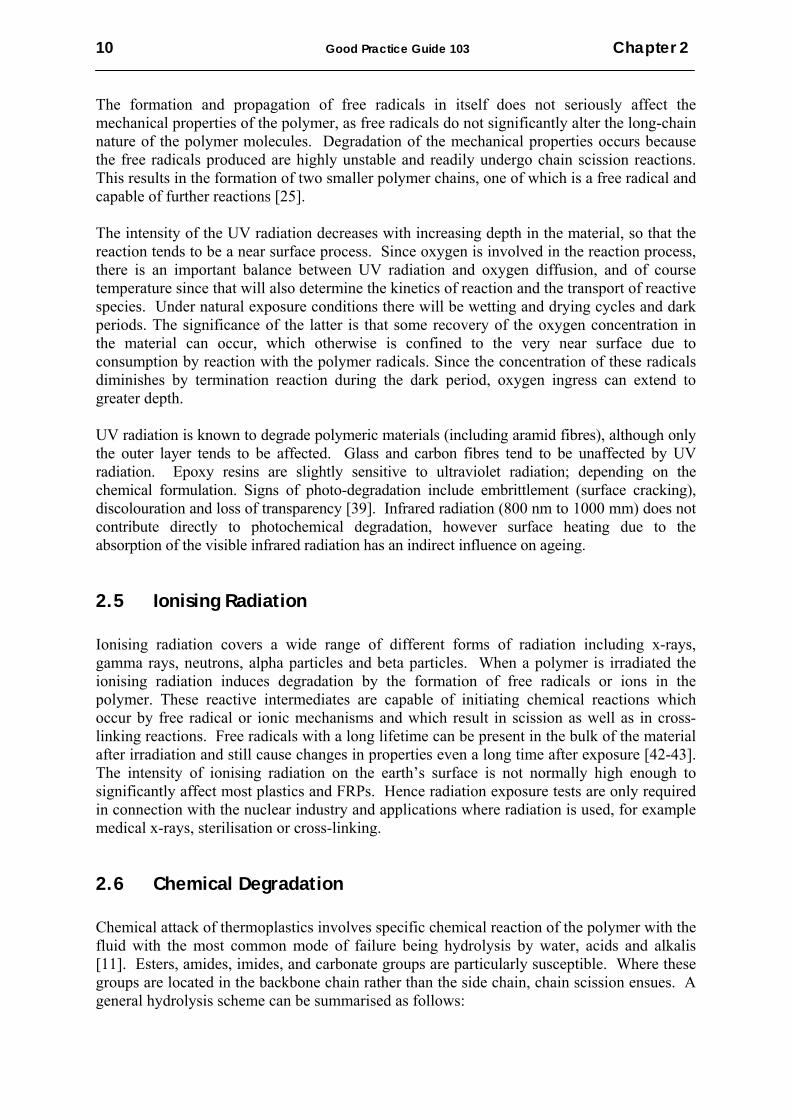
Fibre-Reinforced Plastics: In many instances, water reacts with the matrix and causes irreversible chemical changes and diminished performance. Capillary action along the fibres can account for a significant proportion of initial moisture uptake, although a chemically resistant matrix may encapsulate the fibres. Shrinkage of the resin away from the fibres during curing is a contributing factor to the capillary effect. The effect of moisture is to cause hydrolytic breakdown of the fibre-matrix interface resulting in a loss in the efficiency of load transfer between the matrix and the fibre reinforcement.
Figure 2 Schematic of the osmotic process – leading to delaminations/blistering

8 Good Practice Guide 103 Chapter 2
All laminates when exposed to marine environments will allow water vapour to permeate the structure. As the water diffuses into the composite it reacts with any hydrolysable components (e.g. ester groups) inside the laminate to form tiny cells of concentrated solution. Under this osmotic process [38-39] (see schematic in Figure 2), more water is drawn through the semi-permeable membrane of the laminate in an attempt to dilute the solution. The water can increase the fluid pressure of the cell substantially and increases of 50 atmospheres can occur, which eventually distorts or bursts the laminate or coating and leads to a blistering of the surface. Damage can be very extensive requiring major repair or the replacement of the structure (Figure 3).
Figure 3 Osmotic blistering of a boat hull Osmosis blistering is a very common problem that occurs in GRP laminated structures that have been immersed for long periods in aqueous solutions and is often observed in GRP boats, water tanks and swimming pools. A resin rich layer (e.g. gel coat) is often applied to the composite surface where the material is to be exposed for long periods to aqueous solutions. This protective layer acts as a barrier to moisture ingress, thereby protecting glass fibres from moisture degradation. Other protective measures against natural weathering include marine paint and polyurethane coatings, which also shield the composite substrate from UV damage and weathering erosion. The effect of moisture on aramid (e.g. Kevlar 49®) fibre-reinforced epoxy laminates is potentially greater than other composite systems. Aramid fibres tend to absorb moisture and degrade at room temperature with the rate of degradation accelerating as temperature is increased. Substantial hygrothermal strength losses have been observed with these materials, particularly under natural weathering conditions (i.e. combination of moisture and UV light). Fibre degradation is primarily an issue for glass fibres and aramid fibres, with carbon fibres being stable in most environments. Carbon fibres are relatively insensitive to moisture, and hence the variability in the tensile breaking stress and strain for carbon fibre tows is noticeably less than for E-glass fibre tows. For example, the tensile strength of freshly drawn E-glass fibres is typically 3.5 GPa. This strength can be fully realised, provided the fibres are carefully handled during fabrication to avoid surface damage and are stored in a dry environment.

Chapter 2 Good Practice Guide 103 9
Exposure to humid air (including environmentally controlled laboratories at standard conditions - 23ºC and 50% relative humidity (RH)) - will compromise the load bearing capacity of the fibres, resulting in a loss of strength and an increase in strength variability [40]. The loss of tensile strength of E-glass fibres is dependent on exposure time, temperature and degree of humidity. On initial exposure to a humid/water environment, the rate of fibre degradation is relatively rapid, even in benign environments, such as air-conditioned laboratories. The tensile strength is reduced to 3.0 GPa after 3 weeks exposure to standard laboratory conditions. Immersion in water at ambient temperature for the same period results in a 20% reduction (~2.5 GPa). As a consequence of handling and moisture, an intrinsic tensile strength of 2.0 GPa is often assumed for design purposes. Degradation of E-glass fibres in water can be mainly attributed to leaching of alkali oxides (sodium and potassium oxide) from the fibre surface resulting in the formation of surface micro-cracks, which act as stress concentrators. The loss of strength can be expected to be permanent at all conditioning temperatures and exposure times. The water surrounding glass fibres evolves into an aggressive alkali solution as the alkali ions dissolve out of the glass, slowly decomposing the glass fibres. Increasing the alkali content of the glass tends to reduce environmental attack from water and alkali solutions. It is worth noting that deionised water is slightly more aggressive than either tap water or seawater. Drying of the composite will remove most of the skin of water adjacent to the fibre, but a small permanent layer with retained water will still remain, and the mechanical properties of the fibre will be permanently degraded (for further details on chemical degradation see references [27, 41]). 2.4 Natural Weathering Weathering or more specifically photo-oxidation of polymers refers to the chemical and physical changes that occur when UV radiation is absorbed by a polymer. The UV radiation spectrum comprises wavelengths of between 290 and 400 nm, which corresponds to energies of between 415 and 300 kJ/mol. These energies are in the same range as the bond energies of many organic compounds. Chemical reactions are induced when specific functional groups absorb the UV radiation. Free radicals liberated in the process will trigger further reactions. The deleterious effect will be dependent on the chemical nature of the material, environmental factors such as temperature and humidity, and exposure time. Photo-oxidative sensitivity may also increase with prolonged exposure to pollutants. [9, 23, 27]. Photo-degradation is initiated by solar radiation, which results in the absorption of UV radiation by chromophores and in the activation of excited states in macromolecules. When a polymer is exposed to solar radiation the energy absorbed by the polymer results in the formation of free radicals within the polymer by the dissociation of the C-H bonds in the polymer chains. The extent of this chemical reaction depends on the radiation exposure that is the quantity of ultraviolet light (<350 nm) to which it is exposed. Once free radicals have been produced, reaction with oxygen generates hydroperoxides (POOH) [25]. These hydroperoxides can dissociate further to produce a series of decomposition products including aldehydes and ketones. The presence of these carbonyl groups in a degraded polymer can be used as a chemical index for degradation. Once formed these free radicals can continue to react via propagation reactions long after the initial UV exposure has ended.
10 Good Practice Guide 103 Chapter 2
The formation and propagation of free radicals in itself does not seriously affect the mechanical properties of the polymer, as free radicals do not significantly alter the long-chain nature of the polymer molecules. Degradation of the mechanical properties occurs because the free radicals produced are highly unstable and readily undergo chain scission reactions. This results in the formation of two smaller polymer chains, one of which is a free radical and capable of further reactions [25]. The intensity of the UV radiation decreases with increasing depth in the material, so that the reaction tends to be a near surface process. Since oxygen is involved in the reaction process, there is an important balance between UV radiation and oxygen diffusion, and of course temperature since that will also determine the kinetics of reaction and the transport of reactive species. Under natural exposure conditions there will be wetting and drying cycles and dark periods. The significance of the latter is that some recovery of the oxygen concentration in the material can occur, which otherwise is confined to the very near surface due to consumption by reaction with the polymer radicals. Since the concentration of these radicals diminishes by termination reaction during the dark period, oxygen ingress can extend to greater depth. UV radiation is known to degrade polymeric materials (including aramid fibres), although only the outer layer tends to be affected. Glass and carbon fibres tend to be unaffected by UV radiation. Epoxy resins are slightly sensitive to ultraviolet radiation; depending on the chemical formulation. Signs of photo-degradation include embrittlement (surface cracking), discolouration and loss of transparency [39]. Infrared radiation (800 nm to 1000 mm) does not contribute directly to photochemical degradation, however surface heating due to the absorption of the visible infrared radiation has an indirect influence on ageing. 2.5 Ionising Radiation Ionising radiation covers a wide range of different forms of radiation including x-rays, gamma rays, neutrons, alpha particles and beta particles. When a polymer is irradiated the ionising radiation induces degradation by the formation of free radicals or ions in the polymer. These reactive intermediates are capable of initiating chemical reactions which occur by free radical or ionic mechanisms and which result in scission as well as in cross-linking reactions. Free radicals with a long lifetime can be present in the bulk of the material after irradiation and still cause changes in properties even a long time after exposure [42-43]. The intensity of ionising radiation on the earth’s surface is not normally high enough to significantly affect most plastics and FRPs. Hence radiation exposure tests are only required in connection with the nuclear industry and applications where radiation is used, for example medical x-rays, sterilisation or cross-linking. 2.6 Chemical Degradation Chemical attack of thermoplastics involves specific chemical reaction of the polymer with the fluid with the most common mode of failure being hydrolysis by water, acids and alkalis [11]. Esters, amides, imides, and carbonate groups are particularly susceptible. Where these groups are located in the backbone chain rather than the side chain, chain scission ensues. A general hydrolysis scheme can be summarised as follows:
Chapter 2 Good Practice Guide 103 11
CH2OCH2 C
O
+ H2O
↓
OHCH2 C
O
CH2HO+
The reduction in molecular weight consequent upon chain scission can lead to a reduction of toughness and fracture strain. Stress is known to accelerate the chain scission process and also to enhance the rate of fluid uptake. The majority of thermoset resins are susceptible to oxidation by numerous oxidizing agents, from exposure to elevated temperatures (i.e. thermo-oxidation), hydrogen peroxide and bleaches (e.g. hypochlorite). It is often other constituents, such as fillers, catalysts, hardeners, pigments or fire retardants, rather than the resin or fibre reinforcement that are more reactive to these chemicals. Formulators and users, although usually aware of the potential durability problems associated with these additives, often overlook minor constituents such as catalysts, hardeners, pigments and processing aids. Most of the commonly used resin systems employed by the composite industry are far more chemical resistant to strong acids, salt solutions and oxidative agents than stainless steel or aluminium alloys. However, exposure to secondary solvents, such as paint strippers, can lead to irreversible material damage. The effect of these highly destructive processes is often evidenced by a degraded surface appearance (i.e. discolouration, loss of surface reflectivity, increased surface roughness and exposure of underlying fibres). Composites used in the automotive and aerospace industry may come in contact with a wide range of chemicals including aircraft fuel, gasoline, oil, hydraulic, brake and transmission fluids, lubricants, coolants and de-icing and antifreeze compounds. Many of these are known to have adverse effects on composite performance through degradation of the polymer matrix, for example the combination of JP-4 jet fuel and water is more aggressive than the two media acting alone. Alkali and Acidic Solutions: As with moisture effects, acid and alkali degradation processes are accelerated at elevated temperatures. Compared with other glass fibre types (e.g. R, ECR and C), E-glass is particularly vulnerable to attack from mineral acids (e.g. HCl and H2SO4) and alkalis (e.g. NaOH and KOH) [27, 41]. Dilute mineral acids are not only encountered in the chemical plant industry, but are also present in industrial and household effluent and sewage. As acids come into contact with E-glass fibres, ionic exchange occurs between the metallic cations (e.g. Na+ ions) at the glass surface and the hydrogen ions in the acid solution, resulting in leaching of sodium, potassium, calcium, magnesium, boron and aluminium from the outer layer or sheath of the fibre. Exposed fibres gradually lose weight, stiffness and strength with exposure time. Immersion in weak caustic solutions at room temperature can result in strength reductions of 30% within 2 weeks.
12 Good Practice Guide 103 Chapter 2
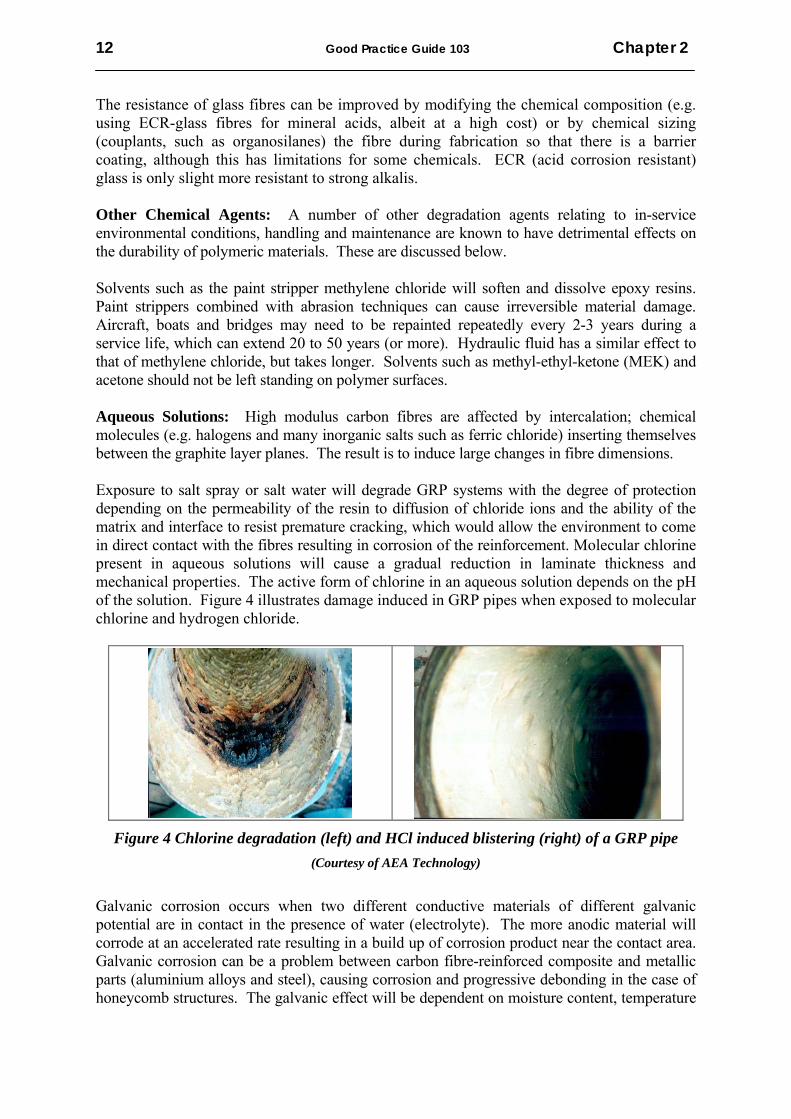
The resistance of glass fibres can be improved by modifying the chemical composition (e.g. using ECR-glass fibres for mineral acids, albeit at a high cost) or by chemical sizing (couplants, such as organosilanes) the fibre during fabrication so that there is a barrier coating, although this has limitations for some chemicals. ECR (acid corrosion resistant) glass is only slight more resistant to strong alkalis. Other Chemical Agents: A number of other degradation agents relating to in-service environmental conditions, handling and maintenance are known to have detrimental effects on the durability of polymeric materials. These are discussed below. Solvents such as the paint stripper methylene chloride will soften and dissolve epoxy resins. Paint strippers combined with abrasion techniques can cause irreversible material damage. Aircraft, boats and bridges may need to be repainted repeatedly every 2-3 years during a service life, which can extend 20 to 50 years (or more). Hydraulic fluid has a similar effect to that of methylene chloride, but takes longer. Solvents such as methyl-ethyl-ketone (MEK) and acetone should not be left standing on polymer surfaces. Aqueous Solutions: High modulus carbon fibres are affected by intercalation; chemical molecules (e.g. halogens and many inorganic salts such as ferric chloride) inserting themselves between the graphite layer planes. The result is to induce large changes in fibre dimensions. Exposure to salt spray or salt water will degrade GRP systems with the degree of protection depending on the permeability of the resin to diffusion of chloride ions and the ability of the matrix and interface to resist premature cracking, which would allow the environment to come in direct contact with the fibres resulting in corrosion of the reinforcement. Molecular chlorine present in aqueous solutions will cause a gradual reduction in laminate thickness and mechanical properties. The active form of chlorine in an aqueous solution depends on the pH of the solution. Figure 4 illustrates damage induced in GRP pipes when exposed to molecular chlorine and hydrogen chloride.
Figure 4 Chlorine degradation (left) and HCl induced blistering (right) of a GRP pipe
(Courtesy of AEA Technology) Galvanic corrosion occurs when two different conductive materials of different galvanic potential are in contact in the presence of water (electrolyte). The more anodic material will corrode at an accelerated rate resulting in a build up of corrosion product near the contact area. Galvanic corrosion can be a problem between carbon fibre-reinforced composite and metallic parts (aluminium alloys and steel), causing corrosion and progressive debonding in the case of honeycomb structures. The galvanic effect will be dependent on moisture content, temperature

Chapter 2 Good Practice Guide 103 13
and electrical and chemical properties of the galvanic cell electrodes and electrolyte. Carbon fibre surfaces are electrochemically active supporting chemical reactions. 2.7 Biological Degradation
Biological degradation is not a common form of degradation as most commonly used thermoplastics are resistant to microbiological attack. The only cases were biological attack has influenced life expectancy has been with certain polyurethanes and some low molecular weight additives in PVC. No predictive techniques for the life expectancy of conventional polymers due to biological degradation have been developed although there are standards for testing resistance (See Section 9). There is, however, growing interest in the development of deliberately short-lived polymers both for medical applications and for use as disposable packaging. 2.8 Environmental Stress Cracking (ESC) Environmental stress cracking (ESC) remains one of the most common causes of failure in polymers. The main reason for this is the complexity of the phenomenon, with aspects such as chemical compatibility, liquid diffusion, craze formation and crack development all contributing. While crystalline and amorphous polymers are both susceptible to ESC, amorphous polymers are particularly susceptible due to their relatively open structure that leads to easy fluid penetration. Once the fluid has penetrated the polymer it becomes locally dissolved promoting cracking and crazing in the polymer. Cracking is normally preceded by the formation of crazes initiated at sites of stress concentration or in regions of local microstructure inhomogeneity. Crazes are voids that are held together by highly drawn fibrils, which bridge the void allowing the craze to transmit stress and prevent the craze from propagating (Figure 5). The mechanism of crazing in chemical environments is generally considered to be identical to that in air [13, 15. 44]. In general terms, craze initiation is considered to evolve from micro-deformation processes in localised regions about 30 nm in diameter (see Figure 5) [45]. As the deformation region develops, further localised deformation is induced. The growth and coalescence of such deformed nuclei create a narrow plastic zone. In the presence of dilatational stress, voids develop. The voided structure is considered the precursor of the fibrillated craze structure that ultimately leads to failure [46].
Figure 5 Crazing of PMMA
14 Good Practice Guide 103 Chapter 2
The environment accelerates the craze formation process by local plasticisation (i.e. enhancement of the local relative movement of molecular chains by reduced intermolecular interaction between chains [15, 44]). However, the particular phase of craze precursor development during which acceleration by the environment occurs, and the dependence of this on polymer type, is less clear. It has been proposed [44] that the role of the environment is to determine when the voided precursors break down to form crazes and it has also been suggested that the environment is important in void stabilisation through surface energy reduction. Stress concentration can be important not only for the development of local deformation zones (although this is not necessarily dependent on stress concentration) but also for concentrating absorbed molecules in response to the presence of dilatational stress. The rapid growth of the craze precursor to a visible crazes is thought to occur at a critical level of the inelastic strain, which is independent of the environment and temperature [44, 47-48]. This has significant implications for assessing the durability of a polymer. For example, in polymer-fluid combinations that lead to plasticisation-induced toughening, simultaneous exposure may delay the development of crazes. However, exposure to the fluid after the sample has been stressed in air to attain the critical level of inelastic strain may lead to rapid crazing. It helps explain the very rapid development and growth of crazes in many cases when environment exposure times are relatively short but the time under stress has been long. 2.9 Stress Corrosion of Fibres The process of environmental degradation of glass fibres is accelerated under mechanical loads with the long-term strength of GRP laminates under hostile environments being controlled by stress corrosion of the fibre-reinforcement [27, 41]. In alkaline solutions, degradation is associated with progressive weakening of the glass fibres rather than a synergism between stress and the environment. This process also occurs when glass fibres are exposed to water vapour or immersed in water. A high alkaline concentration builds up at the tip of a crack, or flaw. ESC of glass fibres occurs in acidic solutions with the rate of degradation dependent on pH level. The consequence is that GRP laminates suffer delayed brittle fracture in acidic environments, under stress [49]. Static fatigue or creep rupture, which refers to time-dependent failure of the material when subjected to constant load, is used as a measure for gauging the relative resistance of the material (i.e. fibre or composite) to chemical environments. The less resistant a fibre is to a particular environment, the more rapid the drop in the rupture stress time curve. For a given applied load, the stress rupture time decreases with increasing humidity and temperature, or chemical concentration.
Environmental Conditioning and Testing
IN THIS CHAPTER
33
Temperature
» Elevated and Sub-Zero
» Thermal Conditioning
» Heat Ageing
» Heat Distortion Temperature (HDT)
Moisture
» Conditioning and Testing
» Steam Autoclave
» Pressurized Fluid Testing
» Fickian Diffusion
» Moisture Expansion Coefficient
Mechanical Testing of Conditioned Specimens
Fibre Bundles and Impregnated Strands
Design and Planning Test Programme

16 Good Practice Guide 103 Chapter 3
3.1 Introduction A number of techniques have been employed to accelerate testing of polymeric materials. The usual approach for environmental testing has been to increase the temperature, humidity level or pressure (and in the case of chemical exposure the concentration level of the chemical agent). However, there is a temperature limit to which most polymer resins can be raised without affecting a change in the degradation mechanism, e.g. moisture absorption. Above this critical temperature, there is a strong possibility of altering the degradation mechanism. An alternative approach to increasing the level of the degradation agent is to increase the frequency of application of the degradation agent. An example is chemical resistance where exposure may be continuous, whereas in-service exposure is intermittent. The concern is that continuous exposure may result in a different response to actual service conditions. The use of relatively small specimens for longer times under less severe conditions could potentially be used, provided the data generated can be scaled up to predict the long-term performance of more realistic size structures [50-51] to generate durability data provided that allow rapid conditioning under more realistic temperatures, stresses and concentrations reflecting actual service conditions. This section examines temperature and moisture accelerated testing of polymeric materials. 3.2 Temperature High Temperatures: Prolonged, or even short term, exposure to elevated temperatures will result in a reduction in the short-term properties and possibly irreversible chemical and physical changes within an adhesive. For polymer systems, high temperatures will rarely exceed 300°C and will normally be considerably lower. It is recommended when characterising mechanical properties (i.e. stiffness and strength) at elevated temperatures that testing be conducted in a temperature-controlled chamber [52]. It is important that the load cell is thermally isolated from the chamber and that any sensors within the test environment are able to operate at the test temperature. It may be necessary to use thermal compensation to ensure accurate sensor measurements. It is common practice for elevated temperature to allow a soak period of 10 minutes at the test temperature prior to testing. The purpose of “heat-soaking” is to eliminate distortion due to non-uniform temperature distributions. The thermal mass of test fixtures can often result in a significant thermal lag in the specimen reaching equilibrium with the surrounding environment. It is recommended that the surface temperature of the specimen be monitored to determine the soak time. This need only be carried out for the initial test for a series of identical tests. Care needs to be taken when testing moisture pre-conditioned specimens to prevent drying of the specimen during the test Sub-Zero Temperatures: The basic principles of elevated temperature testing also apply to low temperatures. Additional time, however, may be required to reach the test temperature and the temperatures achievable may depend strongly on the dimensions and degree of insulation of the environmental chamber. In particular it can be difficult to cool to low temperatures in large chambers.

Chapter 3 Good Practice Guide 103 17
Mechanical refrigeration and liquid nitrogen based cooling systems are commercially available with the former tending to be restricted to a minimum operating temperature of approximately -50°C (chamber permitting). Liquid nitrogen is capable of changing temperature many times faster than a mechanical refrigerated cooling system and can achieve temperatures around –150°C, or better. Even though a mechanically refrigerated system may be capable of achieving a temperature of -50°C, it will take considerably longer to reach those temperatures. All moving parts should be coated in molybdenum grease to prevent stiction. It is recommended that dry nitrogen gas be circulated through the test chamber to prevent moisture condensation and ice formation on the bonded specimen and test apparatus. It is also recommended that the test apparatus to be constructed from stainless steel to avoid corrosion products forming on the apparatus surface. Thermal Conditioning and Heat Ageing: It is advisable to use a circulatory oven or chamber to maintain a steady flow of air through the oven and to ensure uniform temperature distribution within the test chamber. Test specimens should be exposed to air on all sides, unless otherwise specified. The chamber should be significantly larger than the volume occupied by loading fixtures and test specimens. It is good practice to limit the occupied volume to 10% of the free chamber space, and that specimens are separated by 1 to 2 centimetres. The temperature tolerance should be within ± 2 °C, or smaller. Heat ageing tests [23] should include a minimum of three (preferably five) temperatures for periods of 1,000 hours (∼6 weeks), or more in order to generate sufficient data that can be extrapolated to lower (i.e. service conditions). It is important that at the highest temperature that the degradation mechanism is the same as experienced at the lower temperatures. The same specimens can be used throughout the test provided the test is non-destructive (e.g. loss of mass or colour change). If the measurements are destructive then a batch of at least five specimens (preferably more) must be prepared for each combination of duration and temperature. It is advisable to include reserve sets (2 off) in case the threshold of degradation is not reached. The minimum number of durations should be at least 5 in order to determine the change of property with time. The spacing of exposure times is usually linear for heat ageing. There is no general heat ageing method for polymeric materials, however there are a number of specific procedures, which are primarily intended for control and comparative purposes (for further details see [23]). Heat Distortion Temperature (HDT) is often the only criterion used in determining a materials “fitness for purpose” at elevated temperatures (i.e. upper of safe operating temperature at which the material can support a load for any appreciable time). The test procedure for determining HDT, as described in ISO 75 [53], consists of three-point loading of a rectangular beam (120 mm long, 3 to 4 mm wide and 10 to 15 mm thick) immersed in a heated mineral oil bath, whose temperature is constantly increased at a rate of 2 °C/min. The separation between the test specimen supports is 100 mm. The central deflection is continuously monitored. HDT is reached when the central deflection of the test specimen reaches a specified deflection value for a given nominal surface stress. The standard deflection depends upon the specimen thickness (e.g. 0.32 mm for a specimen thickness of 10 mm and a nominal surface stress of 1.80 MPa). The ISO standard applies to both neat resins (Part 2) and FRPs (Part 3), although some difficulties have been encountered.

18 Good Practice Guide 103 Chapter 3
Note: HDT test data are only suitable for materials selection and acceptance, and not for design purposes. The results obtained using this method do not necessarily represent maximum use temperatures, because in practice essential factors such as time, loading conditions and nominal surface stress may differ for the different testing conditions. Results obtained using ISO 75 indicate that the HDT values are higher for un-reinforced plastics (measured using Part 2) compared with the corresponding results obtained for the reinforced version measured using Part 3. It is recommended that Part 2 be used until the anomaly associated with the incorrectly specified applied stress level is resolved. Glass transition temperature can also be used to set upper service temperature limits for polymeric systems. 3.3 Moisture Conditioning and Testing The degree of degradation that occurs in polymeric systems when in service can often be linked directly with the amount of moisture absorbed. The moisture absorption kinetics of polymer systems will differ widely and also change with physical ageing. Moisture conditioning can be carried out using either full immersion (where solution chemistry needs to be considered) or in a humid atmosphere (where relative humidity, RH, should be controlled). Absorption and diffusion rates are also temperature dependent. Equilibrium moisture concentrations normally increase with increasing RH. Immersion usually results in a higher equilibrium moisture concentration than atmospheric exposure. The approach often adopted, is to define a constant exposure environment that will produce a moisture level that is representative of a component or structure that has been exposed to a real life environment at a particular geographical location. The variability of a natural environment, that is daily, monthly or seasonal changes in temperature and humidity are known to be a major factor in determining both the final moisture equilibrium level in the material and the distribution of moisture in the outer surface layers. The military consider the worst worldwide environment to be represented by 70oC and 85% RH. The natural process of moisture absorption in engineering components/structures is normally very slow, and this makes it very difficult to reach an adequate degree of degradation in a structural test element in practical timescales. It has been found necessary, therefore, to speed up the moisture diffusion process by employing an accelerated conditioning technique that can ensure a representative level of degradation in a significantly reduced time. There are two basic methods of moisture conditioning: • Fixed-time conditioning, where a test specimen is exposed to a conditioning
environment for a specified period of time; and • Equilibrium conditioning, where a specimen is exposed until the material reaches
equilibrium with the conditioning environment. The first technique is routinely employed for screening adhesives (including surface treatments) and FRPs. This approach results in non-uniform moisture distribution through the thickness of the test specimen. Test data obtained from specimens conditioned in this manner are only considered suitable for comparing different batches of the same material or for quality control tests. It is essential that test specimens used in this manner are identical in dimensions and have similar surface finishes.

Chapter 3 Good Practice Guide 103 19
Ideally, comparative studies of water absorption properties of materials should be carried out only using the equilibrium moisture content of polymeric materials exposed to identical conditions. Equilibrium moisture concentration is most likely to indicate ‘worst-case’ material properties. Comparisons between polymeric systems with different moisture absorption characteristics are possible if the materials are preconditioned to equilibrium. The thicker the material the longer the time required to reach equilibrium, hence the use of relatively thin specimens to determine the “through-the-thickness” moisture diffusion coefficient. An alternative approach to attempting to reach an equilibrium condition, involves altering the acceptance criteria to a given percentage of the chosen equilibrium condition. Conditioning the material to 95% of the full equilibrium state takes a relatively shorter time to reach than the full (100%) equilibrium condition. The time required to obtain the last 5% can take longer than the time taken to reach the 95% level. Clearly a very large saving in time is possible if a 95% of equilibrium can be justified in terms of a non-significant change in the structural strength and stiffness properties. Further acceleration can be obtained by increasing the relative humidity to the maximum that can be readily maintained (i.e. 96%). It is required that the acceleration method takes full advantage of the high rates of diffusion given by temperature and humidity and still achieve a reasonably realistic moisture absorption. It is not satisfactory to precondition at 96% RH, so that the equilibrium level in the outer surface layers exceeds the bulk equilibrium level obtained due to exposure in service. Note: Although accelerated ageing is widely used, a full understanding of the effects is not yet available and there is no consensus as to a satisfactory accelerated test. Adsorption Measurement: The international standard BS EN ISO 62 [54] describes a procedure for determining the moisture absorption properties and/or diffusion coefficients in the “through-the-thickness” direction of flat and curved solid plastics. BS EN ISO 62 is suitable for use with thermoset resin (inc. adhesives) and FRP specimens. The method can be applied to vapour exposure and liquid immersion. Further information is given in reference [36]. Conditioning usually consists of exposing pre-dried specimens to a steady-state environment (i.e. constant temperature and constant moisture exposure level) and measuring the moisture gain (i.e. average moisture content) for a prescribed period of time or until the specimen reaches moisture equilibrium. The amount of water absorbed by the test specimen is determined by measuring its change in mass (i.e. difference between initial mass and the mass after exposure). All surfaces are in contact with the test environment. It is recommended that when determining moisture absorption properties that square shape specimens be used for homogeneous polymers. In this case, specimen dimensions and tolerances should comply with ISO 294-3 [55]. For FRPs, it is recommended that square specimens also be used with a width w ≤ 100 x nominal thickness d (typically 2 mm). It is recommended that specimens be pre-dried in an oven maintained at 50 ± 2 °C until the specimen weight reaches a constant value. The temperature of the drying oven should not exceed the maximum operating temperature of the adhesive system. Specimens are removed at fixed intervals (typically 24 hrs) and allowed to cool to room temperature in a desiccator before being weighed.

20 Good Practice Guide 103 Chapter 3
After weighing, the specimen is returned to the oven and the process is repeated until the mass of the specimen is constant (zero datum level). Specimens should be free of voids in order to ensure accurate moisture absorption measurements. To minimise moisture uptake prior to preconditioning, specimens are stored in a desiccator (sealed container with desiccant), at room temperature. It should be noted that under standard laboratory conditions many polymeric materials could absorb significant levels of moisture. Conditioned specimens need to be wiped with a clean cloth to ensure all surface water is removed prior to weighing. Damage may accumulate during long-term conditioning, and hence handling and monitoring of test specimens should be minimal. This is particular pertinent to those specimens used for generating engineering data. Travellers are required to monitor specimen moisture content throughout the environmental history (i.e. manufacture, storage, pre-conditioning and testing). Traveller specimens should have identical material properties, geometry and processing history as the test specimen. It is essential that moisture content prior to pre-conditioning be established. Conditioning is often carried out at elevated temperature or humidity to accelerate moisture uptake. Care should be taken to avoid exceeding the Tg of the material. The recommended maximum conditioning temperatures are 45 °C and 70 °C for 120 °C and 180 °C cure systems, respectively [56]. These temperature levels should not be exceeded. It is recommended that information on the moisture and temperature response of the material be obtained prior to environmental conditioning. The rate of moisture uptake is fairly rapid in the early stages of conditioning with the rate of moisture uptake decreasing with time. It is therefore necessary to make frequent weight measurements in the early stages (3-4 measurements on day one) followed by at least two readings per day for the remainder of the first week. At least one reading per day is required for the second week, followed by a gradual decrease in frequency as the rate of weight gain diminishes. It is recommended that weighing be carried out at approximately equal intervals of (time)1/2. The percentage uptake of water by weight M can be determined as follows:
( ) %100xW
WWMDRY
DRYWET −= (1)
Wet and dry weights are denoted by WWET and WDRY. A precision analytical balance capable of reading to within 0.1 mg is required. This can be relaxed to 1 mg if water absorption is greater than 1 %. Accurate records need to be kept on preconditioning sequence including relative humidity, temperature and time, measured weights and derived moisture contents. Although humidity conditions can be controlled using salt solutions, this procedure is not particularly reliable as it is difficult to maintain the required tolerances on humidity and temperature. The recommended procedure is to use an environmental cabinet, which can control the temperature to within ±2 °C and the relative humidity to within ±5%. Since diffusion rates depend on temperature it is preferred that the tolerances be smaller [36]. A circulation fan is essential for ensuring uniform temperature and humidity throughout the chamber.

Chapter 3 Good Practice Guide 103 21
It is essential that boiler units of humidity cabinets be supplied from a deionised/distilled water reservoir in order to prevent salt deposits on test specimens, corrosion of bonded joints and scaling of the plumbing. Ideally, humidity and temperature of the environmental chamber should be continuously monitored using a data acquisition system with limit alarms. Should a monitoring system be unavailable it is advised to regularly check the temperature and humidity indicators on the equipment. It is ill advised to assume that the temperature and humidity settings on environmental conditioning equipment are correct, for example temperature control settings on water baths can be a few degrees in error. Temperature and humidity measurements using calibrated equipment should be carried out to ensure the control settings produce the test conditions required. Checks on control settings should be routinely carried out throughout the duration of testing to ensure environmental test conditions are maintained. Three Stage Conditioning: The approach is to expose the material to the maximum practical humidity that is available (i.e. 96% RH) until the moisture level in the bulk reaches the bulk equilibrium level at the lower humidity/temperature condition (i.e. 70 °C/85% RH). The second stage is to expose the material to a lower humidity level (15% RH), a drying stage, to remove excess moisture in the outer surface layers. The third stage uses a relative humidity that will give the desired final moisture level (i.e. 85% RH). The distribution flattens out across the entire material thickness. The effective use of the technique relies upon mathematically modelling the moisture diffusion for each stage of conditioning. Steam Autoclave Conditioning: Exposure to superheated pressurized steam (e.g.. 2.2 bar and 136 °C) can induce levels of moisture of 2 to 3 weight % in epoxy-based composites within 48 hours. Experimental evidence [51] suggests that steam autoclave conditioning is a viable option for inducing accelerated ageing, particularly for those systems possessing a cure temperature and a Tg in excess of 120 to 140 °C. The technique can be expected to prove too destructive for materials possessing low Tg values, such as polyester and vinyl ester resins. This approach could be useful for conditioning thick laminated sections and for provided a worst case-scenario as to material degradation. Pressurized Fluid Testing: Rate of moisture uptake of specimens immersed in a fluid under pressure, such as deep-sea environments, may be expected to increase with an increase in pressure. Poorly compacted materials (i.e. high porosity) tend to absorb moisture more rapidly under pressurized conditions than would occur under atmospheric conditions. Tests simulating deep-sea conditions can be carried out in specially designed pressure autoclaves, which can be heated internally using heating elements or externally using a heating blanket. Depressurizing samples back to atmospheric pressure can induce additional damage similar to the bends, particularly in porous materials. Cycling between high and low pressure can propagate damage in samples. Note: Pressure vessels must be used with care. Safety tests should be conducted routinely on the equipment to ensure the equipment is within safety specifications.
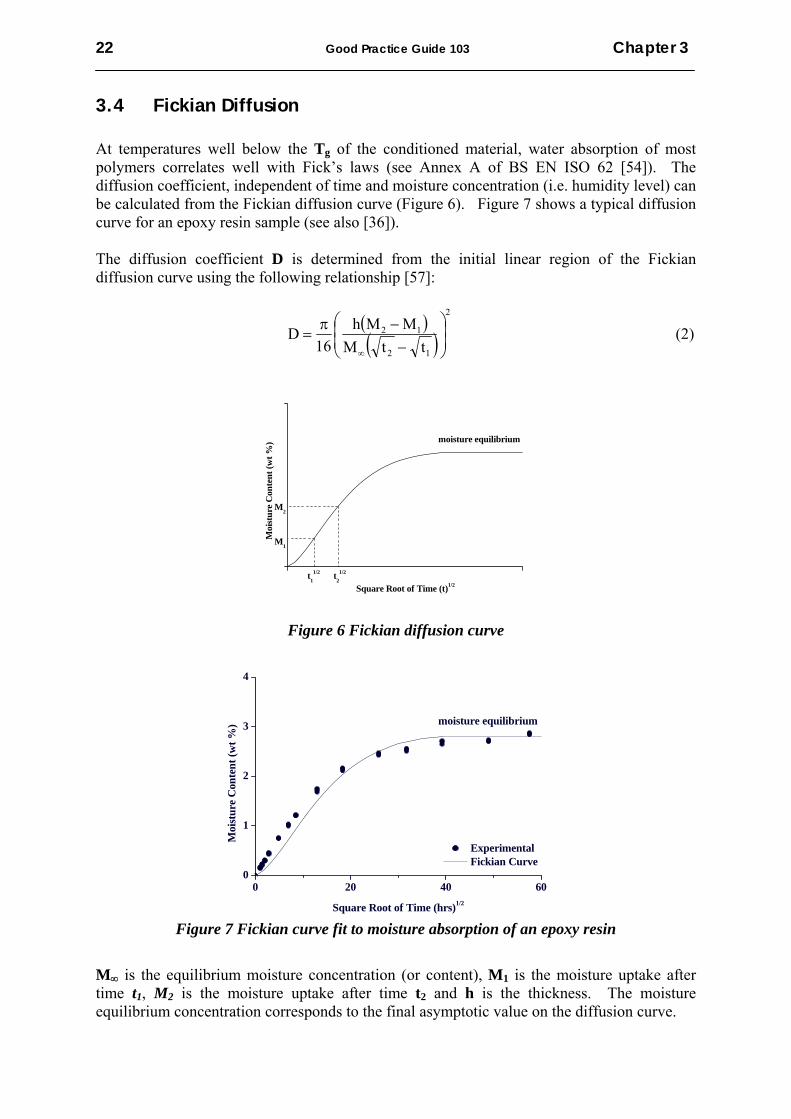
22 Good Practice Guide 103 Chapter 3
3.4 Fickian Diffusion At temperatures well below the Tg of the conditioned material, water absorption of most polymers correlates well with Fick’s laws (see Annex A of BS EN ISO 62 [54]). The diffusion coefficient, independent of time and moisture concentration (i.e. humidity level) can be calculated from the Fickian diffusion curve (Figure 6). Figure 7 shows a typical diffusion curve for an epoxy resin sample (see also [36]). The diffusion coefficient D is determined from the initial linear region of the Fickian diffusion curve using the following relationship [57]:
( )( )
2
12
12
ttMMMh
16D ⎟
⎟⎠
⎞⎜⎜⎝
⎛
−−π
=∞
(2)
0 600
4
t11/2 t
21/2
M2
M1
moisture equilibrium
Moi
stur
e C
onte
nt (w
t %)
Square Root of Time (t)1/2
Figure 6 Fickian diffusion curve
Figure 7 Fickian curve fit to moisture absorption of an epoxy resin
M∞ is the equilibrium moisture concentration (or content), M1 is the moisture uptake after time t1, M2 is the moisture uptake after time t2 and h is the thickness. The moisture equilibrium concentration corresponds to the final asymptotic value on the diffusion curve.
0 20 40 600
1
2
3
4
moisture equilibrium
Experimental Fickian Curve
Moi
stur
e C
onte
nt (w
t %)
Square Root of Time (hrs)1/2
Chapter 3 Good Practice Guide 103 23
The fractional moisture content gain G can be approximated by [57-59]:
⎥⎥⎦
⎤
⎢⎢⎣
⎡⎟⎠⎞
⎜⎝⎛−−=
−−
=∞
75.0
2i
i
hDt3.7exp1
MMMMG (3)
Mi is the initial moisture content of the sample and M = M(t) the percent moisture content of the composite at any time t. When only one side of the sample is exposed, the thickness h is replaced by 2h. The analysis used to derive D assumes that the specimen is an infinite rectangular plate with no moisture diffusion from the specimen edges. In practice, moisture diffusion occurs from all six surfaces. Shen and Springer [57] derived a correction factor to account, which enables the true one-dimensional diffusion coefficient Dx to be determined as follows:
2
x bh
lh1DD
−
⎟⎠⎞
⎜⎝⎛ ++= (4)
where l and b are the sample length and width, respectively. If the moisture entering through the specimen edges is neglected then Dx the diffusivity of the material in the direction normal to the surface is: DDx = (5) Note: Diffusion in an adhesive joint may be 10 times as high as that measured for bulk adhesive samples, probably as a result of capillary action along the adhesive/adherend interface. Moisture diffusion may differ between the unstressed and stressed states with the diffusion rate increasing with applied stress. Diffusivity D can be expressed as a function of absolute temperature T by the following Arrhenius relationship [58]: T/k
o expDD −= (6) Do and k are constants determined from a linear regression fit to log D versus 1/T graph (Figure 8). For anisotropic materials, the diffusion coefficients vary with direction. The diffusion coefficients parallel and perpendicular to the fibres (D11 and D22) for aligned glass and carbon fibre-reinforced systems may be estimated by the following relationships [51, 58]:
( )
mf
22
mf11
DV21D
DV1D
⎟⎟⎠
⎞⎜⎜⎝
⎛π
−=
−=
(7)
Dm is the diffusivity of the resin and Vf is the fibre volume fraction.
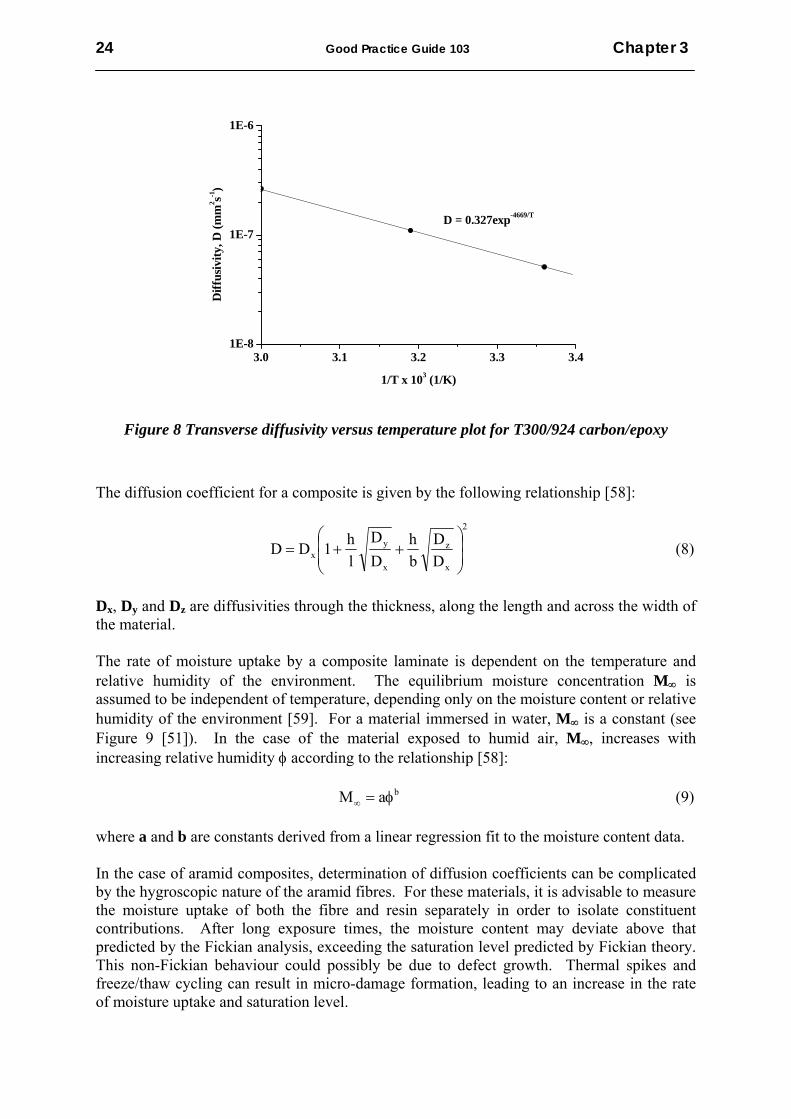
24 Good Practice Guide 103 Chapter 3
3.0 3.1 3.2 3.3 3.41E-8
1E-7
1E-6
D = 0.327exp-4669/TD
iffus
ivity
, D (m
m2 s-1
)
1/T x 103 (1/K)
Figure 8 Transverse diffusivity versus temperature plot for T300/924 carbon/epoxy
The diffusion coefficient for a composite is given by the following relationship [58]:
2
x
z
x
yx D
Dbh
DD
lh1DD ⎟
⎟⎠
⎞⎜⎜⎝
⎛++= (8)
Dx, Dy and Dz are diffusivities through the thickness, along the length and across the width of the material. The rate of moisture uptake by a composite laminate is dependent on the temperature and relative humidity of the environment. The equilibrium moisture concentration M∞ is assumed to be independent of temperature, depending only on the moisture content or relative humidity of the environment [59]. For a material immersed in water, M∞ is a constant (see Figure 9 [51]). In the case of the material exposed to humid air, M∞, increases with increasing relative humidity φ according to the relationship [58]: baM φ=∞ (9) where a and b are constants derived from a linear regression fit to the moisture content data. In the case of aramid composites, determination of diffusion coefficients can be complicated by the hygroscopic nature of the aramid fibres. For these materials, it is advisable to measure the moisture uptake of both the fibre and resin separately in order to isolate constituent contributions. After long exposure times, the moisture content may deviate above that predicted by the Fickian analysis, exceeding the saturation level predicted by Fickian theory. This non-Fickian behaviour could possibly be due to defect growth. Thermal spikes and freeze/thaw cycling can result in micro-damage formation, leading to an increase in the rate of moisture uptake and saturation level.

Chapter 3 Good Practice Guide 103 25
Figure 9 Moisture absorption in continuous unidirectional T300/924 carbon/epoxy
Moisture measurements are sensitive to a number of factors that need to be considered in order to ensure accurate diffusivity values. These are listed below [36]: • Small changes in temperature or humidity can result in large variations in diffusivity,
and hence the need to control the test environment to the utmost accuracy possible. • When removed from the conditioning environment specimens will immediately dry
and lose weight. A significant amount of moisture can be lost within a short period of time, thus compromising measurement accuracy.
• Surface roughness can affect moisture uptake and drying. Rough surfaces are more difficult to dry, and also present a larger surface area to the surrounding environment.
• Absorption is dependent on the level of porosity with the rate of moisture absorbed and moisture concentration at saturation increasing with the level of porosity.
• Specimen dimensions need to be accurately measured. Small variations can result in significant errors in diffusivity calculations.
• Surface damage and defects must be avoided as these can act as paths for moisture ingress.
0 20 40 60 800.0
0.5
1.0
1.5
2.0
25 oC 40 oC 60 oC
Moi
stur
e C
onte
nt (w
t %)
Square Root of Time (hrs)1/2
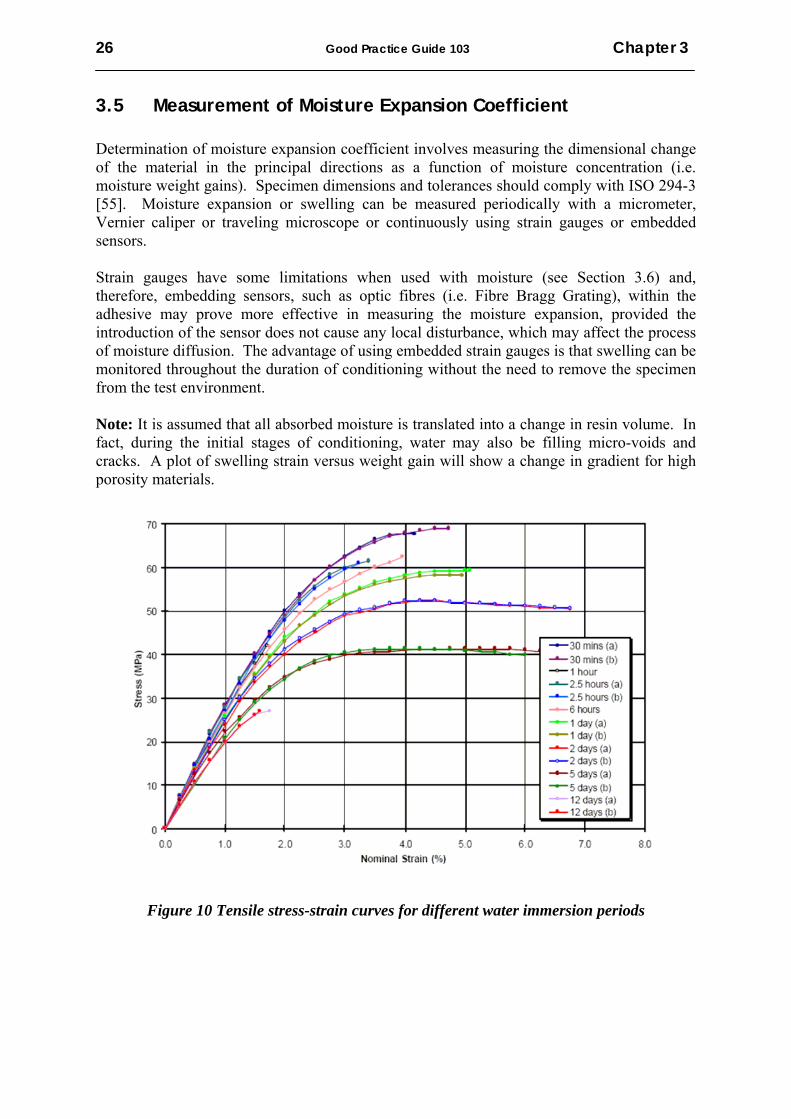
26 Good Practice Guide 103 Chapter 3
3.5 Measurement of Moisture Expansion Coefficient Determination of moisture expansion coefficient involves measuring the dimensional change of the material in the principal directions as a function of moisture concentration (i.e. moisture weight gains). Specimen dimensions and tolerances should comply with ISO 294-3 [55]. Moisture expansion or swelling can be measured periodically with a micrometer, Vernier caliper or traveling microscope or continuously using strain gauges or embedded sensors. Strain gauges have some limitations when used with moisture (see Section 3.6) and, therefore, embedding sensors, such as optic fibres (i.e. Fibre Bragg Grating), within the adhesive may prove more effective in measuring the moisture expansion, provided the introduction of the sensor does not cause any local disturbance, which may affect the process of moisture diffusion. The advantage of using embedded strain gauges is that swelling can be monitored throughout the duration of conditioning without the need to remove the specimen from the test environment. Note: It is assumed that all absorbed moisture is translated into a change in resin volume. In fact, during the initial stages of conditioning, water may also be filling micro-voids and cracks. A plot of swelling strain versus weight gain will show a change in gradient for high porosity materials.
Figure 10 Tensile stress-strain curves for different water immersion periods

Chapter 3 Good Practice Guide 103 27
3.6 Mechanical Testing of Conditioned Specimens For design purposes, a material test programme should measure both the moisture absorption properties of a material (i.e. diffusion rate and equilibrium content) and the resultant mechanical properties at equilibrium. Mechanical property measurements at intermediate moisture levels (based on average moisture contents) can be used to determine temporal and spatial distributions of stresses and strains within a bonded structure. To evaluate worst-case effects of moisture content on material properties, tests are performed on specimens that have been preconditioned to the design service moisture content (e.g. aerospace worst-case environment is considered to be represented by 70 °C/85% RH). It should be noted that the material operational limit is influenced markedly by temperature and moisture content. Figure 10 shows tensile stress-strain responses under ambient test conditions for an adhesive that has been immersed in water for periods ranging from 30 minutes to 12 days. There is a significant reduction in tensile stiffness and strength with increasing moisture content. The reduction in material properties will be more severe at elevated temperatures. A number of contact and non-contact techniques, such as linear voltage displacement transducers (LVDTs), video extensometers, and electronic speckle pattern interferometry (ESPI), strain gauges and crosshead movement are available for measuring strain and displacement. With the exception of strain mapping techniques (i.e. ESPI and digital image correlation (DIC)), the measured strain will be an average strain. Also, strain gauges only measure strain at the location of the gauge. Further details on these techniques can be obtained from NPL Measurement Good Practice Guide Number 47 [33]. Some thought needs to be given to selecting techniques for the actual tests to be performed. Factors to be considered include: • Degree of accuracy and resolution required • Area over which strain is to be monitored • Suitability of measurement device for testing environment, e.g. the calibration for
contact extensometers may not be valid at non-ambient temperatures • Quality of visual access to specimen (for non-contact techniques) • Chemical compatibility with any pattern marking or adhesives required • Likelihood of strain measuring devices (e.g. knife edges on extensometers) damaging
specimen and initiating premature failure. Strain gauges have particular issues that restrict their usefulness in environmental conditioning and testing. Most strain gauge adhesives are sensitive to moisture, which can often preclude bonding of strain gauges to the specimen prior to the preconditioning stage. Moisture attack of the strain gauge adhesive and strain gauges will occur from the top, edges and through the test specimen. It is therefore important to ensure that the adhesive selected for bonding the strain gauges remains unaffected for the entire duration of the test and that strain gauges and associated electrical wiring are suitably encapsulated. Silicone rubber and foil have been placed over strain gauges in order to isolate the gauges during environmental conditioning. The process is only partially effective, as moisture will eventually penetrate the bond-line. The strain gauge manufacturer should be contacted to obtain advice on adhesive selection and procedures for strain gauge protection. The preferred method is to use either contact extensometers or video extensometers for monitoring strain.

28 Good Practice Guide 103 Chapter 3
It is important that the moisture content be established prior to testing and that specimens be tested within an hour of removal from the conditioning environment in order to ensure that minimal water loss occurs. At elevated temperatures, preconditioned specimens tend to dry out during the test, although for static tests the effects are minimal provided testing is completed within 15 minutes of the specimen being removed from the conditioning environment. Methods of inhibiting moisture loss, such as encapsulating specimens with a sealant or enclosing the specimen in a polythene bag containing a salt solution appropriate to the humidity requirements of the test, are not practical. Travellers are required for monitoring the moisture content loss that occurs during the test. For coupon testing, it is common practice to allow a soak period of 10 minutes at the test temperature prior to testing. The purpose of “heat-soaking” is to eliminate distortion due to non-uniform temperature distributions. Moisture conditioned specimens can be stored in a refrigerator at a temperature of 4 °C for periods of up to six weeks with minimal moisture loss or effect on mechanical properties. Sub-zero temperatures can result in further damage to a material due to ice formation, and hence storage under these conditions should be avoided. 3.7 Fibre Bundles and Impregnated Strands Test methods have been developed for characterising the tensile properties of fibre bundles and impregnated strands under static and cyclic (tension-tension) loads, and/or aggressive environments [50]. These test methods require shorter conditioning times and less manufacturing and testing costs compared with current practices. The use of small diameter composite rods (1.5 to 5 mm), as shown in Figure 11, enables rapid environmental conditioning under more moderate and realistic temperatures and moisture levels compared with those methods used to accelerate ageing in laminates. Degradation effects on the composite rods by the environment are quickly manifested (within 7 days) in terms of strength reduction [50]. Several test methods exist for measuring the tensile strength and longitudinal modulus of single fibre filaments and fibre tows or rovings (i.e. bundle of continuous parallel filaments). These methods are usually intended for yarns having a diameter of less than 2 mm (typically 0.5 to 0.8 mm), or a linear density lower than 2,000 tex (weight per unit length in g/km). Fibre tow methods include testing of both un-impregnated (i.e. loose or dry) and impregnated rovings. ISO 3341 [60] specifies a method for the determination of the breaking force and failure strain of un-impregnated glass fibre rovings, whereas BS ISO 9163 [61] allows for both un-impregnated and impregnated fibre tows. ASTM D 4018 [62] and ISO 10618 [63] specify test methods for carbon fibre tows. Manufacturers will often use in-house quality assurance methods for determining fibre tensile properties. NPL Measurement Note CMMT (MN) 063 [50] gives details on specimen manufacture and testing.

Chapter 3 Good Practice Guide 103 29
Figure 11 Composite rod specimen with adhesively bonded composite end tabs (dimensions are in mm)
3.8 Design and Planning an Accelerated Test Programme In order to conduct an effective accelerated test programme, it is essential to spend time in designing and planning the test programme [23]. The more consideration given to this process the more likely that the outcome of the exercise will meet expectations. The process is iterative and will need to be repeated several times in order to establish a programme that will meet budget and technical requirements. The test programme needs to be suitably flexible in case of unexpected results or technical problems occurring. It may be necessary in some cases that test parameters will need to be changed during the test programme. Short-term tests at high stress levels and high temperatures are generally set-up first to check the procedure and to identify technical issues that may not have been apparent prior to testing. It is often possible to establish the timescale of the longer-term tests on the basis these short-term results. This is important where measurements need to be completed within a set period of time, as specified in a number of standards. This section identifies steps that need to be considered when designing, planning and managing a test programme [23]. • Define clearly the purpose and objectives of the test programme. • Specify the service life that needs to be predicted and the level of uncertainty in life
expectancy that is acceptable. • Identify critical degradation agents and levels (e.g. temperature, pressure, humidity
and chemical concentration) – often dependent on resources and time available. • Environmental and safety issues that need to be considered in relation to handling,
storage and disposal of chemicals. • Specimens and products to be exposed.

30 Good Practice Guide 103 Chapter 3
• Synergistic effects (e.g. humidity and temperature or pressure and water) – establish requirements and if conditions can be achieved. For example, it is difficult to achieve high temperatures and humidity (e.g. 80 °C/85% RH)
• Loading requirements and test parameters to be monitored (e.g. temperature, humidity, pH level, displacement, load, etc.).
• Detailed test conditions and specimen numbers to be tested per condition. • Environmental and monitoring equipment requirements – include a contingency plan
to allow for possible equipment failure. • Performance tests (destructive and non-destructive) to be performed on the
conditioned material. • Methods for analysing data and predictive model(s) for extrapolating short-term data
to service conditions. • Timing and sequencing of exposures. • Ensure equipment and labour costs and time agree with budget and available
timescale. • Identify specimen/product machining and preparation requirements. A key standard to consider when carrying out environmental testing is ISO 11403 “Acquisition and Presentation of Comparable Multi-Point Data – Environmental Influences on Properties” [64].

Stress Rupture
IN THIS CHAPTER
44
Static Fatigue Testing
» Tension
» Flexure

32 Good Practice Guide 103 Chapter 4
4.1 Introduction Testing materials under applied loads further accelerates the onset and accumulation of damage. For static fatigue testing, strain levels in excess of those normally experienced during service are applied to the test component. Although obviously apparent for temperature, an increase in chemical concentration or applied stress can also alter the mechanism of degradation. This section examines static fatigue testing. 4.2 Static Fatigue Testing Static fatigue tests are performed to assess the extension of materials or structures (e.g. bonded joints) under load to predict long-term behaviour or to assess the long-term strength of the system under load. The first requirement needs high precision extensometry to monitor extension and the tests must be performed under stable environmental conditions (temperature and humidity) to avoid artefacts in the measurement. This section addresses the requirements of static fatigue (or creep rupture) tests. Two approaches have been adopted for assessing the degree of degradation under combined static load and environment: • Rate of strength loss with time (i.e. residual strength): This approach determines
the time taken for the strength of the materials system to decline to a design stress limit, below which the joint is no longer considered safe. Specimens are removed at regular intervals to assess strength reduction.
• Time-to-failure: This approach attempts to determine the probable average life expectancy of a materials system at a prescribed stress level or to determine the percentage of failures that can be expected to occur within a given exposure period.
Screw-jack test machines Self-stressing tubes
Figure 12 Tensile creep fixtures

Chapter 4 Good Practice Guide 103 33
Static fatigue tests could, in theory, be performed using any of the loading options outlined below, but for highest accuracy options (i) or (ii) would be preferred. (i) Mechanical (servo-hydraulic or motor driven) test machines; (ii) Dead-weight and lever creep testing machines; (iii) A screw jack in series with a load cell (Figure 12); and (iv) Self-stressing fixture where specimens are placed in either a tube equipped with a pre-
calibrated spring system (Figure 12) for loading specimens or a circular ring. The use of a mechanical test machine is not an economic option in most cases. A bank of small creep machines can be assembled at a considerably lower cost compared with the capital outlay involved with purchasing and operating such machines. Self-stressing fixtures (Figure 12), which are light and economic to produce and maintain, are particularly suited for field trials and for large batch testing. Care should be taken to ensure that the thermal mass of the tubes does not exceed the capacity of the conditioning cabinet, thus preventing correct maintenance of humidity and temperature. Self-stressing tubes have been used to successfully test many different types of specimen, e.g. small single-lap and T-peel adhesive joints. Testing consists of placing specimens in a tube equipped with a pre-calibrated spring system for loading the specimens. The spring system can be compressed and locked in place to apply the required load with the spring stiffness determining the load range. The amount of load is determined by measurement of the spring compression. The fixture shown in Figure 12 is capable of loading a series of 3-6 specimens at a time. The specimens are bolted together with either stainless steel or polyamide bolts. The tubes should be suspended vertically within the environmental cabinet to ensure uniform exposure of the test specimens. The stress tubes need to be inspected at frequent intervals to check on the condition of the test specimens (i.e. failed or intact). Failed joints are replaced with spacers and the remaining specimens re-stressed. The failure times are measured at which the first three specimens fail. When the third specimen fails, the remaining specimens are removed from the loading tube and tested to failure to determine residual strength. The average lifetime of the failed specimens and the residual strength of the remaining specimens should be recorded. The large uncertainty associated with time-to-failure measurements, especially at the high stress levels will require either electromechanical or optical devices to monitor load or deformation in order to accurately determine time-to-failure. Specimens loaded by springs can often be in an unstressed state for a considerable period of time (overnight or weekends) before the failed joint is replaced (by a “dummy” specimen) and the loading train is re-tensioned. There is also a tendency for surviving specimens to be damaged in the re-stressing process with the probability of occurrence increasing at high stresses. Creep/relaxation histories of specimens will be different due to the replacement of failed specimens and subsequent re-loading. This contributes further to the uncertainty of creep rupture data. For long term tests over months or years, this effect will probably be minimal. For short duration tests (i.e. static loads close to the maximum load at failure) load relaxation occurs and it is therefore necessary to continuously adjust the manual screw jack on the creep frame or the loading spring on the self-stressing tube in order to maintain a constant load. The use of controlled mechanical test frames avoids this problem. Manually operated systems are best suited to long-term testing where loads are relatively low and load relaxation is minimal.
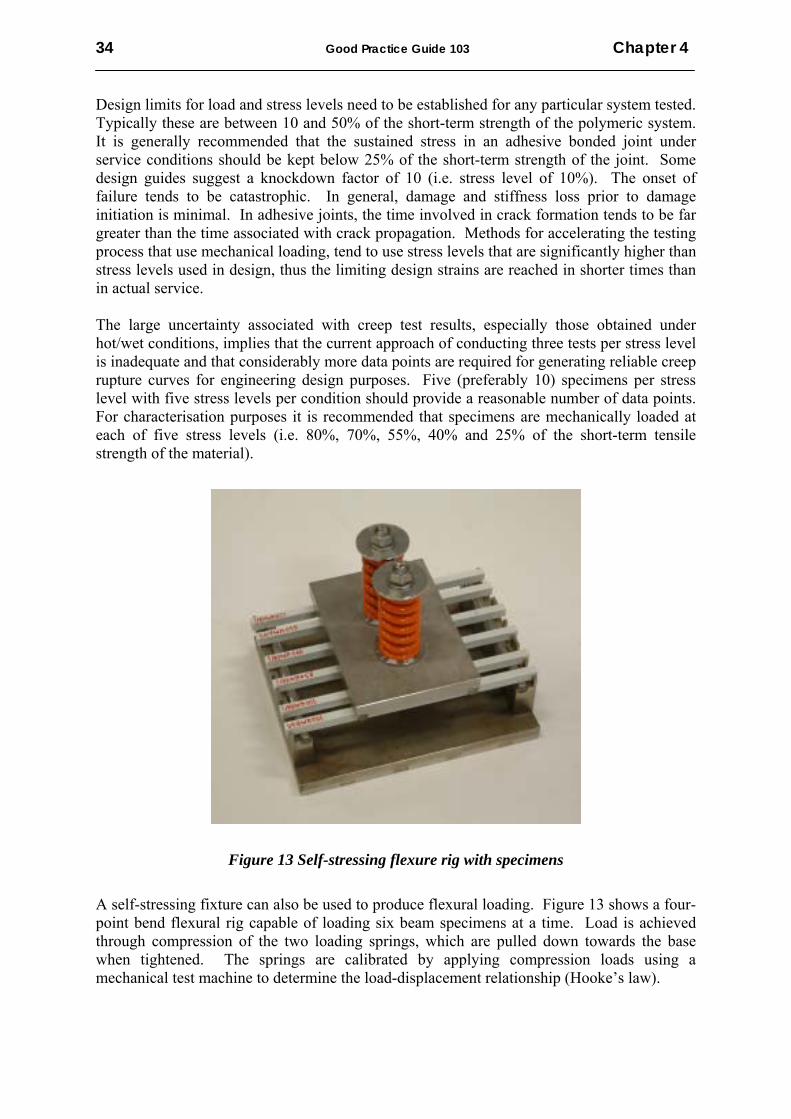
34 Good Practice Guide 103 Chapter 4
Design limits for load and stress levels need to be established for any particular system tested. Typically these are between 10 and 50% of the short-term strength of the polymeric system. It is generally recommended that the sustained stress in an adhesive bonded joint under service conditions should be kept below 25% of the short-term strength of the joint. Some design guides suggest a knockdown factor of 10 (i.e. stress level of 10%). The onset of failure tends to be catastrophic. In general, damage and stiffness loss prior to damage initiation is minimal. In adhesive joints, the time involved in crack formation tends to be far greater than the time associated with crack propagation. Methods for accelerating the testing process that use mechanical loading, tend to use stress levels that are significantly higher than stress levels used in design, thus the limiting design strains are reached in shorter times than in actual service. The large uncertainty associated with creep test results, especially those obtained under hot/wet conditions, implies that the current approach of conducting three tests per stress level is inadequate and that considerably more data points are required for generating reliable creep rupture curves for engineering design purposes. Five (preferably 10) specimens per stress level with five stress levels per condition should provide a reasonable number of data points. For characterisation purposes it is recommended that specimens are mechanically loaded at each of five stress levels (i.e. 80%, 70%, 55%, 40% and 25% of the short-term tensile strength of the material).
Figure 13 Self-stressing flexure rig with specimens A self-stressing fixture can also be used to produce flexural loading. Figure 13 shows a four-point bend flexural rig capable of loading six beam specimens at a time. Load is achieved through compression of the two loading springs, which are pulled down towards the base when tightened. The springs are calibrated by applying compression loads using a mechanical test machine to determine the load-displacement relationship (Hooke’s law).

Chapter 4 Good Practice Guide 103 35
It is important that three, or more specimens are loaded at any one time to ensure balanced loading. The spring stiffness and strength needs to be selected according to the loads required. It should be noted that the load is equally shared between the two springs, which should have identical mechanical properties and dimensions. The load (spring displacement) needs to be continuously monitored and adjusted to maintain constant load. Load relaxation occurs at all stress levels with relaxation increasing with temperature and stress. Special attention is required at the start and end of testing. There is bedding in period at the start of the test and specimens tend to creep rapidly at the end of their life. When a specimen fails the load is rapidly redistributed to the remaining specimens, which can cause the surviving specimens to fail. It is advisable to stop the test and replace all the specimens rather than replace the failed specimen and re-load the fixture.

Environmental Stress Cracking (ESC) of Plastics
IN THIS CHAPTER
55
Bent Strip Tests
Bent Strip for Flexible Materials
Ball and Pin Impression
Constant Tensile Deformation
Slow Strain Rate Testing
Constant Load Tests
C-Ring Tests
Strain Hardening Tests

Chapter 5 Good Practice Guide 103 37
5.1 Introduction Environmental Stress Crack (ESC) is one of the main causes of failure in polymeric materials accounting for approximately 30% of all in-service failures. Assessing whether a particular polymer/environment combination results in ESC is therefore essential in determining a products long-term properties. The evaluation of ESC in thermoplastics is covered by a number of national and international standards [19]. These test methods can be divided roughly into two groups those that are based on an applied deformation and those based on applied load. The main international standards for testing ESC resistance are: Constant Deformation Tests • Bent strip [65] • Bent strip test for flexible materials [66] • Ball and pin impression [67] • Constant tensile deformation [68] • Slow strain rate testing [69] Constant Load Tests • Constant tensile stress [70-71] • C-ring tests [72-73] The following section gives a brief overview of the ESC test methods that have been standardised. More detailed information about these and other non-standard test methods can be obtained from NPL Technical Review No.3 [19]. 5.2 Bent Strip Tests The bent strip test (ISO 22088-3) [65] involves clamping the test specimen to a semicircular former to apply a known strain to the specimen. The radius of curvature of the former can be varied to induce different levels of stress in the specimen. This strain ε may be calculated using the following equation:
100dr2
d(%) ×+
=ε (10)
where d is the thickness of the specimen and r is the radius of the former. Once the specimen has been strained it is brought quickly in contact with the chemical environment. After an agreed time the specimen is removed from the apparatus and either visually inspected for crazing or mechanically tested to assess residual strength. This test is most commonly used for assessing the ESC susceptibility of amorphous polymers. It is not suitable for semi-crystalline polymers, which are susceptible to rapid stress relaxation, as the stress applied to the specimen will decrease during the test.
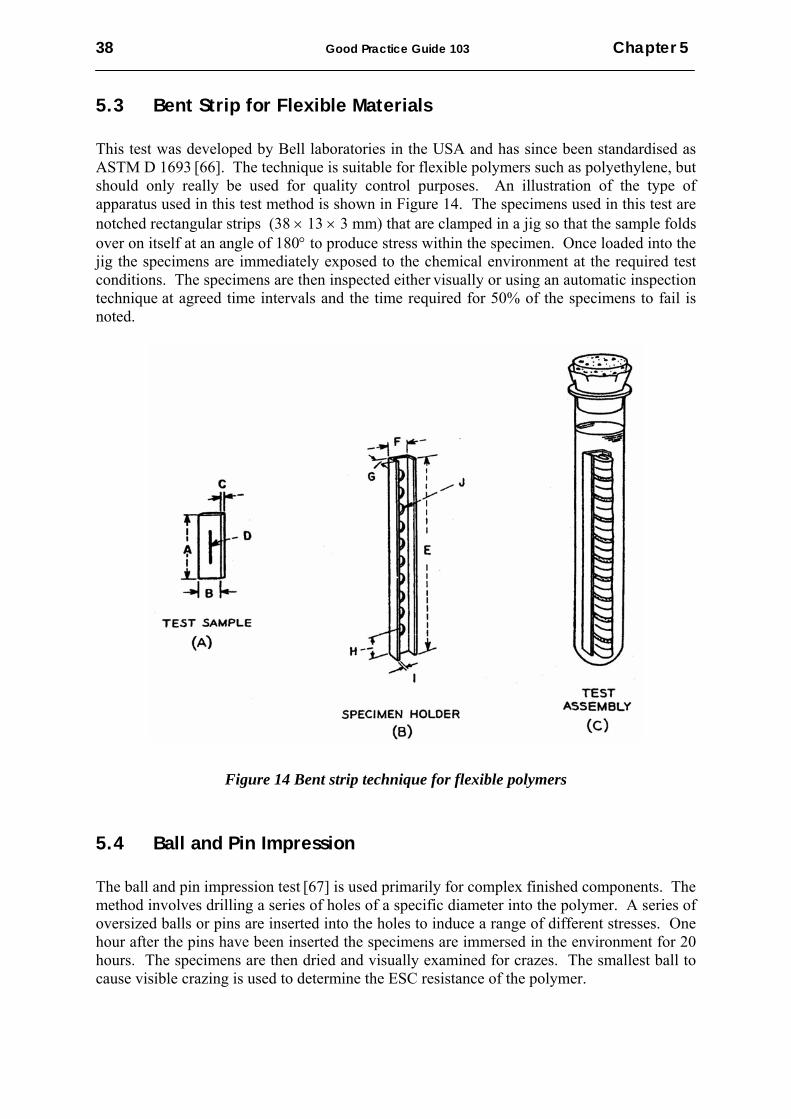
38 Good Practice Guide 103 Chapter 5
5.3 Bent Strip for Flexible Materials This test was developed by Bell laboratories in the USA and has since been standardised as ASTM D 1693 [66]. The technique is suitable for flexible polymers such as polyethylene, but should only really be used for quality control purposes. An illustration of the type of apparatus used in this test method is shown in Figure 14. The specimens used in this test are notched rectangular strips (38 × 13 × 3 mm) that are clamped in a jig so that the sample folds over on itself at an angle of 180° to produce stress within the specimen. Once loaded into the jig the specimens are immediately exposed to the chemical environment at the required test conditions. The specimens are then inspected either visually or using an automatic inspection technique at agreed time intervals and the time required for 50% of the specimens to fail is noted.
Figure 14 Bent strip technique for flexible polymers 5.4 Ball and Pin Impression The ball and pin impression test [67] is used primarily for complex finished components. The method involves drilling a series of holes of a specific diameter into the polymer. A series of oversized balls or pins are inserted into the holes to induce a range of different stresses. One hour after the pins have been inserted the specimens are immersed in the environment for 20 hours. The specimens are then dried and visually examined for crazes. The smallest ball to cause visible crazing is used to determine the ESC resistance of the polymer.
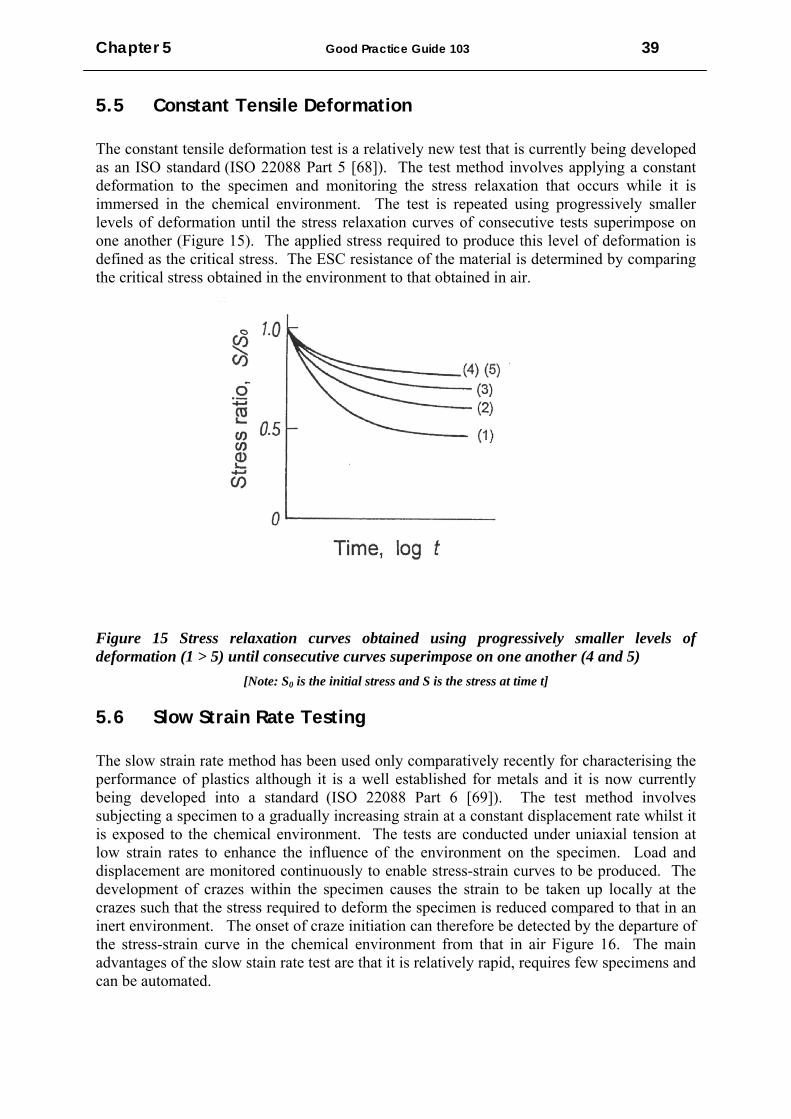
Chapter 5 Good Practice Guide 103 39
5.5 Constant Tensile Deformation The constant tensile deformation test is a relatively new test that is currently being developed as an ISO standard (ISO 22088 Part 5 [68]). The test method involves applying a constant deformation to the specimen and monitoring the stress relaxation that occurs while it is immersed in the chemical environment. The test is repeated using progressively smaller levels of deformation until the stress relaxation curves of consecutive tests superimpose on one another (Figure 15). The applied stress required to produce this level of deformation is defined as the critical stress. The ESC resistance of the material is determined by comparing the critical stress obtained in the environment to that obtained in air.
Figure 15 Stress relaxation curves obtained using progressively smaller levels of deformation (1 > 5) until consecutive curves superimpose on one another (4 and 5)
[Note: S0 is the initial stress and S is the stress at time t] 5.6 Slow Strain Rate Testing The slow strain rate method has been used only comparatively recently for characterising the performance of plastics although it is a well established for metals and it is now currently being developed into a standard (ISO 22088 Part 6 [69]). The test method involves subjecting a specimen to a gradually increasing strain at a constant displacement rate whilst it is exposed to the chemical environment. The tests are conducted under uniaxial tension at low strain rates to enhance the influence of the environment on the specimen. Load and displacement are monitored continuously to enable stress-strain curves to be produced. The development of crazes within the specimen causes the strain to be taken up locally at the crazes such that the stress required to deform the specimen is reduced compared to that in an inert environment. The onset of craze initiation can therefore be detected by the departure of the stress-strain curve in the chemical environment from that in air Figure 16. The main advantages of the slow stain rate test are that it is relatively rapid, requires few specimens and can be automated.

40 Good Practice Guide 103 Chapter 5
0.00 0.01 0.02 0.03 0.04 0.050
10
20
30
40
50
60
Departure
Strain
Stre
ss (M
Pa)
Air Test Medium
Figure 16 Typical stress-strain plot showing the difference in stress/strain profile for material exposed in air and in the test medium
5.7 Constant Load Tests The distinctive feature of this test is that a constant load is applied to the specimens, thereby avoiding the problem of stress relaxation that is found in the constant strain test methods [70]. An illustration of the type of apparatus used in this test method is shown in Figure 17. The technique involves subjecting the specimen under investigation to a constant tensile stress at a stress below the tensile yield stress of the polymer. This is usually achieved using a dead weight that is suspended from one end of the specimen, while the specimen is immersed in a cell containing the stress-cracking agent (Figure 18). The specimen is inspected at regular intervals to establish the onset of crazing. The time required for crazes/cracks to appear after the specimen has been exposed, or the threshold stress below which no crazes appear in a specific time period (typically 1000 hours) can be used as a measure of the ESC resistance. Polyethylenes and polypropylenes can also be examined using constant load tests, however due to generally good ESC resistance a more severe test is required. This is achieved by cutting sharp notches on all four sides of the tensile specimen as shown in Figure 19. The procedure used to conduct the tests is similar to that used in the conventional load tests. This tests method is known as the full notch creep test [71]

Chapter 5 Good Practice Guide 103 41
Figure 17 Illustration of typical apparatus used for a constant load test
Figure 18 Typical environmental cell used for the constant load test

42 Good Practice Guide 103 Chapter 5
w overall length, minimum: 6 ± 0.2 mm
b width at tapered ends: 6 mm ± 0.2 mm
l length of specimen: 90 ± 0.2 mm
d notch depth: 1 ± 0.1 mm
Figure 19 Test specimens used in the full notch creep test The full notch test shows differences in the ESC resistance, but can be misleading if creep tests are not conducted for a sufficient length of time (up to 1 year). Figure 20 compares the time to failure of three grades of linear low-density polyethylene (LLDPE) in which there is a crossover point at approximately 1,000 hrs.
Figure 20 Time to failure of three grades of LLDPE full notch creep specimens
w
b
d
l
Notch
Material
Notch
9
10
11
12
13
14
15
16
17
1 10 100 1000 10000Time (hours)
Stre
ss (M
Pa)
LLDPE 1
LLDPE 2
LLDPE 3

Chapter 5 Good Practice Guide 103 43
5.8 C-Ring Tests C-ring specimens are often used for the testing of tubing and pipes, and have been standardised for the testing of polyethylene pipe in ASTM F 1248 [72]. Typical apparatus for testing C-ring specimens is shown in Figure 21. Circumferential stress is of principle interest and this stress varies around the circumference of the C-ring from zero at each bolthole to a maximum at the outer surface of the middle of the arc opposite the stressing bolt. C-rings can also be stressed in the reverse direction by spreading the ring and creating a tensile stress on the inside surface. An almost constant load can be developed on the C-ring specimen by placing a calibrated spring on the loading bolt. This enables the C-ring to be self-loading particularly important for monitoring degradation in inaccessible places as they can be used as in-situ test coupons.
Figure 21 C-ring test methods for assess ESC in pipe-sections
5.9 Strain Hardening Tests An alternative approach that has been developed for testing the ESC resistance of polyethylenes is to relate the ESC resistance to the creep rate deceleration of drawn polyethylene samples [74-77]. In this approach, it is assumed that the critical step in the ESC of semi-crystalline polymers is the creep of the fibrils. Fibrillar creep is therefore determined by simulating the structure of a fibril using a tensile specimen drawn to its natural draw-ratio. Using this technique Cawood and Rose et al [76-77] showed that for polyethylenes there is a direct relationship between the creep rate deceleration and ESC resistance. Measurement of creep is, however, a slow process and the technique has therefore not been widely adopted. However, it has been shown recently [78] that the average strain-hardening modulus Gp of high-density polyethylene (HDPE) correlates extremely well with the ESC resistance of the polymer. Typical data obtained from this new strain hardening technique is shown in Figure 22. The strain hardening modulus is given by the average gradient of the completely drawn specimen (draw ratios > 9). In this example, it can clearly be seen that the strain hardening modulus of HDPE 1 is significantly higher than HDPE 2, indicating that HDPE 1 is more resistance than HDPE 2 to ESC. The advantage of using strain hardening to determine ESC resistance is that the data required may be obtained from simple plots of true-stress again draw-ratio, offering a relatively easy and significantly quicker method of assessing the relative ESC susceptibility of different polyethylene grades.

44 Good Practice Guide 103 Chapter 5
Figure 22 True stress – draw ratio curves used to determine the relative ESC resistance of two polyethylene grades in the strain hardening technique
0 2 4 6 8 10 12 14 16 18 200
50
100
150
200
250
300
350
HDPE 1 HDPE 2
True
stre
ss (M
Pa)
Draw ratio
Accelerated Weathering
IN THIS CHAPTER
66
Artificial Weathering Apparatus
» Ultraviolet Radiation
» UV Lamps
» Salt Spray Cabinets
» Test Chambers
» Specimen Mounting and handling
Accelerated Weathering Test Procedures
Performance Testing » Moisture Content
» Glass Transition Temperature (Tg)
» Barcol Hardness
» Gloss
» Spectral Reflectance (Colour)
» Flexural Properties
» Chemical Analysis

46 Good Practice Guide 103 Chapter 6
6.1 Introduction At present, there is no universally agreed performance based specification for accelerated weathering procedures. Performance based specifications are being developed by a number of recognized standards bodies including BSI, ISO, NACE and customer end-users (e.g. Norsok). The principle aim of these specifications is for the material system to meet a set of pre-determined laboratory performance based requirements that vary depending on the service requirements. Key to the success of performance testing is the ability of being able to correlate laboratory test data with service performance. It is important to note that there is no ‘foolproof’ test that will provide an accurate prediction of service performance and life expectancy. The predominant factors in climatic exposure are humidity, temperature and solar (ultraviolet) irradiation. The severity of these factors will depend on geographical location, and need to be taken into account when designing with these materials. There is no accelerated weathering procedure that can accommodate the wide range of climatic conditions experienced geographically (e.g. Florida, Arizona, Persian Gulf and North Atlantic). Accelerated weathering procedures [27, 79] generally involve cyclic exposure to a combination of salt spray, elevated and/or sub-zero temperatures, and ultraviolet (UV) radiation. The environmentally conditioned material is subjected to a series of tests (i.e. performance testing) to determine the degree of degradation (i.e. chemical resistance) as a function of exposure time. The criteria used to assess chemical resistance include mechanical properties, such as hardness, flexural modulus and strength, dimensional stability (i.e. swelling), weight change and appearance (i.e. colour, gloss retention, crazing, fibre prominence, blister formation, loss of surface resin, etc) [80]. Whilst mechanical properties and dimensional stability are quantitatively measurable quantities, a number of the appearance criteria tend to be assessed in qualitative terms, and hence the question arises as to the reliability of the assessment. A major challenge is to ensure that performance testing for determination of chemical resistance (level of degradation) is based upon a set of “quantitatively” measurable criteria; avoiding qualitative or subjective assessment. This section provides guidance on performance testing and technical requirements relating to accelerated weathering of FRPs. 6.2 Artificial Weathering Apparatus As the ultimate aim of accelerated ageing is to improve lifetime prediction under service conditions, the most appropriate conditions are those that match the service environment exactly. These are most easily obtained by naturally exposing specimens at outdoor exposure sites. The problem with this approach is that the exposure period required would have to be at least as long as the life-expectance of the product. Natural weathering is therefore normally accelerated by exposure to climatic conditions that are more severe than those that are expected in service. For this purpose there are a number of established test sites in Saudi Arabia, Australia and the southern states of the USA [81]. Arizona is popular for exposure in hot dry climates and Florida for hot humid climates. Acceleration can also be achieved by the use of Fresnel mirrors [81] that concentrate the sunlight directly onto the specimen.

Chapter 6 Good Practice Guide 103 47
Standard test procedures for the weathering of polymers in natural daylight, glass-filtered daylight and concentrated sunlight using Fresnel mirrors are given in ISO 877 [82], ASTM D 1435 [83], ASTM D 4364-02 [84] and ASTM G 24-05 [85]. Artificial weathering involves exposing test specimens to an artificial light source in a cabinet in which the temperature, humidity and water spray are controlled. The advantage of artificial weathering is that it is easier to accelerate the testing as all of the exposure conditions are controlled. The problem with this approach is determining synergistic effects (interactions) between the different parameters in the weathering process. The key parameter in all accelerated weathering apparatus is the light source, which should ideally simulate solar radiation. The main types of artificial light sources that are used are: carbon-arc, xenon-arc and fluorescent tube [25]. UV light can be divided into three groups of wavelengths as described below: • UV-A (315 – 400 nm) - least harmful to polymers, forming 6% of the total solar
radiation reaching earth. • UVB (280-315 nm) - more damaging to polymers, forming 0.1% of the total solar
radiation reaching earth. • UV-C (<280 nm) – Most harmful to polymers, but is filtered out by the earth’s
atmosphere. UV radiation below 350 nm is absorbed by window glass, thus eliminating UV-B radiation indoors.
Figure 23 Spectrum of carbon-arc lamp (continuous line), carbon-arc lamp with a Cordex D filter (dashed) and noonday Chicago sunlight (dotted) [25] Carbon-Arc: A typical spectrum from a carbon-arc consists of a series of line emissions that are superimposed on to a continuous background (Figure 23). The spectrum is not a good match for the solar radiation, particularly at the lower wavelengths (<350 nm) [25]. The high energy, short wavelengths lead to such intensive damage that it bears little relationship to any natural weathering process. In spite of these deficiencies carbon-arc lamps are still in commercial use today and their use for plastics is standardised in ISO 4892:Part 4 [86] and ASTM D 1499-99 [87].
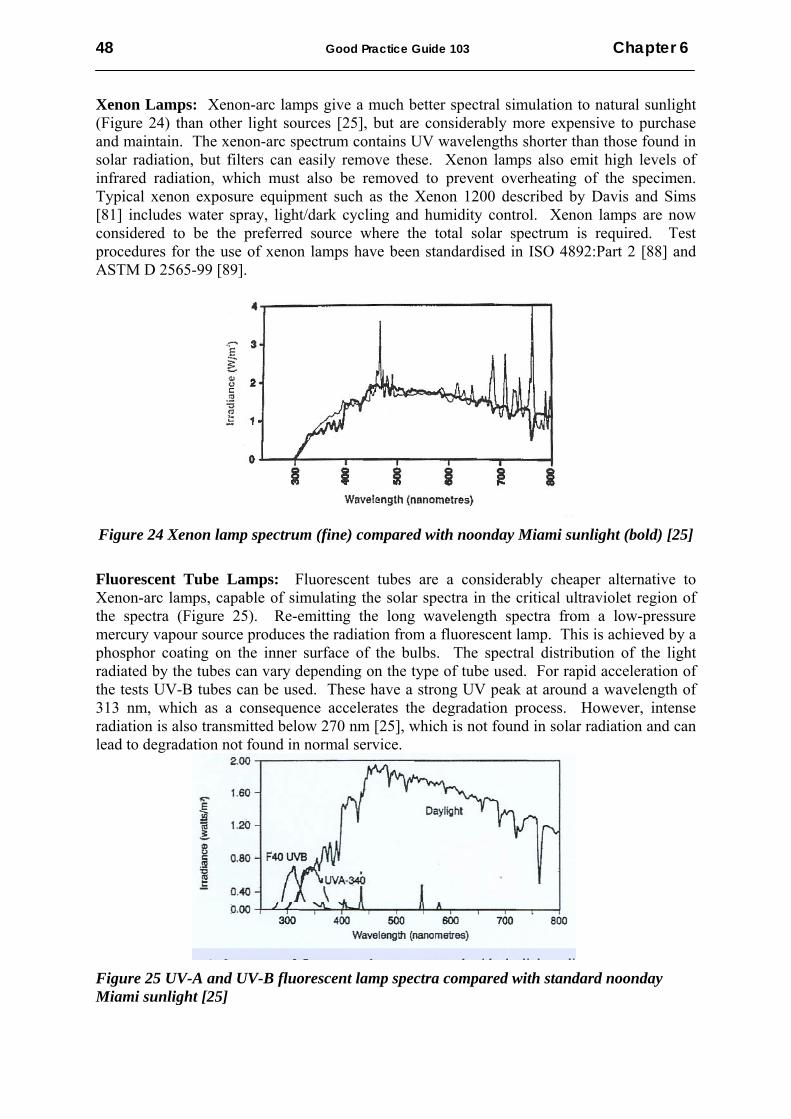
48 Good Practice Guide 103 Chapter 6
Xenon Lamps: Xenon-arc lamps give a much better spectral simulation to natural sunlight (Figure 24) than other light sources [25], but are considerably more expensive to purchase and maintain. The xenon-arc spectrum contains UV wavelengths shorter than those found in solar radiation, but filters can easily remove these. Xenon lamps also emit high levels of infrared radiation, which must also be removed to prevent overheating of the specimen. Typical xenon exposure equipment such as the Xenon 1200 described by Davis and Sims [81] includes water spray, light/dark cycling and humidity control. Xenon lamps are now considered to be the preferred source where the total solar spectrum is required. Test procedures for the use of xenon lamps have been standardised in ISO 4892:Part 2 [88] and ASTM D 2565-99 [89].
Figure 24 Xenon lamp spectrum (fine) compared with noonday Miami sunlight (bold) [25] Fluorescent Tube Lamps: Fluorescent tubes are a considerably cheaper alternative to Xenon-arc lamps, capable of simulating the solar spectra in the critical ultraviolet region of the spectra (Figure 25). Re-emitting the long wavelength spectra from a low-pressure mercury vapour source produces the radiation from a fluorescent lamp. This is achieved by a phosphor coating on the inner surface of the bulbs. The spectral distribution of the light radiated by the tubes can vary depending on the type of tube used. For rapid acceleration of the tests UV-B tubes can be used. These have a strong UV peak at around a wavelength of 313 nm, which as a consequence accelerates the degradation process. However, intense radiation is also transmitted below 270 nm [25], which is not found in solar radiation and can lead to degradation not found in normal service.
Figure 25 UV-A and UV-B fluorescent lamp spectra compared with standard noonday Miami sunlight [25]

Chapter 6 Good Practice Guide 103 49
UV-A fluorescent lamps emit radiation at a much higher wavelength producing spectra that are closer to that of solar radiation in the UV region. UVA-340 lamps manufactured by Q-Panel have a UV spectrum (295-350 nm) that is particularly close to that of solar radiation and these are frequently used in weathering studies. Outside the UV region (>350 nm) these lamps do not emit substantial levels of radiation. As most of the degradation processes in polymers occur in the UV region, this is not normally a problem. However, this characteristic does have implications for certain polymers. For example, substantial degradation occurs in nylon-6 at a wavelength of 365 nm that is not well represented by fluorescent tubes. Standard test procedures for the use of fluorescent tube are given in ISO 4892:Part 3 [90] and ASTM D 4329-99 [91]. Salt Spray Cabinets: Special cabinets are used for salt spray (and salt mist) exposure in which a spray of sodium chloride solution is produced at specified conditions. This method of conditioning was developed for determining corrosion resistance of metals for marine and offshore applications. The average salt spray output used is 1.6 ml/hour and the concentration of the salt solution being typically 50 ± 10 g/litre. Salt fog (5% NaCl) or artificial seawater as the electrolyte is used for simulating offshore conditions. The drying temperature frequently used 35 ± 2 °C. It is recommended that salt spray exposure be conducted in accordance to ISO 7253 [92]. Water used for the salt spray must meet the requirements of ISO 4892-1, clause 5.3 [93]. The chamber should have a spray system capable of directing an intermittent water spray onto both the front and back surfaces of the test specimens. The water spray must be uniformly distributed over the specimens. Weathering Chambers: The conditioning chamber should be constructed from corrosion resistant material (e.g. stainless steel). In addition to controlling irradiance, the test chamber should have controlled temperature, and if required controlled humidity. When required by the exposure used, the chamber should also include facilities for the provision of salt spray or the formation of condensation on the specimen surfaces, or for immersion of the specimens in water. Irradiance at any position in the area used for the specimen exposure shall be at least 80% of the maximum irradiance. For some materials of high reflectivity, periodic repositioning of specimens is recommended to ensure uniformity of exposures. Requirements and procedure for periodic repositioning of specimens is described in ISO 4892-1 [93]. If the lamp system (one or more lamp(s) is centrally positioned in the chamber, the effect of eccentricity of the lamp(s) on the uniformity of exposure may be reduced by using a rotating frame carrying the specimens or by repositioning or rotating the lamps. It is important that lamps that generate ozone should be isolated from the test specimens and the ozone vented directly to the outside of the building. Mounting Test Specimens: Specimens should be supported within the test chamber using an open holding frame, which can be adjusted to allow double-sided or single-sided exposure. A solid backing can be inserted into the holding frame for single-sided exposure. Support equipment needs to be constructed using corrosion resistant materials, such as stainless steel (not brass, copper or steel). Consideration needs to be given the spacing between the backing and the test specimen. Care needs to be taken to ensure that the holding frame does not introduce stresses into the test specimens. In order to simulate actual topside service conditions, only one surface should be exposed to salt spray and UV radiation.

50 Good Practice Guide 103 Chapter 6
Note: Identify each specimen by suitable indelible marking, avoiding areas to be used for subsequent testing, and produce a plan of test specimen positions. Trial all test equipment before carrying out conditioning of test specimens. This is to ensure that the test conditions are met and that all controlling and monitoring equipment are performing to specification. Plan any maintenance in advance to avoid disrupting the tests. Include additional specimens in contingency of unforeseen technical problems and for checks on test conditioning. If it is necessary to remove samples for periodic assessment, such as measuring colour change, avoid handling the exposed surfaces and return to the same position in the test chamber. 6.3 Accelerated Weathering Test Procedures Accelerated weathering procedures generally involve cyclic exposure to a combination of salt spray, condensation, elevated temperature and UV radiation. These standards tend to exclude the effect of sub-zero temperatures often experienced in practice or in external exposure testing. It is recommended that when selecting a procedure for accelerated weathering, consideration should be given to including a sub-zero temperature excursion. A freeze cycle (-20 °C for 24 hrs) has been included in ISO 20340 [94] in an attempt to produce more realistic results. The inclusion of the freeze cycle has been shown to produce results much more typical of those seen in practice or external exposure testing [79]. Test procedures excluding a freeze cycle give results not typical of those seen in service. This may go towards explaining the discrepancy between pre-qualification testing and in-service performance. The exposure cycle used in the procedure given in ISO 20340 consists of the following stages: • 72 hrs exposure to UV radiation and water in accordance to ISO 11507 [95] and
alternating between: 4 hrs exposure to UV (UVA 340 nm) at 60 °C; and 4 hrs exposure to moisture condensation at 50 °C
• 72 hrs exposure to salt spray at 35 °C in accordance with ISO 7253 [92] • 24 hrs exposure at -20 °C 6.4 Performance Testing The environmentally conditioned material will be subjected to a series of tests (i.e. performance testing) to determine the degree of degradation (i.e. chemical resistance) as a function of exposure time. The criteria used to assess chemical resistance include mechanical properties, such as hardness, flexural modulus and strength, dimensional stability (i.e. swelling), weight change and appearance (i.e. colour, gloss, crazing, fibre prominence, blister formation, loss of surface resin, etc) [96].
Chapter 6 Good Practice Guide 103 51
Whilst mechanical properties and dimensional stability are quantitatively measurable quantities, a number of the appearance criteria tend to be assessed in qualitative terms, and hence the question arises as to the reliability of the assessment. A major challenge is to ensure that performance testing for determination of chemical resistance (level of degradation) is based upon a set of “quantitatively” measurable criteria; avoiding qualitative or subjective assessment. This section provides guidance on performance testing using data generated from an accelerated weathering study [97] in which glass/polyester pultruded rods were conditioned in accordance with ISO 20340 [94] for a period of six months. Mechanical and physical measurements were conducted on the GRP rods after 0, 1, 2, 3, 4 and 6 months exposure (carried out by in order to assess surface and bulk property degradation. Surface and bulk properties measured include: • Moisture content (wt %) • Glass transition temperature (Tg) • Barcol hardness • Gloss • Spectral reflectance (colour) • Flexural properties Moisture Content (wt%) of test specimens should be measured before and after artificially weathering. Prior to conditioning, the material should be dried to a constant weight to provide a zero datum. The drying temperature is typically 50 °C for polyester and vinyl ester based composites, and 70 °C for epoxy based systems. The moisture content of glass and carbon FRPs exposed to standard laboratory conditions is typically 0.2 wt%. In the case of the glass/polyester, this is equivalent to approximately one month of artificially weathering (see Table 1). The moisture content in accelerated weathered FRPs will reach an equilibrium level (possibly within a few months). Moisture measurement should be conducted in accordance of ISO 62 [54]. Glass Transition Temperature (Tg): An increase in moisture content will generally result in a reduction in Tg. The results presented in Table 1, however, indicate that the moisture content in the glass/polyester remains relatively unaffected by an increase in moisture content. This is probably because the moisture is mainly concentrated in the outer few layers of the composite. Although there may be no changes in Tg, this does not exclude the possibility of material degradation. Tg can be measured using dynamic mechanical analysis (DMA) [98-100]. The recommended DMA standard is ISO 6721 [98].
Table 1 Moisture Content and Glass Transition Temperature (Tg) Material Moisture Content
(%) Glass Transition Temperature
(°C) As received 0.23 ± 0.01 94.70 Dry 0 97.01 Exposure (Months) 1 2 3 4 6
0.27 ± 0.02 0.34 ± 0.04 0.56 ± 0.04 0.39 ± 0.10 0.54 ± 0.02
92.20 95.51 92.26 95.20 96.88
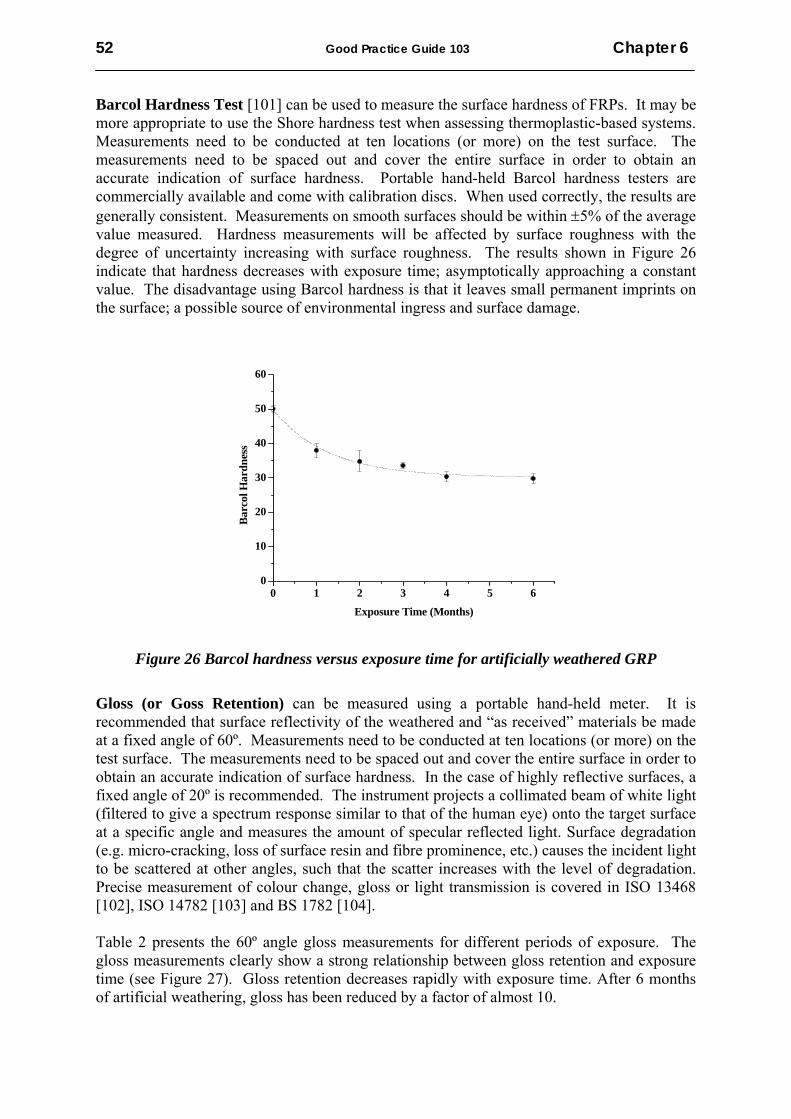
52 Good Practice Guide 103 Chapter 6
Barcol Hardness Test [101] can be used to measure the surface hardness of FRPs. It may be more appropriate to use the Shore hardness test when assessing thermoplastic-based systems. Measurements need to be conducted at ten locations (or more) on the test surface. The measurements need to be spaced out and cover the entire surface in order to obtain an accurate indication of surface hardness. Portable hand-held Barcol hardness testers are commercially available and come with calibration discs. When used correctly, the results are generally consistent. Measurements on smooth surfaces should be within ±5% of the average value measured. Hardness measurements will be affected by surface roughness with the degree of uncertainty increasing with surface roughness. The results shown in Figure 26 indicate that hardness decreases with exposure time; asymptotically approaching a constant value. The disadvantage using Barcol hardness is that it leaves small permanent imprints on the surface; a possible source of environmental ingress and surface damage.
Figure 26 Barcol hardness versus exposure time for artificially weathered GRP
Gloss (or Goss Retention) can be measured using a portable hand-held meter. It is recommended that surface reflectivity of the weathered and “as received” materials be made at a fixed angle of 60º. Measurements need to be conducted at ten locations (or more) on the test surface. The measurements need to be spaced out and cover the entire surface in order to obtain an accurate indication of surface hardness. In the case of highly reflective surfaces, a fixed angle of 20º is recommended. The instrument projects a collimated beam of white light (filtered to give a spectrum response similar to that of the human eye) onto the target surface at a specific angle and measures the amount of specular reflected light. Surface degradation (e.g. micro-cracking, loss of surface resin and fibre prominence, etc.) causes the incident light to be scattered at other angles, such that the scatter increases with the level of degradation. Precise measurement of colour change, gloss or light transmission is covered in ISO 13468 [102], ISO 14782 [103] and BS 1782 [104]. Table 2 presents the 60º angle gloss measurements for different periods of exposure. The gloss measurements clearly show a strong relationship between gloss retention and exposure time (see Figure 27). Gloss retention decreases rapidly with exposure time. After 6 months of artificial weathering, gloss has been reduced by a factor of almost 10.
0 1 2 3 4 5 60
10
20
30
40
50
60
Barc
ol H
ardn
ess
Exposure Time (Months)

Chapter 6 Good Practice Guide 103 53
Table 2 Gloss Measurements for Artificially Weathered Glass/Polyester
Material Gloss Measurement
As received 22.1 ± 0.1 Exposure (Months) 1 2 3 4 6
17.8 ± 0.4 9.7 ± 0.1 7.1 ± 0.3 3.5 ± 0.3 2.6 ± 0.1
Figure 27 Gloss retention versus exposure time (60º angle measurements)
Colour change is frequently encountered when a polymeric material has been exposed to UV light for extensive periods of time. The discolouration can be accurately measured using spectrophotometry (see [102-105]). Portable hand-held colour meters are also available for field inspection. It is important when using these devices in the field that natural light does not impinge on the measurements. The spectral reflectance should be measured for both the conditioned and “as-received” material. The spectrophotometer exposes a 10 mm diameter circular area on the surface to a light source with a daylight colour temperature and compares the percentage reflectance within the visible spectrum (360 - 750 nm wavelength) to that of reference white and black colour tiles [106]. The reflectance of the sample is measured at 1 nm wavelength intervals over the spectral range 380 nm to 780 nm. Two sets of measurements were made on separate occasions on the test specimens and the average recorded. The degree of reflectance decreases with exposure time (see Figure 28), mirroring the changes in gloss measurement. Figure 29 shows a normalised plot of total reflectance over the spectral range 380 nm to 780 nm. The total reflectance data for each specimen (i.e. exposure time) was normalised with respect to the total reflectance data obtained for the unconditioned material.
0 1 2 3 4 5 60
20
40
60
80
100
120
Glo
ss (%
)
Exposure Time (Months)

54 Good Practice Guide 103 Chapter 6
Discolouration of GRP rods 0 (left), 1, 2, 3 and 6 months Spectral reflectance versus exposure time
Figure 28 Colour change in glass/polyester due to artificial weathering The discolouration (i.e. yellowing) observed with exposure time as shown in Figure 28 is due to a reduction in spectral reflectance over the spectral range 380 nm to 600 nm (i.e. blue component). The discolouration can be mainly attributed to exposure to UV radiation (UVA 340 nm). Note: Visual inspection can provide considerable information as to the state of a materials surface (i.e. colour changes, crazing and resin loss).
Figure 29 Total reflectance of artificially weathered glass/polyester rods (normalised with respect to the “as-received” material) Flexure Properties: Flexural modulus is relatively insensitive to physical and chemical changes that can occur at the surface or within the bulk of the material, and hence is a poor indicator of material degradation. In contrast, flexural strength is sensitive to material degradation.
350 400 450 500 550 600 650 700 750 800
10
20
30
40
50
60
70
80
Unaged 1 month 2 months 3 months 4 months 6 months
increasing exposure time
Refle
ctan
ce (%
)
Wavelength (nm)
0 1 2 3 4 5 60
20
40
60
80
100
120
Nor
mal
ised
Tot
al R
efle
ctan
ce (%
)
Exposure Time (Months)
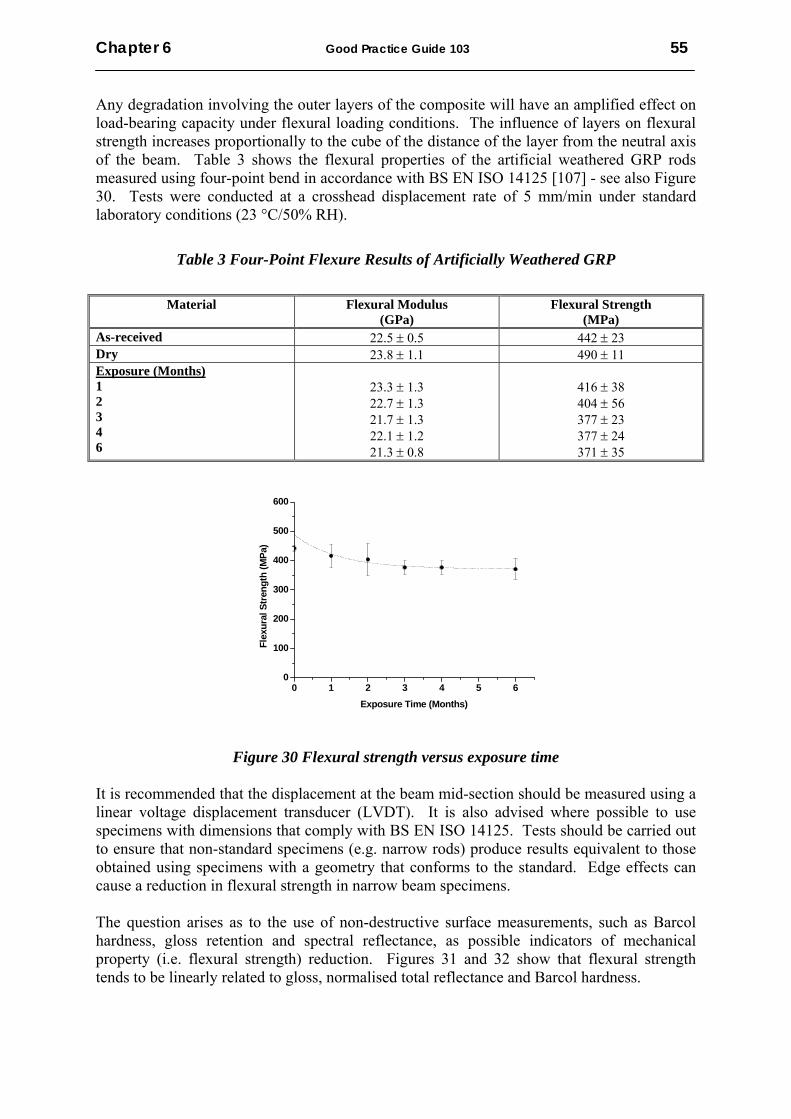
Chapter 6 Good Practice Guide 103 55
Any degradation involving the outer layers of the composite will have an amplified effect on load-bearing capacity under flexural loading conditions. The influence of layers on flexural strength increases proportionally to the cube of the distance of the layer from the neutral axis of the beam. Table 3 shows the flexural properties of the artificial weathered GRP rods measured using four-point bend in accordance with BS EN ISO 14125 [107] - see also Figure 30. Tests were conducted at a crosshead displacement rate of 5 mm/min under standard laboratory conditions (23 °C/50% RH).
Table 3 Four-Point Flexure Results of Artificially Weathered GRP
Material Flexural Modulus (GPa)
Flexural Strength (MPa)
As-received 22.5 ± 0.5 442 ± 23 Dry 23.8 ± 1.1 490 ± 11 Exposure (Months) 1 2 3 4 6
23.3 ± 1.3 22.7 ± 1.3 21.7 ± 1.3 22.1 ± 1.2 21.3 ± 0.8
416 ± 38 404 ± 56 377 ± 23 377 ± 24 371 ± 35
Figure 30 Flexural strength versus exposure time
It is recommended that the displacement at the beam mid-section should be measured using a linear voltage displacement transducer (LVDT). It is also advised where possible to use specimens with dimensions that comply with BS EN ISO 14125. Tests should be carried out to ensure that non-standard specimens (e.g. narrow rods) produce results equivalent to those obtained using specimens with a geometry that conforms to the standard. Edge effects can cause a reduction in flexural strength in narrow beam specimens. The question arises as to the use of non-destructive surface measurements, such as Barcol hardness, gloss retention and spectral reflectance, as possible indicators of mechanical property (i.e. flexural strength) reduction. Figures 31 and 32 show that flexural strength tends to be linearly related to gloss, normalised total reflectance and Barcol hardness.
0 1 2 3 4 5 60
100
200
300
400
500
600
Flex
ural
Str
engt
h (M
Pa)
Exposure Time (Months)

56 Good Practice Guide 103 Chapter 6
The curves relating to surface reflectance incorporate flexural strength and reflectance data for the “as-received” material and not the “dry” material. Spectral reflectance (i.e. colorimetry) measurements are intrinsically more accurate than specular (gloss) measurements. The results clearly demonstrate that suitable non-invasive test methods are available that can provide reliable and accurate quantitative data relating the degree of surface degradation to mechanical performance. These test methods make it possible to produce measurable criteria for performance testing for determination of chemical resistance of composite materials. Surface hardness and reflectance measurements could possibly be used to monitor the detrimental effects of service environments on flexural strength. It may also be possible to use these techniques to quantify the level of degradation (i.e. a graduated scale) and provide realistic weighting factors (see Section 7.2). Note: Surface measurements, such as hardness and surface reflectance will vary between batches of material and will be affected by surface treatments (i.e. abrasion and solvents), and hence care needs to be taken when carrying out and recording measurements. It is important to compare measurements of the material in the “as received” condition with measurements obtained on the same material after exposure (i.e. conditioned).
Gloss Normalised Spectral Reflectance
Figure 31 Flexural strength versus surface reflectance for weathered and “as-received” glass/polyester)
Figure 32 Flexural strength versus Barcol hardness for weathered and “as-received” glass/polyester
80 85 90 95 1000
100
200
300
400
500Fl
exur
al S
tren
gth
(MPa
)
Normalised Total Reflectance (%)
0 25 50 75 1000
100
200
300
400
500
Flex
ural
Str
engt
h (M
Pa)
Gloss (%)
25 30 35 40 45 50 550
100
200
300
400
500
Flex
ural
Str
engt
h (M
Pa)
Barcol Hardness

Chapter 6 Good Practice Guide 103 57
Chemical Analysis: Monitoring chemical changes enable direct measurement of the fundamental mechanisms causing degradation. These measurements are essential for understanding the degradation process and rate of chemical degradation that are occurring, The measurement of the carbonyl group is a good indicator of the level of weathering, which can be measured using Fourier Transform Infrared (FTIR) Spectroscopy. Figure 33 compares FTIR spectra for 0, 3 and 6 months of artificially weathered glass/polyester. The set of spectra showed gradual, consistent changes indicating that significant chemical changes have taken place. Some of the more obvious changes are the relative increase in intensity of the absorbance at ~3500 cm and 1640 cm. There are also more subtle changes with an increase in absorbance at ~1775 cm and a change in the absorbance maxima wave number for the absorbance band at ~1725 cm (carbonyl group). The increase in intensity of the absorbance at ~3500 cm and 1640 cm may possibly be attributed to a combination of moisture ingress and oxidation due to UVA radiation.
Figure 33 FTIR spectra for 0, 3 and 6 months weathering of glass/polyester (courtesy of ElmerPerkin)

Accelerated Testing in Aqueous and Chemical Environments
IN THIS CHAPTER
77
Test Methods and Standards
» Chemical Resistance
» Product Testing
» Environmental Test Methods
Environmental Testing » Treatment Tanks
» Control and Monitoring
» Specimen Mounting and Handling
» Chemical Spillage
» Failure Modes
Design and Selection Considerations
Test Data and Analysis

Chapter 7 Good Practice Guide 103 59
7.1 Introduction Safe and reliable design of engineering components/structures for long-term operation in hostile environments depends on the availability of reliable engineering data that can be used for material qualification, and to predict structural integrity and life expectancy. It also requires the designer/engineer to have a good understanding of physical and chemical degradation of surface and bulk properties resulting from exposure to environmental conditions. Whilst the life expectancy of products in non-demanding applications have traditionally been predicted from previous in-service experience (i.e. service conditions considered identical or similar to those for which data already exists), long-term or critical applications require the use of accelerated ageing regimes to generate data in an attempt to simulate the engineering requirements and life expectancy of the component. This section examines accelerated testing in aqueous and chemical environments (i.e. alkalis and acids). 7.2 Test Methods and Standards FRP Chemical Resistance: An important aspect for composites in many applications is that FRPs are frequently used for their good corrosion resistance (e.g. boats, process equipment, sewage applications). Part 2 of BS EN 13121 [80] is solely devoted to the determination of chemical resistance as befits a standard on chemical process vessels and aims to provide a partial design factor, A2, that can be used in the design of a component to take into account the chemical resistance of the material from which it is constructed. Table 7.1 of the standard gives the required thickness for different protective layers, which may be a single protective layer (SPL), a chemically resistant layer (CRL) or one of several thermoplastic linings (TPL). In accordance with the main philosophy, the design factor A2 is determined using one of several methods depending on circumstances. Five methods are given for determining the factor [27]: • Through media lists • Resin manufacturer’s data • Thermoplastic liner manufacturer’s data • Service experience • Testing in laboratory/in-situ It is permissible to use the lowest value, if more than one method is used. In more detail the methods are: • The aggressive environments are divided into Categories 1, 2 and 3 media. There are
comprehensive instructions depending on service temperatures, type of lining, etc. • For materials with a deflection temperature under load (DTUL) 20°C greater than the
service temperature, cured according to the manufacturer’s instructions, partial factors vary between 1.1 and 1.4, and 1.1 and 1.8, for post cured and non-post cured material, respectively, based on the manufacturer’s recommendations.
• Similar approach for thermoplastic liners when used.
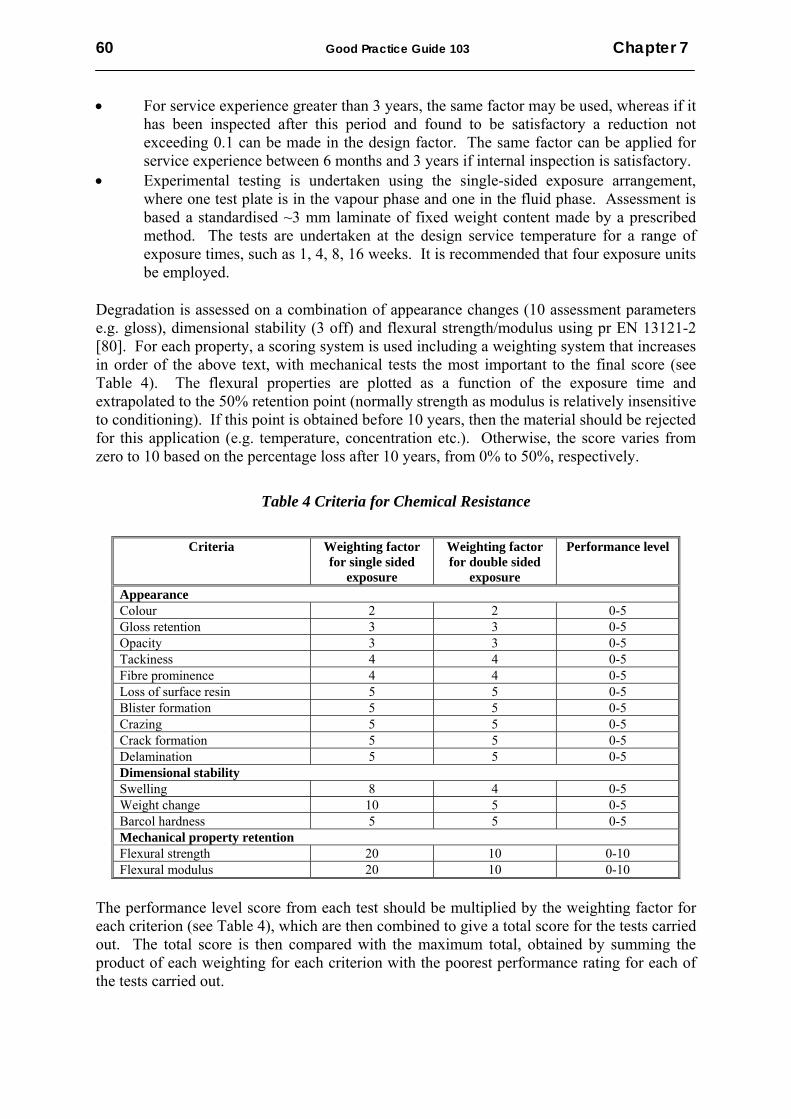
60 Good Practice Guide 103 Chapter 7
• For service experience greater than 3 years, the same factor may be used, whereas if it has been inspected after this period and found to be satisfactory a reduction not exceeding 0.1 can be made in the design factor. The same factor can be applied for service experience between 6 months and 3 years if internal inspection is satisfactory.
• Experimental testing is undertaken using the single-sided exposure arrangement, where one test plate is in the vapour phase and one in the fluid phase. Assessment is based a standardised ~3 mm laminate of fixed weight content made by a prescribed method. The tests are undertaken at the design service temperature for a range of exposure times, such as 1, 4, 8, 16 weeks. It is recommended that four exposure units be employed.
Degradation is assessed on a combination of appearance changes (10 assessment parameters e.g. gloss), dimensional stability (3 off) and flexural strength/modulus using pr EN 13121-2 [80]. For each property, a scoring system is used including a weighting system that increases in order of the above text, with mechanical tests the most important to the final score (see Table 4). The flexural properties are plotted as a function of the exposure time and extrapolated to the 50% retention point (normally strength as modulus is relatively insensitive to conditioning). If this point is obtained before 10 years, then the material should be rejected for this application (e.g. temperature, concentration etc.). Otherwise, the score varies from zero to 10 based on the percentage loss after 10 years, from 0% to 50%, respectively.
Table 4 Criteria for Chemical Resistance
Criteria Weighting factor for single sided
exposure
Weighting factor for double sided
exposure
Performance level
Appearance Colour 2 2 0-5 Gloss retention 3 3 0-5 Opacity 3 3 0-5 Tackiness 4 4 0-5 Fibre prominence 4 4 0-5 Loss of surface resin 5 5 0-5 Blister formation 5 5 0-5 Crazing 5 5 0-5 Crack formation 5 5 0-5 Delamination 5 5 0-5 Dimensional stability Swelling 8 4 0-5 Weight change 10 5 0-5 Barcol hardness 5 5 0-5 Mechanical property retention Flexural strength 20 10 0-10 Flexural modulus 20 10 0-10
The performance level score from each test should be multiplied by the weighting factor for each criterion (see Table 4), which are then combined to give a total score for the tests carried out. The total score is then compared with the maximum total, obtained by summing the product of each weighting for each criterion with the poorest performance rating for each of the tests carried out.

Chapter 7 Good Practice Guide 103 61
For example, if colour, gloss retention and Barcol hardness, are the measured criteria then the maximum (worse) score would be:
2 x 5 + 3 x 5 + 5 x 5 = 50 Acceptance of the material for the application should be if the combined score of the tests results is ≤ 50% of the total score possible for the tests conducted. Depending on the total score for all aspects, as a percentage of the maximum that could be obtained for the parameters assessed, the partial factor A2 is obtained from a chart within the range 1.1 to 1.4 (see Table 5) [80]. The weighting factors are different for single-sided and full immersion. The test can be also be conducted by full immersion of 100 mm x 125 mm plates of the laminate or by testing in-situ within a tank.
Table 5 Determination of Partial Design Factor, A2
% of Total Assessment Score A2
≤ 20 1.1 ≤ 30 1.2 ≤ 40 1.3 ≤ 50 1.4 >50 Unsuitable for purpose
British standard BS 4994 [108] specifies requirements for the design, materials selection, construction, inspection, testing and erection of vessels and tanks in FRPs. The standard covers a wide range of materials and processing routes, and includes design factors to account for the deterioration of the laminated structure due to long-term exposure to combinations of chemical environments, elevated temperature and sub-zero temperatures, and alternating loads. Geometries covered include cylindrical and spherical shells, rectangular tanks, flanges and domes. The document claims that he adoption of a minimum design factor will prevent ESC of the laminated vessels and tanks exposed to aqueous environments.
Figure 34 Strain corrosion test apparatus
Rubber Padding
Chemical Agent

62 Good Practice Guide 103 Chapter 7
Product Testing: Combined stress and environmental conditions are used in some product test methods. BS 5480-2 [109] and ASTM D 3681 [110] are often used by industry to determine the chemical–resistant properties of GRP pipes. Testing consists of exposing the interior of a pipe section to a corrosive solution (Figure 34) while the pipe is subjected to a constant compressive deflection until the structure fails. The test is carried out at several deflections and the time-to-failure is measured for each test. The long-term chemical resistance of the pipe is obtained by extrapolating to 50 years the log-log linear regression line for the initial strain level. This test is appropriate to structures buried underground, such as sewer pipes, which will experience a constant strain throughout the life of the structure. A self-stressing fixture can be used to apply a constant displacement. Alternatively, a constant load, often in the form of a dead weight, is applied to the pipe section and the creep behaviour is monitored. Time-to-failure is plotted either as a function of stress or as a function of initial strain. This test is appropriate to above ground pipes. Acoustic emission (AE) is often used to monitor the structural integrity of GRP tanks and vessels under pressure. Guidance on static fatigue testing is given in Section 4. The American Concrete Institute standard ACI 440.3R-04 “Guide Test Methods for Fibre-Reinforced Polymers for Reinforcing or Strengthening Concrete Structures” [111] specifies environmental conditions representative of porewater in Portland cement for testing GRP rebars for concrete reinforcement. The requirements of the test solution are listed below: • Ca(OH)2 – 118.5 g • NaOH – 0.9 g • KOH – 4.2 g • Deionised water – 1 litre • pH of 12.6 – 13.0 and temperature 60 °C The solution is supersaturated with Ca(OH)2, as a result CO2 is continually released into solution, thus ensuring the pH level remains within the specified limits of 12.6 and 13.0. It is quite common for creep tests to be carried out under adverse conditions using standard test coupon specimens (i.e. flexure and tension). Specimen preparation and testing should comply with the appropriate ISO standard. ISO 175 [112] and ASTM D 543 [113] cover the absorption of chemical liquids into polymers. National and international environmental test method standards are listed in Section 9 of this document and in NPL Report CMMT (A) 94 [114]. The latter provides more detail on the test conditions included in the standards. 7.3 Environmental Testing Treatment tanks or containers with chemical solutions should be of sufficient size to accommodate the specimens to be conditioned (i.e. volume of chemical solution should be well in excess of the volume occupied by the component and test fixture in solution). Tests may need to be carried out to determine the minimum volume required to condition a component. Treatment tanks used in chemical etching processes should be equipped with temperature controls and should be regularly agitated or stirred (see Figure 35) to prevent local overheating and to ensure uniform concentration of the chemical etching solution. The tanks should be suitably lined to prevent reaction between the tank and the chemical solution, thus ensuring no adverse effect on the solution used or the surfaces being treated.

Chapter 7 Good Practice Guide 103 63
Note: Care needs to be taken when handling, storage and disposal of alkali and acid solutions (see Section 8). These chemicals are particularly hazardous at elevated temperatures. When handling chemically conditioned specimens it is recommended that the specimens be rinsed in deionised water to remove chemical residue and then dried. Rinse tanks should be large enough to accommodate the specimens that have been chemically conditioned and should be equipped to allow for circulation of clean water to prevent build-up or carryover of residue on the test specimens. Stainless steel or polypropylene tanks or containers can be used for conditioning specimens in alkali solutions. The latter has the advantage of having a low thermal conductivity, and therefore it is easier and safer to handle. If polypropylene boxes are used then fully moulded construction should be used and welded seams avoided. Self-stressing fixtures, such as the flexure rig shown in (Section 4.2) can be quite heavy and cumbersome, and combined with the weight of several litres of fluid the test unit becomes difficult to handle. Glass tanks are ill advised for housing test fixtures. Warning: Caustic solutions with a high pH level will corrode glass vessels resulting in failure of the vessels.
Figure 35 Chemical tank with motorised stirrer (courtesy of RAPRA)
Chemical tanks need to be regularly monitored to ensure the temperature, fluid level and pH level remain constant and within the specified range. Ideally, the process of ensuring the fluid level in the test tank remains constant should be automated, but in most cases this a manual operation. In the latter case, it is recommended to use fully sealed containers. The temperature of test solution should be checked to ensure it conforms to specification. There may be a few degrees difference between the temperature of the heating chamber or bath and the test solution. In the case of exposure to aqueous solutions, it may be necessary to regularly flush the system with new solution or manually replace when the change in pH level goes outside the specification. The pH level of alkaline and acidic solutions will change with exposure time and is temperature dependent. The pH of alkaline solutions will decrease with increasing exposure time and temperature. Portable hand-held pH meters are available commercially. These devices come with liquid satchels with a known pH level to check that the meter is within calibration. This check should be carried out before testing begins and routinely throughout the test programme.

64 Good Practice Guide 103 Chapter 7
Where loads are applied to test specimens whilst in solution through the use of self-stressing fixtures, then the applied stress needs to be regularly checked and appropriate adjustments made to the mechanical fixture (e.g. tightening springs). Guidance on self-stressing fixtures and their use is given in Section in 4.2. Specimen Mounting and Handling: Many of the points identified in Section 6.2 are pertinent to chemical conditioning. It is important to identify each specimen by suitable indelible marking, avoiding areas to be used for subsequent testing, and produce a plan of test specimen positions. Exposure to alkaline or acidic solutions at elevated temperature can quickly degrade identifying marks on the test specimen surface. It may be necessary to mark the samples several times throughout the duration of the test. The spacing between specimens should be sufficient to ensure complete surface contact with the surrounding environment. The location of test specimens in the test environment should be carefully documented in case moisture measurements or non-destructive testing needs to be carried out on the test specimens throughout the duration of the test programme. Accurate records need to be kept on preconditioning sequence including relative humidity, pressure, temperature and time, pH level and applied stress. Simulating Chemical Spillage Effects (Intermittent Exposure): Chemical spillage can be simulated by cyclic exposure of the material surface through dipping the test specimens into chemical solution using a motorized crane for a short-time duration and then removing. A suggested cycle is 18 minutes exposure followed by 102 minutes of drying. Ideally, the surface should be rinsed after removal from solution and then allowed to dry under ambient conditions. The ratio of immersion/drying time is specified in a number of accelerated weathering and environmental testing standards. The specimens are clamped in a manner that allows only the top surface to come into contact with the chemical solution. Care needs to be taken to ensure that there is no overflow due to liquid displacement when immersing the specimens in solution, and that a crust (residue layer) does not form on the test equipment and specimens. Failure Mode: When conducting tests on chemically degraded materials either in-situ or following environmental exposure, a check should be made as to the mode of failure. In the case of tensile tests, failure must occur within the gauge section and not within the gripping region. It is recommended that a suitable structural film adhesive is used to bond the end tabs to the composite specimen in order prevent the possibility of premature failure. There is a possibility that flexure specimens will fail prematurely at the loading point(s) when subjected to flexural loading as a result of high compression and shear stresses acting in the loading regions. This can be avoided through the use of shims placed between the loading rollers and the test specimen. Composites are suitable for short-term ambient and elevated temperature tests, but unsatisfactory for long-term static fatigue tests in chemical environments (including water) because the composite will absorb water and will soften, thus altering the applied stress to the test specimen.

Chapter 7 Good Practice Guide 103 65
7.4 Design and Selection Considerations A number of points to consider when designing an environmental test programme in order to ensure that the test procedures used closely reflect the service conditions. • Time to reach saturation depends on the square of thickness, and therefore exposure
timescales will need to be considered in light of the sample dimensions. A maximum sample thickness of 1 mm is recommended by ISO 62 [54] to ensure that test durations do not exceed one week for typical diffusivity values for polymers (approximately 10-12 m2s-1).
• The exposure temperature should reflect the application temperature. • Multiple temperature exposures may be needed to build up a picture of the full
behaviour of the material. • High temperatures may cause chemical or phase changes in the polymer, which could
limit the possibility of extrapolating behaviour from one temperature to another. • Where possible, the exposure intervals should match these in the standards to enable
comparability with standard data. • If multiple specimens are to be exposed in a study then the exposure intervals for each
of the specimens should be consistent. The start of the exposures may need to be staggered to allow mass measurements to be carried out efficiently.
The two most important criteria when selecting a test method are the availability of a standard test method and the ability of the test method to produce consistent and reliable engineering data for a range of service conditions. When planning a test strategy the following should be considered: • Selection of an appropriate test for ranking and screening, design data and quality
assurance/quality control (i.e. conformance to design standards/codes) purposes. • Knowledge of existing standards/legislative requirements. • An understanding of the material characteristics, test method and the test data
generated. An awareness of the mechanical and physical properties of the polymer material is invaluable in understanding the test results and for trouble-shooting.
• Cost of fabrication and testing/test facility requirements. • Knowledge on factors that affect data reliability. 7.5 Test Data Analysis A number of factors may provide difficulties in interpretation of property-time measurements. These include: • Strength may increase or decrease upon initial exposure to elevated temperatures.
This may result from loss of volatiles, chemical cross-linking (post-curing) or relief of internal stresses.
• Long-term degradation rate may change during the ageing period. The ageing process may also change with temperature and exposure time.
• Statistical variability, which generally increases with exposure time, can introduce anomalous effects that make it difficult to differentiate the effects of key variables and

66 Good Practice Guide 103 Chapter 7
to determine the ageing sequence. Rigorous statistical analysis is required to determine the precision (confidence limits) of the durability data.
• It is virtually impossible to duplicate service conditions using accelerated ageing procedures, particularly as realistic environments include large random variations in temperature and humidity.
Handling, Storage and Documentation IN THIS CHAPTER
88
Handling and Storage of Materials and Chemicals
Handling and Storage of Adhesives, Resins and Prepreg
Handling and Storage of Adherends
Handling, Storage and Disposal of Chemicals
Documentation (Record Keeping)
68 Good Practice Guide 103 Chapter 8
8.1 Handling and Storage of Materials and Chemicals A number of issues relating to the handling and storage of materials and chemicals need to be considered as many of these factors can affect the performance of the material. Issues to be considered include: • Health and safety (COSHH) • Documentation • Handling and storage (including moisture and temperature effects) Handling polymeric materials, such as resins and adhesives can be hazardous to human health, thus COSHH (Control of Substances Hazardous to Health Regulations) procedures should be followed to minimise operator exposure. This also applies to chemical agents for environmental testing. A safety data sheet should accompany all materials and chemicals (Health and Safety at Work Act 1974). The user prior to handling the material must read this document. The safety data sheet supplied with the adhesive identifies: • Hazardous ingredients and concentrations – includes regulatory information according
to EC directives. The data sheet includes hazard labels (e.g. Xi irritant), R (risk) phrases (e.g. R43 – may cause sensitisation by skin contact) and S (safety) phrases (e.g. S37/39 – wear suitable gloves and eye/face protection).
• Hazardous identification (e.g. Irritant to eyes and skin. May cause sensitisation by skin contact).
• First aid (including ingestion, skin contact, eye contact and inhalation), fire fighting (extinguishing media and protective equipment) and accidental release (personal precautions and methods for cleaning up) measures.
• Handling and storage (including storage temperature). • Exposure controls/personal protection (including engineering measures, respiratory,
eye and skin protection, and additional). Engineering measures include ventilation requirements, whilst additional measures will refer to the handling, consumption and storage of food, beverages and tobacco products where adhesives are used.
• Physical and chemical properties (i.e. colour, odour, melting and boiling points, vapour pressure, flammability, etc.), and stability and reactivity of ingredients.
• Toxicological information (refer to COSHH) – includes potential health effects and hazardous toxicity data.
• Ecological information, disposal considerations and transport information. 8.2 Handling and Storage of Adhesives, Resins and Prepreg Polymeric resins may undergo physical and chemical changes when stored for a considerable length of time or under unsatisfactory storage conditions, thus adversely affecting the performance of the adhesive. For example, adhesives may undergo an increase in viscosity, or prepreg a loss of tack and drapeability. Less flow and, thus poorer wetting of the surface, will occur during cure and gel times of epoxy film adhesives could become shorter.

Chapter 8 Good Practice Guide 103 69
Extended exposure of uncured materials (e.g. adhesives and resins) to temperature and humidity above those recommended by the manufacturer will reduce the cohesive and adhesive strength of the material when cured [3]. The overall effect is to reduce the polymer performance and induce premature failure of the polymeric system. The safety and product data sheets will provide the user with recommendations in regard to storage temperature for an adhesive. Adhesives and composite prepreg should be stored in sealed containers to prevent moisture ingress and contamination, and some cases exposure to light. Opening a storage container exposes the material to oxygen and moisture, which may in some cases severely reduce the shelf life of the material. The shelf (storage) life is generally defined as the time that an adhesive can be stored (unopened) without any adverse affects on the cure properties and bond strength of the adhesive. The product sheet will often specify the shelf life of the adhesive for various temperature ranges. Materials should not be used beyond the expiry date, which will be indicated on the container. The shelf life can decrease significantly with increasing storage temperature. Unless the manufacturer explicitly states that the material must stored or would benefit from being stored at sub-ambient temperatures then adhesives should be stored at ambient temperatures (18-25 °C). Materials should not be stored below freezing unless recommended by the manufacturer but for some materials this is essential, e.g. composite prepreg is generally stored in a freezer at a temperature of -18 °C. Ideally, temperature and humidity in the storage area should be tightly controlled and monitored (i.e. temperature recorders), although this may not always be physically or economically feasible. Standard laboratory conditions are typically 23 ± 2 °C and 50 ± 5 % RH. Refrigerators (or freezers) should be armed with a temperature alarm and the temperature should be monitored continuously to ensure that the temperature remains below the upper temperature limit specified by the adhesive manufacturer. The maintenance of the refrigerator units should allow for regular manual or automatic defrosting. A container of raw material may be used several times during the shelf life of the product. This will involve the product being taken from the storage (often sub-ambient) temperature and placed at room temperature and allowed to warm. It is advisable throughout this exercise that the material is enclosed (i.e. remains enclosed in a sealed container) until the temperature has reached room temperature and is ready to be used. Containers that have been opened must be sealed immediately after use. The amount of time at ambient for these materials should be minimal, advice on the length of time can be obtained from the manufacturer. Repeated exposure of the adhesive and composite prepreg to atmospheric conditions is a frequent cause of adhesive ageing and deterioration. Sampling of the material before removal from sub-ambient storage (e.g. tack test) may help extend the shelf life of the product, however this may not always be possible for adhesive packed in cartridges. Exposure to repeated freeze/thaw cycling could limit the shelf life of a polymeric system. For example, exposing a film adhesive that has been stored at sub-ambient temperatures will result in moisture condensing on the surface, which if not allowed to evaporate will compromise the strength and durability of the joint. Entrapped moisture will be released during the cure process, thus compromising the physical and mechanical properties of the adhesive, and contribute to the degradation of the bonded surfaces. Routine tests to verify that the physical and mechanical properties of the adhesives are still within specification are recommended, particularly where multiple use of an adhesive has occurred.
70 Good Practice Guide 103 Chapter 8
Resins, adhesives and prepregs should be stored in an area specifically dedicated to these materials. The area should be suitable for handling flammable and hazardous materials. It may be necessary to segregate materials depending on the hazardous nature of the material. Materials in these areas should be clearly identified and controlled. 8.3 Handling and Storage of Adherends Before and after machining, adherends sensitive to environmental attack or hygroscopic in nature should be stored in sealed containers to prevent moisture ingress and contamination. It is important that the adherend does not undergo physical or chemical changes whilst being stored. Moisture can alter the chemistry of both the surface and substrate of the adherend, thus compromising the performance of bonded joints. It is recommended that an accurate record of the adherend (including condition and use) be maintained throughout the duration of use the material. Inventory control mechanisms employed for adhesives are also relevant to the storage and handling of adherend materials. Quality documentation should include details on the material source, manufacturer’s code number, batch or lot number, form (i.e. sheet or plate), storage conditions, surface conditions of the adherends (including corrosion products, and surface defects such as scratches present on receipt of the material), and the location of each specimen sectioned from the adherend. The inventory report should also include (where necessary) test data (i.e. strength and stiffness properties) for the adherend. Test certificates are often supplied with metallic materials, such as titanium and aluminium alloys, in which an elemental analysis is supplied along with basic tensile property data. These sheets contain information on the materials condition (e.g. descaled and annealed titanium). FRP suppliers provide data sheets on processing conditions, fibre volume fractions and mechanical properties of their products. Often elastic and strength properties are quoted for a range of temperatures, and in some cases for hot/wet conditions (e.g. 70 °C and 85% RH) and other environments. It may be necessary to generate mechanical property data for design purposes. This data should be included in the documentation for the material. Variations in material thickness, and elastic and strength properties can be expected between batches of materials. 8.4 Handling, Storage and Disposal of Chemicals In all cases involving solvents, primers, acid and alkaline solutions, extreme care and good laboratory practice should be followed at all times in storing, handling and disposing these materials (recommended further reading [20]). Personnel need to be trained in handling and using these materials, and should wear appropriate protective clothing as the chemicals can be harmful if they come contact with the skin or eyes. Ventilation and spill containment are particularly important safety considerations. Chemicals treating solutions should be prepared and stored in containers of glass, ceramic, or chemical resistant plastic. Checks should be made to ensure that the containing vessel is resistant to chemical attack from would be contents (e.g. hydrofluoric acid attacks glass). Stirring rods should be made of the same materials. Contact of the chemical solution with metals during preparation and storage should be avoided.
Chapter 8 Good Practice Guide 103 71
Continuous monitoring and quality control are required for all chemicals employed in chemical conditioning and surface treatments, and all containers with chemical agents should be clearly identified with labels. Labelling should be protected from being damaged through chemical contact or handling. Chemical solutions need to be changed regularly to prevent contamination and ensure repeatable concentration [20]. Quality assurance tests are recommended to check concentrations, and levels of contamination (e.g. opacity for checking particulate content, colour and pH for acidic and alkaline solutions). Warning It is important to note that many chemicals, such as acids, alkalis and solvents are toxic and present a risk to both human health and the environment, and that all safety requirements need to be met when handling, storing and disposing of these materials. 8.5 Documentation (Record Keeping) It is recommended that an accurate record of the polymeric materials be maintained, and that routine checks are made each month to ensure that the stored materials are within the time limits recommended by the manufacturer. A record should include details on the material source, manufacturer’s code number, batch or lot number, form (i.e. one-or two-part, or film, etc.), shelf life, storage temperature and handling history during the shelf life (i.e. dates of use and length of time at room temperature if refrigerated). The report should include test data from acceptance tests and routine quality checks carried out to assess material performance. Materials suppliers will often supply data sheets (material certification) with their materials and these should be kept as part of the record. It is recommended that an accurate check as to the quality of polymeric material be carried out on receipt of the material to ensure that material meets the manufacturers specifications, ensuring the product complies with the purchase order and suppliers test reports (see [20]). The colour, viscosity, shelf life, etc. should be verified. It may be necessary to carry out acceptance tests in-house to ensure mechanical properties are in accordance with the material specification. Acceptance tests should be directed towards assuring that the materials are identical from batch to batch. Accelerated environmental tests (i.e. high temperature and humidity) may also need to be carried out to confirm that the durability performance of the material meets the manufacturer specifications. ISO, BSI and ASTM list various test methods for quality assurance of materials (see Section 9).

Standards and Contacts
99
Chapter 9 Good Practice Guide 103 73
ISO STANDARDS
Plastics
Thermal Degradation ISO 176 Determination of Loss of Plasticisers - Activated
Carbon Method ISO 177 Plastics - Determination of Migration of Plasticiser ISO 291 Plastics - Standard Atmospheres for Conditioning
and Testing. ISO 305 Determination of Thermal Stability of Polyvinyl
Chloride Related Chlorine Containing Polymers, and their Compounds - Discoloration Method
ISO 554 Standard Atmospheres for Conditioning and/or Testing - Specification.
ISO 1137 Plastics: Determination of Behaviour in a Ventilated Tubular Oven
ISO 1599 Cellulose Acetate- Determination of Viscosity
ISO 2578 Plastics: Determination of Time/Temperature Limits after Exposure to Prolonged Action of Heat
ISO 3671 Determination of Volatile Matter of Amino-plastics Moulding Materials
ISO 3205 Preferred Test Temperatures
Environmental Stress Cracking (ESC)
ISO 4599 Plastics - Determination of Resistance to Environmental Stress Cracking (ESC) - Bent Strip Method
ISO 4600 Plastics - Determination of Environmental Stress Cracking (ESC) - Ball and Pin
ISO 6252 Plastics - Determination of Resistance to Environmental Stress Cracking (ESC) - Constant Tensile Stress Method
ISO 22088 Plastics - Determination of Resistance to Environmental Stress Cracking (ESC)
ISO 16770 Plastics - Determination of Environmental Stress Cracking (ESC) of Polyethylene - Full-Notch Creep Test (FNCT)
Effect of Liquids
ISO 62 Plastics - Determination of Water Absorption
ISO 175 Plastics - Determining the Effect of Liquid Chemical Including Water

74 Good Practice Guide 103 Chapter 9
ISO 483 Plastics - Small Enclosures for Conditioning and Testing Using aqueous Solutions to Maintain Relative Humidity at Constant Value.
ISO 4611 Plastics - Determination of the Effect of Exposure to Damp Heat, Water Spray and Salt
Weathering
ISO 877 Plastics - Determination of Resistance to Change upon Exposure under Glass to Daylight
ISO 2579 Plastics - Instrumental Evaluation of Colour Differences
ISO 3557 Plastics - Recommended Practice for Spectrophoto-metry and Calculation of Colour in CIE Systems
ISO 3558 Plastics - Assessment of the Colour of Near-White or Near-Colourless Materials
ISO 4582 Plastics - Determination of Changes in Colour and Variations in Properties and Exposure to Daylight under Glass, Natural Weathering of
ISO 4607 Plastics - Methods of Exposure to Natural Weathering
ISO 4892 Plastics - Methods of Exposure to Laboratory Light Sources
ISO 9370 Guide for the Iinstrumental Determination of Radiant Exposure in Weathering Tests
ISO TR 9673 Solar radiation and its measurements for determining outdoor weather exposure levels
ISO 11403:Part 3 Environmental Influences on Properties
Biological Attack
ISO 846 Determination of Behaviour under the Action of Fungi and Bacteria - Evaluation by Visual Examination or Measurement of Change in Mass or Physical Properties
Mechanical (Creep)
ISO 899 Plastics - Determination of Creep Behaviour

Chapter 9 Good Practice Guide 103 75
Rubbers
Thermal Degradation
ISO 188 Accelerated Ageing or Heat Resistance Tests
ISO 6914 Determination of Ageing Characteristics by Measurement of Stress at a Given Elongation
Effect of Liquids
ISO 1817 Determination of the Effect of Liquids
Weathering
ISO 4665:Part 1 Assessment of Change in Properties after Exposure to Natural Weathering or Artificial Light
ISO 4665:Part 2 Methods of Exposure to Natural Weathering
ISO 4665:Part 3 Methods of Exposure to Artificial Weathering
Effect of Ozone
ISO 1431:Part 1 Resistance of Ozone Cracking - Static Strain Test
ISO 1431:Part 2 Resistance to Ozone Cracking - Dynamic Strain Test
ISO 1431:Part 3 Determination of Ozone Concentration
Biological Degradation
ISO 846 Determination of Behaviour under the Action of Fungi and Bacteria - Evaluation by Visual Examination or Measurement of Change in Mass or Physical Properties
Mechanical (Stress Relaxation in Compression)
ISO 3384 Determination of Stress Relaxation in Compression at Normal and High Temperatures
ISO 6056 Determination of Compression Stress Relaxation (Rings)

76 Good Practice Guide 103 Chapter 9
Composites
ISO 75 Part 3 Plastics - Determination of Temperature of Deflection under Load. Part 3: High-strength thermosetting laminates and Long-Fibre-Reinforced plastics
BS EN 2378 Fibre reinforced plastics - Determination of Water Absorption by Immersion in Demineralised Water.
BS EN 2489 Fibre reinforced plastics - Determination of the Action of Liquid Chemicals.
BS EN 2823 Fibre reinforced plastics - Determination of the Effect of Exposure to Humid Atmosphere on Physical and Mechanical Characteristics.
ISO 13003 Fibre-Reinforced plastics - Determination of Fatigue Properties under Cyclic Loading Conditions
Note: The standards listed in this section refer specifically to fibre-reinforced composites. More general standards covering both plastics and composites are given in the section on ISO plastic related standards.
Adhesives
ISO 9142 Adhesives - Guide to the Selection of Standard Laboratory Ageing Conditions for Testing Bonded Joints
ISO 9664 Test Methods for Fatigue Properties of Structural Adhesives in Tensile Shear
ISO 10354 Adhesives - Characterisation of Durability of Structural Adhesive Assemblies - Wedge Rupture Test
ISO 10363 Hot Melt adhesives - Determination of Thermal Stability
ISO 14615 Adhesives - Durability of Structural Adhesive Joints - Exposure to Humidity and Temperature under Load
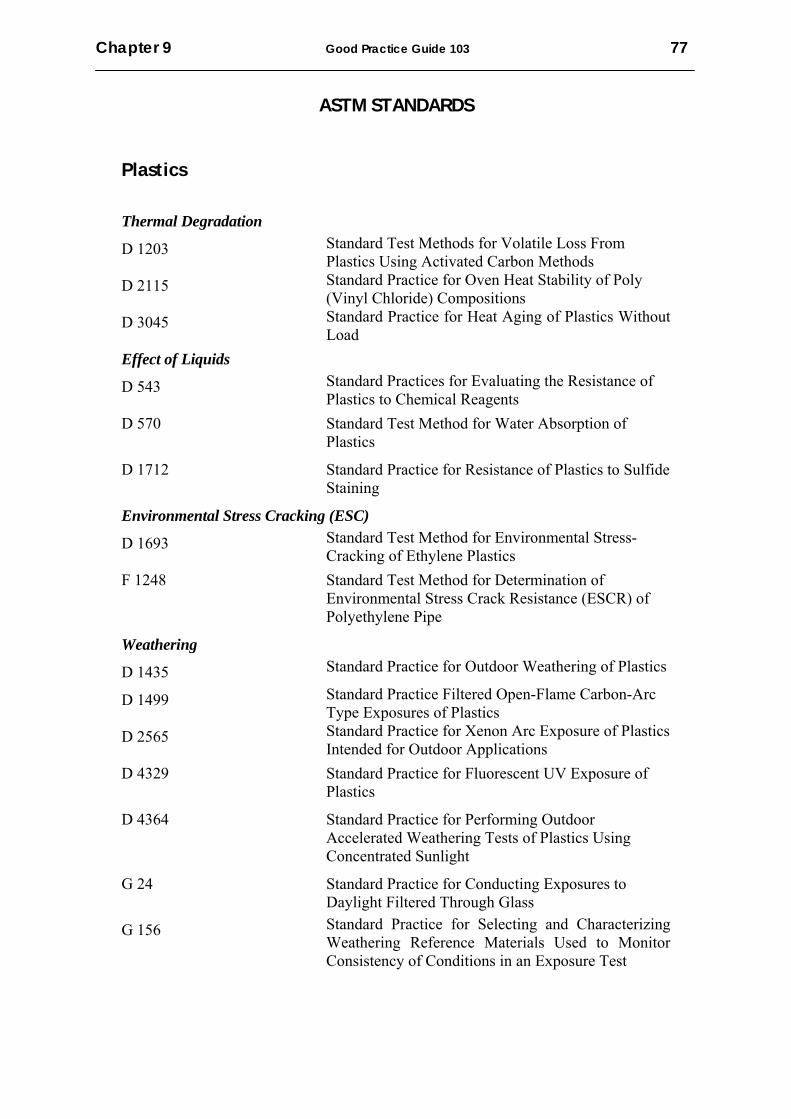
Chapter 9 Good Practice Guide 103 77
ASTM STANDARDS
Plastics
Thermal Degradation
D 1203 Standard Test Methods for Volatile Loss From Plastics Using Activated Carbon Methods
D 2115 Standard Practice for Oven Heat Stability of Poly (Vinyl Chloride) Compositions
D 3045 Standard Practice for Heat Aging of Plastics Without Load
Effect of Liquids
D 543 Standard Practices for Evaluating the Resistance of Plastics to Chemical Reagents
D 570 Standard Test Method for Water Absorption of Plastics
D 1712 Standard Practice for Resistance of Plastics to Sulfide Staining
Environmental Stress Cracking (ESC)
D 1693 Standard Test Method for Environmental Stress-Cracking of Ethylene Plastics
F 1248 Standard Test Method for Determination of Environmental Stress Crack Resistance (ESCR) of Polyethylene Pipe
Weathering
D 1435 Standard Practice for Outdoor Weathering of Plastics
D 1499 Standard Practice Filtered Open-Flame Carbon-Arc Type Exposures of Plastics
D 2565 Standard Practice for Xenon Arc Exposure of Plastics Intended for Outdoor Applications
D 4329 Standard Practice for Fluorescent UV Exposure of Plastics
D 4364 Standard Practice for Performing Outdoor Accelerated Weathering Tests of Plastics Using Concentrated Sunlight
G 24 Standard Practice for Conducting Exposures to Daylight Filtered Through Glass
G 156 Standard Practice for Selecting and Characterizing Weathering Reference Materials Used to Monitor Consistency of Conditions in an Exposure Test

78 Good Practice Guide 103 Chapter 9
G 178 Standard Practice for Determining the Activation Spectrum of a Material (Wavelength Sensitivity to an Exposure Source) Using the Sharp Cut-On Filter or Spectrographic Technique
Biological Attack
G 21 Standard Practice for Determining Resistance of Synthetic Polymeric Materials to Fungi
Mechanical (Creep)
D 2990 Standard Test Methods for Tensile, Compressive, and Flexural Creep and Creep-Rupture of Plastics
Rubber
Thermal Degradation
D 454 Standard Test Method for Rubber Deterioration by Heat and Air Pressure
D 572 Standard Test Method for Rubber—Deterioration by Heat and Oxygen
D 573 Standard Test Method for Rubber—Deterioration in an Air Oven
D 865 Standard Test Method for Rubber-Deterioration by Heating in Air (Test Tube Enclosure)
Effect of Liquids
D 471 Standard Test Method for Rubber Property-Effect of Liquids
D 1460 Standard Test Method for Rubber Property—Change in Length During Liquid Immersion
D 3137 Standard Test Method for Rubber Property—Hydrolytic Stability
Weathering
D 518 Standard Test Method for Rubber Deterioration-Surface Cracking
Effect of Ozone D 1149 Standard Test Method for Rubber Deterioration-
Surface Ozone Cracking in a Chamber D 1171 Standard Test Method for Rubber Deterioration-
Surface Ozone Cracking Outdoors or Chamber (Triangular Specimens)
Mechanical (Stress Relaxation in Compression)
F 38 Standard Test Methods for Creep Relaxation of a Gasket Material
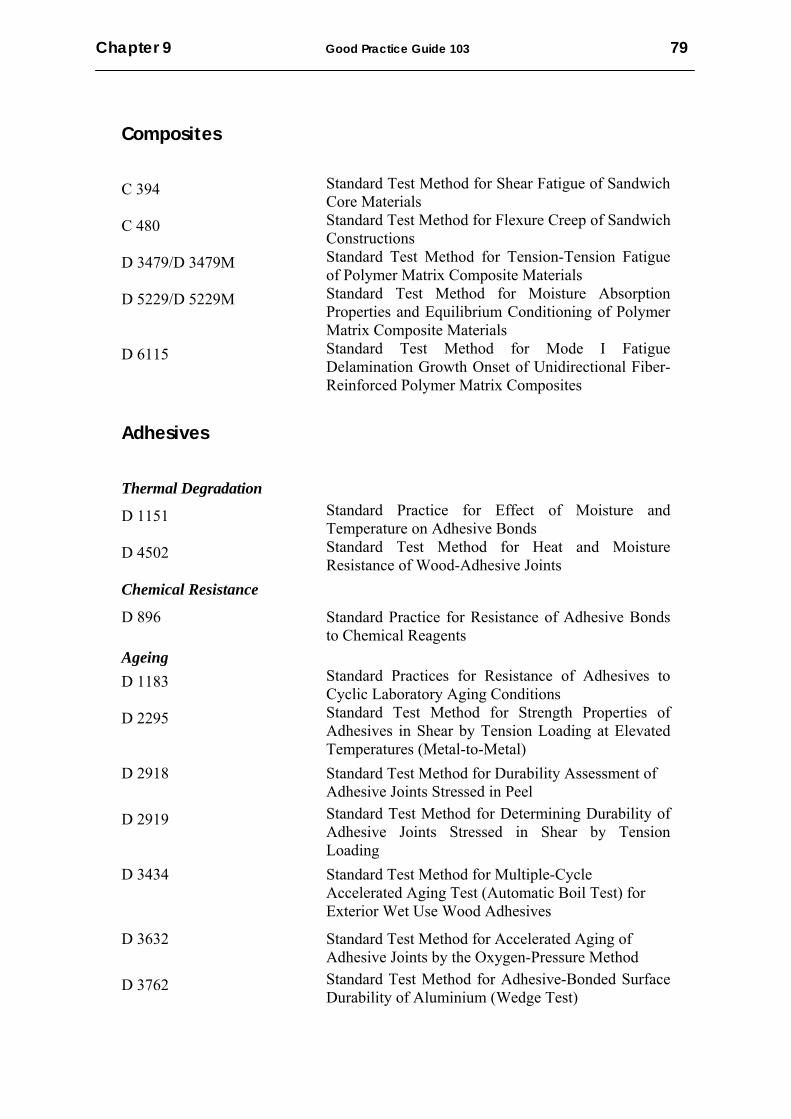
Chapter 9 Good Practice Guide 103 79
Composites
C 394 Standard Test Method for Shear Fatigue of Sandwich Core Materials
C 480 Standard Test Method for Flexure Creep of Sandwich Constructions
D 3479/D 3479M Standard Test Method for Tension-Tension Fatigue of Polymer Matrix Composite Materials
D 5229/D 5229M Standard Test Method for Moisture Absorption Properties and Equilibrium Conditioning of Polymer Matrix Composite Materials
D 6115 Standard Test Method for Mode I Fatigue Delamination Growth Onset of Unidirectional Fiber-Reinforced Polymer Matrix Composites
Adhesives
Thermal Degradation
D 1151 Standard Practice for Effect of Moisture and Temperature on Adhesive Bonds
D 4502 Standard Test Method for Heat and Moisture Resistance of Wood-Adhesive Joints
Chemical Resistance
D 896 Standard Practice for Resistance of Adhesive Bonds to Chemical Reagents
Ageing D 1183 Standard Practices for Resistance of Adhesives to
Cyclic Laboratory Aging Conditions D 2295 Standard Test Method for Strength Properties of
Adhesives in Shear by Tension Loading at Elevated Temperatures (Metal-to-Metal)
D 2918 Standard Test Method for Durability Assessment of Adhesive Joints Stressed in Peel
D 2919 Standard Test Method for Determining Durability of Adhesive Joints Stressed in Shear by Tension Loading
D 3434 Standard Test Method for Multiple-Cycle Accelerated Aging Test (Automatic Boil Test) for Exterior Wet Use Wood Adhesives
D 3632 Standard Test Method for Accelerated Aging of Adhesive Joints by the Oxygen-Pressure Method
D 3762 Standard Test Method for Adhesive-Bonded Surface Durability of Aluminium (Wedge Test)

80 Good Practice Guide 103 Chapter 9
D 4498 Standard Test Method for Heat-Fail Temperature in Shear of Hot Melt Adhesives
Fatigue
D 3166 Standard Test Method for Fatigue Properties of Adhesives in Shear by Tension Loading (Metal/Metal)
Creep
D 1780 Standard Practice for Conducting Creep Tests of Metal-to-Metal Adhesives
D 2293 Standard Test Method for Creep Properties of Adhesives in Shear by Compression Loading (Metal-to-Metal)
D 2294 Standard Test Method for Creep Properties of Adhesives in Shear by Tension Loading (Metal-to-Metal)
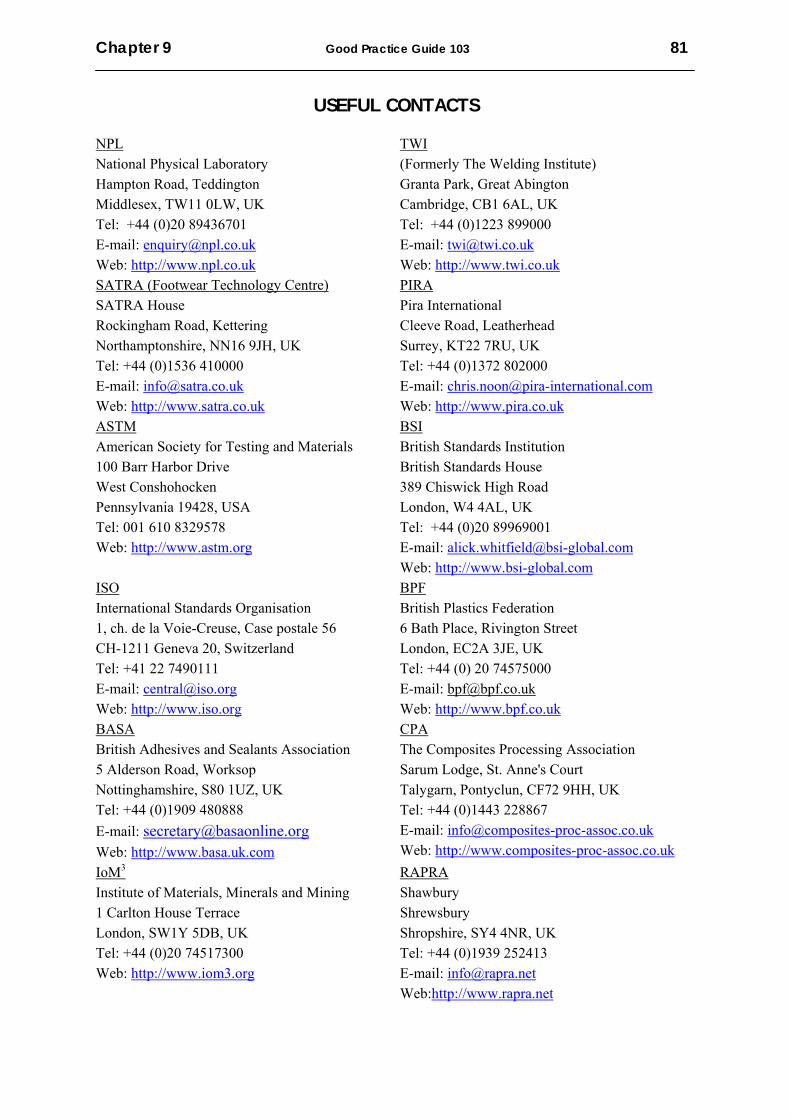
Chapter 9 Good Practice Guide 103 81
USEFUL CONTACTS
NPL National Physical Laboratory Hampton Road, Teddington Middlesex, TW11 0LW, UK Tel: +44 (0)20 89436701 E-mail: [email protected] Web: http://www.npl.co.uk
TWI (Formerly The Welding Institute) Granta Park, Great Abington Cambridge, CB1 6AL, UK Tel: +44 (0)1223 899000 E-mail: [email protected] Web: http://www.twi.co.uk
SATRA (Footwear Technology Centre) SATRA House Rockingham Road, Kettering Northamptonshire, NN16 9JH, UK Tel: +44 (0)1536 410000 E-mail: [email protected] Web: http://www.satra.co.uk
PIRA Pira International Cleeve Road, Leatherhead Surrey, KT22 7RU, UK Tel: +44 (0)1372 802000 E-mail: [email protected] Web: http://www.pira.co.uk
ASTM American Society for Testing and Materials 100 Barr Harbor Drive West Conshohocken Pennsylvania 19428, USA Tel: 001 610 8329578 Web: http://www.astm.org
BSI British Standards Institution British Standards House 389 Chiswick High Road London, W4 4AL, UK Tel: +44 (0)20 89969001 E-mail: [email protected] Web: http://www.bsi-global.com
ISO International Standards Organisation 1, ch. de la Voie-Creuse, Case postale 56 CH-1211 Geneva 20, Switzerland Tel: +41 22 7490111 E-mail: [email protected] Web: http://www.iso.org
BPF British Plastics Federation 6 Bath Place, Rivington Street London, EC2A 3JE, UK Tel: +44 (0) 20 74575000 E-mail: [email protected] Web: http://www.bpf.co.uk
BASA British Adhesives and Sealants Association 5 Alderson Road, Worksop Nottinghamshire, S80 1UZ, UK Tel: +44 (0)1909 480888 E-mail: [email protected] Web: http://www.basa.uk.com
CPA The Composites Processing Association Sarum Lodge, St. Anne's Court Talygarn, Pontyclun, CF72 9HH, UK Tel: +44 (0)1443 228867 E-mail: [email protected] Web: http://www.composites-proc-assoc.co.uk
IoM3 Institute of Materials, Minerals and Mining 1 Carlton House Terrace London, SW1Y 5DB, UK Tel: +44 (0)20 74517300 Web: http://www.iom3.org
RAPRA Shawbury Shrewsbury Shropshire, SY4 4NR, UK Tel: +44 (0)1939 252413 E-mail: [email protected] Web:http://www.rapra.net

References
1100

Chapter 10 Good Practice Guide 103 83
1. Kinloch, A.J., “Adhesion and Adhesives - Science and Technology”, Chapman and Hall, 1987.
2. “Joining Fibre-Reinforced Plastics”, Matthews, F.L. (Editor), Elsevier Applied Science, 1987.
3. “Adhesives and Sealants”, Engineered Materials Handbook, Volume 3, ASM International, 1990.
4. “Adhesive Bonding Handbook for Advanced Structural Materials”, European Space Research and Technology Centre, European Space Agency, Noordwjik, The Netherlands, 1990.
5. Rosato, D.V., DiMattia, D.P. and Rosato, D.V., “Designing with Plastics and Composites: A Handbook” Van Nostrand Reinhold, 1991.
6. “Design and Manufacture of Composite Structures”, Eckold, G., Woodhead Publishing Ltd, 1994.
7. “Optimisation of Design of Composite Structures”, Miravete, A., Woodhead Publishing Ltd, 1994.
8. Military Handbook, Polymer Matrix Composites, Volume 3 - Materials Usage, Design and Analysis, MIL-HDBK-17-1E, 1994.
9. White, J.R. and Turnbull, A., “Review: Weathering of Polymers: Mechanisms of Degradation and Stabilization, Testing Strategies and Modelling”, Journal of Materials Science, Volume 29, pp 584-613, 1994.
10. Brydson, J.A., “Plastics Materials”, Sixth Edition, British Plastics and Rubber, 1995. 11. Brown, R.P., Kockott, D., Trubiroha, P., Ketola, W. and Shorthouse, J., ‘A Review of
Accelerated Durability Tests’, VAMAS Report No.18, Edited by Brown, R.P., Versailles Project on Advanced Materials and Standards, 1995.
12. “Structural Design of Polymer Composites”, EUROCOMP Design Code and Handbook, Edited by Clarke, J.L., Chapman Hall, 1996.
13. Wright, D.C., “Environmental Stress Cracking of Plastics”, RAPRA Technology Ltd., 1996.
14. Adams, R.D., Comyn, A. and Wake, W.C., “Structural Adhesive Joints in Engineering”, Second Edition, Chapman and Hall, 1997.
15. Greenwood, J.H., ‘Life Prediction in Polymers’, ERA Technology Report No. 97-0782R, 1997.
16. “Joining of Fibre-Reinforced Polymer Composite Materials, Project Report 46, Construction Industry Research and Information Association, 1997.
17. “Composites Engineering Handbook”, Edited by Mallick, P.K., Marcel Dekker, 1997. 18. “Guide to The Structural Use of Adhesives”, The Institution of Structural Engineers,
1999. 19. Turnbull, A. and Maxwell. A., “Test Methods for Environment Stress Cracking of
Polymeric materials”. NPL Technical Review No. 3, 1999. 20. Petrie, E.M., “Handbook of Adhesives and Sealants”, McGraw-Hill Handbooks,
2000. 21. “Comprehensive Composite Materials”, Handbook (6 volumes), Edited by Kelly A
and Zweben, C., Elsevier Science, 2000. 22. Wright, D.C., ‘Failure of Plastics and Rubber Products – Causes, Effects and Case
Studies involving Degradation’, RAPRA Technology Report, ISBN: 1-85857-261-8, 2001.
23. Brown, R.P. and Greenwood, J.H., ‘Practical Guide to the Assessment of the Useful Life of Plastics’, RAPRA Technology Limited, 2002.
24. Broughton, W.R., Crocker, L.E., Gower, M.R.L., “Design Requirements for Bonded and Bolted Composite Structures”, NPL Report MATC (A)65, 2002.

84 Good Practice Guide 103 Chapter 10
25. Wypych, G., “Handbook of Materials Weathering”, ChemTec Publishing, 2003. 26. Maxwell, A.S., “Review of Techniques for Monitoring the Environmental
Degradation of Polymers”, NPL Report DEPC MPR 015, 2005. 27. Maxwell, A.S., Broughton, W.R., Dean, G.D. and Sims, G.D., “Review of
Accelerated Ageing Methods and Lifetime Prediction Techniques for Polymeric Materials”, NPL Report DEPC MPR 016, 2005.
28. Duncan, B.C, Urquhart, J.M, and Roberts, S., “Review of Measurement and Modelling of Permeation and Diffusion in Polymers”, NPL Report DEPC MPR 020, 2005.
29. Dean, G. and Duncan, B., “Preparation and Testing of Bulk Specimens of Adhesives”, NPL Measurement Good Practice Guide No 17, 1998.
30. Broughton, W.R., Durability Performance of Adhesive Joints”, NPL Measurement Good Practice Guide No 28, 2000.
31. Davies, A., Foreman, A., Shaw, R. and Sims, G., “Fibre Reinforced Plastic Composites – Machining of Composites and Specimen Preparation”, NPL Measurement Good Practice Guide No 38, 2001.
32. Duncan, B. and Crocker, L., “Characterisation of Flexible Adhesives for Design”, NPL Measurement Good Practice Guide No 45, 2001.
33. Broughton, B and Gower, G., “Preparation and Testing of Adhesive Joints”, NPL Measurement Good Practice Guide No 47, 2001.
34. Dean, G and Crocker, L., “The Use of Finite Element Methods for Design with Adhesives”, NPL Measurement Good Practice Guide No 48, 2001.
35. Duncan, B.C, and Broughton, W.R., “Characterising Strength of Adhesion”, NPL Measurement Good Practice Guide No 72, 2004.
36. Duncan, B.C., and Broughton, W.R., “Absorption and Diffusion of Moisture In Polymeric Materials”, NPL Measurement Good Practice Guide No 102, 2007.
37. Broughton, W.R., Lodeiro, M. and Maudgal, S., “Accelerated Test Methods for Assessing Environmental Degradation of Composite Laminates”, NPL Report MATC (A) 251, 2000.
38. “Reinforced Plastics Durability”, Edited by Pritchard, G., Woodhead Publishing Ltd, 1995.
39. “Design of Marine Structures in Composite Materials”, Edited by Smith, C.S., Elsevier Applied Science, 1990.
40. Sims, G.D.and Broughton, W.R., Chapter 5, Volume 2, “Comprehensive Composite Materials”, Handbook, Edited by Kelly A and Zweben, C., Elsevier Science, 2000.
41. Ehrenstein, G.W., Schmiemann, A., Bledzki, A. and Spaude, R., “Corrosion Phenomena in Glass-Fiber-Reinforced Thermosetting Resins”, Volume 1, Handbook of Ceramics and Composites, Edited by Cheremisinoff, N.P., Marcel Dekker, Inc., 1990.
42. Carfago, S.P. and Gibson, R.J., “A Review of Equipment Ageing Theory and Technology”, EPRI NP-1558, Electric Power Research Institute, Palo Alto, CA, USA, September 1980.
43. Gueguen, V., Audouin, L., Pinel, B. and Verdu, J., “Lifetime Prediction in the Case of Radiooxidative Ageing of An Ethylene-Propylene Rubber Used for Electrical Insulation”, Polymer Degradation and Stability, Volume 46, Number 1, 1994, pp 113-122.
44. Arnold, J.C. “Environmental Stress Crack Initiation in Glassy Polymers”, Trends in Polymer Science, Volume 4, 1996, pp 403-408.
45. Wellinghoff, S. and Baer, E., “The Mechanism of Crazing in Polystyrene”, Journal of Macromolecular Science B, Volume 11, Number 3, 1975, pp 367-387.

Chapter 10 Good Practice Guide 103 85
46. Kausch, H.H., and Oudet, C., “Progress and Challenge in Polymer Crazing and Fatigue”, Die Makromolekulare Chemie. Macromolecular Symposia, Volume 22, 1998, pp 207-224.
47. Wright, D.C. and Gotham, K.V. “Solvent Crazing Criteria”, Polymer Engineering Science, Volume 23, Number 3, 1983, pp 135-139.
48. Wright, D.C., “An Inelastic Deformation Criterion for Delayed Failure” British Polymer Journal, Volume 19, 1978, pp 60-64.
49. Hogg P.J. and Hull, D., “Micromechanics of Crack Growth in Composite Materials Under Corrosive Environments”, Materials Science, Volume 14, 1980, pp 441-449.
50. Broughton, W.R. and Lodeiro, M.J., “Environmental and Fatigue Testing of Fibre Bundles and Impregnated Strands”, NPL Measurement Note CMMT (MN) 063, 2000.
51. Broughton, W.R. and Lodeiro, M.J., “Techniques for Monitoring Water Absorption in Fibre-Reinforced Polymer Composites”, NPL Measurement Note CMMT (MN) 064, 2000.
52. IEC 60216-4, “Guide for the Determination of Thermal Endurance Properties of Electrical Insulating Materials. Part 4: Ageing Ovens”, 1990-2000.
53. BS EN ISO 62:1999, Plastics - Determination of Water Absorption”. 54. ISO 75, “Plastics – Determination of Temperature of Deflection Under Load”. 55. ISO 294-3:1996, “Plastics - Injection Moulding of Test Specimens of Thermoplastic
Materials - Part 3: Small Plates”. 56. “CRAG Test Methods for the Measurement of the Engineering Properties of Fibre
Reinforced Plastics”, Edited by Curtis, P.T., Defence Evaluation and Research Agency (now Qinetiq), United Kingdom, Technical Report 88012, 1998.
57. Shen, C.H. and Springer, G.S., “Moisture Absorption and Desorption of Composite Materials”, Journal of Composite Materials”, Volume 10, 1976, pp 2-20.
58. “Environmental Effects on Composite Materials”, Volumes 1 and 2, Edited by Springer, G.S., Technomic Publishing Company, 1984.
59. Collings, T.A., “Moisture Management and Artificial Ageing of Fibre Reinforced Epoxy Resins”, Defence Evaluation and Research Agency (now Qinetiq), United Kingdom, Technical Memo MAT/STR 1093, 1987.
60. ISO 3341:1997, “Textile Glass - Yarns - Determination of Breaking Force and Breaking Elongation”.
61. BS ISO 9163:1996, “Textile Glass - Rovings - Manufacture of Test Specimens and Determination of Tensile Strength of Impregnated Strands”.
62. ASTM D 4018, “Standard Test Methods for Properties of Continuous Filament Carbon and Graphite Fiber Tows”.
63. ISO 10618:1999, “Carbon Fibre - Determination of Tensile Properties of Resin Impregnated Yarns”.
64. ISO 11403 “Acquisition and Presentation of Comparable Multi-Point Data – Environmental Influences on Properties”.
65. ISO 22088-3:2006, “Plastics - Determination of Resistance to Environmental Stress cracking (ESC) - Part 3 Bent Strip method”.
66. ASTM D 1693-01, “Environmental Stress-Cracking of Ethylene Plastics. 67. ISO 22088-4:2006, “Determination of Environmental Stress Cracking (ESC) - Part 4
the Ball or Pin Impression Method”. 68. ISO 22088-5:2006, Plastics – Determination of Resistance to Environmental Stress
Cracking (ESC) – Part 5: Constant Tensile Deformation Method”. 69. ISO 22088-6:2006, “Plastics - “Determination of Resistance to Environmental Stress
Cracking (ESC) – Part 6: Slow Strain Rate Method”.
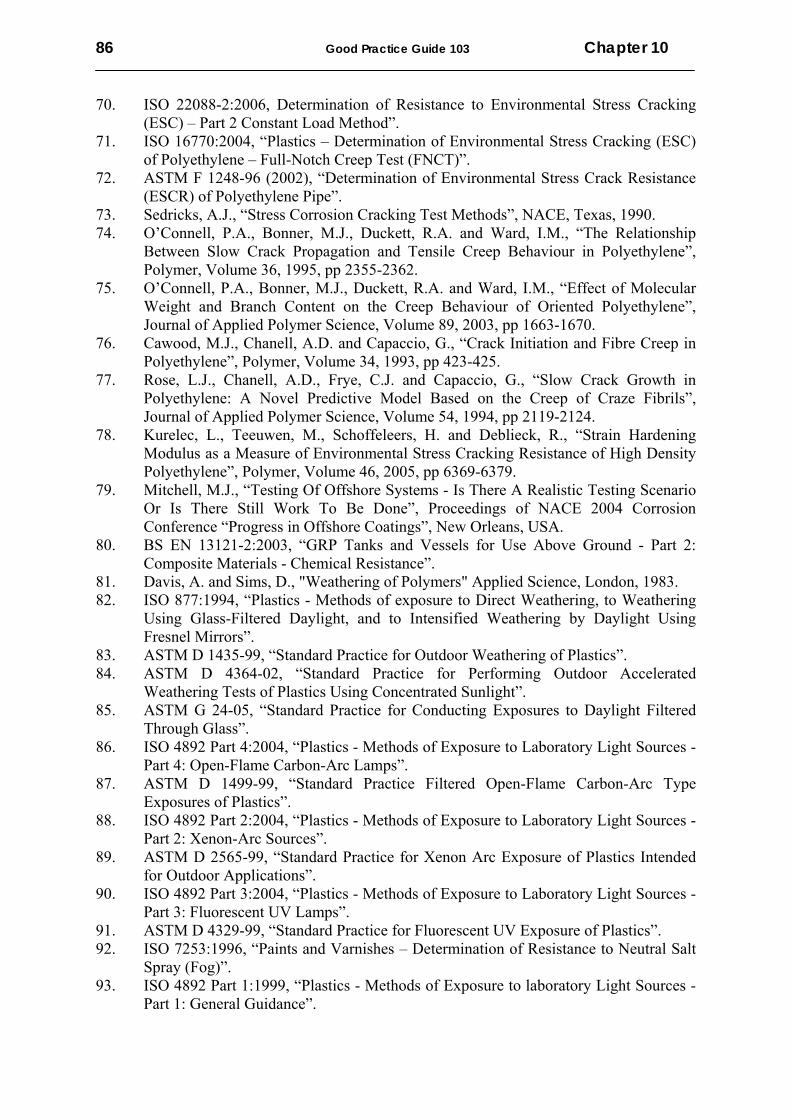
86 Good Practice Guide 103 Chapter 10
70. ISO 22088-2:2006, Determination of Resistance to Environmental Stress Cracking (ESC) – Part 2 Constant Load Method”.
71. ISO 16770:2004, “Plastics – Determination of Environmental Stress Cracking (ESC) of Polyethylene – Full-Notch Creep Test (FNCT)”.
72. ASTM F 1248-96 (2002), “Determination of Environmental Stress Crack Resistance (ESCR) of Polyethylene Pipe”.
73. Sedricks, A.J., “Stress Corrosion Cracking Test Methods”, NACE, Texas, 1990. 74. O’Connell, P.A., Bonner, M.J., Duckett, R.A. and Ward, I.M., “The Relationship
Between Slow Crack Propagation and Tensile Creep Behaviour in Polyethylene”, Polymer, Volume 36, 1995, pp 2355-2362.
75. O’Connell, P.A., Bonner, M.J., Duckett, R.A. and Ward, I.M., “Effect of Molecular Weight and Branch Content on the Creep Behaviour of Oriented Polyethylene”, Journal of Applied Polymer Science, Volume 89, 2003, pp 1663-1670.
76. Cawood, M.J., Chanell, A.D. and Capaccio, G., “Crack Initiation and Fibre Creep in Polyethylene”, Polymer, Volume 34, 1993, pp 423-425.
77. Rose, L.J., Chanell, A.D., Frye, C.J. and Capaccio, G., “Slow Crack Growth in Polyethylene: A Novel Predictive Model Based on the Creep of Craze Fibrils”, Journal of Applied Polymer Science, Volume 54, 1994, pp 2119-2124.
78. Kurelec, L., Teeuwen, M., Schoffeleers, H. and Deblieck, R., “Strain Hardening Modulus as a Measure of Environmental Stress Cracking Resistance of High Density Polyethylene”, Polymer, Volume 46, 2005, pp 6369-6379.
79. Mitchell, M.J., “Testing Of Offshore Systems - Is There A Realistic Testing Scenario Or Is There Still Work To Be Done”, Proceedings of NACE 2004 Corrosion Conference “Progress in Offshore Coatings”, New Orleans, USA.
80. BS EN 13121-2:2003, “GRP Tanks and Vessels for Use Above Ground - Part 2: Composite Materials - Chemical Resistance”.
81. Davis, A. and Sims, D., "Weathering of Polymers" Applied Science, London, 1983. 82. ISO 877:1994, “Plastics - Methods of exposure to Direct Weathering, to Weathering
Using Glass-Filtered Daylight, and to Intensified Weathering by Daylight Using Fresnel Mirrors”.
83. ASTM D 1435-99, “Standard Practice for Outdoor Weathering of Plastics”. 84. ASTM D 4364-02, “Standard Practice for Performing Outdoor Accelerated
Weathering Tests of Plastics Using Concentrated Sunlight”. 85. ASTM G 24-05, “Standard Practice for Conducting Exposures to Daylight Filtered
Through Glass”. 86. ISO 4892 Part 4:2004, “Plastics - Methods of Exposure to Laboratory Light Sources -
Part 4: Open-Flame Carbon-Arc Lamps”. 87. ASTM D 1499-99, “Standard Practice Filtered Open-Flame Carbon-Arc Type
Exposures of Plastics”. 88. ISO 4892 Part 2:2004, “Plastics - Methods of Exposure to Laboratory Light Sources -
Part 2: Xenon-Arc Sources”. 89. ASTM D 2565-99, “Standard Practice for Xenon Arc Exposure of Plastics Intended
for Outdoor Applications”. 90. ISO 4892 Part 3:2004, “Plastics - Methods of Exposure to Laboratory Light Sources -
Part 3: Fluorescent UV Lamps”. 91. ASTM D 4329-99, “Standard Practice for Fluorescent UV Exposure of Plastics”. 92. ISO 7253:1996, “Paints and Varnishes – Determination of Resistance to Neutral Salt
Spray (Fog)”. 93. ISO 4892 Part 1:1999, “Plastics - Methods of Exposure to laboratory Light Sources -
Part 1: General Guidance”.
Chapter 10 Good Practice Guide 103 87
94. ISO 20340:2003, “Paints and Varnishes – Performance Requirements for Protective Paint Systems for Offshore and Related Structures”.
95. ISO 11507: 1997, Paints and Varnishes – Exposure of Coatings to Artificial Weathering – Exposure to Fluorescent UV and Water”.
96. BS EN 13121-2:2003, “GRP Tanks and Vessels for Use Above Ground—Part 2: Composite Materials—Chemical Resistance”.
97. Broughton, W.R, Pilkington, G.D and Ratnakela, D.K., “Accelerated Weathering: Performance Testing of Polymer Matrix Composites”, NPL Measurement Note DEPC-MN 047, 2007.
98. ISO 6721, “Plastics - Determination of Dynamic Mechanical Properties”. 99. Mulligan, D., Gnaniah, S. and Sims, G.D., Thermal Analysis Techniques for
Composites and Adhesives (Second Edition)”, NPL Measurement Good Practice Guide No 62, 2003.
100. Sims, G.D. and Gnaniah, S., “Polymer Composites - Rate Dependent Temperature Calibration of Dynamic Mechanical Analysers (DMA) for Tg Measurements”. NPL Measurement Note DEPC (MN) 017, 2005.
101. BS 2782-10:Method 1001:1977 Methods of testing plastics. Glass reinforced plastics. Measurement of hardness by means of a barcol impressor.
102. ISO 13468 Parts 1 and 2:1999, “Plastics - Determination of the Total Luminous Transmittance of Transparent Materials”.
103. ISO 14782:1999, “Plastics - Determination of Haze for Transparent Materials”. 104. BS 272 Method 520A, “Methods of Testing Plastics. Optical and Colour Properties,
Weathering. Determination of Specular Gloss”. 105. Clarke, P.J., “Regular Transmittance Measurements”, NPL Measurement Good
Practice Guide No 97, 2006. 106. Chunnilall, C.J., Deadman, A.J., Crane, L., Usadi, E., “NPL Scales For Radiance
Factor And Total Diffuse Reflectance, Metrologia, Volume 40, 2003, S192-S195. 107. BS EN ISO 14125:1998, “Fibre Reinforced Plastic Composites - Determination of
Flexural Properties”. 108. BS 4994, “Design of Construction Vessels and Tanks in Reinforced Plastics”. 109. BS 5480 Part 2, “Specification for Glass Reinforced Plastics (GRP) Pipes and Fittings
for Use for Water Supply and Sewerage. Part 2: Design and Performance Requirements”.
110. ASTM D 3681, “Standard Test Method for Chemical Resistance of Fibreglass (glass fibre reinforced thermosetting resin) Pipe in a Deflected Condition”.
111. ACI 440.3R-04 “Guide Test Methods for Fibre-Reinforced Polymers for Reinforcing or Strengthening Concrete Structures”.
112. ISO 175: 1999, Plastics - Methods of Test for the Determination of the Effects of Immersion in Liquid Chemicals”.
113. ASTM D543-95 (2001), “Standard Practices for Evaluating the Resistance of Plastics to Chemical Reagents”.
114. Broughton, W.R., Lodeiro, M.J., Maudgal, S. and Sims, G.D., “Review of Test Methods and Standards for Assessing Long-Term Performance of Polymer Matrix Composites”, NPL Report CMMT (A) 94, 1998.
115. ISO 11357:1997, “Plastics – Differential Scanning Calorimetry”.

Acknowledgements & Contact Details
1111

Chapter 11 Good Practice Guide 103 89
11.1 Acknowledgements The research reported in this Good Practice Guide was funded by the United Kingdom Department of Trade and Industry (National Measurement System Policy Unit) as part of the Measurements for Materials Performance Programme. The authors would also like to express their gratitude to Robert Alexander (PerkinElmer Ltd) John Hartley (Fibreforce Composites Ltd), Roland Groom and Chris Hughes (RAPRA), Bernard Sikkel (3M, UK) and to colleagues at the National Physical Laboratory, particularly Bruce Duncan, Crispin Allen, Sam Gnaniah, Maria Lodeiro, Richard Mera, Jaspal Nottay, Gordon Pilkington, Dhammika Ratanakela and Graham Sims for technical support and advice. 11.2 Contact Details Comments and feedback on the use of this guide should be sent to: Dr Bill Broughton Industry and Innovation Division National Physical Laboratory Hampton Road, Teddington, Middlesex, TW11 0LW Telephone +44 (0)20-8943 6834 Facsimile +44(0)20-8943 6177 E-mail: [email protected]


![Accelerated chondrogenesis in nanofiber polymeric ... · cells. [17,21-22,26,29-30] Specifically for articular carti- lage repair, animal studies support the use of biodegrad-able](https://img.pdfslide.us/doc/110x75/5fd6ecb512e6d764a21b02f1/accelerated-chondrogenesis-in-nanofiber-polymeric-cells-1721-222629-30.jpg)