Embed Size (px)
Citation preview
Proceedings of the 2013 SAAA Biennial Conference
79
ACC007
SIGNS OF JIBAR MANIPULATION?
Keywords: LIBOR, JIBAR, manipulation
Authors:
Phillip de Jager
Department of Finance and Tax
University of Cape Town
Rondebosch
+27216502296
Shaun Parsons
College of Accounting
University of Cape Town
Rondebosch
+27216504029
We declare that the manuscript or a similar one has not been published and is not, nor will be,
under consideration for publication elsewhere while being reviewed for the SAAA
conference.

Proceedings of the 2013 SAAA Biennial Conference
80
Abstract:
The JSE has recently come under pressure in the financial media to defend the integrity of the
Johannesburg Interbank Agreed Rate (JIBAR) in the midst of the revelations of the long-term
and systematic manipulation of the London Interbank Offer Rate (LIBOR) in the United
Kingdom. The purpose of this paper is to investigate the extent to which there may be
anomalies in the historical JIBAR that merit further investigation.
The paper finds that there is insufficient publicly available data from the JSE to test for
profit-seeking manipulation by individual banks. In considering the available data,
discrepancies were identified in the historic JIBAR obtained from different sources, and
inconsistencies were noted in the types of data used to calculate the JSE zero coupon yield
curves.
Based on the available data, no evidence was found of ―day of the month‖ type manipulation
of JIBAR. In seeking indications of possible ―lowballing‖ activity, the 3 month JIBAR
behaved very similarly to the 3 month British pound LIBOR. In contrast, over the height of
the financial crisis, the 1 month JIBAR behaved in ways that cannot be readily explained.
The anomalies in this rate support the need for further investigation.
Proceedings of the 2013 SAAA Biennial Conference
81
Introduction
That LIBOR was manipulated extensively and over an extended period of time is now a matter
of public record. The banks that were the first to be implicated have already received record-
breaking fines, and the investigation into at least twenty banks across three continents continues
(The Economist (1), 2013). The manipulation of LIBOR has been found to be systematic,
widespread and continued for a number of years. Accusations of manipulations in the financial
press were continually denied until academic research substantiating the claims made further
denial impossible. The substance of these denials was often based on reasoning similar to that
currently provided by the defenders of JIBAR in South Africa. Some of that reasoning has
already been found by the South African press to be flawed.
This study proceeds on the assumption that there is need for rigorous academic investigation into
whether there is any evidence of manipulation of JIBAR. This paper serves as an initial
investigation, from which the merit of further investigation may be assessed. The following is a
timeline of the significant events in the development of the LIBOR scandal:
15 November 2007 Minutes of the Bank of England Sterling Money Markets Group indicates
concern that banks may be understating their submissions for LIBOR
(Bank of England, 2007).
March 2008 The Bank for International Settlements in its quarterly review indicates
that the data available does provide evidence of LIBOR manipulation
(BIS, 2008: 70).
16 April 2008 A Wall Street Journal article suggests that banks may be submitting
knowingly incorrect estimates of borrowing costs to manipulate LIBOR
(Mollenkamp, 2008).
29 May 2008 A second Wall Street Journal article highlights discrepancies in banks‘
LIBOR submissions.
October 2008 The International Monetary Fund‘s Global Financial Stability Review
supports the integrity of the US Dollar LIBOR (IMF, 2008).

Proceedings of the 2013 SAAA Biennial Conference
82
April 2010 Paper by Snider and Youle (2010) identifies anomalies in banks‘ LIBOR
submissions, including anomalies that corroborate the Wall Street Journal
claims.
March 2011 The Wall Street Journal reveals that regulators are investigating the
actions of Bank of America, Citigroup Inc. and UBS AG.
February 2012 Reuters reveals that investigations include criminal investigations by the
US Department of Justice into LIBOR fixing.
30 April 2012 The city of Baltimore files a civil case against 19 banks for losses
sustained on LIBOR-based instruments (US District Court, 2012).
27 June 2012 The United Kingdom regulatory body, the Financial Services Authority,
finds that Barclays Bank Plc took into account the requests of its own
derivatives traders in making LIBOR submissions, attempted to influence
the submissions of other banks, and knowingly submitted understated
submissions in order to manage market sentiment towards the bank.
Barclays is fined £59.5 million by the FSA, $200 million by the
Commodity Futures Trading Commission, and $160 million by the United
States Department of Justice (FSA, 2012).
2 & 3 July 2012 Barclays chairman Marcus Agius and Barclays CEO Bob Diamond resign
on successive days (BBC(1), 2012).
4 July 2012 Bob Diamond appears before United Kingdom Parliament. Diamond
insists he did not know of LIBOR fixing until a month ago (Trotman,
2012).
9 July 2012 Paul Tucker voluntarily appears before parliament and states that he did
not encourage banks to manipulate LIBOR (The Guardian, 2012).
10 July 2012 The United States Congress announces its own investigation into LIBOR
manipulation, focusing on possible complicity of the New York Federal
Reserve (Nasiripour, 2012).
15 July 2012 Canadian Competition Bureau releases information of its investigation into
the fixing of yen-denominated LIBOR, based on information obtained
from a whistle-blower.
Proceedings of the 2013 SAAA Biennial Conference
83
27 July 2012 A Financial Times article claims that LIBOR manipulation had been
occurring since 1991 (Douglas, 2012).
July 2012 Released documents show that in 2007 the New York Federal Reserve was
aware of LIBOR manipulation (Gongloff, 2012).
25 September 2012 The British Bankers‘ Association agree to hand over future responsibility
for the setting of LIBOR to the FSA (Wilson, 2012).
4 October 2012 Republican senators announce an investigation into the possible
involvement of US Treasury Secretary Timothy Geithner (HITC Business,
2012).
15 October 2012 Class action filed by Alabama homeowners claiming losses suffered in
mispricing of variable rate home loans due to LIBOR manipulation
(Tourvalai, 2012).
3 November 2012 The Federal Housing Finance agency indicates that losses of $3 billion
incurred by the Federal National Mortgage Association (―Fannie Mae‖)
and the Federal Home Loan Mortgage Corporation (―Freddie Mac‖),
whose failure of which was integral to the precipitation of the 2007
financial crisis, may have been caused by manipulation of LIBOR
(Benson, 2012).
19 December 2012 The US Commodity Futures Trading Commission finds UBS guilty of
attempting to manipulate LIBOR between 2005 and 2010, both for profit
and to manage market sentiment, and of more than 2 000 instances of
unlawful conduct by its employees, including collusion with other banks to
manipulate the rate (CFTC, 2012). Fines against UBS levied by the US
Department of Justice, the Commodity Futures Trading Commission, and
the United Kingdom FSA amount to is fined $1.2bn (BBC(2), 2012).
The purpose of this paper is to identify the tests used to identify LIBOR manipulation, to
determine to what extent these tests can be reperformed in a South African context, and to
perform initial investigations into whether there is evidence of data anomalies within the
historical Johannesburg Interbank Agreed Rate (JIBAR) that merit further investigation.
Proceedings of the 2013 SAAA Biennial Conference
84
The paper proceeds as follows: section 2 reviews the literature surrounding the manipulation of
LIBOR, as well as considering the debate that has already emerged in the financial press over the
possibility of JIBAR manipulation. Section 3 considers the availability of comparable South
African data and defines how this may limit the testing that may be performed on JIBAR.
Section 4 presents the findings of the statistical analysis of the South African data based on the
possible tests identified. Section 5 discusses the implications of these findings, and identifies
areas for further research. Section 6 concludes.
Literature review
How is LIBOR calculated?
The London Interbank Offered Rate (LIBOR) serves as a benchmark for $350 trillion in financial
contracts (Masters et al, 2012). The rate is quoted daily at 11am, and until recently was overseen
by the British Bankers‘ Association. LIBOR is calculated on the daily submissions of a panel of
banks for ten currencies and fifteen maturities, of what each estimates it would be charged to
borrow from other banks in the market. The most significant LIBOR is that of the three-month
Dollar rate (The Economist (2), 2012), for which sixteen banks make daily submissions (BIS,
2008). The highest and lowest four estimates are discarded, and the remaining eight are averaged
to arrive at LIBOR.
The rate submitted by each bank is considered a measure of its estimate of its own
creditworthiness, since it represents the risk premium it would have to pay above the risk-free
rate in order to borrow money. The submission is however an estimate; while the submissions
made are in the public domain, they do not represent the rates at which any actual transactions
have occurred.
Why did the banks manipulate LIBOR, and how was it identified?
The incentives to submit accurate estimates had previously been thought sufficient to safeguard
the integrity of LIBOR. In its March 2008 quarterly review, the Bank for International
Proceedings of the 2013 SAAA Biennial Conference
85
Settlements pointed to the reputational damage that a bank would suffer if it were to submit an
estimated rate at which it was subsequently found to be unwilling to transact. Banks‘
submissions were matters of public record in order to promote this incentive. The report
acknowledged that in certain circumstances this risk might be outweighed by other incentives to
manipulate the rate, but argued that a single bank should in theory be unable to do this; since the
highest and lowest four submissions are discarded, it would take in theory take collusion or at
least similar intent among five banks to influence the rate in a particular direction. At the time,
perceived anomalies in the LIBOR were attributed to lack of market liquidity and changes in
strategic focus of individual banks in a time of crisis (BIS, 2008: 70).
However, as the truth about the long-term manipulation of LIBOR has emerged, three primary
incentives for banks to manipulate LIBOR have been identified. Although these had been
previously speculated upon in investigations by the financial press, it was research by Snider and
Youle (2010) that provided the statistical evidence to support these suspicions.
Firstly, since banks may trade in instruments that are priced against LIBOR while at the same
time being involved in the determination of LIBOR, a bank that was able to shift the rate in its
favour could profit from the change in the market prices of the instruments. The exposure of
Barclays to such instruments in 2007 was significant enough to result in a daily gain or loss of
$40m from changes in interest rates.
Evidence of manipulation for profit was provided through the identification of ―bunching‖ of
around the fourth or twelfth quotes used to determine the day‘s LIBOR. Snider and Youle found
that the LIBOR submissions of banks that had a significant trading exposure to LIBOR-
referenced instruments were more likely to be found at the upper and lower ends of the range of
quotes included in the eight used to determine LIBOR than banks without such exposure. This
supported the proposition that these banks were trying to move the rate without submitting
estimates that would be excluded from the sample (Snider and Youle, 2010).
The second reason cited is that the LIBOR submissions of each bank are a measure of credit risk,
and therefore potentially both reflect and influence market sentiment. Prior to the financial crisis
this may not have been a major concern, but in the midst of the crisis there was real concern that

Proceedings of the 2013 SAAA Biennial Conference
86
banks would either go bankrupt or be nationalised. British banks were intent on avoiding a ‗run
on the banks‘ – a sudden mass withdrawal of funds beyond the level that the bank‘s liquidity
could bear – the likes of which spelt the end of Northern Rock. To do this they would need to
control market sentiment, which could (it was thought) be turned by banks‘ rate estimates.
Banks might therefore wish to submit artificially low rates to indicate that there was no
perceived problem with its credit risk. In this scenario the bank on its own is not trying to
influence the overall LIBOR; it is not concerned with whether its submission forms part of the
average or is discarded. But, when every bank is subject to the same threat and identifies the
same means of managing it, the LIBOR could be artificially suppressed.
Snider and Youle found evidence of this by examining the market price of credit default swaps
(CDS). Since banks do not trade on the rates they submit for LIBOR, a traded rate is needed for
comparison. This was achieved by comparing the difference between the bank‘s CDS rate and its
submitted rate. Since the CDS rate represents the market‘s perception of the bank‘s credit risk,
and the submitted rate represents the bank‘s borrowing cost, the difference between the two
should be the risk-free borrowing rate, which should remain constant. Snider and Youle however
found that there were significant movements in this difference, and that often it fell below the
risk-free rate, which could only occur if the estimate was understated or the market were willing
to accept a guaranteed loss on CDS‘s. The lack of a strong correlation between the bank‘s
estimate and corresponding CDS rate, and in particular an underrecognition of credit risk,
indicates that banks were knowingly understating their submissions. This understatement had
previously been identified (Thornton, 2009), but at the time had been attributed to a failure of the
financial market to recognise the rising credit risk in that period.
The same article also compared LIBOR submissions among banks across different currencies.
Since the currency risk implicit in each submission is constant across all submitting banks, the
difference in banks‘ submissions should depend only on its assessment of its own credit risk,
which is not currency dependent. The ranking of banks‘ submissions on any given day should
therefore be constant across currencies, i.e. if Bank A submits the highest rate and Bank B the
lowest in its Dollar estimate, Bank A should also be the highest and Bank B the lowest in their
respective Yen estimates. Snider and Youle found that this was not consistently the case. This

Proceedings of the 2013 SAAA Biennial Conference
87
further supports the hypothesis that banks were engaged in attempts to manipulate particular
LIBOR rates.
The final possible reason for LIBOR manipulation is to influence the repricing of agreements
that directly or indirectly reference LIBOR. In particular, mortgages in the US housing market
are periodically repriced. Since this repricing occurs on a limited number of dates, if LIBOR
could be influenced on those dates in favour of the lenders (the banks), interest income for the
next period could be artificially inflated.
This is alleged to have been the case between 2007 and 2009, with rates being as much as 7.5
basis points higher than average on the first day of each month between August 2007 and
February 2009 (Halahtouryalai, 2012). Further evidence was obtained from internal trader emails
requesting manipulation of JIBAR specifically for this purpose (Binham, 2012).
Could JIBAR have been subject to manipulation?
The Johannesburg Interbank Agreed Rate (JIBAR) is South Africa’s version of LIBOR. It is
published daily at 11am by the Johannesburg Stock Exchange (JSE), which is responsible
for its calculation in a manner similar to LIBOR – 9 banks submit quotes, the highest and
lowest two rates are discarded, and the remaining five are averaged to arrive at JIBAR.
In the wake of the collapse of faith in LIBOR, the SARB was quick to respond to suggestions
that South Africa‘s JIBAR might also have been open to manipulation. Central to the SARB‘s
argument in its media release of 24 July 2012 was that, whereas LIBOR is based on estimates of
a hypothetical transaction, JIBAR submissions are based on the rates at which each bank actually
transacts on its negotiable certificates of deposit (NCD‘s). Banks‘ submissions are in the public
domain, and since the submissions are meant to reference actual transaction rates, if a
counterparty were unable to transact with the bank at that rate a complaint would be lodged
against the bank. The SARB states that no such complaints have ever been received.
Furthermore, South African banks are required to submit both bid and offer rates, whereas
United Kingdom banks submit only their offer rates. Submitting both rates is considered more

Proceedings of the 2013 SAAA Biennial Conference
88
reliable because banks would either have to manipulate both rates or show a large bid-offer
spread, which would be a warning sign to the SARB. The SARB also indicated that it had
initiated a review of the JIBAR process in 2011 by the Financial Markets Liaison Group, the
results of which were expected by the end of August 2012 but have not yet been released (South
African Government Online, 2012).
Standard Bank CEO Jacko Maree also came out in support of the credibility of JIBAR. Maree
cited ―better governance and leadership values‖ and ―an ethos and culture which is much
stronger than in Europe and the USA‖ as the reasons why SA banks had not participated in rate
manipulation (Moneyweb, 2012).
The soundness of the JSE‘s argument was quickly challenged by online financial site
Moneyweb. In its investigation into JIBAR it revealed that it had identified 23 instances between
3 November 2008 and 14 December 2009 where the bid rate of an individual bank was lower
than its corresponding offer rate (Rees, 2012). When pressed, the JSE indicated to Moneyweb
that these had arisen due to capturing errors inverting the two rates. It also pointed out that since
the JIBAR is calculated on the bid/offer spread this would not have had an effect on the day‘s
JIBAR. Although the inversions in themselves are not evidence of attempted manipulation, it is
clear that there is lack of control over the input data, and undermines the JSE‘s contention that
the public nature of the quotes protects against misstatement. Moneyweb also noted that with a
wide bid/offer spread of 15-25 points there was a lack of a meaningful benchmark against which
anomalies in the spread could be identified.
Subsequent to the confirmation of LIBOR manipulation responsibility for the determination of
JIBAR has been transferred from the JSE to the Reserve Bank.
Research approach and data
Research approach
The purpose of this study is to explore the possibility of the manipulation of the JIBAR around
the time period of the global financial crisis. Exploratory research is sometimes claimed to be
inferior to explanatory research, but when ―we are in relatively uncharted waters and the most
Proceedings of the 2013 SAAA Biennial Conference
89
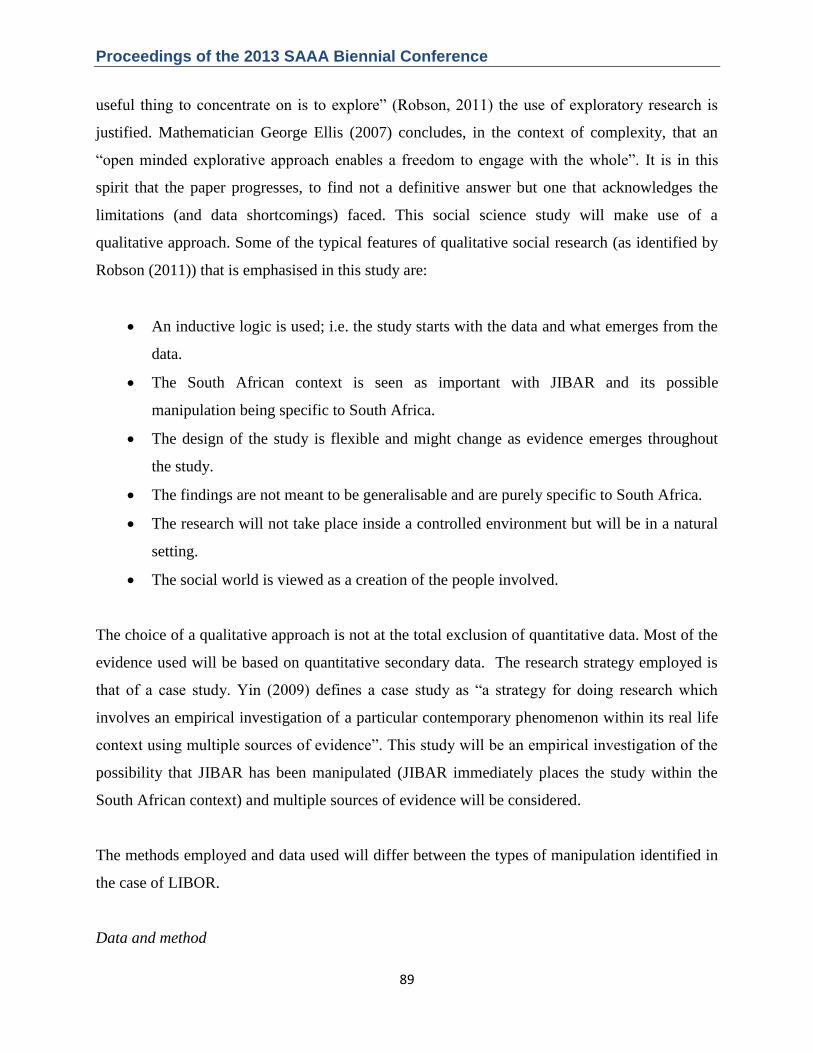
useful thing to concentrate on is to explore‖ (Robson, 2011) the use of exploratory research is
justified. Mathematician George Ellis (2007) concludes, in the context of complexity, that an
―open minded explorative approach enables a freedom to engage with the whole‖. It is in this
spirit that the paper progresses, to find not a definitive answer but one that acknowledges the
limitations (and data shortcomings) faced. This social science study will make use of a
qualitative approach. Some of the typical features of qualitative social research (as identified by
Robson (2011)) that is emphasised in this study are:
An inductive logic is used; i.e. the study starts with the data and what emerges from the
data.
The South African context is seen as important with JIBAR and its possible
manipulation being specific to South Africa.
The design of the study is flexible and might change as evidence emerges throughout
the study.
The findings are not meant to be generalisable and are purely specific to South Africa.
The research will not take place inside a controlled environment but will be in a natural
setting.
The social world is viewed as a creation of the people involved.
The choice of a qualitative approach is not at the total exclusion of quantitative data. Most of the
evidence used will be based on quantitative secondary data. The research strategy employed is
that of a case study. Yin (2009) defines a case study as ―a strategy for doing research which
involves an empirical investigation of a particular contemporary phenomenon within its real life
context using multiple sources of evidence‖. This study will be an empirical investigation of the
possibility that JIBAR has been manipulated (JIBAR immediately places the study within the
South African context) and multiple sources of evidence will be considered.
The methods employed and data used will differ between the types of manipulation identified in
the case of LIBOR.
Data and method
Proceedings of the 2013 SAAA Biennial Conference
90
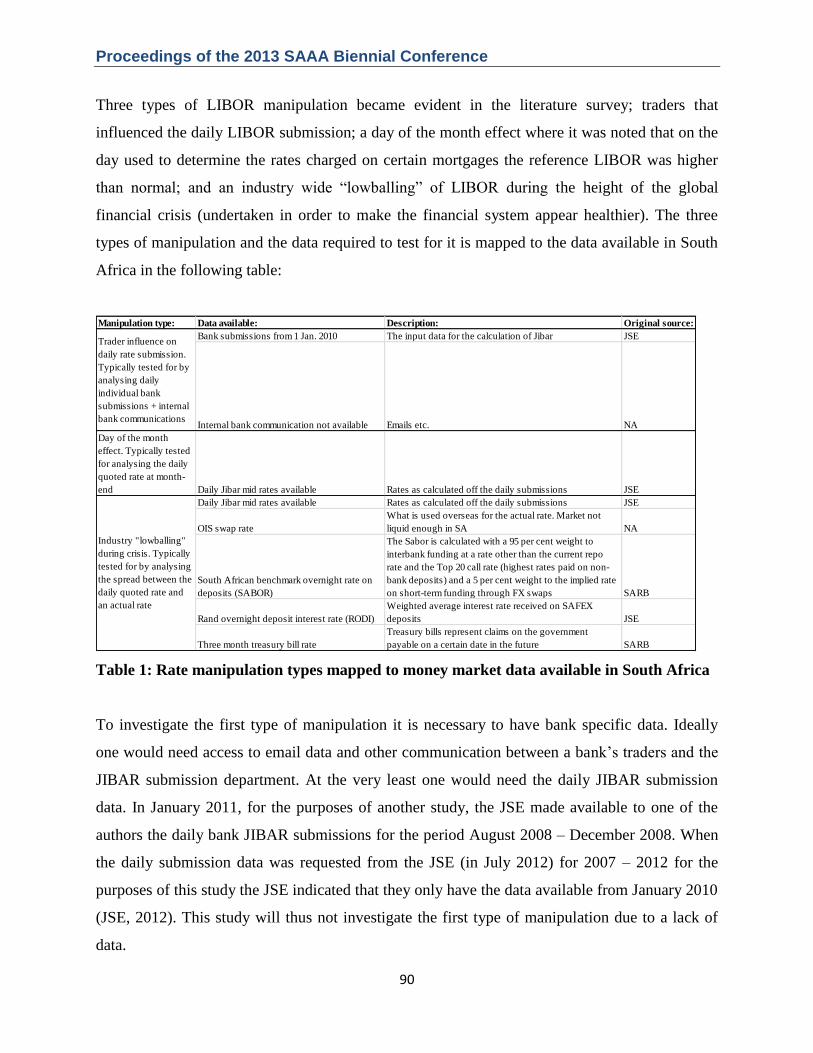
Three types of LIBOR manipulation became evident in the literature survey; traders that
influenced the daily LIBOR submission; a day of the month effect where it was noted that on the
day used to determine the rates charged on certain mortgages the reference LIBOR was higher
than normal; and an industry wide ―lowballing‖ of LIBOR during the height of the global
financial crisis (undertaken in order to make the financial system appear healthier). The three
types of manipulation and the data required to test for it is mapped to the data available in South
Africa in the following table:
Table 1: Rate manipulation types mapped to money market data available in South Africa
To investigate the first type of manipulation it is necessary to have bank specific data. Ideally
one would need access to email data and other communication between a bank‘s traders and the
JIBAR submission department. At the very least one would need the daily JIBAR submission
data. In January 2011, for the purposes of another study, the JSE made available to one of the
authors the daily bank JIBAR submissions for the period August 2008 – December 2008. When
the daily submission data was requested from the JSE (in July 2012) for 2007 – 2012 for the
purposes of this study the JSE indicated that they only have the data available from January 2010
(JSE, 2012). This study will thus not investigate the first type of manipulation due to a lack of
data.
Manipulation type: Data available: Description: Original source:
Bank submissions from 1 Jan. 2010 The input data for the calculation of Jibar JSE
Internal bank communication not available Emails etc. NA
Day of the month
effect. Typically tested
for analysing the daily
quoted rate at month-
end Daily Jibar mid rates available Rates as calculated off the daily submissions JSE
Daily Jibar mid rates available Rates as calculated off the daily submissions JSE
OIS swap rate
What is used overseas for the actual rate. Market not
liquid enough in SA NA
South African benchmark overnight rate on
deposits (SABOR)
The Sabor is calculated with a 95 per cent weight to
interbank funding at a rate other than the current repo
rate and the Top 20 call rate (highest rates paid on non-
bank deposits) and a 5 per cent weight to the implied rate
on short-term funding through FX swaps SARB
Rand overnight deposit interest rate (RODI)
Weighted average interest rate received on SAFEX
deposits JSE
Three month treasury bill rate
Treasury bills represent claims on the government
payable on a certain date in the future SARB
Trader influence on
daily rate submission.
Typically tested for by
analysing daily
individual bank
submissions + internal
bank communications
Industry "lowballing"
during crisis. Typically
tested for by analysing
the spread between the
daily quoted rate and
an actual rate

Proceedings of the 2013 SAAA Biennial Conference
91
To investigate the second type of manipulation the daily JIBAR is required. This is available
from the original source, being the JSE. The data is also available from Bloomberg and as a first
step we will compare the 1 and 3 month JIBAR received from the JSE with that from Bloomberg
for the period 1 January 2007 to 31 December 2011. A dummy variable on the last or first day of
each month will be used (for 1 month and 3 month JIBAR) to test for this type of manipulation.
Table 2: Differences identified when comparison is done between source JIBARs (JSE) and
information provider JIBARs (Bloomberg)
When comparing the JIBARs available from the source (JSE) and the JIBARs available from an
information supplier (Bloomberg) for the period 1 January 2007 to 31 December 2011 for
maturities of 1 month and 3 months, 15 instances where differences exist can be identified.
Excluding the missing observations in the JSE data for October 2009 most of the differences are
concentrated in 2008 and specifically the time period around the global financial crisis.
Implications that arise are: first, that Bloomberg JIBAR data seems more reliable and will be
Date JIBAR1M JIBAR3M JIBAR1M JIBAR3M 1M 3M
09 May 2007 9.21 9.39 9.04 9.21 0.17 0.18
Considering day before
and after Bloomberg
seems correct
19 November 2007 10.56 10.83 10.55 10.92 0.01 -0.09 No obvious explanation
16 January 2008 11.28 11.36 11.28 11.37 0.00 0.00 No obvious explanation
29 February 2008 11.15 11.31 11.15 11.32 0.00 -0.01 No obvious explanation
29 April 2008 10.65 11.83 11.65 11.83 -1.00 0.00
29 May 2008 10.20 12.58 12.20 12.58 -2.00 0.00
24 June 2008 12.14 12.33 12.15 12.33 -0.01 0.00 No obvious explanation
09 December 2008 11.70 11.78 11.70 11.58 0.00 0.19
Considering day before
and after Bloomberg
seems correct
23 April 2009 9.12 7.68 9.12 8.55 0.00 -0.87
Considering day before
and after Bloomberg
seems correct
19 October 2009 0.00 0.00 6.97 7.18 -6.97 -7.18
20 October 2009 0.00 0.00 6.98 7.18 -6.98 -7.18
21 October 2009 0.00 0.00 6.98 7.18 -6.98 -7.18
22 October 2009 0.00 0.00 6.98 7.22 -6.98 -7.22
23 October 2009 0.00 0.00 6.98 7.23 -6.98 -7.23
19 January 2011 5.44 5.50 5.44 5.55 0.00 -0.05
Considering day before
and after Bloomberg
seems correct
JSE - BLOOMB.
Observations missing in
JSE data
Obvious mistake in JSE
data
JSE BLOOMBERG

Proceedings of the 2013 SAAA Biennial Conference
92
used in any of the tests conducted and second, that the lowest detail available on Bloomberg for
JIBAR rates is the daily midrate quotation. The last point became apparent when the ―last price‖
and the ―Ask price‖ data received from Bloomberg for 1 month and 3 month JIBAR turned out
to be exactly the same; in other words JIBAR quotations and spread information are not
available on Bloomberg.
The last type of manipulation will also be investigated by this study as again it relates not to
individual and unavailable bank data but rather to industry aggregated data. Overseas the spread
of LIBOR over an actual traded reference rate was often analysed as an indicator of this type of
manipulation:
Quoted rate – actual traded rate = spread (1)
In its defence of the integrity of JIBAR, the JSE argued that the JIBAR is an actual rate and not a
quoted rate like LIBOR. In practice it is not obvious how the JIBAR differs from a quoted rate;
the Moneyweb investigation clearly showed that it is not possible to trade on the submitted
JIBAR. If JIBAR was an actual rate then the spread calculated according to formula (1) would
have been nonsensical; our expectation is that the spread will exist and have information content.
The first step in the study of the ―lowballing‖ type of manipulation would be to calculate a
suitable spread for JIBAR and compare it to a similar spread for LIBOR. Any large differences
will be highlighted and investigated.
JIBAR 1 month and 3 months for the period 1 January 2007 to 31 December 2011 as supplied by
Bloomberg will be used as the quoted rate. The two rates are compared in the following graph:
Proceedings of the 2013 SAAA Biennial Conference
93
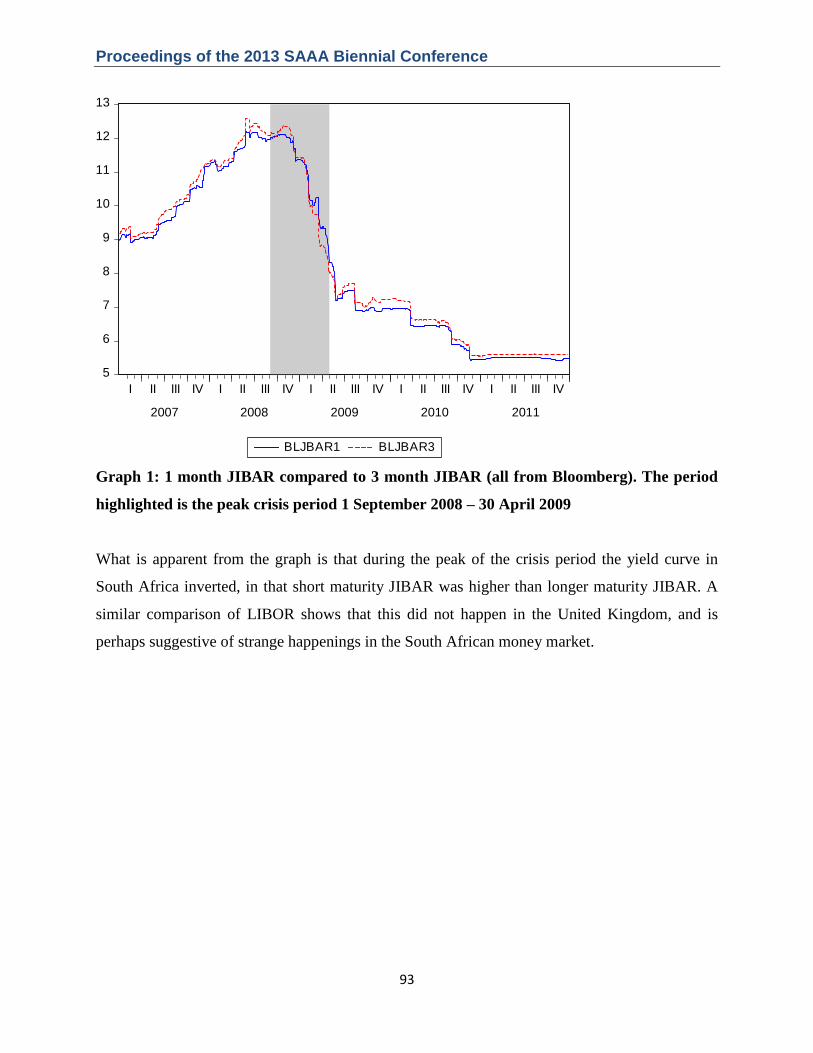
Graph 1: 1 month JIBAR compared to 3 month JIBAR (all from Bloomberg). The period
highlighted is the peak crisis period 1 September 2008 – 30 April 2009
What is apparent from the graph is that during the peak of the crisis period the yield curve in
South Africa inverted, in that short maturity JIBAR was higher than longer maturity JIBAR. A
similar comparison of LIBOR shows that this did not happen in the United Kingdom, and is
perhaps suggestive of strange happenings in the South African money market.
5
6
7
8
9
10
11
12
13
I II III IV I II III IV I II III IV I II III IV I II III IV
2007 2008 2009 2010 2011
BLJBAR1 BLJBAR3
Proceedings of the 2013 SAAA Biennial Conference
94
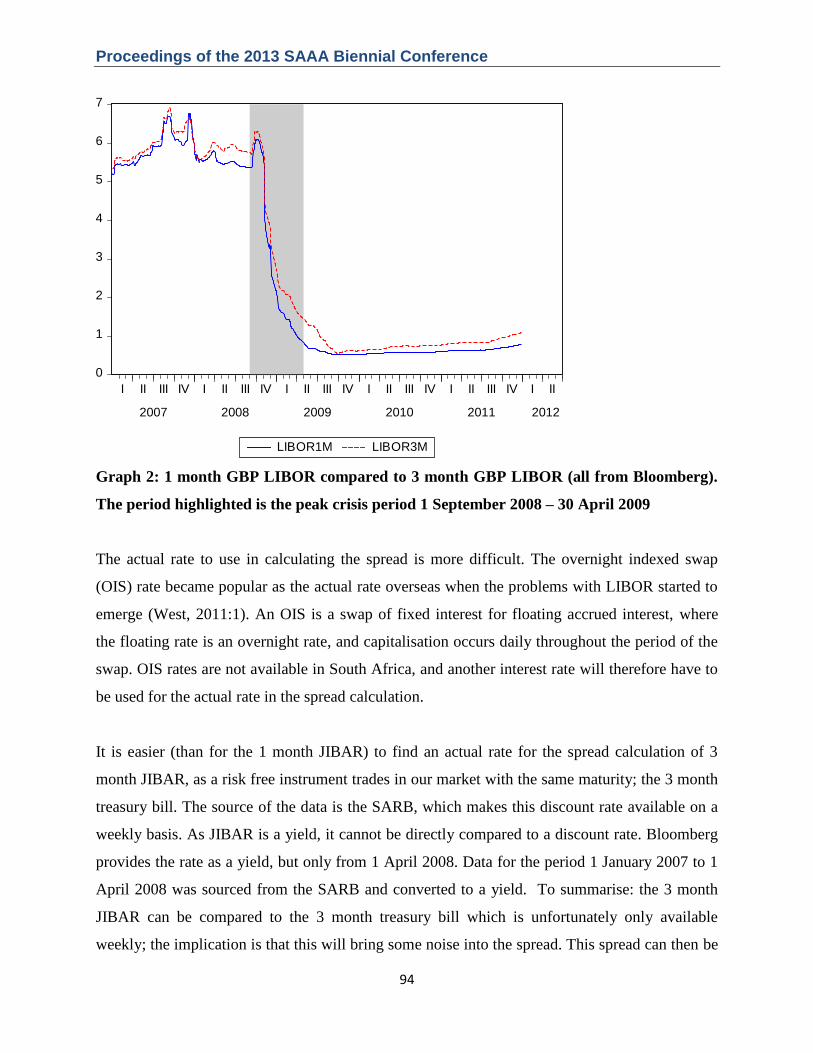
Graph 2: 1 month GBP LIBOR compared to 3 month GBP LIBOR (all from Bloomberg).
The period highlighted is the peak crisis period 1 September 2008 – 30 April 2009
The actual rate to use in calculating the spread is more difficult. The overnight indexed swap
(OIS) rate became popular as the actual rate overseas when the problems with LIBOR started to
emerge (West, 2011:1). An OIS is a swap of fixed interest for floating accrued interest, where
the floating rate is an overnight rate, and capitalisation occurs daily throughout the period of the
swap. OIS rates are not available in South Africa, and another interest rate will therefore have to
be used for the actual rate in the spread calculation.
It is easier (than for the 1 month JIBAR) to find an actual rate for the spread calculation of 3
month JIBAR, as a risk free instrument trades in our market with the same maturity; the 3 month
treasury bill. The source of the data is the SARB, which makes this discount rate available on a
weekly basis. As JIBAR is a yield, it cannot be directly compared to a discount rate. Bloomberg
provides the rate as a yield, but only from 1 April 2008. Data for the period 1 January 2007 to 1
April 2008 was sourced from the SARB and converted to a yield. To summarise: the 3 month
JIBAR can be compared to the 3 month treasury bill which is unfortunately only available
weekly; the implication is that this will bring some noise into the spread. This spread can then be
0
1
2
3
4
5
6
7
I II III IV I II III IV I II III IV I II III IV I II III IV I II
2007 2008 2009 2010 2011 2012
LIBOR1M LIBOR3M

Proceedings of the 2013 SAAA Biennial Conference
95
compared to the spread between the 3 month British pound LIBOR and the 3 month British
treasury bill rate.
For the 1 month JIBAR spread calculation a 1 month treasury bill rate is not available (as it is in
the United Kingdom). We will have to make use of another actual interest rate and unfortunately
the only options available have overnight maturities and not 1 month maturities. The implication
is that we will bring some yield curve movement noise into our spread calculation (we will later
attempt to correct for this noise). To summarise: the 1 month JIBAR can be compared to an
actual overnight interest rate; the implication is that this will bring some noise into the spread.
This spread can then be compared to the spread between the 1 month British pound LIBOR and
the 1 month British treasury bill rate.
The actual overnight rate to use is a choice between the South African benchmark overnight rate
on deposits (SABOR) from the SARB and the Rand overnight deposit interest rate (RODI) from
the JSE. SABOR is calculated with a 95 per cent weight to interbank funding at a rate other than
the current repo rate and the Top 20 call rate (the highest rates paid on non-bank deposits) and a
5 per cent weight to the implied rate on short-term funding through foreign exchange swaps. The
SARB gives no indication of what portion of the 95% is allocated to interbank funding and what
portion is allocated to the Top 20 call rate. RODI is the weighted average interest rate received
on SAFEX deposits. It is obvious that RODI is an offer rate whilst it is probably safe to assume
that SABOR is also an offer rate as the Top 20 call (thus an offer rate) rate is included in
SABOR. The implication is that, notwithstanding which actual rate we use, we will be
comparing a midrate (JIBAR) with an offer rate. When we compare the GBP 1 month LIBOR as
a quoted rate with GBP treasury as an actual rate we are using an offer rate (LIBOR) minus a
midrate (treasury). The following table summarises:
Spread calculation Correction needed for
comparability
SA 1 month JIBAR - SABOR Midrate – offer rate -0.1%
UK 1 month LIBOR - TREASURY Offer rate – midrate +0.1%
SA 3 month JIBAR – Treasury Midrate - midrate No adjustment
UK 3 month LIBOR - Treasury Offer rate - midrate +0.1%
Proceedings of the 2013 SAAA Biennial Conference
96
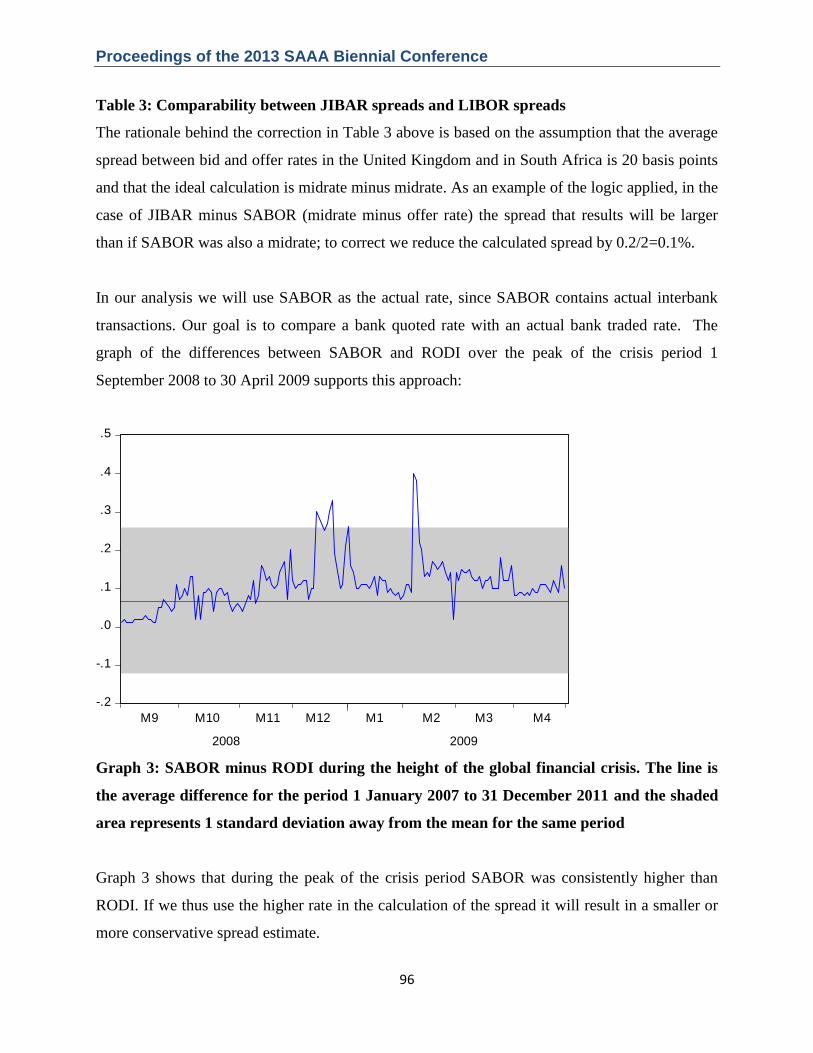
Table 3: Comparability between JIBAR spreads and LIBOR spreads
The rationale behind the correction in Table 3 above is based on the assumption that the average
spread between bid and offer rates in the United Kingdom and in South Africa is 20 basis points
and that the ideal calculation is midrate minus midrate. As an example of the logic applied, in the
case of JIBAR minus SABOR (midrate minus offer rate) the spread that results will be larger
than if SABOR was also a midrate; to correct we reduce the calculated spread by 0.2/2=0.1%.
In our analysis we will use SABOR as the actual rate, since SABOR contains actual interbank
transactions. Our goal is to compare a bank quoted rate with an actual bank traded rate. The
graph of the differences between SABOR and RODI over the peak of the crisis period 1
September 2008 to 30 April 2009 supports this approach:
Graph 3: SABOR minus RODI during the height of the global financial crisis. The line is
the average difference for the period 1 January 2007 to 31 December 2011 and the shaded
area represents 1 standard deviation away from the mean for the same period
Graph 3 shows that during the peak of the crisis period SABOR was consistently higher than
RODI. If we thus use the higher rate in the calculation of the spread it will result in a smaller or
more conservative spread estimate.
-.2
-.1
.0
.1
.2
.3
.4
.5
M9 M10 M11 M12 M1 M2 M3 M4
2008 2009

Proceedings of the 2013 SAAA Biennial Conference
97
As a final comment on South African money market interest rates emerging from our
investigation, it is worth expressing concern over the inputs used to construct the JSE zero-
coupon yield curves. The SAFEX overnight rate is used to anchor the short end of the nominal
bond curve and the nominal swap curve (JSE, 2013). It could be seen above that SAFEX is
consistently below SABOR, and arguably reflects higher credit risk than SABOR. For this
reason SABOR may perhaps be a more appropriate rate to use. More importantly, SAFEX (and
SABOR) is an offer rate. Treasury bills for 91, 182, 273 and 365 days are also used as inputs into
the nominal bond curve calculation. With the use of the treasury bill rates there is no problem
with credit risk, but it is significant to note that these rates are midrates. In this short part of the
yield curve there is therefore a lack of consistency in terms of bid, offer or midrates used.
Similarly, the nominal swap curve uses JIBAR 1 month and JIBAR 3 month as inputs in addition
to SAFEX, with the implication that this is also a mix of an offer rate and midrates.
Results
Day of the month manipulation
We investigate the second type of manipulation by using regressions with JIBAR as the variable
to be explained and explanatory variables a constant and dummies for the last day and first day
of the month. The results are presented below:
Dependent Variable: BLJBAR1
Method: Least Squares
Date: 02/13/13 Time: 14:04
Sample: 1/02/2007 12/30/2011
Included observations: 1251 Variable Coefficient Std. Error t-Statistic Prob. C 8.271089 0.071232 116.1140 0.0000
FDOM 0.015994 0.317365 0.050396 0.9598
LDOM -0.037823 0.317365 -0.119177 0.9052 R-squared 0.000014 Mean dependent var 8.270042
Adjusted R-squared -0.001589 S.D. dependent var 2.393672
S.E. of regression 2.395573 Akaike info criterion 4.587517
Sum squared resid 7161.985 Schwarz criterion 4.599823
Log likelihood -2866.492 Hannan-Quinn criter. 4.592143
F-statistic 0.008696 Durbin-Watson stat 0.000423
Prob(F-statistic) 0.991342
Proceedings of the 2013 SAAA Biennial Conference
98
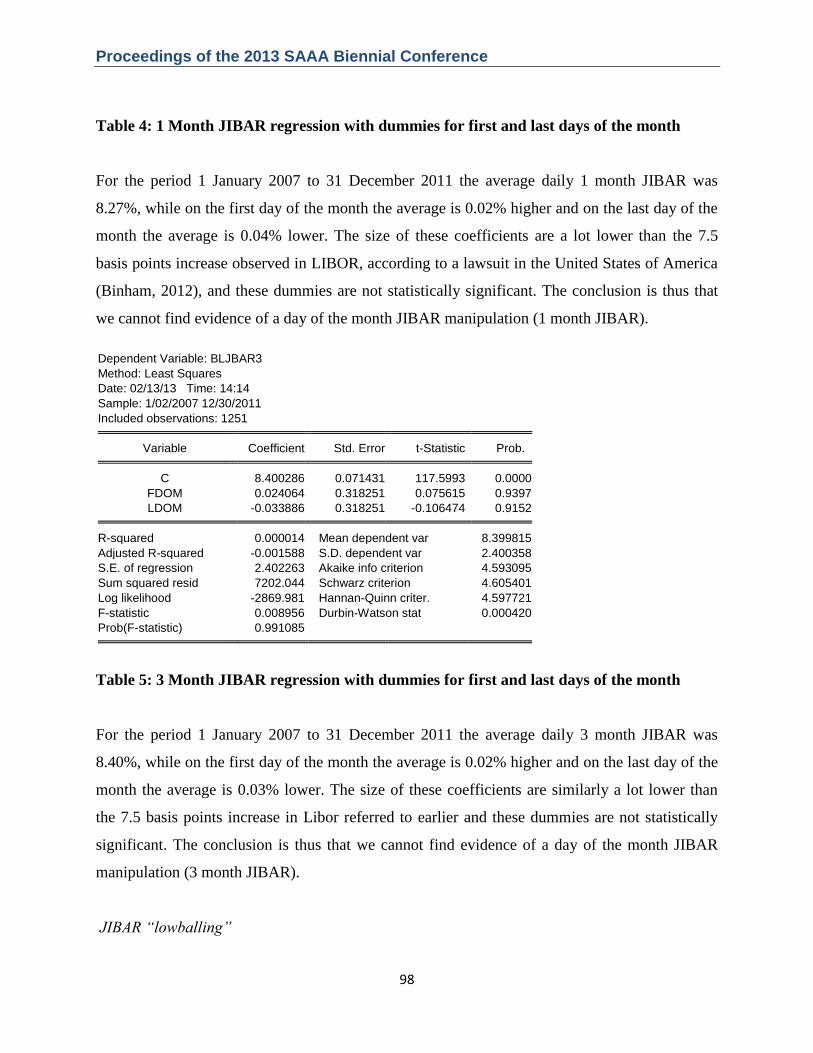
Table 4: 1 Month JIBAR regression with dummies for first and last days of the month
For the period 1 January 2007 to 31 December 2011 the average daily 1 month JIBAR was
8.27%, while on the first day of the month the average is 0.02% higher and on the last day of the
month the average is 0.04% lower. The size of these coefficients are a lot lower than the 7.5
basis points increase observed in LIBOR, according to a lawsuit in the United States of America
(Binham, 2012), and these dummies are not statistically significant. The conclusion is thus that
we cannot find evidence of a day of the month JIBAR manipulation (1 month JIBAR).
Dependent Variable: BLJBAR3
Method: Least Squares
Date: 02/13/13 Time: 14:14
Sample: 1/02/2007 12/30/2011
Included observations: 1251 Variable Coefficient Std. Error t-Statistic Prob. C 8.400286 0.071431 117.5993 0.0000
FDOM 0.024064 0.318251 0.075615 0.9397
LDOM -0.033886 0.318251 -0.106474 0.9152 R-squared 0.000014 Mean dependent var 8.399815
Adjusted R-squared -0.001588 S.D. dependent var 2.400358
S.E. of regression 2.402263 Akaike info criterion 4.593095
Sum squared resid 7202.044 Schwarz criterion 4.605401
Log likelihood -2869.981 Hannan-Quinn criter. 4.597721
F-statistic 0.008956 Durbin-Watson stat 0.000420
Prob(F-statistic) 0.991085
Table 5: 3 Month JIBAR regression with dummies for first and last days of the month
For the period 1 January 2007 to 31 December 2011 the average daily 3 month JIBAR was
8.40%, while on the first day of the month the average is 0.02% higher and on the last day of the
month the average is 0.03% lower. The size of these coefficients are similarly a lot lower than
the 7.5 basis points increase in Libor referred to earlier and these dummies are not statistically
significant. The conclusion is thus that we cannot find evidence of a day of the month JIBAR
manipulation (3 month JIBAR).
JIBAR “lowballing”

Proceedings of the 2013 SAAA Biennial Conference
99
We investigate the third type of manipulation by calculating a spread for 1 month and 3 month
JIBAR as elucidated above. The 1 month JIBAR spread has been reduced by 0.1%, and the
resultant spreads are then compared to similarly calculated United Kingdom spreads.
Graph 4: 1 month JIBAR spreads versus 1 month Libor spreads (unadjusted for yield
curve effects). The period highlighted is the peak crisis period 1 September 2008 –
30 April 2009
Regressions for both series with the spread as variable to be explained by a constant and a
dummy for the height of the crisis period give some summary statistics:
Dependent Variable: SA1MSPREAD1
Method: Least Squares
Date: 02/13/13 Time: 14:55
Sample (adjusted): 3/27/2007 12/30/2011
Included observations: 1169 after adjustments Variable Coefficient Std. Error t-Statistic Prob. C 0.355311 0.006143 57.83859 0.0000
CRISISDUM -0.197348 0.016502 -11.95892 0.0000 R-squared 0.109171 Mean dependent var 0.327962
Adjusted R-squared 0.108408 S.D. dependent var 0.206454
-1.0
-0.5
0.0
0.5
1.0
1.5
2.0
2.5
I II III IV I II III IV I II III IV I II III IV I II III IV
2007 2008 2009 2010 2011
SA1MSPREAD1 UK1MSPREAD
Proceedings of the 2013 SAAA Biennial Conference
100
S.E. of regression 0.194942 Akaike info criterion -0.430520
Sum squared resid 44.34879 Schwarz criterion -0.421856
Log likelihood 253.6388 Hannan-Quinn criter. -0.427252
F-statistic 143.0158 Durbin-Watson stat 0.092212
Prob(F-statistic) 0.000000
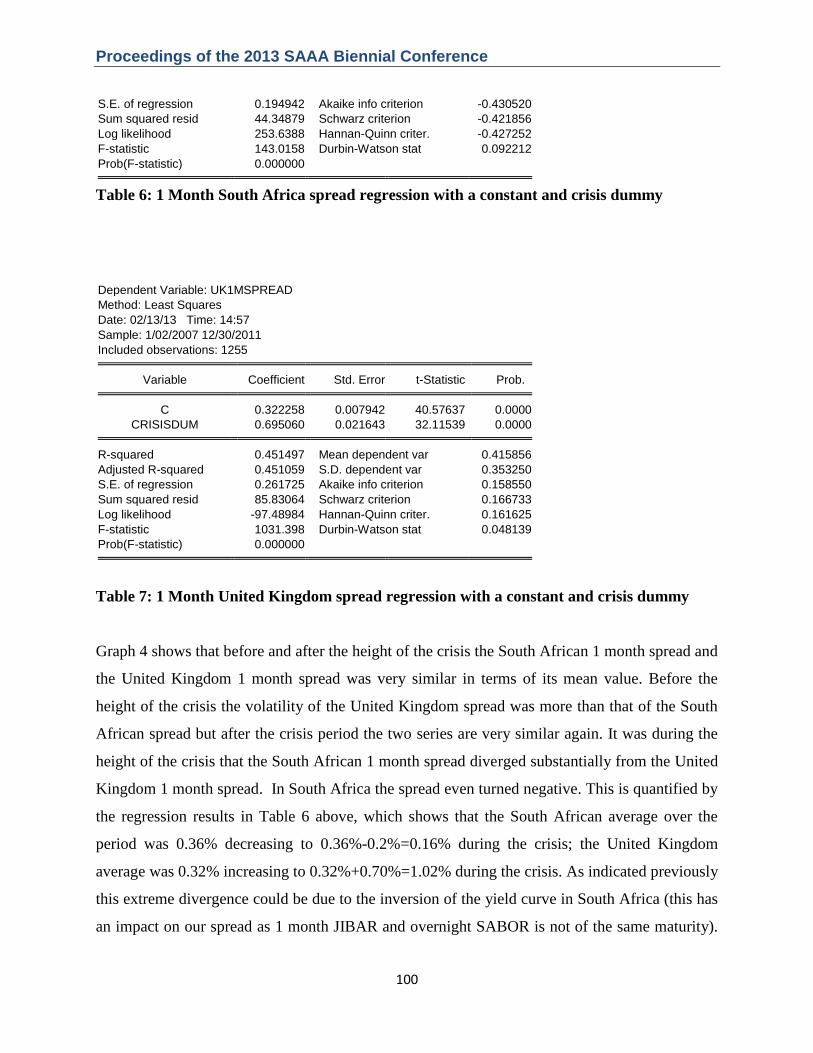
Table 6: 1 Month South Africa spread regression with a constant and crisis dummy
Dependent Variable: UK1MSPREAD
Method: Least Squares
Date: 02/13/13 Time: 14:57
Sample: 1/02/2007 12/30/2011
Included observations: 1255 Variable Coefficient Std. Error t-Statistic Prob. C 0.322258 0.007942 40.57637 0.0000
CRISISDUM 0.695060 0.021643 32.11539 0.0000 R-squared 0.451497 Mean dependent var 0.415856
Adjusted R-squared 0.451059 S.D. dependent var 0.353250
S.E. of regression 0.261725 Akaike info criterion 0.158550
Sum squared resid 85.83064 Schwarz criterion 0.166733
Log likelihood -97.48984 Hannan-Quinn criter. 0.161625
F-statistic 1031.398 Durbin-Watson stat 0.048139
Prob(F-statistic) 0.000000
Table 7: 1 Month United Kingdom spread regression with a constant and crisis dummy
Graph 4 shows that before and after the height of the crisis the South African 1 month spread and
the United Kingdom 1 month spread was very similar in terms of its mean value. Before the
height of the crisis the volatility of the United Kingdom spread was more than that of the South
African spread but after the crisis period the two series are very similar again. It was during the
height of the crisis that the South African 1 month spread diverged substantially from the United
Kingdom 1 month spread. In South Africa the spread even turned negative. This is quantified by
the regression results in Table 6 above, which shows that the South African average over the
period was 0.36% decreasing to 0.36%-0.2%=0.16% during the crisis; the United Kingdom
average was 0.32% increasing to 0.32%+0.70%=1.02% during the crisis. As indicated previously
this extreme divergence could be due to the inversion of the yield curve in South Africa (this has
an impact on our spread as 1 month JIBAR and overnight SABOR is not of the same maturity).

Proceedings of the 2013 SAAA Biennial Conference
101
To quantify the possible size of this effect the following regression was used that explained 1
month JIBAR with a constant, 3 month JIBAR and a crisis dummy:
Dependent Variable: BLJBAR1
Method: Least Squares
Date: 02/13/13 Time: 15:31
Sample: 1/02/2007 12/30/2011
Included observations: 1251 Variable Coefficient Std. Error t-Statistic Prob. C 0.019094 0.014032 1.360732 0.1738
BLJBAR3 0.977715 0.001683 580.8865 0.0000
CRISISDUM 0.290542 0.011935 24.34362 0.0000 R-squared 0.997082 Mean dependent var 8.270042
Adjusted R-squared 0.997078 S.D. dependent var 2.393672
S.E. of regression 0.129400 Akaike info criterion -1.249416
Sum squared resid 20.89708 Schwarz criterion -1.237110
Log likelihood 784.5097 Hannan-Quinn criter. -1.244790
F-statistic 213240.4 Durbin-Watson stat 0.031591
Prob(F-statistic) 0.000000
Table 8: 1 Month JIBAR explained by a constant, 3 month JIBAR and a crisis dummy
The dummy indicates that during the height of the financial crisis the average relationship
between 1 month JIBAR and 3 month JIBAR moved up by 0.29%; this is our estimate of the
yield curve effect during the crisis period. Thus, during the crisis the South African spread
moved from an average of 0.36% to 0.36% - 0.2% + 0.29% = 0.45%; an increase of
0.45% ÷ 0.36% = 1.25 times. In the United Kingdom the change was 1.02% ÷ 0.32% = 3.19
times; very similar to what was found on the 3 month spread for the United Kingdom. Even after
the adjustment for yield curve effects the South African 1 month spread is very dissimilar to the
United Kingdom 1 month spread (and to the South African 3 month spread that follows).

Proceedings of the 2013 SAAA Biennial Conference
102
Graph 5: 3 month JIBAR spreads versus 3 month Libor spreads. The period highlighted is
the peak crisis period 1 September 2008 – 30 April 2009
Graph 5 shows that for the 3 month spread the UK and South Africa moved in a broadly similar
manner over the period except that after the height of the global financial crisis a permanent gap
between the two series emerged. Unlike the 1 month South African spread the 3 month South
African spread never turns negative. Summary statistics are obtained by running similar
regression as above with the results as follows:
Dependent Variable: SA3MSPREAD
Method: Least Squares
Date: 02/13/13 Time: 15:10
Sample (adjusted): 1/05/2007 12/30/2011
Included observations: 1213 after adjustments Variable Coefficient Std. Error t-Statistic Prob. C 0.246366 0.010223 24.09883 0.0000
CRISISDUM 0.423004 0.028692 14.74312 0.0000 R-squared 0.152174 Mean dependent var 0.300070
Adjusted R-squared 0.151474 S.D. dependent var 0.361161
S.E. of regression 0.332685 Akaike info criterion 0.638405
Sum squared resid 134.0325 Schwarz criterion 0.646816
Log likelihood -385.1928 Hannan-Quinn criter. 0.641572
F-statistic 217.3595 Durbin-Watson stat 0.037601
-0.5
0.0
0.5
1.0
1.5
2.0
2.5
3.0
I II III IV I II III IV I II III IV I II III IV I II III IV
2007 2008 2009 2010 2011
SA3MSPREAD UK3MSPREAD
Proceedings of the 2013 SAAA Biennial Conference
103
Prob(F-statistic) 0.000000
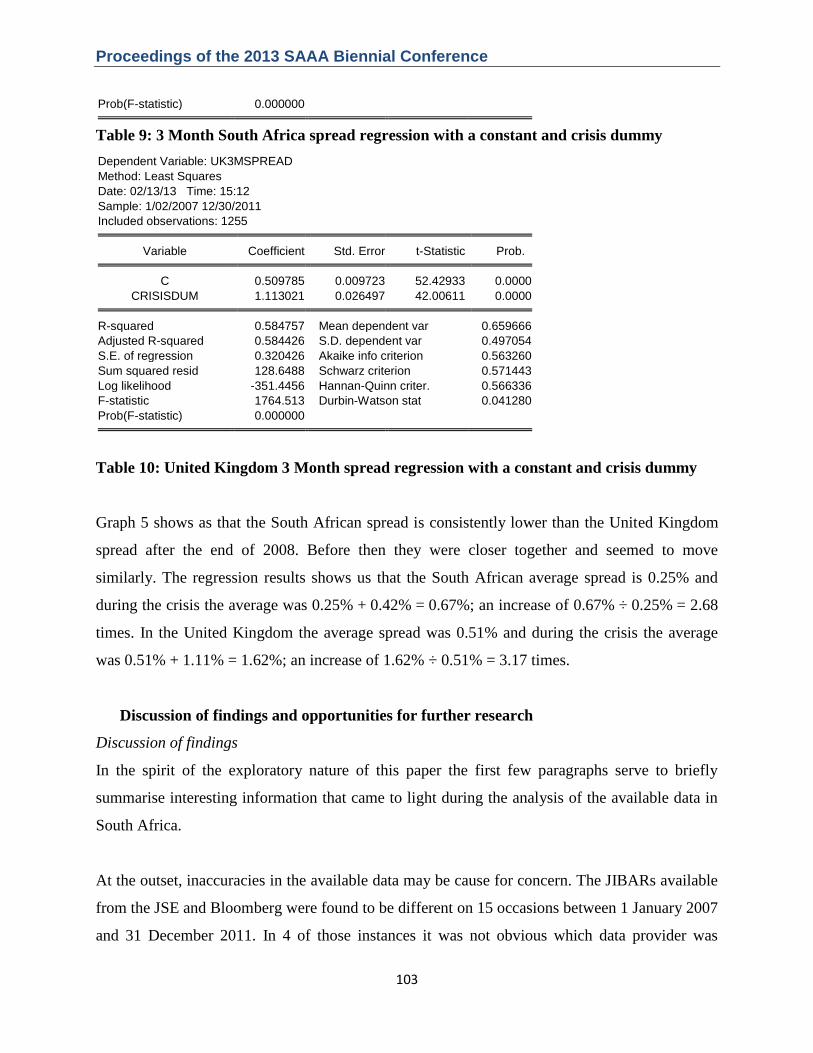
Table 9: 3 Month South Africa spread regression with a constant and crisis dummy
Dependent Variable: UK3MSPREAD
Method: Least Squares
Date: 02/13/13 Time: 15:12
Sample: 1/02/2007 12/30/2011
Included observations: 1255 Variable Coefficient Std. Error t-Statistic Prob. C 0.509785 0.009723 52.42933 0.0000
CRISISDUM 1.113021 0.026497 42.00611 0.0000 R-squared 0.584757 Mean dependent var 0.659666
Adjusted R-squared 0.584426 S.D. dependent var 0.497054
S.E. of regression 0.320426 Akaike info criterion 0.563260
Sum squared resid 128.6488 Schwarz criterion 0.571443
Log likelihood -351.4456 Hannan-Quinn criter. 0.566336
F-statistic 1764.513 Durbin-Watson stat 0.041280
Prob(F-statistic) 0.000000
Table 10: United Kingdom 3 Month spread regression with a constant and crisis dummy
Graph 5 shows as that the South African spread is consistently lower than the United Kingdom
spread after the end of 2008. Before then they were closer together and seemed to move
similarly. The regression results shows us that the South African average spread is 0.25% and
during the crisis the average was 0.25% + 0.42% = 0.67%; an increase of 0.67% ÷ 0.25% = 2.68
times. In the United Kingdom the average spread was 0.51% and during the crisis the average
was 0.51% + 1.11% = 1.62%; an increase of 1.62% ÷ 0.51% = 3.17 times.
Discussion of findings and opportunities for further research
Discussion of findings
In the spirit of the exploratory nature of this paper the first few paragraphs serve to briefly
summarise interesting information that came to light during the analysis of the available data in
South Africa.
At the outset, inaccuracies in the available data may be cause for concern. The JIBARs available
from the JSE and Bloomberg were found to be different on 15 occasions between 1 January 2007
and 31 December 2011. In 4 of those instances it was not obvious which data provider was

Proceedings of the 2013 SAAA Biennial Conference
104
correct, but in general the JIBARs from Bloomberg were deemed more accurate and complete
even though the JSE is the original source of JIBAR.
The lack of available data restricts the scope of this study. The lowest level of data available
from Bloomberg that relates to JIBAR is the daily midrate; individual rate submissions and the
spread between bid and offer rates are not available. South African treasury bill rates are only
available from the SARB as source on a weekly basis and Bloomberg also only provides the
rates on a weekly basis. A difference between Bloomberg and the SARB is that Bloomberg
provides the rate as a yield and the SARB provides the rate as a discount. No actual 1 month
maturity reference rate is available in South Africa unlike the United Kingdom that has a 1
month treasury bill rate available. There is an inconsistency in the inputs used to calculate the
nominal bond curve and the nominal swap curve; SAFEX is an offer rate whilst midrates are
used for the rest of the curves‘ inputs.
No evidence was found of a ―day of the month‖ type manipulation of JIBAR. This result is not
very surprising as few home loans in South Africa are referenced against JIBAR. Most South
African home loans are referenced against the prime interest rate. SA Home Loans‘ loans are
referenced against the 3 month JIBAR19
, but they are a relatively small player in the market and
do not take part in the JIBAR setting process. What are referenced against 3 month JIBAR, and
may possibly be significant, are the funding instruments issued by South African banks and their
securitisation vehicles (bonds and commercial paper20
). One would then expect a reduction in
rate effect, but nothing significant was observed.
The results for the 3 month spreads show that the South African spread broadly followed the
movement in the United Kingdom spread, except that the increase during the crisis in South
Africa was 15% less than the increase in the United Kingdom. If the United Kingdom system is
accepted as having ―lowballed‖ their submissions, then these results might be interpreted as the
South African system having further ―lowballed‖. But it may be argued that, since the South
19
Different reference dates are used for different products. On the 18th
or the 22nd
of the month, every quarter, SA
Home Loans references to the average 3 month JIBAR for the previous three months (SA Home Loans, n.d.). 20
Commercial paper references JIBAR on the day on which the paper is sold and that can vary (Standard Bank,
2013). An interesting question that arises is whether a relationship can be found between an individual bank‘s rate
submission and its instrument issuance.
Proceedings of the 2013 SAAA Biennial Conference
105
African banks proved to be safer (none failed during the crisis), the interest rate movements
simply reflected that fact. Another relevant factor is that South African banks tend to fund
themselves with short term debt, and thus the movement on the 1 month spreads is arguably of
more interest.
The results for the 1 month spreads show that the behaviour of the South African spread was
very different when compared to the United Kingdom spread (or the South African 3 month
spread). This difference could not be explained by yield curve effects and justifies further
research focusing on the 1 month portion of the South African money market.
The Graph 1 evidence of the inversion of the yield curve during the height of the crisis tempers
this finding somewhat. If 1 month JIBAR was already higher than 3 month JIBAR and 1 month
JIBAR was ―lowballed‖ then the inversion effect would have been worse without ―lowballing‖.
Opportunities for further research
In order to more conclusively interrogate the integrity of JIBAR this investigation needs to be
expanded to bank specific data away from industry aggregated data. An analysis of the JIBAR
submissions made by each bank would be ideal. This data can possibly be sourced by the SARB
from the individual banks. Internal bank documents such as minutes of meetings and emails
between traders and JIBAR submitters could also prove to be significant in any subsequent
investigation. A comparison between the rates submitted by each bank and movements in the
credit default swaps of that bank should also provide an indication of whether that bank‘s
submission is reasonable or not. A question that arose during an investigation into the day of the
month type manipulation is whether a relationship exists between an individual bank‘s rate
submission and that bank‘s issuance of financial instruments.
Conclusion
The manipulation of LIBOR is currently in the news. Numerous international banks have
admitted guilt and paid large fines. In South Africa, both the JSE and the SARB have argued that
the South African equivalent interest rate, JIBAR, is unlikely to have been manipulated. The
purpose of this study was to explore the possibility of the manipulation of JIBAR. The
Proceedings of the 2013 SAAA Biennial Conference
106
exploration started by first identifying the types of LIBOR manipulation that took place. The
data available in South Africa was then mapped to these types of manipulation and a decision
made as to what can be tested for, given the data and time constraints.
As part of the South African data availability analysis, interesting aspects of the local market
came to light that should be of interest for other researchers and market participants. The JIBARs
available from the JSE and Bloomberg were found to be different on several occasions, and in
general the JIBARs from Bloomberg appeared more accurate and complete, even though the JSE
is the original source of JIBAR.
The availability of data restricted the reperformance of tests used in overseas rate studies to
generate significant findings. The lowest level of data available from Bloomberg that relates to
JIBAR is the daily midrate; individual rate submissions and the spread between bid and offer
rates are not available. SABOR is preferable to RODI as an actual overnight rate but more
information is needed in the public domain as to the interbank component of SABOR. South
African treasury bill rates are available from the SARB on a weekly basis and Bloomberg also
only provides the rates on a weekly basis. A difference between Bloomberg and the SARB is that
Bloomberg provides the rate as a yield and the SARB provides the rate as a discount. No actual
1 month maturity reference rate is available in South Africa, unlike the United Kingdom that has
a 1 month treasury bill rate available. There is an inconsistency in the inputs used to calculate the
nominal bond curve and the nominal swap curve; SAFEX is an offer rate whilst midrates are
used as inputs for the rest of the curves.
We found no evidence of a ―day of the month‖ type manipulation of JIBAR. We also found that
the 3 month JIBAR behaved very similarly to the 3 month British pound LIBOR. We did find
that the 1 month JIBAR behaved in ways that cannot be explained over the height of the crisis
period. This finding should be tempered by the fact that without these anomalies the inversion of
the South African yield curve over the crisis period would have been worse, but the anomalies
found are at least supportive of the need to conduct further research into the 1 month JIBAR
setting process over the period of the financial crisis.
Proceedings of the 2013 SAAA Biennial Conference
107
References
Bank of England. 2007. Sterling Money Markets Liaison Group: Minutes of meeting Thursday
15 November 2007. [Online]. Bank of England. Available: <
http://www.bankofengland.co.uk/markets/Documents/money/mmlgnov07.pdf> [2013, 15
February].
Bank for International Settlements (BIS). 2008. BIS quarterly review March 2008. [Online].
Bank for International Settlements. Available: <http://www.bis.org/publ/qtrpdf/r_qt0803.htm>
[2013, 15 February].
BBC. 2012. Barclays boss Bob Diamond resigns amid LIBOR scandal. [Online]. BBC, 3 July
2012. Available: <http://www.bbc.co.uk/news/business-18685040> [2013, 30 January].
BBC. 2012. UBS fined $1.5 billion for LIBOR rigging. [Online]. BBC, 19 December 2012.
Available: <http://www.bbc.co.uk/news/business-20767984> [2013, 15 February].
Benson, Clea. 2012. Fannie Mae, Freddie Mac Libor Loss Tops $3 Billion in Audit. [Online].
Bloomberg, 20 December 2012. Available: <http://www.bloomberg.com/news/2012-12-
19/fannie-mae-freddie-mac-libor-loss-tops-3-billion-auditor-says.html> [2013, 15 February].
Binham, C. 2012. US woman takes fight to banks in first Libor homeowner class action.
Financial Times (London). 12 October 2012.
The Economist. 2013. Year of the Lawyer. [Online]. The Economist, 5 January 2013. Available:
<http://www.economist.com/news/finance-and-economics/21569053-banks-face-another-
punishing-year-fines-and-lawsuits-year-lawyer> [2013, 15 February].
The Economist. 2012. The rotten heart of finance. [Online]. The Economist, 7 July 2012.
Available: <http://www.economist.com/node/21558281> [2013, 15 February].
Proceedings of the 2013 SAAA Biennial Conference
108
Ellis, G. 2007. Fundamentalism in science, theology, and academia [paper on personal website].
Available: <www.mth.uct.ac.za/~ellis/Fundamentalism.pdf> [2013, 14 February].
Financial Services Authority (FSA). 2012. Barclays fined £59.5 million for significant failings in
relation to LIBOR and EURIBOR. [Online]. Financial Services Authority. Available:
<http://www.fsa.gov.uk/library/communication/pr/2012/070.shtml> [2013, 15 February].
The Guardian. 2012. Bank of England deputy governor Paul Tucker fights Libor accusations - as
it happened. [Online]. The Guardian, 8 July 2012. Available:
<http://www.guardian.co.uk/business/2012/jul/09/paul-tucker-fights-libor-
accusations?INTCMP=SRCH> [2013, 15 February].
Gongloff, Mark. 2012. New York Fed's LIBOR documents reveal cozy relationship between
regulators, Banks. [Online]. Huffington Post, 13 July 2012. Available:
<http://www.huffingtonpost.com/2012/07/13/new-york-fed-libor-documents_n_1671524.html>
[2013, 15 February].
HITC Business. 2012. Senators launch investigation into Treasury Secretary Geithner‟s
involvement in LIBOR manipulation. [Online]. Fox Business Network. Available:
<http://hereisthecity.com/2012/10/04/fox-business-networks-charlie-gasparino-reports-sen-
grassley-and/> [2013, 15 February].
International Monetary Fund (IMF). Global financial stability report October 2008 (Chapter 2).
[Online]. International Monetary Fund. Available:
<http://www.imf.org/external/pubs/ft/gfsr/2008/02/pdf/chap2.pdf> [2013, 15 February].
Johannesburg Stock Exchange (JSE). 2012. Historical JIBAR rates [email]. 10 July 2012.
Johannesburg Stock Exchange (JSE). 2012. The JSE Zero-Coupon Yield Curves Methodology
Document September 2012. [Online]. Johannesburg: JSE. Available:
<http://www.jse.co.za/Libraries/IRM-Zero-Curve/The_JSE_Zero_Coupon_Yield_Curves.sflb.
ashx> [2013, 14 February].

Proceedings of the 2013 SAAA Biennial Conference
109
Keenan, Douglas. 2012. My thwarted attempt to tell of LIBOR shenanigans. [Online]. Financial
Times, 26 July 2012. Available: <http://www.ft.com/intl/cms/s/0/dc5f49c2-d67b-11e1-ba60-
00144feabdc0.html#axzz2KxkLtE34> [2013, 15 February].
Masters, Brooke, Oakley, David and Kaminska Izabella. 2012. Bankers embark on Libor rate-
setting rethink. [Online]. Financial Times, 6 March 2012. Available:
<http://www.ft.com/intl/cms/s/0/cefbc2a6-677c-11e1-b6a1-
00144feabdc0.html#axzz2KxkLtE34> [2013, 15 February].
Mollenkamp, Carrick. 2008. Bankers cast doubt on key rate amid crisis. [Online]. The Wall
Street Journal. Available: <http://webcache.googleusercontent.com/search?q=cache:-
QRw4n8zTGwJ:online.wsj.com/article/SB120831164167818299.html+bankers+cast+doubt+on
+key+rate+amid+crisis&cd=1&hl=en&ct=clnk&gl=us> [2013, 15 February].
Moneyweb. 2012. SA banks have strong ethos and culture – Standard Bank. [Online].
Moneyweb, 29 July 2012. Available: <http://www.moneyweb.co.za/moneyweb-financial/sa-
banks-have-strong-ethos-and-culture--standard-b?sn=2009%20Detail> [2013, 15 February].
Nasiripour, Shahien. 2012. Congress starts inquiry into US LIBOR banks. [Online]. Financial
Times, 10 July 2012. Available: <http://www.ft.com/intl/cms/s/0/3d35e646-ca99-11e1-89f8-
00144feabdc0.html#axzz2JYbQy3jL> [2013, 15 February].
Rees, Malcolm. 2012. SA‘s JIBAR system not foolproof. [Online]. Moneyweb, 28 August 2012.
Available: <http://www.moneyweb.co.za/moneyweb-special-investigations/sas-jibar-system-not-
foolproof> [2013, 15 February].
Robson, C. 2011. Real world research. West Sussex: Wiley-Blackwell.

Proceedings of the 2013 SAAA Biennial Conference
110
SA Home Loans, n.d. What is JIBAR rate? [Online] Available:
<http://www.sahomeloans.com/UsefulInformation/NewClientBrochure/WhatYouNeedToKnow
AboutYourHomeLoan.aspx> [2013, 14 February].
Snider, Connan and Youle, Thomas. 2010. Does the LIBOR reflect banks‟ borrowing costs?
[Online] Available: <http://www.econ.umn.edu/~youle001/libor_4_01_10.pdf> [2013, 15
February].
Standard Bank. 2013. Email reply to question directed at conduit public representative. 14
February 2013.
South African Government Online. 2012. Money market reference interest rates in the domestic
financial markets. [Online]. South African Government, 24 July 2012. Available:
<http://www.info.gov.za/speech/DynamicAction?pageid=461&sid=29310&tid=77470> [2013,
15 February].
Touryalai, Halah. 2012. Banks Rigged Libor To Inflate Adjustable-Rate Mortgages: Lawsuit.
[Online]. Forbes.com, 15 September 2012. Available:
<http://www.forbes.com/sites/halahtouryalai/2012/10/15/banks-rigged-libor-to-inflate-
adjustable-rate-mortgages-lawsuit/> [2013, 15 February].
Trotman, Andrew. 2012. Bob Diamond questioned by MPs on Barclays LIBOR scandal: as it
happened. [Online]. The Telegraph, 4 July 2012. Available:
<http://www.telegraph.co.uk/finance/newsbysector/banksandfinance/9374516/Bob-Diamond-
questioned-by-MPs-on-Barclays-LIBOR-scandal-as-it-happened.html> [2013, 15 February].
United States District Court, S.D. New York. 2012. In re LIBOR-based financial instruments
antitrust litigation.
United States Commodity Futures Trading Commission (CFTC). 2012. CFTC order UBS to pay
$700 million penalty to settle charges of manipulation, attempted manipulation and false
Proceedings of the 2013 SAAA Biennial Conference
111
reporting of LIBOR and other benchmark interest rates. [Online]. United States Commodity
Futures Trading Commission, 19 December 2012. Available:
<http://www.cftc.gov/PressRoom/PressReleases/pr6472-12> [2013, 15 February].
West, G. 2011. Post-crisis methods for bootstrapping the yield curve. [Online]. Available:
<http://www.finmod.co.za/OISCurve.pdf> [2013, 15 February].
Wilson, Harry. 2012. BBA agrees to be stripped of role in setting LIBOR. [Online]. The
Telegraph, 25 September 2012. Available:
<http://www.telegraph.co.uk/finance/newsbysector/banksandfinance/9565940/BBA-agrees-to-
be-stripped-of-role-in-setting-Libor.html> [2013, 15 February].