Embed Size (px)
Citation preview


ACADEMIC RESEARCH and REVIEWS in ARCHITECTURE, PLANNING and
DESIGN SCIENCES
EDITORS: Prof. Latif Gürkan KAYA Ph. D.
Assoc. Prof. Fürüzan ÇELİK ASLAN Ph.D.

Academic Research and Reviews in Architecture, Planning and Design SciencesEditors:
Prof. Latif Gürkan Kaya Ph.D. Assoc. Prof. Fürüzan Çelik Aslan Ph.D.
Editor in chief: Berkan BalpetekCover and Page Design: Duvar DesignPrinting : First Edition-Mayıs 2021Publisher Certificate No: 49837ISBN: 978-625-7680-75-2
© Duvar Publishing853 Sokak No:13 P.10 Kemeraltı-Konak/Izmir/ TurkeyPhone: 0 232 484 88 [email protected]
Printing and Binding: Vadi Grafik Tasarım ve Reklamcılık Ltd. Şti.İvedik Org. San. 1420. Cad. No: 58/1Yenimahalle/ANKARAPhone: 0 312 395 85 71Certificate No: 47479
CONTENTS
Chapter-1 5The Formation Of A Campus:General Directorate Of Mineral Research And Exploration (Mta) İpek MEMİKOĞLUElif GÜNEŞ
Chapter-2 19Outdoor Thermal Comfort Indicators and Indices Muge UNAL CILEK
Chapter-3 41An Environmental Design Studio in The Distance Education Process During The Pandemic Elif BAYRAMOĞLU Seyhan SEYHAN
Chapter-4 55Interior Space Brand Identity: Strategies That Matter Shirin IZADPANAH
Chapter-5 77Comparison Of Floor Heating and Radiator Systems in Terms of Energy Efficiency in Building Heating SystemsSahika OZDEMIR


5
Chapter-1
THE FORMATION OF A CAMPUS:GENERAL DIRECTORATE OF MINERAL RESEARCH AND EXPLORATION (MTA)
Asst. Prof. Dr. İpek MEMİKOĞLU1 Assoc. Prof. Dr. Elif GÜNEŞ2
1 Atılım University, School of Fine Arts Design and Architecture, Department of Interior architecture and Environmental Design, Gölbaşı, Ankara, Turkey, [email protected]
2 Atılım University, School of Fine Arts Design and Architecture, Department of Interior architecture and Environmental Design, Gölbaşı, Ankara, Turkey, [email protected]

6

7
1. INTRODUCTIONUntil the 1960’s, Ankara witnessed many building types that were in different
styles and functions. These building types reflected the architectural style of the period and the socio-political situation. In 1960, different from the previous years, a governmental campus was constructed in Ankara referred to as the General Directorate of Mineral Research and Exploration (MTA). This paper will analyze MTA with respect to its period, constitution and how it reflects the architectural style. In addition, it aims to understand the effect of the MTA campus in the development of the city.
1.1. Ankara in the 1960’sBefore the 1950’s, Ankara had experienced the Jansen plan, although its
implementation had started with high hopes and enthusiasm, it “could not manage to overcome the process where the compact finished forms of the city plan was not able to cope with the natural changes that would occur later” (Günay, 1988, p. 32). As a result a new master plan was selected through a competition in 1955.
The Yücel-Uybadin plan, which was named after its Turkish winners, was an extension of the Jansen plan that emphasized the north-south axis. “Both in north and south of the city, limits of development were pushed to higher altitudes” (Günay, 1988, p. 34). According to the Yücel-Uybadin plan, which emphasized the importance of the Eskişehir Highway and Konya Highway, governmental buildings were to be constructed on the Eskişehir Highway. In the early 1960’s, MTA and METU (Middle East Technical University) were the first buildings to be constructed on the Eskişehir Highway and after 1980 many of the governmental buildings were situated around the Balgat junction and later along the Eskişehir Highway (Dinçer, 2006). Governmental buildings that were constructed between 1960 and 1980, were mainly gathered around Anıttepe and Genel Kurmay, such as İstatistik, Türk Standartları Enstitüsü, Karayolları, Devlet Su İşleri, Devlet Malzeme Ofisi and Türkiye ve Ortadoğu Amme İdaresi Enstitüsü. In addition, Danıştay, Toprak Mahsulleri Ofisi, Emekli Sandığı and Sosyal Sigortalar Kurumu were situated in the city center. After 1980’s Eskişehir Highway gained importance and it became a focus point for governmental buildings.
In the 1950’s, an important arena for architectural activity were competitions, which were generally held by the Ministry of Public Woks or other governmental offices. Some of the competitions were organized for the social programs of the state. Hospitals, high schools and large university campuses were among the

8
more significant architectural works of the period (Yücel, 1984). MTA, which was designed by a competition, was one of the governmental institutions that required a new space for its expanding program.
1.2. Campus PlanningCampuses have their origins in the Western tradition of the Greek agora.
The term campus was derived from the Greek terminology for a ‘green’ or open landscaped area and later, the Roman military ‘camp’ of well planned order. A paradox of freedom and control is represented by the concept (Neuman, 2003). Neuman (2003) indicates that “although the Greeks may have viewed the campus as a setting to spur the commerce the ideas, the Romans saw its order in terms of colonization and a way to bring civilization to the conquered ‘barbarians’” (p. 2).
Campus planning, its architecture and landscape are critical topics since they compose the setting that supports the mission of the institution, they create the identity that the institution portrays to its users and visitors, and they assist in sustaining the status. In other words, an institution’s physical campus is a critical component of its very existence and survival (Neuman, 2003).
Reuter, Hawks and Woodin (1987) stated that the campus does not consist of just leftover spaces between buildings. It is “a series of designed places that reflect the values of an institution’s wishes to be known for. It is a culturally dynamic, complex landscape setting. The campus must be a place that feels safe, encourages participation, enhances social interaction and appeals to students, faculty, staff and visitors on many levels” (cited in Neuman, 2003, p. 2). A well-functioning campus results when it is carefully planned and keenly managed by enduring planning framework, compelling landscape character, strong contextual architecture, controlled perimeter treatments and carefully managed encounters (Neuman, 2003).
In the national and international occasions, there are many examples of residential campus techniques that show differences in the application process. The development and formation of the campus, like cities, is effected by a variety of factors. Some basic examples for these factors can be classified such as: approaches of the campus designers, differences in the properties of the climate and region, special educational aims, different architectural characteristics that are shaped through the cultural improvements of the countries, developments in the construction techniques, expectations of the user groups and physical properties of the campus site (Türeyen, 2003). According to these factors, the most common residential campus techniques can be classified under twelve headings that are;

9
1. Compositional Style2. Mega-Structural Style3. Group Style4. Nuclear Approach5. Linear Approach6. Gridion Approach7. Epidemical Type 8. Central Type 9. Molecular Type 10. Graticule Type 11. Cross Type 12. Linear Type
2. MTA2.1. Historical Background of MTAAfter the establishment of the Turkish Republic, within the improvement and
development years, the mining matter was taken into consideration. In 1933, two independent associations were established, which were “Searching and Operating the Petroleum” and “Searching and Operating the Gold Management” that aimed at getting and making use of the underground sources. In the later years, in order to search and operate the mines with necessary geological and mining methods in a systematic way, these two associations were brought together to form the General Directorate of Mineral Research and Exploration (http://www.mta.gov.tr).
According to the establishment laws, the General Directorate of Mineral Research and Exploration, which was established on June 22, 1935 by the law number 2804, is responsible for carrying out chemical and technological analysis. They search for and find mining and stone beds and then determine whether they are appropriate for operation or not and at the same time educate engineers, assist personnel and qualified employers for the sector (http://www.mta.gov.tr). According to the foundation laws, the institution was commissioned for specific services such as:
• to reveal the under soil fortunes like minerals and stone pits in the country,
• to search about the necessities and requirements for being more effective and suitable in the management,
• to prepare and do the necessary geologic studies, exploration of minerals, practices of the chemical and technological experiments,

10
• to prepare the documentations and data’s like maps and plans for the studies,
• to educate the Turkish geologist, engineers, technicians that will work in the special studies (Yüzüncü Yıl Kutlama Kurulu, n.d.).
All these functions can be classified under three main parts as follows:
1. Long-term studies: Studies that are related with the geological structure of Turkey and the determination of the mineral potentials (studies and researches about the geology, geophysics, mineral inventory etc…).
2. Medium-term studies: Research about the availability of any specific material in Turkey.
3. Short-term studies: Detailed assessments about any raw materials and making experiments on chemical-technological-economical tests (Yüzüncü Yıl Kutlama Kurulu, n.d.)
Previously, the General Directorate of Mineral Research and Exploration institution was on an apartment floor at the opposite side of the Ankara Justice Palace. It was a small establishment that consisted of five units: accountancy, laboratory, coal, petroleum and other metals, with 38 employees in total. Later it was moved to the Akköprü foundation. Due to the rapid improvements of the General Directorate of Mineral Research and Exploration, the Akköprü foundation became inadequate and in 1967, the institution moved to its current place in Balgat campus (http://www.mta.gov.tr).
2.2. Analysis of the MTA CampusThe campus was designed by Demirtaş Kamçıl and Rahmi Bediz, who
won the competition held in 1962. The MTA campus, which is located on the Eskişehir Highway, is situated on an area of 450 000 meters square that consists of 85 service buildings with different functions. These can be stated as:
• General directorate and administration• Offices and laboratories that are related to geology, geophysics, mine
and mineral study and technical operation • Cafeteria, museum, library, sports hall and other facilities related to
social functions• Heating center, repair workshops, warehouses (Kortan, 1974).

11
The form of the MTA campus is in the “Epidemical Type” of campus planning. The most important characteristics of this type is in the use of rare building compactness and the casual distribution of the singular building groups with the natural landscape area (Figures 1, 2, 3 and 4). In addition, this type requires a very large site because of the epidemical building distribution. The development is provided by the construction of the macro-micro scaled secondary buildings in the spaces between the units. Also, common institutions are placed in a group within the same area (Türeyen, 2003).
Figure 1: Epidemical Type of Residential Campus Techniques.(Linde 1971 and Kortan, 1981)

12
Figure 2: An Example of a Site for the Epidemical Type Twente High School, Hollanda.(Linde, 1971 and Turcan, 1996)

13
Figure 3: Site Plan of the MTA Campus.(Photo taken by the researcher from campus)
14
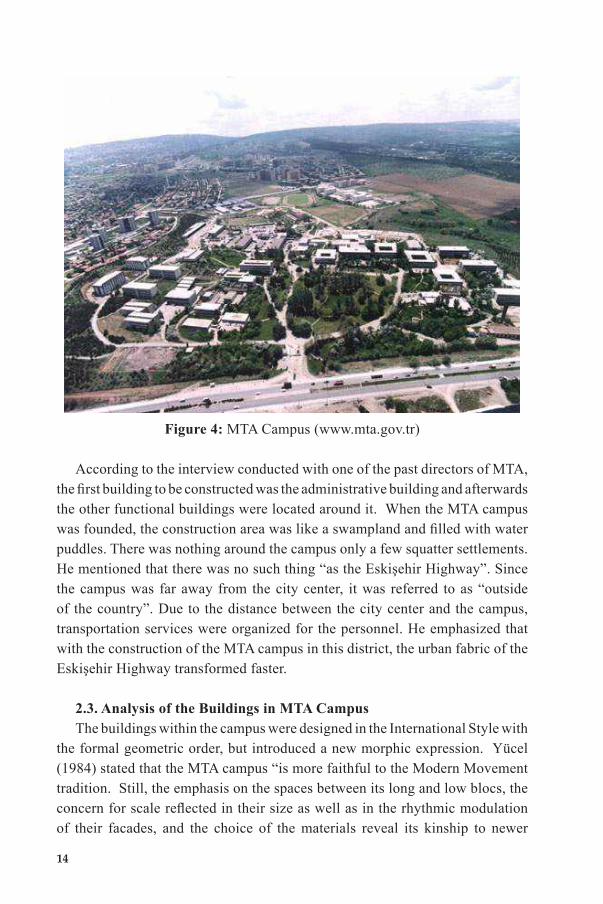
Figure 4: MTA Campus (www.mta.gov.tr)
According to the interview conducted with one of the past directors of MTA, the first building to be constructed was the administrative building and afterwards the other functional buildings were located around it. When the MTA campus was founded, the construction area was like a swampland and filled with water puddles. There was nothing around the campus only a few squatter settlements. He mentioned that there was no such thing “as the Eskişehir Highway”. Since the campus was far away from the city center, it was referred to as “outside of the country”. Due to the distance between the city center and the campus, transportation services were organized for the personnel. He emphasized that with the construction of the MTA campus in this district, the urban fabric of the Eskişehir Highway transformed faster.
2.3. Analysis of the Buildings in MTA CampusThe buildings within the campus were designed in the International Style with
the formal geometric order, but introduced a new morphic expression. Yücel (1984) stated that the MTA campus “is more faithful to the Modern Movement tradition. Still, the emphasis on the spaces between its long and low blocs, the concern for scale reflected in their size as well as in the rhythmic modulation of their facades, and the choice of the materials reveal its kinship to newer

15
approaches and render this complex different from orthodox interpretations of the International Style” (pp. 133-134). All the building types are grouped in specific areas. With respect to the main design principles, it can be seen that MTA has the properties of “Rational Architecture” such as: geometric prisms, modular coordination that are formed through the rules and systems, structural order (Kortan, 1974).
Generally, there is consistency and continuity in the planning of the buildings; these attributes provide harmony and aesthetics for all the buildings. The side facades are in the form of rough textured concrete wall that are fixed by specially prepared mould. All these types of applications are an obvious effort for the attitude of International Brutalism (Kortan, 1974). Kortan (1974) claimed that the textures that were applied on the facades were initially inspired from the building of Art and Architecture in the Yale University, which was designed by Paul Rudolph. On the other side, marble facing and plaster type of covering are used. This is a reflection of the “New Brutalism” that means ‘the use of materials in a very honest way’.
In the complex, two different modules were developed, one of them was 1.40 m for the offices and the other was 1.70 m for the laboratories. The vertical elements that were placed in these modules of the structure were used as the load bearing walls and were emptied which were called as the “Hull Wall”. Generally, the structural parts are concrete that are expressed apparently (Kortan, 1974). Since plastered brick wall is used in the sections of the offices, flexibility is not possible in the structures. Materials on the exterior are expressed apparently, but in some cases the usual materials and techniques like plaster or marble are used.
In spite of the characteristics of the main design and the facades, there is not any usage of prefabrication or pre-cast construction; the advantages of this issue are very obvious in these types of campuses that are developed over time. This can provide good results not only in economy, speed, perfectness and consistency between the buildings, but also in the usage of the technical potential of the time (Kortan, 1974).
Natural Historical Museum can be found on the grounds of the MTA campus. The first Natural Historical Museum in Europe was founded in the 16th century. However, even in 20th century, there is a lack of Natural Historical Museums in our country. MTA started the studies of constructing the first Natural Historical Museum by the knowledge of the lack, for educate the individuals who have the ability of think, search, analyze and critique. The Museum, which was established in 1935 by MTA under Atatürk’s directives, opened its doors to the scientific world and to the public in 1968 (n.a., 1998; Mymerhaba, 2007).

16
The first MTA Natural Historical Museum building is a three storey high building that consists of five departments. Materials collected from geologic, mineralogical, and paleontological research and study are exhibited in 4,000-square-meter museum (Erendil, Yıldırım, Mengi, Şener, Şahin & Göktekin, 1995). In 1970’s, worldwide unique examples of fossilized human and domestic animal footprints were kept under protection in the Natural Historical Museum of MTA (İnaner et al., 2006). But it did not show any other progresses and developments in time. In order to create a much more modern and international style, it was decided that a new museum building would be constructed in the MTA campus. The new building construction started in 1998 and ended in 2002. In 2003, the Natural Historical Museum was moved to the new building. The museum is closed because of the capital errors that were done during the construction process and in the usage of the materials (www.yenisafak.com; www.arsiv.sabah.com.tr; www.focusdergisi.com.tr).
In addition to Natural Historical Museum, the MTA Library is located in the MTA campus. It is a research library which is located on the 8th km of Eşkişehir Highway, Ankara. It is has an important capacity as it is the largest earth science library in the country and in the Middle East region. It serves in MTA General Directorate Campus and is available for everyone except the loaning publication service (http://www.mta.gov.tr). It has a large achieve that is especially concerned with earth sciences and mining subjects, by supplying the native and foreign books, periodic publications, maps, etc. There are 58.000 books, 180.000 periodical publications under 2118 titles, and 15.000 reports that contain all studies and assessments of the researches (Erendil et al., 1995).
3. CONCLUSIONThe General Directorate of Mineral Research and Exploration (MTA) is an
important institution in the Turkish Republic. Within the years, it has expanded its program resulting in a need for a larger campus. The current campus, which is situated on the Eskişehir Highway, was the first governmental campus that was designed by a competition in 1962. Due to its location, the Eskişehir Highway transformed and as a result other governmental buildings moved to the Eskişehir Highway. After 1980’s Eskişehir Highway gained importance and it became a focus point for governmental buildings. This paper aimed to analyze the MTA campus with respect to its period, constitution, architectural style. In addition, it aimed to understand the effect of the MTA campus in the development of the city.

17
REFERENCES1. Dinçer, G. (2006). Ankara kent yazıları. Ankara Üniversitesi Yayınları
No: 225.2. Erendil, M., Yıldırım, S., Mengi, H., Şener, F., Şahin, M. B. and
Göktekin, Y. (1995). Maden Tetkik Arama Genel Müdürlüğü; 60.Yıl. MTA Genel Müdürlüğü.
3. Günay, B. (1988). Our generation of planners, the hopes, the fears, the facts: Case study Ankara. Scupad SS, 20th Anniversary Congress, 6-9 May 1988: Salzburg.
4. İnaner, H., Tokçaer, M., Kaya, T., Akbulut, A., Çalapkulu, F., Mustafa, E., Nakoman, E. and Taşkıran, A. (2006). Immediate Protection of the Fossilized Human Footprints in the Kula Geopark Area. PROGEO – Sarajev.
5. Kortan, E. (1974). Türkiye’de mimarlık hareketleri ve eleştirisi 1960-1970 (pp.67-155). O.D.T.Ü. Mimarlık Fakültesi Mimarlık Bölümü.
6. Kortan, E. (1981). Çağdaş üniversite kampüsları tasarımı. O.D.T.Ü. Mimarlık Fakültesi.
7. Linde, H. (1971). Hochshulplanung, werner verlag gmbh. Düsseldorf, Germany.
8. Neuman, D. J. (2003). College and university facilities. John Wiley & Sons, Inc.
9. Reuter, D., Hawks, R. and Woodin, J. (1987). Campus: A Compendium of Planning Design. State University of New York, Syracuse Campus Environmental Improvement Program in College and University
10. Facilities. John Wiley & Sons, Inc.11. Turcan, Y. (1996). Tarihsel süreç içinde yükseköğretim yapılarının
mekansal analizi. Karadeniz Teknik Üniversitesi.12. Türeyen, M. N. (2003). Yükseköğretim kurumları ve kampuslar. Tasarım
Yayın Grubu.13. Yücel, A. (1984). Pluralism takes command: The Turkish architectural
scene today. Modern Turkish Architecture, pp.119-152.14. Yüzüncü Yıl Kutlama Kurulu. (n.d.). Atatürk Madencilik ve MTA: 1935-
1981. M.T.A Matbaası. 15. ---. (1980). Mimar, 2, p.10. 16. Mymerhaba. (2007). MTA Natural History Museum. Retrieved October
26, 2007 from Mymerhaba web site: http://www.mymerhaba.com/MTA-Natural-History-Museum-in-Turkey-849.html
17. MTA General Directorate retrieved from http://www.mta.gov.tr

18
18. Yeni Şafak, retrieved from www.yenisafak.com 19. Arşiv Sabah, retrieved from www.arsiv.sabah.com.tr 20. Focus Dergisi, retrieved from www.focusdergisi.com.tr

19
Chapter-2
OUTDOOR THERMAL COMFORT INDICATORS and INDICES
Muge UNAL CILEK1
1 Cukurova University, Faculty of Architecture, Landscape Architecture Department, 01330, Adana, TURKEY


21
1. INTRODUCTIONCities are a type of settlement that meets society’s needs, such as settlement,
work, accommodation, entertainment, and rest. Cities are places where people from different social and cultural classes, different ethnic groups and characteris-tics come together. Rapid population growth has led to rapid urbanization around the world. This situation caused the land cover to deteriorate and the transforma-tion of rural areas into urban areas, the decrease in the understanding of urban planning and design integrated with the environment, the formation of unplanned urban geometry and the change of urban climate (Zheng et al. 2018, Geletič et al. 2019, Hu et al. 2019, Quan 2019, Ochola et al. 2020)Environmental problems brought about by rapid urbanization did not remain at a regional scale but showed their effects on the world. Therefore, it has become a necessity to take both lo-cal and global measures. Increasing environmental problems with urbanization, transformation in surface change due to the fact that permeable natural areas (soil, grass, etc.) are replaced by impermeable artificial areas (concrete, asphalt, etc.) The temperature difference between urban and rural areas due to anthropo-genic effects has been defined as the urban heat island phenomenon (Budhiraja et al. 2019, Gholami and Beck 2019, Hu et al. 2019, Chen et al. 2020). Although urban heat island studies are among the most common topics in the literature in recent years, they differ in cities according to location, urban morphology and lo-cal climate zones (Alchapar and Correa 2016).
The urban heat island (UHI) phenomenon arises as a result of many factors. The most important ones are summarized as follows (Voogt and Oke 1997, Em-manuel and Fernando 2007, Kuşçu Şimşek and Şengezer 2012):
• Radiative characteristics of the city canyon,• Thermal properties of materials used in the city,• Increase of human-induced atmospheric emissions,• Increase of the greenhouse effect in the city,• The decrease in the number of open areas in cities where evaporation oc-
curs and the surfaces of open areas turn into impervious surfaces,• The formation of the canyon radiation geometry that reduces the effective
albedo of the system due to the multiple reflections of the shortwave radi-ation between the canyon surfaces,
• Low turbulence heat transfer on the streets,

22
Although UHI studies generally based on urban development, surface materi-als, climatic factors, and vegetation, the focus of these studies is human comfort. Therefore, the design with climate in urban studies has importance to increase the quality of life. Design with climate can generally be defined as urban design with the bioclimatic condition of the city. Today’s urban designers also describe this situation as balancing the environment, and they call these studies design with climate (Olgyay 2015).
The aims of design with climate can be summarized as follows:
• Creating microclimatic conditions to increase bioclimatic comfort by tak-ing advantage of the existing climatic condition of a city,
• Reducing energy use to eliminate the adverse effects of climatic condi-tions such as cooling, air circulation, humidification, etc., benefiting from solar and wind energy (energy efficient design),
• Determining the location and orientation of buildings according to climat-ic conditions to minimize the negative effects of climate,
• Preventing the formation of urban heat islands that have negative effects on people (Panagopoulos 2008),
• Public space should be located according to the climatic condition of the city,
• Increasing the thermal comfort of indoor and outdoor spaces with suitable plant species and planting design,
• To improve energy efficiency in material selection and use.
Bioclimatic comfort is the location where people can feel the most comforta-ble and productive in terms of physical and spiritual, and where climatic condi-tions (temperature, humidity, wind, etc.) coexist. According to thermal condition, the bioclimatic comfort level of cities can be increased by the design of building, streets, urban open spaces, and urban green spaces. Accordingly, the criteria that should be considered, especially in design with climate, can be grouped under two categories:
• Structural criteria: Buildings with suitable location and orientation ac-cording to the characteristics of slope, aspect and climate, suitable build-ing distance, building aspect ratios, and material properties,
• Open and green areas design criteria: Green systems surrounding the urban area and building area, pedestrian zones, squares, plant types,

23
plant densities, accessibility to green areas, etc. (Sobin and Olgyay 1963, Altunkasa 1987)
Studies on indoors and outdoors climatic comfort dates back to ancient times. In the first settlements, such as Ancient Egypt, Ancient Rome, Sumer, Assyria and Spain, the building and building environments were planned and designed to reduce the climate’s negative effects. Some of the climate design characteris-tics used in ancient times are: (i) planning canyons that will allow shadow and air circulation; (ii) gardens and courtyards where the cooling effect of water and vegetation is prioritized; (iii) narrow and curved streets designed for protection from the extreme effects of the sun; (iv) the use of high and thick walls in build-ings (Altunkasa 1987).
Previous studies conducted before the 20th century developed and applied as a result of long experience and lifestyles. On the other hand, planning and designed with the climate in large urban residential areas and optimal use of open and green spaces in the city emerged at the beginning of the 20th century. However, scientific results for climate design were published and put into practice after the middle of the 20th century. The concepts of bioclimatic comfort in the 1950s and thermal comfort in the 1980s were included in the climatic studies.
In the International Organization for Standardization (ISO) ISO 7730-1994 standards, thermal comfort is defined as a state of mind that expresses satisfaction from the thermal environment. Generally, this definition is easily understandable; however, it is difficult to quantify as thermal comfort may vary from person to person (Emmanuel and Fernando 2007). Therefore, thermal comfort can be de-fined as most individuals’ climatically comfortable state while carrying out their indoor or outdoor activities (Altunkasa 1987, Hisarligil 2013, Yücekaya 2017). Although the concept of thermal comfort became widespread in the 1980s, it has been studied since the 1930s. Thermal comfort is essential for three main reasons. The first one is the creation of a climatically comfortable space for the users. The second one is the minimization of consumption due to intense energy use. The last one is the establishment of standards for improving thermal comfort (Salur 2016). Defining climatic comfort zones has become a necessity to achieve these goals. The climatic comfort zone defined as the temperature range in which the body temperature is in a balanced relationship with the natural conditions, with-out the need for any energy source. Since the 1960s, heat balance models of the human body have become increasingly accepted in thermal comfort assessment. The basis of these models is the human energy balance equation (Matzarakis and Amelung 2008). Three climatic comfort models, which are the basis of current
24
studies that enable the definition of comfort zones by quantifying thermal com-fort, are widely used in the literature.
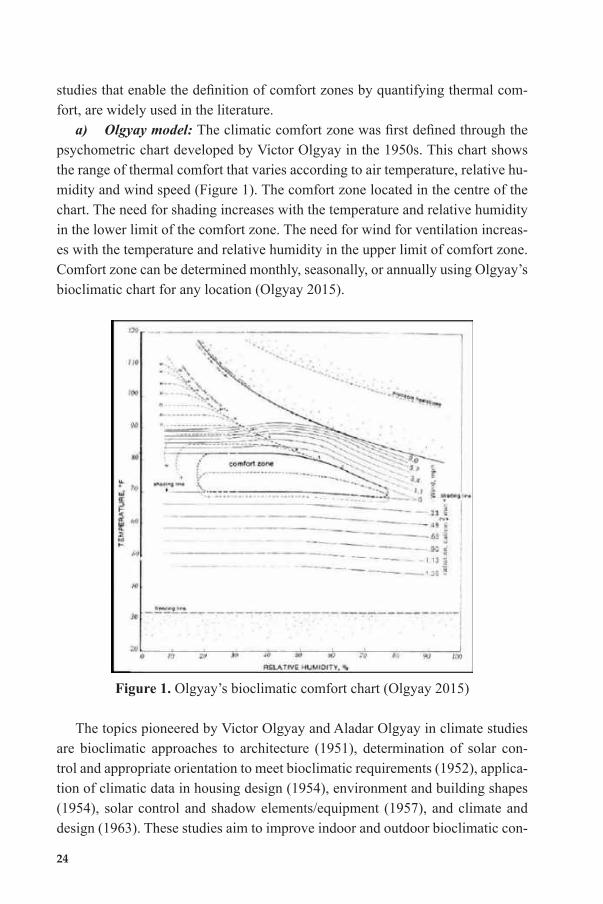
a) Olgyay model: The climatic comfort zone was first defined through the psychometric chart developed by Victor Olgyay in the 1950s. This chart shows the range of thermal comfort that varies according to air temperature, relative hu-midity and wind speed (Figure 1). The comfort zone located in the centre of the chart. The need for shading increases with the temperature and relative humidity in the lower limit of the comfort zone. The need for wind for ventilation increas-es with the temperature and relative humidity in the upper limit of comfort zone. Comfort zone can be determined monthly, seasonally, or annually using Olgyay’s bioclimatic chart for any location (Olgyay 2015).
Figure 1. Olgyay’s bioclimatic comfort chart (Olgyay 2015)
The topics pioneered by Victor Olgyay and Aladar Olgyay in climate studies are bioclimatic approaches to architecture (1951), determination of solar con-trol and appropriate orientation to meet bioclimatic requirements (1952), applica-tion of climatic data in housing design (1954), environment and building shapes (1954), solar control and shadow elements/equipment (1957), and climate and design (1963). These studies aim to improve indoor and outdoor bioclimatic con-
25
ditions and to make appropriate design suggestions. Especially the bioclimatic chart developed by Olgyay (1963) is still one of the most common methods used in microclimatic studies. Olgyay (1963) has set two criteria for determining the bioclimatic comfort and needs of a settlement by considering the climatic con-ditions: the optimum direction and location according to climatic condition. The main determinants of these criteria are temperature, solar radiation energy, rela-tive and specific humidity, and wind speed. The researcher determines the settle-ment’s topography, land use types, building characteristics, building order, sur-face properties, material properties, green areas, etc. It has created climate-based planning and design for settlements in different climatic zones. Moreover, Olg-yay and Olgyay (1976) developed a method that can be used to control the sun rays and shadow with a suitable location, orientation and spatial order to improve indoor and outdoor thermal comfort conditions (Barber 2017).
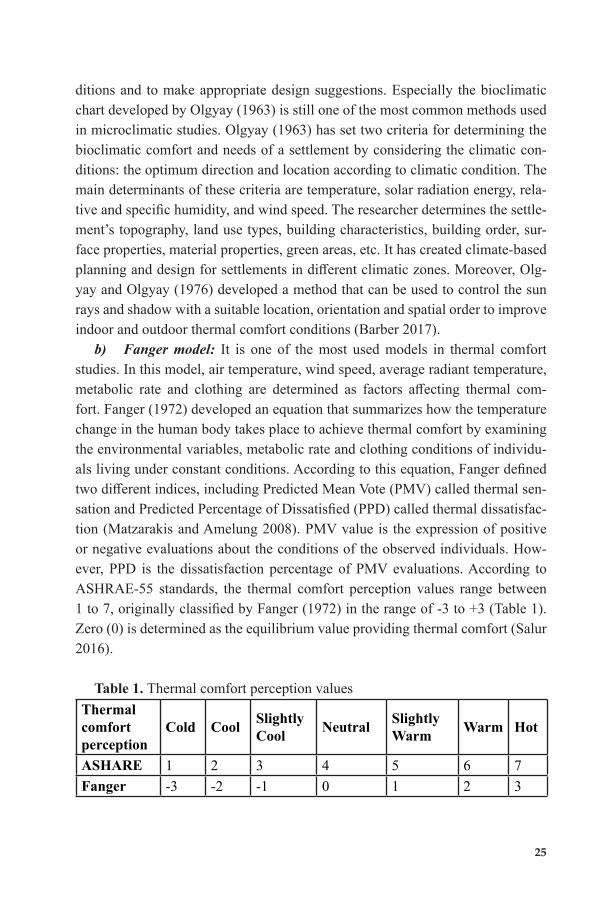
b) Fanger model: It is one of the most used models in thermal comfort studies. In this model, air temperature, wind speed, average radiant temperature, metabolic rate and clothing are determined as factors affecting thermal com-fort. Fanger (1972) developed an equation that summarizes how the temperature change in the human body takes place to achieve thermal comfort by examining the environmental variables, metabolic rate and clothing conditions of individu-als living under constant conditions. According to this equation, Fanger defined two different indices, including Predicted Mean Vote (PMV) called thermal sen-sation and Predicted Percentage of Dissatisfied (PPD) called thermal dissatisfac-tion (Matzarakis and Amelung 2008). PMV value is the expression of positive or negative evaluations about the conditions of the observed individuals. How-ever, PPD is the dissatisfaction percentage of PMV evaluations. According to ASHRAE-55 standards, the thermal comfort perception values range between 1 to 7, originally classified by Fanger (1972) in the range of -3 to +3 (Table 1). Zero (0) is determined as the equilibrium value providing thermal comfort (Salur 2016).
Table 1. Thermal comfort perception valuesThermal comfort perception
Cold Cool Slightly Cool Neutral Slightly
Warm Warm Hot
ASHARE 1 2 3 4 5 6 7Fanger -3 -2 -1 0 1 2 3

26
c) Givoni model: Givoni predicted indoor comfort according to outdoor cli-matic conditions with the bioclimatic chart (Hisarlıgil 2009, Salur 2016). Givoni, who examined the relationship between air temperature and absolute humidity, aimed to develop designs for different climatic zones that can control climat-ic comfort with passive methods. Givoni bioclimatic chart (1976) shows the change in the comfort zone according to air temperature and relative humidity (Figure 2). The chart shows all the relationships between dry bulb temperature, wet bulb temperature, relative humidity and dew point.
Figure 2. Givoni’s bioclimatic comfort chart (Givoni, 1976)
Although these models were initially used to evaluate indoor climatic com-fort, they have been the primary studies for outdoor thermal comfort (Altunkasa 1987, Hisarligil 2013, Yücekaya 2017). Early studies of thermal indices were of-ten limited to estimating the combined effect of air temperature, air humidity, and air velocity on immobile people, including simple approximations. The impact of human physiology, activity, clothing and other personal data (height, weight, age, gender, etc.) was ignored (Olgyay, 1969; Fanger, 1972; Givoni 1976; ASHRAE, 2001).

27
2. OUTDOOR THERMAL COMFORT INDICATORSContrary to indoor comfort, outdoor thermal comfort is a relatively new re-
search area. Determining outdoor comfort is more complex than indoor comfort due to the spatial and temporal microclimatic variations of meteorological varia-bles. Examples include the lack of climate control in the outdoor, physical and so-cio-cultural adaptation of individuals and a wide variety in outdoor use and users. Therefore, it is not suitable to directly implement any indoor thermal comfort ap-proach in outdoor thermal comfort assessment (Johansson et al. 2014). To evalu-ate the outdoor thermal comfort, it is necessary to take into account human char-acteristics as well as climatic variables. As a result, the comfort indicators used to evaluate outdoor thermal comfort are grouped into two classes as climate-based indicators and human-based indicators.
2.1. Climate-based indicatorsClimate-based indicators contain four climatic elements that effectively main-
tain the balance between the atmosphere and the human body.a) Temperature: There are two concepts in temperature, namely air temper-
ature and perceived temperature. While the air temperature includes quantitative values measured with a dry thermometer, the perceived temperature expresses the air temperature’s effect on the human body by changing with wind and humidity. The thermal comfort perception is determined by the relationship between the av-erage human body temperature (36.5℃) and the average atmosphere temperature (23℃). While the thermal comfort is in equilibrium between these temperatures, the human body perceives cold or sweat outside of these temperatures (Figure 3).
Figure 3. Human body and atmosphere temperature relationship (Salur 2016)
28
b) Mean Radiant Temperature (MRT): It is the energy stored by any sur-face radiation type. While it is an undesirable temperature in the hot period, it is a desired temperature in the cold period. MRT can be controlled by changing land-scape design, surface materials, vegetation species and density, and architectural details. Therefore, MRT can reach different values at different points of the same space.
c) Airflowvelocityorwindvelocity:Winds caused by the movement of hot and cold air with pressure change is another indicator that affects thermal com-fort. As the temperature difference increases, the speed of air movement increas-es. It shows different effects between seasons depending on the wind strength and wind direction. While it is a desired feature with its cooling effect in the summer months, it is a feature that should be taken precautions or controlled as it causes cold in the winter months.
d) Humidity: Humidity is the amount of water vapour in the air. There are two types of humidity as absolute and relative humidity. Absolute humidity the humidity value in the unit air, while relative humidity is the value expressing what percentage of the absolute humidity in the saturated air at the same temper-ature constitutes. Humidity is an essential factor affecting comfort conditions. Es-pecially in humid indoor conditions, the airflow velocity significantly affects the perceived temperature. In cases where the temperature is high, humidity causes a feeling of depression; on the other hand, when the temperature is low, it causes a chill feeling. Due to the inverse relationship between air temperature and relative humidity, the humidity rate should decrease as the temperature increases. Thus, thermal comfort can be improved. Humidity is a vital climate element that should be controlled to provide thermal comfort.
2.2. Human-based indicatorsHuman-based indicators such as users’ activities, clothing, age, gender, gen-
eral health status, and subcutaneous fat ratio are important besides climate-based indicators to determine outdoor thermal comfort. Although these indicators dif-fer according to individuals, average values were accepted according to clothing types and activity types.
a) Clothing: One of the essential features to provide thermal comfort is clothing. The highlight is the thermal properties of the clothes. Clothes are nec-essary for people in different atmospheric conditions to maintain their body tem-perature. Clothing varies according to seasons, regions, cultural characteristics and activities. The clothing’s function creates a heat regulation system that will

29
keep the body temperature at the average value, even if the external environmen-tal conditions and physical activities vary. Since weather conditions cannot be changed according to individuals, clothes properties such as thinness-thickness (cutting the airflow), colour, and texture (radiation storage) are determinant for outdoor thermal comfort. Therefore, Clo values of clothes with different charac-teristics are decisive for determining outdoor thermal comfort (Figure 4).
Figure 4. Clo values of clothes with different characteristics (Marmaralı et al. 2006)
b) Metabolic rate: The thermal balance of the body varies according to the activities in daily life. Different activities such as running, sitting and walking dur-ing the day we start after sleeping cause a certain amount of body temperature change. Despite this temperature change, the body tries to reach its thermal balance in a certain period. Values expressed with Met and called metabolic rate were de-termined for some activities to evaluate outdoor thermal comfort (Figure 5).
Figure 5. Met values of activity types (Cao et al. 2014)

30
c) Age: Differences in metabolic rate and limitation of activity types ac-cording to different age groups emerge as an outdoor thermal comfort indicator. Depending on the metabolic rate in the same environmental condition where the elderly is cold, children can perceive warmth, and adults feel comfortable. Be-sides, if some public spaces serve users of different age groups, the criteria to be considered in thermal comfort will require a more detailed examination. There-fore, thermal comfort can be calculated by accepting the average value for users of different age groups for the same space.
d) Gender: Metabolic rate and some blood values may differ between males and females. While women are more affected by cold weather conditions, their defence mechanisms against heat, that is, sweating activity, work slower than men. The change in hormone values caused by the gender difference causes dif-ferent metabolic rates, frequency, and sweating levels. However, if the air tem-perature is assumed to be constant in space, people will be affected differently by the air velocity rate. For example, the age, weight, clothing condition are the same in the two genders, and the felt temperature value may differ. All these val-ues are results in line with the assumption that the users are healthy individuals.
e) Subcutaneous fat ratio: Subcutaneous fat ratio, which is closely related to whether the individual is healthy or not, is considered a thermal comfort factor. This ratio is another value that differs according to gender. Therefore, it is an es-sential factor in the adaptation process. Subcutaneous fats, which serve as a pro-tective function for our tissues, cause changes in comfort parameters among users in the same place.
3. OUTDOOR THERMAL COMFORT INDICESToday (2020), there is no international standard for evaluating outdoor ther-
mal comfort, although outdoor thermal comfort studies are common in litera-ture. However, there are several criteria lists and guidelines that include human biometeorological studies. The American Society of Heating, Refrigerating, and Air-Conditioning Engineers (ASHRAE) studies are essential in determining the criteria and guides for thermal comfort.
ASHRAE is an international association founded in 1894 with more than 52,000 members in more than 130 countries, including Turkey, working in ener-gy efficiency, spatial air quality, building installation systems and sustainability. The criteria and measures for thermal comfort are determined by internationally accepted standards such as ISO 7730 and ASHRAE Standard 5-2004. For exam-ple, under the title of ASHRAE Standard 5-2004 (Thermal Environmental Con-ditions for Human Occupancy), thermal comfort is defined as the conditions that

31
a significant part of the people in a certain environment find thermally acceptable.In general, thermal indices were used to evaluate and classify thermal com-
fort. In recent years, more than a hundred Human Thermal Indices, which in-clude human-based indicators as well as climate-based indicators, have been de-veloped. However, indices developed specifically to evaluate outdoor thermal comfort are limited in number (ASHRAE 2001, Höppe 2002, Ali-Toudert et al. 2005). The most common outdoor thermal comfort indices in international stud-ies are given below.
• Predicted Mean Vote (PMV): PMV is a thermal index developed by Fanger (1972) based on test data for 1565 areas in an indoor environment. Fanger (1972) equation, originally designed to measure indoor thermal comfort, was modified and developed by Jendritzky and Nübler (1981) for outdoor conditions. PMV estimates the average value of the thermal comfort state of a large group of people using four weather indicators. The climate indicators used are air temperature, radiant temperature, wind speed and humidity. It also uses two human-induced parameters: clothing level and metabolic rate. The PMV scale is defined between -3 (very cold) and +3 (very hot), where 0 is the thermal neutral (comfort) value. (ASHRAE 2001, ISO 7730 2005, Berkovic et al. 2012, Lai et al. 2014).
• EffectiveTemperature(ET): It has been developed for indoor and outdoor conditions such as ET, PMV and SET. ET is an experimentally determined index of combinations of dry bulb temperature, humidity, mean radiant tem-perature (MRT) and air movement (ASHRAE 2001).
• StandardEffectiveTemperature(SET): SET is the dry-bulb air tempera-ture of an environment at 50 percent relative humidity for a person wear-ing formal clothing for a specific activity in the real environment. In other words, SET is a temperature metric that influences relative humidity, aver-age irradiation temperature, and wind speed and also takes into account the expected activity rate and clothing levels (ASHRAE 2001; Blazejczyk et al. 2012).
• Perceived Temperature (PT): The Perceived Temperature is equivalent to a complete heat budget model of the human body. Its suitability has proven with a wide range of applications from micro to a global scale; in addition, it is used successfully in daily predictions and climatological studies. This index is designed for outdoor comfort and is defined as the air temperature of a reference environment where the thermal perception will be the same as in the real environment (VDI 3787 2008; Blazejczyk et al. 2012).

32
• Physiological Equivalent Temperature (PET): PET is the air temperature in a typical indoor environment (without wind and solar radiation) at which the human body’s heat budget is balanced with the same skin temperature as in the complex outdoor conditions to be evaluated (Höppe, 1999). PET is a thermal comfort index based on a prognostic model of human energy balance that calculates skin temperature, body core temperature, sweat rate, and clothing temperature as an auxiliary variable. It is based on the 2-node model proposed by Gagge et al. (1971) and was compiled by Höppe (1984) and expanded to the Munich Energy Balance Model for individuals. PET, which is initially ignored by the thermal differences of seasons and climatic zones, converted into equivalent physiological stress on humans before the recalculated for three climatic periods, including cold, warm, and hot peri-ods (Wang et al. 2018). Compared to PMV and PET, PET is more intuitive and has the advantage of allowing users to compare the integrated effects of complex outdoor thermal conditions with people’s thermal experience. Therefore, it is more widely used to determine outdoor thermal comfort. In addition, with its easily recognized unit of degrees Celsius (℃), PET is also important for users such as urban planners, landscape architects, and deci-sion-makers (Lin and Matzarakis, 2008).
• Universal Thermal Climate Index (UTCI): The number of 45 scientists developed UTCI from 23 countries with a multidisciplinary background to standard human biometeorology practices. It is expressed as the equiv-alent ambient temperature of a reference environment that causes the same physiological response as real conditions. It is based on the Fiala mul-ti-knot model of human thermal regulation with an adaptable clothing model. Static clothing insulation in the clothing model is adjusted accord-ing to the ambient air temperature, taking into account Europeans’ sea-sonal clothing habits. This index is suitable for thermal evaluations in all climates and seasons and all scales. Air temperature at 10 m above ground, mean radiant temperature, relative humidity and wind speed are required for calculation (Blazejczyk et al. 2012).
4. CONCLUSIONWith the development of technology in the 2000s, remote sensing techniques
and the microclimate simulation (ENVI-met, Rayman, SkyHelios, etc.), compar-ative urban heat island studies in compact urban area, low-density historical city centre, industrial and tourism cities have accelerated. Outdoor thermal comfort indices, which were initially calculated manually according to mathematical for-

33
mulas, began to be calculated and visualized by a microclimatic model in which complex data structure integrated. Models contribute to analysis in different res-olutions from local to regional scale to determine the climatic differences arising from the design features’ changes (different building type, aspect ratio, water and green surface ratio, albedo, etc.). According to scenarios, models develop principle and recommendations in line with the climate-based design (Bruse and Fleer 1998, Huttner 2012, Acero and Herranz-Pascual 2015, Alchapar and Correa 2016)the lower part of the atmosphere where we live is very sensitive to small scale processes which can develop an individual local climate, different to the expected average conditions. Especially in urban areas the great variety of differ-ent surfaces and sheltering obstacles produces a pattern of distinct microclimate systems. To simulate these local effects, microscale surface-plant-air interaction schemes with a special extension to typical artificial urban boundaries are need-ed. The paper focuses on the microscale numerical simulation of surface-plant-air interactions inside urban structures, especially the feedback between artificial surfaces like buildings and vegetation inside street canyons, backyards or greens. The three-dimensional non-hydrostatic model ENVI-met is presented and used to solve the basic equations forward in time and can simulate ‘hard’ wind field modifications (solid boundaries.
In literature, there are many different study subjects, mainly in hot-arid and hot-humid urban areas. These studies subject were listed below:
• The effects of different physical characteristics such as orientation, as-pect ratios and shape on courtyard’s microclimate (Ghaffarianhoseini et al. 2015, Salur 2016, Nasrollahi et al. 2017);
• The outdoor thermal comfort of campus area with scenarios according to different design and planting principles (Srivanit and Hokao 2013, Taleghani et al. 2014, Salata et al. 2016);
• Planting scenarios according to suitable plant species and type in the pe-destrian zone, squares, urban canyon, green areas (Morakinyo et al. 2018)a parametric study was conducted to investigate the thermal and energy saving benefits in a selected neighbourhood with its current greenery cov-erage ratio (GCR
• The effects of different design elements such as material albedo, the ratio of water, the green and impervious surface on urban public spaces to im-prove outdoor thermal comfort (Perera 2015, Chatzidimitriou and Yannas 2016, Kántor et al. 2018)together with LCZ-based morphology simula-tions (ENVI-met;

34
• The elimination of micro-scale urban heat island effects on urban geom-etry and urban morphology combined with local climate zones (Karak-ounos et al. 2017, Yücekaya 2017, Zhao and Fong 2017)aiming at analyz-ing and characterizing the cooling potentials of heat mitigation strategy (HMS;
• The effects of urban green areas on outdoor thermal comfort according to scenario-based examination results including the location, area size, frag-mentation or integrity of the green areas (Duarte et al. 2015, Nasir et al. 2015, Lee et al. 2016, Evola et al. 2017) are some of them.
In outdoor thermal comfort studies, public spaces, especially urban green spaces, are significant for cities because of their many functions, such as ensur-ing ecological balance, creating sustainable environments, providing clean air, and creating wind corridors. Therefore, it is necessary to examine the spatial ad-equacy of public spaces characteristics in terms of quantitative and qualitative to quantify their climatic contributions to the city with mathematical models. The creation of bioclimatic comfort maps according to the region’s climatic condi-tions is of great importance in the urban planning and design process before the implementation decision of any plan and design.

35
REFERENCES1. Acero, J.A. and Herranz-Pascual, K., 2015. A comparison of thermal
comfort conditions in four urban spaces by means of measurements and modelling techniques. Building and Environment, 93, 245–257.
2. Ali-Toudert, F., Djenane, M., Bensalem, R., Mayer, H., 2005. Outdoor thermal comfort in the old desert city of Beni-Isguen, Algeria. Climate Research, 28, 243–256.
3. Alchapar, N.L. and Correa, E.N., 2016. The use of reflective materials as a strategy for urban cooling in an arid “OASIS” city. Sustainable Cities and Society, 27, 1–14.
4. Altunkasa, M.F., 1987. Çukurova Bölgesi’nde Biyoklimatik Veriler Kul-lanılarak Açık ve Yeşil Alan Sistemlerinin Belirlenmesi İlkeleri Üzerinde Bir Araştırma.
5. ASHRAE, 2001. Handbook of Fundamentals. American Society of Heat-ing, Refrigerating and Air-Conditioning Engineers Inc., Atlanta.
6. Barber, D.A., 2017. The nature of the image: Olgyay and olgyay’s archi-tectural-climatic diagrams in the 1950s. Public Culture, 29 (1), 129–164.
7. Berkovic, S., Yezioro, A., Bitan, A., 2012. Study of thermal comfort in courtyards in a hot arid climate. Solar Energy 86(5), 1173–1186.
8. Blazejczyk, K., Epstein, Y., Jendritzky, G., Staiger, H., Tinz, B., 2012. Comparison of UTCI to selected thermal indices. International Journal of Biometeorology, 56(3), 515–535.
9. Bruse, M. and Fleer, H., 1998. Simulating surface-plant-air interactions inside urban environments with a three dimensional numerical model. En-vironmental Modelling and Software, 13 (3–4), 373–384.
10. Budhiraja, B., Gawuc, L., and Agrawal, G., 2019. Seasonality of Sur-face Urban Heat Island in Delhi City Region Measured by Local Climate Zones and Conventional Indicators. IEEE Journal of Selected Topics in Applied Earth Observations and Remote Sensing, 12 (12), 5223–5232.
11. Cao, B., Zhu, Y., Li, M., Ouyang, Q., 2014. Individual and district heat-ing: A comparison of residential heating modes with an analysis of adap-tive thermal comfort. Energy and Buildings, 78, 17–24.
12. Chatzidimitriou, A. and Yannas, S., 2016. Microclimate design for open spaces: Ranking urban design effects on pedestrian thermal comfort in summer. Sustainable Cities and Society, 26, 27–47.
13. Chen, Y., Zheng, B., and Hu, Y., 2020. Mapping Local Climate Zones Using ArcGIS-Based Method and Exploring Land Surface Temperature Characteristics in Chenzhou, China. Sustainability, 12 (7), 2974.

36
14. Duarte, D.H.S., Shinzato, P., Gusson, C. dos S., and Alves, C.A., 2015. The impact of vegetation on urban microclimate to counterbalance built density in a subtropical changing climate. Urban Climate, 14, 224–239.
15. Emmanuel, R. and Fernando, H., 2007. Urban heat islands in humid and arid climates: role of urban form and thermal properties in Colombo, Sri Lanka and Phoenix, USA. Climate Research, 34, 241–251.
16. Evola, G., Gagliano, A., Fichera, A., Marletta, L., Martinico, F., Nocera, F., and Pagano, A., 2017. UHI effects and strategies to improve outdoor thermal comfort in dense and old neighbourhoods. Energy Procedia, 134, 692–701.
17. Fanger, P.O., 1972. Thermal Comfort: Analysis and Applications in En-vironmental Engineering. New York: McGraw-Hill Book Company, New York, 244s.
18. Gagge A.P., Burton A.C., Bazett H.D. 1971. A practical system of units forthe description of heat exchange of man with his environment. Science, 94: 428-430.
19. Geletič, J., Lehnert, M., Savić, S., and Milošević, D., 2019. Inter-/in-tra-zonal seasonal variability of the surface urban heat island based on local climate zones in three central European cities. Building and Envi-ronment, 156 (December 2018), 21–32.
20. Ghaffarianhoseini, A., Berardi, U., and Ghaffarianhoseini, A., 2015. Ther-mal performance characteristics of unshaded courtyards in hot and humid climates. Building and Environment, 87, 154–168.
21. Gholami, R. and Beck, C., 2019. Towards the determination of driving factors of varying LST-LCZ relationships: A case study over 25 cities. Geographica Pannonica, 23 (4), 289–307.
22. Givoni B., 1976. Man, Climate and Architecture. Van Nostrand Reinhold. New York.
23. Hisarligil, H., 2013. Exploring the Courtyard Microclimate through an Example of Anatolian Seljuk Architecture: The Thirteenth-Century Sa-habiye Madrassa in Kayseri. In: Smart Innovation, Systems and Technol-ogies. 59–69.
24. Hisarlıgil, H., 2009. Enerji Etkin Planlamada Konut Adası Tasarımı: Hi-potetik Konut Adalarının Ankara Örneğinde Mikroklima Analiz. Gazi Üniversitesi Fen Bilimleri Enstitüsü, Doktora Tezi. Ankara, 300s.
25. Höppe P. 1984. Die Energiebilanz des Menschen. Dissertation. Wissen-schaftlicher Mitteilung Nr. 49. Universität München.
26. Höppe, P., 1999. The physiological equivalent temperature - a universal

37
index for the biometeorological assessment of the thermal environment. International Journal of Biometeorology, 43(2), 71–75.
27. Höppe, P., 2002. Different aspects of assessing indoor and outdoor ther-mal comfort. Energy and Buildings, 34(6), 661–665.
28. Hu, J., Yang, Y., Pan, X., Zhu, Q., Zhan, W., Wang, Y., Ma, W., and Su, W., 2019. Analysis of the Spatial and Temporal Variations of Land Surface Temperature Based on Local Climate Zones: A Case Study in Nanjing, China. IEEE Journal of Selected Topics in Applied Earth Observations and Remote Sensing, 12 (11), 4213–4223.
29. Huttner, S., 2012. Further development and application of the 3D micro-climate simulation ENVI-met. Mainz: Johannes Gutenberg-Universitat in Mainz, Ph.D Thesi.
30. ISO 7730, 2005. Ergonomics of the Thermal Environment-Analytical De-termination and Interpretation of Thermal Comfort using Calculation of the PMV and PPD Indices and Local Thermal Comfort Criteria. Interna-tional Organization for Standardization, Geneva.
31. Jendritzky, G., Nübler, W., 1981. A model analysing the urban thermal environment in physiologically significant terms. Archives For Meteorol-ogy, Geophysics, And Bioclimatology, Series B, 29: 313-326.
32. Johansson, E., Thorsson, S., Emmanuel, R., and Krüger, E., 2014. Instru-ments and methods in outdoor thermal comfort studies - The need for standardization. Urban Climate, 10 (P2), 346–366.
33. Kántor, N., Chen, L., and Gál, C. V., 2018. Human-biometeorological significance of shading in urban public spaces—Summertime measure-ments in Pécs, Hungary. Landscape and Urban Planning, 170 (November 2016), 241–255.
34. Karakounos, I., Dimoudi, A., and Zoras, S., 2017. The influence of bio-climatic urban redevelopment on outdoor thermal comfort. Proceedings of 33rd PLEA International Conference: Design to Thrive, PLEA 2017, 2, 1757–1764.
35. Kuşçu Şimşek, Ç. and Şengezer, B., 2012. İstanbul Metropoliten Alanında Kentsel Isınmanın Azaltılmasında Yeşil Alanların Önemi. The Importance of Green Spaces in Minimizing Urban Heat in The İstanbul Metropolitan Area.
36. Lai, D., Guo, D., Hou, Y., Lin, C., Chen, Q., 2014. Studies of outdoor ther-mal comfort in northern China. Building and Environment, 77, 110–118.
37. Lee, H., Mayer, H., and Chen, L., 2016. Contribution of trees and grass-lands to the mitigation of human heat stress in a residential district of Frei-

38
burg, Southwest Germany. Landscape and Urban Planning, 148, 37–50.38. Lin, T.-P., Matzarakis, A., 2008. Tourism climate and thermal comfort in
Sun Moon Lake, Taiwan. International Journal of Biometeorology, 52(4), 281–290.
39. Marmaralı, A., Dönmez Kretzschmar, S., Özdil, N., Gülsevin Oğlakçıoğ-lu, N., 2006. Giysilerde ısıl konforu etkileyen parametreler. Tekstik ve Konfeksiyon, 4:241-247.
40. Matzarakis, A. and Amelung, B., 2008. Seasonal Forecasts, Climatic Change and Human Health. Seasonal Forecasts, Climatic Change and Human Health, (May 2014).
41. Morakinyo, T.E., Lau, K.K.L., Ren, C., and Ng, E., 2018. Performance of Hong Kong’s common trees species for outdoor temperature regulation, thermal comfort and energy saving. Building and Environment, 137 (Jan-uary), 157–170.
42. Nasir, R.A., Ahmad, S.S., Zain-Ahmed, A., and Ibrahim, N., 2015. Adapt-ing Human Comfort in an Urban Area: The Role of Tree Shades Towards Urban Regeneration. Procedia - Social and Behavioral Sciences, 170, 369–380.
43. Nasrollahi, N., Hatami, Z., and Taleghani, M., 2017. Development of out-door thermal comfort model for tourists in urban historical areas; A case study in Isfahan. Building and Environment, 125, 356–372.
44. Ochola, E.M., Fakharizadehshirazi, E., Adimo, A.O., Mukundi, J.B., We-songa, J.M., and Sodoudi, S., 2020. Inter-local climate zone differentia-tion of land surface temperatures for Management of Urban Heat in Nai-robi City, Kenya. Urban Climate, 31 (November), 100540.
45. Olgyay, V., 1963. Design with Climate: Bioclimatic Approach to Archi-tectural Regionalism. Princeton, NJ: Princeton University Press.
46. Olgay V., 1969. Design with the climate: Bioclimatic approach to archi-tectural regionalism.
47. Olgyay, V., Olgyay, A., 1976. Solar Control and Shading Devices. Prince-ton University Press, New Jersey, 202 s.
48. Olgyay, V., 2015. Design with climate: Bioclimatic approach to archi-tectural regionalism: New and expanded edition. Design with Climate: Bioclimatic Approach to Architectural Regionalism: New and Expanded Edition.
49. Panagopoulos, T., 2008. Using Microclimatic Lanscdape Design to Create Thermal Comfort and Energy Efficiency. Actas da 1a Conferência sobre Edifícios Eficientes,Universidade do Algarve, 25 de Janeiro, 1s (June), 1–4.

39
50. Perera, N., 2015. Climate-Sensitive Urban Public Space: a Sustainable Approach To Urban Heat Island Mitigation in Colombo, Sri Lanka, (Jan-uary).
51. Quan, J.L., 2019. Enhanced geographic information system-based map-ping of local climate zones in Beijing, China. Science China Technologi-cal Sciences, 62 (12), 2243–2260.
52. Salata, F., Golasi, I., de Lieto Vollaro, R., and de Lieto Vollaro, A., 2016. Outdoor thermal comfort in the Mediterranean area. A transversal study in Rome, Italy. Building and Environment, 96, 46–61.
53. Salur, H., 2016. Avlulu Yapılarda Termal Konfor Analizi: Kayseri Köşk Medrese Örneği. Erciyes Üniversitesi, Fen Bilimleri Enstitüsü, Mimarlık Anabilim Dalı, Doktora Tezi, Kayseri.
54. Sobin, H.J. and Olgyay, V., 1963. Design with Climate: Bioclimatic Ap-proach to Architectural Regionalism. Journal of Architectural Education (1947-1974), 18 (3), 43.
55. Srivanit, M. and Hokao, K., 2013. Evaluating the cooling effects of green-ing for improving the outdoor thermal environment at an institutional campus in the summer. Building and Environment, 66, 158–172.
56. Taleghani, M., Sailor, D.J., Tenpierik, M., and van den Dobbelsteen, A., 2014. Thermal assessment of heat mitigation strategies: The case of Port-land State University, Oregon, USA. Building and Environment, 73, 138–150.
57. VDI 3787, 2008. Part 2, Environmental Meteorology – Methods for the Human Biometeorological Evaluation of Climate and Air Quality for Ur-ban and Regional Planning at Regional Level; Part I: Climate. Beuth Ver-lag, Berlin.
58. Voogt, J.A. and Oke, T.R., 1997. Complete urban surface temperatures. Journal of Applied Meteorology.
59. Wang, Y., Ni, Z., Peng, Y., Xia, B., 2018. Local variation of outdoor ther-mal comfort in different urban green spaces in Guangzhou, a subtropical city in South China. Urban Forestry and Urban Greening, 32(December 2017), 99–112.
60. Yücekaya, M., 2017. Kentsel Açik Mekanlariİklı̇mleDengelı̇ Tasarimi-naYönelı̇Analı̇tı̇kBı̇r ModeÖnerı̇sı̇:Gazı̇antepÖrneğı̇.
61. Zhao, T.F. and Fong, K.F., 2017. Characterization of different heat mitiga-tion strategies in landscape to fight against heat island and improve ther-mal comfort in hot-humid climate (Part II): Evaluation and characteriza-tion. Sustainable Cities and Society, 35 (May), 841–850.

40
62. Zheng, Y., Ren, C., Xu, Y., Wang, R., Ho, J., Lau, K., and Ng, E., 2018. GIS-based mapping of Local Climate Zone in the high-density city of Hong Kong. Urban Climate, 24, 419–448.

41
Chapter-3
AN ENVIRONMENTAL DESIGN STUDIO IN THE DISTANCE EDUCATION PROCESS
DURING THE PANDEMIC
Doç. Dr. Elif BAYRAMOĞLU1 Arş. Görevlisi Seyhan SEYHAN2
1 Karadeniz Technical University, Faculty of Forestry, Department of Landscape Architecture, Trabzon / Turkey [email protected]
2 Karadeniz Technical University, Faculty of Forestry, Department of Landscape Architecture, Trabzon / Turkey, [email protected] .


43
INTRODUCTIONThe 2019-2020 pandemic of the coronavirus (Covid-19) that was first observed
in the capital of the Hubei province of China, Wuhan on December 1, 2019, led to significant changes and effects on global economy, social life and educational practices. The World Health Organization (WHO, 2020) declared the pandemic on March 11, 2020 (Can, 2020). The World Health Organization commissioned ex-perts and initiated investigations in Wuhan, the assumed point zero of the epidemic, and the city was quarantined (Wnag et al., 2020). Despite the quarantine measures, the virus started to spread and finally affected the whole world. The first identified Covid-19 cases in Europe were reported in France on January 24, Germany on Jan-uary 27, Finland on January 29 and Italy on January 31. Since then, the number of cases identified in Europe, especially in Spain, Italy, France, Germany, the UK and Turkey increased rapidly (Karadağ and Yucel, 2020).
Since the pandemic was not expected, the initial restrictions were insignifi-cant. Singapore, which was one of the first counFertutries that took measures, warned all nations and limited the entries and exists in Singapore in January 2020 (Wong et al., 2020). Later, measures such as curfews, work and education at home were adopted in other countries. This had negative effects on several fields and increased the fear and anxiety among all individuals. The pandemic also had negative socio-cultural, political, economic and educational consequences (Bozkurt and Sharma, 2020). Turkish Higher Education Council (HEC) initially announced the closure of the universities for 3 weeks on March 16, 2020. Later, HEC instructed universities to adopt distance education methods and discontin-ued formal education for the 2019-2020 academic year spring semester. Distance education was initiated by HEC on March 23, 2020 based on individual univer-sity facilities (Saraç, 2020).
Today, the end of the pandemic could not still be estimated. Vaccine devel-opment has continued all over the world and in Turkey during this period. The inoculations started and 14,126,629 individuals were vaccinated. However, the consequences of vaccination and the success of inoculation against the virus are still not known. Therefore, the course of the pandemic, hence, the possible date when face-to-face education would be possible are not known. Thus, the analysis, evaluation and development of distance education applications are of great im-portance. The present study aimed to define the distance education process based on the environmental design project course instructed in Karadeniz Technical University, Landscape Architecture Department. The study included information about the problems, limitations and opportunities observed within the process.

44
Distance education in PandemicDistance education means web-based education that employs internet
technologies and computers. Distance education is completely conducted on virtual media, independent of time and space, where learner and teacher do not have be at the same place. In distance education, preferred in several fields, all levels of education is possible, including secondary and tertiary education (Kahraman, 2020). In distance education, the concept of “place” does not determine the availability of the educational services. Because “the place” is “everywhere” on the internet (Karasar, 2004). Distance education was initially introduced in France in 1907. In 1939, the Distance Education Center was officially established. Distance education was introduced in Japan in 1948 with the education law to provide education for those without access to school, school dropouts and soldiers. Later, it was extended to include middle and high schools and higher education institutions (Antalyalı, 2004).
In Turkey, active distance education was introduced with the pandemic. The Higher Education Council decision on March 23, 2020 stipulated that all courses should be instructed with the distance education method. Universities adopted “synchronous”, “asynchronous” or “both synchronous and asynchronous” distance education methods based on the available infrastructure. The adoption of distance education in Turkish universities during the pandemic is determined by the fluency of the faculty members in technology and the expectations and experiences of the students (Karadağ and Yucel, 2020). As an immediate response to the crisis induced by the COVID-19, universities structured for formal education started to adopt to the instruction of the courses and programs with web-based distance education instead of face-to-face education (Gewin, 2020). The adaptation of the programs was conducted by the Distance Education Application and Research Centers (UZEM) in cooperation with the Information Technology Departments.
Distance education applications has been adopted for a long time in Turkey. Turkey has 300 years of history in constructivist learning (Bozkurt, 2019). Web-based distance education has been provided by Anadolu University, Istanbul University and Ataturk University and Distance Education Application and Research Centers (UZEM) in other universities (Keskin and Özer Kaya, 2020). In fact, for 10 years, YOK allowed distance learning in up to 30% of the courses and course content in formal programs via various regulations and directives.
Distance education in environmental design studioDesign education (art education) is a visual philosophy that leads to function-
al creativity. Design education is an organizational method (Gökaydın, 2002).

45
Design is one of the most important components of life. Although it sometimes might elude us, the impact of design is quite significant and diverse. It affects us both directly or indirectly. So much so that according to the Gestalt theory, daily encounters with visual values contribute to the positive or negative development of our spirit (Öztuna, 2007).
Design education requires the blending of both theoretical and practical knowledge and constant criticism by an instructor. Thus, the student comes to the next class after correcting the criticism of the previous class in this process. In these classes, the instructor provides certain recommendations using marks and corrected drawings on the student Project (Yılmaz ve ark., 2021) . Criticisms could be verbal or on paper. The Environmental Design course is instructed with project comments throughout the semester. One-to-one communication between the student and the educator is quite important, since the project should be final-ized in a semester. At the end of the semester, the student submits the project via graphical presentations, models and printouts that reflect the project accurately. Design studios, on the other hand, provide web-based services that run on fully equipped computer networks.
In the study, the distance education process implemented in EDP II Single housing environmental design project course during the 2019-2020 academic year spring semester at KTU Landscape Architecture Department was analyzed. The study was conducted with 9 undergraduate students. Due to the sudden meas-ures taken after the COVID-19 pandemic, it was no longer possible to conduct face-to-face education. Thus, distance education was adopted immediately to prevent losses in education. Education is limited by the instruction of each course by the assigned lecturer. In this process, the courses were defined for each facul-ty member. The courses started to be instructed on the Adobe Connect software. This system allows the students to participate in live classes. It also allows them to watch recorded sessions when they experience internet problems. However, students are expected to attend each class as they receive one-on-one critique in project courses. They could also correct their mistakes after watching the videos based on the criticism. Thus, enrollment is beneficial for the students.
EDP II course was conducted with 9 students and a TA. Assistants attend the class on the predetermined day and time, similar to the faculty members. Howev-er, since every student’s internet access was not the same in distance education, additional classes were organized to achieve the desired outcomes. Additional lessons were instructed by organizing groups or through online communication outside the class hours. In this process, the lecturer and the assistant provided critical drawings for the student designs and communicated these to the students.

46
The students revised and improved their projects for the next course.The course project was the development of the environmental plan for a single
housing unit at ‘Cirav Condominiums’ in Yalıncak district in Trabzon province. The students were expected to design the landscape around the single housing unit based on the relations between the residence, occupant and the environment.
• The landscape design solutions were developed for the single housing unit based on various occupant requirements. The occupants and their require-ments were defined and the activities that match these requirements were identi-fied. Each student developed a unique scenario and concept (Figure 1). This stage was conducted in weeks 1 and 2.
Figure 1. scenario and concept project

47
• Activities and scenarios that produce solutions for the needs determined by each student were developed. The activities were associated with ade-quate spatial components and elements. In this stage, the occupant group was determined. Each student determined different occupant types based on their scenarios, and constructed the correlations between the needs, ac-tivities and the space. The function-correlation diagrams were developed based on the relations between the activities. This stage was conducted in weeks 3 and 4.
• Each student started to come up with options based on her or his concept and construct. Option development occurred during the 5th, 6th, and 7th weeks. In this stage, the students drew sketches and presented them during the online course. The faculty member provided criticism to improve the student design.
• Then, the spaces were designed for the planned activities. The activi-ty-space relations were designed based on design principles, size and form. Each student developed an original work after the 8th week. The designs were based on the balance of duty, dominance, balance and unity principles. Spatial solutions for the final designs included contour lines, elevation legends, space names, stairs, ramps and furniture

48
Figure 2. Designed for the planned activities.
• The open green spaces on the designed hard pavement were planted and their names and frequencies were presented at the plan scale. Planting included coniferous and latifolius tree and shrub species. This stage was conducted in weeks 12 and 13 and online.

49
Figure 3. Planting project
• Cross-sections and elevations were drawn for the finalized hard pavement and planting projects. Walls, border elements, stairs, ramps, spatial solu-tions, furniture (lighting, sitting, objects, garbage bins, cover elements and plant elements when available) are presented. In the cross-sections and el-evations, attention was paid to the relationship between the mass and void and landscape compositions.

50
Figure 4. Cross-sections projects
• At the end of the project, a presentation sheet that included the project sec-tions was developed. The presentation sheet is a single sheet that includes the scenario, concept, plan, planting and cross-sections. In the online pro-cess, the presentation is the last project phase. And these layouts are dis-played in KTU Landscape Architecture Department virtual media space.
51
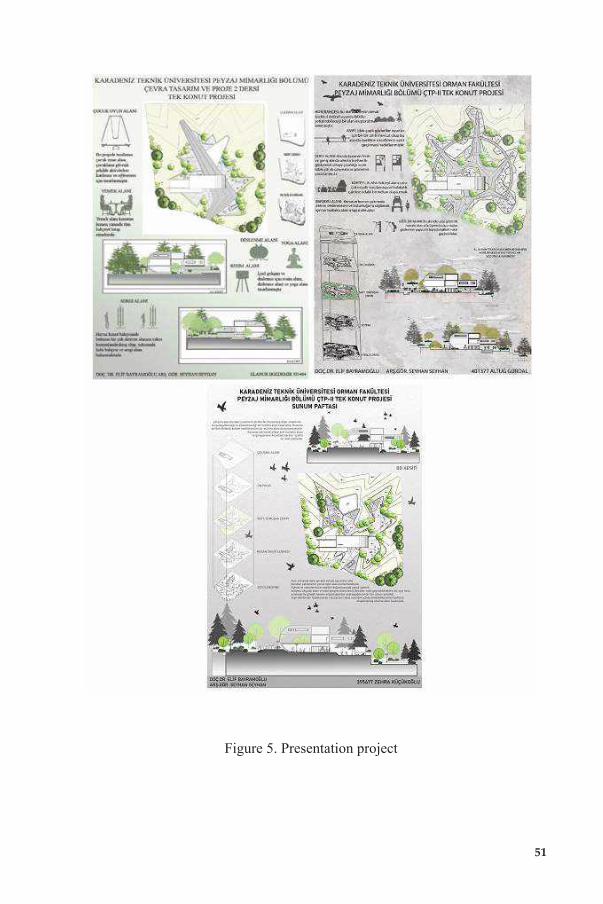
Figure 5. Presentation project

52
CONCLUSIONThe Covid-19 pandemic affected the field of education and instruction similar
to every field of daily life. A series of measures and action plans were adopted and implemented in every field. In the field of education, the solution was the distance education method. Although this approach was actually implemented before, it was fairly new for certain courses. It also introduced difficulties for both students and faculty members. Especially for disenfranchised students.
Distance education was more difficult iforn design and applied educa-tion departments. Because the design students and the lecturer should commu-nicate one-on-one. When necessary, the instructor could intervene in the design. However, in the current conditions, auxiliary technological devices served as a solution. In the near future, it was predicted that distance education could be-come mainstream in education rather than an alternative to face-to-face learning or a supplementary facility. The new order enforced by the pandemic will be em-ployed in several fields. Because the digital age education and novel technologies will prevail in the field of learning.

53
REFERENCES1. Antalyalı, Ö., L. (2004). Uzaktan eğitim algısı ve yöneylem araştırması
dersinin uzaktan eğitim ile verilebilirliği, Isparta: Süleyman Demirel Üniversitesi Sosyal Bilimler Enstitüsü Dergisi.
2. Bozkurt, A., Sharma, R. C. (2020). Emergency remote teaching in a time of global crisis due to CoronaVirus pandemic. Asian Journal of Distance Education, 15(1)
3. Bozkurt, A. (2019). From Distance Education to Open and Distance Learn-ing: A Holistic Evaluation of History, Definitions, and Theories. In S. Sis-man-Ugur, & G. Kurubacak (Eds.), Handbook of Research on Learning in the Age of Transhumanism (pp. 252-273). Hershey, PA: IGI Global.
4. CAN, E. (2020). Coronavirüs (Covid-19) pandemisi ve pedagojik yansımaları: Türkiye’de açık ve uzaktan eğitim uygulamaları. Açıköğre-tim Uygulamaları ve Araştırmaları Dergisi, 6(2), 11-53.
5. Gewin, V. (2020). Five tips for moving teaching online as COVID-19 takes hold. Nature, 580(7802), 295-296.3
6. Gökaydın, N. (2002). Temel Sanat Eğitimi, MEB Yayınları, Ankara.7. Kahraman, M. E. (2020). COVID-19 salgınının uygulamalı derslere et-
kisi ve bu derslerin uzaktan eğitimle yürütülmesi: Temel tasarım dersi örneği. Medeniyet Sanat Dergisi, 6(1), 44-56.
8. Karadağ, E., Yucel, C. (2020). Yeni tip Koronavirüs pandemisi döneminde üniversitelerde uzaktan eğitim: Lisans öğrencileri kapsamında bir değer-lendirme çalışması. Yükseköğretim Dergisi, 10(2), 181-192.
9. Karasar, Ş. (2004). Eğitimde Yeni İletişim Teknolojileri -Internet ve Sanal Yüksek Eğitim-.The Turkish Online Journal of Educational Technology – TOJET.
10. Keskin, M ve Özer Kaya, D. (2020). COVID-19 sürecinde öğrencilerin web tabanlı uzaktan eğitime yönelik geri bildirimlerinin değerlendirilm-esi. İzmir Katip Çelebi Üniversitesi Sağlık Bilimleri Fakültesi Dergisi, 5(2), 59-67.
11. Öztuna, Y. H. (2007). Görsel İletişimde Temel Tasarım. Tibyan Yayıncılık, İstanbul
12. Saraç, Y. 2020. “Basın Açıklaması”. Yükseköğretim Kurulu. https://ba-sin.yok.gov.tr/KonusmaMetinleriBelgeleri/2020/04-yok-baskani-saracu-zaktan-egitime-iliskin-basin-toplantisi.pdf,
13. Wang, C., Cheng, Z., Yue, XG and McAleer, M. (2020). Risk Manage-ment of Covid-19 by Universities in China. Journal of Risk and Financial Management,13: 36-42

54
14. WHO (2020). WHO Director-General’s opening remarks at the mediabriefing on COVID-19 - 11 March 2020
15. Wong, J.E., Leo, Y.S. ve Tan, C.C. (2020). COVID-19 in Singapore - cur-rent experience: critical global issues that require attention and action.Journal of American Medical Association, (15) 323: 1488- 1494.
16. Yılmaz, S., Düzenli, T., Alpak, E. M. (2021). Peyzaj Mimarlığı Eğiti-minde “Land Art” Etkisi. Online Journal of Art and Design, 9(1).

55
Chapter-4
INTERIOR SPACE BRAND IDENTITY: STRATEGIES THAT MATTER
Shirin IZADPANAH1
1 Antalya Bilim University, Faculty of Fine Arts Design and Architecture, Department of Interior architecture and Environmental Design, Döşemealti, Antalya, Turkey,[email protected]


57
Introduction Researches claim that interiors have a direct influence on customer percep-
tion. Recently there is a growing interest in investigating the impact of interior design and marketing. As part of this interest, the focus has shifted towards the link between Strengthening brands and interior design (Perry & Wisnom, 2003, Oylum, 2010, Dagli, 2016).
Sametz and Maydoney (2010, p. 18) refer to the influential role of storytelling through interior design in enhancing brand identity. The authors state that “Sto-rytelling (branding) is natural, easy, entertaining, and energising. Stories help us understand complexity. Stories can enhance or change perceptions”. Consistent with the power of interior environment in promoting services and products, the number of brands showing interest in hiring architects and interior designers as advocates of their brands is increasing (Norton, 2003).
Studies also claim that an increase in customers’ emotional bond with the brand will increase the value of that brand (Klingmann, 2007; Loureiro, Ruediger & Demetris, 2012). In this regard Clegg and Kornberger (2006, p. 213) state that “the sum of all the interactions a client has with your brand, is what makes brand environments so critical in connecting with potential customers and creating pref-erence”. Building on the customers’ emotional bond with the brand through an influential interior space is another reason that has put emphasis on interior de-sign as a brand marketing strategy. However, despite the increasing significance of interior design in supporting and marketing brand identity, there is a lack of comprehensive studies on interior design branding strategies to be used as a ref-erence in real world practice (Fielding, 2015).
This book chapter aims to contribute to the existing knowledge of interior space branding. The key research objectives are to determine: 1) the similarities and difference between interior space identity and interior space with a brand identity 2) the important strategies in designing an interior with marketing poten-tial for a brand. The purpose of this research is to identify the important strategies that matter in using interior space as an influential brand marketing instrument. Furthermore, this research intends to classify the key strategies and concepts in using interior design as a branding tactic and propose a theoretical framework for brand marketing through interiors.
The chapter has been structured as follows. First, a general overview of the relationship between brand identity and interior space identity is proposed. Sec-ond, some theoretical approaches are examined and strategies adopted for realis-ing brand marketing through interior environments are identified. As a result, the study proposes a common ground of theory, discussing experiencing the brand vi-

58
sion and identity through experiencing the interior space. This theoretical frame-work paves a path for further analysis and research.
Interior Space Identity vs. Interior Space Brand IdentityThe concept of place is an important term in increasing interest towards creat-
ing interior space identity. Interior designers seek to design spaces that will create meaning and new experiences for the users to transform those spaces into places (Chung, 2017). Both the social and physical factors of a space contribute to its identity (Waxman, 2006).
Social factors of a space are very much interrelated with the psychological, cultural and behavioural backgrounds of the users. The importance of users’ so-cial factors in shaping the identity of interior space has compelled interior de-signers to acquire a good understanding of human behaviour in different environ-ments (Waxman, 2004, p. 9).
The main physical factors that shape the identity of an interior are classified as objects, plane/surfaces, sequence/circulation, light, texture, threshold, colour, materials and view (Brooker & Stone, 2007; Brooker and Stone, 2008). To cre-ate an identity for an interior space, all or some of these factors need to define an environment with characteristics that differentiate the target environment from other interior environments (Yilmaz & Maz, 2006).
Interior spaces are mainly structured settings where daily life occurs and, therefore, people are constantly shaping meanings through interaction with dif-ferent interiors on a daily basis. In return, these meanings affect people’s percep-tion and further interactions (Poldma, 2008; Vaikla-Poldma, 2003). Interior de-signers need to consider users’ meaning-making processes in order to design an interior space with an identity. Thus, shaping prior knowledge about a space has become a necessity for designers. This requires designers to overlook the possible activities and experiences that will happen in the space prior to its construction (Amin & Cohendet, 2004; O’Brien, 2006).
Today designing interiors is beyond static attributes and interior designers conduct extensive discussions with clients and users to learn what they want and how they live, and going further, observe how people engage and interact in spac-es to design supportive spaces. Supportive spaces are spaces that not only look attractive and function well, but also spaces that have a dynamic nature, engage people with changing situations based on specific purposes (Poldma, 2010).
It is this new approach to interior design that invite brands and businesses to use interior design as a tool for embracing their identity. Professional designers can adapt branding principles into interior space and consequently deliver a con-

59
sistent message between the brand and costumers. This consistency will strength-en the message and increase the value of the brand (Mesher, 2010).
Since interior design is proven to have the potential for communicating the character of companies, today, interior branding is used heavily as it extends the vision and experience of firms and organisations to the interior and exterior of their settings where the space reflects their brand identity (Adams, 2020). Interior design is now considered as a crucial part of a brand’s corporate design manage-ment. The connection of corporate design and interior design can be seen glob-ally in many stores, offices, restaurants and hotels. Through branded interiors “it is possible to integrate key factors as perceived by the relevant target groups, to improve customer loyalty and to strengthen their relationship to a brand by mak-ing it tangible (Leydecker, 2013, p.20)”.
Designing a branded interior space requires a good understanding of the dif-ference between brand image and brand identity. Brand identity is internal where-as brand image is external (Kapferer, 2012; Keller, 2012). Interior designers need to match the identity and look (image) of the space with the brand’s identity and image in order to establish a successful branded interior (Figure 1).
Figure 1- Patterns that bring the interior identity and interior image together for a consistent branded interior space (developed based on studies by Aaker, 1996;
Burmann et al., 2017; Roy & Banerjee, 2008)
In scope of interior space branding, space narratives and design solutions that improve the business and benefit brand marketing are at the core of design deci-

60
sions. The intention is to provide a layout and environment that encourages staff within the strategical framework of the company or motivate customers to stroll through the space for more purchases. Because at the end of the day, commercial environments like branded interiors tend to engage users in a way that contributes to a positive financial return to the company (Austin, 2020).
Communicative aestheticsDesign and image are two important concerns in terms of brands competition.
Designers put an enormous effort to design invisible expressive symbols from an invisible brand. In such cases, innovation is not a choice but a necessity, because a brand’s survival in current market conditions becomes impossible without in-novative concepts (Thyssen, 2011). Brand aesthetics tend to define visual char-acteristics that contributes to characterize a brand. This visualisation starts with a logo and extends to packaging, website, billboards, advertisements and interior design.
Symbolism is the first factor that comes to mind in defining the visual identity of a brand. However, communicative aesthetics in a branded interior should not be limited to symbolism. Considering a customer sensory experience with the space and product, interaction with digital devices and the brand’s social media, circulation through advertisements, signage, displays and reception desks will propose a broader scope of consistency in aesthetically representing a brand. In line with different dimensions of aesthetics in a branded interior, it is important to remember that consistent aesthetics does not mean monotony. Consistent aesthet-ics means a vibrant and distinctive form of aesthetics (Airey, 2019).
Interior aesthetics is generally led by a brand’s corporate identity to provide a consistent message. However, the visual identity of the branded interior is based on how costumers understand and interpret the aesthetic communication. Wood (2001) argues that organisations are incapable of controlling the visual identity of their brand because they cannot control the context that consumers perceive their corporate identity. However, with an increase in studies that focus on how users perceive aesthetic elements of an interior space, there is a better chance for interior designers to control the visual identity of an interior. Interior designers can shape visual identity by proposing aesthetic characteristics that will directly convey the brand’s corporate identity to the users (Figure 2).
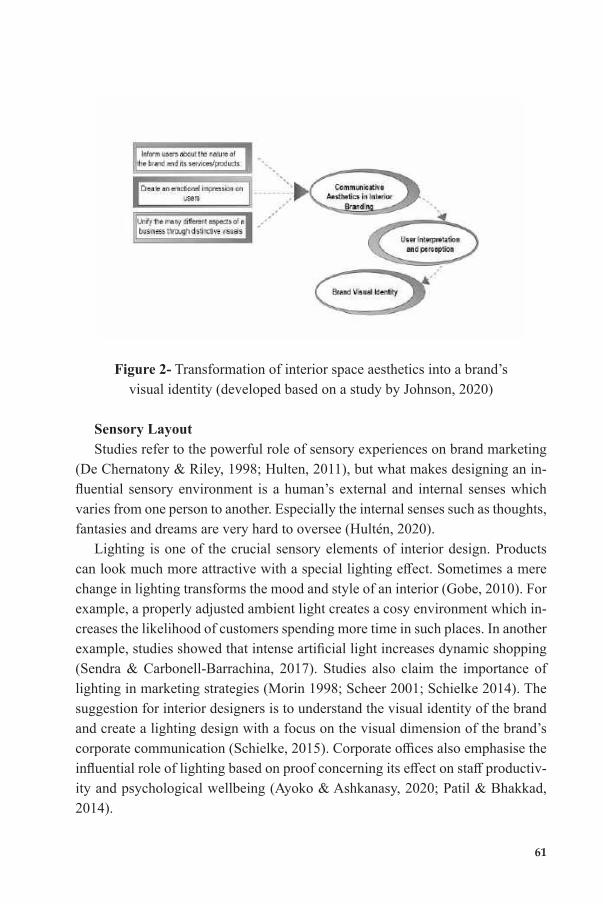
61
Figure 2- Transformation of interior space aesthetics into a brand’s visual identity (developed based on a study by Johnson, 2020)
Sensory LayoutStudies refer to the powerful role of sensory experiences on brand marketing
(De Chernatony & Riley, 1998; Hulten, 2011), but what makes designing an in-fluential sensory environment is a human’s external and internal senses which varies from one person to another. Especially the internal senses such as thoughts, fantasies and dreams are very hard to oversee (Hultén, 2020).
Lighting is one of the crucial sensory elements of interior design. Products can look much more attractive with a special lighting effect. Sometimes a mere change in lighting transforms the mood and style of an interior (Gobe, 2010). For example, a properly adjusted ambient light creates a cosy environment which in-creases the likelihood of customers spending more time in such places. In another example, studies showed that intense artificial light increases dynamic shopping (Sendra & Carbonell-Barrachina, 2017). Studies also claim the importance of lighting in marketing strategies (Morin 1998; Scheer 2001; Schielke 2014). The suggestion for interior designers is to understand the visual identity of the brand and create a lighting design with a focus on the visual dimension of the brand’s corporate communication (Schielke, 2015). Corporate offices also emphasise the influential role of lighting based on proof concerning its effect on staff productiv-ity and psychological wellbeing (Ayoko & Ashkanasy, 2020; Patil & Bhakkad, 2014).

62
Figure 3- Strategies for improving lighting aimed at promoting a brand’s service and product (developed based on studies by Boyce, et al. 2003; Herbst, 1998)Taste and smell are two other important senses to which studies claim playing
a role in brand marketing. People shape personalised meaning with events, envi-ronments and experiences through scents and it is discussed that people’s sense of smell are strongly linked to their sense of taste (Hulten, 2017). Integrating ol-factory elements in interiors will contribute to building a bond between the brand and customers. While familiar scents evoke memories, new scents are the start-ing point of building new memories (Angeli, 2016). In general, studies indicate that using a distinctive ambient scent encourages customer to visit and return to a store; thus olfactory stimulants contribute to establish a positive perception of an interior environment for customers (Bone & Ellen, 1999; Chebat & Michon, 2003; Chatterjee, 2017).
Taste marketing is linked with offering food and drinks that correspond to a brand’s personality. Taste needs to conform with the target audience. It is worth mentioning that many brands that do not sell food products also prefer tasting experiences through food marketing (Dio, 2019). If this approach fits in with the brand’s marketing strategy, flavour experiences can be integrated in the interior layout.

63
Figure 4- Strategies for integrating scent and taste to create a branded interior (developed based on the studies by The Aroma Trace, 2020; Oduguwa, 2015)
Finally, tactility is other important sense that is worth considering in interior branding. Touch plays an important role in our sense of appreciation. Consistent with this, 30% of the world’s largest brands have recently been working on re-search and improving knowledge on sensory branding strategies (Johnson, 2007). It is reported that materials, temperature, weight and form contribute to a tac-tile experience and improve customer loyalty (Hulten.et.al, 2011). “Since brand-ing is all about creating a distinctive experience”, engaging people in an interior through the sense of touch is crucial (Nair, 2013, p.227).
One of the key subjects that will help interior designers to engage touch into designing branded interiors is haptic sensation. Haptic sensation is shaped through the interaction of the body with materials. People’s sensation and expe-riences are very much influenced by the properties of materials (Postell & Ges-imondo, 2011). Shape is another parameter of haptic experience. Shapes show how surfaces are placed in relation to the rest of the built environment (Herssens & Heylighen, 2011). Figure 4 presents the properties of shape and materials in scope of haptic sensation.

64
Figure 5- The properties of materials and shapes that must be considered in engaging haptic experiences in an interior space (Developed based on a study
by Herssens & Heylighen, 2011)
The challenging part of tactile marketing is the necessity for customers to take action in order to be engaged in the tactile qualities of an interior space. Howev-er, it is important for interior designers to check if their proposed tactile elements in interiors are in line with the value and essence of the brand (Minsky& Fahey, 2017). Dealing with senses and sensorial emotions is a challenging task, because emotions are an important part of how people sense and interact with a space. Designers can evaluate sensory branding by getting a better understanding of emotions. Stimulating the right emotion through interior design will be an oppor-tunity for shaping a long-term connection between the customers and brand. Six basic emotions that will help designers to create sensorial emotions in a space are as follows (Chakravarty, 2015, p. 358):
• Happiness: Related to everything that makes people feel good at all levels.• Sadness: Negative emotions which people wish to avoid.• Fear: Emotion that triggers people’s survival instinct.• Surprise: Emotional reaction to a new situation.• Anger: An aggressive reaction to any given situation.• Disgust: Negative reactions in response to unpleasant situations.
Cherishing ExperiencesIn line with the emphasis on the importance of multi-sensual and multisensory
spaces in identifying the brand, the spatial dimension of space has also become the focus of marketing strategies (Hollenbeck et al. 2008; Ponsonby-McCabe & Boyle, 2006). In other words, interior space is currently defined as a setting for brand staging. Offering a story-like framework through interior design is a strat-egy to introduce or support a brand and design planning of this nature is defined

65
as purposeful design (Sonnenburg & Baker, 2013). Today plenty of brands are offering their customers experimental spaces and
entertaining environments to explore their business, products, service or technol-ogy. In their book titled ‘Branded Spaces’ Borges et al. (2013) have compiled nu-merous branded spaces that offer unique spatial experiences with identical spatial qualities. The main aim of designers in creating such spaces is shaping concepts and layouts that communicate brand identity through experiences that will affect the audience on an emotional and passionate level. Figure 6 proposes four types of spaces that will provide experimental environments for brands.
Figure 6- Type of experimental spaces that enhance the branding environment (Developed based on a study by Bojovic, Sabatier & Coblence, 2019)
Lifestyle SegmentationLifestyle segmentation means classifying a target audience/consumer based
on their values, visions, hobbies, interests and etc. Lifestyle segmentation plays an important role in a brand’s marketing strategies. This strategy allows a brand to provide a product or a service that fits in with the lifestyle of their target audi-ence. Currently, an overpopulated market has made it difficult for brands to se-cure their positions, therefore lifestyle positioning allows brand to fit in with us-ers’ lifestyles or look appealing for potential users with corresponding lifestyles (Tuckwell & Jaffey, 2016).
Gobe (2001, p.189) has pointed to the importance of consumer lifestyles for brands and reports that “Brands are not static and they have many facets to their personality. In order to build up and retain equity as a preferred brand in the mind

66
of the consumer, a brand must evolve to stay connected to its target audience in its day-to-day, moment-to-moment existence. Brand presence at its best connects intimately to the consumer’s lifestyle”.
Learning about user lifestyles is in fact an issue overseen by architects and in-terior designers. However, while designing commercial spaces, they need to con-duct a comprehensive analysis on consumer behaviour and social interactions to get a better idea on their lifestyles (Crespy & Isgro, 2020). Designers need to get a broad overview about the lifestyle led by consumers who prefer the brand and determine the segmentations that could be enhanced and emphasised with interior design. Ideally, the key segments will be those with the highest number of con-sumers. The second ideal in segmentation selection is identifying segments that match the brand profile. Prototyping can help designers develop a broad frame-work of consumer lifestyle segmentations (Li & Cai, 2016).
Figure 7-Necessary steps designers can follow to transform customer profiles into a broad lifestyle prototype
(Developed based on studies by Li & Cai, 2016; Plummer, 1974)
Integrating Brand Essence In interior branding, matching the conceptual approach with the essence of the
brand is crucial. Brand essence is holistic and emotional. What a company does, the value it promises, and their main principles define the essence of their brand (Pahwa, Consultant, & Robert, 2021). Generally, advertising slogans are the best representations of a brand’s essence, but a slogan is not an essence itself. Disney World’s slogan is ‘where dream comes true’ and its essence is defined as ‘a magi-

67
cal world. Volvo’s slogan is ‘freedom to move’ but its essence is defined as ‘safe-ty’. the slogan used by Adidas is ‘noting is impossible’ but the company defines its essence as ‘relentless’.
Since brand essence plays an important role in communicating the brand’s message, interior designers need to act carefully in making the essence visible and legible in space. In their book ‘The Language of Branding: Theory, Strate-gies, and Tactics’, Lerman et al. (2018) define the fundamentals of understanding brand essence as follows:
• The story behind the brand• Brand name• The brand’s advertisements claim• Packaging• The brand’s online platforms
Reflecting the essence of the brand in the interior layout is challenging and requires a smart and clear conceptual approach. The essence of a space is spatial and not the result of a conscious design. To correlate the essence of the brand with the essence of the space, designers need to frame the space visually and spatially (Long, 2016). To avoid the risk of similarity in marketing, it is important for in-terior designers to focus on the distinctive features that shape the essence of the brand and avoid the communal features.
Emphasis on Digitalisation Broader internet access has linked people to digital platforms more than ever.
Specifically, with the Covid-19 pandemic in 2020, there has been a huge shift towards online shopping and online engagements with brands and companies. With the boom in E-commerce during the pandemic, retailers have started to put more effort into shaping, developing, and promoting their online platforms (Koch, Frommeyer and Schewe, 2020).
Terms like ‘search marketing’, ‘mobile marketing’, ‘social media’, ‘web-site’, ‘video marketing’, ‘digital storefronts’, ‘gamified environments’ are new channels digital marketing and the current focus is to use these channels at right time and with the right strategy to reach target consumers directly (Greenberg & Kates, 2014). Like branding, interior design is also influenced by digitalisation. ‘Adapting’ and ‘updating’ are important concerns for brands and companies in the digital age, so the space they use must keep up with changing trends (Siddi-qua, 2020). Consistent with the need for change, interior layouts are getting more

68
flexible. The using of mobile interfaces in space is on rise because they easily accommodate changes. Additionally, with increased interest toward e-commerce, innovative design solutions seem to be necessities for the survival of the physical spaces of the brands (Pantano and Laria, 2012).
Today, collaboration between interior designers and technology develop-ers have resulted in innovative and smart interiors. Also, increased attention to sustainability has encouraged interior designers to utilise new technologies and smart solutions for saving energy and cutting emissions. Therefore, there is a shift “from high-energy materials such as cement, glass, brick, and steel to alter-natives including stone, rammed earth, hollow concrete, and wood (Cao, L., (23 Mar 2020)”.
The use of smart and innovative materials is also a result of digital and techno-logical development in space. For example, traditional glass has acquired several smart and appealing qualities. 3M™ Glass Finishes offer a wide range of visual ef-fects at very low costs. This has made glass much more versatile, allowing infinite recreations of interiors (ArchDaily, 2021). Similar to glass, new materials with new properties keep on appearing on the market, so interior designers must keep in-formed on these developments to employ innovative materials in interior branding.
Figure 8- Strategies to reflect digitalisation in interior branding (Developed by author)

69
ConclusionThis chapter has discussed the importance of interior design in marketing
a brand as a result of increased interest by firms and companies in empower-ing their brands through interior design. In this chapter the link between interior space identity and building brand identity through interior design is discussed. Additionally, a series of important strategies that will help designers enhance brand identity through designing the interior space is discussed and interpreted.
Main strategies for designing an interior with a potential for brand marketing are addressed as:
1. Creating an appealing space that communicates a brand’s visual identity2. Providing a layout that engages user senses3. Shaping an environment that offers explorative and entertaining experi-
ences4. Considering the important segments of user lifestyles and applying these
segments in interior layouts5. Understanding the essence of a brand and integrate this essence in concep-
tual approaches 6. Giving emphasis to the digital and innovative design solutions
Although the present research makes important contributions to shape a the-oretical framework on interior space branding, there are several limitations that may need to be considered. Due to limited research on this topic, the theoretical foundations in this study are shaped by the interpretation of a variety of disci-plines and contents. The strategies proposed in this study are based on existing theories and studies, therefore these strategies must also be developed through empirical studies.
This study has revealed a few topics that require further research. Since brand strategies evolve over time and with technology, more research must be carried out on new design strategies that will enhance the physical space of a brand in the current digital era. It is also necessary to explore key interior design elements that embody the image and vibe of the brands in an interior space. Finally, further em-pirical studies must be developed on how interior branding contributes to enhanc-ing a brand’s relationship with consumers and financial returns to the companies.

70
References 1. Aaker, D. A. (2011). Building Strong Brands. The Free Press: New York.2. Adams, R. (2020). Interior design: A global profession. Abingdon, Oxon:
Routledge, Taylor & Francis Group.3. Airey, D. (2019). Identity designed the definitive guide to visual branding.
Beverly, MA: Rockport.4. Amin, A., & Cohendet, P. (2004). Architectures of knowledge: Firms, ca-
pabilities and communities. Oxford, UK: Oxford University Press.5. Angeli, A. (2016, August 26). Why scent is essential to design. Retrieved
April 21, 2021, from https://medium.com/interior-design-collection/why-scent-is-essential-to-design-984edab9a064
6. ArchDaily., (23 Apr 2021). Interiors Colored by Natural Light: TintedGlass Finishes by 3M. Accessed 25 Apr 2021 from https://www.arch-daily.com/960544/interiors-colored-by-natural-light-tinted-glass-finish-es-by-3m
7. Austin, T. (2020). Narrative environments and experience design: Spaceas a medium of communication. New York: Routledge, Taylor & FrancisGroup.
8. Ayoko, O. B., & Ashkanasy, N. M. (2020). Organizational behaviour andthe physical environment. London: Routledge.
9. Bojovic, N., Sabatier, V., Coblence. E., (2019). Becoming Through Do-ing: How Experimental Spaces Enable Organizational Identity Work.Strategic Organization, SAGE Publications: UK and US).
10. Bone, P.F. and Ellen, P.S. (1999). Scent in the marketplace: Explaining afraction of olfaction, Journal of Retailing, 75(2), 243-62.
11. Borges, S., Ehmann, S., Klanten, R. (2013). Brand spaces: Branded ar-chitecture and the future of retail design. Berlin: Gestalten.
12. Boyce, P. R., Heerwagen, J. H., Jones, C. C., Veitch, J. A., & Newsham,G. R. (2003). Lighting quality and office work: A field simulation study.Richland, WA: Pacific Northwest National Laboratory.
13. Brooker, G., Stone, S. (2007). Form + Structure: The Organisation of In-terior Space. Lausanne: AVA.
14. Brooker, G., Stone, S. (2008). Basics Interior Architecture 02: Context &Environment. Lausanne: AVA.
15. Burmann, C., Riley, N-M., Halaszovich, T., & Schade, M. (2017). Identi-ty-Based Brand Management. Wiesbaden: Springer Gabler.
16. Cao, L., (23 Mar 2020). What to Expect from Interiors of the Future. Arch-Daily, Accessed 10 Apr 2021. From https://www.archdaily.com/935089/

71
what-to-expect-from-interiors-of-the-future17. Chakravarty, S. M. (2015). Sensory Branding. In S. Sarma, S. Singh
(Eds.), Cases on branding strategies and product development: Successesand pitfalls (pp. 327-365). Hershey, PA: Information Science Reference.
18. Chatterjee, S. (2017). Brand Loyalty On the Basis of Olfactory Tech-niques Using Discriminant Analysis: A Case of Cafe Coffee Day Store inKolkata, India, Academy of Marketing Studies Journal, 21(1), 1-6.
19. Chebat, J.C. & Michon, R. (2003). Impact of ambient odors on mall shop-pers’ emotions, cognition and spending: A test of competitive causal the-ories. Journal of Business Research, 56(7), 529-39.
20. Chung, S. (2017). Designing “Place” in Workplace. Retrieved fromhttp://icon.asid.org/index.php/2017/09/09/designing-place-in-workplace/
21. Clegg, S. & Kornberger, M. (2006). Space, organizations and manage-ment theory. CBS Press: Denmark.
22. Crespy, G., Isgro, A. E. (2020). Art and Space: New Boundaries of Inter-vention. In 1332742404 977644479 L. Crespi (Author), Cultural, theo-retical, and innovative approaches to contemporary interior design (pp.191-207). Hershey, Pa: IGI Global, Disseminator of Knowledge.
23. Dagli, Z. (2016). Corporate identity in interior design, Global Journal onHumanities & Social Sciences. [Online]. 03, pp 318-327. Available from:http://sproc.org/ojs/index.php/pntsbs
24. De Chernatony, L. & Riley, F. (1998). Modelling the components ofthe brand. European Journal of Marketing, 32(11/12), 1074-1090. doi:10.1108/03090569810243721
25. Dio, (2019, May 14). The sense of taste in experiential marketing - dio ex-periential marketing. Retrieved April 21, 2021, from https://diousa.com/blog/the-sense-of-taste-in-experiential-marketing/
26. Fielding, N. P. (2015). Cultural branding and interior space personalityimpression as dyadic connection: Retail design integrated study of Aber-crombie and Fitch (Unpublished doctoral dissertation). Iowa State Uni-versity.
27. Gesimondo, N., Postell, J. C. (2011). Materiality and interior construc-tion. Hoboken, N.J: John Wiley.
28. Gobe, M. (2010). Emotional Branding: The New Paradigm for Connect-ing Brands to People. New York: Skyhorse Publishing.
29. Gobe, M., (2001). Emotional Branding: The New Paradigm for Connect-ing Brands to People, Allworth Press: New York.
30. Greenberg, E., Kates, A., (2014). Strategic Digital Marketing: Top Dig-

72
ital Experts Share the Formula for Tangible Returns on Your Marketing Investment. McGraw-Hill Education: New York City.
31. Herbst D. (1998). Corporate identity. Berlin: Cornelsen.32. Herssens, J., Heylighen, A. (2011). Challenging architects to include hap-
tics in design: Sensory paradox between content and representation. InLeclercq, P., (Ed.), Designing Together—CAAD Futures, Les EditionsdeL’Universite’ de Liege: Liege, Belgium, 685–700.
33. Hollenbeck, C.R., Peters, C. and Zinkhan, G.M. (2008): Retail spectaclesand brand meaning: Insights from a brand museum case study. Journal ofRetailing, 84(3), 334-353.
34. Hultén, B. (2011). Sensory marketing: the multi-sensory brand-ex-perience concept. European Business Review, 23(3), 256-273. doi.org/10.1108/09555341111130245
35. Hulten, B. (2017). Branding by the five senses: A sensory branding frame-work, Journal of Brand Strategy, 6 (3), 1–12.
36. Hultén, B. (2020). Sensory marketing: An introduction. London: SAGE.37. Johnson, A. (2007). Tactile branding leads us by our fingertips. CTV
News, Shows and Sports. http://www.ctv.ca/servlet/ArticleNews/print/CTVNews/20070803/tactile_branding_070803/20070804/?hub=MSN-Home&subhub=PrintStory.
38. Johnson, J. (2020, July 01). Visual identity: Everything you need to knowabout this essential aspect of branding. Retrieved April 18, 2021, fromhttps://99designs.com/blog/logo-branding/visual-identity/
39. Kapferer, J.N. (2012). The New Strategic Brand Management: Advancedinsights and strategic thinking (5th ed.). Kogan Page: London.
40. Klingmann, A. (2007). Brandscapes: Architecture in the ExperienceEconomy. MIT Press: Massachusetts.
41. Koch, J., Frommeyer, B., & Schewe, G. (2020). Online Shopping Motivesduring the COVID-19 Pandemic—Lessons from the Crisis. Sustainabili-ty, 12(24), 10247. doi:10.3390/su122410247
42. Lerman, D., Morais, R. J., Luna, D. (2018). The language of branding:Theory, strategies, and tactics. New York: Routledge, Taylor & FrancisGroup.
43. Leydecker, S. (2013). In between: Interior design in between architec-ture and design. In S. Leydecker (Ed.), Designing interior architecture:Concept, typology, material, construction (pp. 10-61). Basel: BirkhäuserVerlag AG.
44. Li, H., & Cai, J. (2016). Developing a Lifestyle Design Approach in Brand

73
Design Process Through UCD Methodology. In 1332715655 977628586 A. Marcus (Ed.), Design, User Experience, and Usability: Design Think-ing and Methods 5th International Conference, DUXU 2016, Held as Part of HCI International 2016, Toronto, Canada, July 17-22, 2016, Proceed-ings, Part I (pp. 314-322). Switzerland: Springer International Publishing.
45. Long, C. (2016). The new space: Movement and experience in Viennese modern architecture. New Haven: Yale University press.
46. Loureiro, S. M. C., Ruediger, K. H., & Demetris, V. (2012). Brand emo-tional connection and loyalty. Journal of Brand Management, 20(1), 13–27. doi:10.1057/bm.2012.3.
47. Mesher, L. (2010). Basics Interior Design 01: Retail design. BLOOMS-BURY VISUAL ARTS: Switzerland.
48. Minsky, L., & Fahey, C. (2017). Audio branding: Using sound to build your brand. New York: Kogan Page.
49. Morin M. 1998. Retail sell-out. Light Design Appl. 6, 66-69.50. Nair, S.J., (2013). Creating Brand Identity Using Human Senses. SSRN
Electronic Journal. II(IX), 223-228. doi:10.2139/ssrn.234604551. Norton, D. (2003), Toward Meaningful Brand Experiences. Design Man-
agement Journal, 14 (1): 19-25. 52. O’Brien, D. (2006). An introduction to the theory of knowledge. Cam-
bridge, UK: Polity.53. Oduguwa, E., (2015). How Taste and Sight Impact Brand Loyalty in Sen-
sory Marketing, Undergraduate Student Research Awards. 27.54. Oylum, N. (2010). Marka – İc ̧ Mekan İlişkisinin Tüketim Kavramı
Çerçevesinde Değerlendirilmesi. İstanbul: İstanbul Ticaret Üniversitesi.55. Pahwa, A., Consultant, A., & Robert, K. (2021, January 25). Brand es-
sence: Meaning, importance, & examples. Retrieved April 24, 2021, from https://www.feedough.com/brand-essence/
56. Pantano, E., & Laria, G. (2012). Innovation in Retail Process: From Consumers’ Experience to Immersive Store Design. Journal of Tech-nology Management & Innovation, 7(3), 198–206. doi:10.4067/s0718-27242012000300016
57. Patil, D. B., & Bhakkad, D. D. (2014). Redefining management practices and marketing in modern age. Dhule: Atharva Publications.
58. Perry, A., & Wisnom D. (2003). Before the Brand: Creating the Unique DNA of an enduring Brand Identity. McGraw Hill Professional: New York.
59. Plummer, J. T. (1974). The Concept and Application of Life Style Segmen-

74
tation. Journal of Marketing, 38(1), 33. doi:10.2307/1250164 60. Poldma, T. (2008). Dwelling futures and lived experience: Transforming
interior space. Design Philosophy Papers, Issue 2.61. Poldma, T. (2010). Transforming interior spaces: Enriching subjective ex-
periences through design research. Journal of Research Practice, 6(2),Article M13. Retrieved [10.03.2021], from http://jrp.icaap.org/index.php/jrp/article/view/198/199
62. Ponsonby-McCabe, S., Boyle, E., (2006): Understanding brands as expe-riential spaces: Axiological implications for marketing. Journal of Strate-gic Marketing, 14(2), 175-189.
63. Roger, S., & Maydoney, A. (2003). Storytelling Through Design, DesignManagement Journal, 14(4): 18-34.
64. Roy, D., & Banerjee, S. (2008). CARE‐ing strategy for integration ofbrand identity with brand image. International Journal of Commerce andManagement, 17 (1/2), 140-148.
65. Sametz, R., Maydoney, A., (2010). Storytelling through de-sign, Design Management Journal, 14(4), 18-34. Doi: https://doi.org/10.1111/j.1948-7169.2003.tb00347.x
66. Scheer T. 2001. The Volkswagen architecture: Identity and flexibility as aconcept. Ostfildern (Germany): Hatje Cantz.
67. Schielke T. 2014. Corporate lighting: methods and techniques of archi-tectural lighting for brand communication. Doctoral thesis. Department:Faculty of Architecture. University: Darmstadt University of Technology.
68. Schielke, T. (2015). Influence of Lighting Design on Marketing Commu-nication. LEUKOS, 11(3), 109–124. doi:10.1080/15502724.2015.1020949
69. Sendra, E., & Carbonell-Barrachina, A. A. (2017). Sensory and aromamarketing. Wageningen, The Netherlands: Wageningen Academic.
70. Siddiqua, M. (2020, July 22). Digital technologies Innovating interiordesign. Retrieved April 12, 2021, from https://www.zilliondesigns.com/blog/digital-technologies-innovating-interior-design/
71. The Aroma Trace, (2020, August 21). Best examples of Olfactory market-ing in companies. Retrieved April 21, 2021, from https://thearomatrace.com/best-examples-of-olfactory-marketing-in-companies/
72. Thyssen, O. (2011). Aesthetic communication. Basingstoke: PalgraveMacMillan.
73. Tuckwell, K. J., Jaffey, M. (2016). Think Marketing Second Candia Edi-tion. Canada: Pearson Education Canada.

75
74. Vaikla-Poldma, T. (2003). An investigation of learning and teaching pro-cesses in an interior design class: An interpretive and contextual inquiry.Unpublished doctoral dissertation, McGill University, Montreal, Canada.
75. Waxman, L. (2006). The coffee shop: Social and physical factors influenc-ing place attachment. Journal of Interior Design, 31(3), 35-53.
76. Waxman, L. K. (2004). More Than Coffee: An Examination of People,Place, and Community with Implications for Design; PhD. Dissertation,Florida State University.
77. Wood, E. 2001. The Corporate Identity. In A. Theaker (Ed.), The PublicRelations Handbook, London: Routledge.
78. Yilmaz, M., & Maz, M. (2006). Architectural identity and local communi-ty. Ekistics, 73(436/441), 140-146. Retrieved April 16, 2021, from http://www.jstor.org/stable/43623731


77
Chapter-5
COMPARISON OF FLOOR HEATING AND RADIATOR SYSTEMS IN TERMS OF ENERGY
EFFICIENCY IN BUILDING HEATING SYSTEMS
Sahika OZDEMIR1
1 Asst. Prof. Dr., Istanbul Sabahattin Zaim University, Department of Interior Architecture and Environmental Design, Halkali Street, 34303, Halkali Kucukcekmece Istanbul Turkey [email protected]


79
1. IntroductionThe energy need in our world increases by about 4-5% every year. In paral-
lel with this increase in demand, energy costs are also increasing, and users are charged a heavy bill every month. Therefore, consumers resort to new ways to reduce energy costs at a manageable level. Keeping the maintenance / repair cost of the system low together with an optimum scale heating / cooling system equip-ment, an efficient use of energy in the equipment and the selection of a suitable equipment / fuel system is an important engineering approach in this respect. Current climatic conditions are the biggest factor in determining the heating / cooling requirement of a unit. The climatic conditions and fuel configuration of a location are often beyond the discretion of the users. For this reason, it is the most practical solution to make a design that will provide the minimum cost conditions and maximum system life of the system to be operated within the framework of these two basic factors. Energy costs can generally differ from region to region. The first factor for the user in resource selection should be environment and cost. The most important issue that the user will pay attention to from now on is to choose a new and highly efficient system, thus minimizing monthly energy costs.
Although very high prices are paid for the energy consumed in the operation of the heater, cooler and lighting systems and devices we use in our houses, we cannot see the benefit we expect. There are three main reasons for this. The first reason is that energy prices, especially electricity and natural gas, are very high in our country. The second reason is that the heaters, coolers, lighting systems and devices we use in our houses are unconsciously operated and used in a way that causes low efficiency and low efficiency. The third reason is that our houses are not well insulated with their architectural design to protect them against cold and heat and to provide lighting.
Heating systems, in general, are systems that provide thermal comfort in spac-es by compensating the heat losses between the indoor and outdoor environments. These systems have an important place in people’s lives in terms of comfort. The design of the systems is important for people to benefit from these systems under comfortable and economic conditions.
In the selection of a heating system, advantages and disadvantages should be evaluated and the most suitable system solution should be found in terms of ther-mal comfort.1 In this context, heating systems can be examined under two main headings:
• Central heating systems• District heating systems

80
In central heating systems, a central heater (such as a boiler) for heating the fluid (water, air or steam) to be used, a piping that will distribute the heated fluid and a final conductor that will transmit the heat to the environment by convection is required. In central heating systems, the entire system has a pump that circu-lates the heating water. Hot water is usually used to feed another heat exchanger to provide domestic hot water stored in a water tank. In heating systems where air is used, air is circulated through duct systems.2
District heating systems are basically similar to central heating systems. How-ever, in these systems, users do not like the spaces through a common central system of the building, but individually. The system that feeds the heater that will transmit the heat to the environment becomes a smaller capacity device such as a combi boiler. In these systems, circulation pumps are usually on the device. Fur-thermore, individual heating appliances such as air conditioning (hot air convec-tion), stoves (solid fuel, electric or liquid fuel such as kerosene) and fireplaces are also widely used today.3
When space-heating systems are examined, it is seen that hot water heating systems are the most preferred systems in terms of comfort. In hot water heating systems, energy is obtained by burning gas, liquid or solid fuels in the boiler and this energy is used for heating the water. The heated water is transmitted to the space through various heat emitters such as radiators, fan-coils, air appliances, floor-heating pipes with the help of a pump. Thus, the temperature of the space is increased by the heat transfer that occurs between these devices and the space.4
In this study, within the scope of district heating systems, the uses of the sys-tems that provide the final heat transfer with hot water, underfloor heating and radiator elements and their comparisons on thermal comfort will be discussed. In this study, the cost of energy used in various buildings, the advantages of high-ef-ficiency new modern systems that will ensure efficient use of energy, the applica-tion of energy management in buildings, financial comparison of systems accord-ing to different fuels are examined.
2. Floor Heating SystemsOperating the heating / cooling system of a building under optimum condi-
tions in terms of energy efficiency is accepted as the most important approach in this context. The application of both the existing system in the building and new technologies, process and other equipment, operation and maintenance proce-dures and energy documentation methods to an existing facility requires many levels of training. Detailed training is needed, especially when large expenditures are made for new equipment with high-energy efficiency. Maximum efficiency

81
and maximum savings from such systems can only be achieved with the correct operation of the system and a suitable maintenance / repair period.
Floor heating systems are a heating system that distributes the heat losses in the spaces by spreading the energy received from the heat source through the pipes in the floor concrete under the floor, and heats the floor and therefore the environment. The main principle of the system is to meet the amount of energy to meet the heat loss in a volume whose heat loss has been calculated by circu-lating hot water supplied from a central producer through special pipes under the flooring material. Warm water spreads over the entire floor area and provides a homogeneous heating.5
2.1 Working and Application Principles of Floor Heating Systems In the application of floor heating systems, insulation material serving as heat
and sound insulation and polypropylene foil are laid on the leveled reinforced concrete floor and wall edges. Then, fixing elements are used according to the chosen laying method and pipe distances (modulation).3
Since the lengths of the pipes to be applied to the ground will be limited to 80 - 120 m depending on whether or not there is a circulation pump in the collector, which will be mounted at the starting point and which functions as a water distri-bution and collection unit, the pipes are not applied to the floor in a single group. From the starting point until the appropriate meter is completed, the pipe is laid like a resistance and the starting point is returned, this round trip process is called a group (Figure 1).3
Figure 1. Group representation in floor heating system.3
After the pipes are laid according to the chosen laying style and pipe spacing, each mouth is connected to the collector. The location of the collector should be determined to be at a suitable distance to all places where underfloor heating pipe

82
will be laid. Each group is controlled by a separate valve. A large room can be heated by more than one group (Figure 2).3
Figure 2. Different laying styles for groups.3
Pipe diameters and wall thicknesses used in underfloor heating systems are elements that affect performance. As the transported water, capacity will change depending on the pipe diameter, the thermal efficiency changes and similarly, the wall thicknesses are effective in the heat transfer coefficient of the pipes. For ex-ample, when a pipe with a diameter of 16 mm and a wall thickness of 2 mm is used in a floor heating system in an area of 1 m2, 0.113 liters of water is carried in 1 meter of the pipe and the system is fed with 45 degrees of water and placed in a 4 cm screed under ceramic at 10 cm intervals, 24 degrees in the room. It gives 152 W of heat per square meter. This value decreases by 32% in parquet, 25% in carpet and 50% in laminate. Generally, pipe-laying intervals in underfloor heat-ing systems are applied as 10 cm. In areas with high heat loss such as windows, doors and balconies, this gap is applied as 5 cm. In this way, there is a 10 m pipe consumption in the middle of a 1 m2 area and 20 m pipe consumption in areas with high heat losses.3
2.2 Floor Heating Systems Features and AdvantagesIn recent years, in addition to their use in public spaces and spaces (such as
mosques, baths, saunas, greenhouses, roads, etc.), their use in private spaces such as residences has increased, floor heating systems are systems designed to pro-vide a more comfortable heat distribution with less energy.
The under-floor temperature of a healthy person is 25 ° C on average. For un-derfloor heating systems determined by international standards, the healthy floor temperature is maximum 29 ° C. These temperatures should not exceed 29 ° C in common areas, 33 ° C in the bathroom, and 35 ° C in the edge areas where heat loss is high.6
It is clear that there will be heat transfer between a person with a body tem-perature of 36.5 ° C and a room with a lower temperature. The heat lost by con-vection from the body due to excessive air movements, the heat lost by radiation due to the cold wall and ceiling surfaces, and the heat lost through the conduction

83
from the foot surface that is in constant contact with the floor give a feeling of chill.5
A more homogeneous temperature distribution is provided both horizontal-ly and vertically in a space heated by underfloor heating system. The air in the place heated by the underfloor heating system rises towards the upper parts of the space. As it rises, the air movements towards the upper parts of the space weaken and the air gets cooler. Thus, hot air accumulates in the living space, not on the upper part of the space. This uniform temperature distribution from floor to ceil-ing is the most suitable profile for the theoretically ideal heat dissipation profile.5
When evaluated in this context, the advantages of the floor heating system in terms of application, use and comfort can be summarized as follows:
• Since it is a screed application, it does not narrow the usage areas in thespaces.
• It is comfortable because it provides a homogeneous thermal distributionin spaces; the heat in the environment does not accumulate in the ceilingarea and remains at human height.
• It provides high efficiency from heating devices such as combi boilers andboilers, as it operates at low heating return temperatures such as 30-40 de-grees.
• In terms of application, laying and installation speed is high.• For each room, the desired room temperature can be adjusted by throttling
or closing the valve of the relevant group in the collector.• The service life of the pipes varies according to the operating temperature
and pressure, and it can be up to 50 years.3
3. Radiator Heating SystemsVarious energy sources are used in the heating / cooling sector to meet the
need for heating, cooling, steam, hot water or cooling. These fuels include do-mestic lignite and imported coal, natural gas, heavy fuel oil, light fuel oil (heating fuel), LPG, diesel and electricity. The energy saving potentials of energy sources and their economy accordingly depend on the unit price of the fuel, the calorif-ic value of the fuel and the efficiency of the boiler and burner where the fuel is burned. Comparison of systems using different fuels should be repeated constant-ly, as fuel prices change constantly due to various reasons.
Radiator systems are at the top of the systems used in the heating of spaces in buildings. In these applications, the thermal comfort of the space depends on pa-rameters such as the location of the radiators in the space, the materials used on

84
the heating surfaces, the heating surface areas, the operating temperature, and the obstacles located around the radiators in the space.
In today’s world where the value of energy gradually increases and the desired comfort level increases, it is important for designers, practitioners and users to understand the effects of these parameters.4
3.1 Working and Application Principles of Radiator Heating Systems In radiators, heat spreads to the environment in two ways: radiation (radiation)
and convection. In 90/70 degree hot water heating plants, the average surface temperature is 80 degrees, and the amount of radiation at this low temperature is low. Generally, only 20-40% of the heat in radiators is emitted by radiation. The main part is spread by convection. The type of paint and the geometry of the ra-diator affect the heat transfer by radiation rather than the material of the radiator. Radiation is high in black and matte painted radiators. However, the color of the paint is not very effective. Radiation is significantly reduced in shiny metallic paints. Shiny metallic paints such as aluminum or bronze reduce the radiation to 50% and the total radiator heat power to 10%. The second factor is the radiator geometry. Radiators with a large external projection surface area also have a high rate of radiation. In this respect, the rate of radiation is high in thin cast radiators and panel radiators. Since finned surfaces are used in aluminum radiators, the outer surfaces do not come into direct contact with water and have a lower tem-perature. For this reason, radiation rates are also low. Surface smoothness also has an effect on radiation. Roughcast surfaces radiate slightly better than flat sur-faces.7
Radiator placements recommended in terms of efficiency according to TS 2164/2 are included. According to these data, when the distance from the wall at the rear of the radiator to the wall is at least 40 mm and the distance from the bottom to the base is 100 mm, it was predicted that the efficiency would be 100% and the efficiency of other cases was determined by comparing it.4
The places where the most heat loss is experienced in buildings are glass and external walls. Double glazing applications will not be able to completely prevent heat loss, no matter how good the thermal insulation applications are. Therefore, the radiators should be designed primarily by being mounted under glass. How-ever, if the radiator cannot be mounted under glass due to architectural require-ments, it should be mounted not on the interior wall of the building, but on the outer wall of the building where heat loss is most experienced.7
When choosing the location of the radiator, care should be taken to ensure that it is cleaned to allow heat dissipation. The windows of heated volumes are the

85
coldest places. For this reason, placing the radiators under the windows is pre-ferred. In volumes with large heat loss and a large number of windows, placing a heater in front of each window would be appropriate to distribute the heat prop-erly. If it becomes necessary to place the radiator on the inner wall surface, the majority of the outer surface areas of the radiator should be parallel to the outer wall faces. The effect of cold air intake from cold surfaces can be compensated. Heat transfer in radiators is mostly through heat conduction. Therefore, the radi-ators should be placed in the room in such a way that the ambient air can easily enter the lower part of the radiator, move along the radiator, and rise towards the upper part.7
3.2 Radiator Heating Systems Features and AdvantagesApplication in heating systems with radiators takes place with distribution
over a pipe network. In this distribution, return pipes are laid from the collec-tor boxes to each radiator through the screed. Heating pipes are passed through the larger diameter protective spiral casing pipes so that they do not damage the screed and the floor due to the expansion at high temperature (70 to 90 degrees) in operation, so that there is a free space for expansion between the protective spiral-casing pipe and the heating pipe. The air in this volume also provides heat insulation and prevents unnecessary heating and heat loss in the places where the pipes pass (Figure 3).3
Figure 3. Piping and collector connection for radiators.3
Some of the application advantages of the radiator systems can be listed as in-stallation speed, reduction of pressure losses due to the routing of the pipes, low local flow losses, ease of modification when necessary due to the system operat-ing in a protective casing.3

86
4. Results and DiscussionIn order for the heating / cooling systems to be operated under optimum con-
ditions in terms of energy efficiency, buildings must have a building energy man-agement and energy accounting periodically updated and supervised by experts. In order to minimize the heating / cooling costs; The places that cause air leaks, heating losses, cooling gains in the building components must be repaired and their sealing must be ensured in a perfect way with suitable gasket / wick el-ements. The user should choose the most appropriate fuel and system accord-ing to the region and replace the existing low-efficiency classic units with new high-efficiency models. In these modifications, the initial investment cost, oper-ating cost, payback period and environmental criteria should be taken into con-sideration, and new high efficiency models should be preferred instead of uneco-nomic modifications.
While designing the energy efficiency of the heating / cooling system with a new building, the concepts of climate, maximum benefit from daylight and clean environment should be considered as basic criteria of the design. The combi-nation of architectural and engineering disciplines in the early design process constitutes an important step in achieving a sustainable energy saving goal. The precautions to be taken during the early design process minimize the subsequent modifications in the heating / cooling systems and ensure that the costs are re-flected to the user at a minimum level.
While the operating temperature of the water is 90-70 degrees in radiator heat-ing systems, the inlet temperature is 50-60 degrees in a single pipe system in floor heating. Thus, by allowing the system heating fluid temperature to be selected at a lower temperature, it both reduces operating costs and saves energy.5 In addi-tion, the small difference between the heating water and room temperature in the floor heating system is a factor that prevents the formation of excessive airflow.
In radiator heating systems, the heated air moves towards the ceiling area, stays there, and starts to cool. The cooled air then moves towards the floor surface and causes a cooler and not very comfortable environment in the main position of the living area (Figure 4).

87
Figure 4. Comparison of hot air movement in radiator and floor heating systems.1
In floor heating systems, on the other hand, the system that is placed inside the floor provides the heating of the entire floor and with this, the movement of hot air from the entire floor surface occur upwards. It provides a warm and more comfortable environment in the main living area as the hot air starts to cool as it approaches the ceiling surface. In Figure 8, the mentioned hot air movement be-longing to the two systems can be seen comparatively.
One of the important differences between the two systems is that, in the sys-tem with radiators, hot air is distributed locally within the space, whereas in the floor heating system, the hot air is distributed homogeneously.1
Another difference between the two systems is the dust flight caused by the airflow caused by the displacement of the hot and cold air in the environment. These dust particles, which are formed due to particles burning at high temper-atures, are mostly seen in this system due to the operating temperature above 50 degrees of the radiator system. In addition, continuous hot and cold air displace-ment (non-homogeneous hot air movement) causes dust transport. On the other hand, since the floor heating systems have an operating temperature of 45-50 de-grees, they both prevent dust formation largely and reduce the airflow movement due to the homogeneous hot air movement, thus preventing dust transport.1
5. ConclusionEnergy saving is doing the same job using less energy. Energy saving does not
only mean less use of energy. Energy saving means using energy more efficiently by improving traditional methods and using new technologies. The cheapest en-ergy is the energy saved.
While heating from the radiator does not provide a homogeneous thermal

88
comfort for the environment, the floor heating system, where the floor serves as a complete heating element, provides a more homogeneous thermal comfort at different points of the environment. It is possible to conclude that floor-heating systems create a more homogeneous thermal comfort environment compared to radiator heating systems.8
The difference between the operating temperatures of the systems (90-70 de-grees in a radiator system, 50-60 degrees in floor heating) creates a serious dif-ference in terms of energy consumption and sustainability of the systems. In this context, it can be concluded that underfloor heating is more economical and suit-able for long-term use in terms of performance.

89
References1. Erol N. Comparison of Radiator and Under Floor Heating Systems in
North Cyprus. M.S. thesis, Eastern Mediterranean University, Gazimagu-sa, Cyprus, 2013.
2. URL1: What are Heating Systems?, Reference: Available from: http://www.butunklima.com.tr/hizmet/hizmetlerimiz/isitma-sistemleri
3. 3. Gencler S. Basics of Heating Installation Technique. Viessmann Akad-amie; 2011.
4. Ucler K, Kibar A, Karabag B and Yigit KS. Experimental Investigationof Obstacles Placed Around Radiators Under Windows Inside the Space.Electronic Journal of Machine Technologies, 2015 12(4), 61-69.
5. Arici M, Dil D, Karabay H. The Effect of Pipe Distance and Water Tem-perature on Floor Surface Temperature in Underfloor Heating Applica-tions. TMMOB Chamber of Mechanical Engineers, Plumbing Engineer-ing Journal, 2010 16, 52-56.
6. Olesen BW. Radiant floor heating in theory and practice. Ashrae Journal,2002 44, 19-26.
7. Dasdemir D. Points to Take into Consideration in the Installation and Useof Panel Type Radiators. TMMOB Chamber of Mechanical Engineers,Plumbing Engineering Journal, 2005 146, 5-12.
8. Atilgan I and Ekici C. Comparison of Floor and Radiator Heating in termsof Comfort in an Office. Gazi University Faculty of Architecture Journal,2012 27(1), 183-191.


![read.pudn.comread.pudn.com/downloads108/ebook/446487/LearningPython.pdf · [ Team LiB ] • Table of Contents • Index • Reviews • Reader Reviews • Errata • Academic Learning](https://img.pdfslide.us/doc/110x75/5eb47350f8edee5e4e3ed405/readpudn-team-lib-a-table-of-contents-a-index-a-reviews-a-reader-reviews.jpg)