Embed Size (px)
Citation preview

Consortium on Chicago School Research 1
Examining Productivity Series
Academic Productivityof Chicago PublicElementary Schools
A Technical ReportSponsored byThe Consortium on ChicagoSchool Research
March 1998
Anthony S. BrykUniversity of Chicago
Yeow Meng ThumUniversity of California
at Los Angeles
John Q. EastonConsortium on Chicago
School Research
Stuart LuppescuConsortium on Chicago
School Research

Academic Productivity of Chicago Public Elementary Schools2
i
Academic Productivity ofChicago PublicElementary Schools
A Technical Report
Table of Contents
Acknowledgments . . . . . . . . . . . . . . . . . . . . . . . . . . . iiiIntroduction . . . . . . . . . . . . . . . . . . . . . . . . . . . . . . . . 1
A Weak Indicator: Problems withPercentage of Students atNational Norms . . . . . . . . . . . . . . . . . . . . . . . . . . 3
Need for a Stable Measurement Ruler over Time:Problems Associated withNationally-Normed Standardized Tests . . . . . . . . . 6
The Alternative: A Content-Referenced Measurement System . . . . . . . . . . . . . . . . . . . . . 13
A Good Indicator of School Productivity:A Value-Added Approach . . . . . . . . . . . . . . . . . . 17
Evidence for Systemwide Improvement . . . . . . . . . . .30
Summary . . . . . . . . . . . . . . . . . . . . . . . . . . . . . . . . . .40
Recommendations of the Steering Committee of theConsortium on Chicago School Research . . . . . . 42
Endnotes . . . . . . . . . . . . . . . . . . . . . . . . . . . . . . 46References . . . . . . . . . . . . . . . . . . . . . . . . . . . . . 50Appendix . . . . . . . . . . . . . . . . . . . . . . . . . . . . . . 53

Consortium on Chicago School Research 3
Acknowledgments
Many people have been involved in this project throughout its longhistory. G. Alfred Hess, Jr., Research Professor at Northwestern Uni-versity, proposed this project in 1990 as a joint effort of the ChicagoPanel on School Policy and the Center for School Improvement atthe University of Chicago. With the financial support of the Spen-cer Foundation and the assistance of the Department of Research,Evaluation and Planning of the Chicago Public Schools, work pro-ceeded for several years. With the conclusion of the Spencer grantto the Chicago Panel, the Consortium on Chicago School Researchassumed responsibility for completing the project. Although FredHess continued to advise on the study, the authors alone are respon-sible for any errors of fact or interpretation.
At the Consortium, we would like to thank Sandra Jennings for herexpertise in drawing the figures and desktop publishing the report. Wethank Kay Kersch Kirkpatrick for her attention to detail in managingthe production of the productivity report, and we appreciate RebeccaWilliams’ editing and rewriting skills.
Staff members of the Chicago Panel on School Policy, especially JesseQualls, also contributed greatly to this study.
At the University of Chicago, we wish to thank Ben Wright on thedesign of the equating study and for the numerous hours he spent guid-ing us through the detailed analyses. David Kerbow conducted muchof the research on mobility that helped us understand some of the com-plexities of this study. Many people who contributed along the wayhave since moved on. We especially wish to thank Ong Kim Lee andPaul Dean for their help over the years.
We wish to specifically thank Julia Smith (Western Michigan Uni-versity) for the development of the mathematics measurement ruler usedin this study. Additional work by her on pacing and content in math-ematics instruction will be forthcoming.
At the Chicago Public Schools, we greatly appreciate the early sup-port and ongoing assistance of William Rice and Carole Perlman. Wewould also like to thank John Delmonte, Daisy Garcia, CynthiaGonzalez, Andrea Ross, the late James Stewart, Sandra Storey, and PeterWallin for their help.

Academic Productivity of Chicago Public Elementary Schools4

Consortium on Chicago School Research 5
IntroductionThe past decade saw two major changes in the governance and operationsof the Chicago Public Schools (CPS). The Chicago School Reform Act of1988 devolved substantial resources and authority to local schools and madethem responsible for their own improvement. This law established locallyelected school councils with authority to evaluate and select the school prin-cipal, and devise an annual School Improvement Plan and budget. Increaseddiscretionary monies, provided as part of this legislation, have fueled localimprovement efforts including hiring additional staff; purchasing instruc-tional materials, equipment, and textbooks; and increased professional de-velopment activities.
Beginning in 1991, the Consortium on Chicago School Research initi-ated a number of critical probes of Chicago’s decentralization reform. Ourearly work focused primarily on how teachers and principals in elementaryschools reacted to this reform, how they used the opportunities it providedfor local improvement initiatives, and the constraints they encountered inadvancing school change. Over the last three years, we brought more in-tense scrutiny to reform of the city’s high schools. In both cases, we adopteda strong formative orientation seeking to assist both school community lead-ers and systemwide policy makers. We have sought to chart the progress ofthis reform and to advance the public conversation about additional changesneeded if this reform is to culminate in major improvements in educationalopportunities for children.
More recent state legislation in 1995 added a new dimension to reform—it restructured the central office. The legislation created a corporate stylemanagement team, including a chief executive officer, who replaced theposition of superintendent, and a Reform Board of Trustees, who are nowdirectly appointed by the mayor. This law brought greater central account-ability by clarifying the powers of the chief executive officer to deal withnon-improving schools. As the system has moved aggressively to use thesenew powers to place over 100 schools on probation and to reconstitutesome of the most problematic among them, the need to accurately identify

Academic Productivity of Chicago Public Elementary Schools6
failing schools has become more critical. To date, the system has relied pri-marily on a simple statistical indicator—less than 15 percent of the stu-dents above national norms on the Iowa Tests of Basic Skills (ITBS)—forthis purpose. While the CPS’s efforts to intervene in failing schools havebeen generally lauded, criticisms have been raised about the specific cri-terion used.
Purpose of this PaperLooking back to 1988, it is very clear that the Chicago Public Schoolsneeded deep and profound changes. While there were a few pockets ofexcellence, taken in total it was a school system organized for failure.The 1988 Chicago School Reform Act banked on expanded local par-ticipation to challenge this dysfunctional status quo and to promotestructural change at both the individual school and the system level.While reformers recognized that major changes in student learning mightnot come quickly, the ultimate bottom line for reform was improve-ments in academic achievement.
Thus, the aspirations for the 1988 Reform Act as well as the more recentaccountability efforts of the central office indicate that the CPS needs acredible system for charting academic improvement. As we demonstratebelow, the annual systemwide reports of student test scores, while of greatpublic interest, are crude and sometimes seriously biased indicators formaking judgments about the productivity of individual schools. For thisreason, several Consortium staff and affiliates, under the initiative of theChicago Panel on School Policy, have been working for a number of yearson better ways to analyze and report standardized test score data for exam-ining the academic productivity of the Chicago Public Schools.
This report uses ITBS scores for all students in grades two through eightfrom 1987 to 1996. In half of the schools, where local school councils hadthe opportunity to choose their own principal in 1990, these data representsix-year trends in student learning under reform. For the other half of schools,who had the opportunity to select a principal in 1991, these data representfive-year trends. In both cases, sufficient time has been afforded for signifi-cant organizational changes to occur. A body of evidence has finally beenassembled that makes it now possible to investigate seriously time trends inschool academic productivity.
This report differs from others distributed by the Consortium in that itis more expository in tone and somewhat more technical. We detail a set ofweaknesses in the current CPS testing and reporting system, and developan alternative approach, called a school academic productivity profile, for sum-

Consortium on Chicago School Research 7
marizing the changes that have occurred in a school. The core of this ap-proach entails estimating the value that a school adds to the learning ofstudents taught at that school.
This report also initiates our “Examining Productivity” series. It is thefirst in a series of studies that will systematically examine the academic pro-ductivity of Chicago’s public elementary schools. This report develops aproductivity profile for each school and uses these to summarize the sys-temwide trends over the decade from 1987 to 1996 in reading and math-ematics achievement. Subsequent reports will use these same data to inves-tigate the characteristics of schools that have been especially effective intheir academic improvement efforts.
The term academic productivity has a very specific meaning in the con-text of this report series. It refers to the contribution a school (or group ofschools) makes to the learning of students receiving instruction in that school.Improving academic productivity means that the contribution to students’learning is increasing over time. We detail later in the report that this is themost appropriate standpoint for school accountability. To be clear, improv-ing academic productivity does not necessarily mean high test scores. If aschool enrolls a large proportion of weak students, the school may contrib-ute a great deal to their learning, but overall test scores may still be ratherlow because of the limited preparation that these students bring to the school.
Before forging ahead an important caveat is in order. The analysespresented here, and in subsequent reports, are the best we can offergiven the limitations of the available data. We emphasize at the outsetthat these data limitations are considerable. This report concludes thatthe CPS needs a better testing and reporting system in order to have amore accurate basis in the future for charting academic productivity.The Consortium’s Steering Committee offers a number of recommen-dations to frame these future developments.
A Weak Indicator: Problems with Percentage of Students atNational Norms
Different statistical indicators are needed for different purposes. An in-dicator that is useful to describe student achievement across the wholesystem may not necessarily be well suited for examining individual schoolproductivity and improvements (or declines) in that productivity. TheChicago Public Schools have used a variety of statistics over the yearsfor reporting student achievement. These include median grade equiva-lent scores, median percentile ranks, and “the percent of students scor-ing at or above national norms.” Recently, this latter statistic has been

Academic Productivity of Chicago Public Elementary Schools8
used to make important decisions about individual schools, includingwhether they are put on academic remediation or probation.
The percent of students scoring at or above national norms was firstcalculated in response to the 1988 Reform Act, which mandated a goal foreach school of academic achievement “that equals or surpasses nationalnorms.” While this statistic does indicate a very real systemwide gap fromthe national norm, it can be problematic when used to judge changes in the
Per
cent
in C
ateg
ory
0-9 10-19 20-29 30-39 40-49 50-59 60-69 >=70
Figure 1a. Initial Distribution of Student Scores
60
50
40
30
20
10
0
Percentile Ranges
At National Norms
Percent Above NationalNorms: 10%Median Percentile: 20%Mean Percentile: 26%
Percentile Ranges
60
50
40
30
20
10
0
Per
cent
in C
ateg
ory
0 - 9 10 - 19 20 - 29 30 - 39 40 - 49 50 - 59 60 - 69 >= 70
Figure 1b. Distribution of Student Scores after a Broad-Based Intervention
Percent above NationalNorms: 15%Median Percentile: 36%Mean Percentile: 42%
Figure 1b. Distribution of Student Scores after a Broad-Based Intervention
Figure 1a. Initial Distribution of Student Scores

Consortium on Chicago School Research 9
performance of an individual school. The major concern is that this statisticis responsive to changes in the performance of only a subgroup of students—those who cluster close to national norms. Significant improvements in thelearning of very low achieving students, for example, in the 10-30 percen-tile range, can go undetected. This is problematic since many Chicago schoolsenroll large numbers of such students. We note that the same issue arises forimprovements among higher achieving students, for example, in the 70-90percentile range. These changes also would go unrecognized.
We demonstrate the problem with a simple illustration. Figure 1a pre-sents a profile of test scores for a low achieving elementary school withstudents arrayed within 10-point percentile ranges called deciles. Let’s con-sider two possible school improvement scenarios. In the first case, a broad-based intervention is put in place that affects the achievement of all stu-dents, with more attention, however, focusing on the lowest achievingstudents. As a consequence, students who were originally in the lowest threedeciles moved up about 20 percentile points. All other students improvedby 10 percentile points. (See Figure 1b.)
In the second case, a much narrower intervention was attempted focus-ing only on students in the fourth and fifth deciles (i.e., the 30-49 percen-tile range). While this intervention was successful in moving many of thesestudents toward or above the threshold of national norms, the vast majorityof students in the school remain unaffected. (See Figure 1c.)
Percentile Ranges
60
50
40
30
20
10 0
Per
cent
in C
ateg
ory
0 - 9 10 - 19 20 - 29 30 - 39 40 - 49 50 - 59 60 - 69 >= 70
Figure 1c. Distribution of Student Scores after a Narrow-Based Intervention
Percent above NationalNorms: 15%Median Percentile: 20%Mean Percentile: 27%
Figure 1c. Distribution of Student Scores after a Narrow-Based Intervention

Academic Productivity of Chicago Public Elementary Schools10
In terms of the indicator of percentage of students at or above nationalnorms, these two cases are indistinguishable—both improved from 10 to15 percent! Although these two interventions are very different in terms oftheir consequences for students, the principal criterion currently used bythe CPS for accountability purposes would not distinguish this.
Other statistical indicators can do a better job in this regard. The medianpercentile for the school is a somewhat better statistic because it clearlypoints out the large improvement in the first case (Figure 1b) from the 20thto the 36th percentile. This statistic, however, does not detect the smallimprovement that did occur in the second case. An even better statisticfor this purpose is the school mean achievement (i.e., the simple aver-age of all students’ test scores).1 It correctly detects both the large im-provement in the first case and the small improvement in the secondcase. This occurs because the school mean achievement indicator issensitive to the performance of all students. Any changes, even smallones, will be reflected here. We build on this idea in a subsequent sec-tion when we introduce a value-added indicator of school productivity.This indicator, which assesses the contributions that a school makes tostudents’ learning, is based on the mean learning gains for all childrenreceiving instruction in a school in a given year. Here, too, the perfor-mance of each individual student affects the final results.2
Need for a Stable Measurement Ruler over Time:Problems Associated with
Nationally-Normed Standardized TestsThe ITBS is the main achievement data gathered annually by the Chi-cago Public Schools and is the sole information source currently usedby the system for school accountability purposes. These tests are inex-pensive and relatively easy to administer and score. They are quite use-ful for the purposes for which they were originally intended—to tell usabout how well our students perform against a national sample of stu-dents who took the same test. They were not, however, specifically de-signed for the purposes we now use them for—to assess improvementsin schools’ productivity over time.
By way of background, the ITBS is not a single test, but rather atesting system. It consists of multiple forms that were developed at dif-ferent points in time. These forms are literally different tests with nooverlapping items. Each form consists of multiple levels, each designedto be administered to students at a particular grade. For example, level 9is designed for grade 3, level 10 for grade 4, and so on. Although it is
Consortium on Chicago School Research 11
now an infrequent practice in the CPS, students sometimes have beentested “off level,” such as giving level 8 to a very disadvantaged thirdgrader or level 10 to a gifted student at the same grade.
The Non-Equivalence of Grade EquivalenceThe ITBS, like most nationally norm-referenced standardized tests, pro-duces a score report called a grade equivalent (GE). GEs have a great deal ofappeal to teachers and parents because they appear to describe a child’sperformance in developmental terms of grade level and months within grades.Since the CPS administers the ITBS in the eighth month of the school year,a fourth grader’s score of 4.8 is “on grade,” “at grade level,” or “at the na-tional norm.” Similarly, a fifth grader who tested at grade level is assigned aGE of 5.8, a sixth grader who is on grade scores a 6.8, and so on.
Since all of the test forms and levels produce GEs, the lay user mighteasily think that these results are equivalent and directly comparable. Infact, this is not true. To demonstrate the problems here, we gave a sample ofCPS students two different reading and math tests from the ITBS series. Inone case, we administered adjacent levels (8 and 9) from CPS91 (Form G),which was administered systemwide in 1991. In a second case, we adminis-tered the same level of the test (level 9) but from two different forms, CPS90(Form J) and CPS91 (Form G), which were used in 1990 and 1991. Fi-nally, in the third case we changed both the level and form. A sample ofstudents took both test level 8 of CPS90 and level 9 of CPS91.3 The lattercase is interesting because it directly represents what CPS students actuallyexperience. That is, as students progress across the grades, they normallychange test levels each year. In addition, since 1990, the CPS has beenchanging the form of the test administered each year. Thus, as we considerthe year-to-year progress of students over time, we are actually comparingdata from two different forms and levels.
A basic criterion for comparing data from any testing system is that stu-dents’ score reports should not depend upon the particular form or level ofthe test taken so long as it is appropriate for their general ability. Thus, if wegive a child two different tests, we expect similar estimates of that child’scompetence. While some children might do a bit better on the first test,and others might do somewhat better on the second, on average the twotests should tell us the same thing.4 Figures 2a, 2b and 2c demonstrate,however, that this is not always the case with grade equivalent scores fromthe ITBS reading assessments. For example, students who were given CPS91(see Figure 2a) were more than twice as likely to have better GE scores onthe higher level test (level 9) than on the lower level test (level 8). Similarly,

Academic Productivity of Chicago Public Elementary Schools12
consider the students who took the same level of the test from two differentyears (Figure 2b). These students were much more likely to do better onCPS90 than on CPS91. These differential score effects are equally dramaticwhen we consider the comparison across forms and levels (Figure 2c). Stu-dents were seven times more likely to score higher on CPS91, level 9 thanon CPS90, level 8.
These empirical examples illustrate a general problem that grade equiva-lents are both form and level specific and can not be strictly compared.Clearly, this limits our ability to make accurate statements about how muchactual learning an individual student is making over time. It also introducesa great deal of uncertainty into any assessment of whether scores may begoing up or down over time for an individual school or across the wholesystem. While real changes in student performance are embedded here, soare the differences in the test scoring.
Figure 3 presents a clear example of the problems that this can producewhen we try to interpret grade equivalent scores to assess progress over time.We illustrate the GE gains made by seventh grade students in “Millard
0 25 50 80
3%18%
70%
BetterLikely better
About the sameLikely worse
Worse
BetterLikely better
About the sameLikely worse
Worse
BetterLikely better
About the sameLikely worse
Worse
Test Pairs Effect
7%2%
0%1%
38%36%
26%
6%36%
52%6%
0%
a. 1991 test, level 9 vs. 1991 test, level 8
b. 1991 test, level 9 vs. 1990 test, level 9
c. 1991 test, level 9 vs. 1990 test, level 8
Figure 2. GE Test Score Bias Due to Form and Level Differences
Note 1: About the same category is +/- 1 standard deviation from zero.Note 2: See endnote 8.
Percent
Figure 2. GE Test Score Bias Due to Form and Level Differences

Consortium on Chicago School Research 13
Fillmore Elementary School” in 1992, 1993, and 1994.5 The seventh grad-ers in 1992 gained approximately 1.0 grade equivalents over their end ofgrade six performances (see Figure 3a). The following year, seventh gradersgained 1.7 GEs—an improvement of 70 percent. In 1994, however, stu-dent gains fell back to 0.7 GEs—worse than where they started two yearsearlier! Why did this school suddenly lose the productivity improvementfrom the year before? What went wrong?
In fact, it is quite likely that nothing went wrong in 1994, and probablynothing went right in 1993 either. This pattern of results is not distinctiveto Fillmore; it occurred generally across the entire school system. Figure 3cpresents a set of box plots that displays the seventh grade gains in thesesame three years for all Chicago elementary schools. Notice that in mostschools, seventh grade gains went up in 1993 and then fell back down in1994. The median CPS elementary school went from 1.0 GE gain in 1992to a 1.5 GE gain in 1993 and then back down to 0.9 GE gain in 1994.While Fillmore students gained a bit more in 1993 and lost a bit more in1994, their results closely follow the overall system trend.
Note: Figure 3c uses a box plot to display the distribution of school gains. The area inside the box represents gains for half of the schools; the top whisker represents 25 percent of the schools with the greatest gains, and the bottom whisker 25 percent of the schools with the lowest gains.
Figure 3. Trends in Reading Gains: A School Effect or Measurement Artifact?
Distribution of school gainsGE Gain for Fillmore Elementary
GEgain
1.5
1.0
0.5
a. b. c.
92 93 94 92 93 94 92 93 94
Figure 3. Trends in Reading Gains: A School Effect or Measurement Artifact?

Academic Productivity of Chicago Public Elementary Schools14
Unfortunately, many educators and most of the public are unaware ofthese inherent limitations in the grade equivalent metric. These score re-ports are simply not designed for purposes of making inferences about changeover time. Clearly, a better reporting metric is needed if we wish to assessaccurately whether school productivity is improving.
A Non-Standard StandardA second problem with the use of the ITBS for productivity analysis emergeswhen we consider the actual content of the tests. The skills assessed by theITBS have changed over this 10-year time period. Thus, when we look at10-year trends in score reports, we are, in essence, judging students, schools,and the system against a moving target. Unfortunately, this changing targetis largely hidden in a secure test and unknown to most educators. As a
25
20
30
15
10
5
0
Per
cent
Mon
ey &
Tim
eAd
ditio
nSub
tract
ion
Ope
ratio
nsN
umbe
rsW
ord
Prob
lem
sD
ata-
Rel
ated
Geo
met
ryEq
uatio
nsM
ultip
licat
ion
Figure 4a. ITBS Mathematics Content Changes: What the ITBS Tests in Grade 3
1990-1992 Test Forms 1993-1996 Test Forms
Div
isio
n
Frac
tions
Figure 4a. ITBS Mathematics Content Changes: What the ITBS Tests in Grade 3

Consortium on Chicago School Research 15
result, a teacher may see, for example, that students in her classroom clearlyknow more mathematics than previous classes of students, but their stan-dardized test scores may still come back lower.
To document this problem of changing standards, we did a content analy-sis of the ITBS forms used by the CPS from 1990 through 1996. We groupedthe ITBS math test items into 12 major categories ranging at the easy endfrom “money and time” and “addition” problems to the more complex tasksof “equations,” “multiplication,” “division,” and “fractions.”6 Figures 4a,4b, and 4c compare the relative frequency of these 12 different item typesin the tests used from 1990 and 1992 with those used from 1993 through1996 for grades 3, 6, and 8 respectively.
Clearly, a major content shift occurred beginning in 1993. A new topicon “data related concepts” appeared. There was also a major increase in
Figure 4b. ITBS Mathematics Content Changes: What the ITBS Tests in Grade 6
Per
cent
30
25
20
15
10
5
0
Mon
ey &
Tim
eAdd
ition
Subtra
ctio
nO
pera
tions
Numbe
rsW
ord
Prob
lem
sDat
a-Rel
ated
Geo
met
ryEqu
ation
sM
ultip
licat
ion
Divisio
n
Frac
tions
1990-1992 Test Forms 1993-1996 Test Forms
Figure 4b. ITBS Mathematics Content Changes: What the ITBS Tests in Grade 6

Academic Productivity of Chicago Public Elementary Schools16
“equation” problems across all grades. This, in turn, was compensated by adecline in the proportion of basic computation items involving “addition,”“subtraction,” “multiplication,” “division,” and “number problems.”
These patterns reflect gradually changing professional judgments aboutthe appropriate content for elementary school mathematics curriculum.Beginning with the National Council of Teachers of Mathematics(NCTM) standards in 1989, there has been an emphasis on introduc-ing more challenging mathematics into elementary schools. Test pub-lishers such as Riverside, producer of the ITBS, pay close attention tothese developments. In general, the content of national norm-referencedtests is deliberately designed to sample broadly from the different kinds of
Per
cent
30
25
20
15
10
5
0
Figure 4c. ITBS Mathematics Content Changes: What the ITBS Tests in Grade 8
Mon
ey &
Tim
e
Additio
nSub
tracti
onO
pera
tions
Num
bers
Wor
d Pr
oble
ms
Data-
Relat
ed
Geo
met
ryEq
uatio
nsM
ultip
licat
ion
Div
isio
nFr
actio
ns
1990-1992 Test Forms 1993-1996 Test Forms
Figure 4c. ITBS Mathematics Content Changes: What the ITBS Tests in Grade 8

Consortium on Chicago School Research 17
curricula that schools may be implementing in order to provide a basis forglobal comparisons of how students in a particular school or district com-pare with a national sample of children who took the same test. The testsare purposefully not aligned with any one curricular strategy so as to beuseable across a wide range of schools. As a result, they are a very bluntinstrument for assessing increasing productivity in a particular curriculumbecause only a modest portion of the test may be assessing what schools areactually trying to teach students in any given grade. For example, while thetests used in 1993 through 1996 reflect some movement toward the NCTMstandards, few math educators would consider these authentic tests of themore challenging mathematics envisioned in the NCTM.
We again return to our general point. The ITBS system was simplynot designed for the purposes to which it is now directed. The testingsystem was intended to compare the competence level of an individualor group of students relative to a national sample who took the sameparticular test of basic knowledge and skills. For this comparison to berelevant, the tests try to represent at least some of what children mightbe asked to learn in a wide range of districts. Moreover, it is quite natu-ral to change the content of norm-referenced tests over time as ideasabout instruction shift. This helps to keep comparisons across districtsas relevant as possible. This latter principle, however, proves problem-atic when we switch purposes toward assessing changes in school pro-ductivity in a single district. An absolute prerequisite for valid studies ofchange is a constant measurement ruler.
The Alternative: A Content-Referenced Measurement System
The problems laid out above offer a formidable challenge to any simpleassessment of changing productivity in the CPS. We found it necessary tocreate a new test score metric that allows us to take into account the differ-ent content used in various ITBS forms in order better to compare resultsacross time. For this purpose, we undertook a major equating study of allforms and levels of the ITBS used in Chicago from 1987 through 1996 atgrades 1 through 8. (See details of the equating study in the sidebar on page17.) This test equating produced a content-referenced scale that offers acommon metric against which persons and schools can be assessed. Thescale is constructed around the relative difficulty of the test items for CPSstudents. Each student is then measured against this content-referenced scale.Any student’s scale scores can be directly interpreted in terms of the kindsof items that the student is likely to answer correctly and those that he or
Academic Productivity of Chicago Public Elementary Schools18
she is unlikely to know. In this process, we are adjusting for the variations intest content across forms and levels. A particular test is now simply a set ofitems, each of which has its own unique difficulty. By knowing the diffi-culty of the items a child got right and wrong, we can calculate a content-referenced scale score.
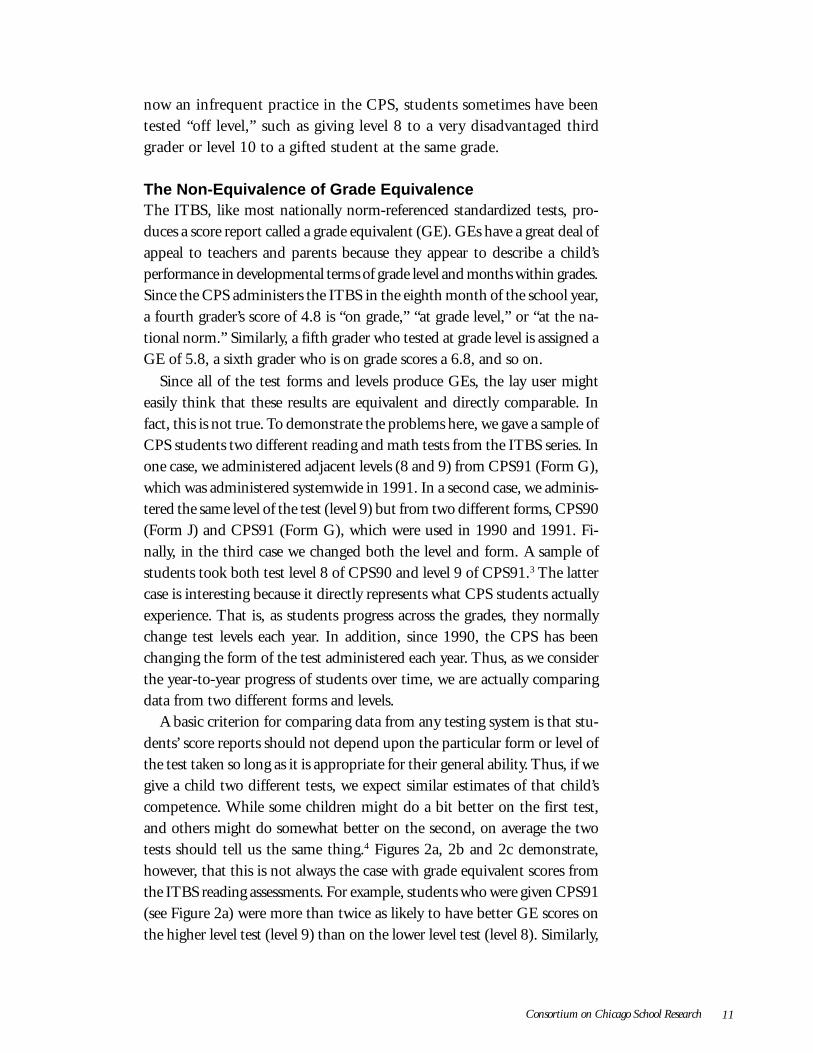
The major advantage of the content-referenced metric is that the scalescores of students of similar competence or ability should no longer dependon the specific form and level of the ITBS they receive.7 In Figure 5 wepresent the same data as previously analyzed in Figure 2. Figures 5a, 5b, and5c show that, regardless of the specific level or form administered, a studentis no more likely to do better or to do worse. The key difference as com-pared to the GE metric is that, while some students still do better on thefirst test and some do worse, on average, there is no bias. That is, a studenthas an equal chance of doing better or worse on the second administration.This is reflected in Figure 5 by the fact that the percentage of students
0 25 50 80
3%11%
71%
BetterLikely better
About the sameLikely worse
Worse
BetterLikely better
About the sameLikely worse
Worse
BetterLikely better
About the sameLikely worse
Worse
Test Pairs Effect
11%4%
0%15%
64%17%
4%
2%13%
67%14%
4%
a. 1991 test, level 9 vs. 1991 test, level 8
b. 1991 test, level 9 vs. 1990 test, level 9
c. 1991 test, level 9 vs. 1990 test, level 8
Figure 5. Rasch Test Score Bias Due to Form and Level Differences
Note 1: About the same category is +/- 1 standard deviation from zero.Note: See endnote 8.
Percent
Figure 5. Rasch Test Score Bias Due to Form and Level Differences

Consortium on Chicago School Research 19
doing better and the percentage doing worse are approximately the same inall three panels.
On balance, the results presented here illustrate the kinds of improve-ments that can occur when test scales are content-difficulty referenced. Ourequating design involved 24 different situations or links, where studentstook two different forms and/or levels of the ITBS. The GE metric showedbias in half of the cases! The equating removed the bias in eight cases, ef-fected improvement in three situations, and exacerbated it in one case. Whilethis is an improvement, it is less than ideal.8 To establish better test compa-rability, the mechanism for test equating needs to be built directly into thedesign of the testing program rather than treated as a special study as wehave done in this research.
The ITBS as Content-Referenced ScalesThe reading and mathematics measurement rulers—Figures 6 and 7 (in-cluded separately)—present the content-referenced scales for the readingand math series that we developed from the equating study. In both cases,the scale has been established so that test scores run from 0 to 100. Thesecontent-referenced scales form a developmental metric. Higher scores indi-cate more advanced student competency. The scales have been anchoredsuch that a score of 20 is comparable to being at national norms at the endof first grade, and a score of 80 is consistent with being at national norms ateighth grade, based on the average of 1987 to 1996 ITBS scores.9 The Chi-cago grade-level averages for 1996 are represented in the blue bars at the topand bottom of each scale. For example, the fourth grade average readingscale score was 48 in 1996; for sixth grade it rose to 60.5. The comparableresults for math at grades four and six were 48 and 65 respectively.
The scale score for any student (or the average score for an individualschool) is directly related to the specific content that constitutes the testseries. For example, students with scale scores of 50 on the reading testhave a 75 percent probability of answering correctly the items clusteredaround that scale value (e.g., items C4, D1, and E2,). They are evenmore likely to get the simpler items (e.g., C1 and D3) correct. They areless likely, however, to answer correctly the harder items, for examplethose associated with passage F.
In short, the scale score provides specific information about what stu-dents know and can do. This is what we mean by a content-referenced, ascontrasted to a solely norm-referenced, testing system.
The reading scale. The reading scale is defined by the difficulty of thereading passages and the individual items associated with each passage. We

Academic Productivity of Chicago Public Elementary Schools20
present here a sample of tasks from Form 7, which was used by the CPS upto 1989, to illustrate the content difficulty that forms the overall scale. Ingeneral, the reading tasks become more difficult as we move from left toright across the scale.10 Each sample passage has been selected so as to illus-trate what a student who is approximately on that grade level should be ableto read well. For example, passage E about fireflies represents the kind oftext that an on-level student in grade three should be able to comprehendand answer questions about.11 The difficulties of selected individual itemsfor each passage are referenced against the scale at the bottom of the page.Notice that the items vary considerably in their difficulty even within asingle passage. For example, item E1 associated with the fireflies passage isrelatively simple to answer and has a scale difficulty of 39; in contrast, itemE3 is almost 20 scale points harder.
In general, the easiest passages (i.e., with lower scale score difficulties)involve short simple narratives. The items associated with them tend to asksimple factual questions and make little or no evaluative demands on thestudent. The questions associated with fireflies offer good examples of this.In contrast, passages on the right draw on more specialized subject matterand offer a more detailed exposition of facts. These passages also tend to usemore complex sentences with less common vocabulary. For example, pas-sage H is about the Floating Market in Thailand—a topic with which mostChicago students would not have had any firsthand experience. These up-per level passages sometimes tap other literary genres, such as passage I,which is a poem. Items associated with such passages typically elicit thereader’s overall impression (or inference) of what a passage is about in itsmood, tone, and meaning.
The mathematics scale. The easiest items in mathematics probe students’ability to count, perform simple addition, and tell time. These typicallyhave item difficulties of 20 or less. Next come subtraction and multiplica-tion tasks which become more common around scale values in the 20s and30s. As we move farther up the scale, the computation tasks become morecomplex and involve other operations such as division and fractions. Wordproblems and tasks involving equations become more frequent as well. Sometopics, such as geometry problems, span almost the entire scale, but thequestions become more complex. For example, a simple geometry problemof identifying shapes has a scale difficulty of 16; in contrast, a geometryproblem involving lines and angles has a difficulty of 82.
The interpretation of students’ scale scores follows the same basiclogic as the reading scale. For example, the average Chicago first graderin spring 1996 had a scale score of 22. Such students are likely to able to

Consortium on Chicago School Research 21
do simple two-digit addition with no regrouping and even more likelyto answer correctly simple addition and time problems. Questions thatask simple multiplication facts (e.g., 3x3=? which has a scale difficultyof 31) would likely be too difficult. Similarly, the typical eighth graderin the CPS in 1996 (scale score of 76) would likely show mastery overmost computation tasks (except for the most complex division and frac-tion problems). But he or she would encounter difficulty with morecomplex word problems (e.g., the distance, rate, and time problem il-lustrated with a scale difficulty of 81), or with problems requiring asolution to a linear equation system in two unknowns (scale score of88), or finding the roots of a quadratic equation (scale difficulty of 91).
A Good Indicator of School Productivity:A Value-Added Approach
We showed earlier that a school mean provides a better statistical summaryof the overall attainment of students in a school or district because the
Equating the ITBS
We conducted a series of four separate studies to equate the six different forms of the ITBSused from 1987 through 1996.12 These studies involved both vertical equating (that is, linkingdifferent levels within the same test form, such as grades three and four tests given in 1990) aswell as horizontal equating (that is, linking similar levels in different tests, such as third-grade testsgiven in 1991 and 1992). In order to accomplish horizontal equating, four studies were undertakenwhere students completed two different tests. This created the necessary links to make scores com-parable across forms.
Within each form, test levels 9 – 14 are linked by common items that appear on more than onetest level. This provided the basis for the vertical equating among test levels. For levels 7, 8, and 9,which share no common items within a form, the vertical links were established by groups of stu-dents who took two of these different test levels at the same time. These groups ranged in size from150 to 450 students. Additional data from students who took single test levels (about 1000 peopleper test level) were included to improve the precision of the item difficulty estimates. For thosestudents who took two tests, the order of test administration was varied. This counterbalancingdesign was employed to prevent systematic effects of fatigue, boredom, and differential effort andmotivation.
The actual statistical equating relied on a method of test item calibration called Rasch analysis.The Rasch model is a member of a class of scaling models based on item response theory (IRT)currently used by most modern testing programs such as the NAEP, the SAT, and the TOEFL. Itemdifficulties for all forms and levels are placed on the same scale. This is intended to assure that allmeasures are directly comparable.
To be sure, issues of comparability can still arise as small changes in the design of a testingprogram can have a significant impact on observed student performance. The intent in the techni-cal design of the assessments, however, is to assure greater comparability than is now the case.

Academic Productivity of Chicago Public Elementary Schools22
performance of every student affects the indicator value. This statistic ismost useful for informing us about the overall level of students’ capabilities.Moreover, if we track this indicator over time, it will tell us about possiblechanges in overall student attainment.
The average achievement level, however, is not an especially good indica-tor of school productivity and whether this is changing over time. Onemajor problem that this indicator fails to take into account is student mo-bility. For example, if a group of students enrolls in a school sometimeduring the academic year, even on the day just before testing, their scoreswill be counted as part of the overall achievement level for the school. Clearly,the attainment for these students depends primarily on their previous school-ing experiences and home background and tells us virtually nothing aboutthe effectiveness of the particular school.
This concern is especially problematic in urban school districts such asChicago because student mobility tends to be high. In the typical Chicagoelementary school only 80 percent of the students tested in a given yearwere also tested in the same school the previous year. This means that 20percent of the students are new each year.13 (See Figure 8.) Over a third ofthe students are new to schools over a two-year period.
Additional problems arise as we examine trends over time. Consider, forexample, a school in a “port of immigration” neighborhood. Many of thestudents enrolled in the neighborhood school will not be native Englishspeakers and, as a result, their measured initial standardized test scores willtypically be low. (Further complicating the problem, the CPS currently hasno tests designed to measure how well non-native speakers are learningEnglish.) As these students progress through a few years of schooling, their
1
2
3
4
Year
s
0 20 40 60 80 100
20%
34%
45%
53%
Stable Mobile
80%
66%
55%
47%
Figure 8. Average Percentage of Students Remaining in the Same School after One through Four YearsFigure 8. Average Percentage of Students Remaining in the
Same School after One through Four Years

Consortium on Chicago School Research 23
academic attainment is likely to improve, but they may also leave the schoolas their family develops opportunities to move into better housing. Newimmigrants in the community replace these students, and the cycle beginsanew. Clearly, the average attainment level for such a school is not likely toget very high because teachers are constantly working with new students.While school staff may do a terrific job contributing to the learning ofstudents who are enrolled, few students stay long enough to significantlyaffect the bottom line of average student attainment.
More generally, if the student composition of a school is changing overtime, the average achievement levels might well rise or fall, but this wouldtell us little about any possible changes in school effectiveness. Clearly, weneed to take such factors into account in developing an appropriate indica-tor for purposes of assessing school productivity and whether this is chang-ing over time.14 In order to do this, we begin with a basic accountabilityprinciple: A school should be held responsible for the learning that occursamong students actually taught in that school. This suggests that ratherthan focusing exclusively on the average achievement levels at each gradelevel, we also consider the gains in achievement made by students at eachgrade in the school for each year.15
In addition, as we examine trends in achievement gains over time, weneed to take into account other factors that might also be changing duringthis period that could affect the observed learning trends. For example, overthe 10-year period of this study, the CPS changed its procedures concern-ing eligibility requirements for the testing of bilingual students. Similarly,grade retention policy changed. Both of these policy changes could verywell affect the gains recorded at some grade levels and schools. As a generalrule, we want to adjust for the effects of such extraneous factors so that anychanges over time in a school’s value-added to learning will signal real im-provements (or declines) in school productivity.
The Grade Productivity ProfileWith these ideas as background, we now proceed to define a productivityprofile for each school. The school profile is composed of a set of gradeprofiles, one for each grade in the school for which entry and exit data areavailable. Figure 9 develops the idea of a grade productivity profile usingtest data from grade six at Fillmore School.
The productivity profile is built up out of two basic pieces of informa-tion for each school grade: the input status for the grade and the learninggain recorded for that grade. The input status captures the background knowl-edge and skills that students bring to their next grade of instruction. Toestimate this input status, we began by identifying the group of students

Academic Productivity of Chicago Public Elementary Schools24
who received a full academic year of instruction in each grade in each school,and then retrieved their ITBS test scores from the previous spring. As notedabove, students who move into and out of a school during the academicyear do not count in the productivity profile for that year.16 For our illustra-tive case of grade six at Fillmore School, we retrieved the end of grade fivetest scores for students who spent grade six at the school. The average ofthese students’ previous year’s test scores is the input status for that schoolgrade. This input status is what teachers had to build on to advance thelearning of the stable sixth grade students at Fillmore School that year.
As for the learning gain for each school grade, this is simply howmuch the end of year ITBS results have improved over the input statusfor this same group of students. In terms of our case example of grade
Figure 9. Constructing the Grade Productivity Profile
9a. Identify 6th grade scores. Match 5th grade scores from previous year. Include only students in same school.
output
learninggain
input
92
9b. Repeat for all years beginning in 1987.
9c. Add input and output trends to the profile.
88-89 89-90 90-91 91-92 92-93 93-94 94-95
9e. To make trends clearer, remove basic data.
9d. Compute smoothed trends using "best fitting" summary line.
9f. Final Productivity Profile
87 88 89 90 91 93 94 95
87-88 95-96
88 8990 91 92 93 94
9596
Figure 9. Constructing the Grade Productivity Profile

Consortium on Chicago School Research 25
six instruction at Fillmore School, the learning gains for the stable gradesix students is how much their test scores have improved over the gradefive scores from the previous year. Finally, by adding the learning gain tothe input status we recover the third piece of information – the outputstatus. This tells us about the knowledge and skill levels of these stu-dents at the end of a year of instruction. This would be at the end ofgrade six in our Fillmore School example.
The grade productivity profile is organized around data from some baseyear. In our analyses of productivity for CPS schools we have selected 1991as the base year.17 Panel 9a displays the base year input status, learning gain,and output status for grade six at Fillmore School. We then add to this inpanel 9b the grade six data for years prior to and post 1991. We have repre-sented now all of the basic data for examining academic productivity ingrade six at Fillmore School.
Our interest in changing school productivity directs attention to the varia-tion over time reflected in these data. A visual scan of panel 9b suggests thatthe inputs to grade six at Fillmore School may be declining over time. Coun-tering this, the learning gains appear to be increasing and with this, theoutputs also appear to be increasing. To make this clearer, Panel 9c adds aninput trend, and output trend to the profile. Notice that each of these trendlines varies considerably from year to year. This variability in the data tendsto obscure any overall pattern. To highlight this better we compute smoothedtrends that involve estimating the best summary line that fits these data.These are presented in Panel 9d. To make the trends even clearer, Panel 9epresents the trend lines with the basic data removed.
Indeed, the inputs to grade six have declined, but the learning gains in-creased. The latter is reflected by the fact that the input and output trendlines spread apart over time. Moreover, since the learning gains increasedfaster than the input decline, a positive output trend is the net effect. Key tomaking such judgments is the estimation of smoothed trend lines throughthe use of a statistical model. (See the Appendix for a description of themodel and discussion of estimation issues.) The analysis generates our mostconcise visual summary of a grade productivity profile. Panel 9f illustratesthe final representation of this.
The fitting of a statistical model to smooth the trend lines also servesanother important function. It allows us to adjust the trend estimates forother factors that might be changing over time besides school effectiveness.In seeking to develop the best possible estimates of school productivity forthe CPS, we considered a range of factors including changes in a school’sethnic composition, percentage of low income students, retention rates,

Academic Productivity of Chicago Public Elementary Schools26
percentage of students enrolled who are old for their grade, and the propor-tion of bilingual students. Generally, the effects associated with these fac-tors were not large. In addition, most CPS schools did not vary much onmost of these factors over the 10-year period from 1987 to 1996. As aresult, the adjusted trends were quite similar to the unadjusted estimates. 18
Finally, we use our estimate of a school’s learning gain trend to quantifyschool improvement in the form of a learning gain index (LGI). This quan-tity assesses the relative change in student learning over the last five years ascompared to the amount of learning that occurred across the system in thebase year, 1991.19
Classifying Productivity ProfilesEach grade profile involves three different trends: input, learning gain, andoutput trends. If we know any two of these, the third can be inferred di-rectly. Observing only one of the three, such as when we monitor an outputtrend or a gain trend separately, can be misleading.
Much of the recent literature on school accountability emphasizes use ofthe learning gain trends for purposes of judging productivity.20 As we beganthis study, we intended to focus exclusively on the learning gain trend orvalue-added to student learning for judging school productivity.21 Gradu-ally, however, we came to conclude that while the statistical arguments forusing the learning gain or value-added trend were sound, these argumentswere too narrow on both educational and policy grounds. We elaborate ourconcerns through two examples.
First, consider the grade profile in Figure 10a. Notice that the outputtrend is up substantially. However, the input trend for the grade is alsoincreasing at the same rate, and the estimated learning gain trend is flat.(Formally, the estimated LGI is 0 percent.) Visually the input and outputtrends are parallel lines, implying no change over time in the value added tostudent learning. While most educators would consider the output trend tobe indicative of a reform success, focusing only on the learning gain trendwould lead us to conclude that no significant change in instruction hadoccurred in this school grade.
Let’s think about what might actually be occurring educationally in“School A.” The students entering each year are more advanced than theprevious year’s students (i.e., the input trend is positive). The teachers mustrecognize this and each year modify their plans of instruction. Since at leastsome of the instruction will be new each year, teachers must also engage incontinuous formative evaluation—trying to figure out what is working andwhat is not and adjusting accordingly. In the absence of such teacher activ-ity, we might expect a profile more like Figure 10b. Here, the improving

Consortium on Chicago School Research 27
inputs go unrecognized, teachers continue to teach as they have in the past,and succeeding student cohorts make less progress because, increasingly,instruction is simply a repeat of past lessons. (The learning gain trend isactually negative here. The LGI is -18 percent.) In essence, one could arguethat Figure 10b, and not Figure 10a, is the “no change” case in that Figure10b represents the trends that we might expect to occur if teachers are notproactive change agents.
Now let’s consider another case represented in Figure 10c. Both the in-put and output trends are declining, but the input trend is declining at afaster rate. This pattern results in a positive learning trend (LGI=78 per-cent) that is reflected in the distance between the two trend lines increasingover time. While from a strict value-added perspective, this is a case of
Grade 3 - School A Grade 4 - School B
Grade 3 - School C Grade 3 - School D
Output = UpLGI = 0%Input = Up
Output = FlatLGI = -18%Input = Up
Output = DownLGI = 78%Input = Down
Output = UpLGI = 113%Input = Flat
Figure 10. Grade Productivity Profiles
Note: LGI = Learning Gain Index, computed for 1992-1996.
a.
c.
b.
d.
Figure 10. Grade Productivity Profiles

Academic Productivity of Chicago Public Elementary Schools28
reform success (improving learning gains over time), it would still be prob-lematic to hold up this case as an exemplar of improved performance. At aminimum, we would want to distinguish it from a school grade with aproductivity profile more like Figure 10d. Here, both the output trend andlearning gain trends are improving over time. This clearly is a success story!
Examples such as these have led us to conclude that we should employ adual indicator comparison scheme. Specifically we need to look simulta-neously at both the learning gain trends and output trends to classify im-provement efforts. Taken together, these two trends provide a detailed sum-mary of changing school productivity over time.
From visually inspecting a large number of grade productivity profiles,we were able to identify nine distinct patterns among output and learninggain trends. These are presented in Figure 11. Each cell in this table isbased on whether the output and learning gain trends are up, flat, or downrespectively. Some patterns, such as 1, 5, and 9, are straightforward tointerpret. These represent “Up,” “No Change,” and “Down” in academicproductivity. We describe patterns 2 and 4 as “Tending Up” since there issome evidence of improvement in either output or learning gain trends.Similarly, we describe patterns 6 and 8 as “Tending Down” because there issome evidence of real decline. Patterns 3 and 7 are the hardest to interpretsince the learning gains and output trends are going in opposite directions—one is improving while the other is declining. Without knowing more aboutthe particulars of a school case like this, we call these “Mixed” profiles. Theresult is a 7-category scheme for describing grade productivity trends.22
Summarizing School ProductivityWhile we compute productivity profiles for each grade, we do not recom-mend that an accountability system use only single grade information. Ourstatistical analyses have identified negative relationships among profiles inadjacent grades. That is, improving productivity at one grade tends to befollowed by some declines at the next, and the reverse is also true.23 As aresult, judging a school by looking at only selected grades can be mislead-ing. We would be better off, from a statistical perspective, to average acrossadjacent grades to develop a more stable estimate of school productivity.
Educational concerns also push us in this same direction. The design of agood accountability system should promote cooperative improvement ef-forts among a faculty in articulating curriculum across grade levels, evaluat-ing improvement efforts, and tracking the progress of students throughschooling. This too suggests aggregating adjacent grade level profiles to-gether to focus accountability analyses on the performance of meaningful

Consortium on Chicago School Research 29
Out
put T
rend
s
Figure 11. A Typology of Productivity Profiles
UP
UPFLATDOWN
Mixed–Increasing
Output
Tending
Down
Down
Tending
Up
No
Change
Tending
Down
Up
Tending
Up
Mixed–Increasing
Gain
1
2
3
4
5
6
7
8
9
Learning Gain Trends
FLAT
DOWN
sub-units within a school. In this way, the accountability system createsincentives for more cooperative teacher work, which has long been a majororganizational concern for schools.24
In sum, for both educational and statistical reasons, we have groupedgrade level profiles to summarize a school’s overall productivity. Assumingthe basic Chicago elementary school structure of kindergarten to grade eight,we report the following:
• a summary profile for grades three and four;• a summary profile for grades five and six; and• a summary profile for grades seven and eight.25
Since we lack comprehensive systemwide data prior to grade two, wehave no basis for judging improvements in productivity for pre-kindergar-ten, kindergarten, and grades one and two. Nonetheless, it is important tochart whether the output of this grade grouping is changing over time sincethis represents the basic inputs to the next sub-unit. For this reason, we add
Figure 11. A Typology of Productivity Profiles

Academic Productivity of Chicago Public Elementary Schools30
the output trend from grade two to our school summary profile. In general,any changes observed in the grade two outputs can be attributed to eitherchange in the kinds of students enrolled or changes in a school’s effective-ness. Without more detailed student background data than is available cur-rently through CPS central records, we were unable to sort between thesetwo competing explanations. Individual schools, however, have access toconsiderable additional information which may allow them to interpret bettertheir second grade output trends.
For our illustrative case of Fillmore School, the productivity summaryfor reading achievement was “Mixed, Increasing Output” for grades threeand four; “Up” for grades five and six; and “No Change” for grades sevenand eight. (See Figure 12.) The output trend for grade two (not shown) wasalso “Up.” The vertical axis on this and subsequent figures represents the 0-100 content-referenced scale.
Two examples of school productivity trends. We have argued that theschool productivity profile is a better way to examine school effectiveness
Figure 12. Reading Productivity for Fillmore Elementary School
Sca
le
100
90
80
70
60
50
40
30
Mixed–Increasing Output Up No Change
3 4 5 6 7 8
Grade
-14%
-33%12%
60%
12%
-1%
Note: Percentages associated with each grade productivity profile are thepercentage improvement in learning gains (LGI) over the base year period (1991).
Figure 12. Reading Productivity for Fillmore Elementary School
Consortium on Chicago School Research 31
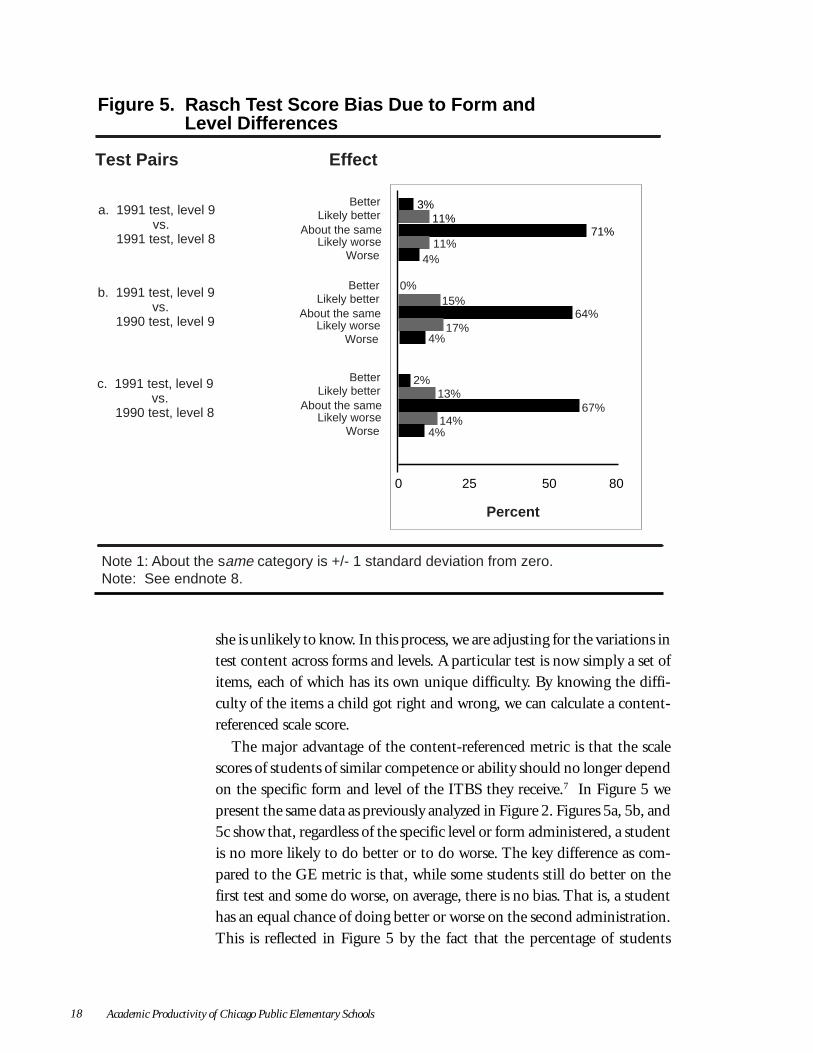
Figure 13a. Reading Test Score Results at Garfield School
Score
100
90
80
70
60
50
40
30
Reading Output TrendsOutput: 1988-1996
3 4 5 6 7 8Grade
Score
100
90
80
70
60
50
40
30
Reading Productivity TrendsInput: 1987-1995 Output: 1988-1996
3 4 5 6 7 8
Grade
Figure 13a. Reading Test Score Results at Garfield School

Academic Productivity of Chicago Public Elementary Schools32
Score
Reading Output TrendsOutput: 1988-1996
100
90
80
70
60
50
40
303 4 5 6 7 8
Grade
Figure 13b. Reading Test Scores at Polk School
Score
Reading Productivity TrendsInput: 1987-1995 Output: 1988-1996
100
90
80
70
60
50
40
30
3 4 5 6 7 8Grade
Figure 13b. Reading Test Score Results at Polk School

Consortium on Chicago School Research 33
than simple trends in percentage of students at national norms. We illus-trate this with an analysis of reading data from two schools shown in Figure13. In Figure 13a (top), we see the reading output trends for grades threethrough eight for the years 1988 to 1996 in Garfield School. The outputtrends are clearly down in grades three through five and, at best, they areflat in sixth, seventh, and eighth grades. This surely looks like a deteriorat-ing school! A look at this school using the productivity profile, however,tells us more about what is happening here. We see in Figure 13a (bottom)a sharply declining input trend in grade three. The gains in grade three areactually improving over time. A similar pattern appears in grade six, where,again, the gain trends are improving over time. We don’t know why thesedeclining input trends are occurring. The school populations might be chang-ing because of community demographic changes; the opening of a newschool nearby may be siphoning off some of the stronger students; theremay be serious instructional problems in the primary and preprimary pro-grams. Whatever the reasons, it does appear that the middle and upperelementary grade teachers are making a serious effort to respond to theincreasing educational needs of students appearing at their classroom door.The productivity profile helps in this case to understand better the outputtrends and suggests at least some possible clues about what might be hap-pening here.
Polk School provides a different story. The output trends in Figure 13b(top) show increases at every grade level—a big success across the board!But again, the productivity profile (Figure 13b, bottom) provides a morenuanced view. The input status to grade three has gone up markedly inthese years. Though the output is up, it has not moved nearly as quickly.(The grade three LGI is actually negative.) This same pattern appears infourth and fifth grades where the gains are decreasing over time. The inputstatus grows stronger year after year, but the school is not capitalizing fullyon this. Again, we don’t know fully what is occurring here. This school mayhave developed an extraordinarily effective primary reading program. If thisis the case, this would be something that we should investigate more closely.Alternatively, it may just be recruiting better students. Genuine improve-ments appear to be occurring at certain grades, such as six and seven, andthis we should definitely look at more closely as possible guidance to otherschools. Even though the output trends are up for all grades, it is less thanclear that all grades are actually improving. In sum, while Polk School stillappears successful, we now have a somewhat more circumscribed view aboutthe extent and location of these successes.

Academic Productivity of Chicago Public Elementary Schools34
Evidence for Systemwide ImprovementPreliminary ResultsAs we have argued throughout this report, the differences in test forms andlevels of the ITBS used by the Chicago Public Schools over the last decadecause a significant problem in drawing inferences about changing schoolproductivity. For this reason, we undertook a cross form and level equatingstudy. While the equating study results are an improvement over the gradeequivalent metric for assessing change over time, a great deal of noise re-mains in these data.
Fortuitously, there is one set of comparisons embedded in the post-reform testing series that is not afflicted by these problems. The testform administered in 1993, Form K, was repeated in 1995, and theform used in 1994, Form L, was repeated in 1996. As a result, the 1994and 1996 learning gains are directly comparable because they are basedon the same pairs of test forms and levels. (For example, the third gradegain in both years is based on second grade students taking level 8 ofForm K, followed the next year by level 9 of Form L.) For this reason,we begin our analysis of systemwide trends by focusing on the strongestpiece of evidence where results are not contingent on the accuracy ofthe equating study.
Across the board, for all elementary grades three through eight, the 1996learning gains were substantially greater than in 1994 for both reading andmathematics. (See Figures 14a and 14b respectively.) The same pattern oc-curs in GE scores. In relative terms, student gains in 1996 represent im-provements ranging from 10 to nearly 40 percent over the 1994 levels. (SeeFigure 14c.) This is an impressive two-year productivity gain by most anystandard.26
Why We Focused on ITBS instead of IGAPThe ITBS testing program is better suited for answering questions about school produc-
tivity than the state assessment system, the Illinois Goals Assessment Program (IGAP). Atthe elementary level, the state program tests students in reading and mathematics at gradesthree, six, and eight (with selected other subjects tested at other grades). Given that indi-vidual scores on the IGAP were not available until spring of 1993, it was impossible to linkstudent scores to estimate individual learning gains and thereby have a basis to create value-added indicators for schools. Even with individual scores that were made available since1993, the spacing of the testing remains too far apart because so many students will havechanged schools between these grades. The annual ITBS testing program reduces theseproblems considerably. It provides a basis for measuring learning gains each year for eachschool and grade.

Consortium on Chicago School Research 35
Figure 14a. 1994 vs. 1996 ITBS Reading Gains
Grade
10
9
8
7
6
5
4
3
2
1
0
Gai
n in
Sco
re
3 4 5 6 7 8
1993-1994 Gain 1995-1996 Gain
Figure 14b. 1994 vs. 1996 ITBS Mathematics Gains
Grade
10
9
8
7
6
5
4
3
2
1
0
Gai
n in
Sco
re
3 4 5 6 7 8
1993-1994 Gain 1995-1996 Gain
Figure 14c. 1996 Improvements over 1994 Gains
Reading Mathematics
50
45
40
35
30
25
20
15
10
5
0
Per
cent
age
3 4 5 6 7 8 3 4 5 6 7 8
Note: (1996-1994 gain) / average (1988, 1989, 1990 gain)
Figure 14a. 1994 vs. 1996 ITBS Reading Gains
Figure 14b. 1994 vs. 1996 ITBS Mathematics Gains
Figure 14c. 1996 Improvements over 1994 Gains

Academic Productivity of Chicago Public Elementary Schools36
Figure 15. Long-Term Systemwide Gain Trends–Reading
10
9
8
7
6
5
4
90 92 94 96
15a . Grade 3
10
9
8
7
6
5
4
90 92 94 96
15b. Grade 4
10
9
8
7
6
5
4
90 92 94 96
15c. Grade 5
10
9
8
7
6
5
4
90 92 94 96
15d. Grade 6
10
9
8
7
6
5
4
90 92 94 96
15e. Grade 7
10
9
8
7
6
5
4
90 92 94 96
15f. Grade 8
(2.4)
Figure 15. Long-Term Systemwide Gain Trends–Reading
Consortium on Chicago School Research 37
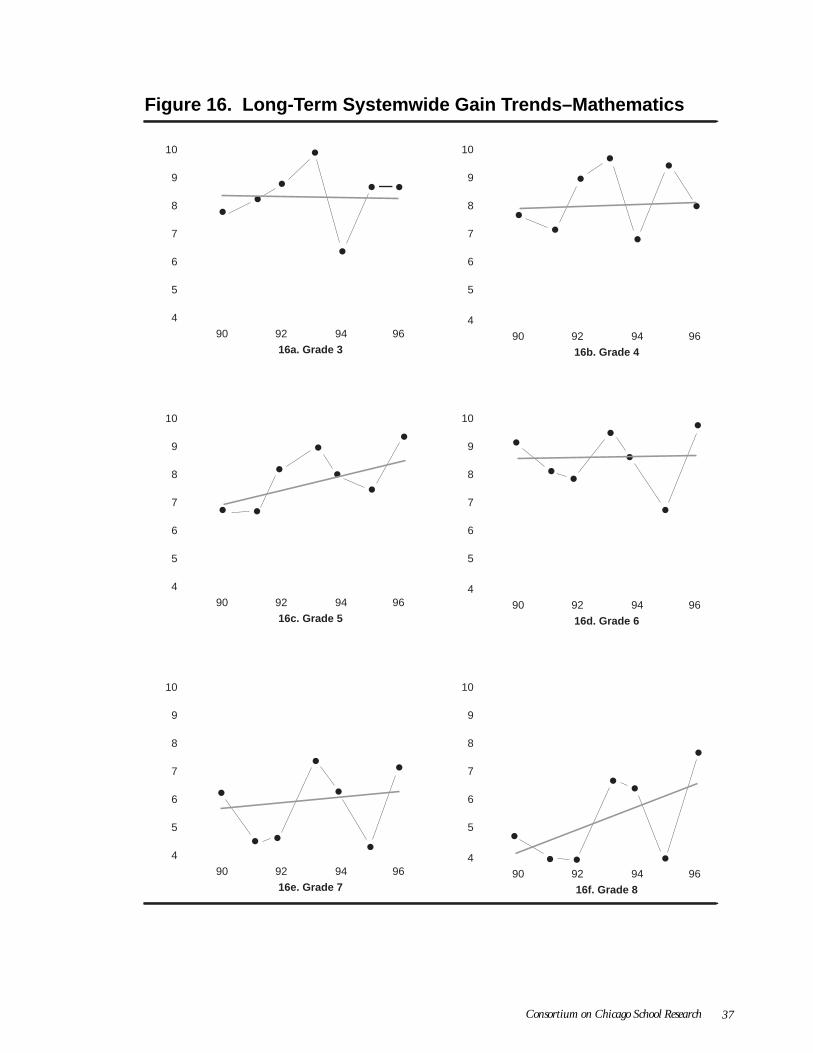
Figure 16. Long-Term Systemwide Gain Trends–Mathematics
10
9
8
7
6
5
4
90 92 94 96
16a. Grade 3
10
9
8
7
6
5
4
90 92 94 96
16b. Grade 4
10
9
8
7
6
5
4
90 92 94 96
16c. Grade 5
10
9
8
7
6
5
4
90 92 94 96
16d. Grade 6
10
9
8
7
6
5
4
90 92 94 96
16e. Grade 7
10
9
8
7
6
5
4
90 92 94 96
16f. Grade 8
Figure 16. Long-Term Systemwide Gain Trends–Mathematics

Academic Productivity of Chicago Public Elementary Schools38
These results immediately raise a second question, “Is this a one-yearphenomenon (e.g., something attributable to the administrative reforms of1995) or rather a signal of a longer-term improvement trend that links backto the reforms of 1988?” To investigate this question, we do have to rely onthe equating study results in order to examine the 1996 gains within thelarger context of the learning gain trends over the last several years. If theimprovement registered in 1996 is a one-year phenomenon, we would ex-pect to find flat or possibly even declining trends in learning gains through1995 followed by one big upward jump in 1996. In contrast, the 1996 datamay look like a natural part of a longer-term trend. The results for readingand mathematics are presented in Figures 15 and 16 respectively.
The first and most immediate observation from scanning the learninggain trends is that these data are quite noisy. While we can see that the 1996gains are higher than in 1994, a similar pattern occurred for the 1993 gainsas compared with 1991. In almost every case, the 1993 results outpaced1991. Taken overall, the 1996 results appear for the most part to be embed-ded in longer-term (albeit noisy) trends. To see this more clearly, we esti-mated trend lines from 1990 through 1996 that discount year-to-year datafluctuations.27 Generally, the 1996 data look consistent with these overalltrends. There is some evidence, however, of an upward jump in 1996 inselected grades, especially in mathematics.
These analyses provide our first evidence about trends systemwide inacademic productivity. To probe this further, we now turn to an analysis ofthe school productivity profiles. This offers more complete information aboutacademic productivity in that it considers simultaneously both output andlearning gain trends.
Systemwide Average Productivity ProfileFigure 17 displays the overall ITBS mathematics productivity profile forthe CPS. The display aggregates the grade productivity profiles from allindividual elementary schools in the system. Notice that the output trendsare up for all grades three through eight.28 The learning gain trends alsoshow marked improvements for the middle and upper grades. For gradefive, the systemwide improvement, as summarized in the LGI, was 19 per-cent over the five-year period from 1992 through 1996. For grades six,seven, and eight the relative improvement in mathematics learning was 7percent, 27 percent and 63 percent respectively. In contrast, grades threeand four show little change in learning gains over this period.
The grade three mathematics data are quite interesting. The estimatedLGI for grade three is actually slightly down (by 4 percent), but the output

Consortium on Chicago School Research 39
trend is still positive. This is a case where if we just looked at the outputtrend, as we might under a more traditional accountability approach, wecould mistakenly conclude that third grades have been improvingsystemwide. In fact, the registered gains in achievement at the end of gradethree appear largely attributable to major improvements prior to grade three.
Figure 18 displays the systemwide productivity profiles for reading. Theresults here are a bit more mixed, but still generally positive. The outputtrends are up at all grades except grade four; the rates of improvement,however, are not as large as in mathematics. Grade four registers a learningrate decline of 22 percent. Grades three, five, six and seven, however, showsignificant gain trends ranging from 10 to 42 percent; Grade 8 remainsbasically unchanged.
Overall, our analyses indicate broad-based systemwide improvementsin student learning, stronger in mathematics but also in reading. More-over, we believe that these data, up through 1996, are a reasonably good
Scale
75
70
65
60
55
50
45
40
35
30
3 4 5 6 7 8
Grade
Figure 17. Mathematics Productivity Profile for CPS, 1987-1996
-4%
2%
19%
7%
27%
63%Grade 5Output
Grade 4 Input
LGI for Grade 6
LGI = Learning Gain Index, computed for 1992-1996.
Figure 17. Mathematics Productivity Profile for CPS, 1987-1996

Academic Productivity of Chicago Public Elementary Schools40
indicator of meaningful changes in instruction and student learning be-cause no high stakes external accountability were associated with them.29
That is, prior to 1996 the main external accountability force over ChicagoPublic Schools was the Illinois State Board of Education, which based itsschool rankings and “academic watch list” on IGAP data. Although ITBSscores still mattered to individual schools, no formal consequences weredirectly attached to them. Beginning in 1996, the CPS instituted its ownhigh stakes accountability system based exclusively on the ITBS; as a result,the future utility of these data as an indicator of broad instructional im-provement has become more questionable.
Distributions of Individual School Productivity ProfilesAs we noted in the introduction, we should expect varied outcomes amongschools under decentralization reforms such as the 1988 legislation. Someschools were well positioned at the onset of reform to take good advantageof the opportunities and resources it afforded to press for deep changes.Others, starting with a much weaker base of human and social resources,
Note: LGI = Learning Gain Index, computed for 1992-1996.
Grade
Scale
70
65
60
55
50
45
40
35
30
25
10%
-22%
11%
42%
16%
-4%
3 4 5 6 7 8
Grade 5Output
Grade 4 Input
Figure 18. Reading Productivity Profile for CPS, 1987-1996
LGI for Grade 6
Figure 18. Reading Productivity Profile for CPS, 1987-1996

Consortium on Chicago School Research 41
were likely to progress less rapidly and, in the worst cases, might evenmove backwards. Clearly, patterns among schools in their academic pro-ductivity are likely to be related to these core resources for improve-ments in student learning.30
Thus, in addition to looking at systemwide aggregate trends, we alsofocus attention on the distribution of productivity trends across the 466elementary schools that comprise the composite pictures. For this purpose,we rely on the school productivity classification system introduced earlier.We summarize each school’s performance in terms of the aggregate produc-tivity profile for the lower, intermediate, and upper elementary units (i.e.,grades three and four, grades five and six, and grades seven and eight) andthe second grade output trend. The summary productivity profile for eachschool is classified using a seven-category scheme that ranges from clearly“Up” through “Mixed” and “No Change” categories to clearly “Down.”(See page 48 and endnote 22 for a further description.) The second gradeoutput trends are subject to a three-category classification: “Up,” “NoChange,” and “Down.” The distribution of school results is presented inFigure 19 for mathematics and Figure 20 for reading.
����yz{|����yz{|����yz{|��yz��yz��yz��������yyzz{{||��������yyzz{{||��
����yy
zz{|
Up
Tending Up
�|Mixed-Increasing Output
�zMixed-Increasing Gain
�|No Change
Tending Down
Down
100
90
80
70
60
50
40
30
20
10
0
Figure 19. Distribution of Mathematics Productivity
Grade
2
Outpu
tLo
wer
Inte
rmed
iate
Upper
��
����
��yy
zz{{
||
Figure 19. Distribution of Mathematics Productivity

Academic Productivity of Chicago Public Elementary Schools42
For mathematics, 50 percent of the schools have positive productivitytrends for the lower grades. A substantial group (19 percent) are “Up” inboth output and gain trends, and another 31 percent are “Tending Up”—that is, they are up either in output or gain trends. About 28 percent of theschools have “Mixed” or “No Change” productivity ratings. In these schools,there is either no evidence of improved scores or contradictory evidence—that is, either outputs are up and gains are down or the reverse. In 21 per-cent of the cases, productivity is “Down” or “Tending Down.”
The picture is much more positive for the intermediate grade mathemat-ics results where 45 percent of the schools are “Up” and another 32 percentare “Tending Up.” About three percent of the cases are “Mixed” and 13percent show “No Change.” A very small number of schools—about sixpercent—are “Down” or “Tending Down.”
���
���
���
���
yyy
zzz
{{{
|||
���
���
����yyy
zzz
{{||��yz���
���
����yyy
zzz
{{||��yz
Up
Tending Up
�|Mixed-Increasing Output
�zMixed-Increasing Gain
�|No Change
Tending Down
Down
100
90
80
70
60
50
40
30
20
10
0
Figure 20 . Distribution of Reading Productivity
Grade
2
Outpu
tLo
wer���
���
���
���
yyy
zzz
{{{
|||
���
���
��
��yyy
zzz
{{
||
Inte
rmed
iate
Upper
��
��
��
��yy
zz
{{
||
Figure 20. Distribution of Reading Productivity

Consortium on Chicago School Research 43
The upper grade trends are even better than the intermediate grades inmath, where 63 percent of the schools are “Up” and another 28 percent are“Tending Up.” The remaining 9 percent of the schools are spread amongthe other categories.
In reading, the pattern is less clear cut. In the lower grades, there areabout equal numbers of schools with positive trends (24 percent) aswith negative trends (28 percent). The most prevalent category in thesegrades is “No Change,” (36 percent) and 11 percent of the schools have“Mixed” trends.
The intermediate grades are quite positive, with 27 percent of the schoolsin the “Up” category and 64 percent “Tending Up.” The upper grades aremore varied, with the biggest category (51 percent) being “No Change.”Thirty percent are “Up” or “Tending Up” and 16 percent are “Down” or“Tending Down.”
We also note that grade two output trends suggest some possible im-provements in CPS primary programs. For mathematics, 50 percent of theschools show improved trends compared to 9 percent declining. In reading,35 percent show positive trends compared to 15 percent declining.
InterpretationInterpreting these results is complicated by the fact that the ITBS has
been a tacit rather than an explicit standard for school performance. Whilethe content of the tests, as laid out in the content-referenced scale presentedearlier, is certainly reasonable—few would disagree that well-educated stu-dents should be able to answers these kinds of questions—this has neverbeen publicly established as a systemwide standard for subject matter con-tent and sequence. Individual schools may well be working on other aca-demic goals. They might, for example, focus more on higher-order think-ing skills or deeper engagement of students with projects and some specificsubject matter. Some schools may also be teaching to the ITBS contentmaps, but not in precisely the same sequence. Such schools may recordweak test scores in some grades, where the alignment between the test andinstruction is poor, and then much better results in other grades where thetest better matches with students’ actual classroom experiences.
With these caveats in mind, we proceed to offer an interpretation. Thereappears to have been significant improvement systemwide in primary pro-grams through grade three. This is reflected in the improving second gradeoutput trends in half of the schools in mathematics and a third in reading.We know generally that the student population entering the Chicago Pub-lic Schools has been growing gradually more disadvantaged over the recent

Academic Productivity of Chicago Public Elementary Schools44
10-year period.31 Thus, although we cannot specifically account for thesources of the improvement (e.g., more state pre-kindergarten; improve-ment in kindergarten, grades one and two curriculum), something positiveappears to have happened here.
For the most part, the early gains prior to grade three, however, are notbeing further advanced during grades three through four in either math-ematics or reading. In fact, some of the early improvements appear to belost. In contrast, the intermediate and upper elementary grades look quitepositive. A word of caution is in order, however. If the primary grades sud-denly began to promote children with much higher levels of skills, thiswould challenge intermediate and upper grade teachers to rethink their in-struction to build on the advanced knowledge that students now possess. Inthe absence of such proactive improvement efforts by intermediate gradeteachers, i.e., if they simply repeated past practice, their productivity trendswould suddenly start to look worse. In short, the positive trends in theintermediate and upper grades may, in part, be a curious consequence ofthe lack of productivity improvement in primary grades.
Finally, while the overall thrust of this report has been to design a defen-sible indicator reporting system for assessing school productivity, we wouldbe remiss not to comment at least briefly on the substantive import of thesefindings. Notwithstanding the numerous methodological issues documentedabove, these analyses strongly suggest that Chicago school reform has pre-cipitated substantial improvements in achievement in a very large numberof Chicago public elementary schools. The governance reforms of 1988and 1995 have significantly advanced the learning opportunities affordedto literally hundreds of thousands of Chicago’s children. While more im-provements are still needed, these results should nonetheless encourage thepublic that Chicago’s schools can substantially improve and that this is, infact, occurring.
SummaryThis study set out to examine the issues involved in using extant standard-ized test data for school accountability and to devise a more defensible indi-cator system for monitoring and reporting changes over time. Our effortsmet several serious obstacles to a straightforward tallying of the results. Wefound it necessary to contend with a host of confounding factors including:
• Changing test forms from year to year that rendered both testcontent and scales not directly comparable;
• Inappropriateness of standard measurement metrics, such as grade

Consortium on Chicago School Research 45
equivalents, for measuring change;• Significant school-to-school variability in student mobility; and• Possible effects of changing system policy, such as those regarding
retention and bilingual testing.
These concerns pose serious problems for the academic productivity in-dicator currently used by the CPS—percent of students at or above na-tional norms.
In response to the first two issues, we returned to the original studentITBS item scores and undertook an equating study to derive a content-referenced scale for comparing student performance across grades and years.All of the results presented in this report are based on this content-refer-enced scale. In response to the last two issues, we developed an academicproductivity profile based on student learning gains that adjusts for extra-neous factors, which also influence reported achievement levels, in order todetermine true school effects. Our approach estimates each school’s contri-bution, or value-added, to the learning of students enrolled at that school.
We have striven to provide an accurate summary of the progress of Chi-cago schools over the last decade. The results presented here are the finalproduct of literally thousands of alternative analyses conducted over severalyears. They represent the best assessment that we can offer, given the limita-tions of the extant testing system. These inherent limitations are substan-tial, and we feel less than completely satisfied with the end product. Weak-nesses in the data have frustrated our efforts to develop more accurate answers.Again, this is not a criticism of the ITBS per se; rather, we along with theCPS are simply trying to use these tests for purposes for which they werenever designed.
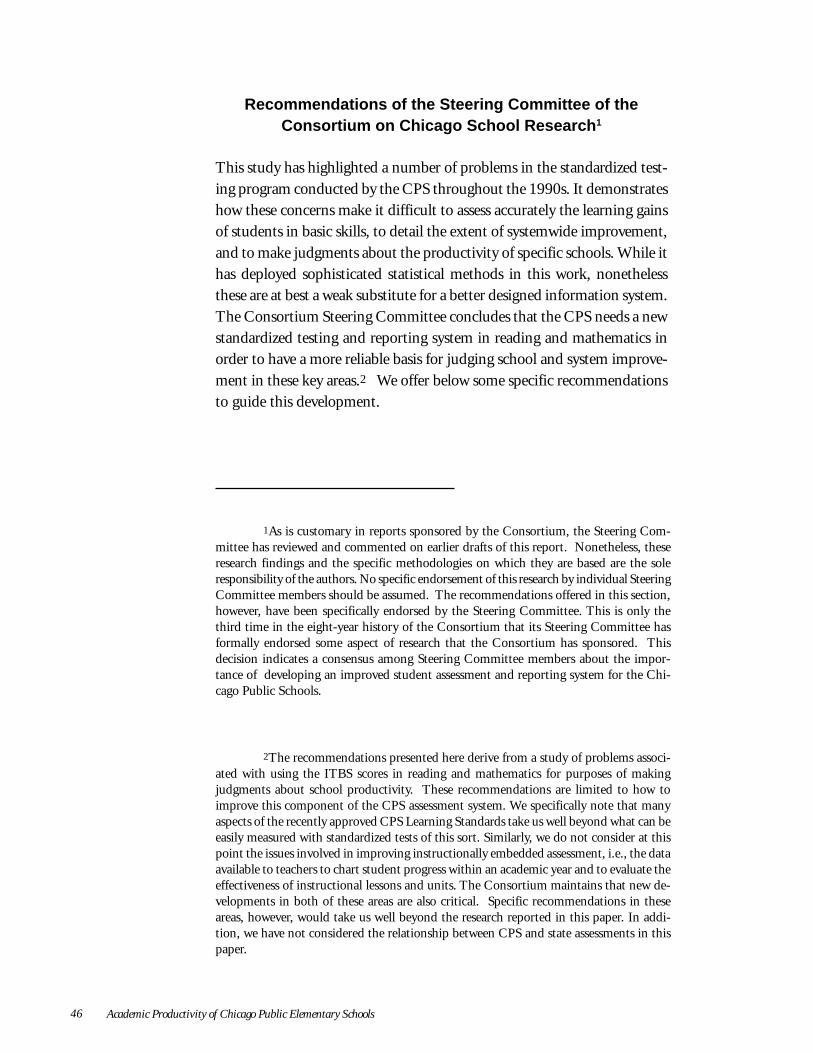
Academic Productivity of Chicago Public Elementary Schools46
Recommendations of the Steering Committee of theConsortium on Chicago School Research 1
This study has highlighted a number of problems in the standardized test-ing program conducted by the CPS throughout the 1990s. It demonstrateshow these concerns make it difficult to assess accurately the learning gainsof students in basic skills, to detail the extent of systemwide improvement,and to make judgments about the productivity of specific schools. While ithas deployed sophisticated statistical methods in this work, nonethelessthese are at best a weak substitute for a better designed information system.The Consortium Steering Committee concludes that the CPS needs a newstandardized testing and reporting system in reading and mathematics inorder to have a more reliable basis for judging school and system improve-ment in these key areas.2 We offer below some specific recommendationsto guide this development.
1As is customary in reports sponsored by the Consortium, the Steering Com-mittee has reviewed and commented on earlier drafts of this report. Nonetheless, theseresearch findings and the specific methodologies on which they are based are the soleresponsibility of the authors. No specific endorsement of this research by individual SteeringCommittee members should be assumed. The recommendations offered in this section,however, have been specifically endorsed by the Steering Committee. This is only thethird time in the eight-year history of the Consortium that its Steering Committee hasformally endorsed some aspect of research that the Consortium has sponsored. Thisdecision indicates a consensus among Steering Committee members about the impor-tance of developing an improved student assessment and reporting system for the Chi-cago Public Schools.
2The recommendations presented here derive from a study of problems associ-ated with using the ITBS scores in reading and mathematics for purposes of makingjudgments about school productivity. These recommendations are limited to how toimprove this component of the CPS assessment system. We specifically note that manyaspects of the recently approved CPS Learning Standards take us well beyond what can beeasily measured with standardized tests of this sort. Similarly, we do not consider at thispoint the issues involved in improving instructionally embedded assessment, i.e., the dataavailable to teachers to chart student progress within an academic year and to evaluate theeffectiveness of instructional lessons and units. The Consortium maintains that new de-velopments in both of these areas are also critical. Specific recommendations in theseareas, however, would take us well beyond the research reported in this paper. In addi-tion, we have not considered the relationship between CPS and state assessments in thispaper.

Consortium on Chicago School Research 47
Alignment with CPS Learning GoalsNew CPS standardized tests in reading and mathematics should be directlyaligned with the recently approved CPS Learning Standards. Only if theassessments are specifically developed to achieve this aim and have beendemonstrated to be valid in this regard will teachers, students, and parentsknow whether they are making genuine progress on these important goals.The content of the standards should dictate the content of the tests. A“back-in” solution (i.e., choosing among existing tests the one that comesclosest to matching the standards) is inadequate. Under such an approachthe test publishers rather than local leaders get to decide the accountabilitystandards for judging schools.
Score Reporting on a Content-Referenced ScaleIn addition to a reference to national norms, test score results should bereported in terms of the specific knowledge and skills that students havedemonstrated. The content-referenced scales used in this paper illustratethis kind of approach. The results for a sample of actual test questions thatwere administered to students each year should also be made public. Thiscan help to promote in each school community, and across the city, aneducational, as well as a numeric conversation about what students actuallyknow and can do.
A Stable Measurement Ruler for Assessing AcademicProgressFor purposes of making judgments about school and system improvementover time, it is essential to maintain a stable testing system that consistentlymeasures students against the same content standards from year to year.This will require that rigorous equating procedures be fully integrated intothe overall testing system design. As views about appropriate learning goalsshift over time, this will entail developing new assessments and starting newtrend lines about progress toward these new standards. The changes in goalsshould not be obscured by changing forms of the assessment, as has beenthe case in the past.
An Accountability Focus on Schools’ Value Added toStudent LearningEach Chicago school should be held accountable for the amount of learn-ing acquired by students enrolled in that school. While the current CPSschool accountability indicator—the percentage of students at nationalnorms—provides information about the overall attainment of students, it

Academic Productivity of Chicago Public Elementary Schools48
does not tell us how much they have learned in any particular school.Whether gains in student learning are improving over time should play amajor role in the school accountability system. Thus, for purposes of re-porting on individual school accountability, the CPS should add a focus ongain trends in addition to its current data on output trends.
An Inclusive OrientationThe design of new assessments should incorporate a strong commit-ment to measuring the learning progress of all students. Similarly, schoolsshould be held accountable for the progress of all students, and proce-dures should be established to minimize the exclusion of students fromthe accountability system.
The accountability system must take better account of the learning gainsof mobile students (i.e. students who have changed schools during the 12-month period prior to spring testing.) The attribution of these students’learning gains to schools, however, must be adjudicated in a fair manner.3
Procedures can be devised that are both fair to individual schools (i.e., in-cluding in their accountability report only the students who have been en-rolled long enough for the school to have a measurable impact on theirlearning) and inclusive in orientation (i.e., where learning gains for over 90percent of the CPS students are counted.)
Reporting test scores and learning gains for retained students is also animportant issue. Incentives implicit in the current system are to retain stu-dents because their scores will then count against a lower grade level. Sincethe progress of retained students is especially important, the reporting sys-tem should give them explicit treatment. One possible method would be toanalyze the progress of retained students separately (that is, disaggregatedfrom the total); another possibility would be to report scores by age level ofstudents rather than by grade level.
3Although we were unable to do this in the analyses presented in this paper,because of limitations in the test data information files available to us, the CPS can ac-complish this by merging the test files with information from the student administrativehistory files on the time and places of student enrollments. One possible rule would be tocount for each school the learning gains for all students who were enrolled in the schoolcontinuously from some date, for example October 1, through spring testing. Anotherpossible rule would be to assign the learning gain to the school where the student spentthe most time in the past academic year, regardless of entry and exit dates.

Consortium on Chicago School Research 49
Because of the importance of the first years of schooling for developing asolid foundation of literacy and numeracy skills, Chicago schools need bet-ter assessment tools for evaluating the progress of primary grade studentstoward the CPS Learning Standards. Extant group administered standard-ized tests, however, are not adequate. A more comprehensive approach, us-ing reliable and valid techniques, needs to be adopted for young students.We specifically caution that assessments in kindergarten and first grade haveoften been misused in the past to label and track students into weak in-struction with low expectations for learning. While it is important thatChicago schools have better data for judging their efforts to educate stu-dents during the critical early years of schooling, such data should never beused to limit students’ opportunity for learning.
The number of students in the CPS whose home language is not Englishis now one in six and rapidly growing. We lack good data on the academicprogress of these students, and many are currently excluded from annualschool accountability reports. The design of a new basic skills assessmentshould make provisions to meet the linguistic needs of students who are inthe process of learning English. Similarly, special education students shouldbe included. In this regard, new tests should be designed consistent withthe guidelines for testing and reporting set out in the recent settlementagreement on the education of special needs students in the CPS.
Concluding CommentThese recommendations are offered as a set of guidelines to the CPS toassist its efforts to strengthen data collection and reporting on school aca-demic accountability. We view such developments as necessary, in fact es-sential, to the continued improvement of Chicago schools. Maintainingcore academic standards and vitalizing a capacity to report more accuratelyto each school community on its progress toward the standards is key tomaking school reform work.

Academic Productivity of Chicago Public Elementary Schools50
Endnotes
1For simplicity of the illustration, we have presented results in terms of percentile scores.Normally we do not compute means on such rank order statistics. The use of means ishighly appropriate with the equated measures developed later in this paper.
2Our point here focuses exclusively on choice of any appropriate statistical indicator.Regardless of the indicator chosen, the accuracy of our inferences will depend on whetherall eligible students are actually tested within each school. Unless the accountability systemis crafted properly and carefully implemented, it can create incentives for schools not totest some students. This problem has to do with the design of the testing system as well aswith the choice of an appropriate analysis indicator.
3These testing experiments were part of our common person equating study. The entiretest equating design involved 24 different situations where students took two differentforms and/or levels of the ITBS. The three cases presented here were chosen to illustratethe kinds of problems that can occur.
4Formally, we are concerned about evidence of bias in the testing system—are students asa group likely to perform better or worse on one test as compared to the other? In each ofthe cases reported here, the mean difference in student results between test administrationswas statistically significant beyond the 0.01 level.
5Fillmore is a fictitious school name; the data are, however, from a real Chicago school. Wehave adopted the convention of pseudonyms for real school names throughout this report.Since the purpose of the report is to examine issues in the CPS testing and indicatorsystem, directing attention to specific schools can distract the reader from our primaryaim. Separate individual school reports are being released at the same time.
6This is based on the results of the item calibration undertaken as part of the equatingstudy described in a subsequent section.
7A second major advantage of the equated test score metric is that it produces a goodnessof fit statistic for each student’s test score responses. Since the items have now been arrangedin difficulty order, we expect most students to get the easier ones correct and to miss theharder ones. The misfit statistic tells us whether students are responding to the scale in thismanner. If, for example, some students are just guessing randomly, they will have largemisfit statistics because they will have missed easy items and gotten some hard ones correctjust by chance. The misfit statistic tells us that we just don’t know much about the truecompetencies of these students. We use this information in the school productivity profileto compute more accurate estimates of school trends.
A third major advantage of the Rasch equating is that, in theory, it produces a “lineartest score metric.” This is an important prerequisite in studies of quantitative change.This allows us to compare directly the gains of individual students or schools who start atdifferent places on the test score metric.
8In these comparisons, a student is said to have performed differently (“better” or “worse”)on the two tests if the difference between test scores is more than twice the square-root ofthe sum of the squares of the standard error of measurement (that is, the standard error ofthe difference) of each of the two test scores. A student is classified as “likely better” or“likely worse” if this difference is larger than one s.e.diff. On the Rasch metric, the standarderror of measurement was calculated for each test score and includes an inflation for unusualresponse patterns. Standard errors of measurement are provided by the ITBS test publisher
Consortium on Chicago School Research 51
for developmental standard scores but not grade equivalents. An approximate standarderror of measurement for GEs was deduced for each test level based on the relationship ofthe GE with the developmentalstandard score, as found in the conversion table providedfor Form M (1996).
9As noted earlier, “on grade level” is test form and level dependent. As a result, the nationalnorm points for any given grade in the equated metric vary some across the forms. Forpurposes of creating some cross walk between the two scales we chose to average the 1987to 1996 scores to create the anchoring points for our content referenced metric. That is, ascale score of 20 is equivalent to a GE of 1.8 on level 7, based on these averages, and a scalescore of 80 is equivalent to a GE of 8.8 on level 14.
10The difficulty score for a passage is based on the median difficulty of the items associatedwith that passage. See Luppescu (1996) for an in-depth analysis of the factors that contributeto both item and passage difficulty in the ITBS reading series.
11We adopt a conventional definition for our level of mastery. A student is said to masteran item if he has greater than a 75 percent chance of responding correctly to that item. Onthe logit scale, this translates to a student ability estimate that is 1.1 higher than the calibrateddifficulty of the item.
12Lee (1992), Lee and Wright (1992), Luppescu (1996).
13See Kerbow (1996).
14Meyer (1993) reported on efforts to characterize school improvement from testingprograms that employ annual school aggregate scores. The results were startling. Individualschools can actually be making improvements (i.e., individual student achievement gainsare increasing), but these increasing gains can be totally obscured by factors such as thosediscussed in this report.
15An important consequence of our definition of school productivity is that only studentswho are tested in the same school for two consecutive years are included in our analysis. Ingrades four to seven from 1994 through 1996, we averaged about 80 percent of studentswho are tested in reading. Of these students, only 84 to 87 percent have useable teststrings. Of this group of students, about 5 percent were further excluded because on one orboth occasions a student was in a special education category or had taken an off-level test.Thus, using reasonable criteria, our accountability system employs only about 60 percentof the children tested on average. This raises a highly sensitive issue of who among thediverse population of children served by the system actually enters our analyses of schoolaccountability.
16We were constrained to follow this procedure in our analyses because of the data thenavailable in the CPS test score files. Because of the analysis presented in this report, theCPS has now merged its test score and administrative history files. As a result, it is nowpossible to assign the learning gains of a student to a school if he or she was enrolled bysome date (e.g., October 1 of the test year) or spent a minimum amount of time there(e.g., at least 100 institutional days). Since the majority of school changes occur over thesummer, the use of such a procedure would result in more than 90 percent of the studentsentering into the accountability analysis each year.
17This choice was driven primarily by testing design considerations. The gains recorded in1991 are based on two new and different forms of the ITBS. The pattern of different testforms persists in subsequent years. In contrast, the gains through 1989 are based on repeated

Academic Productivity of Chicago Public Elementary Schools52
administrations of Form 7 of the ITBS that the CPS used throughout the 1980s. The1990 gain also involves Form 7 data as the input status. Because this test form had beenused for a very long period of time, concerns had been raised about the security of the testitems and whether some teachers and schools might actually be teaching the test. We firstconsidered using the 1990 data as the base year as this is formally the first implementationyear for the 1988 reform. The estimated base year results in 1990 looked spurious, however,in many schools. Since subsequent productivity trends are anchored in the base year results,it seemed prudent to us to switch to 1991 instead.
18Our adjustment strategy reflects two principal concerns affecting our analysis. First, wecontrol for possible residual test-form effects on trend estimates. Recall that from 1990forward, the CPS changed test forms each year. Form 7 was so familiar prior to 1990 that,in many schools, student gains for this period could well harbor long-term practice effects.In contrast, in 1990 we observe a systemwide plunge in gains as a new and unfamiliar testwas given for the first time.
Thus, we chose to introduce in our analyses model-specific “form effects” for the testdata used prior to 1991. As a result, differences in test administration prior to 1991 willnot affect our overall trend estimates.
Second, we adjust each school’s true gain by how its student composition (such asminority status, bilingual status, retention rate, and percentage old for their grade) com-pares with the prereform status defined as the average of the school’s 1988 and 1989 levelfor the grade. Differences among adjusted and unadjusted gain trend estimates are minor.They correlate at .98 or better irrespective of grade.
19Formally, the LGI is computed as follows:
LGI = 100 x (5 x School Gain Trend Estimate) / ( 1991 System Gain Estimate)
An LGI compares the gains made in a grade for the five years (1992 through 1996) as apercentage of the observed gain systemwide for that grade in the 1991 base year.
20Meyer (1993) made a strong case for measuring school performance using gain trends.See Bryk, Deabster, Easton, Luppescu, and Thum (1994) for an early perspective focusingon the Chicago Public Schools.
21Technically, the value added to student learning is different from the observed learninggains in that the value-added estimate is adjusted for other factors affecting observedoutcomes. For simplicity of presentation, we use the terms interchangeably here. All of theresults presented in this paper are adjusted, i.e., value-added estimates.
22School improvement is defined by two factors. A clearly improving school should exhibitan increase in productivity over time as well as increasing outputs over time. For eacheducational sub-unit, therefore, we classify each school’s improvement as:
Up: Total gain trend (across grades in grouping) is +.02 logits or higher. Over thefive-year time span (from 1992 to 1996), this amounts approximately to a 15percent improvement in learning gains (LGI). At the same time, the outputtrend at the end of the grade group is +.02 or higher.
Tending Up: Schools in this group show a +.02 output trend for the last grade inthe grade group and no change in their total gain trends (-.02, +.02), or a totalof +.02 or higher in gain trends without noticeable changes in the final outputtrends (again, from -.02 to +.02).

Consortium on Chicago School Research 53
Mixed Output: Output trends at the last grade in the grade group is equal to .02(or better), but the total gain trend is -.02 or less.
Mixed, Productivity: The total gain trend is .02 or better, but the output trendat the last grade in the grade group is equal to -.02 or less.
No Change: No discernable output trend or total gain trends beyond the -.02 to.02 range.
Tending Down: Schools in this group show a -.02 or lower output trend at thelast grade in the grade group and no change in their total gain trends, or a totalof -.02 or less in gain trends without noticeable changes in the final outputtrends.
Down: Total gain trend (across grade-groups) is -.02 or lower. This amountsapproximately to a 15 percent loss in the LGI over the grades for the five years(from 1992 to 1996) approximately. At the same time, the output trend at theend of the grade group is -.02 or lower.
23Correlations of gain trend estimates for adjacent grades tend to be negative. For example,the ITBS reading estimates for grades 3 and 4 (-.16, p<.001), grades 4 and 5 (-.12, p<.001),grades 5 and 6 (-.22, p<.001), and grades 6 and 7 (-.12, p<.02).
24For a further discussion of the problems of school-based professional community seeKruse, Louis, and Bryk (1995). For an analysis of these issues in Chicago schools, seeSebring, Bryk, Easton, Luppescu, Thum, Lopez, and Smith (1995).
25Standardized testing in the CPS is optional in grades one and two. A substantial numberof eligible students are not tested at grade one. By grade two, however, there is almostuniversal administration of the ITBS. Thus, grade three becomes the first grade at whichentry and exit data exist and, as a result, a grade productivity profile can be computed foralmost all schools.
In principle, other choices of grade groupings could be used such as 2, 3; 4, 5, 6; and7,8. The splits at grades 6 and 8 seemed natural given that these are also the grades forstate mandated reading and math assessments. In this way, the local accountability systemwould parallel the state approach. The treatment of grade four was a main issue for us.Our first inclination was to group it with grades five and six, for the reasons about thestate testing just articulated. Our analysis of auto-correlations across grade levels foundrelatively strong associations between grades three and four, however. These results sug-gest that these two grade levels may work as a system in many schools and that we shouldtreat them together as a unit.
For schools with grade level structures other than kindergarten through eight, theschool productivity summary consists of only the relevant components. For example, in akindergarten through five school, the summary would include only the second gradeoutput trend and the grades three and four summary. Data from grade five would not beused. If we wanted to undertake a more detailed analysis of kindergarten through fiveschools, it would be possible to reconfigure the summaries, e.g., a grade grouping ofthree, four, and five, and examine these. In general, any application of a standard report-ing system to a school system that has as many different grade structures as in Chicago,confronts the dilemma that no system works best for all. We are convinced, however, thatthe one used here works best for most.

Academic Productivity of Chicago Public Elementary Schools54
26The systemwide gains for 1988, 1989, and 1990 were averaged separately for each gradelevel to form the baseline (i.e., used as the denominator) for estimating these percentimprovement statistics.
27Any kernel smoother would suffice. Here, we used a symmetric k-nearest neighbor linearleast squares procedure that is implemented in the S-PLUS© function supsmu.
28We note that the output trend from a given grade is not always identical to the inputtrend for the following grade. This occurs for several reasons. First, year to year mobility, asnoted earlier in the report, means that somewhat different student populations exist foreach grade profile. Typically, about 20 percent of the students exit a school each year andare replaced by a new 20 percent. Second, the population of schools shifts across grades, asnot all schools are kindergarten through eighth grade. Since the system profile is an averageof individual school profiles, this, too, can effect a difference, especially at the upper grades(five and above), where most of these changes occur. Third, the output trend for a gradeincludes 1996 data, whereas the corresponding input trend only goes through 1995.Similarly, the input trend starts with 1987, but the first output information is 1988. Sincethe time series are relatively short, these data differences at “the ends” can create leveragepoints that affect trend estimates. We examined these alternative explanations for thedifferences observed in Figures 17 and 18 and concluded that no one factor dominates.Depending upon the particular input-output combination, any one of the three may bethe causal agent.
29Linn, Koretz, and Baker (1996), for example, raise questions about the validity ofstandardized test score trends as indicators of broad instructional improvements whenthese same data are used for high stakes accountability.
30This will be the focus of a subsequent report in the Examining School Productivityseries. From the preliminary analyses to date, it is clear that such patterns exist.
31Storey, Easton, Sharp, Steans, Ames, and Bassuk (1995).

Consortium on Chicago School Research 55
REFERENCES
Bryk, Anthony S., Paul E. Deabster, John Q. Easton, Stuart Luppescu, and Yeow MengThum (1994). Measuring Achievement Gains in the Chicago Public Schools.Education and Urban Society, 26, 306-319.
Bryk, Anthony S., and Steven W. Raudenbush (1992). Hierarchical Linear Models:Applications and Data Analysis Methods. Newbury Park, CA: Sage Publications.
Bryk, Anthony S., and Herbert I. Weisberg (1977). Use of the Non-equivalent ControlGroup Design When Subjects Are Growing. Psychological Bulletin, 84 (5):950-62.
Harris, Chester W. (Ed.). (1963). Problems in Measuring Change. Proceedings of aconference sponsored by the Committee on Personality Development in Youth of theSocial Science Research Council. Madison, WI: University of Wisconsin Press.
Kerbow, David (1996). Pervasive Student Mobility: A Moving Target for School Improve-ment. Chicago: Chicago Panel on School Policy.
Kruse, Sharon D., Karen S. Louis, and Anthony S. Bryk (1994). Building ProfessionalCommunity in Schools. Issue Report No. 6. Madison, WI: Center on Organizationand Restructuring of Schools, pp. 3-6.
Lee, Ong Kim (1992). Measuring Mathematics and Reading Growth. Unpublisheddoctoral dissertation, University of Chicago.
Lee, Ong Kim, and Benjamin D. Wright (1992). Mathematics and Reading TestEquating. Paper presented at the annual meeting of the American EducationalResearch Association, San Francisco.
Linn, Robert L., Daniel M. Koretz, and Eva L. Baker (1996). Assessing the Validity of theNational Assessment of Educational Progress: Final Report of the NAEP Technical ReviewPanel. Los Angeles: Center for Research on Evaluation, Standards, and StudentTesting.
Luppescu, Stuart (1996). Virtual Equating: An Approach to Reading Test Equating byConcept Matching of Items. Unpublished doctoral dissertation, University of Chicago.
Meyer, Robert (1993). Can Schools Be Held Accountable for Good Performance? ACritique of Common Educational Performance Indicators. Working paper. HarrisGraduate School of Public Policy Studies, University of Chicago.
Meyer, Robert (1996). Value-added Indicators of School Performance. In Eric A.Hanushek and Dale W. Jorgenson (Eds.), Improving America’s Schools: The Role ofIncentives. Washington, DC: National Academy Press, pp. 197-223.
Rogosa, David R., D. Brand, and Michele F. Zimowski (1982). A Growth CurveApproach to the Measurement of Change. Psychological Bulletin, 90: 726-48
Rogosa, David R., and John B. Willett (1985). Satisfying a Simplex Structure IsSimpler Than It Should Be. Journal of Educational Statistics, 10 (2): 99-107.

Academic Productivity of Chicago Public Elementary Schools56
Sebring, Penny B., Anthony S. Bryk, John Q. Easton, Stuart Luppescu, Yeow MengThum, Winifred A. Lopez, and BetsAnn Smith (1995). Charting Reform: ChicagoTeachers Take Stock. Chicago: Consortium on Chicago School Research.
Storey, Sandra, John Q. Easton, Thomas C. Sharp, Heather Steans, Brian Ames, andAlicia Bassuk (1995). Chicago’s Public School Children and Their Environment.Chicago: Chicago Public Schools with Chicago Urban League and the LatinoInstitute.
Willett, John B. (1989). Questions and Answers in the Measurement of Change.Review of Research in Education, 15 (1988-1989), pp. 345-422.

Consortium on Chicago School Research 57
Appendix: Estimating Trends in School Productivity
Estimation Model
We applied the basic analysis model described below for each grade.
1. We denote the Rasch estimated scale score (i.e., the equated metric)obtained for student j from school k at time point t by yjkt. Also availableis an estimate of the precision, 1/s
jkt associated with each scale measure.
This is based on the real standard error of measurement, sjkt, which is thenominal standard error inflated for scale misfit. Students in school k aresubscripted j = 1,2,˛ ,n
k. Schools are indexed k = 1,2,˛ , N . Each time
point, t, may run from 1988 to 1996. Only students with at least twoconsecutive time points, a test score (yjkt ) at time t and an input score(y
jk(t-1)) at time t – 1, are included in our analysis.
2. Given the student’s test scores, we proceed with a parameterization atlevel-1 of a measurement model that estimates a student’s true inputability and true gain for year t:
(1) y*jkt
= a*1jkt
@ π1jkt
+ a*2jkt
@ π2jkt
+ e*jkt
.
Note that: Furthermore,
and
Thus e*jkt-N(0,1) and π
1jkt is the student’s true input ability while π
2jkt is
an estimator of the true gain.
3. For all students in a given grade j = 1,2,˛, nk in all k schools, we estimate
the school input and gain trends at level 2 by
(2) input π1jkt 1 (t – 1991) 0 0 r
1jkt
gain π2nkt
0 0 1 (t – 1991) r2jkt
y*jkt =yjkt
sjkt
6 1sjkt
a*2jkt
=
0 if t is the input data.
if t is the test year data.
= +
β11k
β12k
β21k
β22k
a*1jkt =
1sjkt
.
.

Academic Productivity of Chicago Public Elementary Schools58
In this model, we center t at 1991, so that β11k estimates the average input
in 1991. Similarly, β21k
is the average value-added in 1991. β12k is the
input trend for the grade and β22k
is the gain trend for the grade. Weassume that the errors in (2) are correlated, rjkt-N(0, Tπ). Equation (2) issometimes called a “cross-domain” growth model because it tracks twoclosely related short time-series simultaneously.
Student-level covariates. In addition, we adjust the school effectvector, β
k , for five student composition characteristics that might be
changing over time. The five student characteristics are bilingual “C”status, too old for a grade, if the student is retained, if the student iswhite, and if the student is African-American. Each of these covariates isdeviated around the school mean for 1988 and 1989, or generally(X
sjk,t –
—X
s·k,0) where
—X
s·k,0 denotes the 1988–1989 baseline. The
associated coefficients estimate a time-varying school composition effect.We assume that these level 2 coefficients are constant across years andacross schools.
Form effect adjustments. The final version of this model adjusts forform effect associated with 1988 and 1989 tests (Form 7) and for 1990.This is accomplished by incorporating two additional dummies. Thefirst takes on a value of “1” if the test year for a student is 1988 or 1989and “0” at all other times. Similarly, a second dummy variable is coded“1” if the test data are for 1990 and is coded “0” for all other times. Insummary, we adopted the following coding scheme for the trendcomponent (slope) and the form effects (Form 7 and CPS 90):
This results in a final level 2 model for π1 and π
2 of:
(3)
Year
88 89 90 91 92 93 94 95 96
Slope (1991) -2 -2 -1 0 1 2 3 4 5
Form 7 1 1 0 0 0 0 0 0 0
CPS 90 0 0 1 0 0 0 0 0 0
πjkt
= β21k+ (t – 1991) · β22k
+FORM 7 · β23 + CPS90 . β24
+ 3s(X
sjk,t –
—X
s·k,0) · β
2s+ r
2jkt.

Consortium on Chicago School Research 59
4. School input and gain trend estimates, βk , are expected to vary from oneschool to the next according as:
(4)
Here, the quantities in γ are the systemwide input and gain trendestimates. Across schools, u-N(0, Tβ), and future attempts to identifythe correlates of school performance entails adding plausible school-levelcovariates to this basic level-3 model in a fashion analogous to the level-2model in (3).
Equation (4) yields empirical Bayes estimates of βk for each school. They
are weighted composite estimators that take into account informationabout school k relative to other schools in the system. If the informationfor school k is relatively weak, β
k is shrunk towards the system average γ.
This estimator thus efficiently utilizes all of the available information toprovide predictions for each school.
Discussion of the Estimation ModelAppropriate techniques for research on change have long perplexedbehavioral scientists (see, for example, Harris, 1963). The methodologicalstudies of Rogosa, Brand, and Zimowski (1982), Rogosa and Willett (1985),and Willett (1988) have greatly clarified these problems. Briefly, theydemonstrate that if individual growth is linear (or approximately so), then thegain score is the unbiased estimator of the instantaneous growth rate. Even ifthe underlying growth demonstrates some curvature, the gain score willestimate the average growth rate over the time period of study. In contrast,the covariance model can be seriously biased in studies of school and programeffects on individual growth (Bryk and Weisberg, 1977).For these reasons, the analysis model employed in this research is based ongain scores rather than a covariance adjustment approach. It develops out ofthe growth modeling strategy explicated in Bryk and Raudenbush (1992).Since we are studying students’ academic development over a one-year periodof time, the use of a gain score seems quite appropriate. We note that overthe full 100-point metric, individual growth displays some deceleration at theupper ability levels. Within any grade slice, however, we found no evidence
1991 input β11k
1 0 0 0 γ11
u11k
input trend β12k 0 1 0 0 γ
12u
12k1991 gain β
21k0 0 1 0 γ
21u
21kgain trend β
22k 0 0 0 1 γ22
u22k
= +

Academic Productivity of Chicago Public Elementary Schools60
See the Consortium’s world wide web site forproductivity profiles of each Chicago PublicElementary School. These data are consideredpublic information.
http://www.consortium-chicago.org
of non-linearity in an analysis of a subset of eight-year longitudinal dataon students in the same schools. A key to use of a gain score strategy is an appropriate quantitativemetric for measuring change. The content-referenced scale developed inthis research is critical in this regard. Unlike grade equivalents, theequated test score metric yields an interval measurement scale based onthe relative difficulty of the items. Such interval measurement is necessaryfor quantitative studies of change. We also note that our analysis is based on the latent initial status andgain scores rather than the observed data. This is accomplished by theuse of a measurement model at level 1. The problems of statisticalartifacts due to correlated errors in observed input status and gains arethus eliminated. Also, unlike a covariance model, all of the test dataappears on the left hand side of the equations; as a result, we also avoidthe problems of key adjustor variables that are fallible covariates. This isanother strength of this modeling approach.

Consortium on Chicago School Research 61
Appendix: Estimating Trends in School Productivity
Estimation Model
We applied the basic analysis model described below for each grade.
1. We denote the Rasch estimated scale score (i.e., the equated metric)obtained for student j from school k at time point t by yjkt. Also availableis an estimate of the precision, 1/sjkt associated with each scale measure.This is based on the real standard error of measurement, s
jkt, which is the
nominal standard error inflated for scale misfit. Students in school k aresubscripted j = 1,2,˛ ,nk. Schools are indexed k = 1,2,˛ , N . Each timepoint, t, may run from 1988 to 1996. Only students with at least twoconsecutive time points, a test score (yjkt ) at time t and an input score(yjk(t-1) ) at time t – 1, are included in our analysis.
2. Given the student’s test scores, we proceed with a parameterization atlevel-1 of a measurement model that estimates a student’s true inputability and true gain for year t:
(1) y*jkt = a*1jkt @ π
1jkt + a*2jkt @ π2jkt + e*jkt.
Note that: Furthermore,
and
Thus e*jkt-N(0,1) and π
1jkt is the student’s true input ability while π2jkt is
an estimator of the true gain.
3. For all students in a given grade j = 1,2,˛, nk in all k schools, we estimatethe school input and gain trends at level 2 by
(2) input π1jkt 1 (t – 1991) 0 0 r
1jkt
gain π2nkt 0 0 1 (t – 1991) r
2jkt
y*jkt =yjkt
sjkt
6 1sjkt
a*2jkt =
0 if t is the input data.
if t is the test year data.
= +
β11k
β12k
β21k
β22k
a*1jkt
=1sjkt
.

Academic Productivity of Chicago Public Elementary Schools62
In this model, we center t at 1991, so that β11k estimates the average input
in 1991. Similarly, β21k
is the average value-added in 1991. β
12k is the
input trend for the grade and β22k
is the gain trend for the grade. Weassume that the errors in (2) are correlated, rjkt-N(0, Tπ). Equation (2) issometimes called a “cross-domain” growth model because it tracks twoclosely related short time-series simultaneously.
Student-level covariates. In addition, we adjust the school effectvector, βk , for five student composition characteristics that might bechanging over time. The five student characteristics are bilingual “C”status, too old for a grade, if the student is retained, if the student iswhite, and if the student is African-American. Each of these covariates isdeviated around the school mean for 1988 and 1989, or generally(Xsjk,t –
—Xs·k,0) where
—Xs·k,0 denotes the 1988–1989 baseline. The
associated coefficients estimate a time-varying school composition effect.We assume that these level 2 coefficients are constant across years andacross schools.
Form effect adjustments. The final version of this model adjusts forform effect associated with 1988 and 1989 tests (Form 7) and for 1990.This is accomplished by incorporating two additional dummies. Thefirst takes on a value of “1” if the test year for a student is 1988 or 1989and “0” at all other times. Similarly, a second dummy variable is coded“1” if the test data are for 1990 and is coded “0” for all other times. Insummary, we adopted the following coding scheme for the trendcomponent (slope) and the form effects (Form 7 and CPS 90):
This results in a final level 2 model for π1 and π
2 of:
(3)
Year
88 89 90 91 92 93 94 95 96
Slope (1991) -2 -2 -1 0 1 2 3 4 5
Form 7 1 1 0 0 0 0 0 0 0
CPS 90 0 0 1 0 0 0 0 0 0

Consortium on Chicago School Research 63
4. School input and gain trend estimates, βk , are expected to vary from oneschool to the next according as:
(4)
Here, the quantities in γ are the systemwide input and gain trendestimates. Across schools, u-N(0, Tβ), and future attempts to identifythe correlates of school performance entails adding plausible school-levelcovariates to this basic level-3 model in a fashion analogous to the level-2model in (3).
Equation (4) yields empirical Bayes estimates of βk for each school. They
are weighted composite estimators that take into account informationabout school k relative to other schools in the system. If the informationfor school k is relatively weak, β
k is shrunk towards the system average γ.
This estimator thus efficiently utilizes all of the available information toprovide predictions for each school.
Discussion of the Estimation Model
Appropriate techniques for research on change have long perplexedbehavioral scientists (see, for example, Harris, 1963). Themethodological studies of Rogosa, Brand, and Zimowski (1982), Rogosaand Willett (1985), and Willett (1988) have greatly clarified theseproblems. Briefly, they demonstrate that if individual growth is linear (orapproximately so), then the gain score is the unbiased estimator of theinstantaneous growth rate. Even if the underlying growth demonstratessome curvature, the gain score will estimate the average growth rate overthe time period of study. In contrast, the covariance model can beseriously biased in studies of school and program effects on individualgrowth (Bryk and Weisberg, 1977).
For these reasons, the analysis model employed in this research isbased on gain scores rather than a covariance adjustment approach. Itdevelops out of the growth modeling strategy explicated in Bryk andRaudenbush (1992). Since we are studying students’ academicdevelopment over a one-year period of time, the use of a gain score seems
1991 input β11k 1 0 0 0 γ
11u
11kinput trend β
12k 0 1 0 0 γ12
u12k
1991 gain β21k 0 0 1 0 γ
21u
21kgain trend β
22k 0 0 0 1 γ22
u22k

Academic Productivity of Chicago Public Elementary Schools64
quite appropriate. We note that over the full 100-point metric,individual growth displays some deceleration at the upper ability levels.Within any grade slice, however, we found no evidence of non-linearityin an analysis of a subset of eight-year longitudinal data on students inthe same schools.
A key to use of a gain score strategy is an appropriate quantitativemetric for measuring change. The content-referenced scale developed inthis research is critical in this regard. Unlike grade equivalents, theequated test score metric yields an interval measurement scale based onthe relative difficulty of the items. Such interval measurement is necessaryfor quantitative studies of change.
We also note that our analysis is based on the latent initial status andgain scores rather than the observed data. This is accomplished by theuse of a measurement model at level 1. The problems of statisticalartifacts due to correlated errors in observed input status and gains arethus eliminated. Also, unlike a covariance model, all of the test dataappears on the left hand side of the equations; as a result, we also avoidthe problems of key adjustor variables that are fallible covariates. This isanother strength of this modeling approach.

Consortium on Chicago School Research 65
DirectorsAnthony S. Bryk, Senior Director
University of Chicago
John Q. Easton, Deputy DirectorUniversity of Chicago
Albert L. BennettRoosevelt University
Penny Bender SebringUniversity of Chicago
Mark A. SmylieUniversity of Illinois at Chicago
Dorothy ShippsUniversity of Chicago
Steering CommitteeRachel W. Lindsey, Co-Chair
Chicago State University
Angela Pérez Miller, Co-ChairLatino Institute
John AyersLeadership for Quality Education
Tariq ButtChicago School Reform Board of Trustees
Michael E. CarlNortheastern Illinois University
Karen G. CarlsonAcademic Accountability Council
Molly A. CarrollChicago Teachers Union
Victoria ChouUniversity of Illinois at Chicago
Joseph HahnChicago Public Schools
Anne C. HallettCross City Campaign
for Urban School Reform
G. Alfred Hess, Jr.Northwestern University
John K. HoltonHarvard School of Public Health
Richard D. LaineIllinois State Board of Education
James H. LewisChicago Urban League
Donald R. MooreDesigns for Change
Jeri NowakowskiNorth Central RegionalEducational Laboratory
Charles M. PayneNorthwestern University
Barbara A. SizemoreDePaul University
Linda S. TafelNational-Louis University
Beverly TunneyChicago Principals and
Administrators Association
Paul G. VallasChicago Public Schools
Mission
The Consortium on Chicago School Research is an independentfederation of Chicago area organizations that conducts researchactivities designed to advance school improvement in Chicago’spublic schools and to assess the progress of school reform. TheConsortium aims to encourage:
• Broad access to the research agenda-setting process;
• Collection and reporting of systematic information on the condi-tion of education in the Chicago Public Schools;
• High standards of quality in research design, data collection, andanalysis; and
• Wide dissemination and discussion of research findings.
Researchers from many different settings who are interested inschooling and its improvement come together under the umbrella ofthe Consortium. Its deliberate multipartisan membership includesfaculty from area universities, leadership from the Chicago PublicSchools, the Chicago Teachers Union, education advocacy groups,the Illinois State Board of Education, and the North Central Re-gional Educational Laboratory, as well as other key civic and profes-sional leaders.
The Consortium views research not just as a technical operation ofgathering data and publishing reports, but as a form of communityeducation. The Consortium does not argue a particular policyposition. Rather, it believes that good policy results from a genuinecompetition of ideas informed by the best evidence that can beobtained. The Consortium works to produce such evidence and toensure that the competition of ideas remains vital.
Academic Productivityof Chicago Public Elementary SchoolsA Technical Report Sponsored by theConsortium on Chicago School Research
http://www.consortium-chicago.org
Consortium on Chicago School Research1313 East 60th Street Chicago, Illinois 60637 (773) 702-3364