Embed Size (px)
Citation preview
Acacia Mining plc
Scotiabank Mining ConferenceNovember 2018
Important Notice
This presentation includes “forward-looking statements” that express or imply expectations of future events or results as opposed to historical facts. These statements include, financial projections and estimates and their underlying assumptions, statements regarding plans, objectives and expectations with respect to future production, operations, costs, projects, and statements regarding future performance. Forward-looking statements are generally identified by the words “plans,” “expects,” “anticipates,” “believes,” “intends,” “estimates” and other similar expressions.
All forward-looking statements involve a number of risks, uncertainties and other factors, many of which are beyond the control of Acacia, which could cause actual results and developments to differ materially from those expressed in, or implied by, the forward-looking statements contained herein. Factors that could cause or contribute to differences between the actual results, performance and achievements of Acacia include, but are not limited to, changes or developments in political, economic or business conditions or national or local legislation or regulation in countries in which Acacia conducts - or may in the future conduct -business, industry trends, competition, fluctuations in the spot and forward price of gold or certain other commodity prices (such as copper and diesel), currency fluctuations (including the US dollar, South African rand, Kenyan shilling and Tanzanian shilling exchange rates), Acacia’s ability to successfully integrate acquisitions, Acacia’s ability to recover its reserves or develop new reserves, including its ability to convert its resources into reserves and its mineral potential into resources or reserves, and to process its mineral reserves successfully and in a timely manner, Acacia’s ability to complete land acquisitions required to support its mining activities, operational or technical difficulties which may occur in the context of mining activities, delays and technical challenges associated with the completion of projects, risk of trespass, theft and vandalism, changes in Acacia’s business strategy and on-going implementation of operational reviews, as well as risks and hazards associated with the business of mineral exploration, development, mining and production and risks and factors affecting the gold mining industry in general.
Although Acacia’s management believes that the expectations reflected in such forward-looking statements are reasonable, Acacia cannot give assurances that
such statements will prove to be correct. Accordingly, investors should not place reliance on forward-looking statements contained in this presentation. Any forward-looking statements in this presentation only reflect information available at the time of preparation. Save as required under the Market Abuse Regulation or otherwise as may be required under applicable law, Acacia explicitly disclaims any obligation or undertaking publicly to update or revise any forward-looking statements in this presentation, whether as a result of new information, future events or otherwise. Nothing in this presentation should be construed as a profit forecast or estimate and no statement made should be interpreted to mean that Acacia’s profits or earnings per share for any future period will necessarily match or exceed its historical published profits or earnings per share.
Any mineral reserves and mineral resources estimates contained in this presentation have been calculated as at 31 December 2017 in accordance with National Instrument 43-101 as required by Canadian securities regulatory authorities. Canadian Institute of Mining, Metallurgy and Petroleum (CIM) definitions were followed for mineral reserves and resources estimates. Any reserves and resources figures stated in this presentation are estimates only. All estimates stated are subject to a variety of unknown factors, risks and considerations, such that no assurances whatsoever can be given that any indicated quantities of metal will be produced. In addition, estimated figures and totals stated may not add up due to rounding.
This presentation is provided for general information purposes only. It does not constitute an invitation or offer to underwrite, subscribe for or otherwise acquire or dispose of any securities of Acacia in any jurisdiction. You are reminded that you have received this presentation on the basis that you are a person to whom this presentation may be lawfully made and delivered. You may not and are not authorised to: (i) reproduce or publish this presentation; or (ii) distribute, disclose or pass on this presentation to any other person, in whole or in part, by any medium or in any form, in breach of any applicable securities laws. BY ACCEPTING THIS PRESENTATION, YOU ACKNOWLEDGE AND AGREE TO THE CONTENTS OF THIS DISCLAIMER AND YOU AGREE TO BE BOUND BY THE FOREGOING LIMITATIONS.
2
Producing mines Exploration properties
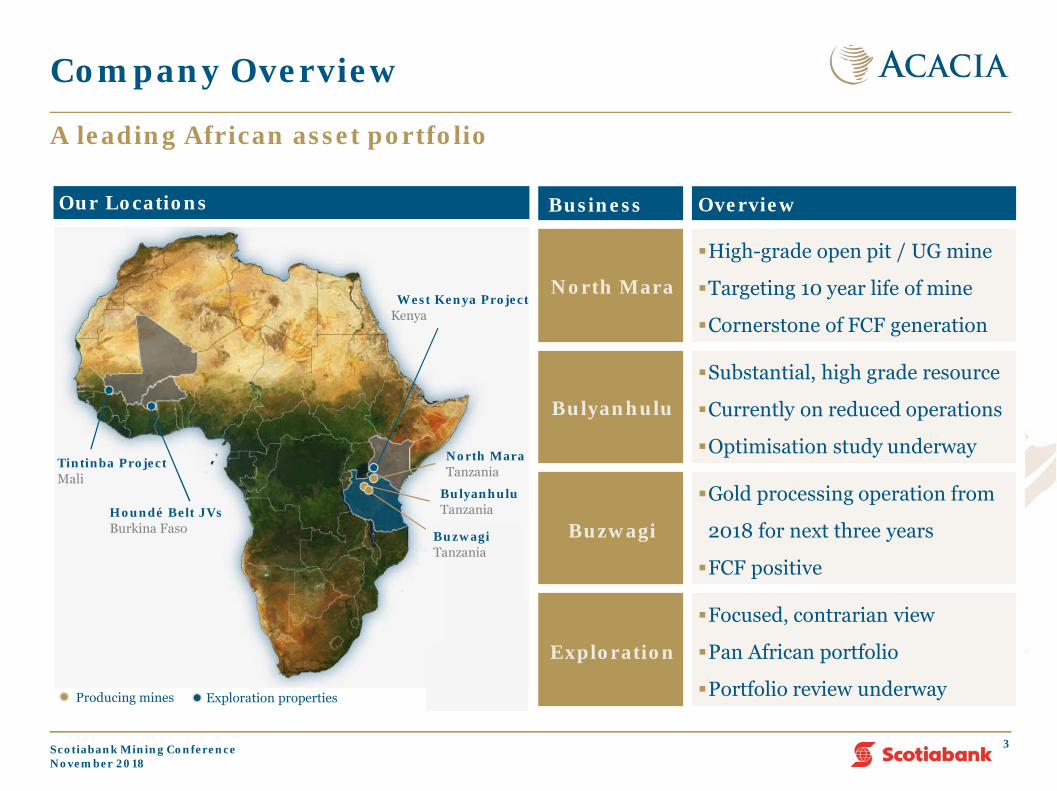
Company Overview
A leading African asset portfolio
Our Locations Business Overview
North Mara
High-grade open pit / UG mine
Targeting 10 year life of mine
Cornerstone of FCF generation
Bulyanhulu
Substantial, high grade resource
Currently on reduced operations
Optimisation study underway
Buzwagi
Gold processing operation from
2018 for next three years
FCF positive
Exploration
Focused, contrarian view
Pan African portfolio
Portfolio review underway
Tintinba ProjectMali
West Kenya ProjectKenya
BulyanhuluTanzaniaHoundé Belt JVs
Burkina Faso
North MaraTanzania
BuzwagiTanzania
3Scotiabank Mining ConferenceNovember 2018
Update on Tanzania
Operating Environment Increasingly Challenging
Discussions between Barrick Gold Corporation and the Tanzanian Government have continued during 2018 Barrick and the Tanzanian Government continued their discussions aimed at agreeing
and documenting the details of the framework they announced in 2017
On the 24 June 2018 Barrick announced that it would not be providing a timetable for the completion of its discussions with the GoT
Acacia has been providing support to Barrick in its discussions with the GoT, but has not been directly involved in those discussions to date
Acacia has not yet received a detailed proposal agreed in principle between Barrick and the GoT for a comprehensive resolution of Acacia’s disputes with the GoT
International arbitrations are underway to protect the businesses and continue to be progressed. The GoT is engaging in the process and recently filed its defence
In recent months the operating environment has become increasingly challenging with criminal charges brought the by GoT against three current Acacia employees and a former employee, three of whom are being held under non-bailable offences
Acacia has reached out to the GoT to request the opportunity for direct dialogue but so far has not received a response
Failing a negotiated resolution Acacia may need to pursue claims under the bilaterialinvestment treaty between the United Republic of Tanzania and the United Kingdom
Acacia is engaging with Barrick to understand Barrick’s proposals for the next steps in its direct discussions with the GoT
5Scotiabank Mining ConferenceNovember 2018
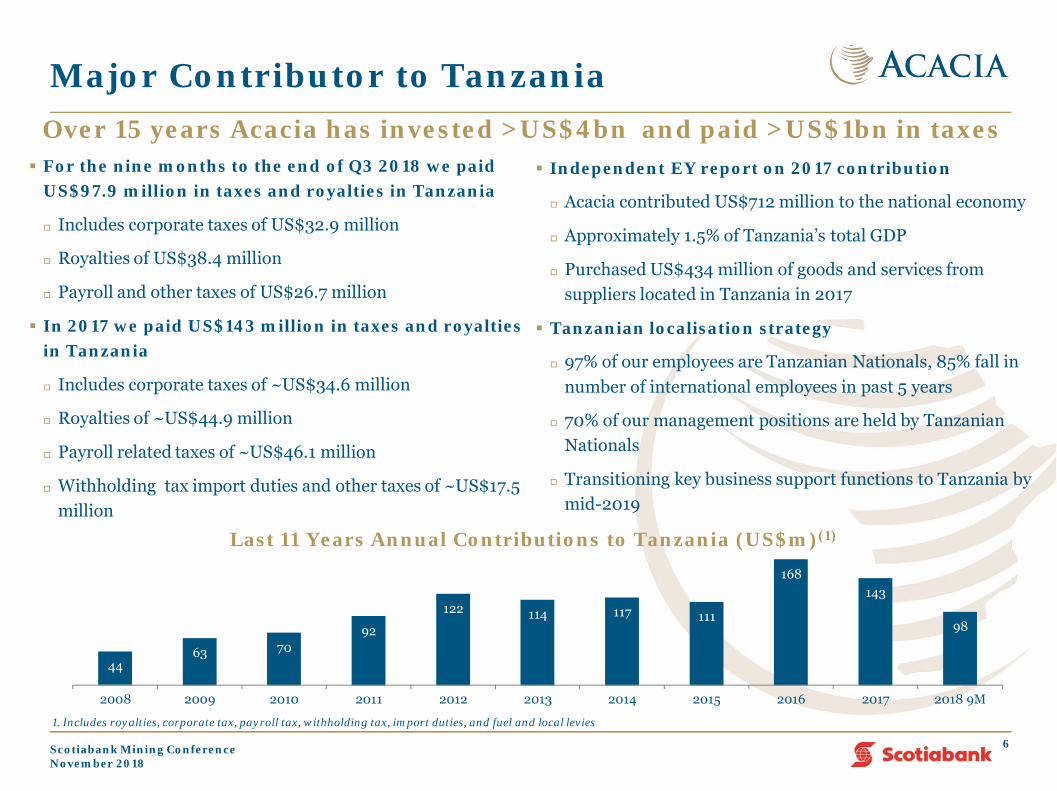
Major Contributor to TanzaniaOver 15 years Acacia has invested >US$4bn and paid >US$1bn in taxes For the nine months to the end of Q3 2018 we paid
US$97.9 million in taxes and royalties in Tanzania
Includes corporate taxes of US$32.9 million
Royalties of US$38.4 million
Payroll and other taxes of US$26.7 million
In 2017 we paid US$143 million in taxes and royalties in Tanzania
Includes corporate taxes of ~US$34.6 million
Royalties of ~US$44.9 million
Payroll related taxes of ~US$46.1 million
Withholding tax import duties and other taxes of ~US$17.5 million
6
Independent EY report on 2017 contribution
Acacia contributed US$712 million to the national economy
Approximately 1.5% of Tanzania’s total GDP
Purchased US$434 million of goods and services from suppliers located in Tanzania in 2017
Tanzanian localisation strategy
97% of our employees are Tanzanian Nationals, 85% fall in number of international employees in past 5 years
70% of our management positions are held by Tanzanian Nationals
Transitioning key business support functions to Tanzania by mid-2019
4463 70
92
122 114 117 111
168143
98
2008 2009 2010 2011 2012 2013 2014 2015 2016 2017 2018 9M
Last 11 Years Annual Contributions to Tanzania (US$m)(1)
1. Includes royalties, corporate tax, payroll tax, withholding tax, import duties, and fuel and local levies
Scotiabank Mining ConferenceNovember 2018
Acacia Contributions into Tanzania
7
(2,000)
(1,000)
0
1,000
2,000
3,000
4,000
5,000Ja
n-96
Jan-
97
Jan-
98
Jan-
99
Jan-
00
Jan-
01
Jan-
02
Jan-
03
Jan-
04
Jan-
05
Jan-
06
Jan-
07
Jan-
08
Jan-
09
Jan-
10
Jan-
11
Jan-
12
Jan-
13
Jan-
14
Jan-
15
Jan-
16
Jan-
17
Jan-
18
Cum
ulat
ive
$'m
Funding GoT Contributions Capital invested
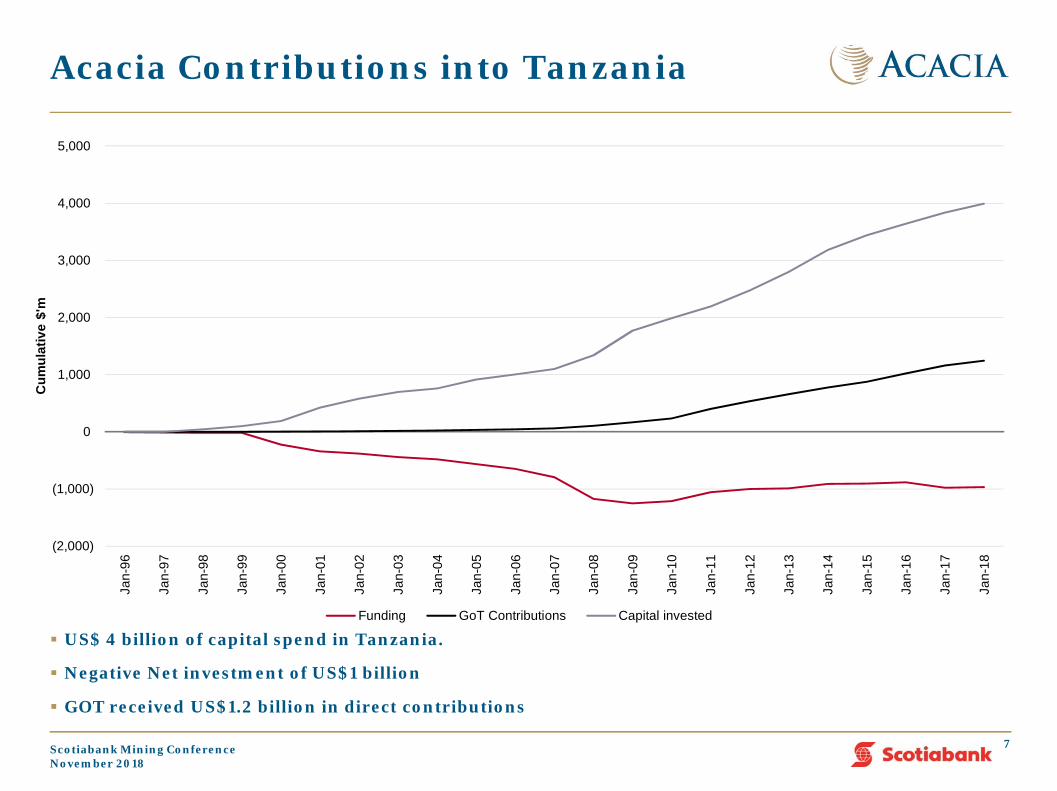
US$ 4 billion of capital spend in Tanzania.
Negative Net investment of US$1 billion
GOT received US$1.2 billion in direct contributions
Scotiabank Mining ConferenceNovember 2018
Contribution to Tanzania
8
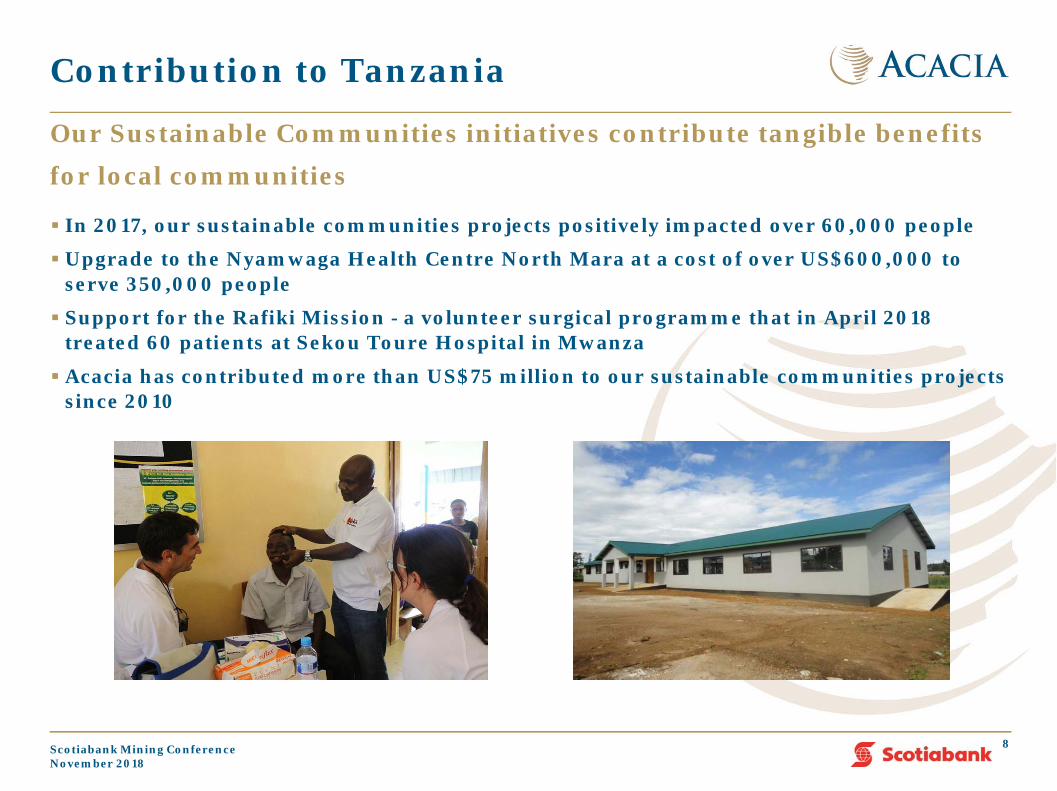
In 2017, our sustainable communities projects positively impacted over 60,000 people
Upgrade to the Nyamwaga Health Centre North Mara at a cost of over US$600,000 to serve 350,000 people
Support for the Rafiki Mission - a volunteer surgical programme that in April 2018 treated 60 patients at Sekou Toure Hospital in Mwanza
Acacia has contributed more than US$75 million to our sustainable communities projects since 2010
Our Sustainable Communities initiatives contribute tangible benefits for local communities
Scotiabank Mining ConferenceNovember 2018
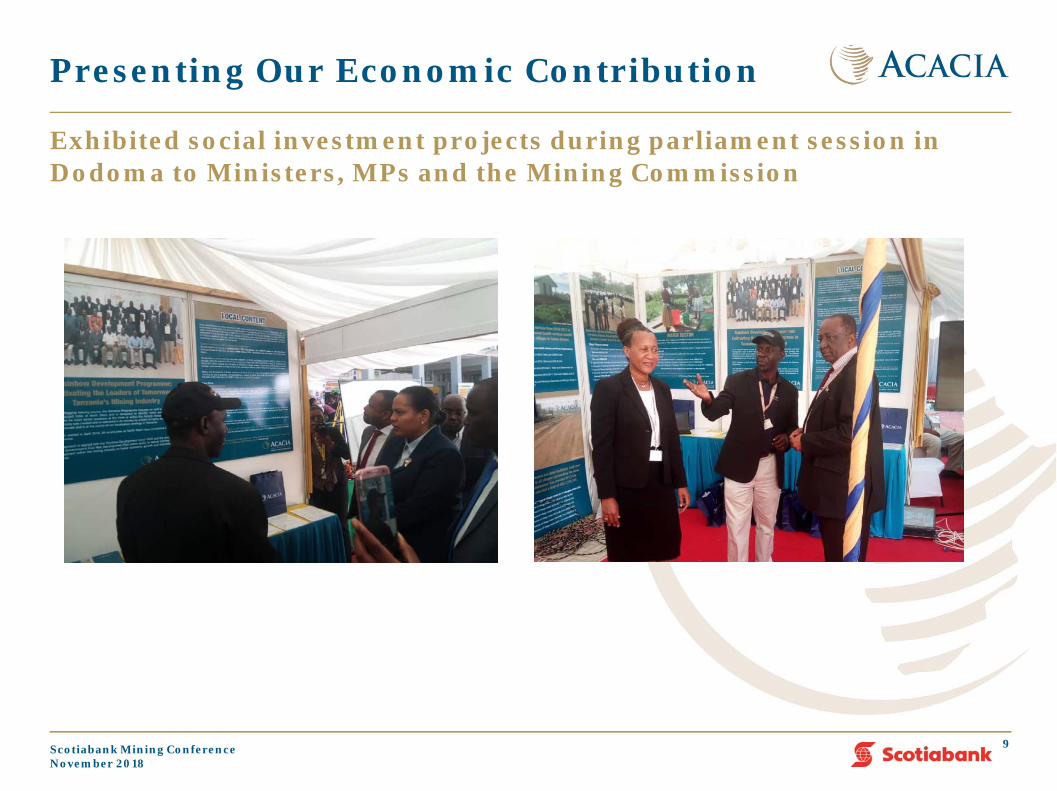
Presenting Our Economic Contribution
9
Exhibited social investment projects during parliament session in Dodoma to Ministers, MPs and the Mining Commission
To
To
Run off and leachate
Scotiabank Mining ConferenceNovember 2018

Operations Review
North Mara
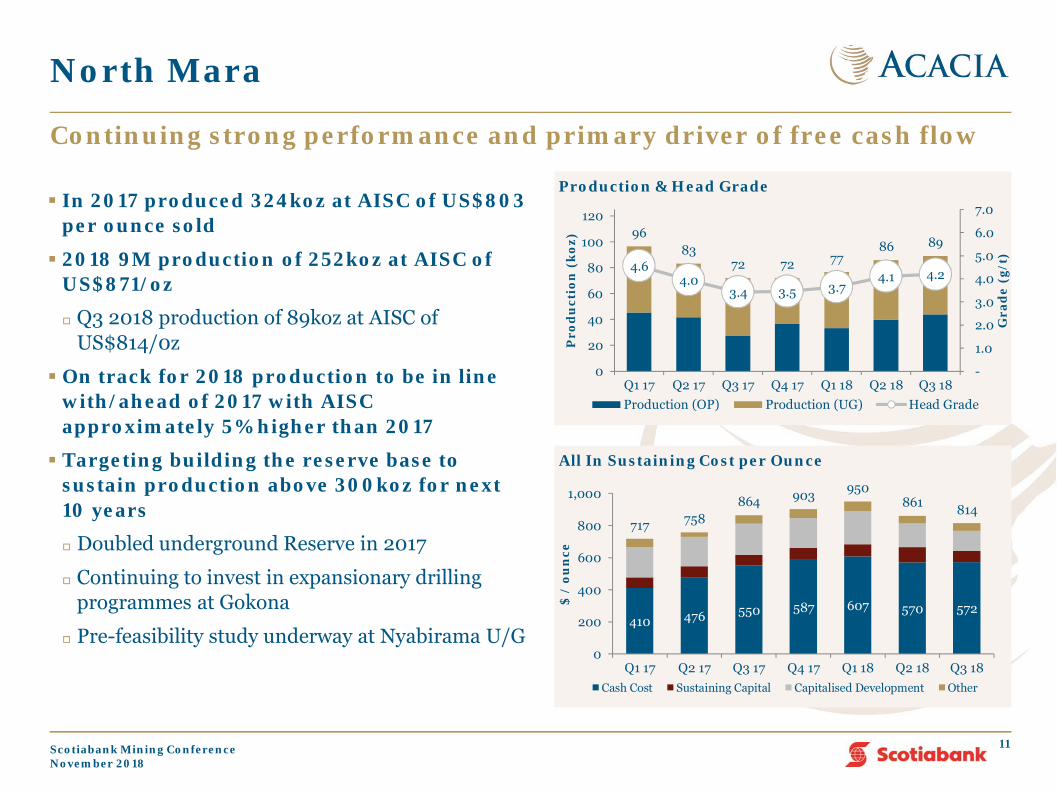
In 2017 produced 324koz at AISC of US$803 per ounce sold
2018 9M production of 252koz at AISC of US$871/oz
Q3 2018 production of 89koz at AISC of US$814/0z
On track for 2018 production to be in line with/ahead of 2017 with AISC approximately 5% higher than 2017
Targeting building the reserve base to sustain production above 300koz for next 10 years
Doubled underground Reserve in 2017
Continuing to invest in expansionary drilling programmes at Gokona
Pre-feasibility study underway at Nyabirama U/G
Continuing strong performance and primary driver of free cash flow
11
9683
72 72 7786 89
4.64.0
3.4 3.5 3.74.1 4.2
-
1.0
2.0
3.0
4.0
5.0
6.0
7.0
0
20
40
60
80
100
120
Q1 17 Q2 17 Q3 17 Q4 17 Q1 18 Q2 18 Q3 18
Gra
de
(g/t
)
Pro
du
ctio
n (
koz)
Production & Head Grade
Production (OP) Production (UG) Head Grade
410 476 550 587 607 570 572
717 758864 903 950
861 814
0
200
400
600
800
1,000
Q1 17 Q2 17 Q3 17 Q4 17 Q1 18 Q2 18 Q3 18
$ /
oun
ce
All In Sustaining Cost per Ounce
Cash Cost Sustaining Capital Capitalised Development Other
Scotiabank Mining ConferenceNovember 2018

Ongoing reserve life extension and continuing to extend high grade mineralisation in the Gokona Underground Central Zone
2018 DrillingUnderground Operational Journey Converted Stage 3 of the Gokona open pit into an
underground operation in 2015 Already exceeded LOM production envisaged in feasibility
study Doubled reserve from 0.6Moz to 1.3Moz during
2017 Drilling programmes are targeting adding
significant resource additions at Gokona over the coming years Further potential along strike at Nyabigena
Gokona Underground – Overview
12
37,000 metres of extension and infill drilling completed during 2018 9M in the West, Central and East zones and further ongoing in Q4 2018
Significant intercepts returned in H1 including:
UGKD453 15.0m @ 13.2 g/t Au from 176m
UGKD457 7.0m @ 53.1 g/t Au from 193m; and
17.0m @ 6.3 g/t Au from 225m
UGKD458 14.6m @ 8.1 g/t Au from 190m and
26.0m @ 4.1 g/t Au from 222m
UGKD463 10.0m @ 7.7 g/t Au from 174m
UGKD472 10.0m @ 14.3 g/t Au from 174m
UGKD448 20.0m @ 8.7 g/t Au from 157m
UGKD476 14.0m @ 9.4g/t Au from 96m; and
10.0m @ 10.9g/t Au from 234m
UGKD479 11.0m @ 3.2g/t from 359m
Note – all drill intersections are down-hole thickness and uncut
*
516 680 656
1,340834
929 937
50468 289
472
2014 2015 2016 2017
Resource Progression (koz)
Reserve Resource Mined Material
Scotiabank Mining ConferenceNovember 2018
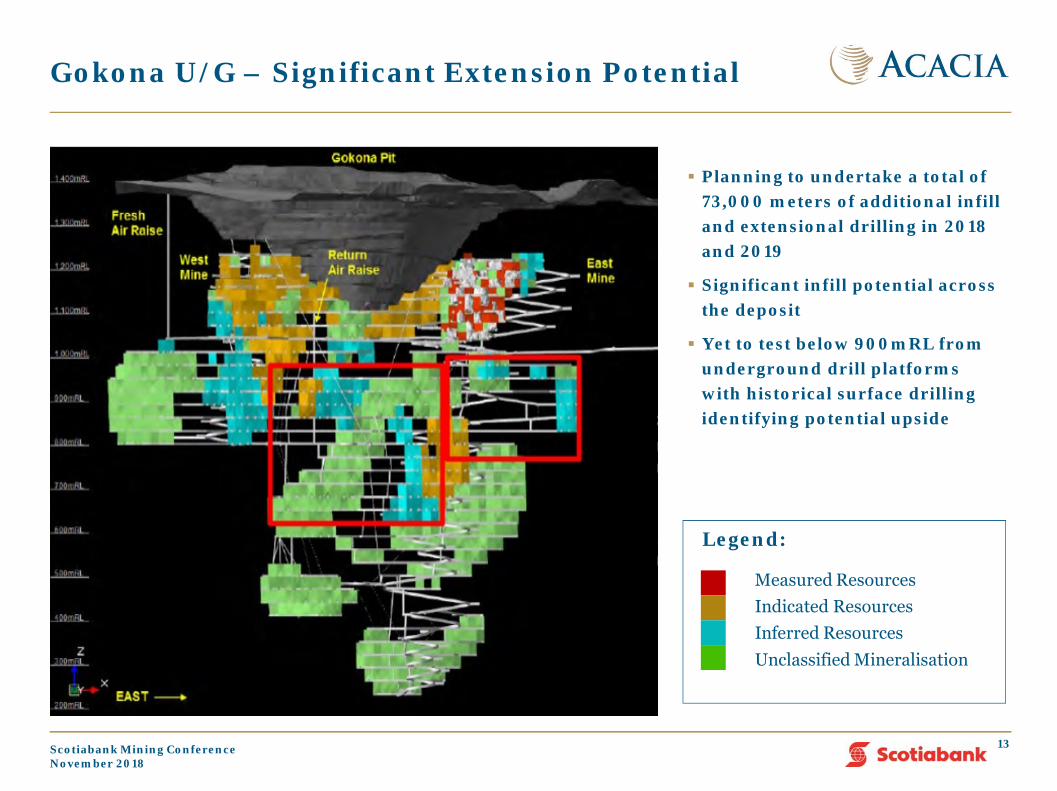
Unclassified Mineralisation
Planning to undertake a total of 73,000 meters of additional infill and extensional drilling in 2018 and 2019
Significant infill potential across the deposit
Yet to test below 900mRL from underground drill platforms with historical surface drilling identifying potential upside
Gokona U/G – Significant Extension Potential
Legend:
Measured ResourcesIndicated ResourcesInferred Resources
13Scotiabank Mining ConferenceNovember 2018
Bulyanhulu
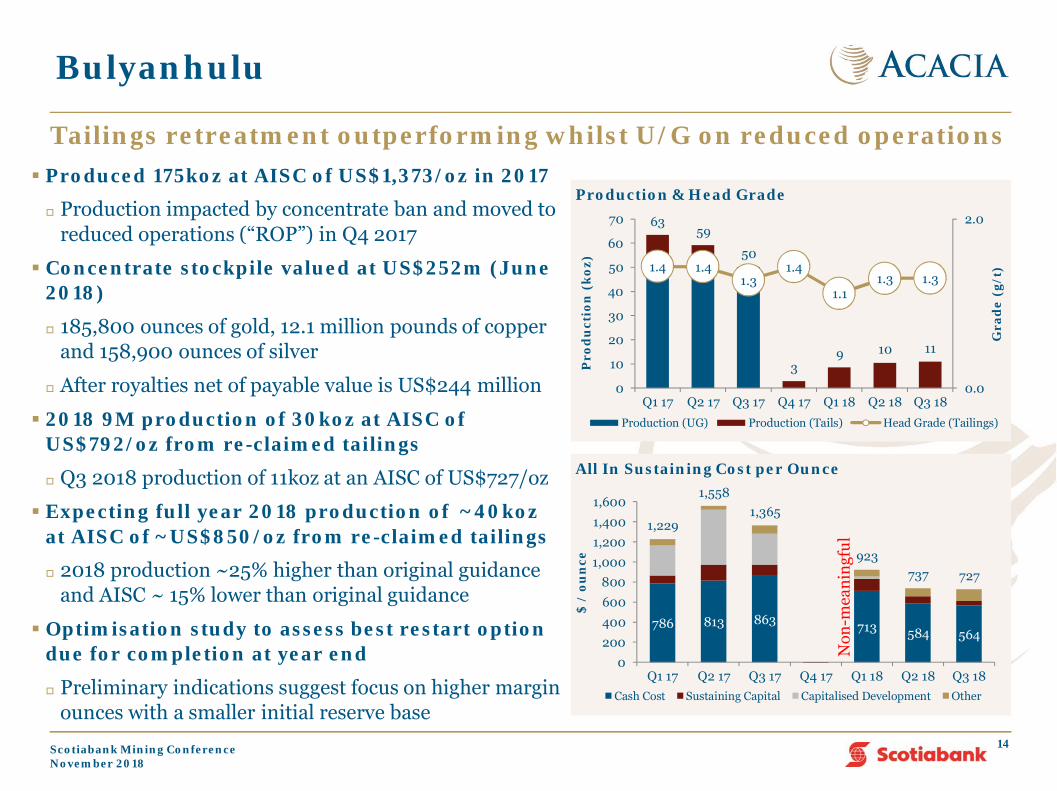
Produced 175koz at AISC of US$1,373/oz in 2017
Production impacted by concentrate ban and moved to reduced operations (“ROP”) in Q4 2017
Concentrate stockpile valued at US$252m (June 2018)
185,800 ounces of gold, 12.1 million pounds of copper and 158,900 ounces of silver
After royalties net of payable value is US$244 million
2018 9M production of 30koz at AISC of US$792/oz from re-claimed tailings
Q3 2018 production of 11koz at an AISC of US$727/oz
Expecting full year 2018 production of ~40koz at AISC of ~US$850/oz from re-claimed tailings
2018 production ~25% higher than original guidance and AISC ~ 15% lower than original guidance
Optimisation study to assess best restart option due for completion at year end
Preliminary indications suggest focus on higher margin ounces with a smaller initial reserve base
Tailings retreatment outperforming whilst U/G on reduced operations
14
6359
50
39 10 11
1.4 1.41.3
1.4
1.11.3 1.3
0.0
2.0
0
10
20
30
40
50
60
70
Q1 17 Q2 17 Q3 17 Q4 17 Q1 18 Q2 18 Q3 18
Gra
de
(g/t
)
Pro
du
ctio
n (
koz)
Production & Head Grade
Production (UG) Production (Tails) Head Grade (Tailings)
786 813 863 713 584 564
1,229
1,5581,365
923737 727
0200400600800
1,0001,2001,4001,600
Q1 17 Q2 17 Q3 17 Q4 17 Q1 18 Q2 18 Q3 18
$ /
oun
ce
All In Sustaining Cost per Ounce
Cash Cost Sustaining Capital Capitalised Development Other
Non
-mea
ning
ful
Scotiabank Mining ConferenceNovember 2018
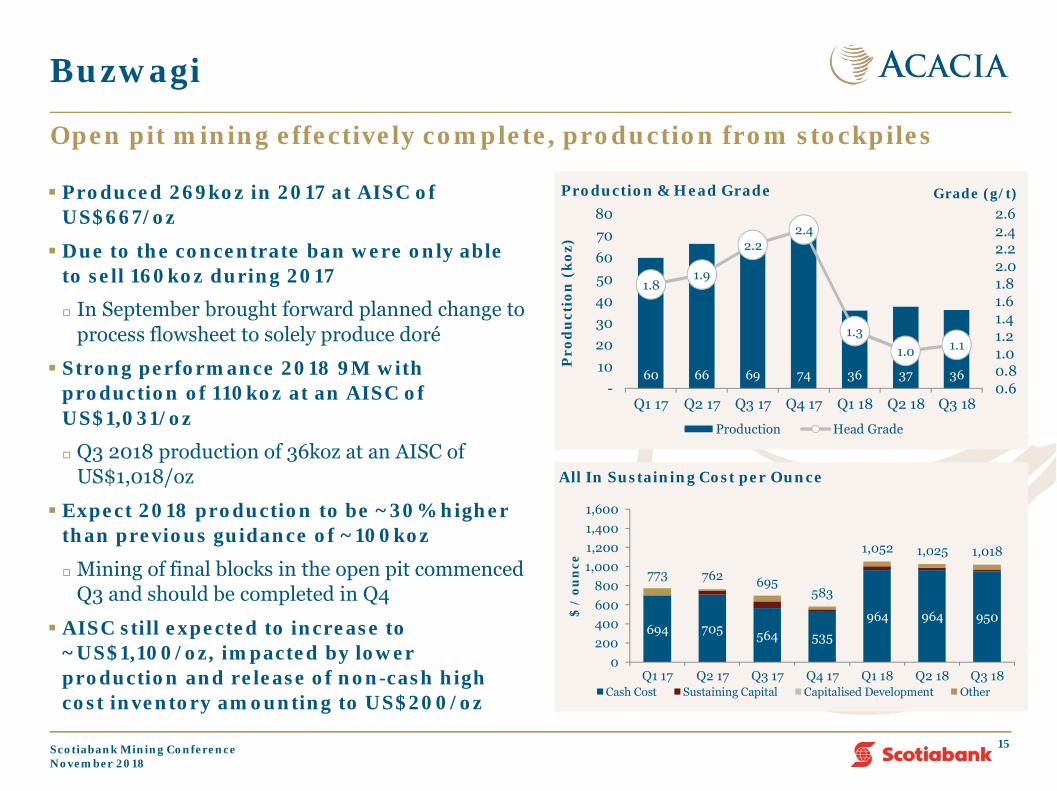
Produced 269koz in 2017 at AISC of US$667/oz
Due to the concentrate ban were only able to sell 160koz during 2017
In September brought forward planned change to process flowsheet to solely produce doré
Strong performance 2018 9M with production of 110koz at an AISC of US$1,031/oz
Q3 2018 production of 36koz at an AISC of US$1,018/oz
Expect 2018 production to be ~30% higher than previous guidance of ~100koz
Mining of final blocks in the open pit commenced Q3 and should be completed in Q4
AISC still expected to increase to ~US$1,100/oz, impacted by lower production and release of non-cash high cost inventory amounting to US$200/oz
Buzwagi
Open pit mining effectively complete, production from stockpiles
15
60 66 69 74 36 37 36
1.81.9
2.22.4
1.31.0 1.1
0.60.81.01.21.41.61.82.02.22.42.6
-1020304050607080
Q1 17 Q2 17 Q3 17 Q4 17 Q1 18 Q2 18 Q3 18
Grade (g/t)
Pro
du
ctio
n (
koz)
Production & Head Grade
Production Head Grade
694 705 564 535
964 964 950
773 762 695583
1,052 1,025 1,018
0200400600800
1,0001,2001,4001,600
Q1 17 Q2 17 Q3 17 Q4 17 Q1 18 Q2 18 Q3 18
$ /
oun
ce
All In Sustaining Cost per Ounce
Cash Cost Sustaining Capital Capitalised Development Other
Scotiabank Mining ConferenceNovember 2018
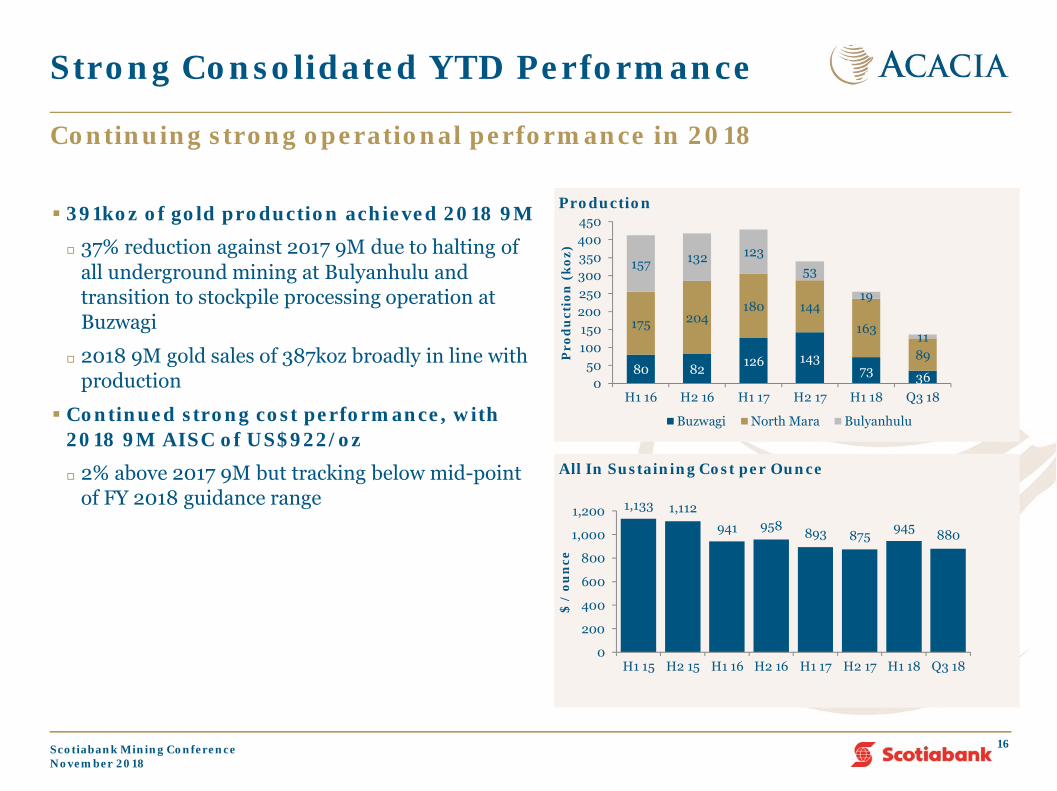
Strong Consolidated YTD Performance
391koz of gold production achieved 2018 9M
37% reduction against 2017 9M due to halting of all underground mining at Bulyanhulu and transition to stockpile processing operation at Buzwagi
2018 9M gold sales of 387koz broadly in line with production
Continued strong cost performance, with 2018 9M AISC of US$922/oz
2% above 2017 9M but tracking below mid-point of FY 2018 guidance range
Continuing strong operational performance in 2018
16
800
80 82 126 14373 36
175 204180 144
163
89
157 132 12353
19
11
050
100150200250300350400450
H1 16 H2 16 H1 17 H2 17 H1 18 Q3 18
Pro
du
ctio
n (
koz)
Production
Buzwagi North Mara Bulyanhulu
1,133 1,112941 958 893 875
945 880
0
200
400
600
800
1,000
1,200
H1 15 H2 15 H1 16 H2 16 H1 17 H2 17 H1 18 Q3 18
$ /
oun
ce
All In Sustaining Cost per Ounce
Scotiabank Mining ConferenceNovember 2018
Financial Review
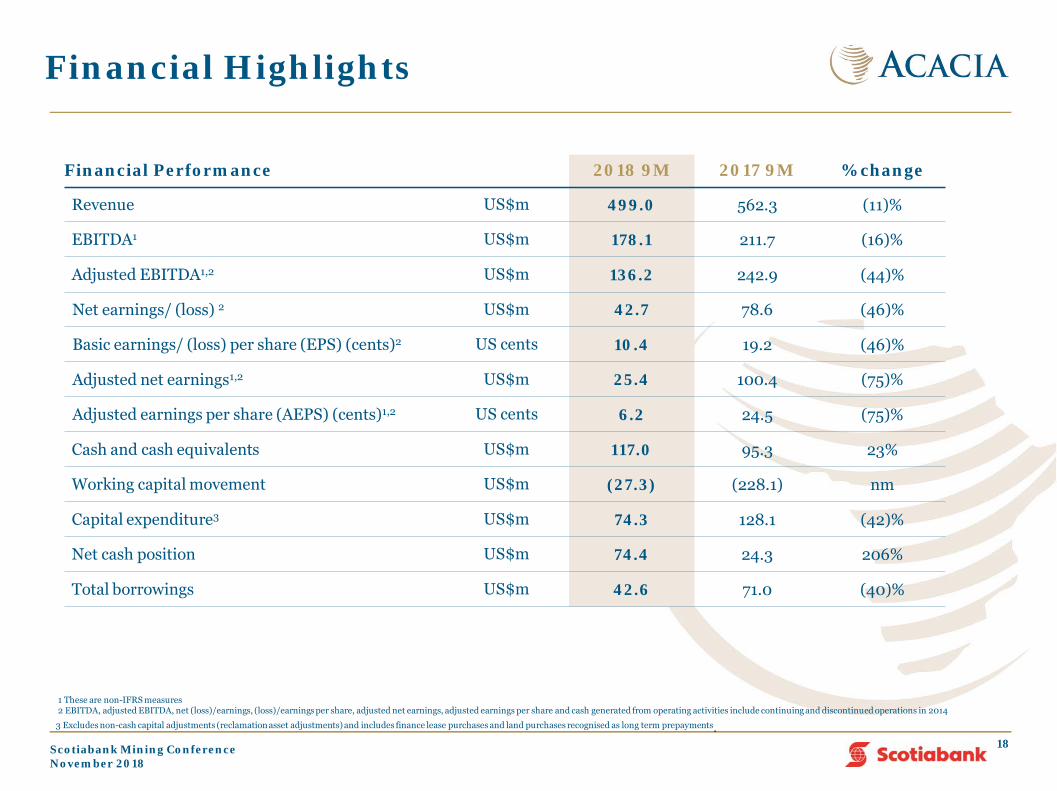
Financial Highlights
1 These are non-IFRS measures2 EBITDA, adjusted EBITDA, net (loss)/earnings, (loss)/earnings per share, adjusted net earnings, adjusted earnings per share and cash generated from operating activities include continuing and discontinued operations in 2014
3 Excludes non-cash capital adjustments (reclamation asset adjustments) and includes finance lease purchases and land purchases recognised as long term prepayments.
Financial Performance 2018 9M 2017 9M % change
Revenue US$m 499.0 562.3 (11)%
EBITDA1 US$m 178.1 211.7 (16)%
Adjusted EBITDA1,2 US$m 136.2 242.9 (44)%
Net earnings/ (loss) 2 US$m 42.7 78.6 (46)%
Basic earnings/ (loss) per share (EPS) (cents)2 US cents 10.4 19.2 (46)%
Adjusted net earnings1,2 US$m 25.4 100.4 (75)%
Adjusted earnings per share (AEPS) (cents)1,2 US cents 6.2 24.5 (75)%
Cash and cash equivalents US$m 117.0 95.3 23%
Working capital movement US$m (27.3) (228.1) nm
Capital expenditure3 US$m 74.3 128.1 (42)%
Net cash position US$m 74.4 24.3 206%
Total borrowings US$m 42.6 71.0 (40)%
18Scotiabank Mining ConferenceNovember 2018
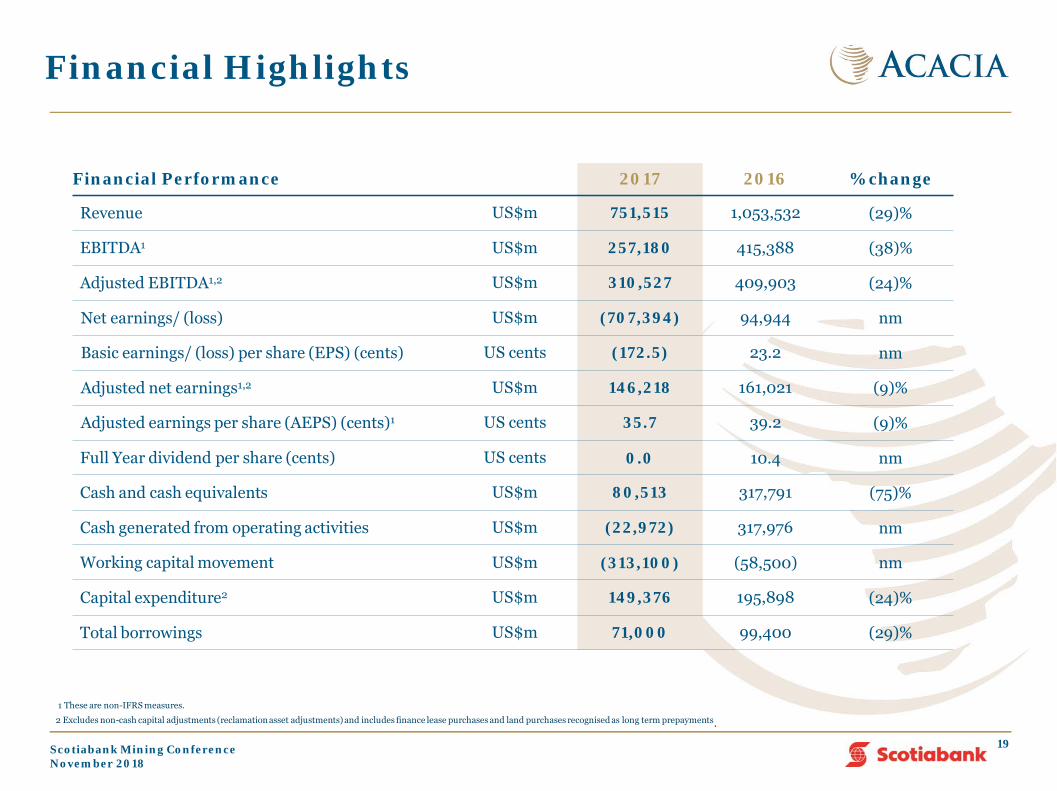
Financial Highlights
1 These are non-IFRS measures.
2 Excludes non-cash capital adjustments (reclamation asset adjustments) and includes finance lease purchases and land purchases recognised as long term prepayments.
Financial Performance 2017 2016 % change
Revenue US$m 751,515 1,053,532 (29)%
EBITDA1 US$m 257,180 415,388 (38)%
Adjusted EBITDA1,2 US$m 310,527 409,903 (24)%
Net earnings/ (loss) US$m (707,394) 94,944 nm
Basic earnings/ (loss) per share (EPS) (cents) US cents (172.5) 23.2 nm
Adjusted net earnings1,2 US$m 146,218 161,021 (9)%
Adjusted earnings per share (AEPS) (cents)1 US cents 35.7 39.2 (9)%
Full Year dividend per share (cents) US cents 0.0 10.4 nm
Cash and cash equivalents US$m 80,513 317,791 (75)%
Cash generated from operating activities US$m (22,972) 317,976 nm
Working capital movement US$m (313,100) (58,500) nm
Capital expenditure2 US$m 149,376 195,898 (24)%
Total borrowings US$m 71,000 99,400 (29)%
19Scotiabank Mining ConferenceNovember 2018
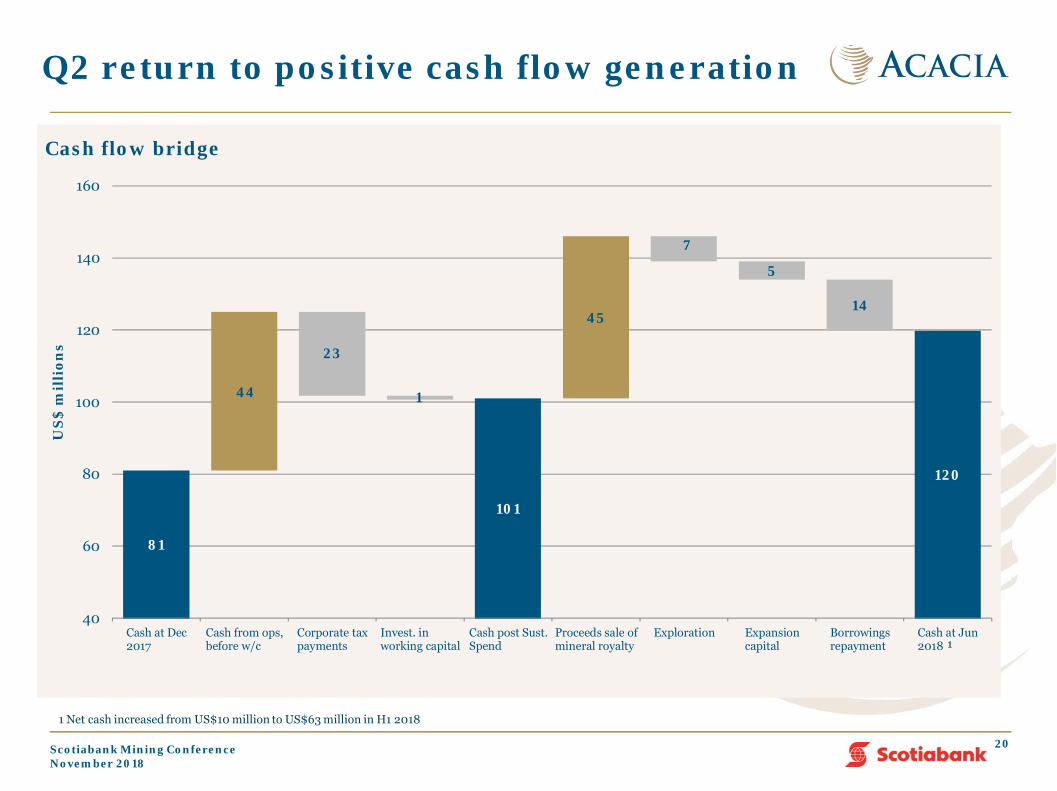
Q2 return to positive cash flow generation
1,100 to 1,175
20
Discretionary spend / non-recurring spend
81
44
23
1
101
45
7
5
14
120
40
60
80
100
120
140
160
Cash at Dec2017
Cash from ops,before w/c
Corporate taxpayments
Invest. inworking capital
Cash post Sust.Spend
Proceeds sale ofmineral royalty
Exploration Expansioncapital
Borrowingsrepayment
Cash at Jun2018
US
$ m
illi
ons
Cash flow bridge
1
1 Net cash increased from US$10 million to US$63 million in H1 2018
Scotiabank Mining ConferenceNovember 2018
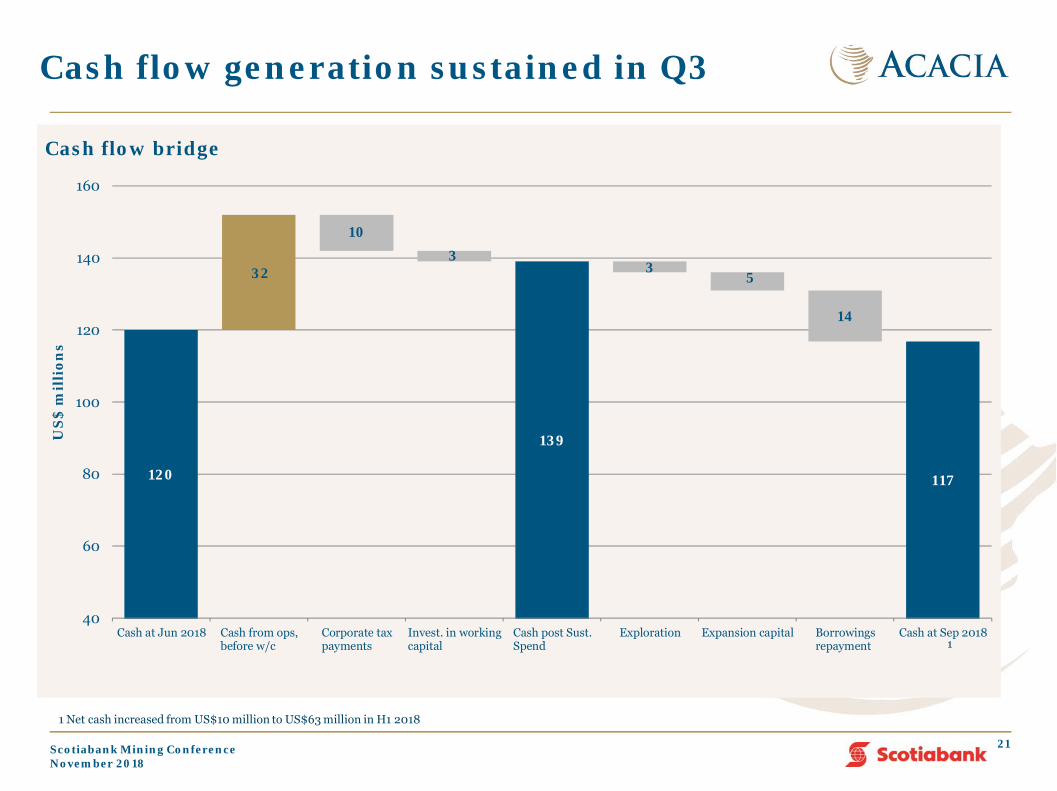
Cash flow generation sustained in Q3
1,100 to 1,175
21
Discretionary spend / non-recurring spend
120
32
103
139
35
14
117
40
60
80
100
120
140
160
Cash at Jun 2018 Cash from ops,before w/c
Corporate taxpayments
Invest. in workingcapital
Cash post Sust.Spend
Exploration Expansion capital Borrowingsrepayment
Cash at Sep 2018
US
$ m
illi
ons
Cash flow bridge
1
1 Net cash increased from US$10 million to US$63 million in H1 2018
Scotiabank Mining ConferenceNovember 2018
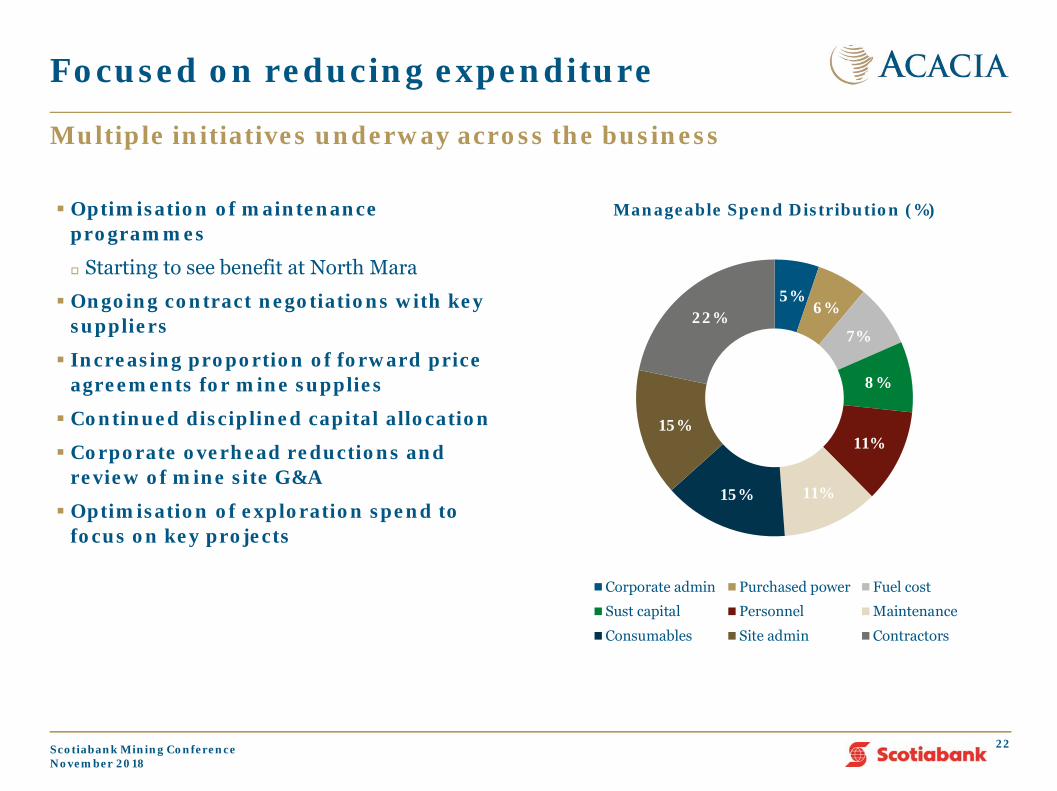
Focused on reducing expenditure
Optimisation of maintenance programmes
Starting to see benefit at North Mara
Ongoing contract negotiations with key suppliers
Increasing proportion of forward price agreements for mine supplies
Continued disciplined capital allocation
Corporate overhead reductions and review of mine site G&A
Optimisation of exploration spend to focus on key projects
22
Multiple initiatives underway across the business
5%6%
7%
8%
11%
11%15%
15%
22%
Manageable Spend Distribution (%)
Corporate admin Purchased power Fuel cost
Sust capital Personnel Maintenance
Consumables Site admin Contractors
Scotiabank Mining ConferenceNovember 2018
Discovery
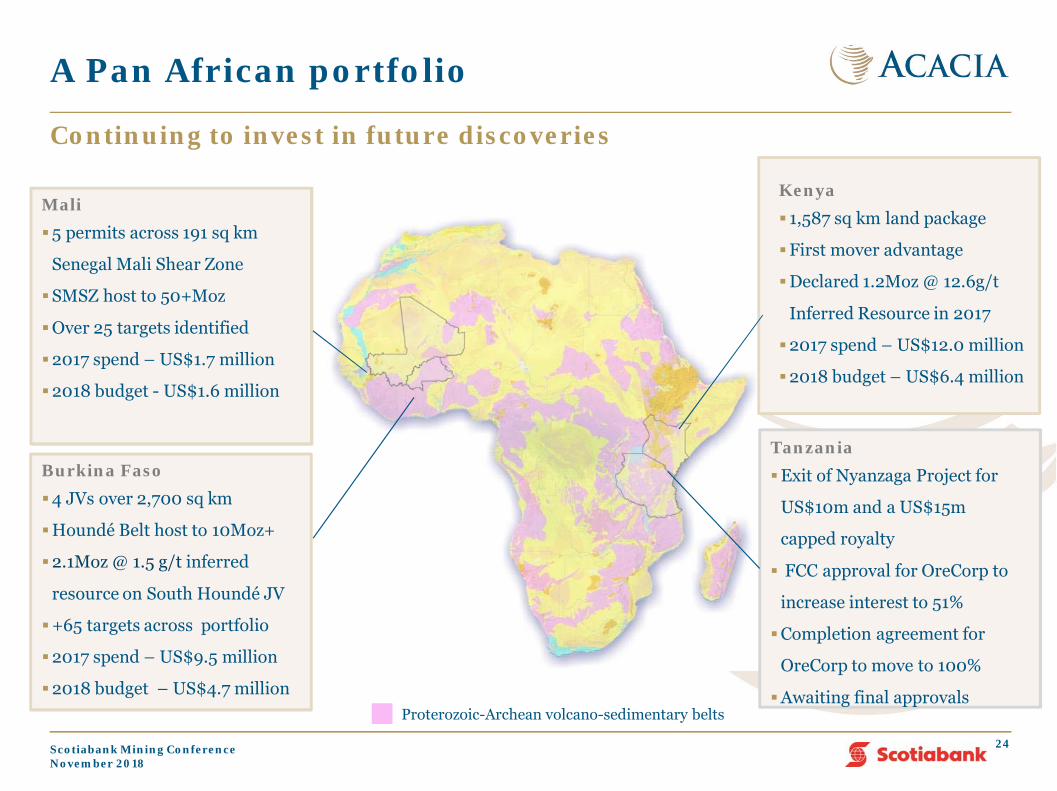
A Pan African portfolio
Mali5 permits across 191 sq km
Senegal Mali Shear Zone
SMSZ host to 50+Moz
Over 25 targets identified
2017 spend – US$1.7 million
2018 budget - US$1.6 million
Kenya 1,587 sq km land package
First mover advantage
Declared 1.2Moz @ 12.6g/t
Inferred Resource in 2017
2017 spend – US$12.0 million
2018 budget – US$6.4 million
Burkina Faso4 JVs over 2,700 sq km
Houndé Belt host to 10Moz+
2.1Moz @ 1.5 g/t inferred
resource on South Houndé JV
+65 targets across portfolio
2017 spend – US$9.5 million
2018 budget – US$4.7 million
Continuing to invest in future discoveries
24
TanzaniaExit of Nyanzaga Project for
US$10m and a US$15m
capped royalty
FCC approval for OreCorp to
increase interest to 51%
Completion agreement for
OreCorp to move to 100%
Awaiting final approvalsProterozoic-Archean volcano-sedimentary belts
Scotiabank Mining ConferenceNovember 2018
Outlook
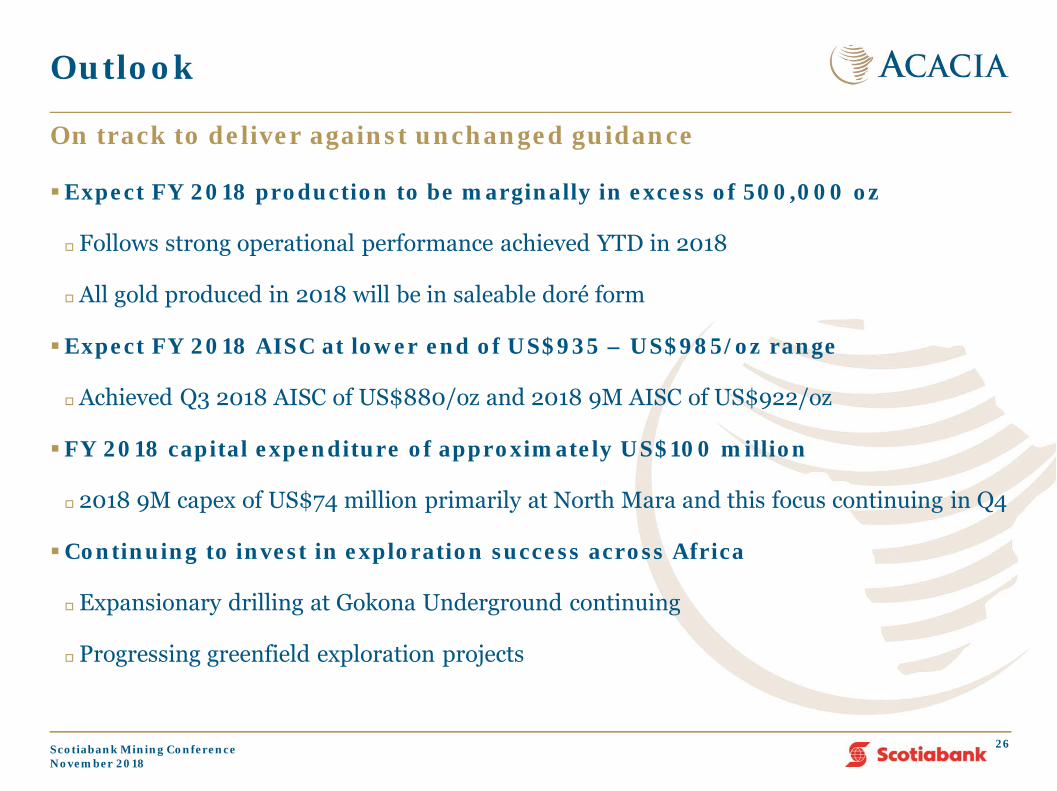
Expect FY 2018 production to be marginally in excess of 500,000 oz
Follows strong operational performance achieved YTD in 2018
All gold produced in 2018 will be in saleable doré form
Expect FY 2018 AISC at lower end of US$935 – US$985/oz range
Achieved Q3 2018 AISC of US$880/oz and 2018 9M AISC of US$922/oz
FY 2018 capital expenditure of approximately US$100 million
2018 9M capex of US$74 million primarily at North Mara and this focus continuing in Q4
Continuing to invest in exploration success across Africa
Expansionary drilling at Gokona Underground continuing
Progressing greenfield exploration projects
On track to deliver against unchanged guidance
26
Outlook
Scotiabank Mining ConferenceNovember 2018
Management team has successfully stabilised the business in 2018
Assets continue to deliver despite the headwinds they face
On track to achieve > 500,000 oz of gold production in 2018
Business returned to free cash flow generation in Q2 2018 for the first time since Q4 2016 and this continued in Q3
Net cash increased to US$74 million as at end Q3 2018
Priority remains on optimising performance with emphasis on strong cost discipline
Successfully managing through the uncertainty in the operating environment
Continue to demonstrate our commitment to Tanzania
Looking for a comprehensive settlement that is acceptable to all stakeholders
Strong operational performance this year following successful stabilisation of the business
27
Conclusion
Scotiabank Mining ConferenceNovember 2018
Appendix
Operating EnvironmentOperating MetricsExploration & Development
Timeline of Events in 2017
29
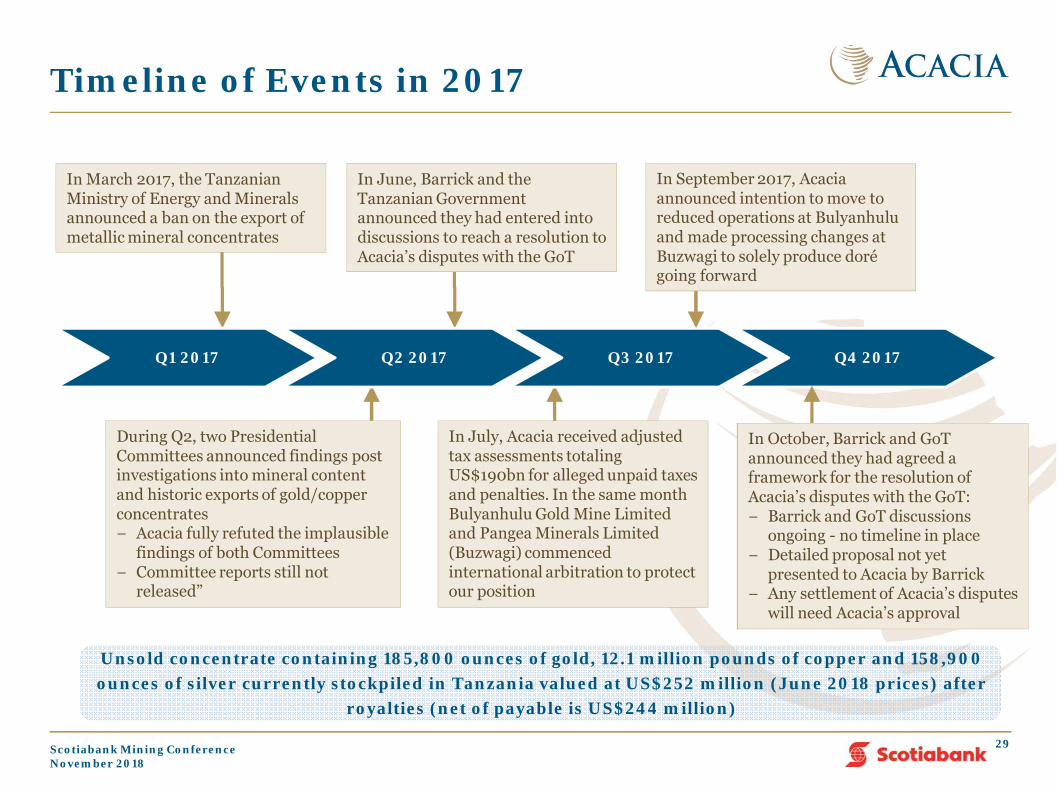
During Q2, two Presidential Committees announced findings post investigations into mineral content and historic exports of gold/copper concentrates− Acacia fully refuted the implausible
findings of both Committees − Committee reports still not
released”
In March 2017, the Tanzanian Ministry of Energy and Minerals announced a ban on the export of metallic mineral concentrates
In July, Acacia received adjusted tax assessments totaling US$190bn for alleged unpaid taxes and penalties. In the same month Bulyanhulu Gold Mine Limited and Pangea Minerals Limited (Buzwagi) commenced international arbitration to protect our position
In June, Barrick and the Tanzanian Government announced they had entered into discussions to reach a resolution to Acacia’s disputes with the GoT
Unsold concentrate containing 185,800 ounces of gold, 12.1 million pounds of copper and 158,900 ounces of silver currently stockpiled in Tanzania valued at US$252 million (June 2018 prices) after
royalties (net of payable is US$244 million)
Q1 2017 Q2 2017 Q3 2017 Q4 2017
In September 2017, Acacia announced intention to move to reduced operations at Bulyanhulu and made processing changes at Buzwagi to solely produce doré going forward
In October, Barrick and GoTannounced they had agreed a framework for the resolution of Acacia’s disputes with the GoT:− Barrick and GoT discussions
ongoing - no timeline in place− Detailed proposal not yet
presented to Acacia by Barrick − Any settlement of Acacia’s disputes
will need Acacia’s approval
Scotiabank Mining ConferenceNovember 2018
Tanzanian Legislative Changes
Following publication of Second Presidential Committee’s findings three new bills were presented to the Tanzanian Parliament in late June, on three days notice
These made a number of changes to the operating environment for Tanzania’s extractive industries with respect to Government ownership, royalties, VAT application, local beneficiation and removal of international legal recourse, amongst others
In July 2017, all legislation came into force and some terms of the Acts are being applied
We are monitoring the impact of the new legislation in light of our legal rights under our Mineral Development Agreements with the Government
To enable sale of doré to continue, we are paying under protest increased royalty rates of 6% and a separate 1% “clearing fee” on exports, without prejudice to our legal rights under our MDAs
In July 2017, Acacia subsidiaries served arbitration notices for Bulyanhulu and Buzwagi
A necessary step to protect the businesses in light of the ongoing disputes with the GoT and the new legislation, although preferred outcome remains a negotiated resolution
In January 2018, new regulations to implement the new laws were issued which seek to impose a broad range of obligations on mining licence holders – Acacia is reserving its position with respect to its legal rights under the MDAs
These include giving preference to Tanzanian employees, suppliers and subcontractors, submitting subcontracts to Government review, conducting financial operations only through Tanzanian bank accounts, and preparing plans to increase the “local content” of many aspects of operations
30
Sector-wide legislation introduced during 2017
Scotiabank Mining ConferenceNovember 2018
Appendix
Operating EnvironmentOperating MetricsExploration & Development

Bulyanhulu* North Mara Buzwagi Group
2018 9M 2017 9M 2018 9M 2017 9M 2018 9M 2017 9M 2018 9M 2017 9M
Key operational information:
Ounces produced oz 29,863 172,636 251,976 251,589 109,560 195,181 391,399 619,406
Ounces sold oz 30,700 107,479 248,345 252,715 107,875 85,032 386,920 445,225
Cash cost per ounce sold US$/oz 617 812 582 473 960 647 690 588
AISC per ounce sold US$/oz 792 1,346 871 774 1,031 742 922 907
Copper production klbs - 3,906 - - - 8,991 - 12,897
Underground:
Ore tonnes trammed/hoisted kt - 596 573 501 - - 573 1,097
Open Pit:
Tonnes mined kt - - 11,849 11,727 179 13,823 12,601 26,647
Ore Tonnes mined kt - - 2,021 2,349 170 7,988 2,764 11,433
Processing information:
Ore milled kt 1,402 1,517 2,119 2,133 3,421 3,215 6,943 6,864
Head grade g/t 1.2 4.3 4.0 4.0 1.1 2.0 2.0 3.1
Mill recovery % 53.7% 81.6% 92.8% 92.2% 89.7% 95.7% 87.1% 90.0%
2018 9M Operating Metrics
• Bulyanhulu mining and processing information represent ROM and tailings reprocessing in 2017 and tailing reprocessing only in 2018 following the mine being placed on reduced operations in Q4 2017.
32Scotiabank Mining ConferenceNovember 2018
Appendix
Operating MetricsExploration & Development
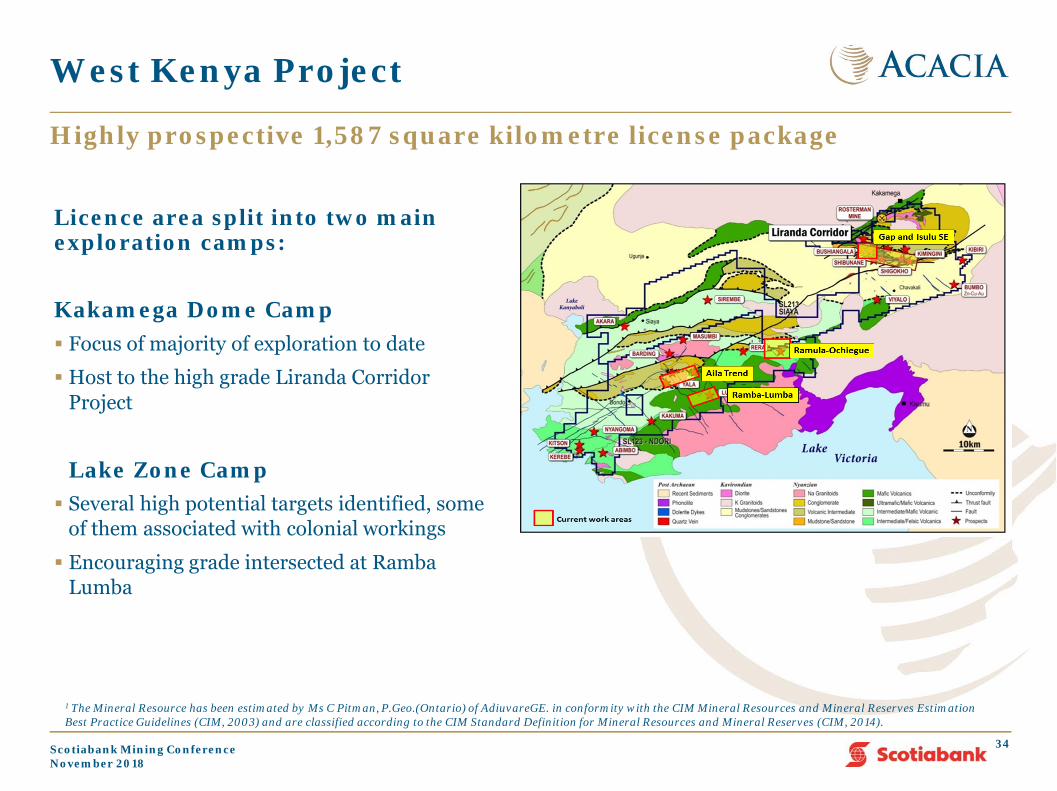
West Kenya Project
Highly prospective 1,587 square kilometre license package
34
Licence area split into two main exploration camps:
Kakamega Dome Camp Focus of majority of exploration to date
Host to the high grade Liranda Corridor Project
Lake Zone Camp Several high potential targets identified, some
of them associated with colonial workings
Encouraging grade intersected at Ramba Lumba
1 The Mineral Resource has been estimated by Ms C Pitman, P.Geo.(Ontario) of AdiuvareGE. in conformity with the CIM Mineral Resources and Mineral Reserves Estimation Best Practice Guidelines (CIM, 2003) and are classified according to the CIM Standard Definition for Mineral Resources and Mineral Reserves (CIM, 2014).
Scotiabank Mining ConferenceNovember 2018
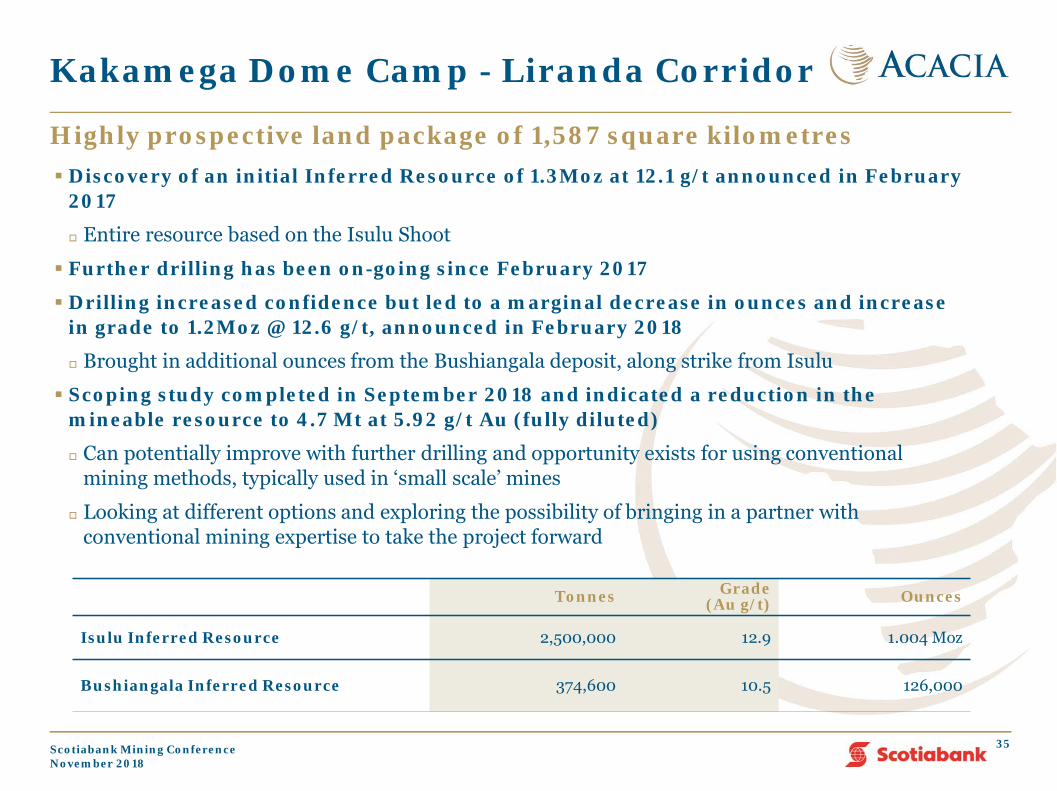
Kakamega Dome Camp - Liranda Corridor
Highly prospective land package of 1,587 square kilometres
35
Discovery of an initial Inferred Resource of 1.3Moz at 12.1 g/t announced in February 2017
Entire resource based on the Isulu Shoot
Further drilling has been on-going since February 2017
Drilling increased confidence but led to a marginal decrease in ounces and increase in grade to 1.2Moz @ 12.6 g/t, announced in February 2018
Brought in additional ounces from the Bushiangala deposit, along strike from Isulu
Scoping study completed in September 2018 and indicated a reduction in the mineable resource to 4.7 Mt at 5.92 g/t Au (fully diluted)
Can potentially improve with further drilling and opportunity exists for using conventional mining methods, typically used in ‘small scale’ mines
Looking at different options and exploring the possibility of bringing in a partner with conventional mining expertise to take the project forward
Tonnes Grade(Au g/t) Ounces
Isulu Inferred Resource 2,500,000 12.9 1.004 Moz
Bushiangala Inferred Resource 374,600 10.5 126,000
Scotiabank Mining ConferenceNovember 2018
Lake Zone - Ramba Lumba Target
36
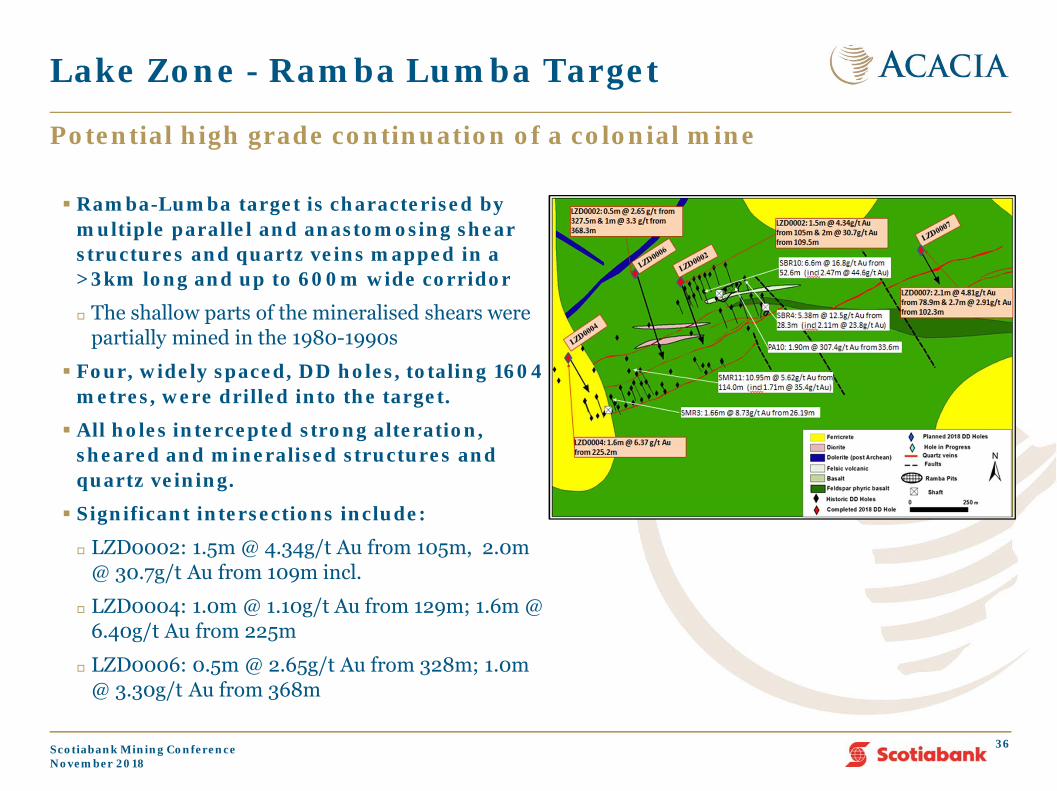
Potential high grade continuation of a colonial mine
Ramba-Lumba target is characterised by multiple parallel and anastomosing shear structures and quartz veins mapped in a >3km long and up to 600m wide corridor
The shallow parts of the mineralised shears were partially mined in the 1980-1990s
Four, widely spaced, DD holes, totaling 1604 metres, were drilled into the target.
All holes intercepted strong alteration, sheared and mineralised structures and quartz veining.
Significant intersections include:
LZD0002: 1.5m @ 4.34g/t Au from 105m, 2.0m @ 30.7g/t Au from 109m incl.
LZD0004: 1.0m @ 1.10g/t Au from 129m; 1.6m @ 6.40g/t Au from 225m
LZD0006: 0.5m @ 2.65g/t Au from 328m; 1.0m @ 3.30g/t Au from 368m
Scotiabank Mining ConferenceNovember 2018
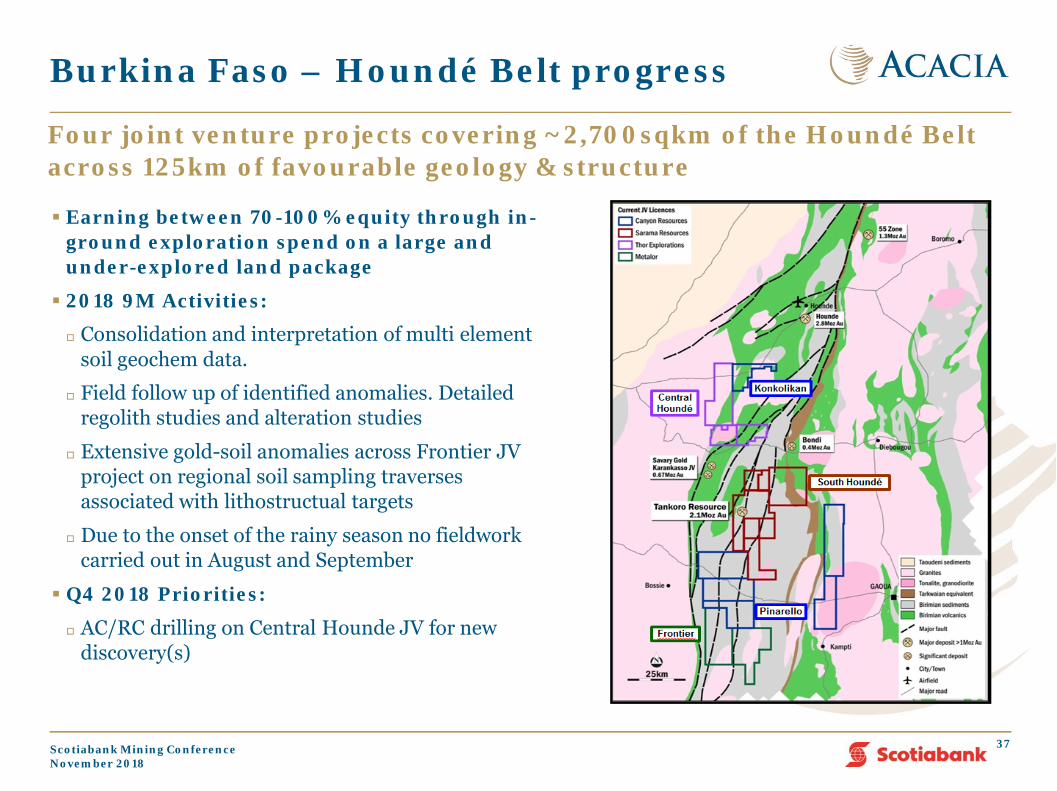
Earning between 70-100% equity through in-ground exploration spend on a large and under-explored land package
2018 9M Activities:
Consolidation and interpretation of multi element soil geochem data.
Field follow up of identified anomalies. Detailed regolith studies and alteration studies
Extensive gold-soil anomalies across Frontier JV project on regional soil sampling traverses associated with lithostructual targets
Due to the onset of the rainy season no fieldwork carried out in August and September
Q4 2018 Priorities:
AC/RC drilling on Central Hounde JV for new discovery(s)
Burkina Faso – Houndé Belt progress
Four joint venture projects covering ~2,700sqkm of the Houndé Belt across 125km of favourable geology & structure
37Scotiabank Mining ConferenceNovember 2018
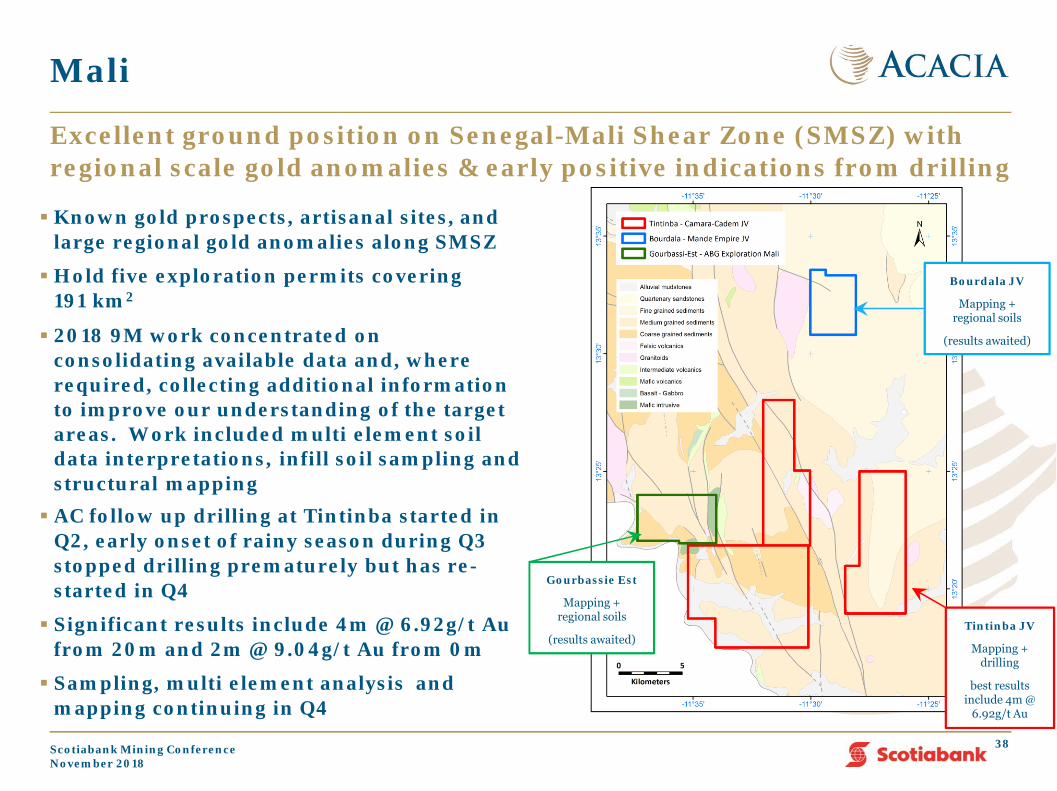
Mali
Excellent ground position on Senegal-Mali Shear Zone (SMSZ) with regional scale gold anomalies & early positive indications from drilling
Known gold prospects, artisanal sites, and large regional gold anomalies along SMSZ
Hold five exploration permits covering 191 km2
2018 9M work concentrated on consolidating available data and, where required, collecting additional information to improve our understanding of the target areas. Work included multi element soil data interpretations, infill soil sampling and structural mapping AC follow up drilling at Tintinba started in
Q2, early onset of rainy season during Q3 stopped drilling prematurely but has re-started in Q4
Significant results include 4m @ 6.92g/t Au from 20m and 2m @ 9.04g/t Au from 0m
Sampling, multi element analysis and mapping continuing in Q4
38
Gourbassie Est
Mapping + regional soils
(results awaited)Tintinba JV
Mapping + drilling
best resultsinclude 4m @
6.92g/t Au
Bourdala JV
Mapping + regional soils
(results awaited)
Scotiabank Mining ConferenceNovember 2018
Contact
Sally MarshakGeneral Manager, Investor Relations & CommunicationsAcacia Mining plc5th Floor, No1. Cavendish PlaceLondon, W1G 0QFTelephone: +44 (0) 20 7129 7160Mobile: +44 (0) 75 2580 7953Email: [email protected]: www.acaciamining.com
39Scotiabank Mining ConferenceNovember 2018