Embed Size (px)
DESCRIPTION
ACA Enrollment 2015
Citation preview

Department of Health and Human Services Office of the Assistant Secretary for Planning and Evaluation
http://aspe.hhs.gov
ASPE ISSUE BRIEF
HEALTH INSURANCE MARKETPLACES 2015 OPEN ENROLLMENT PERIOD:
MARCH ENROLLMENT REPORT1
For the period: November 15, 2014 – February 15, 2015
(Including Additional Special Enrollment Period Activity Reported through 2-22-15)2
March 10, 20153
The Health Insurance Marketplaces (“the Marketplaces”) play a critical role in achieving one of
the Affordable Care Act’s core goals: reducing the number of uninsured Americans by
providing affordable, high-quality health insurance. This report provides summary data for
enrollment-related activity in the individual market Marketplaces during the 2015 Open
Enrollment period for all 50 states and the District of Columbia (11-15-14 to 2-15-15), including
data relating to individuals who qualified for an “in-line” or other Special Enrollment Period
(SEP). (Unless otherwise noted, the data in this report include SEP activity through 2-22-15).4 It
is important to note that this report does not include data on effectuated enrollment (that the
number of people who have paid monthly premiums to the insurer). Additionally, this report
does not include data relating to any individuals who qualified for an SEP after 2-22-15,
including any upcoming SEP for individuals who were unaware of, or did not understand the
implications of the fee for not enrolling in health insurance coverage.5 6
1 As additional data are available from special enrollment periods extending into April, this data will be provided. 2 Most of the data in this report are for the 11-15-14 to 2-15-15 reporting period (including additional special enrollment period
(SEP) activity reported through Sunday, February 22nd), with the following exceptions: the data for the State-Based
Marketplaces (SBMs) that are using their own Marketplace platforms include additional SEP activity through 2-21-15 (with the
exception of California, which is reporting data including additional SEP activity through 2-22-15). 3 This report has been updated with more complete age and gender distribution data for the HealthCare.gov states, as of 8-13-15. 4 The SEP for individuals who were “in-line” on 2-15-15 ended on 2-22-15 for the states that are using the HealthCare.gov
platform. Most of the SBMs that are using their own Marketplace platforms allowed individuals who started the process before 2-
15-15, but could not finish, to complete the application and select a plan by varying dates, mostly within February, with the
exception of Colorado, which allowed applicants through March 2 to complete their applications, and Washington, which
allowed applicants to enroll through April 17. Vermont has indicated that the state will assist consumers with enrollment if they
report a problem trying to enroll, but did not provide for a formal extension period. 5 CMS recently announced a special enrollment period (SEP) for tax season. For individuals and families in the HealthCare.gov
states who did not have health coverage in 2014 and are subject to the fee or “shared responsibility payment” when they file their
2014 taxes. For those who were unaware or did not understand the implications of the fee for not enrolling in coverage, CMS will
provide consumers with an opportunity to purchase health insurance coverage from March 15 to April 30, 2015. (For additional
information, see http://www.cms.gov/Newsroom/MediaReleaseDatabase/Press-releases/2015-Press-releases-items/2015-02-
20.html). 6 Most of the SBMs that are using their own Marketplace platforms also announced an SEP for individuals and families that were
unaware or did not understand the implications of the fee for not enrolling in coverage, but the timeframes for the SEP varied
among the states.

ASPE Issue Brief Page 2
ASPE Office of Health Policy March 2015
Section I of the report focuses on the 37 states that are using the HealthCare.gov platform for the 2015 Open Enrollment period (also known as “HealthCare.gov states”) and covers the
period 11-15-2014 to 2-15-2015, including activity that was reported through 2-22-15 associated
with enrollment through a Special Enrollment Period (SEP).7 The data on SEP activity include
information for those who qualified for an SEP because they were “in line” on 2-15-15, as well
as those who qualified for an SEP for other reasons with coverage that was effective on March 1,
2015.8
The 37 HealthCare.gov states include 35 states that used the HealthCare.gov platform in both
2014 and 2015 and Oregon and Nevada, which are new to the HealthCare.gov platform in 2015.9
These 37 states account for 76 percent (8.8 million) of the total plan selections through the
Marketplaces in this report.
The data available for these states include plan selections through the Marketplaces for new
consumers and those that are reenrolling in coverage. The reenrollee data include separate
breakouts for consumers who actively reenrolled in coverage through the Marketplaces (i.e.,
people who returned to the Marketplaces to select a new plan or actively renew their existing
plan),10
and consumers who were automatically reenrolled into coverage. The report also
includes the number of reenrollees who switched plans, as well as updated data on several
metrics related to the impact of the advance premium tax credit on net premium costs.11
The data included in this report cover the same reporting period as the Week 14 Weekly
Enrollment Snapshot for the 37 HealthCare.gov states, and the metrics that are reported in both
places are generally consistent (see Appendix Table D1 for additional information on how the
data in this report compare with the data in the Week 14 Weekly Enrollment Snapshot).12
This
report also includes data relating to completed applications, eligibility determinations, website
visitors, and call center activity for the HealthCare.gov states; data on the overall distribution of
plan selections through the Marketplaces in these states by gender, age, metal level, financial
assistance status (i.e., whether the consumer has been determined eligible for advance premium
tax credits and/or cost-sharing reductions), race/ethnicity, rural status, household income.
7 This report has been updated with more complete age distribution data for the HealthCare.gov states, as of 6-29-15. 8 This includes persons who had a qualifying life event that qualifies them for an SEP (such as a change in marital status, a
change in dependents, or losing minimum essential health coverage), or a complex situation related to applying for coverage in
the Marketplace. Additional information on Marketplace SEPs can be found at https://www.healthcare.gov/how-can-i-get-
coverage-outside-of-open-enrollment/#part=2. 9 For more information about data on plan selections through the Marketplaces for the 2014 coverage year, please see the 2014
Open Enrollment Period Marketplace Summary Enrollment Report, which can be accessed at
http://aspe.hhs.gov/health/reports/2014/MarketPlaceEnrollment/Apr2014/ib_2014Apr_enrollment.pdf. 10 Active reenrollees includes individuals who actively selected a 2015 plan through the Marketplaces prior to the 12-15-14
deadline for coverage beginning on January 1st, as well as those who returned to the Marketplaces and selected a plan after
having initially been automatically reenrolled. 11 For additional information about these premium-related metrics, please see “Health Insurance Marketplace 2015: Average
Premiums After Advance Premium Tax Credits through January 30 in 37 States Using the HealthCare.gov Platform,” ASPE
Research Brief, U.S. Department of Health and Human Services, February 9, 2015. Available at:
http://aspe.hhs.gov/health/reports/2015/MarketPlaceEnrollment/APTC/ib_APTC.pdf. 12 The Centers for Medicare & Medicaid Services published weekly Open Enrollment snapshots that provided preliminary point-
in-time estimates for weekly data that could fluctuate based on consumers changing or canceling plans or having a change in
status such as a new job or marriage; data revisions may mean that the weekly totals from the snapshots may not sum to the
cumulative numbers. The weekly snapshots can be accessed at http://www.hhs.gov/healthcare/facts/blog/index.html.

ASPE Issue Brief Page 3
ASPE Office of Health Policy March 2015
Section II of the report focuses on the 14 states (including the District of Columbia) that are
operating their own Marketplace platforms for 2015 (see page 20). Most of the 14 states include
activity for the period 11-15-2014 to 2-15-2015 (including activity associated with individuals
who qualified for a SEP that was reported through 2-21-2015, except for California where data
on SEP activity extend through 2-22-2015). These 14 states account for 24 percent (2.8 million)
of plan selections through the Marketplaces in this report. The data available for these states
include new consumers and reenrollees (please see Appendix Table D2 for additional
information on the data on plan selections through the Marketplaces that are available for various
states). Data are available for certain states relating to completed applications, eligibility
determinations, website visitors, call center activity; and the overall distribution of plan
selections through the Marketplaces by gender, age, metal level, financial assistance status, and
reenrollment status (See Appendix Table D3 for a summary of which additional metrics are
available for each state).
ASPE Issue Brief Page 4
ASPE Office of Health Policy March 2015
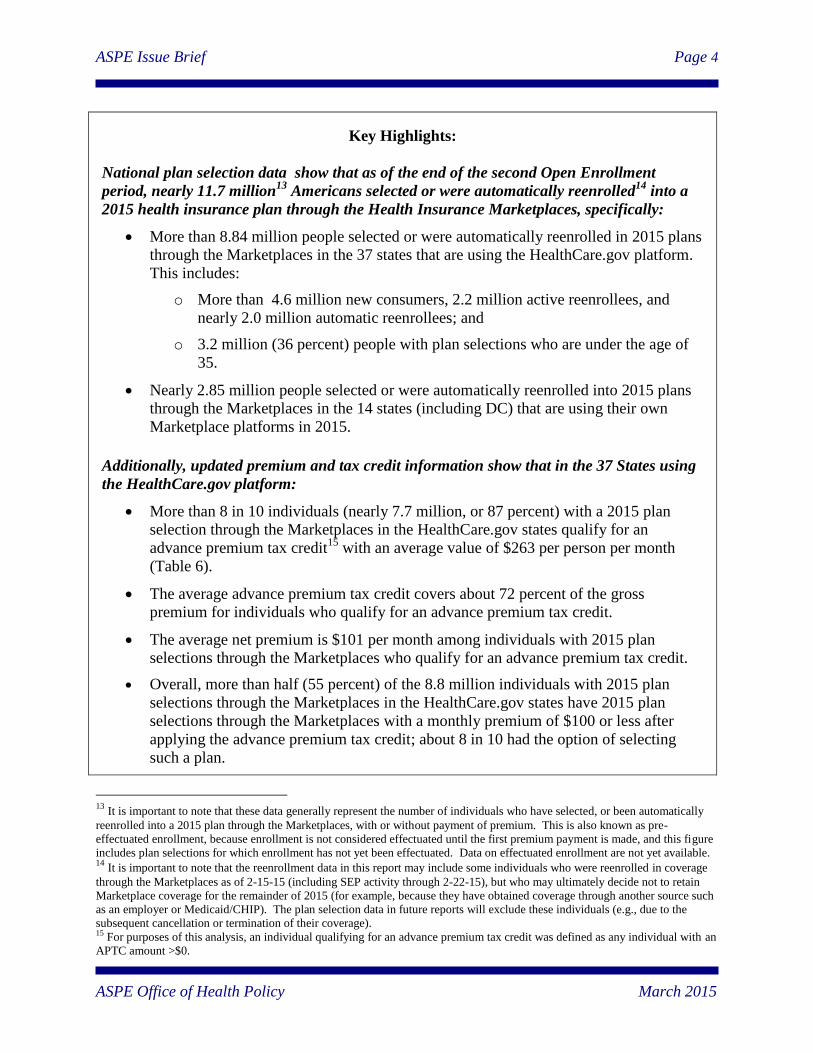
Key Highlights:
National plan selection data show that as of the end of the second Open Enrollment
period, nearly 11.7 million13
Americans selected or were automatically reenrolled14
into a
2015 health insurance plan through the Health Insurance Marketplaces, specifically:
More than 8.84 million people selected or were automatically reenrolled in 2015 plans
through the Marketplaces in the 37 states that are using the HealthCare.gov platform.
This includes:
o More than 4.6 million new consumers, 2.2 million active reenrollees, and
nearly 2.0 million automatic reenrollees; and
o 3.2 million (36 percent) people with plan selections who are under the age of
35.
Nearly 2.85 million people selected or were automatically reenrolled into 2015 plans
through the Marketplaces in the 14 states (including DC) that are using their own
Marketplace platforms in 2015.
Additionally, updated premium and tax credit information show that in the 37 States using
the HealthCare.gov platform:
More than 8 in 10 individuals (nearly 7.7 million, or 87 percent) with a 2015 plan
selection through the Marketplaces in the HealthCare.gov states qualify for an
advance premium tax credit15
with an average value of $263 per person per month
(Table 6).
The average advance premium tax credit covers about 72 percent of the gross
premium for individuals who qualify for an advance premium tax credit.
The average net premium is $101 per month among individuals with 2015 plan
selections through the Marketplaces who qualify for an advance premium tax credit.
Overall, more than half (55 percent) of the 8.8 million individuals with 2015 plan
selections through the Marketplaces in the HealthCare.gov states have 2015 plan
selections through the Marketplaces with a monthly premium of $100 or less after
applying the advance premium tax credit; about 8 in 10 had the option of selecting
such a plan.
13
It is important to note that these data generally represent the number of individuals who have selected, or been automatically
reenrolled into a 2015 plan through the Marketplaces, with or without payment of premium. This is also known as pre-
effectuated enrollment, because enrollment is not considered effectuated until the first premium payment is made, and this figure
includes plan selections for which enrollment has not yet been effectuated. Data on effectuated enrollment are not yet available. 14
It is important to note that the reenrollment data in this report may include some individuals who were reenrolled in coverage
through the Marketplaces as of 2-15-15 (including SEP activity through 2-22-15), but who may ultimately decide not to retain
Marketplace coverage for the remainder of 2015 (for example, because they have obtained coverage through another source such
as an employer or Medicaid/CHIP). The plan selection data in future reports will exclude these individuals (e.g., due to the
subsequent cancellation or termination of their coverage). 15 For purposes of this analysis, an individual qualifying for an advance premium tax credit was defined as any individual with an
APTC amount >$0.

ASPE Issue Brief Page 5
ASPE Office of Health Policy March 2015
Table 1
Key Statistics Relating to the Marketplaces
Reporting Period:
11-15-14 to
2-15-15 (including SEP Activity Thru
2-22-15)
Total 2015 Plan Selections in the Marketplaces 11,688,074
2015 Plan Selections in the Marketplaces in States Using
the HealthCare.gov Platform (1) 8,838,291
2015 Plan Selections in the Marketplaces in State-Based
Marketplaces Using Their Own Marketplace Platforms (2) 2,849,783
Notes:
(1) The data for the States using the HealthCare.gov platform are for 11-15-2014 to 2-15-2015, including SEP activity
through 2-22-15.
(2) The data for most of the States using their own Marketplace platforms are for 11-15-2014 to 2-15-2015, including SEP
activity through 2-21-15 (however, the data for CA include SEP activity through 2-22-15).
SECTION I. DATA FOR THE 37 STATES USING THE HEALTHCARE.GOV
PLATFORM
• More Than 4.6 Million People Who Did Not Have Marketplace Coverage at the
Beginning of the 2015 Open Enrollment Period Selected Plans Through the
Marketplaces.
More than 8.84 million individuals have selected or been automatically reenrolled into a
2015 plan through the Marketplaces as of 2-15-15 in HealthCare.gov states (see Table 2).
Of that total, 53 percent (more than 4.6 million) are plan selections by new consumers
who did not have a plan selection through the Marketplaces as of November 2014,16
and
47 percent (nearly 4.2 million) are plan selections for consumers who are reenrolling in
coverage through the Marketplaces.
• Many of the Consumers Who Were Reenrolling in Coverage in the HealthCare.gov
States Returned to the Marketplaces and Selected a Plan.
Within the HealthCare.gov states, in addition to the 4.6 million new consumers who
selected 2015 coverage through the Marketplaces, 2.2 million active reenrollees also
returned to the Marketplaces and selected a 2015 plan as of 2-15-15 (see Table 2).
16 The nearly 4.7 million new consumers in HealthCare.gov states includes a small number of individuals who previously had
2014 coverage through the Marketplaces in Nevada and Oregon, which switched from using their own Marketplace platforms for
the 2014 coverage year to using the HealthCare.gov Marketplace platform for the 2015 coverage year.

ASPE Issue Brief Page 6
ASPE Office of Health Policy March 2015
The 2.2 million active reenrollees who shopped for coverage represented more than half
(53 percent) of the nearly 4.2 million consumers who had an active plan selection through
the Marketplaces as of November 2014 and have been reenrolled in 2015 coverage
through the Marketplaces. The remaining 47 percent (nearly 2 million) have been
automatically reenrolled (see Table 2).
• More Than Half of the Reenrollees Who Shopped for Coverage in the HealthCare.gov
States Switched Marketplace Plans.
More than half (1.2 million or 54 percent) of the 2.2 million active reenrollees who
selected 2015 plans through the Marketplaces in the HealthCare.gov states switched plans
between the 2014 and 2015 coverage years (see Table 2). The remaining 1.0 million (46
percent) remained in the same Marketplace plan (including those who remained in a
similar crosswalked plan).17
Overall, the 1.2 million active reenrollees, who shopped for coverage and switched plans,
represented 29 percent of the nearly 4.2 million consumers who reenrolled in 2015
coverage through the Marketplaces (including the automatic reenrollees). (See Appendix
Table B2 for state-level data on active reenrollees who switched Marketplace plans).
The 29 percent of reenrollees who switched plans is higher than that seen in other
programs. For example, studies show that approximately 13 percent of Medicare Part D
enrollees change plans in a given year;18
12 percent of those active employees with
Federal Employee Health Benefit Plan coverage switch plans each year,19
and only about
7.5 percent of those with employer sponsored coverage20
switch plans for reasons other
than a job change during a given year.
17 Some consumers’ 2014 plans were no longer active for 2015 but the insurer offered a plan with similar benefits, known as a
“crosswalk plan.” For purposes of this report, active reenrollees who selected the crosswalk plan for the 2015 coverage year
(identified based on the information provided by the insurance companies) are not included in the total number who switched
plans. 18 Hoadley, J. et. al., “To Switch or Not to Switch: Are Medicare Beneficiaries Switching Drug Plans To Save Money?” Kaiser
Family Foundation, October 2013, accessed at http://kff.org/medicare/issue-brief/to-switch-or-not-to-switch-are-medicare-
beneficiaries-switching-drug-plans-to-save-money/. 19 Atherley, A. et. al., “Health Plan Switching Among Members of the Federal Employees Health Benefits Program,” Inquiry
42:255-265 (Fall 2005), Accessed at
http://www.jstor.org/discover/10.2307/29773204?sid=21106062471743&uid=2&uid=3739584&uid=4&uid=3739256. 20 Cunningham, P., “Few Americans Switch Employer Health Plans for Better Quality, Lower Costs,” NIHCR Research Brief
No. 12, January 2013, accessed at http://www.nihcr.org/Health-Plan-Switching.

ASPE Issue Brief Page 7
ASPE Office of Health Policy March 2015
Table 2
2015 Plan Selections Through the Marketplaces in States Using
the HealthCare.gov Platform By Enrollment Type
Cumulative
11-15-14 to 2-15-15
(Including SEP Activity thru 2-22-15)
Number
Plan Selection Data by Enrollment Type
as a % of:
Total
Plan
Selections
n=8.84m
All
Consumers
Reenrolling in
Coverage
n=4.17m
Active
Reenrollees
n=2.21m
Total 2015 Plan Selections through the Marketplaces in
HealthCare.gov States (1)
8.84 million 100% N/A N/A
New Consumers (2) 4.67 million 53% N/A N/A
Consumers Reenrolling in 2015 Coverage through the
Marketplaces (3)
4.17 million 47% 100% N/A
Active Reenrollees (4) 2.21 million 25% 53% 100%
Active Reenrollees Who Remained in the Same Marketplace
Plan (2)
1.01 million 11% 24% 46%
Active Reenrollees Who Switched Marketplace Plans (3) 1.20 million 14% 29% 54%
Automatic Reenrollees (5) 1.96 million 22% 47% N/A
Notes: Numbers may not add to totals due to rounding
(1) Total 2015 Marketplace Plan Selections represents cumulative data on the number of unique individuals who have selected or
been automatically reenrolled into a 2015 Marketplace medical plan for enrollment through the individual market Marketplaces
(with or without the first premium payment having been received directly by the issuer). This is also known as pre-effectuated
enrollment, because enrollment is not considered effectuated until the first premium payment is made, and this figure includes
plan selections for which enrollment has not yet been effectuated. Individuals who have cancelled or terminated their
Marketplace plans are not included in the total number of plan selections. These data also do not include: standalone dental plan
selections; or individuals who may have selected a 2014 Marketplace plan during the reporting period, as a result of having been
eligible for a Special Enrollment Period (SEP).
(2) New Consumers includes data on 2015 Marketplace plan selections for individuals who did not have an active Marketplace
plan selection in HealthCare.gov as of November 2014. This includes consumers who were entirely new to the Marketplace
(e.g., those who had not previously submitted a completed application for 2014 coverage through HealthCare.gov, including
some individuals who may have previously had experience with a State-Based Marketplace that was using its own Marketplace
platform in 2014); as well as those who had previously submitted a completed application to the Marketplace during the 2014
coverage year (including those whose previous 2014 Marketplace plan selection was cancelled or terminated before November
2014, those who were determined eligible to enroll in a QHP, but did not select a Marketplace plan during the 2014 Coverage
Year, and those who submitted a completed application to the Marketplace but were not determined eligible to enroll in a QHP
during the 2014 coverage year).
(3) Consumers reenrolling in coverage through the Marketplaces includes data for consumers who had an active Marketplace
plan selection in HealthCare.gov as of November 2014 and selected or were automatically reenrolled into a 2015 Marketplace
plan (e.g., including data for both active reenrollees and automatic reenrollees). It is important to note that the reenrollment data
in this report may include some individuals who were reenrolled in coverage through the Marketplaces as of 2-15-15 (including
SEP activity through 2-22-15), but who may ultimately decide not to retain Marketplace coverage for the remainder of 2015 (for
example, because they have obtained coverage through another source such as an employer or Medicaid/CHIP). The plan
selection data in future reports will exclude these individuals (e.g., due to the subsequent cancellation or termination of their
coverage).
(4) Active Reenrollees represents the number of consumers reenrolling in coverage through the Marketplaces who returned to the
Marketplace and selected a 2015 plan through the Marketplaces, including some individuals who were initially automatically
reenrolled by the Marketplace and subsequently returned to the Marketplaces to select a plan.
(5) Automatic Reenrollees represents the number of consumers reenrolling in coverage through the Marketplaces whose plan
selections have a current status of automatically renewed because they have not returned to the Marketplaces to select a plan.
Source: Centers for Medicare & Medicaid Services, as of 3-6-15.

ASPE Issue Brief Page 8
ASPE Office of Health Policy March 2015
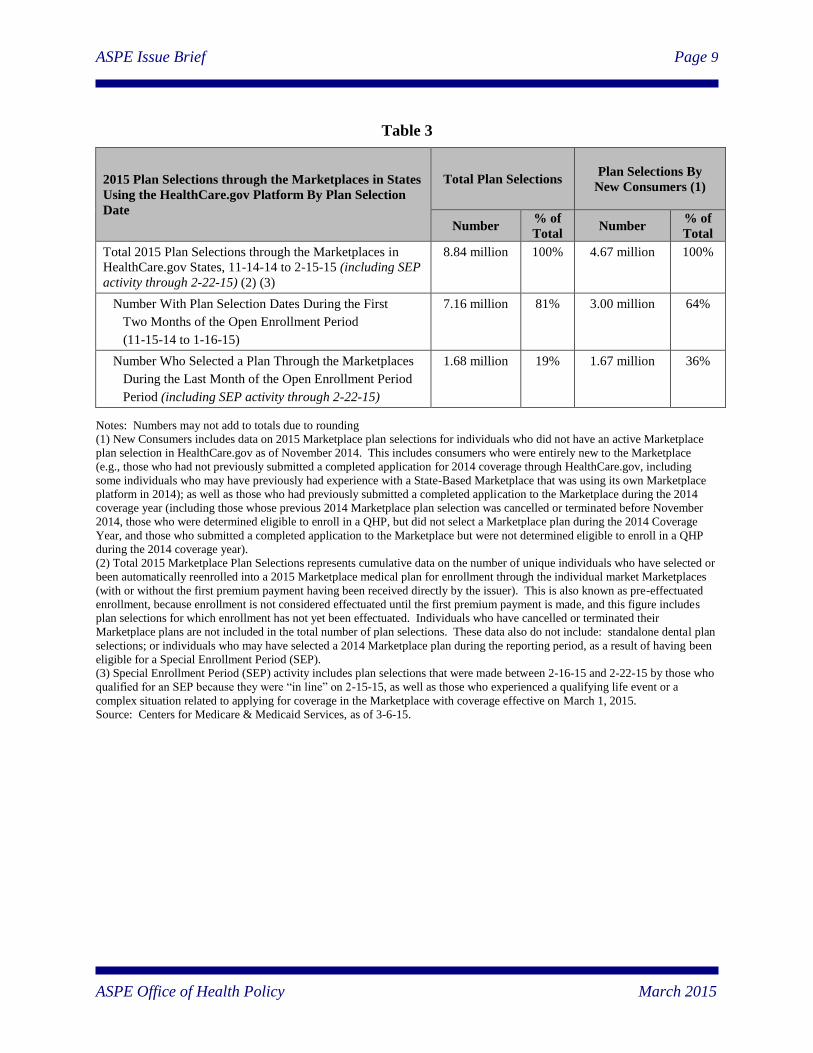
• Nearly 1.7 Million Consumers in the HealthCare.gov States Selected a Marketplace
Plan During the Last Month of the 2015 Open Enrollment Period
The Marketplaces in the HealthCare.gov states experienced additional enrollment as the
close of the 2015 Open Enrollment period approached.
Table 3 shows that nearly 1.7 million of the more than 8.8 million plan selections (19
percent) for consumers in the HealthCare.gov states during the 2015 Open Enrollment
period occurred during the last month of the Open Enrollment period (between 1-16-15
and 2-15-15, including SEP activity through 2-22-15). By comparison, 51 percent of
those who selected a plan in the 2014 Open Enrollment Period in the HealthCare.gov
states (nearly 3.0 million out of 5.4 million) did so between 3-2-14 and 3-31-14
(including SEP activity through 4-19-14).21
Note that in 2014, all consumers were new
consumers and there was no renewal process. When looking only at new consumers for
the 2015 Open Enrollment Period, a greater proportion waited until the end. Specifically,
about 36 percent of the more than 4.6 million new consumers who selected 2015 plans
through the Marketplaces in the HealthCare.gov states did so during the last month of the
open enrollment period (including SEP activity through 2-22-15).
21
For more information, please see the 2014 Open Enrollment Period Marketplace Summary Enrollment Report, which can be
accessed at http://aspe.hhs.gov/health/reports/2014/MarketPlaceEnrollment/Apr2014/ib_2014Apr_enrollment.pdf.
ASPE Issue Brief Page 9
ASPE Office of Health Policy March 2015
Table 3
2015 Plan Selections through the Marketplaces in States
Using the HealthCare.gov Platform By Plan Selection
Date
Total Plan Selections Plan Selections By
New Consumers (1)
Number % of
Total Number
% of
Total
Total 2015 Plan Selections through the Marketplaces in
HealthCare.gov States, 11-14-14 to 2-15-15 (including SEP
activity through 2-22-15) (2) (3)
8.84 million 100% 4.67 million 100%
Number With Plan Selection Dates During the First
Two Months of the Open Enrollment Period
(11-15-14 to 1-16-15)
7.16 million 81% 3.00 million 64%
Number Who Selected a Plan Through the Marketplaces
During the Last Month of the Open Enrollment Period
Period (including SEP activity through 2-22-15)
1.68 million 19% 1.67 million 36%
Notes: Numbers may not add to totals due to rounding
(1) New Consumers includes data on 2015 Marketplace plan selections for individuals who did not have an active Marketplace
plan selection in HealthCare.gov as of November 2014. This includes consumers who were entirely new to the Marketplace
(e.g., those who had not previously submitted a completed application for 2014 coverage through HealthCare.gov, including
some individuals who may have previously had experience with a State-Based Marketplace that was using its own Marketplace
platform in 2014); as well as those who had previously submitted a completed application to the Marketplace during the 2014
coverage year (including those whose previous 2014 Marketplace plan selection was cancelled or terminated before November
2014, those who were determined eligible to enroll in a QHP, but did not select a Marketplace plan during the 2014 Coverage
Year, and those who submitted a completed application to the Marketplace but were not determined eligible to enroll in a QHP
during the 2014 coverage year).
(2) Total 2015 Marketplace Plan Selections represents cumulative data on the number of unique individuals who have selected or
been automatically reenrolled into a 2015 Marketplace medical plan for enrollment through the individual market Marketplaces
(with or without the first premium payment having been received directly by the issuer). This is also known as pre-effectuated
enrollment, because enrollment is not considered effectuated until the first premium payment is made, and this figure includes
plan selections for which enrollment has not yet been effectuated. Individuals who have cancelled or terminated their
Marketplace plans are not included in the total number of plan selections. These data also do not include: standalone dental plan
selections; or individuals who may have selected a 2014 Marketplace plan during the reporting period, as a result of having been
eligible for a Special Enrollment Period (SEP).
(3) Special Enrollment Period (SEP) activity includes plan selections that were made between 2-16-15 and 2-22-15 by those who
qualified for an SEP because they were “in line” on 2-15-15, as well as those who experienced a qualifying life event or a
complex situation related to applying for coverage in the Marketplace with coverage effective on March 1, 2015.
Source: Centers for Medicare & Medicaid Services, as of 3-6-15.

ASPE Issue Brief Page 10
ASPE Office of Health Policy March 2015
Figure 1
Trends in the Cumulative Number of Individuals Who Selected a
Marketplace Plan in States Using the HealthCare.gov Platform,
11-15-14 to 2-15-15 (including SEP Activity thru 2-22-15)
Notes: Represents cumulative sums of weekly data (Sunday to Saturday) on the number of unique individuals who have been determined eligible to enroll in a
plan through the states using the HealthCare.gov platform, and have actively selected a plan (with or without the first premium payment having been received
by the issuer). Number of states using the HealthCare.gov platform: 37 states during the 2015 coverage year.
Source: Centers for Medicare & Medicaid Services, as of 3-6-15
The number of 2015 Marketplace plan selections increased by 1.7 million between 1-16-15
and 2-15-15, including SEP activity thru 2-22-15 (from more than 7.1 million to 8.8 million)
0
1,000,000
2,000,000
3,000,000
4,000,000
5,000,000
6,000,000
7,000,000
8,000,000
9,000,000
11/15/2014 11/29/2014 12/13/2014 12/27/2014 1/11/2015 1/25/2015 2/8/2015 2/15/15(incl. SEP activity
thru 2/22/15)2015 Marketplace Plan Selections in States Using the HealthCare.Gov Platform
End of Open Enrollment Period
Automatic
Reenrollments
• Interest in the Marketplaces in HealthCare.gov States Has Been High. – During the
2015 Open Enrollment period:
o 35.2 million visitors used the HealthCare.gov and CuidadoDeSalud.gov websites;
o 16.8 million calls were made to the Marketplace call center for the
HealthCare.gov states;
o 9.2 million completed applications for 2015 coverage were submitted; and
o 12.4 million individuals were included in these completed applications.22
22
A single completed application form that is submitted to the Marketplace can include multiple individual applicants from the
same household.
ASPE Issue Brief Page 11
ASPE Office of Health Policy March 2015
Characteristics of 2015 Plan Selections Through the Marketplaces in the HealthCare.gov
States Compared to 2014 and Characteristics of New Consumers and Reenrollees in 2015
Generally, the demographic characteristics of consumers selecting plans through the
Marketplaces in the HealthCare.gov states during the 2014 and 2015 Open Enrollment Periods
were quite similar (see Table 4).
There were also some demographic differences between new consumers in 2015 and consumers
reenrolling in coverage through the Marketplaces. Most notably, new consumers were more
likely to be young adults, less likely to select a silver plan, more likely to be African-American
or Latino, and less likely to be White.
As noted in the 2014 summary enrollment report,23
the data on race and ethnicity should be
interpreted with great caution since more than one-third of enrollees do not provide these data.
23
For more information about data on Marketplace plan selections for the 2014 coverage year, please see the Marketplace
Summary Enrollment Report, which can be accessed at
http://aspe.hhs.gov/health/reports/2014/MarketPlaceEnrollment/Apr2014/ib_2014Apr_enrollment.pdf.

ASPE Issue Brief Page 12
ASPE Office of Health Policy March 2015
Table 4
Comparison of Selected
Characteristics of Plan Selections
through the Marketplaces in
States Using the HealthCare.gov
Platform
2014 Open
Enrollment
Period (2)
2015 Open
Enrollment
Period (3)
Total
Plan
Selections
Total
Plan
Selections
By Reenrollment Status
New
Consumers
Active
Reenrollees
Automatic
Reenrollees
Total Number of Individuals Who
Have Selected a 2015 Plan Through
the Marketplaces in the
HealthCare.gov States (1)
5.44 million 8.84 million 4.67 million 2.21 million 1.96 million
Males who have selected a
Marketplace plan (5) 45% 46% 47% 43% 46%
Females who have selected a
Marketplace plan (5) 55% 54% 53% 57% 54%
0 to 34 year olds who have
selected a Marketplace plan (5) 35% 36% 40% 28% 36%
18 to 34 year olds who have
selected a Marketplace plan (5) 28% 28% 31% 21% 29%
Individuals who have selected a
Silver Marketplace plan (5) 69% 69% 66% 72% 72%
Individuals who have selected a
Marketplace plan with
Financial Assistance (5) 86% 87% 86% 91% 84%
African-Americans who have
selected a Marketplace plan (5) 17% 14% 16% 11% 15%
Latinos who have selected a
Marketplace plan (5) 11% 11% 12% 10% 10%
Whites who have selected a
Marketplace plan (5) 63% 65% 63% 69% 66%
Individuals in ZIP Codes
designated as Rural who have
selected a Marketplace Plan (5)
N/A 17% 17% 18% 18%
Notes:
(1) Represents the cumulative number of unique individuals who have selected or been automatically reenrolled into a 2015
Marketplace medical plan for enrollment through the individual market Marketplaces (with or without the first premium payment
having been received directly by the issuer). This is also known as pre-effectuated enrollment, because enrollment is not
considered effectuated until the first premium payment is made, and this figure includes plan selections for which enrollment has
not yet been effectuated. Individuals who have cancelled or terminated their Marketplace plans are not included in the total
number of plan selections. These data also do not include: standalone dental plan selections; or individuals who may have
selected a 2014 Marketplace plan during the reporting period, as a result of having been eligible for a Special Enrollment Period
(SEP). See Appendix D for additional technical notes.
(2) Data for the 2014 Open Enrollment Period are for the following reporting period: 10-1-13 to 3-31-14 (including SEP activity
through 4-19-14). During the 2014 Marketplace coverage year, there were a total of 36 states using the HealthCare.gov platform,
including one state (Idaho) that switched from using the HealthCare.gov platform in 2014 to using its own Marketplace platform
in 2015.

ASPE Issue Brief Page 13
ASPE Office of Health Policy March 2015
(3) Data for the 2015 Open Enrollment Period are for the following reporting period: 11-15-14 to 2-15-15 (including SEP
activity through 2-22-15). During the 2015 Marketplace coverage year, there were a total of 37 states using the HealthCare.gov
platform, including 35 states that are states that used the HealthCare.gov platform in both 2014 and 2015, and two states which
are new to the HealthCare.gov platform in 2015 (Oregon and Nevada).
(4) The data for the 2014 Open Enrollment period correspond with the reporting period for the 2015 Open Enrollment Period.
(5) Percentages shown in this table are based on the total number of active Marketplace plan selections for which the applicable
data are available, excluding plan selections with unknown data for a given metric (e.g., age, gender, race/ethnicity, etc.)
Additional information on the number of plan selections with missing data for each metric can be found in Appendix Table A1.
Source: Centers for Medicare & Medicaid Services, as of 3-6-15; includes updated age distribution data for the HealthCare.gov
states as of 6-29-15.
Distribution of 2015 Plan Selections Through the Marketplaces in the HealthCare.gov States
By Household Income
Most (80 percent) of the consumers who selected 2015 plans through the Marketplaces in the
HealthCare.gov states during the 2015 Open Enrollment period (11-15-14 to 2-15-15, including
SEP activity through 2-22-15) had household incomes that were between 100 percent and 250
percent of the Federal Poverty Level (FPL). However, the observed household income
distributions differed between HealthCare.gov states that have and have not expanded Medicaid
under the Affordable Care Act (see Table 5).24
24 As of December 2014, 14 HealthCare.gov states had implemented the expansion of Medicaid under the Affordable Care Act to
cover adults under age 65 with incomes up to 133 percent of the Federal Poverty Level. Additionally, Pennsylvania implemented
the Medicaid expansion on January 1, 2015 and Indiana the implemented Medicaid expansion on February 1, 2015.

ASPE Issue Brief Page 14
ASPE Office of Health Policy March 2015
Table 5
2015 Plan Selections Through the Marketplaces
in States Using the HealthCare.gov Platform
by Household Income and Medicaid Expansion Status,
11-15-14 to 2-15-15 (including SEP activity thru 2-22-15)
Household Income (% of the Federal
Poverty Level (FPL))
Total Plan Selections Plan Selections for Consumers Renewing
Coverage
All States Using
the
HealthCare.gov
Platform for the
2015 Coverage
Year
(37 States)
HealthCare.gov
States That
Have
Implemented
the Medicaid
Expansion (1)
(16 States)
HealthCare.gov
States That
Have Not
Implemented
the Medicaid
Expansion
(21 States)
All States Using
the
HealthCare.gov
Platform for the
2015 Coverage
Year
(37 States)
HealthCare.gov
States That
Have
Implemented
the Medicaid
Expansion (1)
(16 States)
HealthCare.gov
States That
Have Not
Implemented
the Medicaid
Expansion
(21 States)
Total 2015 Plan
Selections Through the Marketplaces (2)
8.84 million 2.56 million 6.28 million 4.17 million 1.28 million 2.89 million
Plan Selections With
Available Data on Household Income (3)
8.31 million 2.35 million 5.97 million 3.93 million 1.18 million 2.75 million
Plan Selections by Household Income (% of Total with Available Data):
<100% of FPL 3% 2% 3% 2% 2% 2%
≥100% - ≤150% of FPL 40% 22% 47% 39% 25% 45%
>150% - ≤200% of FPL 25% 32% 23% 26% 31% 24%
>200% - ≤250% of FPL 15% 19% 13% 15% 18% 13%
>250% - ≤300% of FPL 8% 11% 7% 8% 11% 7%
>300% - ≤400% of FPL 8% 11% 6% 7% 10% 6%
> 400% of FPL 2% 3% 2% 2% 3% 2%
Notes:
(1) As of December 2014, 14 HealthCare.gov states had implemented the expansion of Medicaid under the Affordable Care Act
to cover adults under age 65 with incomes up to 133 percent of the Federal Poverty Level. Additionally, Pennsylvania
implemented the Medicaid expansion on January 1, 2015 and Indiana the implemented Medicaid expansion on February 1, 2015.
See Appendix D for additional technical notes.
(2) Represents the cumulative number of unique individuals who have selected or been automatically reenrolled into a 2015
Marketplace medical plan for enrollment through the individual market Marketplaces (with or without the first premium payment
having been received directly by the issuer). This is also known as pre-effectuated enrollment, because enrollment is not
considered effectuated until the first premium payment is made, and this figure includes plan selections for which enrollment has
not yet been effectuated. Individuals who have cancelled or terminated their Marketplace plans are not included in the total
number of plan selections. These data also do not include: standalone dental plan selections; or individuals who may have
selected a 2014 Marketplace plan during the reporting period, as a result of having been eligible for a Special Enrollment Period
(SEP).
(3) Household Income represents the individual’s household income as a percentage of the Federal Poverty Level. The 2014
Federal Poverty Guidelines, which are used in determining premium tax credits for 2015 coverage, can be accessed at
http://aspe.hhs.gov/poverty/14poverty.cfm.
Source: Centers for Medicare & Medicaid Services, as of 3-6-15.
ASPE Issue Brief Page 15
ASPE Office of Health Policy March 2015
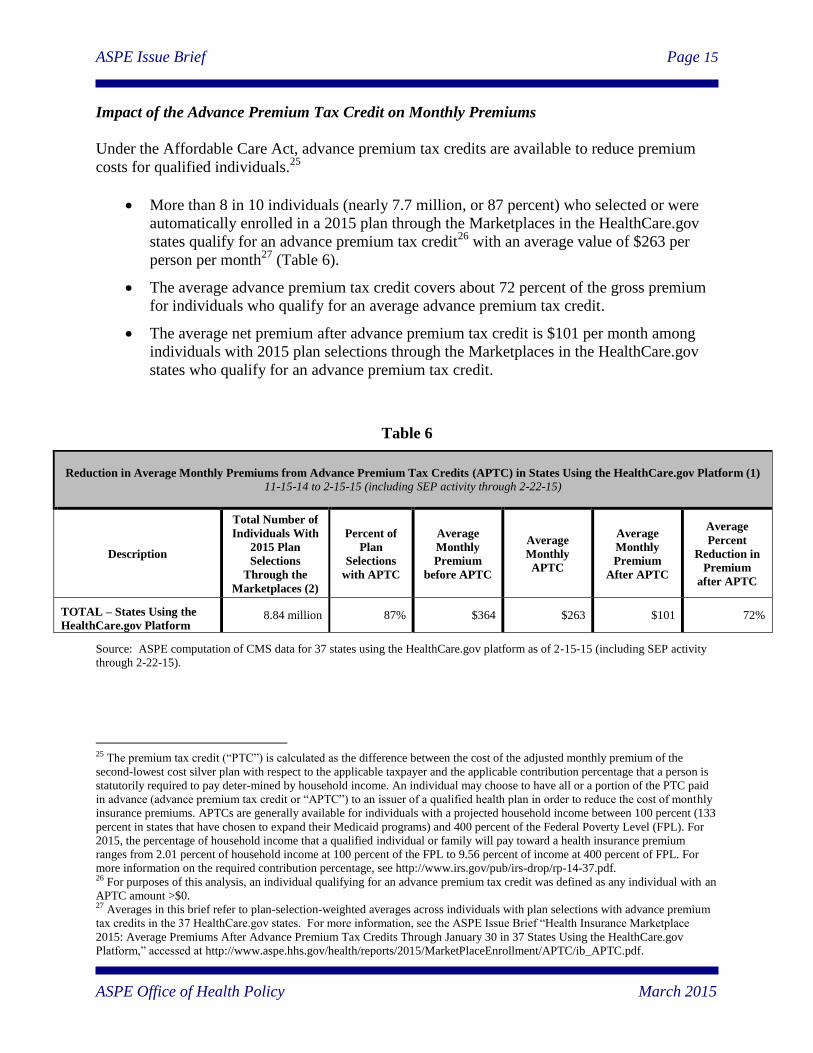
Impact of the Advance Premium Tax Credit on Monthly Premiums
Under the Affordable Care Act, advance premium tax credits are available to reduce premium
costs for qualified individuals.25
More than 8 in 10 individuals (nearly 7.7 million, or 87 percent) who selected or were
automatically enrolled in a 2015 plan through the Marketplaces in the HealthCare.gov
states qualify for an advance premium tax credit26
with an average value of $263 per
person per month27
(Table 6).
The average advance premium tax credit covers about 72 percent of the gross premium
for individuals who qualify for an average advance premium tax credit.
The average net premium after advance premium tax credit is $101 per month among
individuals with 2015 plan selections through the Marketplaces in the HealthCare.gov
states who qualify for an advance premium tax credit.
Table 6
Reduction in Average Monthly Premiums from Advance Premium Tax Credits (APTC) in States Using the HealthCare.gov Platform (1) 11-15-14 to 2-15-15 (including SEP activity through 2-22-15)
Description
Total Number of
Individuals With
2015 Plan
Selections
Through the
Marketplaces (2)
Percent of
Plan
Selections
with APTC
Average
Monthly
Premium
before APTC
Average
Monthly
APTC
Average
Monthly
Premium
After APTC
Average
Percent
Reduction in
Premium
after APTC
TOTAL – States Using the
HealthCare.gov Platform 8.84 million 87% $364 $263 $101 72%
Source: ASPE computation of CMS data for 37 states using the HealthCare.gov platform as of 2-15-15 (including SEP activity
through 2-22-15).
25 The premium tax credit (“PTC”) is calculated as the difference between the cost of the adjusted monthly premium of the
second-lowest cost silver plan with respect to the applicable taxpayer and the applicable contribution percentage that a person is
statutorily required to pay deter-mined by household income. An individual may choose to have all or a portion of the PTC paid
in advance (advance premium tax credit or “APTC”) to an issuer of a qualified health plan in order to reduce the cost of monthly
insurance premiums. APTCs are generally available for individuals with a projected household income between 100 percent (133
percent in states that have chosen to expand their Medicaid programs) and 400 percent of the Federal Poverty Level (FPL). For
2015, the percentage of household income that a qualified individual or family will pay toward a health insurance premium
ranges from 2.01 percent of household income at 100 percent of the FPL to 9.56 percent of income at 400 percent of FPL. For
more information on the required contribution percentage, see http://www.irs.gov/pub/irs-drop/rp-14-37.pdf. 26 For purposes of this analysis, an individual qualifying for an advance premium tax credit was defined as any individual with an
APTC amount >$0. 27 Averages in this brief refer to plan-selection-weighted averages across individuals with plan selections with advance premium
tax credits in the 37 HealthCare.gov states. For more information, see the ASPE Issue Brief “Health Insurance Marketplace
2015: Average Premiums After Advance Premium Tax Credits Through January 30 in 37 States Using the HealthCare.gov
Platform,” accessed at http://www.aspe.hhs.gov/health/reports/2015/MarketPlaceEnrollment/APTC/ib_APTC.pdf.

ASPE Issue Brief Page 16
ASPE Office of Health Policy March 2015
Many Consumers Took Advantage of the Availability of 2015 Plans with Premiums of $100 or
Less Through the Marketplaces in the HealthCare.gov States
Overall, more than half (55 percent) of the 8.8 million total individuals with 2015 plan
selections through the Marketplaces in the HealthCare.gov states have a monthly
premium of $100 or less after applying the advance premium tax credit. About 8 in 10
of these individuals had the option of selecting such a plan (see Table 7).
Meanwhile, more than 3 in 10 of the 8.8 million total individuals with 2015 plan
selections through the Marketplaces in the HealthCare.gov states have a monthly
premium of $50 or less after applying any applicable advance premium tax credit.
About 7 in 10 of eligible individuals had the option of selecting such a plan
Table 7
Availability and Selection of Plans With Monthly Premiums of $100 or Less After the Advance Premium Tax Credit (APTC) through the
Marketplaces in States Using the HealthCare.gov Platform (1) 11-15-14 to 2-15-15 (including SEP activity through 2-22-15)
Description
Number of
Individuals
With 2015 Plan
Selections
Through the
Marketplaces
(2)
Availability of Plans With Monthly
Premiums of $100 or Less Selection of Plans With Monthly Premiums
of $100 or Less
Percent Who
Could Have
Selected a Plan
with a Monthly
Premium of
$50 or Less
after APTC
Percent Who
Could Have
Selected a Plan
with a Monthly
Premium of $100
or Less after
APTC
Percent Who
Selected or Were
Automatically
Reenrolled in a Plan
With a Monthly
Premium of $50 or
Less after APTC
Percent Who
Selected or Were
Automatically
Reenrolled in a Plan
With a Monthly
Premium of $100 or
Less after APTC
Total Number of Individuals
With 2015 Plan Selections
Through the Marketplaces
8.84 million 66% 77% 33% 55%
Individuals With 2015 Plan
Selections With APTC
through the Marketplaces
7.65 million 77% 89% 38% 63%
Source: ASPE computation of CMS data for 37 states using the HealthCare.gov platform as of 2-15-15 (including SEP activity
through 2-22-15).
Distribution of 2015 Plan Selections Through the Marketplaces in the HealthCare.gov States
by Monthly Premium After Tax Credit and Reenrollment Status
Consumers who shopped for coverage were more likely to have a 2015 plan selection
through the Marketplaces with a monthly premium of $100 or less after applying the
advance premium tax credit – 58 percent for new consumers and 55 percent for
reenrollees who returned to the Marketplaces and selected a plan, compared with 46
percent for automatic reenrollees who did not return to the Marketplaces (see Table 8).

ASPE Issue Brief Page 17
ASPE Office of Health Policy March 2015
Table 8
2015 Plan Selections Through the Marketplaces
in States Using the HealthCare.gov Platform By
Monthly Premium After Tax Credit
Cumulative 11-15-14 to 2-15-15
(Including SEP Activity thru 2-22-15)
Total
Individuals
With 2015
Marketplace
Plan Selections
By Reenrollment Status
New
Consumers
Active
Reenrollees
Automatic
Reenrollees
Total 2015 Plan Selections Through the
Marketplaces in HealthCare.gov States, 11-14-14 to
2-15-15 (including SEP activity through 2-22-15) (3)
8.84 million 4.67 million 2.21 million 1.96 million
Plan Selections by Monthly Premium After the
Advance Premium Tax Credit (APTC):
Less Than or Equal to $100 55% 58% 55% 46%
≥$0 and ≤ $50 33% 37% 33% 22%
>$50 and ≤ $100 22% 21% 22% 24%
Greater Than $100 45% 42% 45% 54%
Source: ASPE computation of CMS data for 37 states using the HealthCare.gov platform as of 2-15-15 (including SEP activity
through 2-22-15).
Table 9
2015 Plan Selections Through the Marketplaces
in States Using the HealthCare.gov Platform By
Monthly Premium After Tax Credit
Cumulative 11-15-14 to 2-15-15
(Including SEP Activity thru 2-22-15)
Total
Individuals
With 2015
Marketplace
Plan Selections
With APTC
By Reenrollment Status
New
Consumers
Active
Reenrollees
Automatic
Reenrollees
Total 2015 Plan Selections Through the
Marketplaces in HealthCare.gov States, 11-14-14 to 2-15-15 (including SEP activity through 2-22-15) (3)
7.65 million 4.01 million 2.01 million 1.63 million
Plan Selections by Monthly Premium After the
Advance Premium Tax Credit (APTC):
Less Than or Equal to $100 63% 67% 60% 55%
≥$0 and ≤ $50 38% 43% 37% 27%
>$50 and ≤ $100 25% 24% 23% 28%
Greater Than $100 37% 33% 40% 45%
Source: ASPE computation of CMS data for 37 states using the HealthCare.gov platform as of 2-15-15 (including SEP activity
through 2-22-15).
ASPE Issue Brief Page 18
ASPE Office of Health Policy March 2015
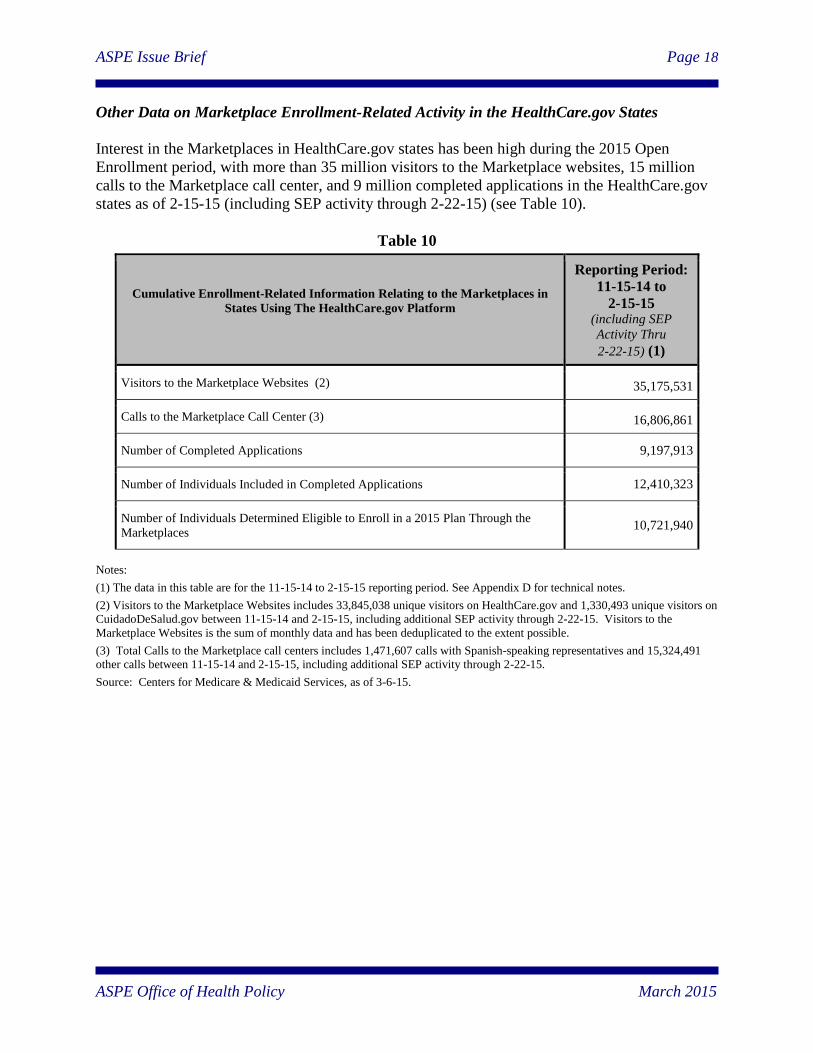
Other Data on Marketplace Enrollment-Related Activity in the HealthCare.gov States
Interest in the Marketplaces in HealthCare.gov states has been high during the 2015 Open
Enrollment period, with more than 35 million visitors to the Marketplace websites, 15 million
calls to the Marketplace call center, and 9 million completed applications in the HealthCare.gov
states as of 2-15-15 (including SEP activity through 2-22-15) (see Table 10).
Table 10
Cumulative Enrollment-Related Information Relating to the Marketplaces in
States Using The HealthCare.gov Platform
Reporting Period:
11-15-14 to
2-15-15 (including SEP
Activity Thru
2-22-15) (1)
Visitors to the Marketplace Websites (2) 35,175,531
Calls to the Marketplace Call Center (3) 16,806,861
Number of Completed Applications 9,197,913
Number of Individuals Included in Completed Applications 12,410,323
Number of Individuals Determined Eligible to Enroll in a 2015 Plan Through the
Marketplaces 10,721,940
Notes:
(1) The data in this table are for the 11-15-14 to 2-15-15 reporting period. See Appendix D for technical notes.
(2) Visitors to the Marketplace Websites includes 33,845,038 unique visitors on HealthCare.gov and 1,330,493 unique visitors on
CuidadoDeSalud.gov between 11-15-14 and 2-15-15, including additional SEP activity through 2-22-15. Visitors to the
Marketplace Websites is the sum of monthly data and has been deduplicated to the extent possible.
(3) Total Calls to the Marketplace call centers includes 1,471,607 calls with Spanish-speaking representatives and 15,324,491
other calls between 11-15-14 and 2-15-15, including additional SEP activity through 2-22-15.
Source: Centers for Medicare & Medicaid Services, as of 3-6-15.
ASPE Issue Brief Page 19
ASPE Office of Health Policy March 2015
SECTION II. DATA FOR THE 14 STATES USING THEIR OWN MARKETPLACE
PLATFORMS
Nearly 2.85 million individuals have selected 2015 plans through the Marketplace s in the 14
states (including DC) that are using their own Marketplace platforms for the 2015 coverage year
as of 2-15-15 (including SEP activity through 2-21-15).28
Several states (Maryland,
Massachusetts, and Idaho) are unable to separate out data for new consumers and consumers
reenrolling in coverage through the Marketplaces due to system vendor changes or other
information technology system issues. This includes:
357,764 plan selections through the Marketplaces in 3 states reporting all enrollees as
new consumers because of systems issues. (Idaho,29
Maryland, and Massachusetts); and
2,492,019 plan selections through the Marketplaces in 11 states reporting data on new
consumers, consumers actively reenrolling in Marketplace coverage, and automatic
reenrollees (California, Colorado, Connecticut, District of Columbia, Hawaii, Kentucky,
Minnesota, New York, Rhode Island, Vermont, and Washington).
Consistent with experience during the 2014 Open Enrollment period, the Marketplaces in the
states using their own Marketplace platforms experienced additional plan selections as the close
of the 2015 Open Enrollment period approached. Table 11 shows that 16 percent of the nearly
2.85 million plan selections for consumers who selected or were automatically enrolled in
Marketplace plans in these states during the 2015 Open Enrollment period (including SEP
activity through 2-21-15) occurred during the last month of the Open Enrollment period
(between 1-18-15 and 2-15-15, including SEP activity through 2-21-15).
28
Data for California are for 11-15-14 to 2-22-15. 29
Data for Idaho include some automatic reenrollees from their previous HealthCare.gov platform (Idaho used the
HealthCare.gov platform during the 2014 coverage year); however, Idaho is treating all plan selections as new in 2015.

ASPE Issue Brief Page 20
ASPE Office of Health Policy March 2015
Table 11
2015 Plan Selections Through the Marketplaces in States Using
Their Own Marketplace Platforms By Plan Selection Date
Total Plan Selections
Number % of Total
Total 2015 Plan Selections Through the Marketplaces in States Using
Their Own Marketplace Platforms, 11-14-14 to 2-15-15 (including SEP
activity through 2-22-15) (2) (3)
2.85 million 100%
Number With Plan Selection Dates During the First Two Months of the
Open Enrollment Period (11-15-14 to 1-17-15)
2.38 million 84%
Number Who Selected a Marketplace Plan During the Last Month of
the Open Enrollment Period (including SEP activity through 2-22-15)
0.47 million 16%
Notes: Numbers may not add to totals due to rounding
(1) Total 2015 Marketplace Plan Selections represents cumulative data on the number of unique individuals who have selected or
been automatically reenrolled into a 2015 Marketplace medical plan for enrollment through the individual market Marketplaces
(with or without the first premium payment having been received directly by the issuer). This is also known as pre-effectuated
enrollment, because enrollment is not considered effectuated until the first premium payment is made, and this figure includes
plan selections for which enrollment has not yet been effectuated. These data also do not include: standalone dental plan
selections; or individuals who may have selected a 2014 Marketplace plan during the reporting period, as a result of having been
eligible for a Special Enrollment Period (SEP). Except for three states, the data for total number of plan selections removes
cancellations and terminations. Minnesota does not remove either from its total plan selection data, whereas DC removes
cancellations and terminations from its automatic reenrollment data and New York removes cancellations and terminations from
its active and automatic reenrollee data.
(2) Special Enrollment Period (SEP) activity includes plan selections that were made between 2-15-15 and 2-21-15 by those who
qualified for an SEP because they were “in line” on 2-15-15, as well as those who experienced a qualifying life event or a
complex situation related to applying for coverage in the Marketplace with coverage effective on March 1, 2015.
Source: Centers for Medicare & Medicaid Services, as of 3-6-15.
This report also includes available data relating to completed applications, eligibility
determinations, website visitors, and call center activity (see Table 12); as well as the overall
distribution of Marketplace plan selections by gender, age, metal level, and financial assistance
status. (See Appendix Table A3 for a summary of available data on the characteristics of
Marketplace plan selections in these states, and Appendix Table D3 for a summary of which data
are available for each state. Additionally, Appendix Tables C1, C2, C3, C4, and C5 include
state-level data for several metrics).

ASPE Issue Brief Page 21
ASPE Office of Health Policy March 2015
Table 12
Cumulative Enrollment-Related Information on the
Marketplaces in
States Using Their Own Marketplace Platforms
Reporting Period:
2015 Open
Enrollment Period
(1)
Visitors to the Marketplace Websites
Number of States Reporting: 13 13,011,171
Calls to the Marketplace Call Centers
Number of States Reporting: 14 8,110,152
Number of Completed Applications
Number of States Reporting: 12 1,886,934
Number of Individuals Included in Completed Applications
Number of States Reporting: 12 3,525,757
Number of Individuals Determined Eligible to Enroll in a 2015 Plan through the
Marketplaces
Number of States Reporting: 14 3,694,776
Number of Individuals Who Have Selected a 2015 Plan through the Marketplaces (2)
Number of States Reporting: 14 2,849,783
Notes:
(1) Most of the data in this table are for the 11-15-14 to 2-15-15 (including SEP activity through 2-21-15) reporting period with
the following exceptions: data for California are for 11-15-14 to 2-15-15 (including SEP activity through 2-22-15).
(2) Total 2015 Marketplace Plan Selections generally represents cumulative data on the number of unique individuals who have
selected a 2015 Marketplace medical plan for enrollment through the individual market Marketplaces (with or without the first
premium payment having been received directly by the issuer). This is also known as pre-effectuated enrollment, because
enrollment is not considered effectuated until the first premium payment is made, and this figure includes plan selections for
which enrollment has not yet been effectuated (however, one state, Washington, has reported data on effectuated enrollment).
Except for three states, the data for total number of plan selections removes cancellations and terminations. Minnesota does not
remove either from its total plan selection data, whereas DC removes cancellations and terminations from its automatic
reenrollment data and New York removes cancellations and terminations from its active and automatic reenrollee data. These
data do not include a count of the number of individuals who have selected a standalone dental plan. They also generally do not
include data for individuals who may have selected a 2014 Marketplace plan during the reporting period, as a result of having
been eligible for a Special Enrollment Period (SEP).
Source: Centers for Medicare & Medicaid Services, as of 3-6-15.

ASPE Issue Brief Page 22
ASPE Office of Health Policy March 2015
SECTION III. METHODOLOGICAL OVERVIEW
The data reported here have been obtained from the information systems of the Centers for
Medicare & Medicaid Services (CMS), based on information collected for 37 states using the
HealthCare.gov platform. We also obtained more limited data reported to CMS by the 14 states
(including DC) that are using their own Marketplace platforms. Data for the Small Business
Health Options Program (SHOP) Marketplaces are not included in this report.
This report includes data that are currently available on enrollment-related activity for the 2015
Open Enrollment period – which generally corresponds with data from 11-15-14 to 2-15-15
(including SEP activity through 2-22-15) for the 37 HealthCare.gov states;30
and from 11-15-14
to 2-15-15 (including SEP activity through 2-22-15) in states that are using their own
Marketplace platforms for the 2015 coverage (see Table 13 below).
Table 13 Marketplace Type Reporting Period
States Using the HealthCare.gov Marketplace Platform (37 states) 11-15-14 to 2-15-15 (including SEP
activity thru 2-22-15)*
States Using Their Own Marketplace Platform (14 states)
California 11-15-14 to 2-15-15 (including SEP
activity thru 2-22-15)
Other 13 States (including DC) 11-15-14 to 2-15-15 (including SEP
activity thru 2-21-15)
* This report has been updated with more complete age distribution data for the HealthCare.gov states, as of 6-29-15.
Data for certain metrics are not available for several of the states that are using their own
Marketplace platforms.
It is important to note that some of the 14 states that are using their own Marketplace platforms
are not separately reporting data for new consumers and consumers who are reenrolling in
coverage through the Marketplaces. Please refer to Appendix D for additional technical notes.
This report also includes available data on the characteristics of individuals who have selected a
plan through the Marketplaces for the 37 states that are using the HealthCare.gov platform for
2015, and the 14 states that are using their own Marketplace platforms. In some cases, the data
for certain characteristics of Marketplace plan selections are not yet available in selected states.
We believe that the information contained in this issue brief provides the most systematic
summary of enrollment-related activity in the Marketplaces for the 2015 Open Enrollment period
because the data for the various metrics are counted using comparable definitions for data
elements across states and Marketplace types.
30 This report has been updated with more complete age distribution data for the HealthCare.gov states, as of 6-29-15.
ASPE Issue Brief Page 23
ASPE Office of Health Policy March 2015
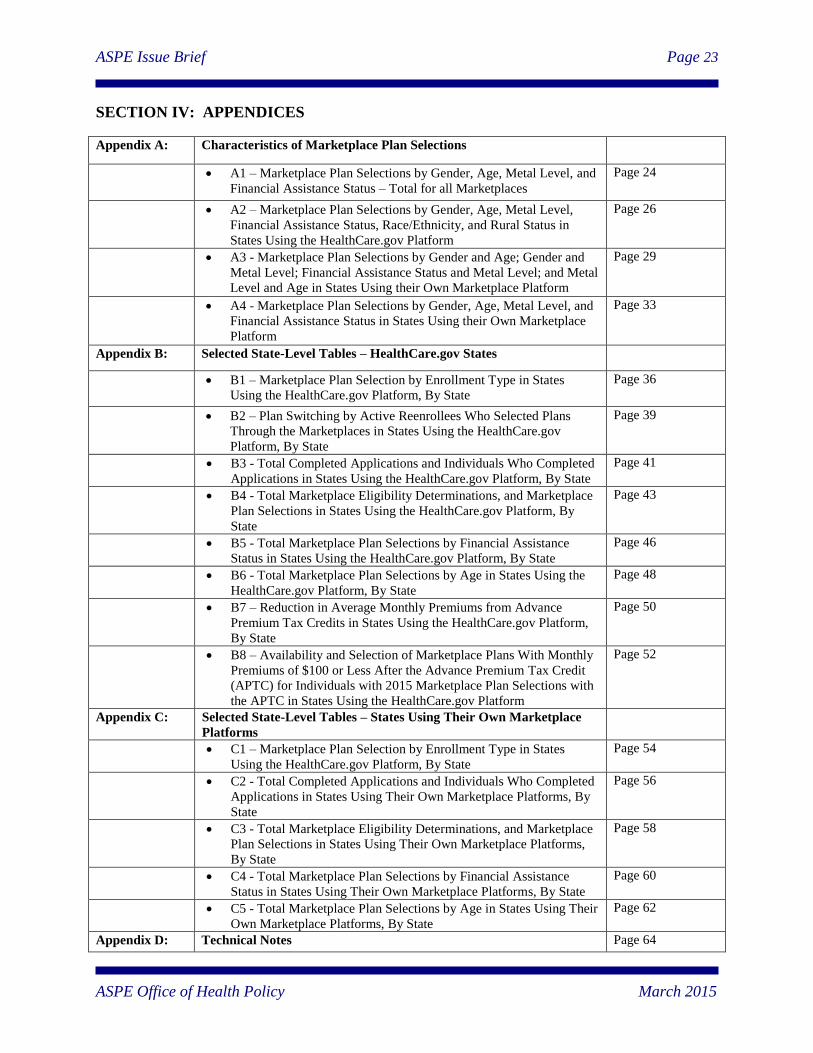
SECTION IV: APPENDICES
Appendix A: Characteristics of Marketplace Plan Selections
A1 – Marketplace Plan Selections by Gender, Age, Metal Level, and
Financial Assistance Status – Total for all Marketplaces
Page 24
A2 – Marketplace Plan Selections by Gender, Age, Metal Level,
Financial Assistance Status, Race/Ethnicity, and Rural Status in
States Using the HealthCare.gov Platform
Page 26
A3 - Marketplace Plan Selections by Gender and Age; Gender and
Metal Level; Financial Assistance Status and Metal Level; and Metal
Level and Age in States Using their Own Marketplace Platform
Page 29
A4 - Marketplace Plan Selections by Gender, Age, Metal Level, and
Financial Assistance Status in States Using their Own Marketplace
Platform
Page 33
Appendix B: Selected State-Level Tables – HealthCare.gov States
B1 – Marketplace Plan Selection by Enrollment Type in States
Using the HealthCare.gov Platform, By State
Page 36
B2 – Plan Switching by Active Reenrollees Who Selected Plans
Through the Marketplaces in States Using the HealthCare.gov
Platform, By State
Page 39
B3 - Total Completed Applications and Individuals Who Completed
Applications in States Using the HealthCare.gov Platform, By State
Page 41
B4 - Total Marketplace Eligibility Determinations, and Marketplace
Plan Selections in States Using the HealthCare.gov Platform, By
State
Page 43
B5 - Total Marketplace Plan Selections by Financial Assistance
Status in States Using the HealthCare.gov Platform, By State
Page 46
B6 - Total Marketplace Plan Selections by Age in States Using the
HealthCare.gov Platform, By State
Page 48
B7 – Reduction in Average Monthly Premiums from Advance
Premium Tax Credits in States Using the HealthCare.gov Platform,
By State
Page 50
B8 – Availability and Selection of Marketplace Plans With Monthly
Premiums of $100 or Less After the Advance Premium Tax Credit
(APTC) for Individuals with 2015 Marketplace Plan Selections with
the APTC in States Using the HealthCare.gov Platform
Page 52
Appendix C: Selected State-Level Tables – States Using Their Own Marketplace
Platforms
C1 – Marketplace Plan Selection by Enrollment Type in States
Using the HealthCare.gov Platform, By State
Page 54
C2 - Total Completed Applications and Individuals Who Completed
Applications in States Using Their Own Marketplace Platforms, By
State
Page 56
C3 - Total Marketplace Eligibility Determinations, and Marketplace
Plan Selections in States Using Their Own Marketplace Platforms,
By State
Page 58
C4 - Total Marketplace Plan Selections by Financial Assistance
Status in States Using Their Own Marketplace Platforms, By State
Page 60
C5 - Total Marketplace Plan Selections by Age in States Using Their
Own Marketplace Platforms, By State
Page 62
Appendix D: Technical Notes Page 64

ASPE Issue Brief Page 24
ASPE Office of Health Policy March 2015
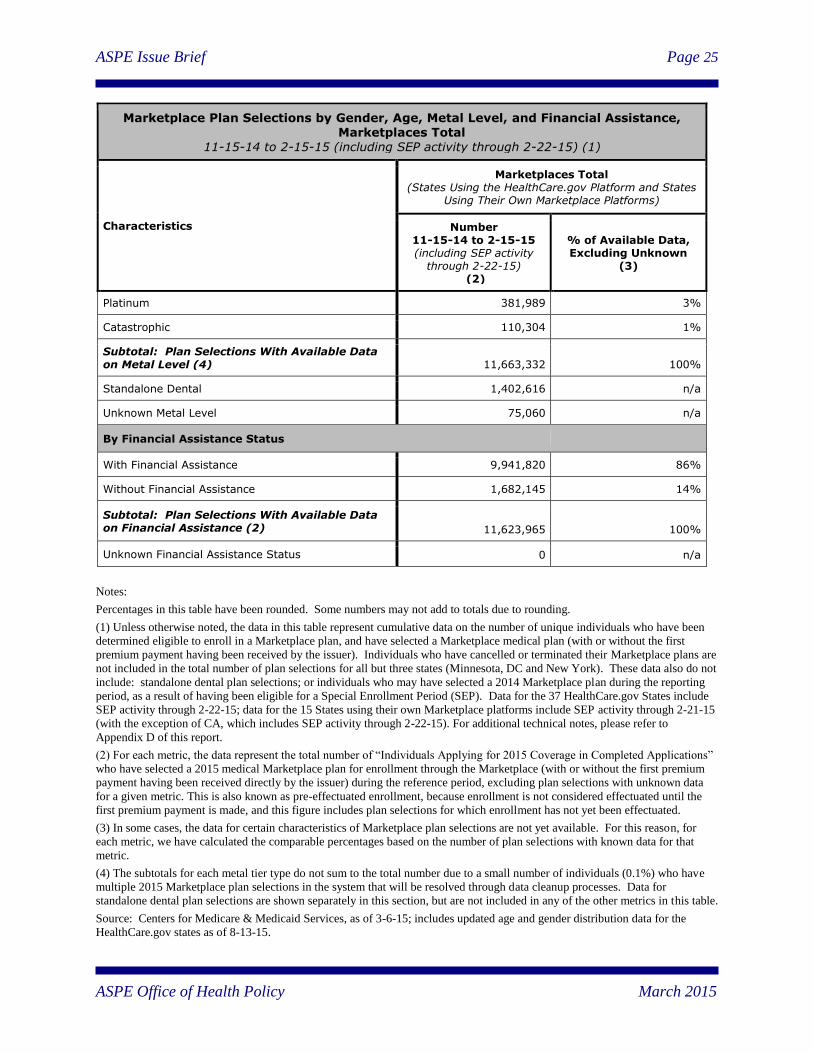
APPENDIX TABLE A1
Marketplace Plan Selections by Gender, Age, Metal Level, and Financial Assistance, Marketplaces Total
11-15-14 to 2-15-15 (including SEP activity through 2-22-15) (1)
Characteristics
Marketplaces Total (States Using the HealthCare.gov Platform and States
Using Their Own Marketplace Platforms)
Number
11-15-14 to 2-15-15 (including SEP activity
through 2-22-15) (2)
% of Available Data, Excluding Unknown
(3)
Total Who Have Selected a Marketplace Plan
Total Number of Individuals Who Have Selected or Been Automatically Reenrolled Into a 2015 Marketplace Plan 11,688,074 n/a
By Gender
Female 6,284,580 54%
Male 5,400,468 46%
Subtotal: Plan Selections With Available Data
on Gender 11,685,048 100%
Unknown Gender 3,026 n/a
By Age
Age < 18 790,500 8%
Age 18-25 1,080,178 11%
Age 26-34 1,656,817 17%
Age 35-44 1,644,622 17%
Age 45-54 2,140,683 22%
Age 55-64 2,484,441 25%
Age ≥65 59,475 1%
Subtotal: Plan Selections With Available Data on Age (2) 9,856,716 100%
Unknown Age 1,364,579 n/a
Ages 18 to 34 2,736,995 28%
Ages 0 to 34 3,527,495 36%
By Metal Level
Bronze 2,574,807 22%
Silver 7,801,379 67%
Gold 794,853 7%
ASPE Issue Brief Page 25
ASPE Office of Health Policy March 2015
Marketplace Plan Selections by Gender, Age, Metal Level, and Financial Assistance, Marketplaces Total
11-15-14 to 2-15-15 (including SEP activity through 2-22-15) (1)
Characteristics
Marketplaces Total (States Using the HealthCare.gov Platform and States
Using Their Own Marketplace Platforms)
Number 11-15-14 to 2-15-15 (including SEP activity
through 2-22-15) (2)
% of Available Data, Excluding Unknown
(3)
Platinum 381,989 3%
Catastrophic 110,304 1%
Subtotal: Plan Selections With Available Data on Metal Level (4) 11,663,332 100%
Standalone Dental 1,402,616 n/a
Unknown Metal Level 75,060 n/a
By Financial Assistance Status
With Financial Assistance 9,941,820 86%
Without Financial Assistance 1,682,145 14%
Subtotal: Plan Selections With Available Data on Financial Assistance (2) 11,623,965 100%
Unknown Financial Assistance Status 0 n/a
Notes:
Percentages in this table have been rounded. Some numbers may not add to totals due to rounding.
(1) Unless otherwise noted, the data in this table represent cumulative data on the number of unique individuals who have been
determined eligible to enroll in a Marketplace plan, and have selected a Marketplace medical plan (with or without the first
premium payment having been received by the issuer). Individuals who have cancelled or terminated their Marketplace plans are
not included in the total number of plan selections for all but three states (Minnesota, DC and New York). These data also do not
include: standalone dental plan selections; or individuals who may have selected a 2014 Marketplace plan during the reporting
period, as a result of having been eligible for a Special Enrollment Period (SEP). Data for the 37 HealthCare.gov States include
SEP activity through 2-22-15; data for the 15 States using their own Marketplace platforms include SEP activity through 2-21-15
(with the exception of CA, which includes SEP activity through 2-22-15). For additional technical notes, please refer to
Appendix D of this report.
(2) For each metric, the data represent the total number of “Individuals Applying for 2015 Coverage in Completed Applications”
who have selected a 2015 medical Marketplace plan for enrollment through the Marketplace (with or without the first premium
payment having been received directly by the issuer) during the reference period, excluding plan selections with unknown data
for a given metric. This is also known as pre-effectuated enrollment, because enrollment is not considered effectuated until the
first premium payment is made, and this figure includes plan selections for which enrollment has not yet been effectuated.
(3) In some cases, the data for certain characteristics of Marketplace plan selections are not yet available. For this reason, for
each metric, we have calculated the comparable percentages based on the number of plan selections with known data for that
metric.
(4) The subtotals for each metal tier type do not sum to the total number due to a small number of individuals (0.1%) who have
multiple 2015 Marketplace plan selections in the system that will be resolved through data cleanup processes. Data for
standalone dental plan selections are shown separately in this section, but are not included in any of the other metrics in this table.
Source: Centers for Medicare & Medicaid Services, as of 3-6-15; includes updated age and gender distribution data for the
HealthCare.gov states as of 8-13-15.
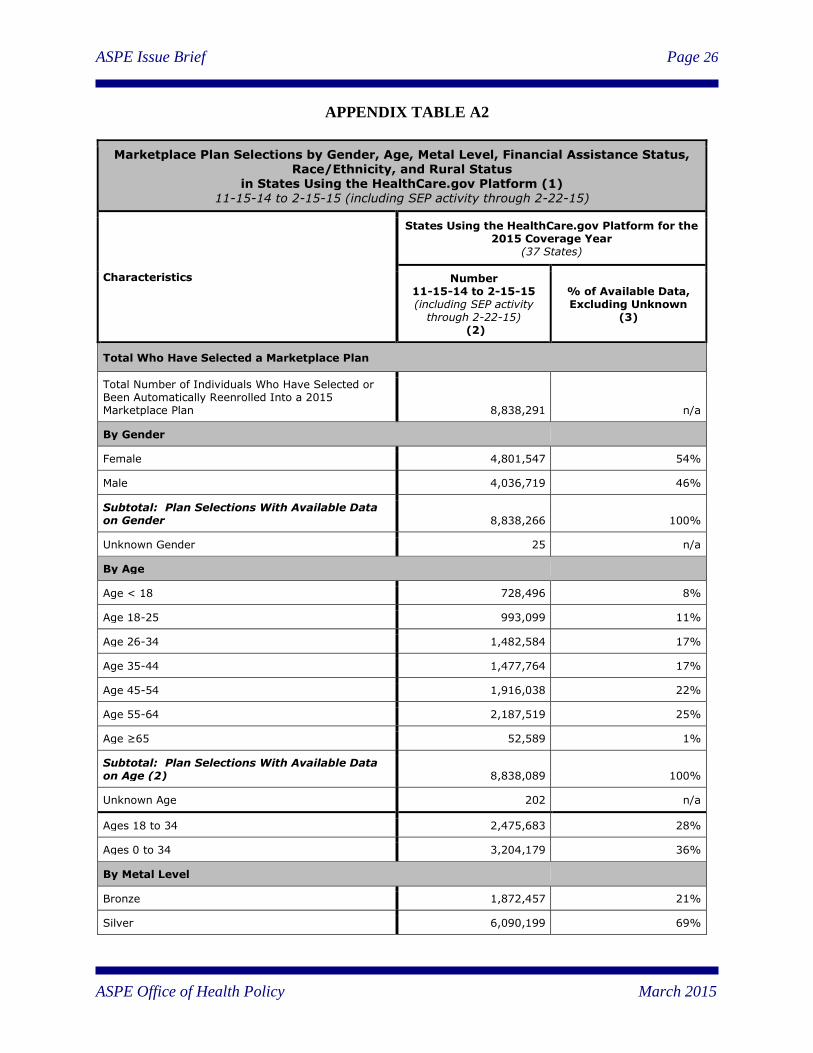
ASPE Issue Brief Page 26
ASPE Office of Health Policy March 2015
APPENDIX TABLE A2
Marketplace Plan Selections by Gender, Age, Metal Level, Financial Assistance Status, Race/Ethnicity, and Rural Status
in States Using the HealthCare.gov Platform (1) 11-15-14 to 2-15-15 (including SEP activity through 2-22-15)
Characteristics
States Using the HealthCare.gov Platform for the 2015 Coverage Year
(37 States)
Number 11-15-14 to 2-15-15 (including SEP activity
through 2-22-15) (2)
% of Available Data, Excluding Unknown
(3)
Total Who Have Selected a Marketplace Plan
Total Number of Individuals Who Have Selected or Been Automatically Reenrolled Into a 2015 Marketplace Plan 8,838,291 n/a
By Gender
Female 4,801,547 54%
Male 4,036,719 46%
Subtotal: Plan Selections With Available Data on Gender 8,838,266 100%
Unknown Gender 25 n/a
By Age
Age < 18 728,496 8%
Age 18-25 993,099 11%
Age 26-34 1,482,584 17%
Age 35-44 1,477,764 17%
Age 45-54 1,916,038 22%
Age 55-64 2,187,519 25%
Age ≥65 52,589 1%
Subtotal: Plan Selections With Available Data on Age (2) 8,838,089 100%
Unknown Age 202 n/a
Ages 18 to 34 2,475,683 28%
Ages 0 to 34 3,204,179 36%
By Metal Level
Bronze 1,872,457 21%
Silver 6,090,199 69%

ASPE Issue Brief Page 27
ASPE Office of Health Policy March 2015
Marketplace Plan Selections by Gender, Age, Metal Level, Financial Assistance Status, Race/Ethnicity, and Rural Status
in States Using the HealthCare.gov Platform (1) 11-15-14 to 2-15-15 (including SEP activity through 2-22-15)
Characteristics
States Using the HealthCare.gov Platform for the 2015 Coverage Year
(37 States)
Number 11-15-14 to 2-15-15 (including SEP activity
through 2-22-15) (2)
% of Available Data, Excluding Unknown
(3)
Gold 573,641 6%
Platinum 225,074 3%
Catastrophic 76,920 1%
Subtotal: Plan Selections With Available Data on Metal Level (4) 8,838,291 100%
Standalone Dental 1,377,874 n/a
Unknown Metal Level 0 n/a
By Financial Assistance Status
With Financial Assistance 7,690,911 87%
Without Financial Assistance 1,147,380 13%
Subtotal: Plan Selections With Available Data on Financial Assistance (2) 8,838,291 100%
Unknown Financial Assistance Status n/a n/a
By Self-Reported Race/Ethnicity
American Indian / Alaska Native 26,314 0%
Asian 460,293 8%
Native Hawaiian / Pacific Islander 5,145 0%
African-American 789,498 14%
Latino 613,053 11%
White 3,649,620 65%
Multiracial 76,609 1%
Subtotal: Plan Selections With Available Data on Self-Reported Race/Ethnicity 5,620,532
100%
Unknown Race/Ethnicity 3,217,759 n/a
By Rural Status
In ZIP Codes Designated as Rural 1,542,970 17%
In ZIP Codes Designated as Urban 7,295,321 83%
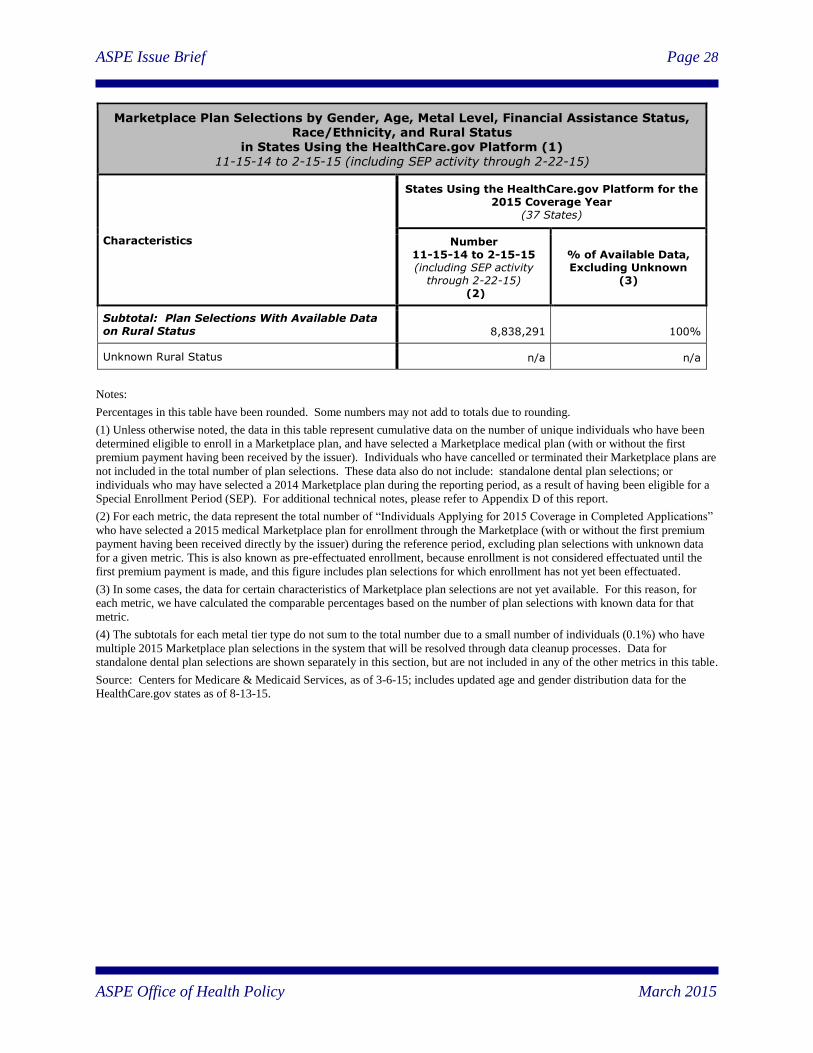
ASPE Issue Brief Page 28
ASPE Office of Health Policy March 2015
Marketplace Plan Selections by Gender, Age, Metal Level, Financial Assistance Status, Race/Ethnicity, and Rural Status
in States Using the HealthCare.gov Platform (1) 11-15-14 to 2-15-15 (including SEP activity through 2-22-15)
Characteristics
States Using the HealthCare.gov Platform for the 2015 Coverage Year
(37 States)
Number 11-15-14 to 2-15-15 (including SEP activity
through 2-22-15) (2)
% of Available Data, Excluding Unknown
(3)
Subtotal: Plan Selections With Available Data on Rural Status 8,838,291 100%
Unknown Rural Status n/a n/a
Notes:
Percentages in this table have been rounded. Some numbers may not add to totals due to rounding.
(1) Unless otherwise noted, the data in this table represent cumulative data on the number of unique individuals who have been
determined eligible to enroll in a Marketplace plan, and have selected a Marketplace medical plan (with or without the first
premium payment having been received by the issuer). Individuals who have cancelled or terminated their Marketplace plans are
not included in the total number of plan selections. These data also do not include: standalone dental plan selections; or
individuals who may have selected a 2014 Marketplace plan during the reporting period, as a result of having been eligible for a
Special Enrollment Period (SEP). For additional technical notes, please refer to Appendix D of this report.
(2) For each metric, the data represent the total number of “Individuals Applying for 2015 Coverage in Completed Applications”
who have selected a 2015 medical Marketplace plan for enrollment through the Marketplace (with or without the first premium
payment having been received directly by the issuer) during the reference period, excluding plan selections with unknown data
for a given metric. This is also known as pre-effectuated enrollment, because enrollment is not considered effectuated until the
first premium payment is made, and this figure includes plan selections for which enrollment has not yet been effectuated.
(3) In some cases, the data for certain characteristics of Marketplace plan selections are not yet available. For this reason, for
each metric, we have calculated the comparable percentages based on the number of plan selections with known data for that
metric.
(4) The subtotals for each metal tier type do not sum to the total number due to a small number of individuals (0.1%) who have
multiple 2015 Marketplace plan selections in the system that will be resolved through data cleanup processes. Data for
standalone dental plan selections are shown separately in this section, but are not included in any of the other metrics in this table.
Source: Centers for Medicare & Medicaid Services, as of 3-6-15; includes updated age and gender distribution data for the
HealthCare.gov states as of 8-13-15.
ASPE Issue Brief Page 29
ASPE Office of Health Policy March 2015
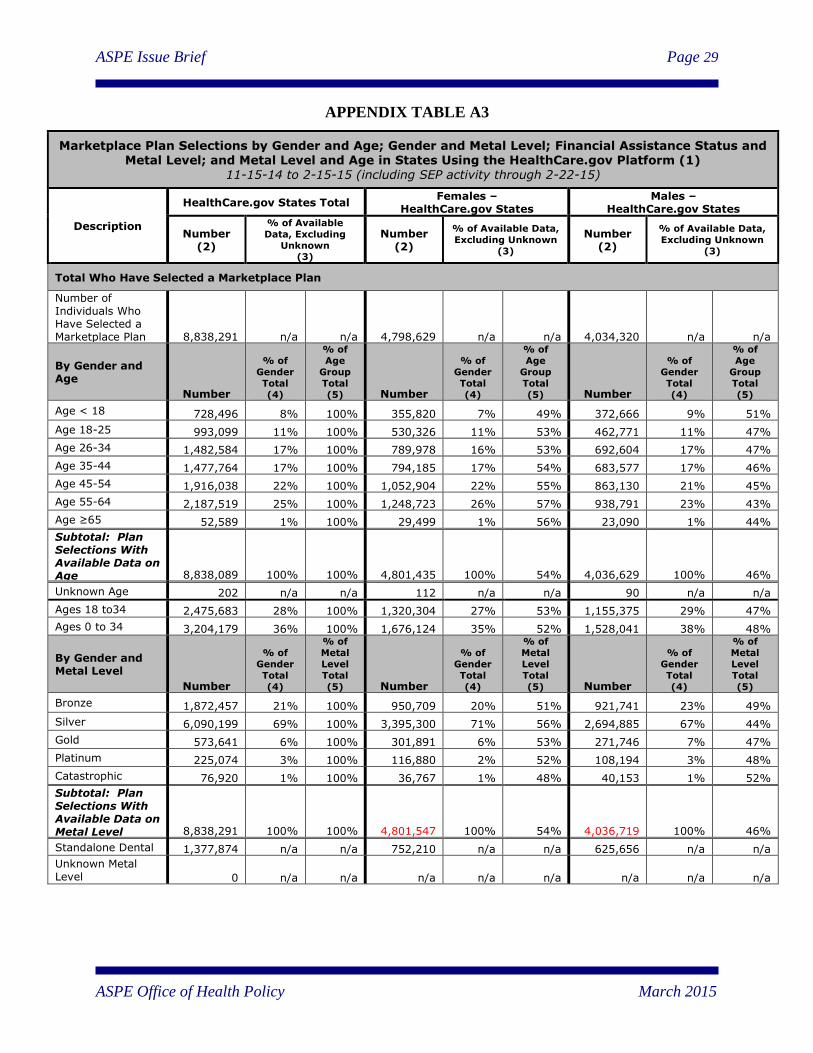
APPENDIX TABLE A3
Marketplace Plan Selections by Gender and Age; Gender and Metal Level; Financial Assistance Status and Metal Level; and Metal Level and Age in States Using the HealthCare.gov Platform (1)
11-15-14 to 2-15-15 (including SEP activity through 2-22-15)
Description
HealthCare.gov States Total Females –
HealthCare.gov States Males –
HealthCare.gov States
Number (2)
% of Available
Data, Excluding
Unknown (3)
Number (2)
% of Available Data,
Excluding Unknown
(3)
Number (2)
% of Available Data,
Excluding Unknown
(3)
Total Who Have Selected a Marketplace Plan
Number of Individuals Who Have Selected a Marketplace Plan 8,838,291 n/a n/a 4,798,629 n/a n/a 4,034,320 n/a n/a
By Gender and Age
Number
% of
Gender
Total
(4)
% of
Age
Group
Total
(5) Number
% of
Gender
Total
(4)
% of
Age
Group
Total
(5) Number
% of
Gender
Total
(4)
% of
Age
Group
Total
(5)
Age < 18 728,496 8% 100% 355,820 7% 49% 372,666 9% 51%
Age 18-25 993,099 11% 100% 530,326 11% 53% 462,771 11% 47%
Age 26-34 1,482,584 17% 100% 789,978 16% 53% 692,604 17% 47%
Age 35-44 1,477,764 17% 100% 794,185 17% 54% 683,577 17% 46%
Age 45-54 1,916,038 22% 100% 1,052,904 22% 55% 863,130 21% 45%
Age 55-64 2,187,519 25% 100% 1,248,723 26% 57% 938,791 23% 43%
Age ≥65 52,589 1% 100% 29,499 1% 56% 23,090 1% 44%
Subtotal: Plan Selections With Available Data on Age 8,838,089 100% 100% 4,801,435 100% 54% 4,036,629 100% 46%
Unknown Age 202 n/a n/a 112 n/a n/a 90 n/a n/a
Ages 18 to34 2,475,683 28% 100% 1,320,304 27% 53% 1,155,375 29% 47%
Ages 0 to 34 3,204,179 36% 100% 1,676,124 35% 52% 1,528,041 38% 48%
By Gender and Metal Level
Number
% of
Gender
Total
(4)
% of
Metal
Level
Total
(5) Number
% of
Gender
Total
(4)
% of
Metal
Level
Total
(5) Number
% of
Gender
Total
(4)
% of
Metal
Level
Total
(5)
Bronze 1,872,457 21% 100% 950,709 20% 51% 921,741 23% 49%
Silver 6,090,199 69% 100% 3,395,300 71% 56% 2,694,885 67% 44%
Gold 573,641 6% 100% 301,891 6% 53% 271,746 7% 47%
Platinum 225,074 3% 100% 116,880 2% 52% 108,194 3% 48%
Catastrophic 76,920 1% 100% 36,767 1% 48% 40,153 1% 52%
Subtotal: Plan Selections With Available Data on Metal Level 8,838,291 100% 100% 4,801,547 100% 54% 4,036,719 100% 46%
Standalone Dental 1,377,874 n/a n/a 752,210 n/a n/a 625,656 n/a n/a
Unknown Metal Level 0 n/a n/a n/a n/a n/a n/a n/a n/a
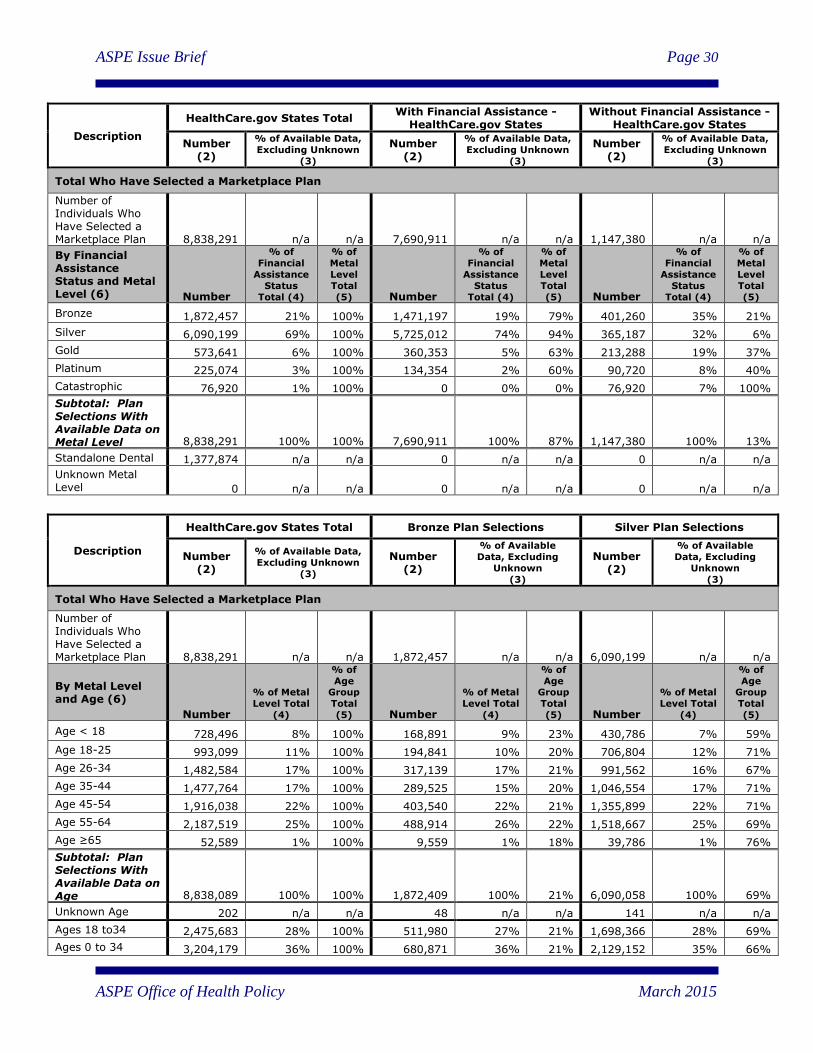
ASPE Issue Brief Page 30
ASPE Office of Health Policy March 2015
Description
HealthCare.gov States Total With Financial Assistance -
HealthCare.gov States Without Financial Assistance -
HealthCare.gov States
Number (2)
% of Available Data,
Excluding Unknown
(3)
Number (2)
% of Available Data,
Excluding Unknown
(3)
Number (2)
% of Available Data,
Excluding Unknown
(3)
Total Who Have Selected a Marketplace Plan
Number of Individuals Who Have Selected a Marketplace Plan 8,838,291 n/a n/a 7,690,911 n/a n/a 1,147,380 n/a n/a
By Financial Assistance Status and Metal Level (6) Number
% of
Financial
Assistance
Status
Total (4)
% of
Metal
Level
Total
(5) Number
% of
Financial
Assistance
Status
Total (4)
% of
Metal
Level
Total
(5) Number
% of
Financial
Assistance
Status
Total (4)
% of
Metal
Level
Total
(5)
Bronze 1,872,457 21% 100% 1,471,197 19% 79% 401,260 35% 21%
Silver 6,090,199 69% 100% 5,725,012 74% 94% 365,187 32% 6%
Gold 573,641 6% 100% 360,353 5% 63% 213,288 19% 37%
Platinum 225,074 3% 100% 134,354 2% 60% 90,720 8% 40%
Catastrophic 76,920 1% 100% 0 0% 0% 76,920 7% 100%
Subtotal: Plan Selections With Available Data on Metal Level 8,838,291 100% 100% 7,690,911 100% 87% 1,147,380 100% 13%
Standalone Dental 1,377,874 n/a n/a 0 n/a n/a 0 n/a n/a
Unknown Metal Level 0 n/a n/a 0 n/a n/a 0 n/a n/a
Description
HealthCare.gov States Total Bronze Plan Selections Silver Plan Selections
Number (2)
% of Available Data,
Excluding Unknown
(3)
Number (2)
% of Available
Data, Excluding
Unknown
(3)
Number (2)
% of Available
Data, Excluding
Unknown
(3)
Total Who Have Selected a Marketplace Plan
Number of Individuals Who Have Selected a Marketplace Plan 8,838,291 n/a n/a 1,872,457 n/a n/a 6,090,199 n/a n/a
By Metal Level and Age (6)
Number
% of Metal
Level Total
(4)
% of
Age Group
Total
(5) Number
% of Metal
Level Total
(4)
% of
Age Group
Total
(5) Number
% of Metal
Level Total
(4)
% of
Age Group
Total
(5)
Age < 18 728,496 8% 100% 168,891 9% 23% 430,786 7% 59%
Age 18-25 993,099 11% 100% 194,841 10% 20% 706,804 12% 71%
Age 26-34 1,482,584 17% 100% 317,139 17% 21% 991,562 16% 67%
Age 35-44 1,477,764 17% 100% 289,525 15% 20% 1,046,554 17% 71%
Age 45-54 1,916,038 22% 100% 403,540 22% 21% 1,355,899 22% 71%
Age 55-64 2,187,519 25% 100% 488,914 26% 22% 1,518,667 25% 69%
Age ≥65 52,589 1% 100% 9,559 1% 18% 39,786 1% 76%
Subtotal: Plan Selections With Available Data on Age 8,838,089 100% 100% 1,872,409 100% 21% 6,090,058 100% 69%
Unknown Age 202 n/a n/a 48 n/a n/a 141 n/a n/a
Ages 18 to34 2,475,683 28% 100% 511,980 27% 21% 1,698,366 28% 69%
Ages 0 to 34 3,204,179 36% 100% 680,871 36% 21% 2,129,152 35% 66%

ASPE Issue Brief Page 31
ASPE Office of Health Policy March 2015
Description
Gold Plan Selections Platinum Plan Selections Catastrophic Plan Selections
Number (2)
% of Available
Data, Excluding
Unknown
(3)
Number (2)
% of Available
Data, Excluding
Unknown
(3)
Number (2)
% of Available
Data, Excluding
Unknown
(3)
Total Who Have Selected a Marketplace Plan
Number of Individuals Who Have Selected a Marketplace Plan 573,641 n/a n/a 225,074 n/a n/a 76,920 n/a n/a
By Metal Level and Age (6)
Number
% of
Metal
Level
Total
(4)
% of
Age
Group
Total
(5) Number
% of
Metal
Level
Total
(4)
% of
Age
Group
Total
(5) Number
% of
Metal
Level
Total (4)
% of
Age
Group
Total
(5)
Age < 18 89,800 16% 12% 35,353 16% 5% 3,666 5% 1%
Age 18-25 46,125 8% 5% 19,557 9% 2% 25,772 34% 3%
Age 26-34 93,109 16% 6% 42,519 19% 3% 38,255 50% 3%
Age 35-44 93,549 16% 6% 43,805 19% 3% 4,331 6% 0%
Age 45-54 110,576 19% 6% 42,882 19% 2% 3,141 4% 0%
Age 55-64 138,214 24% 6% 39,972 18% 2% 1,752 2% 0%
Age ≥65 2,258 0% 4% 983 0% 2% n/a 0% 0%
Subtotal: Plan Selections With Available Data on Age 573,631 100% 6% 225,071 100% 3% 76,920 100% 1%
Unknown Age 10 n/a n/a n/a n/a n/a 0 n/a n/a
Ages 18 to34 139,234 24% 6% 62,076 28% 3% 64,027 83% 3%
Ages 0 to 34 229,034 40% 7% 97,429 43% 3% 67,693 88% 2%

ASPE Issue Brief Page 32
ASPE Office of Health Policy March 2015
Description Standalone Dental Plan Selections
Number (2) % of Available Data, Excluding
Unknown (3)
Total Who Have Selected a Marketplace Plan
Number of Individuals Who Have Selected a Marketplace Plan 1,377,874 n/a n/a
Number Who Have Selected a Standalone Dental Plan By Metal Level and Age
Number
% of Metal Level Total
(4)
% of Age Group Total
(5)
Age < 18 100,051 7% 14%
Age 18-25 159,446 12% 16%
Age 26-34 302,787 22% 20%
Age 35-44 261,065 19% 18%
Age 45-54 278,053 20% 15%
Age 55-64 270,051 20% 12%
Age ≥65 6,371 0% 12%
Subtotal: Plan Selections With Available Data on Age 1,377,824 100% 16%
Unknown Age 50 n/a n/a
Ages 18 to34 462,233 34% 19%
Ages 0 to 34 562,284 41% 18%
Notes:
Percentages in this table have been rounded. Some numbers may not add to totals due to rounding.
(1) Unless otherwise noted, the data in this table represent cumulative data on the number of unique individuals who have been
determined eligible to enroll in a Marketplace plan, and have selected a Marketplace medical plan (with or without the first
premium payment having been received by the issuer). Individuals who have cancelled or terminated their Marketplace plans are
not included in the total number of plan selections. These data also do not include: standalone dental plan selections; or
individuals who may have selected a 2014 Marketplace plan during the reporting period, as a result of having been eligible for a
Special Enrollment Period (SEP). For additional technical notes, please refer to Appendix D of this report.
(2) For each metric, the data represent the total number of “Individuals Applying for 2015 Coverage in Completed Applications”
who have selected a 2015 medical Marketplace plan for enrollment through the Marketplace (with or without the first premium
payment having been received directly by the issuer) during the reference period, excluding plan selections with unknown data
for a given metric. This is also known as pre-effectuated enrollment, because enrollment is not considered effectuated until the
first premium payment is made, and this figure includes plan selections for which enrollment has not yet been effectuated.
(3) In some cases, the data for certain characteristics of Marketplace plan selections are not yet available. For this reason, for
each metric, we have calculated the comparable percentages based on the number of plan selections with known data for that
metric.
(4) Represents the vertical percentage for the data that are being shown based on a given set of metrics. For example, if the rows
show Age Groups and the columns show Gender, then this percentage represents the data for a given Age Group / Gender
combination as a percentage of the comparable Gender total for all Age Groups (e.g., Persons between the ages of 18 and 34
represent X percent of the all of the Female Marketplace Plan selections).
(5) Represents the horizontal percentage of the data that are being shown based on a given set of metrics. For example, if the
rows show Age Groups and the columns show Gender, then this percentage represents the data for a given Age Group / Gender
combination as a percentage of the comparable Age Group total for all Genders (e.g., Females represent X percent of the
Marketplace Plan selections for persons between the ages of 18 and 34).
(6) The subtotals for each metal tier type do not sum to the total number due to a small number of individuals (0.1%) who have
multiple 2015 Marketplace plan selections in the system that will be resolved through data cleanup processes. Data for
standalone dental plan selections are shown separately in this section, but are not included in any of the other metrics in this table.
Source: Centers for Medicare & Medicaid Services, as of 3-6-15; includes updated age and gender distribution data for the
HealthCare.gov states as of 8-13-15.
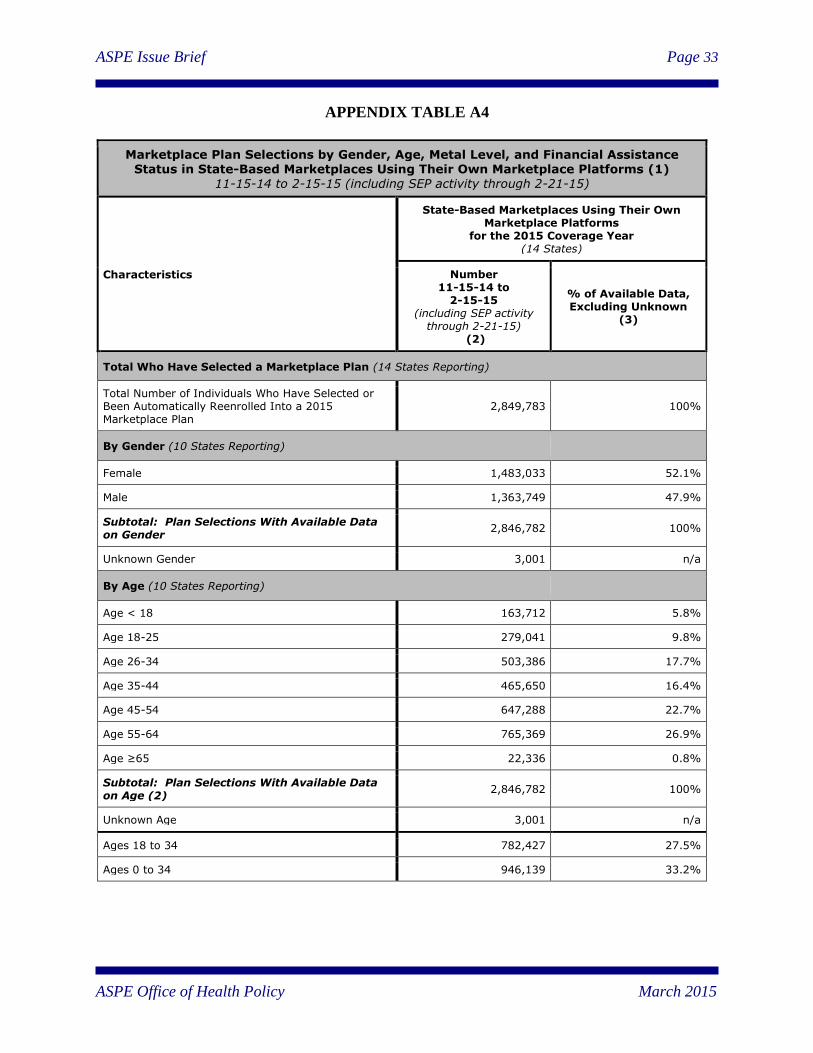
ASPE Issue Brief Page 33
ASPE Office of Health Policy March 2015
APPENDIX TABLE A4
Marketplace Plan Selections by Gender, Age, Metal Level, and Financial Assistance Status in State-Based Marketplaces Using Their Own Marketplace Platforms (1)
11-15-14 to 2-15-15 (including SEP activity through 2-21-15)
Characteristics
State-Based Marketplaces Using Their Own Marketplace Platforms
for the 2015 Coverage Year (14 States)
Number 11-15-14 to
2-15-15 (including SEP activity
through 2-21-15) (2)
% of Available Data, Excluding Unknown
(3)
Total Who Have Selected a Marketplace Plan (14 States Reporting)
Total Number of Individuals Who Have Selected or Been Automatically Reenrolled Into a 2015 Marketplace Plan
2,849,783 100%
By Gender (10 States Reporting)
Female 1,483,033 52.1%
Male 1,363,749 47.9%
Subtotal: Plan Selections With Available Data on Gender 2,846,782 100%
Unknown Gender 3,001 n/a
By Age (10 States Reporting)
Age < 18 163,712 5.8%
Age 18-25 279,041 9.8%
Age 26-34 503,386 17.7%
Age 35-44 465,650 16.4%
Age 45-54 647,288 22.7%
Age 55-64 765,369 26.9%
Age ≥65 22,336 0.8%
Subtotal: Plan Selections With Available Data on Age (2) 2,846,782 100%
Unknown Age 3,001 n/a
Ages 18 to 34 782,427 27.5%
Ages 0 to 34 946,139 33.2%

ASPE Issue Brief Page 34
ASPE Office of Health Policy March 2015
Marketplace Plan Selections by Gender, Age, Metal Level, and Financial Assistance Status in State-Based Marketplaces Using Their Own Marketplace Platforms (1)
11-15-14 to 2-15-15 (including SEP activity through 2-21-15)
Characteristics
State-Based Marketplaces Using Their Own Marketplace Platforms
for the 2015 Coverage Year (14 States)
Number 11-15-14 to
2-15-15 (including SEP activity
through 2-21-15) (2)
% of Available Data, Excluding Unknown
(3)
By Metal Level (10 States Reporting)
Bronze 702,350 24.9%
Silver 1,711,180 60.6%
Gold 221,212 7.8%
Platinum 156,915 5.6%
Catastrophic 33,384 1.2%
Subtotal: Plan Selections With Available Data on Metal Level (4) 2,825,041 100%
Standalone Dental 24,742 n/a
Unknown Metal Level 75,060 n/a
By Financial Assistance Status (9 States Reporting)
With Financial Assistance 2,250,909 80.8%
Without Financial Assistance 534,765 19.2%
Subtotal: Plan Selections With Available Data on Financial Assistance (2) 2,785,674 100%
Unknown Financial Assistance Status 64,109 n/a
Notes:
Percentages in this table have been rounded. Some numbers may not add to totals due to rounding.
(1) Unless otherwise noted, the data in this table represent cumulative data on the number of unique individuals who have been
determined eligible to enroll in a Marketplace plan, and have selected a Marketplace medical plan (with or without the first
premium payment having been received by the issuer). These data do not include a count of the number of individuals who have
selected a standalone dental plan; or individuals who may have selected a 2014 Marketplace plan during the reporting period, as a
result of having been eligible for a Special Enrollment Period (SEP). Except for three states, the data for total number of plan
selections removes cancellations and terminations. Minnesota does not remove either from its total plan selection data, whereas
DC removes cancellations and terminations from its automatic reenrollment data and New York removes cancellations and
terminations from its active and automatic reenrollee data. For additional technical notes, please refer to Appendix D of this
report.
All states except DC, Minnesota, New York, and Washington removed cancellations and terminations from all total plan
selection data. DC removed cancellations and terminations from its auto reenrollee data. New York removed cancellations and
terminations from all of its reenrollee data, active and automatic, but did not remove them from the “new” plan selections.
Washington removed terminations from all of their plan selection data. Minnesota did not remove cancellations and terminations
from its plan selection data.
ASPE Issue Brief Page 35
ASPE Office of Health Policy March 2015
(2) For each metric, the data represent the total number of “Individuals Applying for 2015 Coverage in Completed Applications”
who have selected a 2015 medical Marketplace plan for enrollment through the Marketplace (with or without the first premium
payment having been received directly by the issuer) during the reference period, excluding plan selections with unknown data
for a given metric. This is also known as pre-effectuated enrollment, because enrollment is not considered effectuated until the
first premium payment is made, and this figure includes plan selections for which enrollment has not yet been effectuated. (3) In
some cases, the data for certain characteristics of Marketplace plan selections are not yet available. For this reason, for each
metric, we have calculated the comparable percentages based on the number of plan selections with known data for that metric.
(4) The subtotals for each metal tier type do not sum to the total number due to a small number of individuals (0.1%) who have
multiple 2015 Marketplace plan selections in the system that will be resolved through data cleanup processes. Data for
standalone dental plan selections are shown separately in this section, but are not included in any of the other metrics in this table.
Source: Centers for Medicare & Medicaid Services, as of 3-6-15.
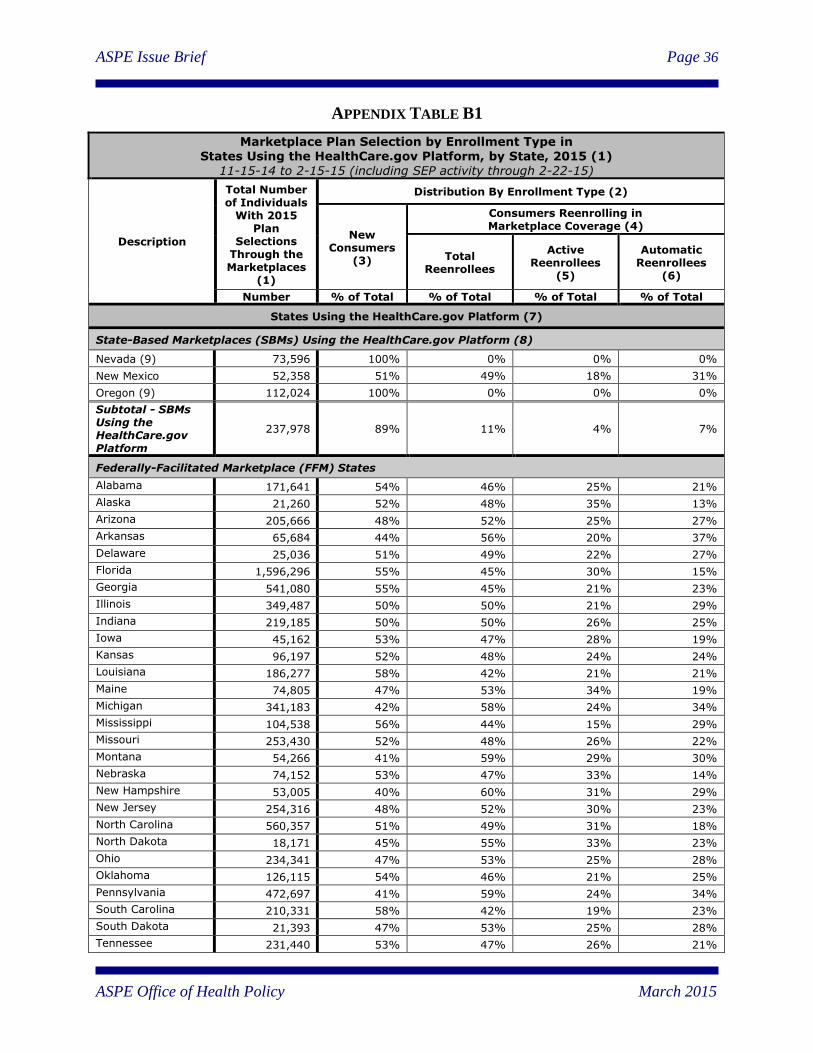
ASPE Issue Brief Page 36
ASPE Office of Health Policy March 2015
APPENDIX TABLE B1
Marketplace Plan Selection by Enrollment Type in States Using the HealthCare.gov Platform, by State, 2015 (1)
11-15-14 to 2-15-15 (including SEP activity through 2-22-15)
Description
Total Number of Individuals
With 2015 Plan
Selections Through the Marketplaces
(1)
Distribution By Enrollment Type (2)
New Consumers
(3)
Consumers Reenrolling in Marketplace Coverage (4)
Total Reenrollees
Active Reenrollees
(5)
Automatic Reenrollees
(6)
Number % of Total % of Total % of Total % of Total
States Using the HealthCare.gov Platform (7)
State-Based Marketplaces (SBMs) Using the HealthCare.gov Platform (8)
Nevada (9) 73,596 100% 0% 0% 0%
New Mexico 52,358 51% 49% 18% 31%
Oregon (9) 112,024 100% 0% 0% 0%
Subtotal - SBMs Using the HealthCare.gov Platform
237,978 89% 11% 4% 7%
Federally-Facilitated Marketplace (FFM) States
Alabama 171,641 54% 46% 25% 21%
Alaska 21,260 52% 48% 35% 13%
Arizona 205,666 48% 52% 25% 27%
Arkansas 65,684 44% 56% 20% 37%
Delaware 25,036 51% 49% 22% 27%
Florida 1,596,296 55% 45% 30% 15%
Georgia 541,080 55% 45% 21% 23%
Illinois 349,487 50% 50% 21% 29%
Indiana 219,185 50% 50% 26% 25%
Iowa 45,162 53% 47% 28% 19%
Kansas 96,197 52% 48% 24% 24%
Louisiana 186,277 58% 42% 21% 21%
Maine 74,805 47% 53% 34% 19%
Michigan 341,183 42% 58% 24% 34%
Mississippi 104,538 56% 44% 15% 29%
Missouri 253,430 52% 48% 26% 22%
Montana 54,266 41% 59% 29% 30%
Nebraska 74,152 53% 47% 33% 14%
New Hampshire 53,005 40% 60% 31% 29%
New Jersey 254,316 48% 52% 30% 23%
North Carolina 560,357 51% 49% 31% 18%
North Dakota 18,171 45% 55% 33% 23%
Ohio 234,341 47% 53% 25% 28%
Oklahoma 126,115 54% 46% 21% 25%
Pennsylvania 472,697 41% 59% 24% 34%
South Carolina 210,331 58% 42% 19% 23%
South Dakota 21,393 47% 53% 25% 28%
Tennessee 231,440 53% 47% 26% 21%

ASPE Issue Brief Page 37
ASPE Office of Health Policy March 2015
Marketplace Plan Selection by Enrollment Type in
States Using the HealthCare.gov Platform, by State, 2015 (1) 11-15-14 to 2-15-15 (including SEP activity through 2-22-15)
Description
Total Number of Individuals
With 2015 Plan
Selections Through the Marketplaces
(1)
Distribution By Enrollment Type (2)
New Consumers
(3)
Consumers Reenrolling in Marketplace Coverage (4)
Total Reenrollees
Active Reenrollees
(5)
Automatic Reenrollees
(6)
Number % of Total % of Total % of Total % of Total
Texas 1,205,174 57% 43% 21% 22%
Utah 140,612 49% 51% 24% 27%
Virginia 385,154 54% 46% 26% 20%
West Virginia 33,421 49% 51% 24% 26%
Wisconsin 207,349 44% 56% 32% 24%
Wyoming 21,092 48% 52% 28% 24%
TOTAL – States Using the HealthCare.gov Platform
8,838,291 53% 47% 25% 22%
Notes:
“N/A” means that the data for the respective metric are not yet available for a given state.
(1) Unless otherwise noted, the data in these tables represent cumulative data on the number of unique individuals who have
selected or have been automatically reenrolled into a 2015 Marketplace medical plan for enrollment through the Marketplaces (with or without the first premium payment having been received directly by the issuer). This is also known as pre-effectuated
enrollment, because enrollment is not considered effectuated until the first premium payment is made, and this figure includes
plan selections for which enrollment has not yet been effectuated. Individuals who have cancelled or terminated their
Marketplace plans are not included in the total number of plan selections. These data also do not include: standalone dental plan
selections; or individuals who may have selected a 2014 Marketplace plan during the reporting period, as a result of having been
eligible for a Special Enrollment Period (SEP). This table only reflects data for the individual market Marketplaces. For
additional technical notes, please refer to Appendix D of this report.
(2) “Distribution by Enrollment Type” represents the percentage of plan selections with available data on enrollment type that are
new consumers vs. consumers reenrolling in coverage through the Marketplaces.
(3) “New Consumers” are those individuals who selected a 2015 Marketplace medical plan (with or without the first premium
payment having been received directly by the issuer) as of the reporting date, and did not have a Marketplace plan selection as of
November 2014. Individuals who have cancelled or terminated their Marketplace plans are not included in the total number of
plan selections. These data also do not include: standalone dental plan selections; or individuals who may have selected a 2014
Marketplace plan during the reporting period, as a result of having been eligible for a Special Enrollment Period (SEP).
(4) “Consumers reenrolling in coverage through the Marketplaces” are those individuals who had a Marketplace plan selection as
of November 2014, and have either actively submitted a 2015 application and selected a 2015 Marketplace medical plan or have
been automatically reenrolled in coverage through the Marketplaces – with or without the first premium payment having been
received directly by the issuer). Individuals who have cancelled or terminated their Marketplace plans are not included in the
total number of plan selections. These data also do not include: standalone dental plan selections; or individuals who may have
selected a 2014 Marketplace plan during the reporting period, as a result of having been eligible for a Special Enrollment Period
(SEP). It is important to note that the reenrollment data in this report may include some individuals who were reenrolled in
coverage through the Marketplaces as of 2-15-15 (including SEP activity through 2-22-15), but who may ultimately decide not to
retain Marketplace coverage for the remainder of 2015 (for example, because they have obtained coverage through another
source such as an employer or Medicaid/CHIP). The plan selection data in future reports will exclude these individuals (e.g., due
to the subsequent cancellation or termination of their coverage).
(5) Active reenrollees are individuals who had a Marketplace plan selection as of November 2014, and return to the Marketplace
to select a new plan or actively renew their existing plan.
(6) Automatic Reenrollees are individuals who had a Marketplace plan selection as of November 2014, and retain coverage
without returning to the Marketplace and selecting a plan. A consumer was automatically reenrolled into their 2014 plan or a
plan with similar benefits from their same issuer if they were enrolled in a Marketplace plan in 2014 and did not select a plan
ahead of the 12-15-14 deadline. If the consumer realized after the deadline that there was a better plan for their family or needed
ASPE Issue Brief Page 38
ASPE Office of Health Policy March 2015
to update their information, the consumer could make that change before 2-15-15, and would at that point be considered as
having actively selected a plan.
(7) For the HealthCare.gov states, the data on 2015 Marketplace plan selections includes data for new consumers and consumers
who reenrolling in Marketplace coverage (including data for consumers who actively reenrolled in coverage through the
Marketplaces, and data for automatic reenrollees).
(8) Nevada, New Mexico, and Oregon are using the HealthCare.gov platform for 2015.
(9) Nevada and Oregon changed Marketplace platforms in 2015. Therefore, their 2015 Marketplace plan selections are generally
being classified as new consumers for operational enrollment and reporting purposes. However, a small number of 2015 plan
selections in these states may be classified as consumers reenrolling in coverage through the Marketplaces in cases where an
individual who had an active 2014 Marketplace plan selection in a HealthCare.gov state signs up for 2015 coverage in Oregon or
Nevada.
Source: Centers for Medicare & Medicaid Services, as of 3-6-15.
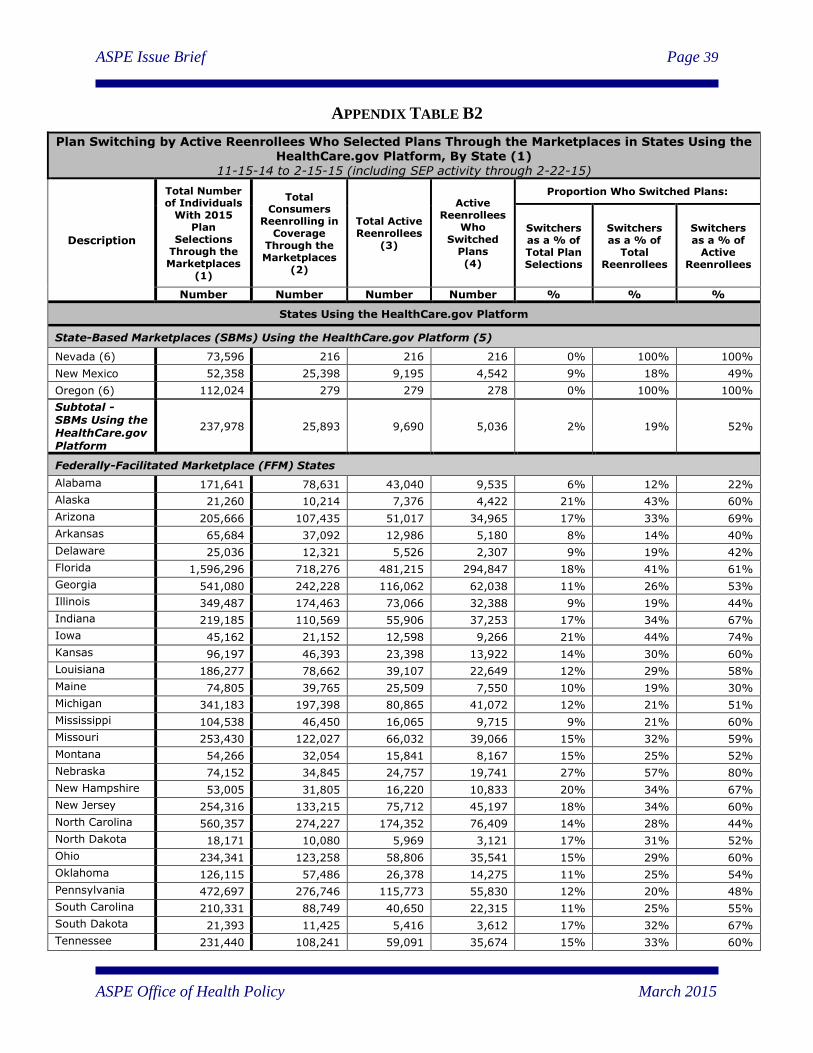
ASPE Issue Brief Page 39
ASPE Office of Health Policy March 2015
APPENDIX TABLE B2
Plan Switching by Active Reenrollees Who Selected Plans Through the Marketplaces in States Using the HealthCare.gov Platform, By State (1)
11-15-14 to 2-15-15 (including SEP activity through 2-22-15)
Description
Total Number of Individuals
With 2015 Plan
Selections Through the Marketplaces
(1)
Total Consumers
Reenrolling in Coverage
Through the Marketplaces
(2)
Total Active Reenrollees
(3)
Active Reenrollees
Who Switched
Plans (4)
Proportion Who Switched Plans:
Switchers as a % of Total Plan Selections
Switchers as a % of
Total Reenrollees
Switchers as a % of
Active Reenrollees
Number Number Number Number % % %
States Using the HealthCare.gov Platform
State-Based Marketplaces (SBMs) Using the HealthCare.gov Platform (5)
Nevada (6) 73,596 216 216 216 0% 100% 100%
New Mexico 52,358 25,398 9,195 4,542 9% 18% 49%
Oregon (6) 112,024 279 279 278 0% 100% 100%
Subtotal - SBMs Using the HealthCare.gov Platform
237,978 25,893 9,690 5,036 2% 19% 52%
Federally-Facilitated Marketplace (FFM) States
Alabama 171,641 78,631 43,040 9,535 6% 12% 22%
Alaska 21,260 10,214 7,376 4,422 21% 43% 60%
Arizona 205,666 107,435 51,017 34,965 17% 33% 69%
Arkansas 65,684 37,092 12,986 5,180 8% 14% 40%
Delaware 25,036 12,321 5,526 2,307 9% 19% 42%
Florida 1,596,296 718,276 481,215 294,847 18% 41% 61%
Georgia 541,080 242,228 116,062 62,038 11% 26% 53%
Illinois 349,487 174,463 73,066 32,388 9% 19% 44%
Indiana 219,185 110,569 55,906 37,253 17% 34% 67%
Iowa 45,162 21,152 12,598 9,266 21% 44% 74%
Kansas 96,197 46,393 23,398 13,922 14% 30% 60%
Louisiana 186,277 78,662 39,107 22,649 12% 29% 58%
Maine 74,805 39,765 25,509 7,550 10% 19% 30%
Michigan 341,183 197,398 80,865 41,072 12% 21% 51%
Mississippi 104,538 46,450 16,065 9,715 9% 21% 60%
Missouri 253,430 122,027 66,032 39,066 15% 32% 59%
Montana 54,266 32,054 15,841 8,167 15% 25% 52%
Nebraska 74,152 34,845 24,757 19,741 27% 57% 80%
New Hampshire 53,005 31,805 16,220 10,833 20% 34% 67%
New Jersey 254,316 133,215 75,712 45,197 18% 34% 60%
North Carolina 560,357 274,227 174,352 76,409 14% 28% 44%
North Dakota 18,171 10,080 5,969 3,121 17% 31% 52%
Ohio 234,341 123,258 58,806 35,541 15% 29% 60%
Oklahoma 126,115 57,486 26,378 14,275 11% 25% 54%
Pennsylvania 472,697 276,746 115,773 55,830 12% 20% 48%
South Carolina 210,331 88,749 40,650 22,315 11% 25% 55%
South Dakota 21,393 11,425 5,416 3,612 17% 32% 67%
Tennessee 231,440 108,241 59,091 35,674 15% 33% 60%
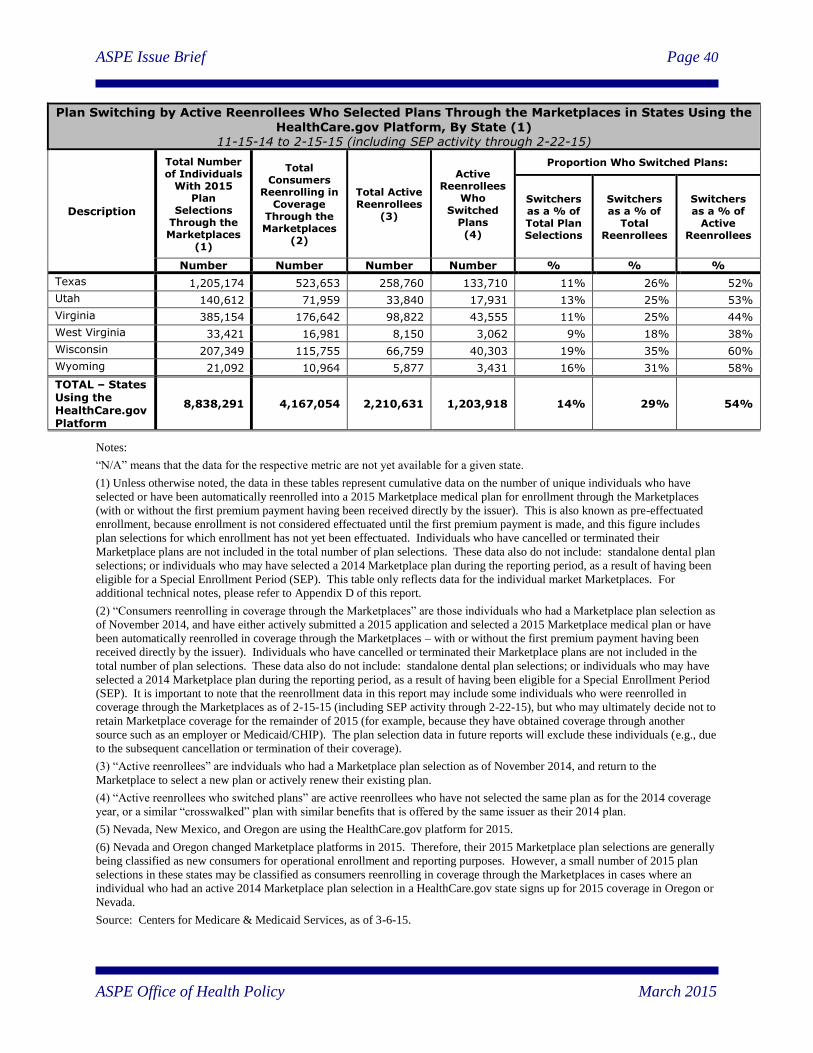
ASPE Issue Brief Page 40
ASPE Office of Health Policy March 2015
Plan Switching by Active Reenrollees Who Selected Plans Through the Marketplaces in States Using the
HealthCare.gov Platform, By State (1) 11-15-14 to 2-15-15 (including SEP activity through 2-22-15)
Description
Total Number of Individuals
With 2015 Plan
Selections Through the Marketplaces
(1)
Total Consumers
Reenrolling in Coverage
Through the Marketplaces
(2)
Total Active Reenrollees
(3)
Active Reenrollees
Who Switched
Plans (4)
Proportion Who Switched Plans:
Switchers as a % of Total Plan Selections
Switchers as a % of
Total Reenrollees
Switchers as a % of
Active Reenrollees
Number Number Number Number % % %
Texas 1,205,174 523,653 258,760 133,710 11% 26% 52%
Utah 140,612 71,959 33,840 17,931 13% 25% 53%
Virginia 385,154 176,642 98,822 43,555 11% 25% 44%
West Virginia 33,421 16,981 8,150 3,062 9% 18% 38%
Wisconsin 207,349 115,755 66,759 40,303 19% 35% 60%
Wyoming 21,092 10,964 5,877 3,431 16% 31% 58%
TOTAL – States Using the HealthCare.gov Platform
8,838,291 4,167,054 2,210,631 1,203,918 14% 29% 54%
Notes:
“N/A” means that the data for the respective metric are not yet available for a given state.
(1) Unless otherwise noted, the data in these tables represent cumulative data on the number of unique individuals who have
selected or have been automatically reenrolled into a 2015 Marketplace medical plan for enrollment through the Marketplaces (with or without the first premium payment having been received directly by the issuer). This is also known as pre-effectuated
enrollment, because enrollment is not considered effectuated until the first premium payment is made, and this figure includes
plan selections for which enrollment has not yet been effectuated. Individuals who have cancelled or terminated their
Marketplace plans are not included in the total number of plan selections. These data also do not include: standalone dental plan
selections; or individuals who may have selected a 2014 Marketplace plan during the reporting period, as a result of having been
eligible for a Special Enrollment Period (SEP). This table only reflects data for the individual market Marketplaces. For
additional technical notes, please refer to Appendix D of this report.
(2) “Consumers reenrolling in coverage through the Marketplaces” are those individuals who had a Marketplace plan selection as
of November 2014, and have either actively submitted a 2015 application and selected a 2015 Marketplace medical plan or have
been automatically reenrolled in coverage through the Marketplaces – with or without the first premium payment having been
received directly by the issuer). Individuals who have cancelled or terminated their Marketplace plans are not included in the
total number of plan selections. These data also do not include: standalone dental plan selections; or individuals who may have
selected a 2014 Marketplace plan during the reporting period, as a result of having been eligible for a Special Enrollment Period
(SEP). It is important to note that the reenrollment data in this report may include some individuals who were reenrolled in
coverage through the Marketplaces as of 2-15-15 (including SEP activity through 2-22-15), but who may ultimately decide not to
retain Marketplace coverage for the remainder of 2015 (for example, because they have obtained coverage through another
source such as an employer or Medicaid/CHIP). The plan selection data in future reports will exclude these individuals (e.g., due
to the subsequent cancellation or termination of their coverage).
(3) “Active reenrollees” are indviduals who had a Marketplace plan selection as of November 2014, and return to the
Marketplace to select a new plan or actively renew their existing plan.
(4) “Active reenrollees who switched plans” are active reenrollees who have not selected the same plan as for the 2014 coverage
year, or a similar “crosswalked” plan with similar benefits that is offered by the same issuer as their 2014 plan.
(5) Nevada, New Mexico, and Oregon are using the HealthCare.gov platform for 2015.
(6) Nevada and Oregon changed Marketplace platforms in 2015. Therefore, their 2015 Marketplace plan selections are generally
being classified as new consumers for operational enrollment and reporting purposes. However, a small number of 2015 plan
selections in these states may be classified as consumers reenrolling in coverage through the Marketplaces in cases where an
individual who had an active 2014 Marketplace plan selection in a HealthCare.gov state signs up for 2015 coverage in Oregon or
Nevada.
Source: Centers for Medicare & Medicaid Services, as of 3-6-15.
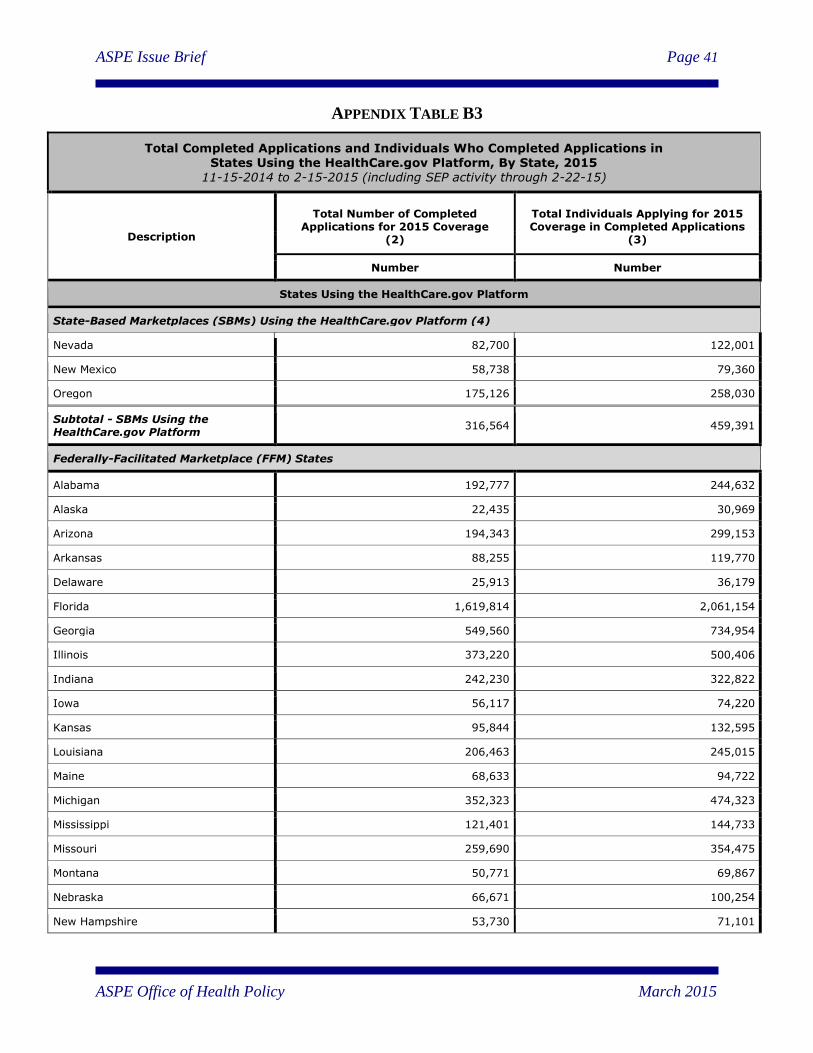
ASPE Issue Brief Page 41
ASPE Office of Health Policy March 2015
APPENDIX TABLE B3
Total Completed Applications and Individuals Who Completed Applications in States Using the HealthCare.gov Platform, By State, 2015
11-15-2014 to 2-15-2015 (including SEP activity through 2-22-15)
Description
Total Number of Completed Applications for 2015 Coverage
(2)
Total Individuals Applying for 2015 Coverage in Completed Applications
(3)
Number Number
States Using the HealthCare.gov Platform
State-Based Marketplaces (SBMs) Using the HealthCare.gov Platform (4)
Nevada 82,700 122,001
New Mexico 58,738 79,360
Oregon 175,126 258,030
Subtotal - SBMs Using the HealthCare.gov Platform 316,564 459,391
Federally-Facilitated Marketplace (FFM) States
Alabama 192,777 244,632
Alaska 22,435 30,969
Arizona 194,343 299,153
Arkansas 88,255 119,770
Delaware 25,913 36,179
Florida 1,619,814 2,061,154
Georgia 549,560 734,954
Illinois 373,220 500,406
Indiana 242,230 322,822
Iowa 56,117 74,220
Kansas 95,844 132,595
Louisiana 206,463 245,015
Maine 68,633 94,722
Michigan 352,323 474,323
Mississippi 121,401 144,733
Missouri 259,690 354,475
Montana 50,771 69,867
Nebraska 66,671 100,254
New Hampshire 53,730 71,101
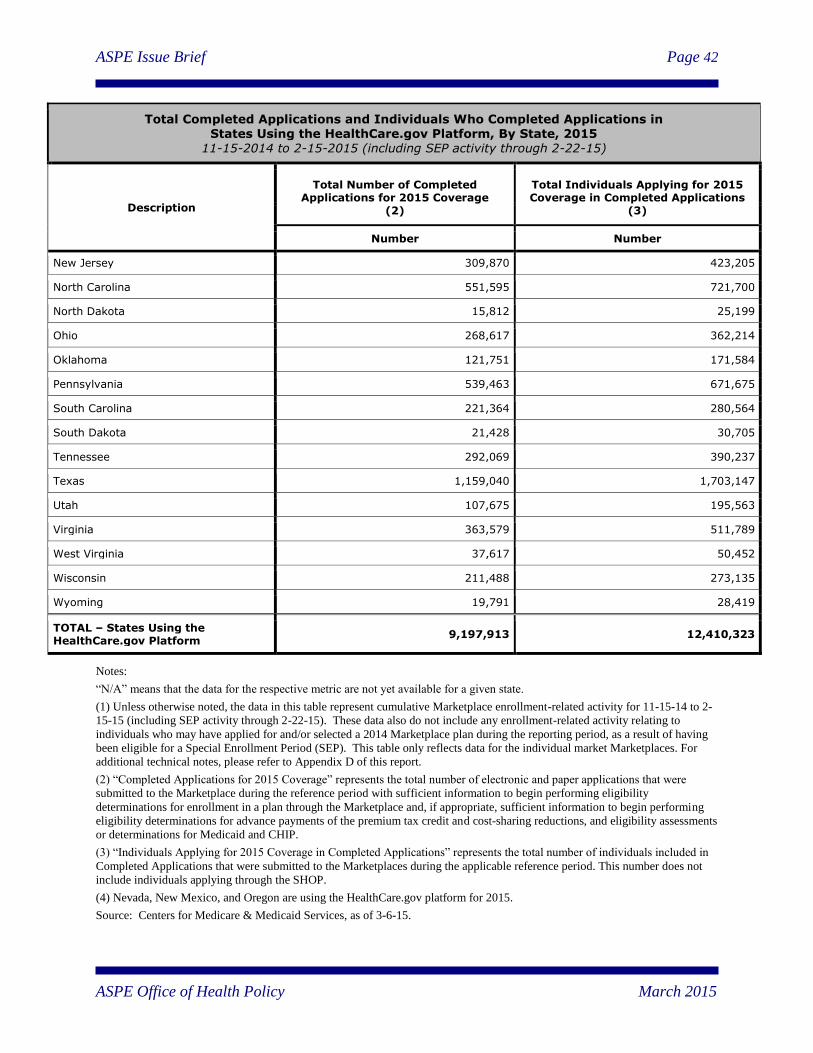
ASPE Issue Brief Page 42
ASPE Office of Health Policy March 2015
Total Completed Applications and Individuals Who Completed Applications in States Using the HealthCare.gov Platform, By State, 2015
11-15-2014 to 2-15-2015 (including SEP activity through 2-22-15)
Description
Total Number of Completed Applications for 2015 Coverage
(2)
Total Individuals Applying for 2015 Coverage in Completed Applications
(3)
Number Number
New Jersey 309,870 423,205
North Carolina 551,595 721,700
North Dakota 15,812 25,199
Ohio 268,617 362,214
Oklahoma 121,751 171,584
Pennsylvania 539,463 671,675
South Carolina 221,364 280,564
South Dakota 21,428 30,705
Tennessee 292,069 390,237
Texas 1,159,040 1,703,147
Utah 107,675 195,563
Virginia 363,579 511,789
West Virginia 37,617 50,452
Wisconsin 211,488 273,135
Wyoming 19,791 28,419
TOTAL – States Using the HealthCare.gov Platform 9,197,913 12,410,323
Notes:
“N/A” means that the data for the respective metric are not yet available for a given state.
(1) Unless otherwise noted, the data in this table represent cumulative Marketplace enrollment-related activity for 11-15-14 to 2-
15-15 (including SEP activity through 2-22-15). These data also do not include any enrollment-related activity relating to
individuals who may have applied for and/or selected a 2014 Marketplace plan during the reporting period, as a result of having
been eligible for a Special Enrollment Period (SEP). This table only reflects data for the individual market Marketplaces. For
additional technical notes, please refer to Appendix D of this report.
(2) “Completed Applications for 2015 Coverage” represents the total number of electronic and paper applications that were
submitted to the Marketplace during the reference period with sufficient information to begin performing eligibility
determinations for enrollment in a plan through the Marketplace and, if appropriate, sufficient information to begin performing
eligibility determinations for advance payments of the premium tax credit and cost-sharing reductions, and eligibility assessments
or determinations for Medicaid and CHIP.
(3) “Individuals Applying for 2015 Coverage in Completed Applications” represents the total number of individuals included in
Completed Applications that were submitted to the Marketplaces during the applicable reference period. This number does not
include individuals applying through the SHOP.
(4) Nevada, New Mexico, and Oregon are using the HealthCare.gov platform for 2015.
Source: Centers for Medicare & Medicaid Services, as of 3-6-15.
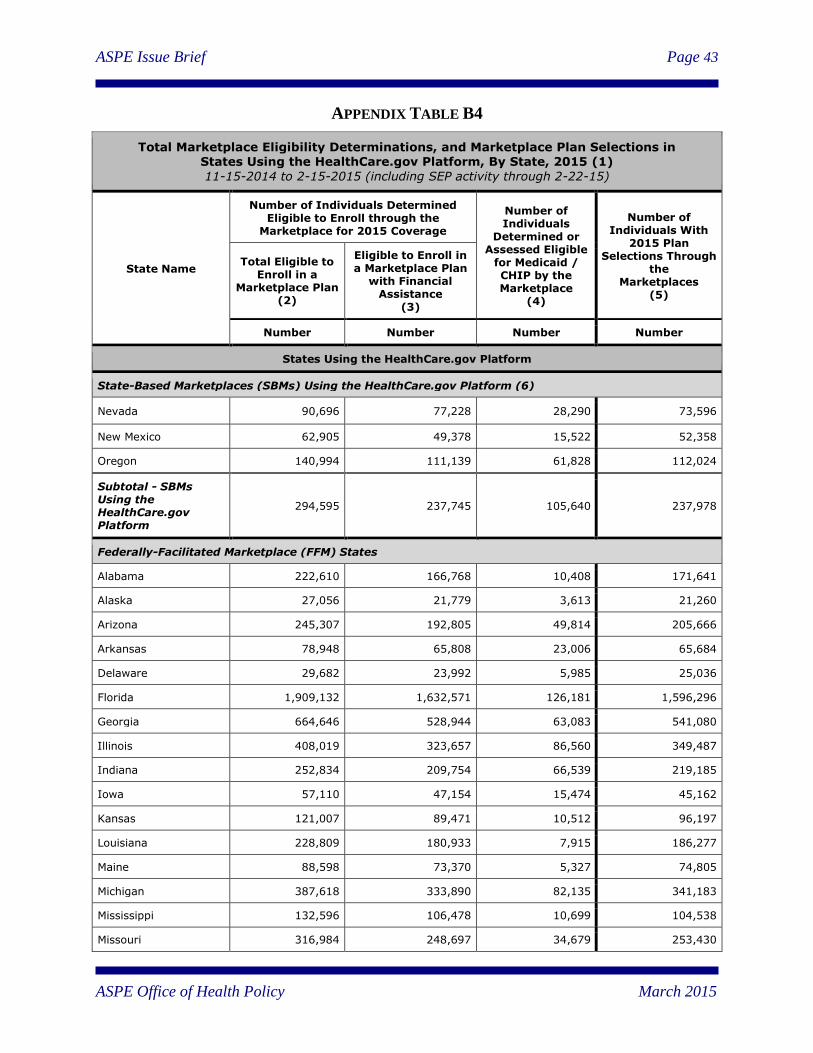
ASPE Issue Brief Page 43
ASPE Office of Health Policy March 2015
APPENDIX TABLE B4
Total Marketplace Eligibility Determinations, and Marketplace Plan Selections in States Using the HealthCare.gov Platform, By State, 2015 (1)
11-15-2014 to 2-15-2015 (including SEP activity through 2-22-15)
State Name
Number of Individuals Determined Eligible to Enroll through the
Marketplace for 2015 Coverage
Number of Individuals
Determined or Assessed Eligible
for Medicaid / CHIP by the Marketplace
(4)
Number of Individuals With
2015 Plan Selections Through
the Marketplaces
(5)
Total Eligible to Enroll in a
Marketplace Plan (2)
Eligible to Enroll in a Marketplace Plan
with Financial Assistance
(3)
Number Number Number Number
States Using the HealthCare.gov Platform
State-Based Marketplaces (SBMs) Using the HealthCare.gov Platform (6)
Nevada 90,696 77,228 28,290 73,596
New Mexico 62,905 49,378 15,522 52,358
Oregon 140,994 111,139 61,828 112,024
Subtotal - SBMs Using the HealthCare.gov Platform
294,595 237,745 105,640 237,978
Federally-Facilitated Marketplace (FFM) States
Alabama 222,610 166,768 10,408 171,641
Alaska 27,056 21,779 3,613 21,260
Arizona 245,307 192,805 49,814 205,666
Arkansas 78,948 65,808 23,006 65,684
Delaware 29,682 23,992 5,985 25,036
Florida 1,909,132 1,632,571 126,181 1,596,296
Georgia 664,646 528,944 63,083 541,080
Illinois 408,019 323,657 86,560 349,487
Indiana 252,834 209,754 66,539 219,185
Iowa 57,110 47,154 15,474 45,162
Kansas 121,007 89,471 10,512 96,197
Louisiana 228,809 180,933 7,915 186,277
Maine 88,598 73,370 5,327 74,805
Michigan 387,618 333,890 82,135 341,183
Mississippi 132,596 106,478 10,699 104,538
Missouri 316,984 248,697 34,679 253,430

ASPE Issue Brief Page 44
ASPE Office of Health Policy March 2015
Total Marketplace Eligibility Determinations, and Marketplace Plan Selections in States Using the HealthCare.gov Platform, By State, 2015 (1)
11-15-2014 to 2-15-2015 (including SEP activity through 2-22-15)
State Name
Number of Individuals Determined Eligible to Enroll through the
Marketplace for 2015 Coverage
Number of Individuals
Determined or Assessed Eligible
for Medicaid / CHIP by the Marketplace
(4)
Number of Individuals With
2015 Plan Selections Through
the Marketplaces
(5)
Total Eligible to Enroll in a
Marketplace Plan (2)
Eligible to Enroll in a Marketplace Plan
with Financial Assistance
(3)
Number Number Number Number
Montana 64,632 52,823 2,683 54,266
Nebraska 90,915 73,371 7,218 74,152
New Hampshire 60,664 44,068 9,294 53,005
New Jersey 307,849 245,148 60,757 254,316
North Carolina 668,702 557,164 47,920 560,357
North Dakota 21,313 18,129 2,013 18,171
Ohio 279,722 229,459 79,963 234,341
Oklahoma 156,795 118,248 12,946 126,115
Pennsylvania 539,023 433,287 126,853 472,697
South Carolina 257,282 205,800 21,106 210,331
South Dakota 27,626 22,496 2,861 21,393
Tennessee 306,785 222,782 40,373 231,440
Texas 1,535,857 1,177,520 146,548 1,205,174
Utah 164,262 141,539 29,017 140,612
Virginia 470,998 355,017 36,569 385,154
West Virginia 40,358 33,409 5,063 33,421
Wisconsin 237,426 205,697 27,628 207,349
Wyoming 26,180 21,633 847 21,092
TOTAL – States Using the HealthCare.gov Platform
10,721,940 8,641,406 1,367,229 8,838,291
Notes:
“N/A” means that the data for the respective metric are not yet available for a given state.
(1) Unless otherwise noted, the data in this table represent cumulative Marketplace enrollment-related activity for 11-15-14 to 2-
15-15 (including SEP activity through 2-22-15). These data also do not include any enrollment-related activity relating to
individuals who may have applied for and/or selected a 2014 Marketplace plan during the reporting period, as a result of having
been eligible for a Special Enrollment Period (SEP). This table only reflects data for the individual market Marketplaces. For
additional technical notes information, please refer to Appendix D of this report.
ASPE Issue Brief Page 45
ASPE Office of Health Policy March 2015
(2) “Individuals Determined Eligible to Enroll in a Plan Through the Marketplace” (i.e., enrollment through the Marketplaces for
a 2015 Marketplace plan) represents the total number of individuals for whom a Completed Application has been received for the
2015 plan year (including any individuals with active 2014 Marketplace enrollments who returned to the Marketplaces and
updated their information), and who are determined to be eligible for plan enrollment through the Marketplaces during the
reference period, whether or not they qualify for advance payments of the premium tax credit or cost-sharing reductions. These
individuals may or may not have enrolled in coverage by the end of the reference period. Individuals who have been determined
or assessed eligible for Medicaid or CHIP are not included. Note: This number only includes data for individuals who applied
for 2015 Marketplace coverage in completed applications. It does not include individuals who were automatically reenrolled.
Thus, the number determined eligible for 2015 coverage may be lower than the total number of 2015 plan selections (which
includes reenrollees).
(3) “Individuals Determined Eligible to Enroll in a Plan Through the Marketplace with Financial Assistance” (i.e., enrollment
through the Marketplace for a 2015 Marketplace plan with Financial Assistance) represents the total number of individuals
determined eligible to enroll through the Marketplace in a Marketplace plan who qualify for an advance premium tax credit
(APTC), with or without a cost-sharing reduction (CSR) for the 2015 plan year (including any individuals with active 2014
Marketplace enrollments who returned to the Marketplace and updated their information). These individuals may or may not
have enrolled in coverage by the end of the reference period. Note: This number only includes data for individuals who applied
for 2015 Marketplace coverage in completed applications. It does not include individuals who were automatically reenrolled.
Thus, the number determined eligible for 2015 coverage may be lower than the total number of 2015 plan selections with
financial assistance (which includes reenrollees).
(4) “Individuals Determined or Assessed Eligible for Medicaid / CHIP by the Marketplace” represents the number of individuals
who have been determined or assessed by the Marketplace as eligible for Medicaid or CHIP based on their modified adjusted
gross income (MAGI). In some states, completed applications for individuals, whom the Marketplace has assessed as potentially
eligible for Medicaid or CHIP, based on MAGI, are transferred to the relevant state agency for a final eligibility determination.
In these “assessment states” the data include those accounts where a final decision is pending. In other states, the Marketplace
has been delegated the final Medicaid/CHIP eligibility determination responsibility for these individuals. Thus, this data element
includes FFM determinations and assessments, regardless of the state Medicaid/CHIP agency’s final eligibility determination, if
applicable. These data may vary from accounts transferred via “flat file” to states by the FFM. Quality assurance continues on
Medicaid assessments and determinations. Note: Marketplace Medicaid/CHIP eligibility determination and assessment data in
this report cannot be added to eligibility determination data in the most recent monthly Medicaid and CHIP Applications,
Eligibility Determinations, and Enrollment report (available on Medicaid.gov) which covers data through December 2014. In the
Marketplaces, some of the individuals assessed or determined eligible for Medicaid or CHIP by the Marketplace and reported in
this report may also be reported in the monthly Medicaid and CHIP Applications, Eligibility Determinations, and Enrollment
Report when the state has made an eligibility determination based on the information provided by the Marketplace. Total
Medicaid/CHIP enrollment is reported in the monthly Medicaid and CHIP Applications, Eligibility Determinations, and
Enrollment Report, and is a point-in-time count of total enrollment in the Medicaid and CHIP programs at the end of the monthly
reporting period.
(5) “Individuals With 2015 Marketplace Plan Selections” represents the total number of individuals determined eligible to enroll
in a plan through the marketplace” who have selected a 2015 Marketplace medical plan for enrollment through the Marketplaces or, after December 15, have been automatically reenrolled in coverage through the Marketplaces (with or without the first
premium payment having been received directly by the issuer) during the reference period. This is also known as pre-effectuated
enrollment, because enrollment is not considered effectuated until the first premium payment is made, and this figure includes
plan selections for which enrollment has not yet been effectuated. Individuals who have cancelled or terminated their
Marketplace plans are not included in the total number of plan selections. These data also do not include: standalone dental plan
selections; or individuals who may have selected a 2014 Marketplace plan during the reporting period, as a result of having been
eligible for a Special Enrollment Period (SEP).
(6) Nevada, New Mexico, and Oregon are using the HealthCare.gov platform for 2015.
Source: Centers for Medicare & Medicaid Services, as of 3-6-15.

ASPE Issue Brief Page 46
ASPE Office of Health Policy March 2015
APPENDIX TABLE B5
Marketplace Plan Selections by Financial Assistance Status in States Using the HealthCare.gov Platform, By State (1)
11-15-14 to 2-15-15 (including SEP activity through 2-22-15)
Description
Total Number of Individuals With
2015 Plan Selections
Through the Marketplaces
(2)
Plan Selections With Available
Data on Financial Assistance Status (3)
By Financial Assistance Status (4) (% of Available Data, Excluding Unknown)
With Financial
Assistance
Without Financial
Assistance
With APTC
(non-add)
With CSR
(non-add)
Number Number % % % %
States Using the HealthCare.gov Platform (4)
State-Based Marketplaces (SBMs) Using the HealthCare.gov Platform (5)
Nevada 73,596 73,596 89% 11% 89% 55%
New Mexico 52,358 52,358 76% 24% 74% 47%
Oregon 112,024 112,024 79% 21% 77% 47%
Subtotal - SBMs Using the HealthCare.gov Platform
237,978 237,978 81% 19% 80% 49%
Federally-Facilitated Marketplace (FFM) States
Alabama 171,641 171,641 89% 11% 89% 71%
Alaska 21,260 21,260 90% 10% 89% 54%
Arizona 205,666 205,666 76% 24% 75% 54%
Arkansas 65,684 65,684 88% 12% 88% 56%
Delaware 25,036 25,036 84% 16% 83% 45%
Florida 1,596,296 1,596,296 93% 7% 93% 70%
Georgia 541,080 541,080 90% 10% 89% 67%
Illinois 349,487 349,487 78% 22% 78% 46%
Indiana 219,185 219,185 88% 12% 87% 50%
Iowa 45,162 45,162 86% 14% 85% 48%
Kansas 96,197 96,197 80% 20% 80% 55%
Louisiana 186,277 186,277 89% 11% 89% 57%
Maine 74,805 74,805 89% 11% 89% 58%
Michigan 341,183 341,183 88% 12% 88% 55%
Mississippi 104,538 104,538 94% 6% 93% 76%
Missouri 253,430 253,430 88% 12% 88% 58%
Montana 54,266 54,266 85% 15% 84% 51%
Nebraska 74,152 74,152 88% 12% 87% 50%
New Hampshire 53,005 53,005 71% 29% 70% 37%
New Jersey 254,316 254,316 83% 17% 83% 51%
North Carolina 560,357 560,357 92% 8% 92% 65%
North Dakota 18,171 18,171 86% 14% 86% 42%
Ohio 234,341 234,341 84% 16% 84% 44%
Oklahoma 126,115 126,115 81% 19% 79% 59%
Pennsylvania 472,697 472,697 81% 19% 80% 57%
South Carolina 210,331 210,331 88% 12% 88% 63%
South Dakota 21,393 21,393 88% 12% 86% 63%
Tennessee 231,440 231,440 83% 17% 82% 62%
Texas 1,205,174 1,205,174 86% 14% 85% 59%

ASPE Issue Brief Page 47
ASPE Office of Health Policy March 2015
Marketplace Plan Selections by Financial Assistance Status in States Using the HealthCare.gov Platform, By State (1)
11-15-14 to 2-15-15 (including SEP activity through 2-22-15)
Description
Total Number of Individuals With
2015 Plan Selections
Through the Marketplaces
(2)
Plan Selections With Available
Data on Financial Assistance Status (3)
By Financial Assistance Status (4) (% of Available Data, Excluding Unknown)
With Financial
Assistance
Without Financial
Assistance
With APTC
(non-add)
With CSR
(non-add)
Number Number % % % %
Utah 140,612 140,612 88% 12% 88% 60%
Virginia 385,154 385,154 84% 16% 83% 55%
West Virginia 33,421 33,421 86% 14% 86% 54%
Wisconsin 207,349 207,349 90% 10% 89% 58%
Wyoming 21,092 21,092 91% 9% 91% 52%
TOTAL – States Using the HealthCare.gov Platform
8,838,291 8,838,291 87% 13% 87% 60%
Notes:
“N/A” means that the data for the respective metric is not yet available for a given state. Percentages in this table have been
rounded. Some numbers may not add to totals due to rounding.
(1) Unless otherwise noted, the data in this table represent cumulative data on the number of unique individuals who have been
determined eligible to enroll in a Marketplace plan, and have selected a Marketplace medical plan (with or without the first
premium payment having been received by the issuer). These data do not include: Individuals who have cancelled or terminated
their Marketplace plans are not included in the total number of plan selections. These data also do not include: standalone dental
plan selections; or individuals who may have selected a 2014 Marketplace plan during the reporting period, as a result of having
been eligible for a Special Enrollment Period (SEP). For additional technical notes, please refer to Appendix D of this report.
(2) For each metric, the data represent the total number of “Individuals Applying for 2015 Coverage in Completed Applications”
who have selected a 2015 medical Marketplace plan for enrollment through the Marketplace (with or without the first premium
payment having been received directly by the issuer) during the reference period, excluding plan selections with unknown data
for a given metric. This is also known as pre-effectuated enrollment, because enrollment is not considered effectuated until the
first premium payment is made, and this figure includes plan selections for which enrollment has not yet been effectuated.
(3) In some cases, the data for certain characteristics of Marketplace plan selections are not yet available. For this reason, for
each metric, we have calculated the comparable percentages based on the number of plan selections with known data for that
metric.
(4) Data on Marketplace plan selections with financial assistance includes plan selections for individuals who are receiving a
premium tax credit and/or cost-sharing subsidy.
(5) For the HealthCare.gov states, the data on 2015 Marketplace plan selections includes data for new consumers and consumers
who are actively reenrolling in Marketplace coverage (including data for consumers who actively reenrolled in coverage through
the Marketplaces, and data for automatic reenrollees).
(6) Nevada, New Mexico, and Oregon are using the HealthCare.gov platform for 2015.
Source: Centers for Medicare & Medicaid Services, as of 3-6-15; ASPE computation of CMS data for 37 states using the
HealthCare.gov platform as of 2-15-15 (including SEP activity through 2-22-15).

ASPE Issue Brief Page 48
ASPE Office of Health Policy March 2015
APPENDIX TABLE B6
Marketplace Plan Selection by Age in States Using the HealthCare.gov Platform, By State (1) 11-15-14 to 2-15-15 (including SEP activity through 2-22-15)
Description
Number of Plan
Selections With
Available Data on Age
(2) (3)
By Age (% of Available Data, Excluding Unknown)
Age < 18
Age 18-25
Age 26-34
Age 35-44
Age 45-54
Age 55-64
Age ≥65
Ages 18-34
Ages 0-34
Number % % % % % % % % %
States Using the HealthCare.gov Platform (4)
State-Based Marketplaces (SBMs) Using the HealthCare.gov Platform (5)
Nevada 73,595 13% 9% 15% 16% 20% 27% 1% 24% 36%
New Mexico 52,357 8% 7% 14% 14% 22% 34% 1% 21% 29%
Oregon 112,010 7% 8% 17% 16% 19% 33% 1% 24% 31%
Subtotal - SBMs Using the HealthCare.gov Platform
237,962 9% 8% 16% 16% 20% 31% 1% 24% 32%
Federally-Facilitated Marketplace (FFM) States
Alabama 171,638 3% 13% 19% 19% 22% 24% 0% 32% 35%
Alaska 21,259 10% 8% 20% 16% 19% 26% 1% 28% 39%
Arizona 205,660 23% 9% 14% 14% 17% 23% 1% 23% 45%
Arkansas 65,684 7% 9% 16% 16% 21% 30% 1% 25% 32%
Delaware 25,036 13% 8% 15% 15% 22% 26% 1% 23% 36%
Florida 1,596,278 6% 13% 15% 18% 24% 23% 1% 28% 33%
Georgia 541,071 6% 13% 18% 19% 22% 21% 1% 31% 37%
Illinois 349,469 7% 10% 18% 15% 21% 28% 1% 28% 35%
Indiana 219,182 9% 9% 16% 16% 20% 29% 0% 25% 35%
Iowa 45,161 5% 9% 17% 15% 22% 32% 0% 26% 31%
Kansas 96,195 9% 11% 19% 16% 19% 25% 0% 31% 40%
Louisiana 186,274 4% 12% 20% 18% 22% 23% 0% 33% 37%
Maine 74,804 10% 8% 15% 14% 22% 31% 0% 23% 33%
Michigan 341,176 9% 9% 16% 15% 21% 28% 0% 26% 35%
Mississippi 104,533 3% 14% 17% 18% 22% 25% 0% 31% 34%
Missouri 253,422 9% 11% 19% 16% 20% 25% 0% 30% 39%
Montana 54,265 7% 10% 20% 16% 19% 29% 0% 29% 36%
Nebraska 74,148 14% 11% 18% 16% 18% 23% 0% 29% 43%
New Hampshire 53,004 8% 9% 16% 14% 23% 30% 0% 24% 32%
New Jersey 254,311 8% 10% 15% 15% 24% 26% 1% 25% 34%
North Carolina 560,346 8% 11% 17% 18% 22% 23% 0% 28% 37%
North Dakota 18,171 23% 8% 19% 13% 15% 22% 0% 27% 50%
Ohio 234,332 11% 8% 15% 14% 20% 31% 0% 24% 34%
Oklahoma 126,114 10% 11% 18% 17% 20% 24% 0% 29% 39%
Pennsylvania 472,680 6% 10% 18% 16% 22% 29% 0% 28% 34%
South Carolina 210,325 7% 11% 17% 17% 23% 26% 0% 28% 34%
South Dakota 21,393 11% 10% 20% 15% 17% 26% 0% 30% 41%
Tennessee 231,436 6% 10% 18% 17% 22% 27% 0% 28% 34%
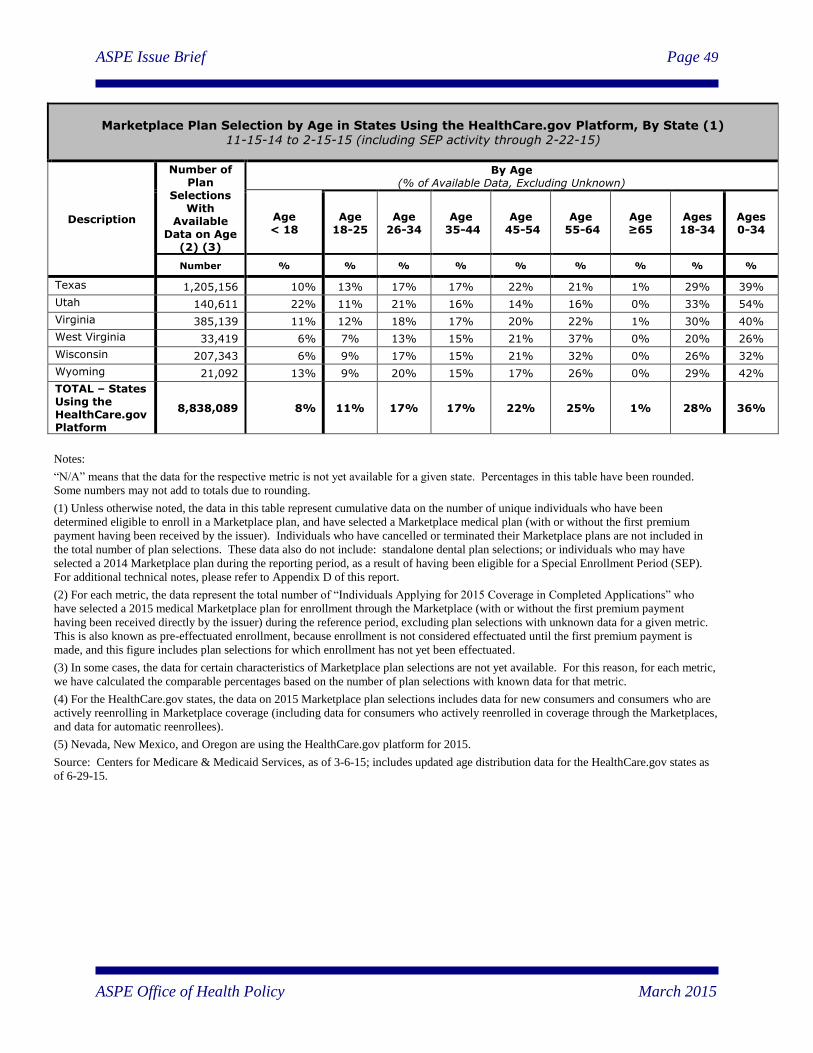
ASPE Issue Brief Page 49
ASPE Office of Health Policy March 2015
Marketplace Plan Selection by Age in States Using the HealthCare.gov Platform, By State (1) 11-15-14 to 2-15-15 (including SEP activity through 2-22-15)
Description
Number of Plan
Selections With
Available Data on Age
(2) (3)
By Age (% of Available Data, Excluding Unknown)
Age < 18
Age 18-25
Age 26-34
Age 35-44
Age 45-54
Age 55-64
Age ≥65
Ages 18-34
Ages 0-34
Number % % % % % % % % %
Texas 1,205,156 10% 13% 17% 17% 22% 21% 1% 29% 39%
Utah 140,611 22% 11% 21% 16% 14% 16% 0% 33% 54%
Virginia 385,139 11% 12% 18% 17% 20% 22% 1% 30% 40%
West Virginia 33,419 6% 7% 13% 15% 21% 37% 0% 20% 26%
Wisconsin 207,343 6% 9% 17% 15% 21% 32% 0% 26% 32%
Wyoming 21,092 13% 9% 20% 15% 17% 26% 0% 29% 42%
TOTAL – States Using the HealthCare.gov Platform
8,838,089 8% 11% 17% 17% 22% 25% 1% 28% 36%
Notes:
“N/A” means that the data for the respective metric is not yet available for a given state. Percentages in this table have been rounded.
Some numbers may not add to totals due to rounding.
(1) Unless otherwise noted, the data in this table represent cumulative data on the number of unique individuals who have been
determined eligible to enroll in a Marketplace plan, and have selected a Marketplace medical plan (with or without the first premium
payment having been received by the issuer). Individuals who have cancelled or terminated their Marketplace plans are not included in
the total number of plan selections. These data also do not include: standalone dental plan selections; or individuals who may have
selected a 2014 Marketplace plan during the reporting period, as a result of having been eligible for a Special Enrollment Period (SEP).
For additional technical notes, please refer to Appendix D of this report.
(2) For each metric, the data represent the total number of “Individuals Applying for 2015 Coverage in Completed Applications” who
have selected a 2015 medical Marketplace plan for enrollment through the Marketplace (with or without the first premium payment
having been received directly by the issuer) during the reference period, excluding plan selections with unknown data for a given metric.
This is also known as pre-effectuated enrollment, because enrollment is not considered effectuated until the first premium payment is
made, and this figure includes plan selections for which enrollment has not yet been effectuated.
(3) In some cases, the data for certain characteristics of Marketplace plan selections are not yet available. For this reason, for each metric,
we have calculated the comparable percentages based on the number of plan selections with known data for that metric.
(4) For the HealthCare.gov states, the data on 2015 Marketplace plan selections includes data for new consumers and consumers who are
actively reenrolling in Marketplace coverage (including data for consumers who actively reenrolled in coverage through the Marketplaces,
and data for automatic reenrollees).
(5) Nevada, New Mexico, and Oregon are using the HealthCare.gov platform for 2015.
Source: Centers for Medicare & Medicaid Services, as of 3-6-15; includes updated age distribution data for the HealthCare.gov states as
of 6-29-15.

ASPE Issue Brief Page 50
ASPE Office of Health Policy March 2015
APPENDIX TABLE B7
Reduction in Average Monthly Premiums from Advance Premium Tax Credits in States Using the HealthCare.gov Platform (1)
11-15-14 to 2-15-15 (including SEP activity through 2-22-15)
Description
Total Number of Individuals With
2015 Plan Selections
Through the Marketplaces
(2)
Percent of Plan
Selections with APTC
Average Monthly Premium
before APTC
Average Monthly
APTC
Average Monthly Premium
After APTC
Average Percent
Reduction in Premium
after APTC
States Using the HealthCare.gov Platform (4)
State-Based Marketplaces (SBMs) Using the HealthCare.gov Platform (5)
Nevada 73,596 89% $361 $242 $119 67%
New Mexico 52,358 74% $323 $196 $127 61%
Oregon 112,024 77% $334 $198 $136 59%
Subtotal - SBMs Using the HealthCare.gov Platform
237,978 80% $341 $213 $128 62%
Federally-Facilitated Marketplace (FFM) States
Alabama 171,641 89% $354 $266 $88 75%
Alaska 21,260 89% $639 $534 $105 84%
Arizona 205,666 75% $278 $155 $123 56%
Arkansas 65,684 88% $389 $280 $109 72%
Delaware 25,036 83% $404 $264 $140 65%
Florida 1,596,296 93% $376 $294 $82 78%
Georgia 541,080 89% $346 $273 $73 79%
Illinois 349,487 78% $336 $208 $128 62%
Indiana 219,185 87% $438 $319 $120 73%
Iowa 45,162 85% $371 $260 $111 70%
Kansas 96,197 80% $301 $211 $90 70%
Louisiana 186,277 89% $416 $319 $97 77%
Maine 74,805 89% $425 $332 $93 78%
Michigan 341,183 88% $366 $236 $130 64%
Mississippi 104,538 93% $405 $353 $52 87%
Missouri 253,430 88% $363 $281 $82 77%
Montana 54,266 84% $346 $230 $116 66%
Nebraska 74,152 87% $354 $250 $104 70%
New Hampshire 53,005 70% $385 $244 $141 63%
New Jersey 254,316 83% $470 $306 $164 65%
North Carolina 560,357 92% $410 $315 $95 77%
North Dakota 18,171 86% $369 $228 $141 62%
Ohio 234,341 84% $389 $244 $145 63%
Oklahoma 126,115 79% $295 $206 $89 70%
Pennsylvania 472,697 80% $355 $226 $129 64%
South Carolina 210,331 88% $365 $278 $86 76%
South Dakota 21,393 86% $358 $228 $130 64%
Tennessee 231,440 82% $316 $213 $102 68%

ASPE Issue Brief Page 51
ASPE Office of Health Policy March 2015
Reduction in Average Monthly Premiums from Advance Premium Tax Credits in States Using the HealthCare.gov Platform (1)
11-15-14 to 2-15-15 (including SEP activity through 2-22-15)
Description
Total Number of Individuals With
2015 Plan Selections
Through the Marketplaces
(2)
Percent of Plan
Selections with APTC
Average Monthly Premium
before APTC
Average Monthly
APTC
Average Monthly Premium
After APTC
Average Percent
Reduction in Premium
after APTC
Texas 1,205,174 85% $328 $239 $89 73%
Utah 140,612 88% $248 $159 $89 64%
Virginia 385,154 83% $348 $259 $89 74%
West Virginia 33,421 86% $448 $311 $137 69%
Wisconsin 207,349 89% $440 $315 $125 72%
Wyoming 21,092 91% $550 $420 $130 76%
TOTAL – States Using the HealthCare.gov Platform
8,838,291 87% $364 $263 $101 72%
Source: ASPE computation of CMS data for 37 states using the HealthCare.gov platform as of 2-15-15 (including SEP activity
through 2-22-15).
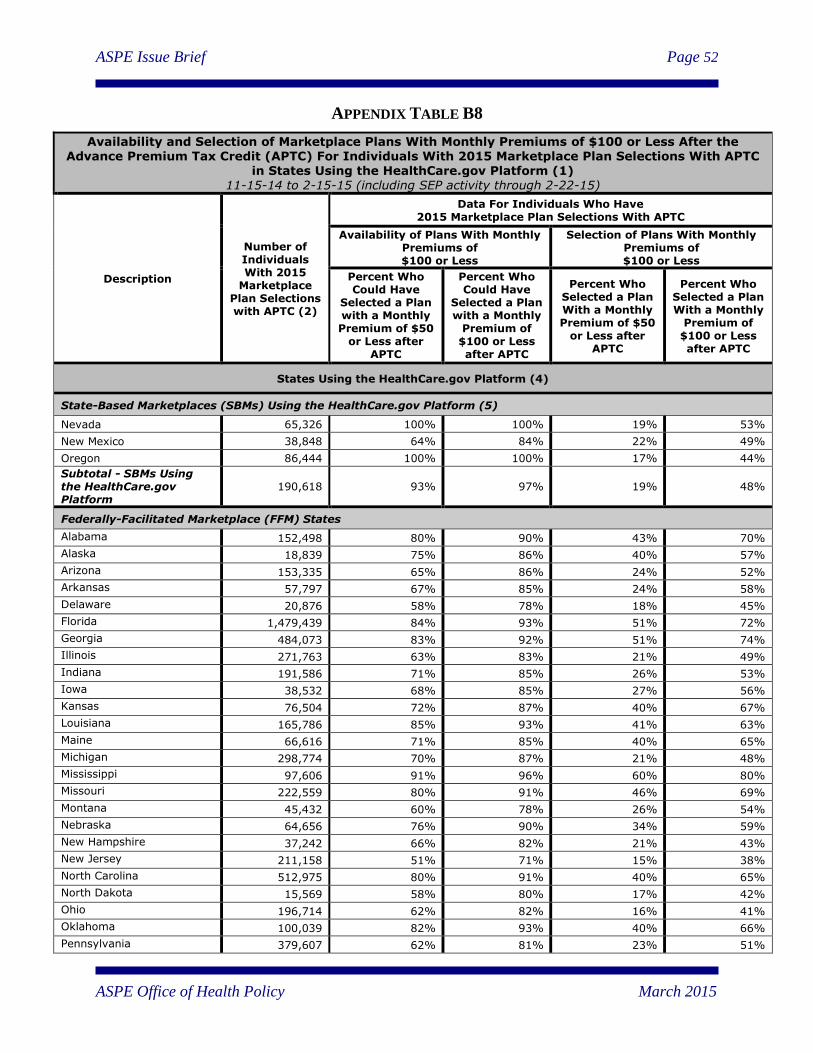
ASPE Issue Brief Page 52
ASPE Office of Health Policy March 2015
APPENDIX TABLE B8
Availability and Selection of Marketplace Plans With Monthly Premiums of $100 or Less After the Advance Premium Tax Credit (APTC) For Individuals With 2015 Marketplace Plan Selections With APTC
in States Using the HealthCare.gov Platform (1) 11-15-14 to 2-15-15 (including SEP activity through 2-22-15)
Description
Number of Individuals With 2015
Marketplace Plan Selections with APTC (2)
Data For Individuals Who Have 2015 Marketplace Plan Selections With APTC
Availability of Plans With Monthly Premiums of $100 or Less
Selection of Plans With Monthly Premiums of $100 or Less
Percent Who Could Have
Selected a Plan with a Monthly Premium of $50
or Less after APTC
Percent Who Could Have
Selected a Plan with a Monthly
Premium of $100 or Less after APTC
Percent Who Selected a Plan With a Monthly Premium of $50
or Less after APTC
Percent Who Selected a Plan With a Monthly
Premium of $100 or Less after APTC
States Using the HealthCare.gov Platform (4)
State-Based Marketplaces (SBMs) Using the HealthCare.gov Platform (5)
Nevada 65,326 100% 100% 19% 53%
New Mexico 38,848 64% 84% 22% 49%
Oregon 86,444 100% 100% 17% 44%
Subtotal - SBMs Using the HealthCare.gov Platform
190,618 93% 97% 19% 48%
Federally-Facilitated Marketplace (FFM) States
Alabama 152,498 80% 90% 43% 70%
Alaska 18,839 75% 86% 40% 57%
Arizona 153,335 65% 86% 24% 52%
Arkansas 57,797 67% 85% 24% 58%
Delaware 20,876 58% 78% 18% 45%
Florida 1,479,439 84% 93% 51% 72%
Georgia 484,073 83% 92% 51% 74%
Illinois 271,763 63% 83% 21% 49%
Indiana 191,586 71% 85% 26% 53%
Iowa 38,532 68% 85% 27% 56%
Kansas 76,504 72% 87% 40% 67%
Louisiana 165,786 85% 93% 41% 63%
Maine 66,616 71% 85% 40% 65%
Michigan 298,774 70% 87% 21% 48%
Mississippi 97,606 91% 96% 60% 80%
Missouri 222,559 80% 91% 46% 69%
Montana 45,432 60% 78% 26% 54%
Nebraska 64,656 76% 90% 34% 59%
New Hampshire 37,242 66% 82% 21% 43%
New Jersey 211,158 51% 71% 15% 38%
North Carolina 512,975 80% 91% 40% 65%
North Dakota 15,569 58% 80% 17% 42%
Ohio 196,714 62% 82% 16% 41%
Oklahoma 100,039 82% 93% 40% 66%
Pennsylvania 379,607 62% 81% 23% 51%

ASPE Issue Brief Page 53
ASPE Office of Health Policy March 2015
Availability and Selection of Marketplace Plans With Monthly Premiums of $100 or Less After the
Advance Premium Tax Credit (APTC) For Individuals With 2015 Marketplace Plan Selections With APTC in States Using the HealthCare.gov Platform (1)
11-15-14 to 2-15-15 (including SEP activity through 2-22-15)
Description
Number of Individuals With 2015
Marketplace Plan Selections with APTC (2)
Data For Individuals Who Have 2015 Marketplace Plan Selections With APTC
Availability of Plans With Monthly Premiums of $100 or Less
Selection of Plans With Monthly Premiums of $100 or Less
Percent Who Could Have
Selected a Plan with a Monthly Premium of $50
or Less after APTC
Percent Who Could Have
Selected a Plan with a Monthly
Premium of $100 or Less after APTC
Percent Who Selected a Plan With a Monthly Premium of $50
or Less after APTC
Percent Who Selected a Plan With a Monthly
Premium of $100 or Less after APTC
South Carolina 185,276 82% 92% 43% 69%
South Dakota 18,503 53% 76% 17% 47%
Tennessee 190,418 81% 92% 32% 60%
Texas 1,030,138 80% 92% 43% 68%
Utah 123,088 69% 90% 33% 67%
Virginia 320,525 80% 91% 42% 68%
West Virginia 28,719 57% 77% 21% 47%
Wisconsin 184,822 68% 83% 26% 50%
Wyoming 19,152 59% 77% 26% 49%
TOTAL – States Using the HealthCare.gov Platform
7,651,234 77% 89% 38% 63%
Source: ASPE computation of CMS data for 37 states using the HealthCare.gov platform as of 2-15-15 (including SEP activity
through 2-22-15).

ASPE Issue Brief Page 54
ASPE Office of Health Policy March 2015
APPENDIX TABLE C1
Marketplace Plan Selection by Enrollment Type in State-Based Marketplaces Using Their Own Marketplace Platforms, By State, 2015 (1)
11-15-2014 to 2-15-2015 (including SEP activity through 2-21-15)
Description
Total Number of Individuals
With 2015 Plan Selections
Through the Marketplaces
(1)
Distribution By Enrollment Type (2)
New Consumers
(3)
Consumers Reenrolling in Marketplace Coverage (4)
Total Reenrollees
Active Reenrollees
Automatic Reenrollees
Number % of Total % of Total % of Total % of Total
State-Based Marketplaces (SBMs) Using Their Own Marketplace Platforms
California (5) 1,412,200 35% 65% 37% 28%
Colorado (6) 140,327 28% 72% 34% 38%
Connecticut (7) 109,839 38% 61% 20% 41%
District of Columbia (8)
18,465 26% 74% 15% 60%
Hawaii (9) 12,625 75% 25% 1% 24%
Idaho (16) 97,079 100% N/A N/A N/A
Kentucky (10) 106,330 26% 73% 39% 35%
Maryland (16) 120,145 100% N/A N/A N/A
Massachusetts (16) 140,540 100% N/A N/A N/A
Minnesota (11) 59,704 60% 40% 26% 14%
New York (12) 408,841 35% 66% N/A N/A
Rhode Island (13) 31,337 32% 68% 68% N/A
Vermont (14) 31,619 14% 87% 17% 69%
Washington (15) 160,732 37% 63% N/A N/A
State-Based Marketplaces (SBMs) Using Their Own Marketplace Platforms
2,849,783 43% 57% 24% 20%
Notes:
“N/A” means that the data for the respective metric are not yet available for a given state.
(1) Unless otherwise noted, the data in these tables represent cumulative data on the number of unique individuals who have
selected or have been automatically reenrolled into a 2015 Marketplace medical plan for enrollment through the Marketplaces (with or without the first premium payment having been received directly by the issuer). This is also known as pre-effectuated
enrollment, because enrollment is not considered effectuated until the first premium payment is made, and this figure includes
plan selections for which enrollment has not yet been effectuated. Except for three states, the data for total number of plan
selections removes cancellations and terminations. Minnesota does not remove either from its total plan selection data, whereas
DC removes cancellations and terminations from its automatic reenrollment data and New York removes cancellations and
terminations from its active and automatic reenrollee data. These data also do not include: standalone dental plan selections; or
individuals who may have selected a 2014 Marketplace plan during the reporting period, as a result of having been eligible for a
Special Enrollment Period (SEP). This table only reflects data for the individual market Marketplaces. For additional technical
notes, please refer to Appendix D of this report.
(2) “Distribution by Enrollment Type” represents the percentage of plan selections with available data on enrollment type that are
new consumers vs. consumers reenrolling in coverage through the Marketplaces.
(3) “New Consumers” are those individuals who selected a 2015 Marketplace medical plan (with or without the first premium
payment having been received directly by the issuer) as of the reporting date, and did not have a Marketplace plan selection as of
November 2014. Individuals who have cancelled or terminated their Marketplace plans are not included in the total number of
plan selections. These data also do not include: standalone dental plan selections; or individuals who may have selected a 2014
Marketplace plan during the reporting period, as a result of having been eligible for a Special Enrollment Period (SEP).

ASPE Issue Brief Page 55
ASPE Office of Health Policy March 2015
(4) “Consumers reenrolling in coverage through the Marketplaces” are those individuals who had a Marketplace plan selection
during coverage year 2014, and have either actively submitted a 2015 application and selected a 2015 Marketplace medical plan
or have been automatically reenrolled in coverage through the Marketplaces – with or without the first premium payment having
been received directly by the issuer). These data also do not include: standalone dental plan selections; or individuals who may
have selected a 2014 Marketplace plan during the reporting period, as a result of having been eligible for a Special Enrollment
Period (SEP). It is important to note that the reenrollment data in this report may include some individuals who were reenrolled
in coverage through the Marketplaces as of 2-15-15 (including SEP activity through 2-21-15), but who may ultimately decide not
to retain Marketplace coverage for the remainder of 2015 (for example, because they have obtained coverage through another
source such as an employer or Medicaid/CHIP).
(5) California reports represent data through 2/22/15. California began its automatic renewal process in December 2014 and
periodically cancels individuals not paying their premiums during ongoing data cleaning processes. If an individual had
effectuated enrollment by 11/12/14 and did not actively re-enroll, he/she was automatically re-enrolled by 12/15/14.
(6) Colorado automatically renewed eligible individuals December 15, 2014 for coverage beginning January 1, 2015 and
periodically cancels individuals not paying their premiums during ongoing data cleaning processes.
(7) Connecticut automatically renewed eligible individuals during December 2014 for coverage beginning January 1, 2015.
Connecticut individuals not paying their premiums are removed from enrollment counts upon receipt of cancelation notice from
insurers. If an individual had effectuated coverage as of December 2014, he/she was eligible for automatic re-enrollment.
(8) DC aligned its automatic renewal process with the Federal 2015 open enrollment process. Individuals automatically renewed
needed to effectuate enrollment by December 15, 2014 to be considered enrolled, otherwise DC canceled their coverage. DC
removed terminations and cancellations from their data for automatic re-enrollees, but did not remove them for new enrollees or
active re-enrollees.
(9) Hawaii began its automatic renewal process November 15, 2014 and canceled individuals for non-payment by January 31,
2015. If an individual had effectuated enrollment by 11/1/2014, did not actively reenroll, and selected “auto-renewal,” he/she was
automatically reenrolled by 12/31/2014 for the 2015 plan year.
(10) Kentucky notified individuals eligible for automatic renewal November 1, 2014 they would be automatically renewed for
coverage effective January 1, 2015. Kentucky periodically cancels individuals not paying their premiums during ongoing data
cleaning processes. Any individual who was actively receiving benefits as of 11/14/2014 was considered eligible for automatic
re-enrollment and was re-enrolled on 11/15/14. Kentucky’s report of unknown individuals in 2015 plan selection breakouts
represents the count of individuals converted from a legacy system (KAMES) to KYHBE.
(11) Minnesota began its automatic renewal process in January 2015.
(12) New York’s renewal process began November 15, 2014. New York removed terminations and cancellations from their data
for active and automatic re-enrollees, but did not remove them for new enrollees. New York’s re-enrollment data does not
distinguish between active and automatic reenrollment. In New York, individuals who were enrolled in October 2014, with an
end date of December 31, 2014, were eligible for automatic re-enrollment if their program eligibility stayed the same from 2014
to 2015, and their plan was available in 2015. If an individual’s 2014 coverage was cancelled/terminated after October 2014, they
were removed from the 2015 coverage that they were automatically renewed into. Additionally, if individuals voluntarily cancel
or terminate their coverage, they are removed from the enrollment count at the time they cancel or terminate their coverage. If an
individual’s coverage is cancelled or terminated for non-payment, they are removed from the enrollment count when the issuer
transmits that transaction to the Marketplace.
(13) Rhode Island does not have any automatic re-enrollments for its 2015 plan selection data, as Rhode Island required all
individuals to undergo active re-enrollment. Individuals are canceled from the system if they do not make payment on the 23rd
day of the month prior to the coverage month.
(14) Vermont automatically renewed all Marketplace consumers for coverage beginning January 1, 2015, with payment for
coverage due 21 days after automatically renewed consumers were sent an invoice.
(15) Washington reports only individuals who have both enrolled and paid for coverage (effectuated enrollment) for its report of
plan selection, thereby undercounting the true total of plan selections in Washington. Washington began its renewal process
November 15, 2014, with payment deadlines the 23rd day of the month prior to the coverage month. Washington defines
renewals as the number of QHP enrollees with coverage in December 2014 and coverage in 2015 as of February 21, 2015.
Washington is not able to provide automatic and active renewal breakouts for 2015 plan selection data due to system issues.
Their system counts some re-enrollees as both automatic and active re-enrollees, which may lead to double counting re-enrollee
breakouts. Washington removed enrollees who terminated their coverage from their plan selection data for new enrollees and re-
enrollees, but retained individuals in the count until issuers confirmed that the coverage was terminated for nonpayment.
(16) Idaho is an SBM that changed Marketplace platforms for the 2015 coverage year (Idaho transitioned from using the
HealthCare.gov platform to using its own platform). Additionally, Massachusetts and Maryland changed their eligibility and
enrollment system vendors for the 2015 coverage year. All of the plan selections for these states are being treated as new
consumers for operational enrollment and reporting purposes.
Source: Centers for Medicare & Medicaid Services, as of 3-6-15.

ASPE Issue Brief Page 56
ASPE Office of Health Policy March 2015
APPENDIX TABLE C2
Total Completed Applications and Individuals Who Completed Applications in State-Based Marketplaces Using Their Own Marketplace Platforms, By State, 2015 (1)
11-15-2014 to 2-15-2015 (including SEP activity through 2-21-15)
Description
Total Number of Completed Applications for 2015 Coverage
(2)
Total Individuals Applying for 2015 Coverage in Completed Applications
(3)
Number Number
State-Based Marketplaces (SBMs) Using Their Own Marketplace Platforms
California (4) N/A NA
Colorado 94,088 134,931
Connecticut 131,627 226,266
District of Columbia 14,521 19,570
Hawaii 16,159 25,314
Idaho 89,460 203,577
Kentucky (5) 94,447 153,920
Maryland (6) 263,035 N/A
Massachusetts 334,410 522,457
Minnesota 127,978 201,920
New York N/A 502,616
Rhode Island 71,995 120,771
Vermont (7) 33,155 59,451
Washington 616,059 1,354,964
TOTAL - SBMs Using Their Own Marketplace Platforms 1,886,934 3,525,757
Notes:
“N/A” means that the data for the respective metric are not yet available for a given state.
(1) Unless otherwise noted, the data in this table represent cumulative Marketplace enrollment-related activity for 11-15-14 to 2-
15-15 (including SEP activity through 2-21-15). These data also do not include any enrollment-related activity relating to
individuals who may have applied for and/or selected a 2014 Marketplace plan during the reporting period, as a result of having
been eligible for a Special Enrollment Period (SEP). This table only reflects data for the individual market Marketplaces. For
additional technical notes, please refer to Appendix D of this report.
(2) “Completed Applications for 2015 Coverage” represents the total number of electronic and paper applications that were
submitted to the Marketplace during the reference period with sufficient information to begin performing eligibility
determinations for enrollment in a plan through the Marketplace and, if appropriate, sufficient information to begin performing
eligibility determinations for advance payments of the premium tax credit and cost-sharing reductions, and eligibility assessments
or determinations for Medicaid and CHIP.
(3) “Individuals Applying for 2015 Coverage in Completed Applications” represents the total number of individuals included in
Completed Applications that were submitted to the Marketplaces during the applicable reference period. This number does not
include individuals applying through the SHOP.

ASPE Issue Brief Page 57
ASPE Office of Health Policy March 2015
(4) California reports data through 2/22/15. California’s system does not specifically track the total number of completed
applications or individuals applying for coverage.
(5) Kentucky data for “completed applications” includes data for the 2014 special enrollment period from 11-15-14 to 12-31-14,
2015 open enrollment, and 2015 SADP enrollment, as its system is not able to differentiate these data at the application level.
(6) Maryland’s system cannot provide the number of individuals applying for coverage through the Marketplace, as records may
be removed from this count after eligibility determinations.
(7) Vermont data for application numbers include withdrawn cases, but do not include test cases.
Source: Centers for Medicare & Medicaid Services, as of 3-6-15.

ASPE Issue Brief Page 58
ASPE Office of Health Policy March 2015
APPENDIX TABLE C3
Total Marketplace Eligibility Determinations, and Marketplace Plan Selections in State-Based Marketplaces Using Their Own Marketplace Platforms, By State, 2015 (1)
11-15-2014 to 2-15-2015 (including SEP activity through 2-21-15)
State Name
Number of Individuals Determined Eligible to Enroll through the
Marketplace for 2015 Coverage
Number of Individuals
Determined or Assessed Eligible
for Medicaid / CHIP by the Marketplace
(4)
Number of Individuals With
2015 Plan Selections
Through the Marketplaces
(5)
Total Eligible to Enroll in a
Marketplace Plan (2)
Eligible to Enroll in a Marketplace Plan
with Financial Assistance
(3)
Number Number Number Number
State-Based Marketplaces (SBMs) Using Their Own Marketplace Platforms
California (6) (7) 1,138,456 535,032 1,056,164 1,412,200
Colorado (7) (8) 132,077 N/A 85,432 140,327
Connecticut (9) 167,193 124,803 277,336 109,839
District of Columbia 7,539 1,714 9,355 18,465
Hawaii 24,568 12,306 32,854 12,625
Idaho 215,145 163,829 314,398 97,079
Kentucky 223,335 138,320 152,529 106,330
Maryland 120,632 85,345 154,194 120,145
Massachusetts 246,397 164,849 276,060 140,540
Minnesota (10) 71,451 38,382 106,654 59,704
New York (11) 1,006,505 498,707 357,456 408,841
Rhode Island 44,097 33,604 65,396 31,337
Vermont 57,533 22,660 16,922 31,619
Washington 239,848 176,295 818,697 160,732
TOTAL - SBMs Using Their Own Marketplace Platforms 3,694,776 1,995,846 3,723,447 2,849,783
Notes:
“N/A” means that the data for the respective metric are not yet available for a given state.
(1) Unless otherwise noted, the data in this table represent cumulative Marketplace enrollment-related activity for 11-15-14 to 2-
15-15 (including SEP activity through 2-22-15). These data also do not include any enrollment-related activity relating to
individuals who may have applied for and/or selected a 2014 Marketplace plan during the reporting period, as a result of having
been eligible for a Special Enrollment Period (SEP). This table only reflects data for the individual market Marketplaces. For
additional technical notes information, please refer to Appendix D of this report.
(2) “Individuals Determined Eligible to Enroll in a Plan Through the Marketplace” (i.e., enrollment through the Marketplaces for
a 2015 Marketplace plan) represents the total number of individuals for whom a Completed Application has been received for the
2015 plan year (including any individuals with active 2014 Marketplace enrollments who returned to the Marketplaces and
updated their information), and who are determined to be eligible for plan enrollment through the Marketplaces during the
ASPE Issue Brief Page 59
ASPE Office of Health Policy March 2015
reference period, whether or not they qualify for advance payments of the premium tax credit or cost-sharing reductions. These
individuals may or may not have enrolled in coverage by the end of the reference period. Individuals who have been determined
or assessed eligible for Medicaid or CHIP are not included. Note: With the exception of states that treated all of the individuals
who selected 2015 coverage through the Marketplaces, this number only includes data for individuals who applied for 2015
Marketplace coverage in completed applications. It does not include individuals who were automatically reenrolled. Thus, the
number determined eligible for 2015 coverage may be lower than the total number of 2015 plan selections (which includes
reenrollees).
(3) “Individuals Determined Eligible to Enroll in a Plan Through the Marketplace with Financial Assistance” (i.e., enrollment
through the Marketplace for a 2015 Marketplace plan with Financial Assistance) represents the total number of individuals
determined eligible to enroll through the Marketplace in a Marketplace plan who qualify for an advance premium tax credit
(APTC), with or without a cost-sharing reduction (CSR) for the 2015 plan year (including any individuals with active 2014
Marketplace enrollments who returned to the Marketplace and updated their information). These individuals may or may not
have enrolled in coverage by the end of the reference period
(4) “Individuals Determined or Assessed Eligible for Medicaid / CHIP by the Marketplace” represents the number of individuals
who have been determined or assessed by the Marketplace as eligible for Medicaid or CHIP based on their modified adjusted
gross income (MAGI). In some states, completed applications for individuals, whom the Marketplace has assessed as potentially
eligible for Medicaid or CHIP, based on MAGI, are transferred to the relevant state agency for a final eligibility determination.
In these “assessment states” the data include those accounts where a final decision is pending. In other states, the Marketplace
has been delegated the final Medicaid/CHIP eligibility determination responsibility for these individuals. Thus, this data element
includes FFM determinations and assessments, regardless of the state Medicaid/CHIP agency’s final eligibility determination, if
applicable. These data may vary from accounts transferred via “flat file” to states by the FFM. Quality assurance continues on
Medicaid assessments and determinations. Note: Marketplace Medicaid/CHIP eligibility determination and assessment data in
this report cannot be added to eligibility determination data in the most recent monthly Medicaid and CHIP Applications,
Eligibility Determinations, and Enrollment report (available on Medicaid.gov) which covers data through December 2014. In the
Marketplaces, some of the individuals assessed or determined eligible for Medicaid or CHIP by the Marketplace and reported in
this report may also be reported in the monthly Medicaid and CHIP Applications, Eligibility Determinations, and Enrollment
Report when the state has made an eligibility determination based on the information provided by the Marketplace. Total
Medicaid/CHIP enrollment is reported in the monthly Medicaid and CHIP Applications, Eligibility Determinations, and
Enrollment Report, and is a point-in-time count of total enrollment in the Medicaid and CHIP programs at the end of the monthly
reporting period.
(5) “Individuals With 2015 Marketplace Plan Selections” represents the total number of individuals determined eligible to enroll
in a plan through the marketplace” who have selected a 2015 Marketplace medical plan for enrollment through the Marketplaces or, after December 15, have been automatically reenrolled in Marketplace coverage (with or without the first premium payment
having been received directly by the issuer) during the reference period. This is also known as pre-effectuated enrollment,
because enrollment is not considered effectuated until the first premium payment is made, and this figure includes plan selections
for which enrollment has not yet been effectuated. These data do not include a count of the number of individuals who have
selected a standalone dental plan; or individuals who may have selected a 2014 Marketplace plan during the reporting period, as a
result of having been granted a Special Enrollment Period (SEP). Except for three states, the data for total number of plan
selections removes cancellations and terminations. Minnesota does not remove either from its total plan selection data, whereas
DC removes cancellations and terminations from its automatic reenrollment data and New York removes cancellations and
terminations from its active and automatic reenrollee data.
(6) California reports data through 2/22/15.
(7) Reported Medicaid + CHIP eligibility assessment totals may be underreported, as CA and CO employ processes that do not
capture all Medicaid + CHIP eligibility assessments.
(8) Colorado data for individuals applying and those eligible for a QHP does not include individuals automatically reenrolled.
Therefore, the number of individuals completing applications, and those eligible for a QHP, is less than the total number of
individuals enrolled. Colorado’s Marketplace, Connect for Health Colorado, and the Medicaid Agency, use the Shared Eligibility
System to determine eligibility for Medicaid, APTC/CSR, and CHIP. Therefore, the data provided by Colorado for “Individuals
Assessed Eligible for Medicaid/CHIP” only include new individual determinations for the Medicaid and CHIP programs
processed between 11/15/14 – 2/21/15. These data do not include redeterminations, recertifications, and renewals for Medicaid
and CHIP.
(9) Connecticut’s number of individuals assessed eligible for Medicaid/CHIP is greater than the number of individuals applying.
This results from Medicaid redeterminations for individuals who already have an initial application with the exchange.
(10) Minnesota data for number of individuals assessed eligible for Medicaid/MinnesotaCare represents data through 2/22/15.
(11) New York eligibility data represent individuals who have an active eligibility determination on or after 11/15/14. The
number of individuals applying represents individuals in accounts that were created on or after 11/15/14. This figure does not
include renewals, or other eligibility determinations for accounts created before 11/15/14.
Source: Centers for Medicare & Medicaid Services, as of 3-6-15.
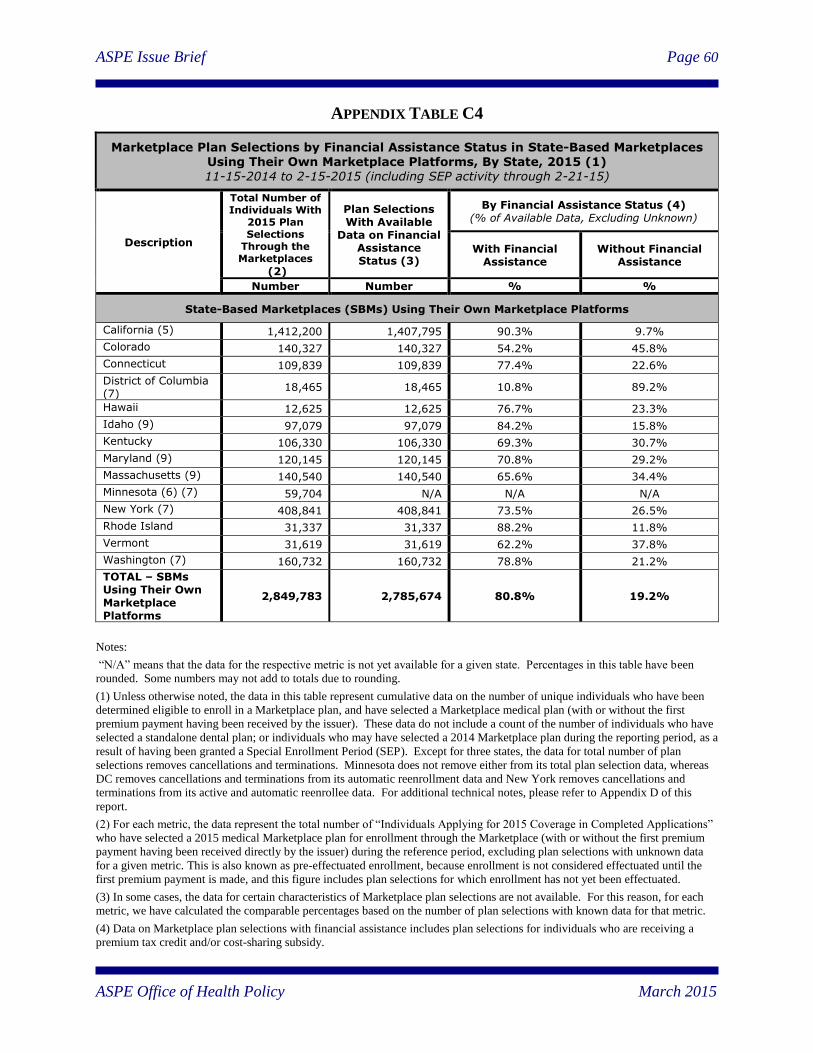
ASPE Issue Brief Page 60
ASPE Office of Health Policy March 2015
APPENDIX TABLE C4
Marketplace Plan Selections by Financial Assistance Status in State-Based Marketplaces Using Their Own Marketplace Platforms, By State, 2015 (1) 11-15-2014 to 2-15-2015 (including SEP activity through 2-21-15)
Description
Total Number of Individuals With
2015 Plan Selections
Through the Marketplaces
(2)
Plan Selections With Available
Data on Financial Assistance Status (3)
By Financial Assistance Status (4) (% of Available Data, Excluding Unknown)
With Financial Assistance
Without Financial Assistance
Number Number % %
State-Based Marketplaces (SBMs) Using Their Own Marketplace Platforms
California (5) 1,412,200 1,407,795 90.3% 9.7%
Colorado 140,327 140,327 54.2% 45.8%
Connecticut 109,839 109,839 77.4% 22.6%
District of Columbia (7)
18,465 18,465 10.8% 89.2%
Hawaii 12,625 12,625 76.7% 23.3%
Idaho (9) 97,079 97,079 84.2% 15.8%
Kentucky 106,330 106,330 69.3% 30.7%
Maryland (9) 120,145 120,145 70.8% 29.2%
Massachusetts (9) 140,540 140,540 65.6% 34.4%
Minnesota (6) (7) 59,704 N/A N/A N/A
New York (7) 408,841 408,841 73.5% 26.5%
Rhode Island 31,337 31,337 88.2% 11.8%
Vermont 31,619 31,619 62.2% 37.8%
Washington (7) 160,732 160,732 78.8% 21.2%
TOTAL – SBMs Using Their Own
Marketplace Platforms
2,849,783 2,785,674 80.8% 19.2%
Notes:
“N/A” means that the data for the respective metric is not yet available for a given state. Percentages in this table have been
rounded. Some numbers may not add to totals due to rounding.
(1) Unless otherwise noted, the data in this table represent cumulative data on the number of unique individuals who have been
determined eligible to enroll in a Marketplace plan, and have selected a Marketplace medical plan (with or without the first
premium payment having been received by the issuer). These data do not include a count of the number of individuals who have
selected a standalone dental plan; or individuals who may have selected a 2014 Marketplace plan during the reporting period, as a
result of having been granted a Special Enrollment Period (SEP). Except for three states, the data for total number of plan
selections removes cancellations and terminations. Minnesota does not remove either from its total plan selection data, whereas
DC removes cancellations and terminations from its automatic reenrollment data and New York removes cancellations and
terminations from its active and automatic reenrollee data. For additional technical notes, please refer to Appendix D of this
report.
(2) For each metric, the data represent the total number of “Individuals Applying for 2015 Coverage in Completed Applications”
who have selected a 2015 medical Marketplace plan for enrollment through the Marketplace (with or without the first premium
payment having been received directly by the issuer) during the reference period, excluding plan selections with unknown data
for a given metric. This is also known as pre-effectuated enrollment, because enrollment is not considered effectuated until the
first premium payment is made, and this figure includes plan selections for which enrollment has not yet been effectuated.
(3) In some cases, the data for certain characteristics of Marketplace plan selections are not available. For this reason, for each
metric, we have calculated the comparable percentages based on the number of plan selections with known data for that metric.
(4) Data on Marketplace plan selections with financial assistance includes plan selections for individuals who are receiving a
premium tax credit and/or cost-sharing subsidy.

ASPE Issue Brief Page 61
ASPE Office of Health Policy March 2015
(5) California reports represent data through 2/22/15. California’s plan selection breakouts result in roughly 4,000 unknowns due
to total plan selection and plan selection breakout reports having been run at different times.
(6) Minnesota tracks plan selection by financial assistance at the household level; it cannot report it at the individual level.
(7) All states except DC, Minnesota, New York, and Washington removed cancellations and terminations from all total plan
selection data. DC removed cancellations and terminations from it automatic reenrollee data. New York removed cancellations
and terminations from all of its reenrollee data, active and automatic, but did not remove them from the “new” plan selections.
Washington removed terminations from all of their plan selection data. Minnesota did not remove cancellations and terminations
from its plan selection data.
(8) Washington reports only individuals who have both enrolled and paid for coverage (effectuated enrollment) for its report of
plan selection, thereby undercounting the true total number of plan selections in Washington.
(9) Idaho is an SBM that changed Marketplace platforms for the 2015 coverage year (Idaho transitioned from using the
HealthCare.gov platform to using its own platform). Additionally, Massachusetts and Maryland changed their eligibility and
enrollment system vendors for the 2015 coverage year. All of the plan selections for these states are being treated as new
consumers for operational enrollment and reporting purposes.
Source: Centers for Medicare & Medicaid Services, as of 3-6-15.
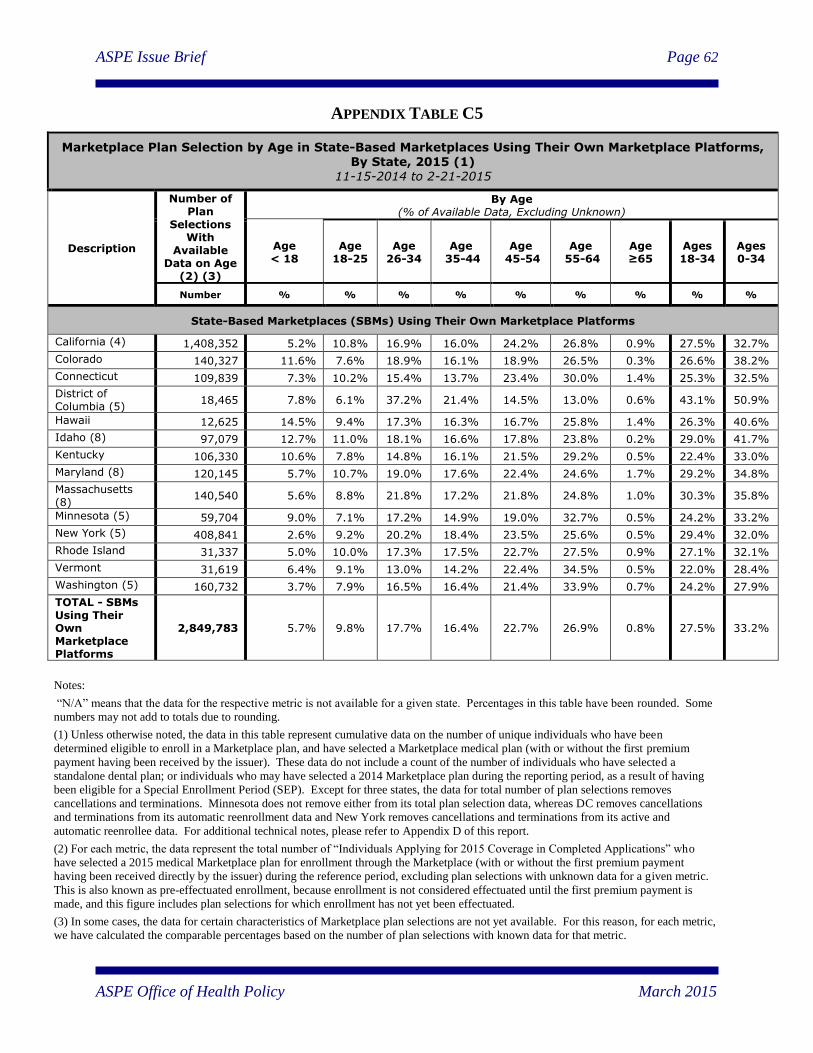
ASPE Issue Brief Page 62
ASPE Office of Health Policy March 2015
APPENDIX TABLE C5
Marketplace Plan Selection by Age in State-Based Marketplaces Using Their Own Marketplace Platforms, By State, 2015 (1)
11-15-2014 to 2-21-2015
Description
Number of Plan
Selections With
Available Data on Age
(2) (3)
By Age (% of Available Data, Excluding Unknown)
Age < 18
Age 18-25
Age 26-34
Age 35-44
Age 45-54
Age 55-64
Age ≥65
Ages 18-34
Ages 0-34
Number % % % % % % % % %
State-Based Marketplaces (SBMs) Using Their Own Marketplace Platforms
California (4) 1,408,352 5.2% 10.8% 16.9% 16.0% 24.2% 26.8% 0.9% 27.5% 32.7%
Colorado 140,327 11.6% 7.6% 18.9% 16.1% 18.9% 26.5% 0.3% 26.6% 38.2%
Connecticut 109,839 7.3% 10.2% 15.4% 13.7% 23.4% 30.0% 1.4% 25.3% 32.5%
District of Columbia (5)
18,465 7.8% 6.1% 37.2% 21.4% 14.5% 13.0% 0.6% 43.1% 50.9%
Hawaii 12,625 14.5% 9.4% 17.3% 16.3% 16.7% 25.8% 1.4% 26.3% 40.6%
Idaho (8) 97,079 12.7% 11.0% 18.1% 16.6% 17.8% 23.8% 0.2% 29.0% 41.7%
Kentucky 106,330 10.6% 7.8% 14.8% 16.1% 21.5% 29.2% 0.5% 22.4% 33.0%
Maryland (8) 120,145 5.7% 10.7% 19.0% 17.6% 22.4% 24.6% 1.7% 29.2% 34.8%
Massachusetts (8)
140,540 5.6% 8.8% 21.8% 17.2% 21.8% 24.8% 1.0% 30.3% 35.8%
Minnesota (5) 59,704 9.0% 7.1% 17.2% 14.9% 19.0% 32.7% 0.5% 24.2% 33.2%
New York (5) 408,841 2.6% 9.2% 20.2% 18.4% 23.5% 25.6% 0.5% 29.4% 32.0%
Rhode Island 31,337 5.0% 10.0% 17.3% 17.5% 22.7% 27.5% 0.9% 27.1% 32.1%
Vermont 31,619 6.4% 9.1% 13.0% 14.2% 22.4% 34.5% 0.5% 22.0% 28.4%
Washington (5) 160,732 3.7% 7.9% 16.5% 16.4% 21.4% 33.9% 0.7% 24.2% 27.9%
TOTAL - SBMs Using Their Own Marketplace Platforms
2,849,783 5.7% 9.8% 17.7% 16.4% 22.7% 26.9% 0.8% 27.5% 33.2%
Notes:
“N/A” means that the data for the respective metric is not available for a given state. Percentages in this table have been rounded. Some
numbers may not add to totals due to rounding.
(1) Unless otherwise noted, the data in this table represent cumulative data on the number of unique individuals who have been
determined eligible to enroll in a Marketplace plan, and have selected a Marketplace medical plan (with or without the first premium
payment having been received by the issuer). These data do not include a count of the number of individuals who have selected a
standalone dental plan; or individuals who may have selected a 2014 Marketplace plan during the reporting period, as a result of having
been eligible for a Special Enrollment Period (SEP). Except for three states, the data for total number of plan selections removes
cancellations and terminations. Minnesota does not remove either from its total plan selection data, whereas DC removes cancellations
and terminations from its automatic reenrollment data and New York removes cancellations and terminations from its active and
automatic reenrollee data. For additional technical notes, please refer to Appendix D of this report.
(2) For each metric, the data represent the total number of “Individuals Applying for 2015 Coverage in Completed Applications” who
have selected a 2015 medical Marketplace plan for enrollment through the Marketplace (with or without the first premium payment
having been received directly by the issuer) during the reference period, excluding plan selections with unknown data for a given metric.
This is also known as pre-effectuated enrollment, because enrollment is not considered effectuated until the first premium payment is
made, and this figure includes plan selections for which enrollment has not yet been effectuated.
(3) In some cases, the data for certain characteristics of Marketplace plan selections are not yet available. For this reason, for each metric,
we have calculated the comparable percentages based on the number of plan selections with known data for that metric.

ASPE Issue Brief Page 63
ASPE Office of Health Policy March 2015
(4) California reports represent data through 2/22/15. California’s plan selection breakouts result in roughly 4,000 unknowns due to total
plan selection and plan selection breakout reports run at different times.
(5) All states except DC, Minnesota, New York, and Washington removed cancellations and terminations from all total plan selection
data. DC removed cancellations and terminations from it auto reenrollee data. New York removed cancellations and terminations from all
of its reenrollee data, active and automatic, but did not remove them from the “new” plan selections. Washington removed terminations
from all of their plan selection data. Minnesota did not remove cancellations and terminations from its plan selection data.
(7) Washington reports only individuals who have both enrolled and paid for coverage (effectuated enrollment) for its report of plan
selection, thereby undercounting the true total of plan selections in Washington.
(8) Idaho is an SBM that changed Marketplace platforms for the 2015 coverage year (Idaho transitioned from using the HealthCare.gov
platform to using its own platform). Additionally, Massachusetts and Maryland changed their eligibility and enrollment system vendors
for the 2015 coverage year. All of the plan selections for these states are being treated as new consumers for operational enrollment and
reporting purposes.
Source: Centers for Medicare & Medicaid Services, as of 3-6-15.
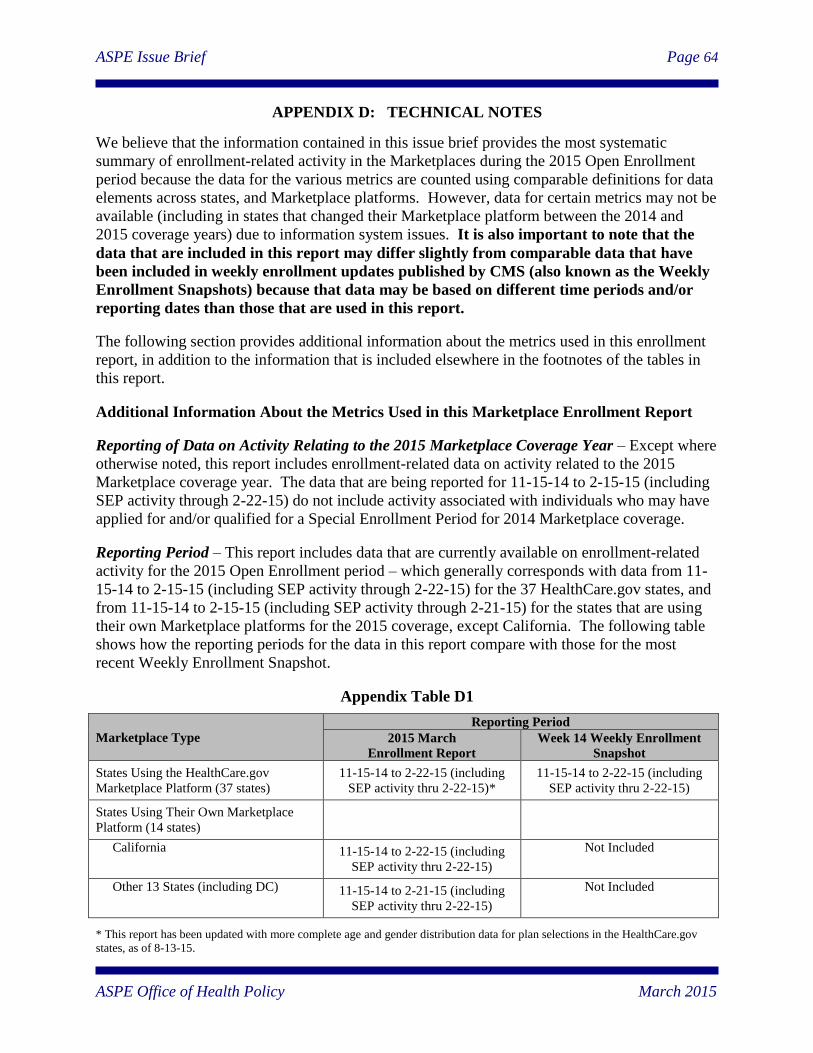
ASPE Issue Brief Page 64
ASPE Office of Health Policy March 2015
APPENDIX D: TECHNICAL NOTES
We believe that the information contained in this issue brief provides the most systematic
summary of enrollment-related activity in the Marketplaces during the 2015 Open Enrollment
period because the data for the various metrics are counted using comparable definitions for data
elements across states, and Marketplace platforms. However, data for certain metrics may not be
available (including in states that changed their Marketplace platform between the 2014 and
2015 coverage years) due to information system issues. It is also important to note that the
data that are included in this report may differ slightly from comparable data that have
been included in weekly enrollment updates published by CMS (also known as the Weekly
Enrollment Snapshots) because that data may be based on different time periods and/or
reporting dates than those that are used in this report.
The following section provides additional information about the metrics used in this enrollment
report, in addition to the information that is included elsewhere in the footnotes of the tables in
this report.
Additional Information About the Metrics Used in this Marketplace Enrollment Report
Reporting of Data on Activity Relating to the 2015 Marketplace Coverage Year – Except where
otherwise noted, this report includes enrollment-related data on activity related to the 2015
Marketplace coverage year. The data that are being reported for 11-15-14 to 2-15-15 (including
SEP activity through 2-22-15) do not include activity associated with individuals who may have
applied for and/or qualified for a Special Enrollment Period for 2014 Marketplace coverage.
Reporting Period – This report includes data that are currently available on enrollment-related
activity for the 2015 Open Enrollment period – which generally corresponds with data from 11-
15-14 to 2-15-15 (including SEP activity through 2-22-15) for the 37 HealthCare.gov states, and
from 11-15-14 to 2-15-15 (including SEP activity through 2-21-15) for the states that are using
their own Marketplace platforms for the 2015 coverage, except California. The following table
shows how the reporting periods for the data in this report compare with those for the most
recent Weekly Enrollment Snapshot.
Appendix Table D1
Marketplace Type
Reporting Period
2015 March
Enrollment Report
Week 14 Weekly Enrollment
Snapshot
States Using the HealthCare.gov
Marketplace Platform (37 states)
11-15-14 to 2-22-15 (including
SEP activity thru 2-22-15)*
11-15-14 to 2-22-15 (including
SEP activity thru 2-22-15)
States Using Their Own Marketplace
Platform (14 states)
California 11-15-14 to 2-22-15 (including
SEP activity thru 2-22-15)
Not Included
Other 13 States (including DC) 11-15-14 to 2-21-15 (including
SEP activity thru 2-22-15)
Not Included
* This report has been updated with more complete age and gender distribution data for plan selections in the HealthCare.gov
states, as of 8-13-15.

ASPE Issue Brief Page 65
ASPE Office of Health Policy March 2015
2015 Plan Selections Through the Marketplaces (also known as Marketplace Plan Selections) – Represents cumulative data on the number of unique individuals who have selected a 2015
plan through the Marketplaces for enrollment through the Marketplaces (with or without the first
premium payment having been received directly by the issuer) during the reference period. This
is also known as pre-effectuated enrollment, because enrollment is not considered effectuated
until the first premium payment is made, and this figure includes plan selections for which
enrollment has not yet been effectuated. These data represent the number of individuals with
active plan selections for a Marketplace medical plan as of the reporting date. These data do not
include stand-alone dental plan selections. These data also do not include any individuals who
may have selected a 2014 Marketplace plan during the reporting period, as a result of having
been eligible for a Special Enrollment Period (SEP).
Additionally, in the data for the HealthCare.gov states, individuals whose Marketplace coverage
has been cancelled or terminated are not included in the total number of Marketplace plan
selections.31
The data for the HealthCare.gov states also do not include plan selection data for
coverage with an effective date beginning after 3-1-15. This table only reflects data for the
individual market Marketplaces. Among the SBMs that are using their own Marketplace
platforms, except for three states, the data for total number of plan selections removes
cancellations and terminations. Minnesota does not remove either from its total plan selection
data, whereas DC removes cancellations and terminations from its automatic reenrollment data
and New York removes cancellations and terminations from its active and automatic reenrollee
data.
We are using the term “active Marketplace plan selections” to signify that the total number of
Individuals Who Have Selected a Marketplace Plan that is reported in the monthly Marketplace
enrollment reports excludes data for plan selections that have been cancelled or terminated. For
example, if an individual selected a Marketplace plan during the first week of the open
enrollment period, but selected a different plan during the third week of the open enrollment
period, the active plan selections total would only include data for the most recent plan selection.
This is consistent with the way that the Marketplace plan selection data were reported in the
previous monthly enrollment reports for the 2014 Open Enrollment period.
This report includes data on SEP activity through 2-22-15. It is important to note that this report
does not include data on effectuated enrollment (that the number of people who have paid
monthly premiums to the insurer). Additionally, this report does not include data relating to any
individuals who enroll through an SEP after 2-22-15, including any upcoming SEP for
individuals who were unaware of, or did not understand the implications of the fee for not
enrolling in health insurance coverage.
This report does not include data relating to any individuals who enroll through an SEP after 2-
22-15, including any upcoming SEP for individuals who were unaware of, or did not understand
the implications of the fee for not enrolling in health insurance coverage.
31 For example, coverage has been terminated for approximately 90,000 consumers who had 2014 coverage were not able to
continue their Marketplace coverage in 2015 because they did not provide the necessary documentation of their citizenship or
immigration status, and these individuals are no longer included in the cumulative total.
ASPE Issue Brief Page 66
ASPE Office of Health Policy March 2015
In-Line Special Enrollment Period – The SEP for individuals who were “in-line” on 2-15-15
ended on 2-22-15 for the states that are using the HealthCare.gov platform. Most of the SBMs
that are using their own Marketplace platforms allowed individuals who started the process
before 2-15-15, but could not finish, to complete the application and select a plan by varying
dates, mostly within February, with the exception of Colorado, which allowed applicants through
March 2 to complete their applications, and Washington, which allowed applicants to enroll
through April 17. Vermont has indicated that the state will assist consumers with enrollment if
they report a problem trying to enroll, but did not provide for a formal extension period.
Tax Season Special Enrollment Period – CMS recently announced a special enrollment period
(SEP) for tax season. For individuals and families in the HealthCare.gov states who did not have
health coverage in 2014 and are subject to the fee or “shared responsibility payment” when they
file their 2014 taxes. For those who were unaware or did not understand the implications of the
fee for not enrolling in coverage, CMS will provide consumers with an opportunity to purchase
health insurance coverage from March 15 to April 30, 2015. (For additional information, see
http://www.cms.gov/Newsroom/MediaReleaseDatabase/Press-releases/2015-Press-releases-
items/2015-02-20.html). Most of the SBMs that are using their own Marketplace platforms
followed the federal guidelines regarding the SEP for tax season.
Definitions of “New” and “Reenrolling” Consumers – The monthly enrollment reports for the
2015 Open Enrollment period distinguish plan selections by new consumers from plan selections
by those who are reenrolling in Marketplace coverage:
• “New Consumers” are those individuals who selected a 2015 plan through the
Marketplaces (with or without the first premium payment having been received directly
by the issuer) and did not have an active 2014 Marketplace plan selection as of
November 1, 2014. These data do not include stand-alone dental plan selections. These
data also generally do not include any individuals who may have selected a 2014
Marketplace plan during the reporting period, as a result of having been eligible for a
Special Enrollment Period (SEP);. Additionally, in the data for the HealthCare.gov states
and most states using their own platforms, individuals who have cancelled or terminated
their Marketplace plans are not included in the total number of Marketplace plan
selections. Additionally, some states are generally classifying all of their plan selections
as new consumers for operational enrollment and reporting purposes due to changes in
Marketplace platform (e.g., Idaho switched to using its own Marketplace platform in
2015, while Nevada and Oregon switched to using the HealthCare.gov platform in 2015),
or changes in system vendors (Maryland and Massachusetts).
• “Consumers reenrolling in coverage through the Marketplaces” are those individuals
who had Marketplace plan selection as of November 2014, and have either actively
submitted a 2015 application and selected a 2015 Marketplace medical plan, or have been
automatically reenrolled in coverage through the Marketplaces – with or without the first
premium payment having been received directly by the issuer. Individuals who have
cancelled or terminated their Marketplace plans are not included in the total number of
plan selections. These data also do not include: standalone dental plan selections; or
ASPE Issue Brief Page 67
ASPE Office of Health Policy March 2015
individuals who may have selected a 2014 Marketplace plan during the reporting period,
as a result of having been eligible for a Special Enrollment Period (SEP). This category
is consistent with the “consumers renewing coverage” category that is included in the
HHS Weekly Enrollment Snapshots. Consumers reenrolling in coverage through the
Marketplaces includes the following two categories:
o Consumers who are Actively Reenrolling in Marketplace Coverage – People who
had a Marketplace plan selection as of November 2014, and return to the Marketplace
to select a new plan or actively renew their existing plan. A consumer is considered
to have actively selected a plan, if they are a consumer with coverage in 2014 who
came back, updated their application and selected a plan. The consumer could have
actively selected their 2014 plan, decided to choose a new plan from their existing
insurer or selected a new plan from a different insurer. A consumer could have
actively selected a plan prior to the 12-15-14 deadline or could have come back after
being automatically reenrolled and decided to update their information and select a
plan; and
o Consumers who have been Automatically Reenrolled into Marketplace Coverage
(also known as “Automatic Reenrollees”) – People who had a Marketplace plan
selection as of November 2014, and retain coverage without returning to the
Marketplace and selecting a plan. A consumer was automatically reenrolled into their
2014 plan or a plan with similar benefits from their same issuer32
if they were
enrolled in a Marketplace plan in 2014 and did not select a plan ahead of the 12-15-14
deadline. If the consumer realized after the deadline that there was a better plan for
their family or needed to update their information, the consumer could make that
change before 2-15-15, and would at that point be considered as having actively
selected a plan.
The categories of Marketplace plan selection data for the 2015 Open Enrollment period that are
included in this report vary by Marketplace type and state:
32 Some consumers’ 2014 plans were no longer active for 2015 but the insurer offered a plan with similar benefits. Based on the
information provided by the insurance companies, consumers were “crosswalked” and automatically re-enrolled into that similar
plan. No consumer was automatically re-enrolled into a plan with a different issuer.
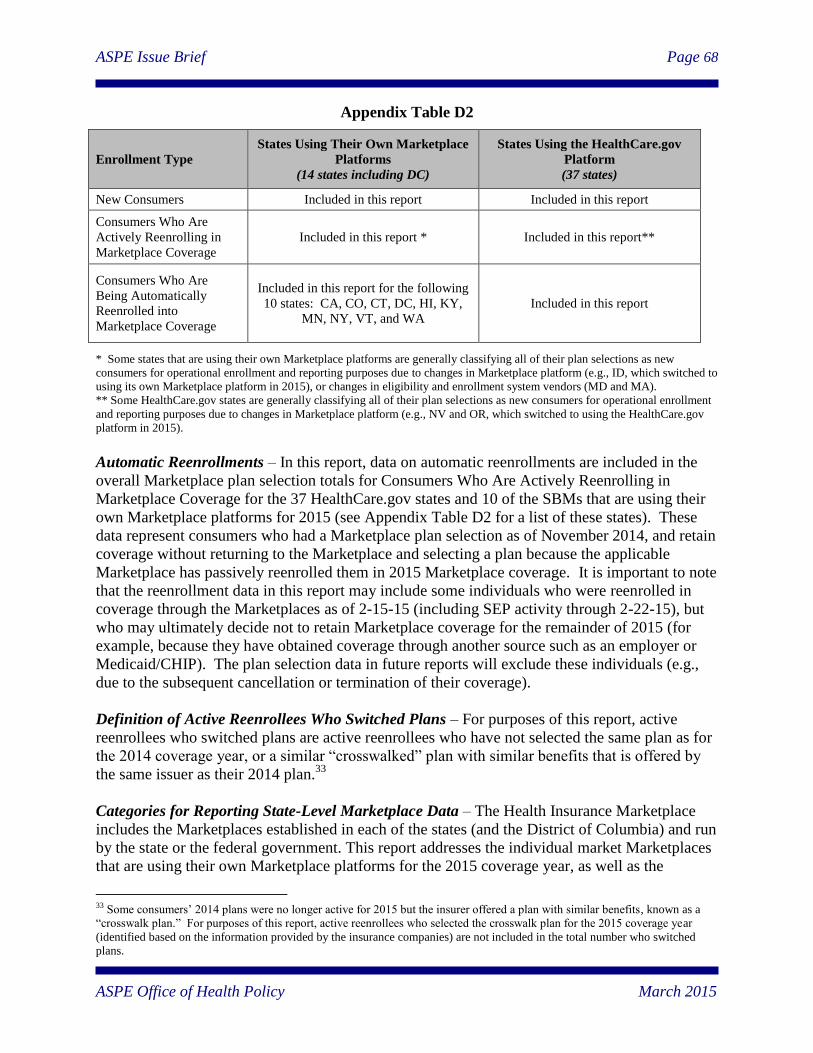
ASPE Issue Brief Page 68
ASPE Office of Health Policy March 2015
Appendix Table D2
Enrollment Type
States Using Their Own Marketplace
Platforms
(14 states including DC)
States Using the HealthCare.gov
Platform
(37 states)
New Consumers Included in this report Included in this report
Consumers Who Are
Actively Reenrolling in
Marketplace Coverage
Included in this report * Included in this report**
Consumers Who Are
Being Automatically
Reenrolled into
Marketplace Coverage
Included in this report for the following
10 states: CA, CO, CT, DC, HI, KY,
MN, NY, VT, and WA
Included in this report
* Some states that are using their own Marketplace platforms are generally classifying all of their plan selections as new
consumers for operational enrollment and reporting purposes due to changes in Marketplace platform (e.g., ID, which switched to
using its own Marketplace platform in 2015), or changes in eligibility and enrollment system vendors (MD and MA).
** Some HealthCare.gov states are generally classifying all of their plan selections as new consumers for operational enrollment
and reporting purposes due to changes in Marketplace platform (e.g., NV and OR, which switched to using the HealthCare.gov
platform in 2015).
Automatic Reenrollments – In this report, data on automatic reenrollments are included in the
overall Marketplace plan selection totals for Consumers Who Are Actively Reenrolling in
Marketplace Coverage for the 37 HealthCare.gov states and 10 of the SBMs that are using their
own Marketplace platforms for 2015 (see Appendix Table D2 for a list of these states). These
data represent consumers who had a Marketplace plan selection as of November 2014, and retain
coverage without returning to the Marketplace and selecting a plan because the applicable
Marketplace has passively reenrolled them in 2015 Marketplace coverage. It is important to note
that the reenrollment data in this report may include some individuals who were reenrolled in
coverage through the Marketplaces as of 2-15-15 (including SEP activity through 2-22-15), but
who may ultimately decide not to retain Marketplace coverage for the remainder of 2015 (for
example, because they have obtained coverage through another source such as an employer or
Medicaid/CHIP). The plan selection data in future reports will exclude these individuals (e.g.,
due to the subsequent cancellation or termination of their coverage).
Definition of Active Reenrollees Who Switched Plans – For purposes of this report, active
reenrollees who switched plans are active reenrollees who have not selected the same plan as for
the 2014 coverage year, or a similar “crosswalked” plan with similar benefits that is offered by
the same issuer as their 2014 plan.33
Categories for Reporting State-Level Marketplace Data – The Health Insurance Marketplace
includes the Marketplaces established in each of the states (and the District of Columbia) and run
by the state or the federal government. This report addresses the individual market Marketplaces
that are using their own Marketplace platforms for the 2015 coverage year, as well as the
33 Some consumers’ 2014 plans were no longer active for 2015 but the insurer offered a plan with similar benefits, known as a
“crosswalk plan.” For purposes of this report, active reenrollees who selected the crosswalk plan for the 2015 coverage year
(identified based on the information provided by the insurance companies) are not included in the total number who switched
plans.
ASPE Issue Brief Page 69
ASPE Office of Health Policy March 2015
individual market Marketplaces that are using the HealthCare.gov Marketplace platform for
eligibility and enrollment for the 2015 coverage year (data for the small group Marketplace, also
known as SHOP, is not included in this report).
Marketplace enrollment-for the 2015 Open Enrollment period, will be reported based on the
following two major categories:
• State-Based Marketplaces (SBMs) Using Their Own Marketplace Platform – 14
states (including DC):
California, Colorado, Connecticut, District of Columbia, Hawaii, Idaho, Kentucky,
Maryland, Massachusetts, Minnesota, New York, Rhode Island, Vermont, and
Washington.
• States Using the HealthCare.gov Platform – 37 states, including:
o State-Based Marketplaces Using the HealthCare.gov Platform – 3 states
Nevada, New Mexico, and Oregon (Note: one of these states (New Mexico) also used the
HealthCare.Gov platform during the 2014 Open Enrollment period; however, Nevada
and Oregon switched to using the HealthCare.gov platform for the 2015 Open
Enrollment period).
o Federally-Facilitated Marketplaces – 34 states
Alabama, Alaska, Arizona, Arkansas, Delaware, Florida, Georgia, Illinois, Indiana, Iowa,
Kansas, Louisiana, Maine, Michigan, Mississippi, Missouri, Montana, Nebraska, New
Hampshire, New Jersey, North Carolina, North Dakota, Ohio, Oklahoma, Pennsylvania,
South Carolina, South Dakota, Tennessee, Texas, Utah, Virginia, West Virginia,
Wisconsin, and Wyoming. (Note: all of these states also used the HealthCare.Gov
platform during the 2014 Open Enrollment period).
Notes on Changes in Marketplace Platforms – The following states changed their Marketplace
eligibility and enrollment platform between the 2014 and 2015 coverage years:
• Nevada and Oregon switched from using their own Marketplace eligibility and
enrollment platforms in 2014 to using the HealthCare.gov platform for eligibility and
enrollment for 2015 (as a consequence, people who select 2015 Marketplace plans in
Nevada and Oregon are generally treated as new consumers for operational enrollment
and reporting purposes because the system cannot identify or automatically reenroll
individuals who previously had 2014 Marketplace coverage in these states); and
• Idaho switched from using the HealthCare.gov platform for 2014 to using its own
Marketplace platform for 2015.
Additionally, Maryland and Massachusetts are continuing to use their own Marketplace

ASPE Issue Brief Page 70
ASPE Office of Health Policy March 2015
platforms, but have implemented new eligibility and enrollment systems for the 2015 Open
Enrollment period, and as a result, the Marketplaces in these states are unable to distinguish
between new consumers and consumers reenrolling in coverage through the Marketplaces for
plan year 2015. Individuals who have 2014 Marketplace coverage in these states will need to
return to the Marketplace to reenroll in coverage for 2015.
Idaho, Nevada, Oregon, Maryland and Massachusetts are generally classifying all of their plan
selections as new consumers for operational enrollment and reporting purposes due to their
changes in Marketplace platform (e.g., ID, NV and OR) or eligibility and enrollment system
vendors (MD and MA).
Data on Total Number of Completed Applications and Total Individuals Applying for
Coverage in Completed Applications – We are showing data on the number of completed
applications and the total number of individuals applying for coverage in the completed
applications in this report.
Data on Marketplace Plan Selections with Financial Assistance – Marketplace plan selections
with financial assistance includes plan selections for individuals who are receiving a premium
tax credit and/or cost-sharing reduction.
Data on Premium Tax Credits – The Affordable Care Act specifies that an individual or family
who is eligible for premium tax credits will be required to pay no more than a fixed percentage of
their income based on the second-lowest cost silver plan available in the Marketplace in their
coverage area. This applicable percentage varies only by household income as a percentage of the
Federal Poverty Level (FPL) and does not depend on household members’ ages, the number of
people within the household covered through the Marketplace, or Marketplace premiums. The
applicable percentage is converted into a maximum dollar amount the household is required to pay
annually for the benchmark plan, and the premium tax credit is applied to make up the difference
between the maximum dollar amount and the actual premium, if any. The exact dollar amount of the
premium tax credit depends on the premium of the second-lowest cost silver plan available to the
household and the cost of covering the family members who are seeking Marketplace coverage.
For purposes of this report, an individual qualifying for an advance premium tax credit was
defined as any individual with an APTC amount >$0. Averages in this brief refer to plan-
selection-weighted averages across individuals with plan selections with advance premium tax
credits in the 37 HealthCare.gov states.34
Data on Characteristics of Marketplace Plan Selections by Metal Level – The subtotals for
each metal tier type do not sum to the total number of Plan Selections with Available Data on
Metal Level due to a small number of individuals (0.1%) who have multiple 2015 Marketplace
plan selections in the system that will be resolved through data cleanup processes. Data for
standalone dental plan selections are shown separately.
34 For additional methodological information, see the ASPE Issue Brief “Health Insurance Marketplace 2015: Average Premiums
After Advance Premium Tax Credits Through January 30 in 37 States Using the HealthCare.gov Platform,” accessed at
http://www.aspe.hhs.gov/health/reports/2015/MarketPlaceEnrollment/APTC/ib_APTC.pdf.

ASPE Issue Brief Page 71
ASPE Office of Health Policy March 2015
Standalone Dental Plan Selections – Individuals who are shopping for health insurance
coverage in the Marketplace have the choice of selecting:
• A medical Marketplace plan with integrated dental coverage,
• A medical Marketplace plan without integrated dental coverage, or
• A medical Marketplace plan and a separate standalone dental plan (it is not possible to
select a standalone dental plan without also selecting a medical plan).
Individuals who have selected both a medical Marketplace plan and a standalone dental plan are
only counted once in the total Marketplace plan selections metric. However, we report data on
total standalone dental plan selections separately for the 37 states that are using the
HealthCare.gov platform, including combined data for both the “High” and “Low” standalone
dental plan types (see Appendix Tables A1 and A2).
Data on Additional Characteristics of Marketplace Plan Selections – This report also includes
data on the characteristics of individuals who have selected a Marketplace plan in the 37 states
that are using the HealthCare.gov platform by Race/Ethnicity and Rural Status. In some cases,
the data for certain characteristics of Marketplace plan selections are not yet available. For this
reason, for each metric, we have calculated the comparable percentages based on the number of
plan selections with known data for that metric.
Race/Ethnicity – The application for Marketplace coverage in the states using the
HealthCare.gov platform contains questions on race and on ethnicity, which are both
marked as optional. The share of unknown race/ethnicity in Marketplace plan selection
data for HealthCare.gov states is higher than in federal survey data,35
but lower than that
reported in administrative data sources in the healthcare industry.36
Thus, while this
information is provided for transparency purposes, its quality is low and its use should be
limited. For example, it is also important to note that the racial/ethnic makeup of the
individuals with unknown race and ethnicity who selected a Marketplace plan in the
HealthCare.gov states may differ substantially from that among those who reported race
and ethnicity. For example, if racial and ethnic minorities are more likely to skip the
optional questions, they would be disproportionately under-reported in the overall
totals.37
35 The main Census surveys have missing data on 3 to 5 percent of respondents, and the National Health Interview Survey has
missing information for about 5 percent of respondents. (Source: ASPE correspondence with U.S. Census and the National
Center for Health Statistics regarding the American Community Survey, the Current Population Survey, and the National Health
Interview Survey; February 2014.) 36 For example, a study of administrative data from the Department of Veterans Affairs found that race/ethnicity information was
missing from files for 36 percent of patients. Additionally, as of 2008, commercial plans that collected race and ethnicity data
only had information for about 40 percent of their members. The health insurance company Aetna, which began collecting data
on race and ethnicity for all its members in 2002 via enrollment forms, currently has information on race/ethnicity for about 35
percent of its membership. (Sources: Nancy R. Kressin, Bei-Hung Chang, Ann Hendricks, and Lewis E. Kazis, “Agreement
between administrative data and patients’ self-reports of race/ethnicity,” American Journal of Public Health, vol. 93, no. 10
(2003), p. 1734-1739); José J. Escarce, Rita Carreón, German Veselovskiy, and Elisa H. Lawson, “Collection of race and
ethnicity data by health plans has grown substantially, but opportunities remain to expand efforts,” Health Affairs, vol. 30, no. 10
(2011); and Aetna, “Aetna’s Commitment,” accessed April 25, 2014. Available at: http://www.aetna.com/about-aetna-
insurance/initiatives/racial-ethnic-equality/index.html. 37 For additional information on the methodology that was used to analyze the characteristics of individuals who selected a
Marketplace plan in the HealthCare.gov states by race/ethnicity, please refer to Appendix C in the 2014 Marketplace Summary

ASPE Issue Brief Page 72
ASPE Office of Health Policy March 2015
Rural Status – The proportion of Marketplace plan selections in rural areas was derived
by aggregating data for Marketplace plan selections with valid ZIP Code information
based on the HHS Office of Rural Health Policy’s (ORHP) most current list of Rural
Designated ZIPs, which has been updated using the 2010 Census data.
Number of Individuals Determined or Assessed Eligible for Medicaid / CHIP by the
Marketplace – Marketplace Medicaid & CHIP eligibility determination and assessment data in
this report cannot be added to eligibility determination data in the most recent monthly Medicaid
and CHIP Applications, Eligibility Determinations, and Enrollment report (available on
www.Medicaid.gov), which covers data through October 2014. Some of the individuals assessed
or determined eligible for Medicaid or CHIP by the Marketplace and reported in this report may
also be reported in the monthly Medicaid and CHIP Applications, Eligibility Determinations, and
Enrollment Report when the state has made an eligibility determination based on the information
provided by the Marketplace. Total Medicaid & CHIP enrollment is reported in the monthly
Medicaid and CHIP Applications, Eligibility Determinations, and Enrollment Report, and is a
point-in-time count of total enrollment in the Medicaid and CHIP programs at the end of the
monthly reporting period.
Metrics Reported by SBMs Using Their Own Marketplace Platforms -- It is important to note
that some of the 14 states that are using their own Marketplace platforms are not separately
reporting data for new consumers and consumers who are reenrolling in Marketplace coverage.
Appendix Table D3
Metric Number of States Reporting Data for this Metric
Visitors to the Marketplace Websites 13 States – California, Colorado, Connecticut, District of Columbia,
Hawaii, Idaho, Kentucky, Maryland, Minnesota, New York, Rhode
Island, Vermont, Washington
Calls to the Marketplace Call Centers 14 States – California, Colorado, Connecticut, District of Columbia,
Hawaii, Idaho, Kentucky, Maryland, Massachusetts, Minnesota, New
York, Rhode Island, Vermont, Washington
Completed Applications 12 States – Colorado, Connecticut, District of Columbia, Hawaii,
Idaho, Kentucky, Maryland, Massachusetts, Minnesota, Rhode Island,
Vermont, Washington
Individuals Applying for Coverage in
Completed Applications
12 States – Colorado, Connecticut, District of Columbia, Hawaii,
Idaho, Kentucky, Massachusetts, Minnesota, New York, Rhode
Island, Vermont, Washington
Number of Individuals Determined
Eligible to Enroll in a Marketplace Plan
14 States – Colorado, California, Connecticut, District of Columbia,
Hawaii, Idaho, Kentucky, Maryland, Massachusetts, Minnesota, New
York, Rhode Island, Vermont, Washington
Number of Individuals Determined
Eligible to Enroll in a Marketplace Plan
with Financial Assistance
13 States –California, Connecticut, District of Columbia, Hawaii,
Idaho, Kentucky, Maryland, Massachusetts, Minnesota, New York,
Rhode Island, Vermont, Washington
Number of Individuals Determined or 14 States – California, Colorado, Connecticut, DC, Hawaii, Idaho,
Enrollment Report, which can be accessed at
http://www.aspe.hhs.gov/health/reports/2014/MarketPlaceEnrollment/Apr2014/ib_2014Apr_enrollment.pdf.

ASPE Issue Brief Page 73
ASPE Office of Health Policy March 2015
Metric Number of States Reporting Data for this Metric
Assessed Eligible for Medicaid/CHIP by
the Marketplace
Kentucky, Maryland, Massachusetts, Minnesota, New York, Rhode
Island, Vermont, Washington
Number of Individuals with 2015
Marketplace Plan Selections
14 States – California, Colorado, Connecticut, District of Columbia,
Hawaii, Idaho, Kentucky, Maryland, Massachusetts, Minnesota, New
York, Rhode Island, Vermont, Washington
2015 Marketplace Plan Selections by
Financial Assistance Status
13 States – California, Colorado, Connecticut, DC, Hawaii, Idaho,
Kentucky, Maryland, Massachusetts, New York, Rhode Island,
Vermont, Washington
2015 Marketplace Plan Selections by Age 14 States –California, Colorado, Connecticut, DC, Hawaii, Idaho,
Kentucky, Maryland, Massachusetts, Minnesota, New York, Rhode
Island, Vermont, Washington
2015 Marketplace Plan Selections by
Gender
14 States – California, Colorado, Connecticut, DC, Hawaii, Idaho,
Kentucky, Maryland, Massachusetts, Minnesota, New York, Rhode
Island, Vermont, Washington
2015 Marketplace Plan Selections by
Metal Level
14 States –California, Colorado, Connecticut, DC, Hawaii, Idaho,
Kentucky, Maryland, Massachusetts, Minnesota, New York, Rhode
Island, Vermont, Washington
Effectuated Enrollment – Data on effectuated enrollment for the 2015 Open Enrollment period
are not yet available. Therefore, the enrollment data in this report are generally based on pre-
effectuated enrollment (plan selections). However, one state, Washington, has reported data on
effectuated enrollment.
Additional Data Validation – CMS has been taking steps to enhance the processes for generating
and validating Marketplace data. As such, some of the numbers in this report could be updated
in future reports.