Embed Size (px)
Citation preview
AC Transit East Bay Bus Rapid Transit Projectin Alameda County
Final Environmental Impact Statement/Environmental Impact ReportPursuant to
National Environmental Policy Act of 1969, §102 (42 U.S.C. §4332); Federal Transit Laws (49 U.S.C. §5301(e), §5323(b) and §5324(b)); National Historic Preservation Act of 1966, §106 (16 U.S.C. §470f); 40 CFR Parts 1500-1508; 23 CFR Part 771; Executive Order 12898
(Environmental Justice); and California Environmental Quality Act, PRC 21000 et seq.; and the State of California CEQA Guidelines, California Administrative Code, 15000 et seq.
by the U.S. Department of Transportation/Federal Transit Administrationand the Alameda Contra Costa Transit District
Geologic AssessmentAddendum
December 2010
DRAFT
GEOLOGIC ASSESSMENT ADDENDUM
AC TRANSIT EAST BAY BRT EIS/R ALAMEDA COUNTY, CALIFORNIA
Prepared for:
KIMLEY-HORN AND ASSOCIATES, INC.
Submitted by:
AGS, INC.
DECEMBER 2010
AGS, Inc., 5 Freelon Street, San Francisco, CA 94107
AGS
KI0807 Geologic Assessment Addendum 2010.doc
This addendum presents the results of a review of the Geologic Assessment conducted
for the AC Transit East Bay BRT project in 2005. Some of the main points from the
Geologic Assessment are as follows:
• The project corridor is located in a seismically active region, which has been subjected to several strong earthquakes during historic time; however, no active faults are known to cross the project corridor. The Hayward Fault lies between 0.4 and 4.3 miles (0.64 and 7.0 kilometers) northeast of the project corridor, closest at both the northern and southern ends, and dominates the seismic hazard due to its proximity. The other major active faults, which could cause significant shaking of the project area, are the San Andreas, Concord, Calaveras, Rodgers Creek, and San Gregorio Faults.
• The Mmax is the largest earthquake that a given fault is calculated to be capable
of generating and the controlling Mmax that could affect the project area would be a magnitude 7.1 event occurring along the Hayward-Rodgers Creek Fault at approximately 0.64 kilometers from the project corridor. The duration of strong shaking from this earthquake would be approximately 15 to 25 seconds with a predominant period of approximately 0.25 to 0.35 seconds at the ground surface. Correlations between distance from a causative fault and mean values of the peak bedrock accelerations and the effects of local soil conditions on peak ground accelerations result in mean peak ground surface accelerations within the project area ranging from 0.50 to 0.60 g for the controlling Mmax event on the Hayward Fault.
• Reported groundwater levels along the project corridor ranged from depths of 4
to 30 feet below the ground surface, with an average depth of about 8 to 11 feet below the ground surface. The project corridor area south of Lake Merritt and the portion of East 14th Street (International Boulevard) at 13th Avenue, which is underlain by artificial fill, is considered to have a high susceptibility to liquefaction. All other portions of the project corridor are considered to have low to moderate susceptibility to liquefaction due to the density of granular subsurface materials or the presence of stiff cohesive soils. The consequences of liquefaction could include seismically-induced settlements, additional lateral loads on piles/piers, downdrag forces on pile/pier foundations, localized lateral deformation of fills, and flotation (buoyancy) of underground structures (i.e., tanks, pipelines and manholes) underlain by the potentially liquefiable soils.
• Because the project corridor is located in a relatively flat area, the seismically-
induced landslide potential is considered to be relatively low.
• The majority of the uppermost materials along the project corridor predominantly consist of clay and silt mixtures with some sand. Localized clayey soils within the
1
AGS
KI0807 Geologic Assessment Addendum 2010.doc
2
project corridor area are likely to be moderately expansive. Expansive soils may cause differential settlement, cracking, and deterioration of roadway pavements.
• Available data indicates that the majority of soils along the project corridor are
suitable for support of light structures; however, uncontrolled fill material and bay mud are not suitable for support of foundations.
The Geologic Assessment was conducted based on reference material available at
that time. Additional, more current, material may be available now; however, this is
not anticipated to change the information presented in the report. Therefore, no
revisions to the Geologic Assessment are warranted at this time.
DRAFT
GEOLOGIC ASSESSMENT FINAL REPORT
AC TRANSIT EAST BAY BRT EIS/R ALAMEDA COUNTY, CALIFORNIA
Prepared for:
KIMLEY-HORN AND ASSOCIATES, INC.
Submitted by:
AGS, INC.
SEPTEMBER 2006
AGS, Inc., 5 Freelon Street, San Francisco, CA 94107
AGSTABLE OF CONTENTS
SUBJECT PAGE
i
1.0 INTRODUCTION .......... .............. ............................................................................ 1
2.0 EXISTING CONDITIONS ............ ............................................................................ 4
2.1 SURFACE CONDITIONS AND TOPOGRAPHY .............................................. 4
2.1.1 BERKELEY SEGMENT ..................................................................... 5
2.1.2 NORTHERN TELEGRAPH SEGMENT ............................................. 5
2.1.3 SOUTHERN TELEGRAPH SEGMENT ............................................. 6
2.1.4 DOWNTOWN OAKLAND SEGMENT ............................................... 6
2.1.5 LAKE MERRITT SEGMENT .............................................................. 6
2.1.6 NORTHERN INTERNATIONAL BOULEVARD SEGMENT ............... 6
2.1.7 SOUTHERN INTERNATIONAL BOULEVARD SEGMENT ............... 7
2.1.8 BAYFAIR EXTENSION SEGMENT ................................................... 7
2.2 AREAL GEOLOGY .............. ............................................................................ 7
2.2.1 CRETACEOUS AND JURASSIC PERIOD FRANCISCAN
COMPLEX AND ASSOCIATED ROCKS ............................................. 8
2.2.2 QUARTERNARY PERIOD DEPOSITS .............................................. 8
2.2.2.1 ALAMEDA FORMATION .................................................. 9
2.2.2.2 OLDER BAY MUD .......................................................... 10
2.2.2.3 MERRITT SAND MEMBER OF THE
SAN ANTONIO UNIT ....................................................... 10
2.2.2.4 YOUNGER BAY MUD ...................................................... 11
2.2.2.5 TEMESCAL UNIT ............................................................. 11
2.2.2.6 ARTIFICIAL FILL .............................................................. 12
2.3 SUBSURFACE SOIL CONDITIONS .............................................................. 12
2.3.1 BERKELEY - SEGMENT .................................................................... 13
2.3.2 NORTHERN TELEGRAPH SEGMENT .............................................. 14
2.3.3 SOUTHERN TELEGRAPH SEGMENT .............................................. 16
AGSTABLE OF CONTENTS
SUBJECT PAGE
ii
2.3.4 DOWNTOWN OAKLAND SEGMENT ................................................ 17
2.3.5 LAKE MERITT SEGMENT ................................................................. 18
2.3.6 NORTHERN I NTERNATIONAL BOULEVARD SEGMENT ............... 19
2.3.7 SOUTHERN INTERNATIONAL BOULEVARD SEGMENT ................ 20
2.3.8 BAYFAIR EXTENSION SUMMIT........................................................ 21
2.4 GROUNDWATER .............. .......................................................................... 22
2.5 FAULTS AND SEISMICITY . .......................................................................... 23
2.5.1 MAXIMUM CAPABLE EARTHQUAKE ............................................ 25
2.5.2 SEISMIC HAZARDS........................................................................ 26
2.5.2.1 FAULT RUPTURE............................................................ 26
2.5.2.2 GROUND SHAKING ........................................................ 26
2.5.2.3 LIQUEFACTION ............................................................... 26
2.5.2.4 SEISMICALLY INDUCED LANDSLIDES ......................... 27
2.6 OTHER GEOLOGIC HAZARDS..................................................................... 27
2.6.1 EXPANSIVE SOILS......................................................................... 27
2.6.2 SETTLEMENT...... .......................................................................... 28
2.6.3 FOUNDATION CONDITIONS ......................................................... 30
3.0 CLOSURE .............. .............. .......................................................................... 31
4.0 REFERENCES CITED . .............. .......................................................................... 32
AGSTABLE OF CONTENTS
SUBJECT PAGE
iii
TABLES
TABLE 1 HISTORICAL EARTHQUAKES ........................................ 24
TABLE 2 FAULT SEISMICITY ......................................................... 25
PLATES
PLATE 1 PROJECT CORRIDOR MAP
PLATES 2A TO 2D GEOLOGIC MAPS OF THE PROJECT CORRIDOR
PLATE 3 FAULT MAP
AGS
AC Transit BRT Revised 2005 Geologic Assessment 12-2010.doc
1
1.0 INTRODUCTION
AGS, Inc., (AGS) has conducted a Geologic and Geotechnical Impact Assessment for
the AC Transit East Bay BRT DEIS/R (the project) according to guidelines set forth in
the subconsultant agreement between Parsons Transportation Group, Inc., (PTG) and
AGS, dated October 8, 2004. The geologic and geotechnical work will primarily support
the environmental assessment of project impacts. The proposed AC Transit East Bay
BRT project would involve the construction of a bus rapid transit system that would
follow major arterial routes, including Shattuck Avenue, Telegraph Avenue, Broadway,
and East 14th Street, traversing through the cities of Berkeley, Oakland, and San
Leandro, as shown on Plate 1 – Project Corridor Map. Because of the potentially
significant and controversial impacts to traffic and parking, and the possibility of
disproportionately greater impacts in different communities in the corridor, preparation
of an EIS/EIR (or EIS/R) has been recommended as the means to environmentally clear
the proposed project.
The results of the Geologic and Geotechnical Impact Assessment are presented herein
in this report, which includes the following six sections. Section 1.0 gives background
information about the project and outlines the content of this report. Section 2.0 gives
detailed information about the existing conditions along the proposed project corridor.
Sections 2.1 to 2.4 including descriptions of the topography and surface conditions,
geology, subsurface soils and groundwater conditions. Section 2.5 describes the
seismic hazards that would impact the project including distances to faults, and the
types and intensity of effects to be expected during an earthquake. Section 2.6
presents a discussion on other geologic hazards and their mitigations.
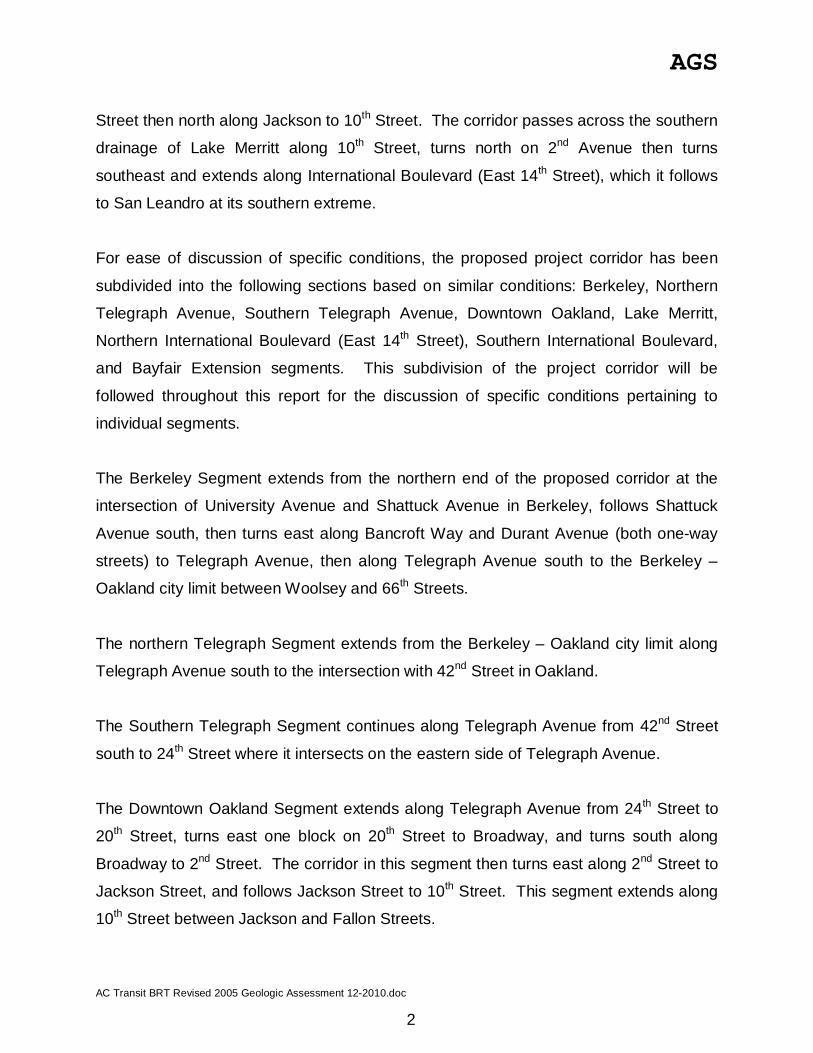
The northern end of the project corridor lies at the intersection of Shattuck and
University Avenue near UC Berkeley. From there the corridor extends south through
Berkeley along Telegraph Avenue toward downtown Oakland then along Broadway
almost to the Bay near Jack London Square. The corridor then turns east along 2nd
AGS
AC Transit BRT Revised 2005 Geologic Assessment 12-2010.doc
2
Street then north along Jackson to 10th Street. The corridor passes across the southern
drainage of Lake Merritt along 10th Street, turns north on 2nd Avenue then turns
southeast and extends along International Boulevard (East 14th Street), which it follows
to San Leandro at its southern extreme.
For ease of discussion of specific conditions, the proposed project corridor has been
subdivided into the following sections based on similar conditions: Berkeley, Northern
Telegraph Avenue, Southern Telegraph Avenue, Downtown Oakland, Lake Merritt,
Northern International Boulevard (East 14th Street), Southern International Boulevard,
and Bayfair Extension segments. This subdivision of the project corridor will be
followed throughout this report for the discussion of specific conditions pertaining to
individual segments.
The Berkeley Segment extends from the northern end of the proposed corridor at the
intersection of University Avenue and Shattuck Avenue in Berkeley, follows Shattuck
Avenue south, then turns east along Bancroft Way and Durant Avenue (both one-way
streets) to Telegraph Avenue, then along Telegraph Avenue south to the Berkeley –
Oakland city limit between Woolsey and 66th Streets.
The northern Telegraph Segment extends from the Berkeley – Oakland city limit along
Telegraph Avenue south to the intersection with 42nd Street in Oakland.
The Southern Telegraph Segment continues along Telegraph Avenue from 42nd Street
south to 24th Street where it intersects on the eastern side of Telegraph Avenue.
The Downtown Oakland Segment extends along Telegraph Avenue from 24th Street to
20th Street, turns east one block on 20th Street to Broadway, and turns south along
Broadway to 2nd Street. The corridor in this segment then turns east along 2nd Street to
Jackson Street, and follows Jackson Street to 10th Street. This segment extends along
10th Street between Jackson and Fallon Streets.
AGS
AC Transit BRT Revised 2005 Geologic Assessment 12-2010.doc
3
The Lake Merritt Segment is the shortest of the eight, extending between Fallon Street
and 2nd Avenue along 10th Street, south of Lake Merritt in the City of Oakland.
The Northern International Boulevard Segment extends between East 10th Street and
International Boulevard (formerly East 14th Street) along 2nd Avenue, then turns
southeast and follows International Boulevard all the way to 98th Avenue.
The Southern International Boulevard Segment continues along International Boulevard
(formerly East 14th Street) southeast to Bristol Boulevard at the Oakland –San Leandro
city limit, continues along East 14th Street (the name of which has been changed to
International Boulevard only in Oakland) to the intersection with Davis Street, then turns
southwest at Davis Street for four blocks then turns southeast onto San Leandro
Boulevard and ends adjacent to the San Leandro BART station at Juana Avenue.
The Bayfair Extension Segment is an additional alternative segment extending the
proposed corridor further southeast along East 14th Street from Davis Street to Bayfair
Drive in San Leandro where the corridor would terminate within the parking area of the
Bayfair Shopping Center.
AGS
AC Transit BRT Revised 2005 Geologic Assessment 12-2010.doc
4
2.0 EXISTING CONDITIONS
The AC Transit East Bay BRT project lies entirely on the Bay Plain, which extends from
the eastern margin of San Francisco Bay to the base of the Oakland-Berkeley Hills in
the north and San Leandro Hills in the south. This plain, along with the greater San
Francisco Bay Area, comprises a portion of coastal California that is known as the
Coast Range Geomorphic Province. The Coast Range Geomorphic Province includes
the northwest trending belt of mountain ranges, valleys and basins that parallel the
California coastline from Point Conception north to the Oregon border. This Province
forms a nearly continuous barrier between the Pacific Ocean to the west and the San
Joaquin Valley to the east. The only significant break occurs in the San Francisco Bay
Area where the Sacramento and San Joaquin Rivers have breached the ranges to flow
into the Pacific.
As part of this Province, the San Francisco Bay is a drowned, northwest-trending
structural depression, bordered on the east by the Oakland-Berkeley Hills. The Bay
Plain lies between these Hills and San Francisco Bay, with the eastern boundary
extending to the Hayward Fault along the western boundary of the Hills.
2.1 SURFACE CONDITIONS AND TOPOGRAPHY
Natural landforms within the Bay Plain have resulted from the interaction of erosion of a
lithologically complex bedrock terrain along the eastern Bay margin and the adjacent
Hills, and deposition of alluvial and marine sediments on the low-lying ground between
the Hills and the Bay, combined with changing sea levels and tectonics related to
ongoing fault movements associated with the San Andreas Fault system. These natural
landforms present along the project corridor generally consist of low-lying undulating
topography, which generally slopes gently toward the south and west, with local
variations in slope caused by the numerous streams draining the hills to the east.
AGS
AC Transit BRT Revised 2005 Geologic Assessment 12-2010.doc
5
The topography along the project corridor is generally gently to moderately sloping
toward the Bay, with elevations ranging from a high of 268 feet in Berkeley to about 8
feet near Jack London Square in Oakland. The project corridor generally lies at an
oblique angle to the direction of local stream drainages, and passes transversely across
the steepest slopes of the surrounding terrain.
These landforms have been modified along the Bay Plain by the grading and placement
of fill materials to varying extent along the entire length of the project during urban
development, and to a larger extent south of Lake Merritt and along the Bay margin to
reclaim usable land from the Bay. The proposed corridor would follow existing paved
streets and parking areas, which are predominantly underlain by varying thicknesses of
artificial fill overlying native materials.
2.1.1 Berkeley Segment
The topography along this segment has the highest elevation but only a small range in
elevation, ranging from 268 feet at the intersection of Telegraph Avenue and Bancroft
Way to 172 feet at the Berkeley – Oakland city limit between Woolsey and 66th Streets.
This change in elevation occurs gradually over a distance of 1.12 miles, resulting in a
moderate to gentle gradient along the corridor. The steepest gradient within this
segment is approximately 3 percent, which occurs along Durant Avenue and Bancroft
Way.
2.1.2 Northern Telegraph Segment
The topography along this segment is characterized by a long gentle slope toward the
southwest ranging from 90 to 172 feet in elevation. The project corridor crosses this
slope at an angle resulting in an average gradient of 1.5 percent along the corridor.
AGS
AC Transit BRT Revised 2005 Geologic Assessment 12-2010.doc
6
2.1.3 Southern Telegraph Segment
This segment ranges in elevation from 90 feet at 42nd Street and Telegraph Avenue to
23 feet on Telegraph Avenue at 24th Street. The average gradient along this segment is
approximately 1.1 percent, continuing along the same gentle slope as the Northern
Telegraph Segment.
2.1.4 Downtown Oakland Segment
The Downtown Oakland Segment ranges in elevation from a high of approximately 42
feet at the intersection of 12th Street and Broadway and slopes gently toward the north,
to about 17 feet at 21st Street and Telegraph, and south to a low of about 8 feet along
2nd Street near Jackson Street. This small range in elevation gives this segment the
characteristic of appearing nearly level with gradients at approximately 0.75 percent
with the exception of the slope at the eastern edge of this segment where it becomes as
steep as 3 percent between Oak and Fallon Streets along 10th Street.
2.1.5 Lake Merritt Segment
The Lake Merritt Segment ranges from about 20 feet at both ends to a low of sea level
at the channel south of Lake Merritt. The roadway across the channel along 10th Street
is at approximately 12 feet in elevation and is nearly level.
2.1.6 Northern International Boulevard Segment
This segment ranges in elevation from a high of about 42 feet along International
Boulevard near 29th Avenue, and a low of 14 feet where the corridor crosses 22nd
Avenue in Oakland. In general, the topography is gently sloping toward the southwest
with the corridor crossing at nearly right angles to the predominant stream drainages.
Most of this segment lies between the elevations of 20 to 30 feet with very gentle
gradients generally less than 0.5 percent.
AGS
AC Transit BRT Revised 2005 Geologic Assessment 12-2010.doc
7
2.1.7 Southern International Boulevard Segment
The Southern International Boulevard Segment ranges from 32 feet in elevation, at 98th
Avenue in Oakland, to 58 feet in elevation, near Davis Street along East 14th Street in
San Leandro. Gradients along this segment range from about 1.5 to 2 percent, with the
corridor following the steepest slopes of the terrain, sloping gently to the northwest,
north of Davis Street, and to the southwest, west along Davis Street and San Leandro
Boulevard.
2.1.8 Bayfair Extension Segment
The Bayfair Extension Segment extends along gently rolling topography sloping to the
southwest on the north side of Blossom Way and toward the south and southeast on the
south side of Blossom Way. The elevation along this segment ranges from a high of
approximately 62 feet at Blossom Way, decreases to 57 feet at the northern end of the
segment at Davis Street, with the lowest elevation at about 30 feet at East 14th Street
and Fairmont Drive adjacent to Bayfair Shopping Center. Gradients along the corridor
in this segment are less than 1 percent.
2.2 AREAL GEOLOGY
The project area is underlain at depth by a melange of late Mesozoic era bedrock of the
Franciscan Complex. Beneath the Bay Plain on the eastern margin of San Francisco
Bay, the Franciscan bedrock is overlain directly by an unconsolidated sedimentary
sequence, which, in places exceeds 400 feet in thickness. In the project area, the
sequence is often subdivided into five units, which are the Alameda, Older Bay Mud
(also Old Bay Clay or Yerba Buena), San Antonio (primarily the Merritt Sand member),
Temescal, and Younger Bay Mud, which have all been deposited during the Quaternary
Period (Goldman, 1969). More recently, Helley and Graymer (1997) have further
subdivided the various surficial sedimentary deposits within the Temescal unit, into
geomorphic and depositional units such as younger and older alluvial fans, stream
AGS
AC Transit BRT Revised 2005 Geologic Assessment 12-2010.doc
8
levees and channels, terrace deposits, and landslide deposits along steeply incised
stream channels. Artificial fill has been placed along the margin of the Bay and within
the southern drainage of Lake Merritt to reclaim marshland once covered by shallow
water. Plates 2A through 2D, Geologic Map of the Project Corridor, show the geology
of the project area.
2.2.1 Cretaceous and Jurassic Period Franciscan Complex and Associated Rocks
Rocks of the Franciscan Complex refer to a group of rocks sharing a common tectonic
history, typically consisting of highly deformed, altered and fractured volcanic,
sedimentary, and metamorphic rocks, and serpentine. Franciscan Complex rocks were
deposited during the late Jurassic and early Cretaceous Periods and range in age from
115 to 165 million years old. Within the project area, the Franciscan rocks are only
found as basement bedrock beneath the Quaternary Period deposits, though these
rocks become very shallow at the northern end of the project area where they are
mapped as outcropping beneath the UC Berkeley campus approximately 500 feet north
and east of the project corridor.
2.2.2 Quaternary Period Deposits
Quaternary Period deposits were all deposited during the last 2 million years, and
represent the surficial deposits overlying bedrock materials. Recent geologic mapping
of Quaternary deposits has shifted terminology away from previously accepted unit
names, which have been used by various authors over the past 100 years (Helley and
Graymer, 1997, Graymer, 2000). These descriptions are based on depositional and
geomorphic features observed from surficial deposits, however, the units as described
in this report are based on soil reports and boring logs where depositional and
geomorphic features are largely inferred. Based on this interpretation, this report will
use the previously accepted terminology of unit names described in subsurface
exploratory borings and correlate these units with the more recent surficial mapping
based on geologic similarities and the unit descriptions.
AGS
AC Transit BRT Revised 2005 Geologic Assessment 12-2010.doc
9
The surficial units covering the project corridor consist of the following (Graymer, 2000):
Af - Artificial fill (Historic)
Qhaf1 - Younger alluvial fan deposits (Holocene)
Qhaf - Alluvial fan and fluvial deposits corresponding to the Temescal unit
(Holocene)
Qhl - Natural levee deposits (Holocene)
Qmt - Marine terrace deposits corresponding to the Alameda unit (Pleistocene)
The surficial and subsurface quaternary period deposits covering the project corridor
are described in the following sections.
2.2.2.1 Alameda Unit
The Alameda unit consists of a thick sequence of marine sediments and alluvial fan
deposits extending from the foot of the Oakland-Berkeley Hills and extending westward
beneath San Francisco Bay. In general, the Alameda unit consists of a lower
continental facies and an upper marine facies, and is underlain by Franciscan Complex
bedrock. The lower continental facies consists of sand and gravel derived from the
underlying Franciscan rocks with interbedded clay deposits. Individual sand and clay
layers range in thickness from about 3 to 60 feet averaging about 10 to 45 feet in
thickness. The sand deposits range from fine to medium-grained sand with increasing
gravel content near the base. The upper marine facies consists of fine to medium-
grained silty sands and lean clays ranging from 40 to 125 feet in thickness. Some
complex interfingering and mixing has occurred locally with the overlying Older Bay
Mud, mostly in the upper layers of this unit.
2.2.2.2 Older Bay Mud
AGS
AC Transit BRT Revised 2005 Geologic Assessment 12-2010.doc
10
Overlying the Alameda unit in places, is a relatively uniform layer of stiff to very stiff clay
seams commonly known as the Older Bay Mud or the Yerba Buena unit. Older Bay
Mud was deposited from approximately 130,000 to 40,000 years before present, and is
thought to be primarily estuarine clay with subordinate alluvial sediments that were
deposited during sea level fluctuations associated with the Sangamon Interglacial
Period (Atwater, et al., 1977). Older Bay Mud unconformably overlies older sediments
and Franciscan bedrock throughout the areas beneath and adjacent to San Francisco
Bay. The thickness and upper surface of the Older Bay Mud are highly irregular, largely
due to erosion. Typically, the Older Bay Mud comprises a light to dark greenish-gray,
stiff to very stiff, moderately to highly plastic clay or silty clay. Layers and lenses of gray
to brown, fine to medium-grained, dense to very dense sand, clayey sand, and gravel
are common throughout the unit. Older Bay Mud is typically overconsolidated, caused
by desiccation that occurred when sea level receded during glacial episodes, and due to
the depth of burial. The upper surface of this unit is often mixed with overlying San
Antonio sediments creating an indistinct boundary.
2.2.2.3 Merritt Sand Member of the San Antonio Unit
The San Antonio unit has a variable composition consisting of interbedded alluvial sand
and fine gravel and marine clay sediments. It is comprised mainly of alternating layers
of silty sand, sandy silt, high plasticity clay and occasional sandy clay of low plasticity.
The sand deposits are generally dense to very dense while the fine-grained silt and clay
layers are typically very stiff to hard. The Merritt Sand member is comprised of well-
sorted (poorly graded) wind-blown sand, deposited from approximately 40,000 years
ago through the present (Atwater, et al., 1977). Though largely associated with the
Wisconsin Period glaciation, it is thought to interfinger laterally with the alluvial fan
deposits of the Temescal unit and the overlying Younger Bay Mud (Graymer, 2000).
Merritt Sand deposits are typically brown to gray, medium dense to very dense, fine-
grained sand and silty sand with occasional lenses or layers of greenish-gray to gray,
stiff to very stiff, moderate to high plasticity clay and sandy clay.
AGS
AC Transit BRT Revised 2005 Geologic Assessment 12-2010.doc
11
2.2.2.4 Younger Bay Mud
Deposition of the Younger Bay Mud has occurred during the Holocene Epoch,
extending from approximately 11,000 years ago to present (Atwater, et al., 1977). The
areal extent of Younger Bay Mud closely follows the shoreline and marshland
boundaries that were present along the eastern margin of San Francisco Bay and
around Lake Merritt prior to reclamation by filling. Younger Bay Mud commonly
underlies areas of artificial fill deposits, especially along the Bay margin. Younger Bay
Mud ranges from 30 to 60 percent clay, 30 to 60 percent silt, and one to 10 percent
sand. Younger Bay Mud is generally olive-green, bluish-gray or black, soft to medium
stiff, saturated, and can contain numerous shell and organic-rich layers. Typically,
Younger Bay Mud exhibits high plasticity, high compressibility, and has very low
permeability.
2.2.2.5 Temescal Unit
The Temescal unit consists of alluvial fan and stream sediments deposited on the Bay
Plain, which were derived from the Oakland-Berkeley Hills to the east over the past
11,000 years. It occurs as alluvial fans and terraces deposited on the underlying San
Antonio deposits and interfingers laterally with the Younger Bay Mud along the
shoreline of San Francisco Bay. The Temescal consists almost entirely of silt and clay
and is generally finer grained than the underlying San Antonio deposits.
2.2.2.6 Artificial Fill
Filling of the Bay and tidal marshlands began in the mid-1800’s, primarily to provide
land for industrial development. Primary sources for fill materials have historically been
dune sands, quarried rock, industrial refuse and building debris. More recently placed
AGS
AC Transit BRT Revised 2005 Geologic Assessment 12-2010.doc
12
fill beneath modern structures and roadways consist of graded select materials, but may
also have incorporated minor amounts of older construction rubble from previous
developments during grading. Artificial fill is believed to exist to varying thicknesses
beneath the entire project as the whole project corridor is along paved roadways and
parking areas within an area with a long history of urbanization. More extensive
deposits of artificial fill are mapped along the margin of Lake Merritt and extending in a
narrow band south of Lake Merritt to the bay.
The composition of artificial fill is highly variable, ranging from gravel to boulder-sized
rubble, in a loose to medium dense matrix of clay, silt, sand and gravel. Occasionally,
areas of high plasticity clays, possibly dredged from the Bay, are encountered in
artificial fills. The engineering properties of artificial fills are highly variable due to the
highly variable composition.
2.3 SUBSURFACE SOIL CONDITIONS
The subsurface soil conditions underlying the proposed project were evaluated by
reviewing available publications and geotechnical soils reports for buildings and
structures along the project corridor. Most of these reports were not performed within
the streets of the project alignment, but located nearby at distances ranging from 10 feet
to 3,000 feet. Some of the locations are relatively far from the project corridor and their
subsurface conditions may vary considerably and thus require more subsurface
investigation at or adjacent to the project area. Plates 2A through 2D, Geologic Map of
the Project Corridor, shows the approximate locations of the subsurface investigations
used for evaluation of the subsurface conditions underlying the project corridor.
2.3.1 Berkeley Segment
The available subsurface information for this segment was derived from 3 reports of
investigations performed for the San Francisco Bay Area Rapid Transit District (BART)
AGS
AC Transit BRT Revised 2005 Geologic Assessment 12-2010.doc
13
for the Downtown Berkeley Station and tunnel (Dames and Moore, 1963), an elevated
version of the Ashby Station (Hawke Engineers, 1964) and an underground version of
the Ashby Station beneath Adeline Street, the tunnel beneath Adeline, and associated
parking areas (Woodward, Clyde, Sherard, 1967).
The portion of the Dames and Moore investigation (1963) coinciding with the proposed
project corridor includes logs of 13 borings indicating the presence of approximately 2 to
5 feet of compacted sandy or gravelly fill beneath the pavement along Shattuck Avenue
prior to the construction of the BART tunnel. This fill is underlain by 6 to 28 feet of
medium stiff to stiff, sandy and silty clay of the Temescal unit with occasional medium
dense to dense clayey sand and clayey gravel lenses of 4 to 11 feet in thickness. At the
time, these sandy and gravelly layers were found to be typically water bearing and
under positive hydraulic head. Boring logs along Shattuck Avenue between University
Avenue and Allston Way indicate the presence of weathered Franciscan bedrock at a
depth of between 30 and 40 feet. The remainder of the borings for this report did not
encounter bedrock with the deepest boring extending to 135 feet below the surface.
These borings were all located in or near Shattuck Avenue and extended south along
Shattuck to Carleton Street.
Hawke Engineers (1964) report subsurface conditions of up to 2 feet of pavement and
aggregate base rock, underlain by 30 to 45 feet of stiff to very stiff silty clay with varying
amounts of sand and rock fragments and occasional thin, dense clayey sand and clayey
gravel layers. Below the silty clay are reported dense to very dense layers of clayey
sand and clayey gravel with occasional layers of silty to sandy clay to the bottom of the
borings from 74 to 85 feet in depth. This investigation encompassed six borings along
Adeline Street between Prince and Russell Streets. These borings are located between
2,300 and 2,860 feet west of the project corridor.
The Woodward-Clyde-Sherard (1967) investigation consisted of 21 borings, 7 within
Adeline Street to depths ranging from 51.5 to 72 feet, and 14 shallow borings spaced
around the parking areas all drilled to about 15 feet. The logs of these borings indicate
AGS
AC Transit BRT Revised 2005 Geologic Assessment 12-2010.doc
14
the presence of between 1 and 4.5 feet of pavement and silty clay fill materials beneath
Adeline Street, overlying stiff to very stiff, silty to sandy clay layers with varying amounts
of sand and gravel, and occasional clayey sand or clayey gravel layers to a depth of
about 30 to 40 feet. Underlying the silty clay is a section of sandy gravel and gravelly
sand with varying amounts of silt and clay. This coarse-grained layer is medium dense
to very dense, wet, and ranges from 5 feet to 32 feet in thickness. Below this coarse
layer is another layer of silty or sandy clay to the bottom of exploration. The borings for
this report are all located between 2,300 and 3,100 feet west of the proposed project
corridor.
The entire length of the proposed project corridor in the Berkeley Segment is mapped at
the surface as Holocene alluvial fan deposits by Helley and Graymer (1997)
corresponding to the Temescal unit.
2.3.2 Northern Telegraph Segment
The available subsurface information for this segment was derived from four soils
investigations, all within one block of the project corridor. These investigations were
performed for the construction of a two-story dwelling at North Street and Telegraph
Avenue (Alexander Buller Associates, 1985), the closure of a service station at the
intersection of 51st and 52nd Streets (Tong and Chang, 1996), a shopping center
development between 49th and 51st Streets on the west side of Telegraph Avenue
(Harza, 1995), and for the construction of two houses on a property at 49th Street and
Shattuck Avenue (Bay Soils, 1986) one block west of Telegraph Avenue.
The report by Alexander Buller Associates (1985) describes 3 shallow borings between
8 and 12 feet in depth which indicate four feet of loose to medium dense silty sand and
medium stiff sandy clay fill, overlying two to four feet of medium stiff sandy clay, which
grades downward into a medium dense clayey sand and gravelly sand, with another
layer of medium stiff sandy clay at the bottom of the deepest boring.
AGS
AC Transit BRT Revised 2005 Geologic Assessment 12-2010.doc
15
The site closure investigation performed by Tong and Chang (1996) includes the logs
for 6 borings all to a depth of 21.5 feet. The borings indicate the presence of between 4
and 16 feet of loose to medium dense sandy silt with fine gravel and debris, some of
which is described as fill, overlying 9 to 13 feet of medium dense to dense sand with
varying amounts of gravel, silt or clay.
The site development report by Harza (1995) includes the logs for 3 borings and 3
probes, and reviews the logs of 6 previous borings by Harza and 42 previous borings
performed by others, as well as 2 previous probes by Harza and 4 previous probes by
others. The majority of the borings seem to have been drilled to identify the course of a
buried stream channel, which previously flowed through the property. The 3 borings for
the current investigation indicate the presence of “stiff clayey fill to a depth of about 5
feet overlying very stiff clay and dense sand” to 16.5 feet in the first boring, and “stiff to
very stiff clay with layers of dense, coarse- to fine-grained sand” to a depth of 19.5 feet
in the other two borings. The more clayey soils are described as having a moderate to
high expansion potential, and these borings indicate the same conditions as previous
borings at the site.
The Bay Soils report (1986) was primarily intended to provide the subsurface location of
two buried stream culverts extending across the property, and to provide foundation
recommendations for placement of two pre-fabricated buildings. Of the 18 borings
logged, those borings which do not terminate at one of the culverts indicate from 8 to 17
feet of medium stiff to stiff silty clay fill overlying 3 to 15 feet of medium stiff to very stiff
silty clay with varying amounts of fine gravel and rock fragments. This silty clay is
underlain by up to 6 feet of very stiff to hard gravelly clay with some sand.
The entire length of the proposed project corridor in the Northern Telegraph Segment is
mapped at the surface as Holocene alluvial fan deposits by Helley and Graymer (1997)
corresponding to the Temescal unit.
2.3.3 Southern Telegraph Segment
AGS
AC Transit BRT Revised 2005 Geologic Assessment 12-2010.doc
16
The available subsurface information for this segment was derived from six soils
investigations ranging from one to five blocks from the project corridor. These
investigations were performed for the construction of an apartment building at 373 40th
Street at Opal Street (Treadwell and Rollo, 2002), a residential building at 440 38th
Street at Ruby Street (Treadwell and Rollo, 2000), planned additions to a church at 408
West MacArthur Boulevard at Ruby Street (Geotechnical Engineering Inc., 1995),
installation of a new radio antenna at CHP Headquarters on Telegraph Avenue at 37th
Street (Tong and Chang, 1997), a soils report for a new building at Merritt Hospital
between 34th Street and Hawthorne Avenue west of Webster Street (Peter Kaldveer and
Associates, 1979), and a soils report for a housing project at Martin Luther King, Jr.
Way and 32nd Street (MWH, 2001).
The available boring logs along this segment indicate the presence of 1 to 10 feet of fill
of varying composition and consistency. Beneath the surficial fill is found 3 to 14 feet of
stiff to very stiff clay and sandy or silty clay of the Temescal unit. These fine-grained
deposits typically have occasional thin layers of clayey sand or gravel, and silt or silty
sand. These granular layers are typically medium dense to dense, wet, and range in
thickness from 6 inches to 3 feet. Underlying these clayey layers of the Temescal unit
are sandy or silty clay deposits of the San Antonio unit. These deposits are typically
stiff to hard, and are found at shallow depth of only 3 to 10 feet in the vicinity of the
project corridor between 30th and 24th Streets. Deposits within the San Antonio unit also
have occasional silty or clayey sand layers with some gravel. These granular layers are
typically dense, range in thickness from 2 to 12 feet, and are potentially water bearing.
2.3.4 Downtown Oakland Segment
The available subsurface information for the Downtown Oakland Segment was obtained
from 10 reports investigating 8 locations either along Broadway or within 3 blocks of the
project corridor. These investigations include a report of two test pits excavated for
BART construction, one at Broadway and 17th Street along the project corridor and the
AGS
AC Transit BRT Revised 2005 Geologic Assessment 12-2010.doc
17
other near Washington and 5th Streets one block west of the project corridor
(Woodward-Clyde-Sherard, 1964), the soil investigation for a planned hotel on the east
side of Broadway between 11th and 12th Streets (PG Soils, 1998), two investigations for
the planned construction of a high-rise building on the west side of Broadway between
11th and 12th Streets (Woodward-Clyde, 1988; Dames and Moore, 1992), an
environmental study and a follow-up soils investigation for a high-rise development for
Pacific Renaissance Plaza located between 9th and 11th Streets and between Franklin
and Webster Streets one block east of the project corridor (HLA, 1988; Kaldveer and
Associates, 1989), two reports for a planned hotel at Broadway and 8th Street
(Geotechnical Engineering Inc., 1990; Hallenbeck and Associates, 1991), and two soil
investigations for the design of BART for the West Oakland line along 4th Street
between Washington Street and Martin Luther King, Jr. Way (Bechtel, 1965a) and the
Alameda line along 8th and 9th Streets between Webster and Fallon Streets (Dames and
Moore, 1963).
The surface mapping along this segment identifies the surficial deposits as belonging to
the Merritt Sand member beneath the entire Segment with the exception of a small area
between 24th and 22nd Streets along Telegraph Avenue, which is mapped as marine
terrace deposits and are here interpreted as corresponding with part of the Alameda
unit. No subsurface information was reviewed from the area mapped as marine terrace
deposits.
Borings along the corridor within downtown Oakland indicate the presence of between 2
and 12 feet of fill consisting of loose to medium dense silty or clayey sand with various
amounts of gravel or building rubble, or stiff silty or sandy clay. Underlying this surficial
fill is found between 7 and 38 feet of sand with varying amounts of fine-grained binder of
silt or clay, identified as part of the Merritt Sand member. These deposits are typically
fine- to medium-grained sand, medium dense to very dense, and are water bearing.
Beneath these sand deposits are found 5 to 38 feet of sandy or silty clay with
occasional dense coarse sand and gravel lenses. These clay deposits are identified as
AGS
AC Transit BRT Revised 2005 Geologic Assessment 12-2010.doc
18
part of the San Antonio unit, and are described as typically stiff to hard, and may contain
shell layers.
2.3.5 Lake Merritt Segment
The subsurface information for this segment was derived from a soil investigation report
for the design of BART for the Alameda line following the alignment of 8th Street
between Fallon Street and 5th Avenue (Dames and Moore, 1963). These borings are
between 480 and 780 feet south of the project corridor through this segment.
The boring logs for this segment indicate the presence of 10 to 20 feet of artificial fill
overlying 15 to 50 feet of younger bay mud. The artificial fill is described as being loose
sand, silty sand or clayey sand with varying amounts and pockets of gravel, rock
fragments, brick fragments, glass and decaying wood and vegetation. The fill layer is
variable in composition but fairly consistent in thickness across this segment. The
underlying Younger Bay Mud layer is thickest beneath the Lake Merritt Channel along
the eastern end of the segment, and tapers abruptly to the east and more gradually to
the west. This layer is described as being very soft to soft, high plasticity silty clay with
decaying vegetation and occasional thin sandy, gravelly or shell-rich layers. The
Younger Bay Mud on the western edge of this segment is underlain by 3 to 12 feet of
clayey sand or sandy clay of the Merritt Sand member. Underlying the Younger Bay
Mud beneath the central portion of the segment is a 10 to 25 foot thick layer of dense
silty sand with occasional gravel and shells of the Alameda unit. On the eastern edge of
the segment, the Younger Bay Mud is deposited on an 8 to 20 foot thick wedge of
dense sand or stiff to very stiff silty clay of the Temescal unit. This wedge is mapped at
the surface as a marine terrace deposit (Helley and Graymer, 1997).
2.3.6 Northern International Boulevard Segment
The subsurface information reviewed for this segment of the Project corridor is from 6
reports, 5 of which are investigations associated with the BART system. These reports

AGS
AC Transit BRT Revised 2005 Geologic Assessment 12-2010.doc
19
are for soils investigations of the Alameda line of BART through downtown Oakland
extending from the edge of the Lake Merritt Channel to the southern end of 7th Avenue
between East 7th and 8th Streets (Dames and Moore, 1963), extend along the Alameda
line from the intersection of East 8th Street and 8th Avenue following East 8th Street and
East 12th Street to 37th Avenue (Bechtel, 1965a) just southeast of Fruitvale Station,
include 2 reports of investigations performed for the proposed expansion of BART
facilities at Fruitvale Station including a multi-story parking structure between 35th and
36th Avenues (Harlan Tait, 1991) and a planned transit village within the boundary of the
existing BART parking areas southwest of East 12th Street between 32nd and 36th
Avenues (Parikh Consultants, 1997), then continue along the Alameda line from 37th
Avenue along San Leandro Street to 55th Avenue (Bechtel, 1965b). The other study
was performed for a school expansion on East 17th Street at Fruitvale Avenue (AGS,
2005) four blocks northeast of the project corridor.
The available boring logs for this segment indicate this section of the Bay Plain to
consist of a thin layer of artificial fill ranging from 0 to 10 feet in thickness composed of
various combinations of clay, silt, sand, gravel and construction debris of brick, asphalt,
concrete and wood fragments. Beneath the surficial fill, is found alternating layers of
alluvial deposits of the Temescal unit. These layers typically consist of medium stiff to
very stiff fine-grained deposits of clay, silty or sandy clay, and clayey silt, alternating
with medium dense to very dense layers of clayey sand, silty sand, and sandy gravel of
varying thickness. Generally, the individual layers of these deposits are thicker toward
the northern end of the corridor and become thinner and more variable toward the
southeast.
A thin layer of Younger Bay Mud was identified beneath the surficial fill from a boring log
along a former stream channel underlying the project corridor in the vicinity of 14th
Avenue (Bechtel, 1965a). Artificial fill is mapped along the surface within this stream
channel crossing the project corridor.
AGS
AC Transit BRT Revised 2005 Geologic Assessment 12-2010.doc
20
The boring logs from the BART studies extend from 16.5 feet to 108 feet in depth and
range from 440 feet to 950 feet from the project corridor.
2.3.7 Southern International Boulevard Segment
The subsurface information for this segment was derived from a soil investigation report
for the design of BART for the Alameda line extending along San Leandro Boulevard
from Apricot Street at the San Leandro city limit to the southern end of the San Leandro
BART station at Juana Avenue (Bechtel, 1965c), from a soil investigation for a bank
parking structure on East 14th Street between Callan and Estudillo Avenues, just east of
the intersection of Davis and East 14th Streets (Engeo, 1972), and a soils report for a
condominium complex along the project corridor at the intersection of Davis and
Carpentier Streets (Alan Kropp and Associates, 1992).
The boring logs reviewed for this segment indicate an artificial fill layer ranging from 2 to
10 feet in thickness existing at the surface along the entire corridor. The artificial fill
layer is underlain by a widespread layer of stiff to very stiff silty to sandy clay ranging
from 8 to 26 feet in thickness. Underlying the clay layer is typically a 15 to 25 foot thick
medium dense to dense silty sand layer with varying amounts of gravel and scattered
thin clean sand and gravel layers.
In the vicinity of San Leandro Creek, along Davis Street and San Leandro Boulevard,
the surficial fill layer is about 8 feet thick, overlying a thin surficial sandy layer ranging
from 2 to 10 feet thick. Within approximately 400 to 500 feet on either side of San
Leandro Creek, there exists a narrow zone of high plasticity clay ranging from 1 to 7 feet
thick at a depth of 20 to 24 feet, which appears to be a buried marsh deposit (Bechtel,
1965c).
The surface geologic units are mapped as either Holocene alluvial fan deposits or levee
deposits from an abandoned channel of San Leandro Creek near the surface beneath
the project corridor between 100th Avenue and Davis Street. These surface deposits fit
AGS
AC Transit BRT Revised 2005 Geologic Assessment 12-2010.doc
21
within the depositional modes described for the Temescal unit. The coarser-grained
sandy layers found beneath the surficial clay layers may represent the underlying San
Antonio unit.
The logs of borings reviewed for this segment from the BART study range from 200 feet
to 2,530 feet from the project corridor. The borings from the other soils reports were
within 300 feet of the corridor.
2.3.8 Bayfair Extension Segment
The subsurface information for this segment was derived from a soil investigation report
for the design of BART for the Alameda line extending southeast from the San Leandro
Station following the Union Pacific Railroad line to the middle of the Bayfair Bart Station
(Bechtel, 1965c), an investigation for a residential housing tract south of Halcyon Drive
adjacent to the Union Pacific Railroad line (United Soils Engineering, 1977), the bank
parking structure from the previous segment located at East 14th Street and Callan
Avenue (Engeo, 1972), and a report for the Bayfair Cineplex Theater on the south side
of Bayfair Shopping Center (Kleinfelder, 1999).
The boring logs reviewed for the Bayfair Extension segment indicate a thin layer of
artificial fill ranging from 1 to 6 feet in thickness along the entire project corridor.
Underlying the artificial fill layer is a stiff to very stiff sandy clay ranging from 8 to 50 feet
in thickness with occasional medium dense to dense, clayey to silty sand layers with
various amounts of gravel ranging from 2 to 8 feet thick. Beneath the fine-grained layer
lie alternating layers of medium dense to very dense silty sand and stiff sandy clay
ranging from 4 to 20 feet in thickness.
Southeast of about 139th Avenue, the boring logs indicate the presence of a nearly
continuous layer of stiff high plasticity clay of 4 to 12 foot thickness at a depth ranging
from 12 to 35 feet below the surface (Bechtel, 1965c). This clay layer ranges in color
from brown to grayish-black with black speckling in some places and white speckling in
AGS
AC Transit BRT Revised 2005 Geologic Assessment 12-2010.doc
22
others. This clay may represent a deposit from a formerly extensive marsh or salt
marsh environment.
The subsurface borings reviewed for this segment from the BART investigation
extended between 59 and 103.2 feet in depth and ranged between 1,650 and 1,980 feet
southwest of the project alternative corridor. The boring logs from the other soils
investigations ranged in depth from 26 to 51.5 feet in depth and were located within 300
feet of the alternative project corridor. The report for the housing tract southwest of the
BART line did not include a boring location map (United Soils Engineering, 1977).
2.4 GROUNDWATER
According to the California Regional Water Quality Control Board, East Bay Plain
Groundwater Basin Report, 1999, the project corridor is located in three distinctive sub-
area hydrologic basins. These sub-area basins are known as the Berkeley, Oakland,
San Lorenzo and San Leandro sub-areas.
Most of the investigations reviewed reported the depth to groundwater and describe the
groundwater encountered as being restricted to coarse-grained layers within finer
grained materials within the Temescal and San Antonio units. The groundwater in
these units is described as being shallow, confined or partially confined and exhibiting
slightly elevated piezometric conditions. Groundwater levels reported are only
representative of the conditions at the time of drilling and are expected to vary both
seasonally and annually based on regional rainfall, local conditions, and localized
pumping. Initial groundwater levels ranged from depths of 4 to 30 feet, with an average
depth to water at about 8 to 11 feet. Long-term static measurements, as a rule, were
not reported in the available geotechnical reports and significant quantities of water
were only found within the two test pits dug for BART (Woodward-Clyde-Sherard, 1964)
within the Merritt Sand.
AGS
AC Transit BRT Revised 2005 Geologic Assessment 12-2010.doc
23
None of the surficial geologic units along the project corridor are considered aquifers
containing useful amounts of water, primarily due to the poor quality of the water found
in these deposits, with high levels of undesirable minerals, and the small amounts of
water that the thin shallow sandy layers would produce. Two of the studies reviewed
reported the presence of contaminants in any borings, and only one tested water
samples for contaminants and provided the results (Tong and Chang, 1996; HLA, 1988,
respectively).
2.5 FAULTS AND SEISMICITY
The project corridor is located in a seismically active region, which has been subjected
to several strong earthquakes during historic time. No active faults are known to cross
the project corridor.
The Hayward Fault lies between 0.4 and 4.3 miles (0.64 and 7.0 kilometers) northeast
of the project corridor, closest at both the northern and southern ends, and dominates
the seismic hazard due to its proximity. A map showing the relationship between the
Hayward Fault and the project corridor is included as Plate 3, Fault Map. The other
major active faults, which could cause significant shaking of the project area, are the
San Andreas, Concord, Calaveras, Rodgers Creek, and San Gregorio Faults. Active
faults that may affect the project area and historic earthquakes attributed to each fault
are listed in Table 1, Historic Earthquakes.
AGS
AC Transit BRT Revised 2005 Geologic Assessment 12-2010.doc
24
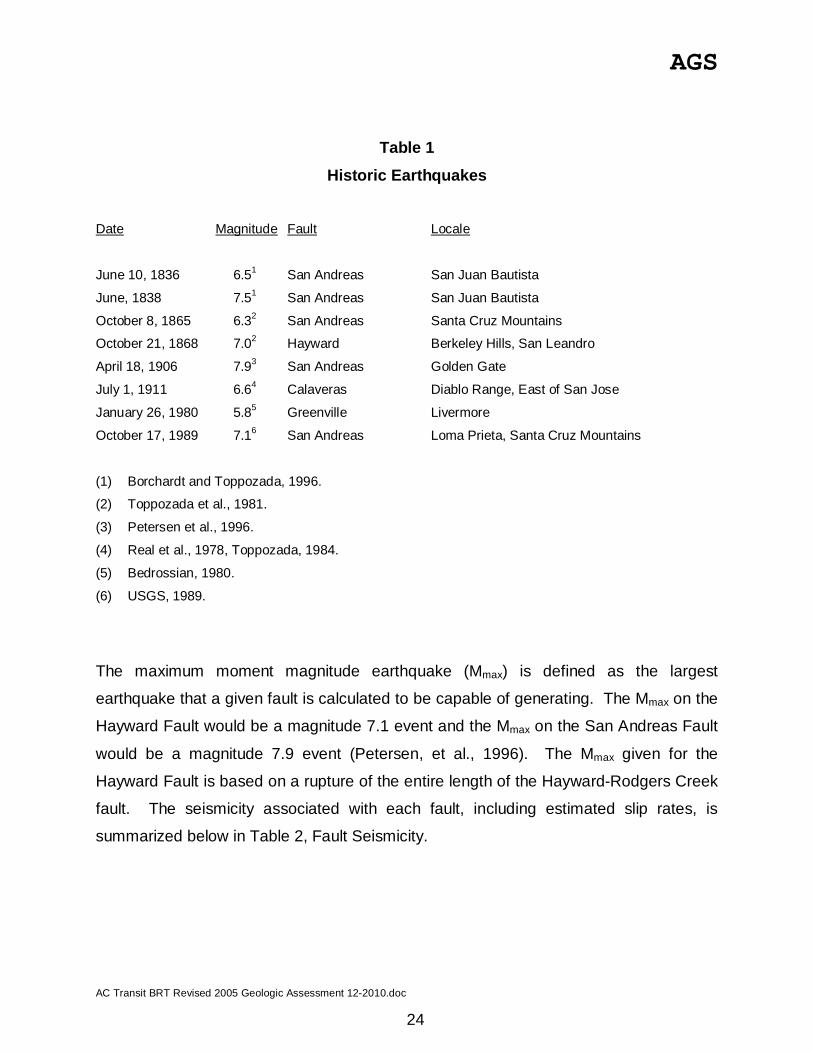
Table 1Historic Earthquakes
Date Magnitude Fault Locale
June 10, 1836 6.51 San Andreas San Juan Bautista
June, 1838 7.51 San Andreas San Juan Bautista
October 8, 1865 6.32 San Andreas Santa Cruz Mountains
October 21, 1868 7.02 Hayward Berkeley Hills, San Leandro
April 18, 1906 7.93 San Andreas Golden Gate
July 1, 1911 6.64 Calaveras Diablo Range, East of San Jose
January 26, 1980 5.85 Greenville Livermore
October 17, 1989 7.16 San Andreas Loma Prieta, Santa Cruz Mountains
(1) Borchardt and Toppozada, 1996.
(2) Toppozada et al., 1981.
(3) Petersen et al., 1996.
(4) Real et al., 1978, Toppozada, 1984.
(5) Bedrossian, 1980.
(6) USGS, 1989.
The maximum moment magnitude earthquake (Mmax) is defined as the largest
earthquake that a given fault is calculated to be capable of generating. The Mmax on the
Hayward Fault would be a magnitude 7.1 event and the Mmax on the San Andreas Fault
would be a magnitude 7.9 event (Petersen, et al., 1996). The Mmax given for the
Hayward Fault is based on a rupture of the entire length of the Hayward-Rodgers Creek
fault. The seismicity associated with each fault, including estimated slip rates, is
summarized below in Table 2, Fault Seismicity.
AGS
AC Transit BRT Revised 2005 Geologic Assessment 12-2010.doc
25
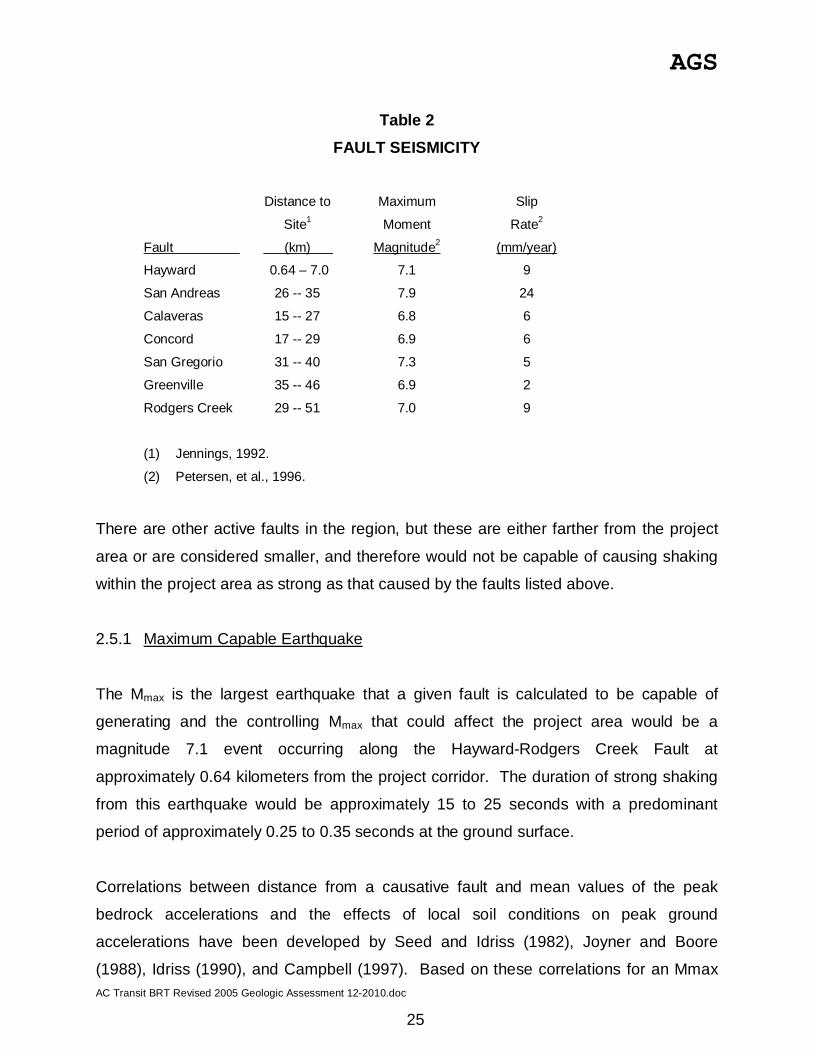
Table 2FAULT SEISMICITY
Distance to Maximum Slip
Site1 Moment Rate2
Fault (km) Magnitude2 (mm/year)
Hayward 0.64 – 7.0 7.1 9
San Andreas 26 -- 35 7.9 24
Calaveras 15 -- 27 6.8 6
Concord 17 -- 29 6.9 6
San Gregorio 31 -- 40 7.3 5
Greenville 35 -- 46 6.9 2
Rodgers Creek 29 -- 51 7.0 9
(1) Jennings, 1992.
(2) Petersen, et al., 1996.
There are other active faults in the region, but these are either farther from the project
area or are considered smaller, and therefore would not be capable of causing shaking
within the project area as strong as that caused by the faults listed above.
2.5.1 Maximum Capable Earthquake
The Mmax is the largest earthquake that a given fault is calculated to be capable of
generating and the controlling Mmax that could affect the project area would be a
magnitude 7.1 event occurring along the Hayward-Rodgers Creek Fault at
approximately 0.64 kilometers from the project corridor. The duration of strong shaking
from this earthquake would be approximately 15 to 25 seconds with a predominant
period of approximately 0.25 to 0.35 seconds at the ground surface.
Correlations between distance from a causative fault and mean values of the peak
bedrock accelerations and the effects of local soil conditions on peak ground
accelerations have been developed by Seed and Idriss (1982), Joyner and Boore
(1988), Idriss (1990), and Campbell (1997). Based on these correlations for an Mmax
AGS
AC Transit BRT Revised 2005 Geologic Assessment 12-2010.doc
26
7.1 event occurring on the Hayward Fault, the mean peak ground surface acceleration
within the project area is computed to range from 0.50 to 0.60 g.
2.5.2 Seismic Hazards
2.5.2.1 Fault Rupture
There is no evidence indicating that the project area is located on identified active faults.
Therefore, damage due to surface fault rupture within the project area is considered
unlikely.
2.5.2.2 Ground Shaking
The San Francisco Bay Area is expected to experience very strong to violent ground
shaking during large earthquakes occurring on any of the major active faults. The
severity of ground shaking is influenced by a number of factors, including the duration
and intensity of the earthquake, the proximity of the project site to the location of the
earthquake, and the type of geologic materials underlying the site.
The mean peak ground acceleration for the controlling maximum capable earthquake
along the project corridor is computed to range from 0.50 to 0.60 g, as presented in
Section 2.4.1. For other levels of earthquake shaking, the peak ground surface
accelerations would be lower.
2.5.2.3 Liquefaction
Soil liquefaction is a phenomenon in which saturated, cohesionless soils lose their
strength due to the build-up of excess pore water pressure, especially during cyclic
loadings (shaking) such as those induced by earthquakes. In the process, the soil
acquires mobility sufficient to permit both horizontal and vertical movements if not
confined. Soils most susceptible to liquefaction are loose, clean, uniformly graded, fine-
AGS
AC Transit BRT Revised 2005 Geologic Assessment 12-2010.doc
27
grained sands. Gravels and coarse-grained sands are also susceptible to liquefaction,
as are saturated silty and clayey sands.
The consequences of liquefaction could easily include seismically-induced settlements,
additional lateral loads on piles, downdrag forces on pile foundations, localized lateral
deformation of fills, and flotation (buoyancy) of underground structures (i.e., tanks,
pipelines and manholes) underlain by the potentially liquefiable soils.
The Northern Telegraph Segment of the project corridor should be considered in
liquefaction investigations, since it contains a layer of loose to medium dense silty sand
approximately 4 feet thick. In addition, the project corridor south of Lake Merritt and the
portion of International Boulevard at 13th Avenue underlain by artificial fill are considered
to have a high susceptibility to liquefaction. All other portions of the project corridor are
considered to have low to moderate susceptibility to liquefaction due to the density of
the granular materials or the presence of stiff cohesive soils.
2.5.2.4 Seismically Induced Landslides
Because the project corridor is located in a relatively flat area, the seismically-induced
landslide potential is considered to be relatively low.
2.6 OTHER GEOLOGIC HAZARDS
2.6.1 Expansive Soils
Review of the available geological data indicates that the majority of the uppermost
materials along the project alignment are the Temescal unit, which predominantly
comprises clayey and silty mixtures with some sand. The localized clayey soils within
the project study area are likely to be moderately expansive. Expansive soils may
cause differential settlement, cracking, and deterioration of roadway pavements.
AGS
AC Transit BRT Revised 2005 Geologic Assessment 12-2010.doc
28
Mitigation
(i) Replace with Non-Expansive Soils. Expansive soils can be excavated and
replaced with non-expansive materials. This alternative may be appropriate where
proposed finished grades do not allow for enough cover over native expansive
materials. The required depth of overexcavation should be such that the minimum
cover requirements discussed in Item (iii) are achieved.
(ii) Treat Expansive Soils. Expansive soils may be treated in place by mixing them
with lime. Lime-treatment alters the chemical composition of the expansive clay
minerals such that the soil becomes non-expansive and also significantly increases the
R-value. This mitigation method, however, can be quite costly if large areas are
involved. Lime-treatment may also be used where proposed grades do not allow for
adequate cover over expansive pavement subgrade materials.
(iii) Provide Cover to Resist Expansion. This alternative is intended to balance the
potential subgrade expansion pressures with adequate downward pressure from the
pavement section. Based on our experience with similar soil conditions, we estimate
that the required cover thickness may range from 2 to 3 feet.
2.6.2 Settlement
Settlement may result in damage to structures, cracking of asphalt pavements, the
trapping of water from rain, and the deterioration of roadway pavements. Fills, which
may be placed on Bay Mud soils along the project alignment, may settle as a result of
consolidation. However, based on available geologic data, except for Bay Mud the
other soils do not appear to be very compressible. Therefore, anticipated settlement of
the proposed fills in such areas outside Bay Mud areas should not be a major impact.
Site-specific geotechnical data should be obtained to evaluate the compressibility of
subsurface soils encountered along the project alignment, where significant
embankment fills are proposed. Appropriate mitigative measures developed based on
AGS
AC Transit BRT Revised 2005 Geologic Assessment 12-2010.doc
29
the results of site-specific studies should be used to reduce damage due to potential
settlement.
Mitigation
The choice of mitigation method often involves non-geotechnical issues as well as cost
and time implications. Below is a discussion of alternative settlement mitigation
measures.
(i) Avoidance. Avoidance of potential settlement can be achieved by spanning the
area with the settlement problem. Spanning structures should be supported on deep
foundations extending below the compressible soils. Design of deep foundations must
take into consideration downdrag loads induced by consolidation due to the weight of
adjacent fills.
(ii) Removal of Compressible Soils. This method involves removal of the
compressible soils either by excavation and recompaction, or by displacement.
Because excavation and backfilling become relatively costly with increased depth of
compressible soil, the feasibility of excavation and recompaction is limited by the
thickness and extent of the compressible soils.
(iii) Reduction of Anticipated Settlement. This can be achieved by lowering the
proposed grades or by using lightweight fill materials, thus reducing the load on the
compressible soils. The effectiveness of lowering proposed grades is limited because
non-geotechnical issues dictate the range of possible grades that can be designed for
the alternate project alignments.
Use of lightweight fill can substantially reduce anticipated settlement and can be useful
where anticipated settlements are relatively low. The effectiveness of lightweight fill is
limited where anticipated settlements are significant.
AGS
AC Transit BRT Revised 2005 Geologic Assessment 12-2010.doc
30
(iv) Hastening the Settlement Process. Hastening anticipated settlements can be
accomplished with the use of drains and surcharges. The purpose of drains is to
decrease the consolidation time of compressible clayey soils by providing shorter paths
for the pore water pressure to dissipate from the soils.
A surcharge load can also be used to increase the amount of initial settlement, thereby
hastening the settlement process. This method involves placing additional fill and
incorporating a settlement period in the construction schedule. Prior to final grading, the
surcharge load is removed and the roadway is constructed.
A combination of surcharging and installing drains can be used to more effectively
hasten the settlement process and reduce the long term, post-construction settlement.
2.6.3 Foundation Conditions
Foundation soil conditions along the alternate project alignments could affect the
stability of the proposed structure fills. Based on our review of available data the
majority of soils along the proposed alignment are suitable for support of light
structures. Fill and Bay Mud soils are not suitable for support of foundations. Presence
of Bay Mud may result in bearing capacity failure.
Mitigation
A deep foundation alternative may be required on fill and Bay Mud area. Details of
deep foundation alternatives should be developed based on the site-specific
geotechnical data.
AGS
AC Transit BRT Revised 2005 Geologic Assessment 12-2010.doc
31
3. CLOSURE
This report has been prepared for the exclusive use of Parsons Transportation Group,
Inc. and its consultants for the specific application to the AC Transit East Bay BRT
DEIS/R in Alameda County, California. The report is prepared in accordance with
generally accepted professional geotechnical engineering practice. No other warranty,
express or implied, is made.
The analyses and recommendations submitted in this report are based upon available
data obtained from borings drilled by others and the geologic reports in the site vicinity.
No site-specific subsurface data were obtained for this study. The conclusions and
recommendations presented in this report are preliminary and should be further verified
by site-specific final geotechnical studies. If changed conditions are encountered in the
final geotechnical studies, it will be necessary to reevaluate the recommendations of
this report.
Respectfully submitted,AGS, Inc.
Bahram Khamenehpour, Ph.D.Geotechnical Engineer #2104
AGS
AC Transit BRT Revised 2005 Geologic Assessment 12-2010.doc
32
4.0 REFERENCES CITED
ABAG EQ Map, 2003, Earthquake Hazard Maps for Berkeley/Albany, NorthOakland/Piedmont/Emeryville, East Oakland, and San Leandro; InteractiveWebsite Scenarios: Rodgers Creek + North Hayward Segments, North Hayward+ South Hayward Segments, and South Hayward Segment of the Hayward-Rodgers Creek Fault System; website URL: http://www.abag.ca.gov/cgi-bin/pickmapx.pl
Alan Kropp & Associates, 1992, Geotechnical Investigation for ResidentialDevelopment, Davis and Carpentier Streets, San Leandro, California.
Alexander Buller Associates, Inc., 1985, Geotechnical Investigation for Two-StoryCommercial Building, 6339 Telegraph Avenue, Oakland, California; June, 1985.
Atwater, B. F., Hedel, C. W., and Helley, E. J., 1977, Late Quaternary DepositionalHistory, Holocene Sea-Level Changes, and Vertical Crustal Movement, SouthernSan Francisco Bay, California; USGS Professional Paper 1014.
Bay Soils, Inc., 1986, Foundation Recommendations for Two Dwellings, 4915 and 4921Shattuck Avenue, Oakland, California; for Insulation Works, June, 1986.
Bechtel Corporation, 1965a, Soil Investigation, A704, Segment A-001, SouthernAlameda County Line; for San Francisco Bay Area Rapid Transit System,December, 1965.
Bechtel Corporation, 1965b, Soil Investigation, A704, Segment A-002, SouthernAlameda County Line; for San Francisco Bay Area Rapid Transit System,December, 1965.
Bechtel Corporation, 1965c, Soil Investigation, A704, Segment A-004, SouthernAlameda County Line; for San Francisco Bay Area Rapid Transit System,December, 1965.
Bechtel Corporation, 1966, Soil Investigation, K702, Segment K-002, West OaklandLine; for San Francisco Bay Area Rapid Transit System, March, 1966.
Bedrossian, T. L., 1980, The Livermore earthquake of January 1980, Contra Costa andAlameda Counties, California, California Geology, vol.
Borchardt, G., and Toppozada, T. R., 1996, Relocation of the “1836 Hayward FaultEarthquake” to the San Andreas Fault; Transactions of the AmericanGeophysical Union, v. 77, n. 46 (supplement).
Campbell, K. W., 1997, Empirical Near-Source Attenuation Relationships for Horizontaland Vertical Components of Peak Ground Acceleration, Peak Ground Velocity,
AGS
AC Transit BRT Revised 2005 Geologic Assessment 12-2010.doc
33
and Pseudo-Absolute Acceleration Response Spectra; Seismological ResearchLetters, v. 68, n. 1, January/February, p. 154-179.
Dames & Moore, 1963, Soil Investigation, Segment K-705, Oakland – 8th and 9th
Streets, San Francisco Bay Area Rapid Transit System; for Parsons- Brinkerhoff-Tudor-Bechtel, October, 1963, with revisions (3) in December, 1963.
Dames & Moore, 1965, Soils Investigation, Segment R-005, Berkeley, California, SanFrancisco Bay Rapid Transit System; for Parsons-Brinkerhoff-Tudor-Bechtel,August, 1965.
Dames & Moore, 1982, Geotechnical Investigation, Proposed Office Building, Broadwaybetween 11th and 12th Streets, Oakland, California; for Bechtel Investments, Inc.,July, 1982.
Engeo, Inc., 1972, Soils Investigation for Four-Story Parking Structure, East 14th Streetbetween Callan and Estudillo Streets, San Leandro, California; for Wells FargoBank, May, 1972.
Federal Emergency Management Agency, 1978, Flood Insurance Rate Map: City ofBerkeley, California, Alameda County; Page 2 of 2, Community Panel Number060004 0002 A.
Federal Emergency Management Agency, 1982a, Flood Insurance Rate Map: City ofOakland, California, Alameda County; Panel 15 of 45, Community Panel Number065048 0015 B.
Federal Emergency Management Agency, 1982b, Flood Insurance Rate Map: City ofOakland, California, Alameda County; Panel 20 of 45, Community Panel Number065048 0020 B.
Federal Emergency Management Agency, 1982c, Flood Insurance Rate Map: City ofOakland, California, Alameda County; Panel 25 of 45, Community Panel Number065048 0025 B.
Federal Emergency Management Agency, 2000a, Flood Insurance Rate Map: City ofSan Leandro, California, Alameda County; Page 1 of 3, Community PanelNumber 060013 0001 C.
Federal Emergency Management Agency, 2000b, Flood Insurance Rate Map: City ofSan Leandro, California, Alameda County; Page 2 of 3, Community PanelNumber 060013 0002 C.
Geotechnical Engineering, Inc., 1990, Soil Investigation for Planned Bradford Center,Broadway & 8th Street, Oakland, California; for Sue Associates, August, 1990.
AGS
AC Transit BRT Revised 2005 Geologic Assessment 12-2010.doc
34
Geotechnical Engineering, Inc., 1995, Soil Investigation, Planned Additions, EvergreenBaptist Church, 408 West MacArthur Boulevard, Oakland, California; forEvergreen Baptist Church, May, 1995.
Goldman, H. B., 1969, Geologic and Engineering Aspects of San Francisco Bay Fill;CDMG Special Report 97, p. 11-29.
Graymer, R. W., 2000, Geologic Map and Map Database of the Oakland MetropolitanArea, Alameda, Contra Costa, and San Francisco Counties, California; USGSMiscellaneous Field Studies MF-2342.
Hallenbeck & Associates, 1991, Soil Investigation, Bradford Building Four-StoryCommercial Structure, 738 Broadway, Oakland, California; for Mr. Wei Ming Ng,April, 1991.
Harding Lawson Associates, 1988, Site Characterization, Pacific Renaissance Plaza,Chinatown Redevelopment Project Area, Oakland, California; for City of OaklandRedevelopment Agency, December, 1988.
Harlan Tait Associates, 1991, Geotechnical Investigation, Bay Area Rapid TransitDistrict Fruitvale Station Parking Structure, Oakland, California; for OrionEnvironmental Associates, December, 1991.
Harza, 1995, Geotechnical Investigation, Temescal Plaza, Telegraph and 51st Street,Oakland, June, 1995, Revised August and October, 1995.
Hawke Engineers, 1964, Report: Soils Investigation Segment R-703 (Ashby Station),Oakland-Berkeley, California, San Francisco Bay Area Rapid Transit System; forParsons, Brinkerhoff, Tudor, Bechtel, February, 1964.
Helley, E. J., and Graymer, R. W., 1997, Quaternary Geology of Alameda County, andParts of Contra Costa, Santa Clara, San Mateo, San Francisco, Stanislaus, andSan Joaquin Counties, California: a Digital Database; USGS Open-File Report97-97.
Idriss, I. M., 1990, Response of Soft Soil Sites During Earthquakes; H. Bolton SeedVolume 2 Memorial Symposium Proceedings, May, 1990.
Jennings, C. W., 1992, Preliminary Fault Activity Map of California; CDMG Open- FileReport 92-03.
Joyner, W.B., and Boore, D. M., 1988, Measurement, Characterization and Prediction ofStrong Ground Motion; Earthquake Engineering and Soil Dynamics II,Proceedings of the Specialty Conference Sponsored by the GeotechnicalEngineering Division of the American Society of Civil Engineers.
AGS
AC Transit BRT Revised 2005 Geologic Assessment 12-2010.doc
35
Kaldveer Associates, 1989, Revised Shoring Design Parameters, Pacific RenaissancePlaza, Phases II and III, Oakland, California; for Pacific Renaissance Associates,November, 1989.
Kleinfelder, 1999, Geotechnical Investigation for the Bayfair Multiplex Theater, BayfairShopping Center, San Leandro, California; June, 1999.
MWH Energy & Infrastructure, Inc., Geotechnical Investigation, Martin Luther King Jr.Way Housing Project, Oakland, California; for Em Johnson Interest, June, 2001.
Parikh Consultants, Inc., 1997, Geotechnical Feasibility Investigation Report, FruitvaleBart Station Transit Village, City of Oakland, California; for FruitvaleDevelopment Corporation, Inc., July, 1997.
Peter Kaldveer and Associates, Inc., 1979, Geotechnical Engineering Services, MerrittHospital Emergency Generator Building, Oakland, California.
Petersen, M. D., Bryant, W. A., Cramer, C. H., Cao, T., and Reichle, M. S., 1996,Probabilistic Seismic Hazard Assessment for the State of California; CDMGOpen-File Report 96-08; USGS Open-File Report 96-706.
PG Soils, Inc., 1997, Geotechnical Investigation, Proposed Keystone Hotel Project,1100 Broadway, Oakland, California; for Amin Group, December, 1997,Amended September, 1998.
Real, C. R., Toppozada, T. R., and Parke, D. L., 1978, Earthquake Epicenter Map ofCalifornia; CDMG Map Sheet 39, Scale 1:1,000,000.
Seed, H. B., and Idriss, I. M., 1982, Ground Motions and Soil Liquefaction DuringEarthquakes; Earthquake Engineering Research Institute Monograph.
Tong & Chang Consultants, Inc., 1996, Geotechnical Investigation Report, 5101Telegraph Avenue, Oakland, California, July, 1996.
Tong & Chang Consultants, Inc., 1997, Geotechnical Investigation Report, Cell Site#496 at I580/I980/24 Oakland CHP Headquarters, Oakland, California, August,1997.
Toppozada, T. R., 1984, “History of Earthquake Damage in Santa Clara County andComparison of 1911 and 1984 Earthquakes,” in The 1984 Morgan Hill, CaliforniaEarthquake; CDMG Special Publication 68.
Toppozada, T. R., Real, C. R., and Park, D. L., 1981, Preparation of Isoseismal Mapsand Summaries of Reported Effects for pre-1900 California Earthquakes; CDMGOpen-File Report 81-11 SAC.
AGS
AC Transit BRT Revised 2005 Geologic Assessment 12-2010.doc
36
Treadwell & Rollo, 2000, Geotechnical Investigation, 440 38th Street, Oakland,California; for Haight Street Ventures, March, 2000.
Treadwell & Rollo, 2002, Geotechnical Investigation, Proposed Residential Buildings,373 40th Street, Oakland, California; for Mr. Andrew Kahn, March, 2002.
United Soils Engineering, Inc., 1977, Soils Report for Residential Tract in WashingtonSquare, San Leandro, California; February, 1977.
Unites States Geological Survey, 1989, Lessons Learned from the Loma Prieta,California Earthquake of October 17, 1989; Circular 1045.
United States Geological Survey, 2005, Northern California ShakeMap: EstimatedInstrumental Intensity Interactive Website; website URL:http://earthquake.usgs.gov/shakemap/nc/shake/HaywardRC_3_se/intensity.html andhttp://earthquake.usgs.gov/shakemap/nc/shake/HaywardRC_6_se/intensity.html
Woodward-Clyde Consultants, 1988, Geotechnical Engineering Study, 1111 BroadwayBuilding, Oakland, California; for Bramalea Pacific, August, 1988.
Woodward-Clyde-Sherard and Associates, 1964, Inspection of Test Pit Excavations,Oakland, California; for Parsons-Brinkerhoff-Tudor-Bechtel, January, 1964.
Woodward-Clyde-Sherard and Associates, 1967, Soil Investigation R-7055, AshbyPlace Station, Berkeley, California; for Parsons-Brinkerhoff, Tudor-Bechtel,August, 1967.
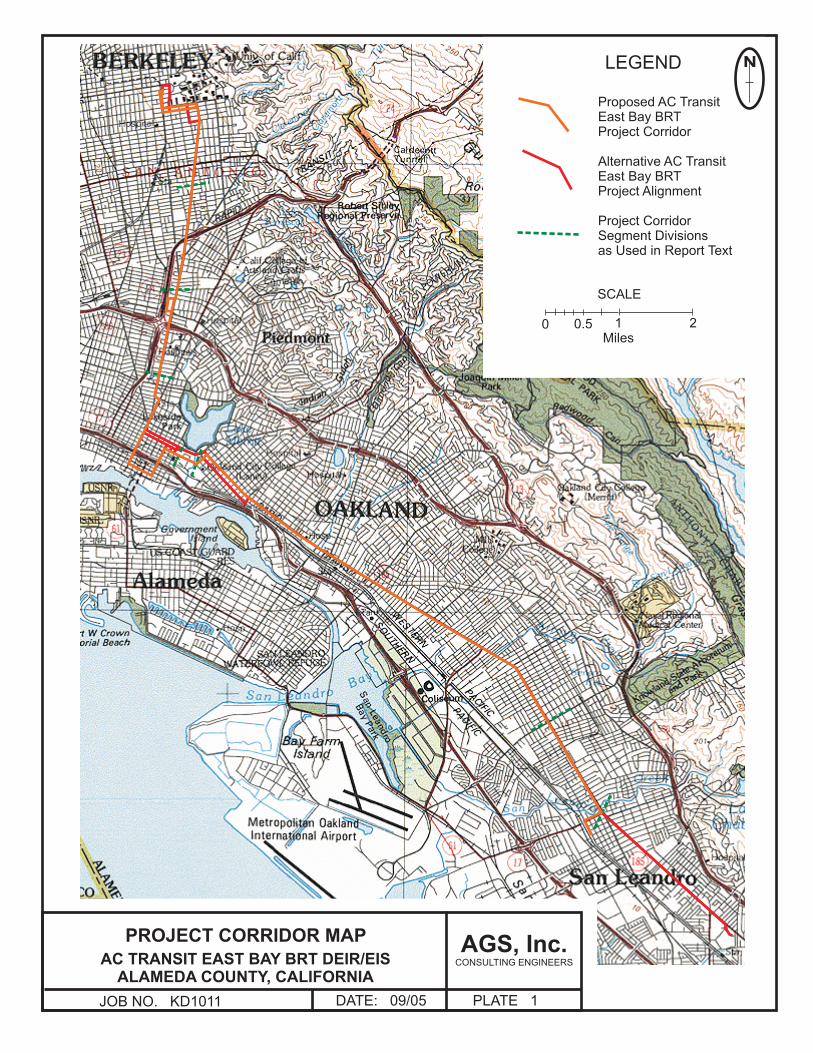
AGS, Inc.CONSULTING ENGINEERS
PLATE 1
PROJECT CORRIDOR MAP
JOB NO. KD1011 DATE: 09/05
AC TRANSIT EAST BAY BRT DEIR/EIS
ALAMEDA COUNTY, CALIFORNIA
LEGEND
Proposed AC TransitEast Bay BRTProject Corridor
Alternative AC TransitEast Bay BRTProject Alignment
Project CorridorSegment Divisionsas Used in Report Text
N
SCALE
0 1Miles
20.5
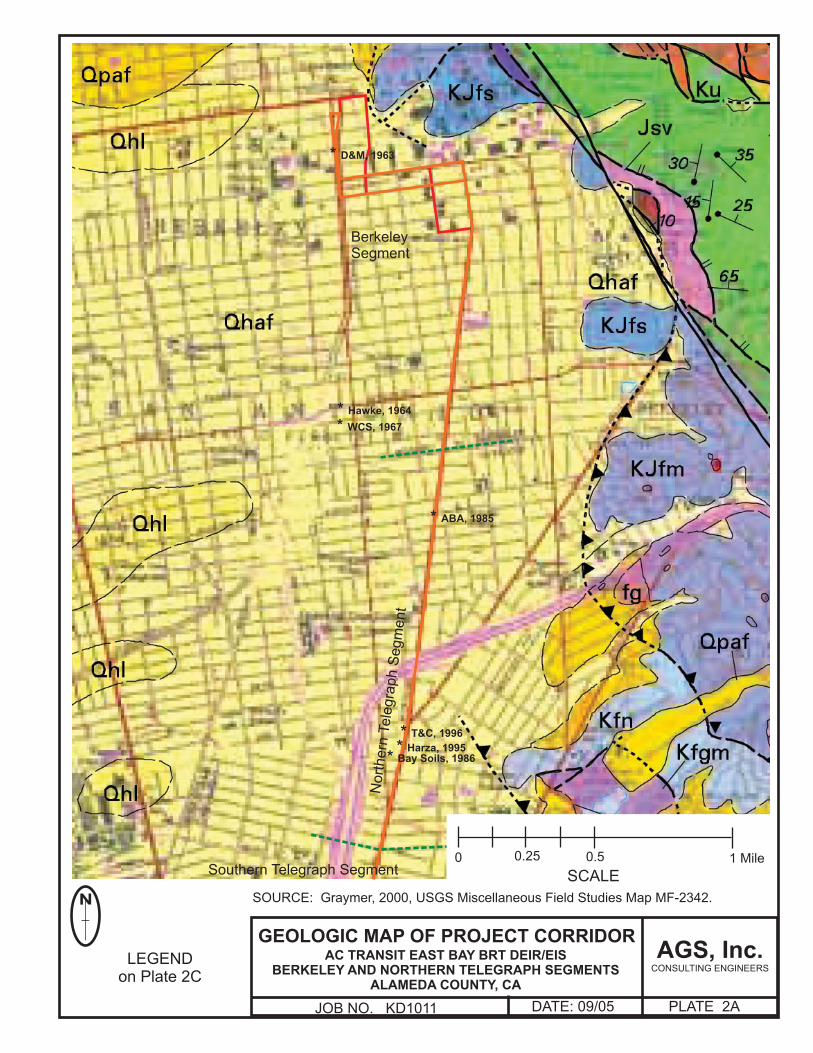
AGS, Inc.CONSULTING ENGINEERS
PLATE 2A
AC TRANSIT EAST BAY BRT DEIR/EIS
BERKELEY AND NORTHERN TELEGRAPH SEGMENTS
ALAMEDA COUNTY, CA
JOB NO. KD1011 DATE: 09/05
GEOLOGIC MAP OF PROJECT CORRIDOR
SOURCE: Graymer, 2000, USGS Miscellaneous Field Studies Map MF-2342.N
LEGENDon Plate 2C
Southern Telegraph Segment
Nort
hern
Tele
gra
ph
Segm
ent
BerkeleySegment
0 0.25 0.5 1 Mile
SCALE
* D&M, 1963
* Hawke, 1964
* WCS, 1967
* ABA, 1985
* T&C, 1996
* Harza, 1995* Bay Soils, 1986
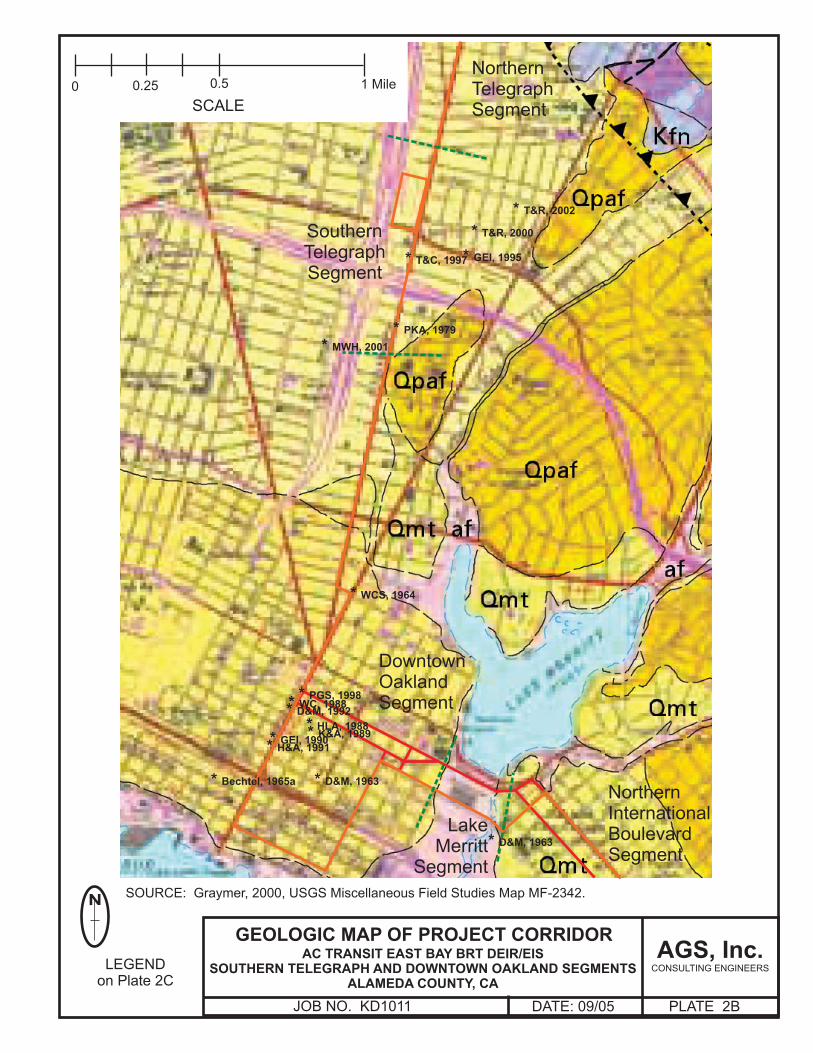
AGS, Inc.CONSULTING ENGINEERS
PLATE 2B
AC TRANSIT EAST BAY BRT DEIR/EIS
SOUTHERN TELEGRAPH AND DOWNTOWN OAKLAND SEGMENTS
ALAMEDA COUNTY, CA
JOB NO. KD1011 DATE: 09/05
GEOLOGIC MAP OF PROJECT CORRIDOR
SOURCE: Graymer, 2000, USGS Miscellaneous Field Studies Map MF-2342.N
LEGENDon Plate 2C
NorthernTelegraphSegment
SouthernTelegraphSegment
LakeMerritt
Segment
DowntownOaklandSegment
NorthernInternationalBoulevardSegment
0 0.25 0.5 1 Mile
SCALE
* T&R, 2002
* T&R, 2000
* GEI, 1995* T&C, 1997
* PKA, 1979
* MWH, 2001
* WCS, 1964
* PGS, 1998* WC, 1988* D&M, 1992
* HLA, 1988* K&A, 1989* GEI, 1990
* H&A, 1991
* Bechtel, 1965a * D&M, 1963
* D&M, 1963
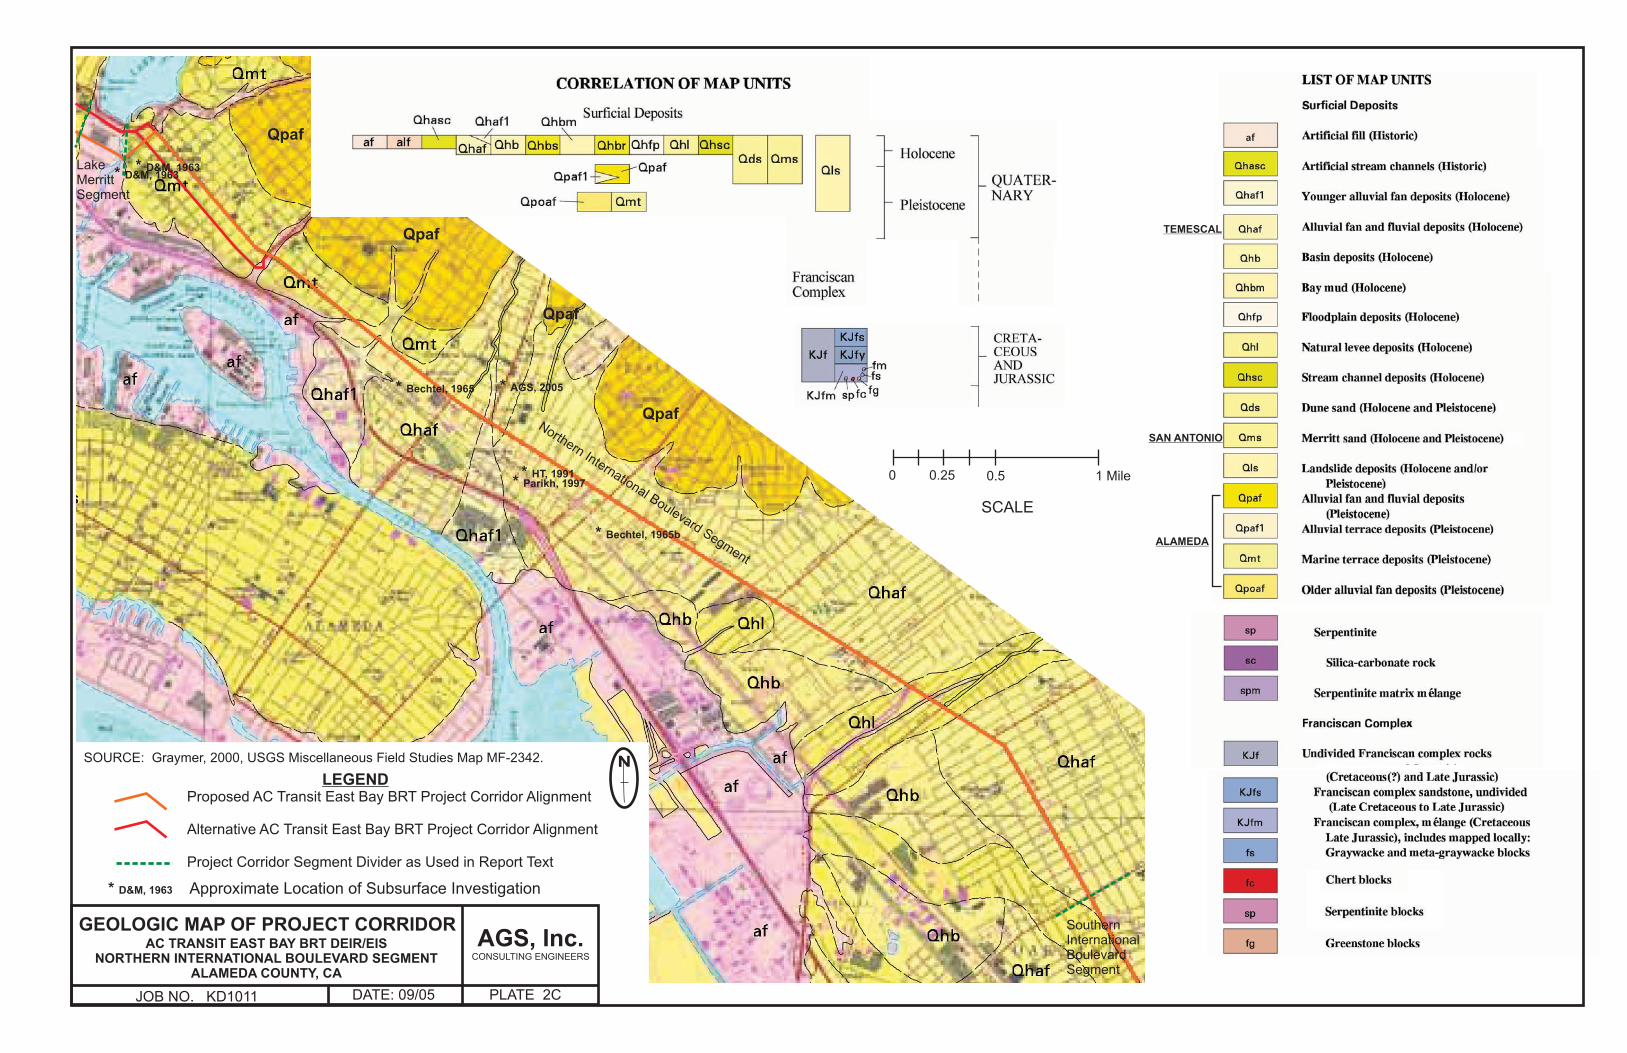
LEGEND:
AGS, Inc.CONSULTING ENGINEERS
PLATE 2C
AC TRANSIT EAST BAY BRT DEIR/EIS
NORTHERN INTERNATIONAL BOULEVARD SEGMENT
ALAMEDA COUNTY, CA
JOB NO. KD1011 DATE: 09/05
GEOLOGIC MAP OF PROJECT CORRIDOR
LakeMerrittSegment
Northern International Boulevard Segment
SouthernInternationalBoulevardSegment
SOURCE: Graymer, 2000, USGS Miscellaneous Field Studies Map MF-2342. N
Qpaf
Qpaf
Qpaf
Qpaf
LEGENDProposed AC Transit East Bay BRT Project Corridor Alignment
Alternative AC Transit East Bay BRT Project Corridor Alignment
Project Corridor Segment Divider as Used in Report Text
SCALE
0 0.25 0.5 1 Mile
SAN ANTONIO
ALAMEDA
TEMESCAL
* Approximate Location of Subsurface InvestigationD&M, 1963
* D&M, 1963* D&M, 1963
* Bechtel, 1965
* HT, 1991* Parikh, 1997
* Bechtel, 1965b
* AGS, 2005
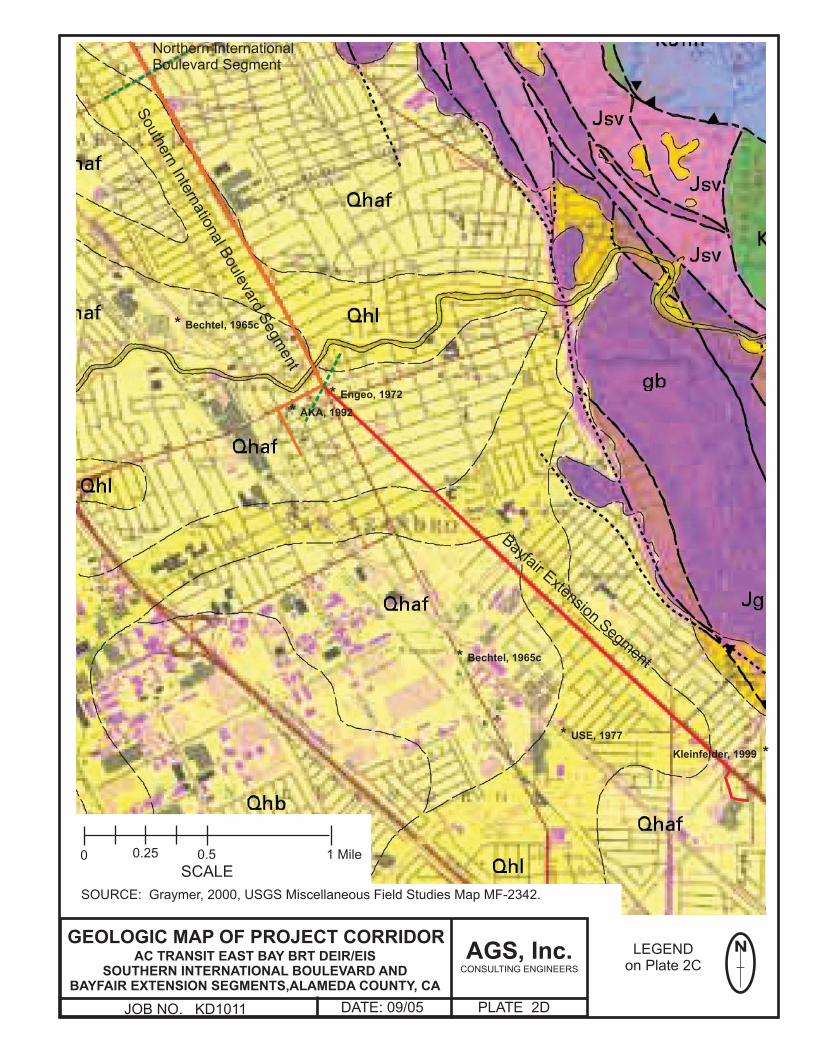
NAGS, Inc.CONSULTING ENGINEERS
PLATE 2D
AC TRANSIT EAST BAY BRT DEIR/EIS
SOUTHERN INTERNATIONAL BOULEVARD AND
BAYFAIR EXTENSION SEGMENTS,ALAMEDA COUNTY, CA
JOB NO. KD1011 DATE: 09/05
GEOLOGIC MAP OF PROJECT CORRIDORLEGEND
on Plate 2C
South
ern
Inte
rnatio
nal B
oule
vard
Segm
ent
Bayfair ExtensionSegm
ent
Northern InternationalBoulevard Segment
SOURCE: Graymer, 2000, USGS Miscellaneous Field Studies Map MF-2342.
0 0.25 0.5 1 Mile
SCALE
* Bechtel, 1965c
* Engeo, 1972
* AKA, 1992
* Bechtel, 1965c
* USE, 1977
Kleinfelder, 1999 *
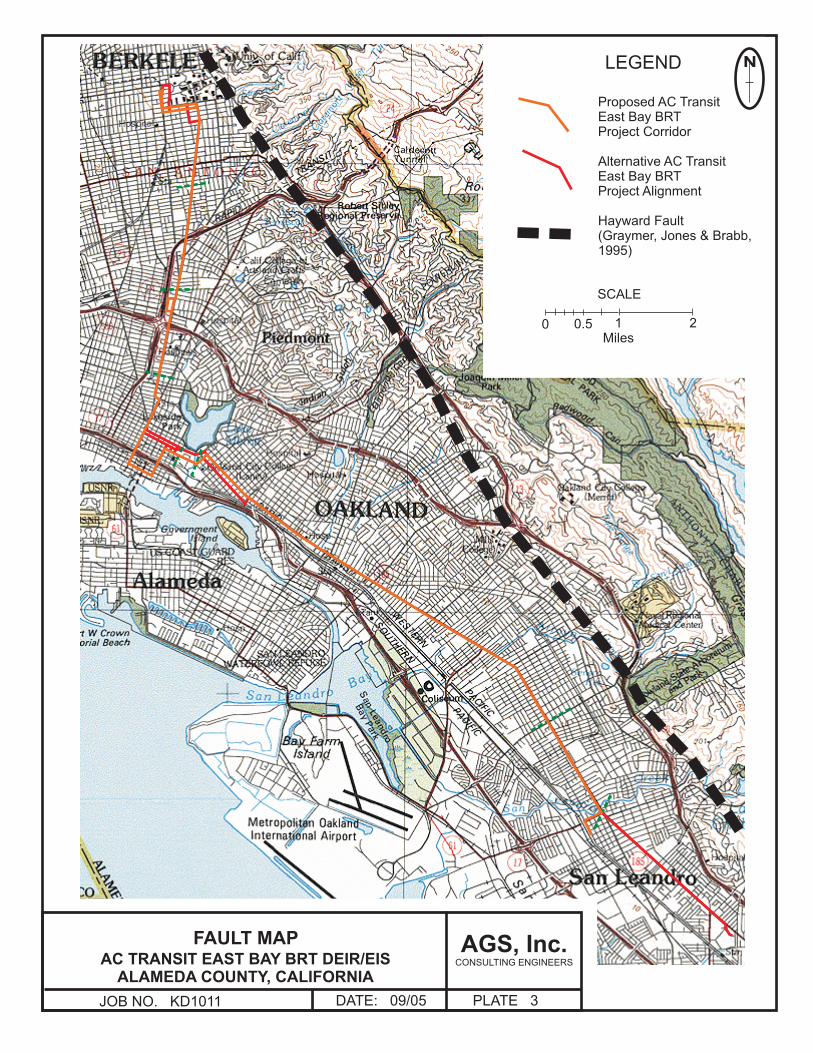
AGS, Inc.CONSULTING ENGINEERS
PLATE 3
FAULT MAP
JOB NO. KD1011 DATE: 09/05
AC TRANSIT EAST BAY BRT DEIR/EIS
ALAMEDA COUNTY, CALIFORNIA
LEGEND
Proposed AC TransitEast Bay BRTProject Corridor
Alternative AC TransitEast Bay BRTProject Alignment
Hayward Fault(Graymer, Jones & Brabb,1995)
N
SCALE
0 1Miles
20.5