Embed Size (px)
Citation preview
Wind Atlas for South Africa (WASA)
How an extreme wind atlas is made
AC Kruger – South African Weather ServiceX Larsén – DTU Wind Energy
1

Wind Atlas for South Africa (WASA)2
•Why do we need extreme wind statistics?
•Statistical background for estimation of extreme wind stats
•Development of extreme wind statistics/values– measured data– modelling
•Applications- wind energy- built environment- disaster management

Wind Atlas for South Africa (WASA)
Why do we need extreme wind statistics?
• Information on extreme winds essential in the design of wind farms – situated in areas with relatively strong winds;
• Application of REWC to obtain extreme wind statistics for wind farm position (e.g. with WAsP Eng.) for IEC 61400-1;
• Updated extreme wind statistics critical for optimal design of built environment
• Disaster management – strong wind hazard profiles for risk estimation
3

Wind Atlas for South Africa (WASA)
Statistical ApproachesAnnual maxima – most widely applied:
GEV (3 types: k < 0, k = 0 (Gumbel) and k >0)
Shortcomings of GEV approach:
• Only one maximum value selected per epoch (per annum)
• Data sets must be long (>= 20 years)
• Cannot be used for data sets < 10 years
Alternative approaches to increase number of cases, e.g.:
• r-largest values per epoch• Method of Independent Storms (MIS)• Peak Over Threshold (POT)

Wind Atlas for South Africa (WASA)
Mixed strong wind climates:
• Mixed distribution method – storms from different origins to be considered separately
• Return period values from combination of set of Gumbel distributions
Hourly Mean Gust

Wind Atlas for South Africa (WASA)Wind Atlas for South Africa (WASA)6
Estimation of Extreme Wind Statistics for South Africa

Wind Atlas for South Africa (WASA)
Analysis of measured data
7

Wind Atlas for South Africa (WASA)
Modeling
• High spatial resolution possible;• New methods continuously researched:
Low time-resolution data (e.g. 6-hourly wind speed)
High time-resolution statistics (e.g. 1:50 yr 10 min wind speed)
8
• Temporal variability can be missed out by smoothing effect of numerical modelling;
Wind Atlas for South Africa (WASA)Wind Atlas for South Africa (WASA) WASA workshop April 20149
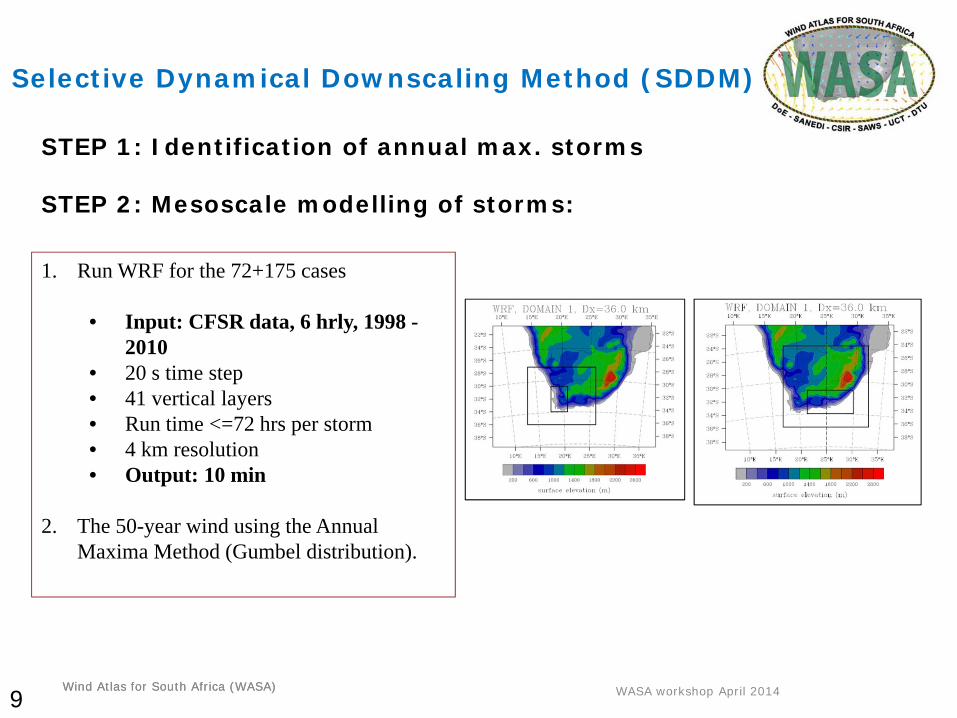
Selective Dynamical Downscaling Method (SDDM)
STEP 1: Identification of annual max. storms
STEP 2: Mesoscale modelling of storms:
1. Run WRF for the 72+175 cases
• Input: CFSR data, 6 hrly, 1998 -2010
• 20 s time step• 41 vertical layers• Run time <=72 hrs per storm• 4 km resolution• Output: 10 min
2. The 50-year wind using the Annual Maxima Method (Gumbel distribution).

Wind Atlas for South Africa (WASA)Wind Atlas for South Africa (WASA)10
• Correction to the standard condition: Height: 10 m, Roughness length: 5 cm
• Microscale generalisation scheme with Linear Computational Model (LINCOM) to obtain mesoscale speedup factors from upwind orography and roughness length
Larsén et al. (2013): The selective dynamical downscaling method for extreme wind atlases, Wind Energy, 2013; 16:1167–1182.
STEP 3: Post-processing procedure:
Wind Atlas for South Africa (WASA)Wind Atlas for South Africa (WASA)
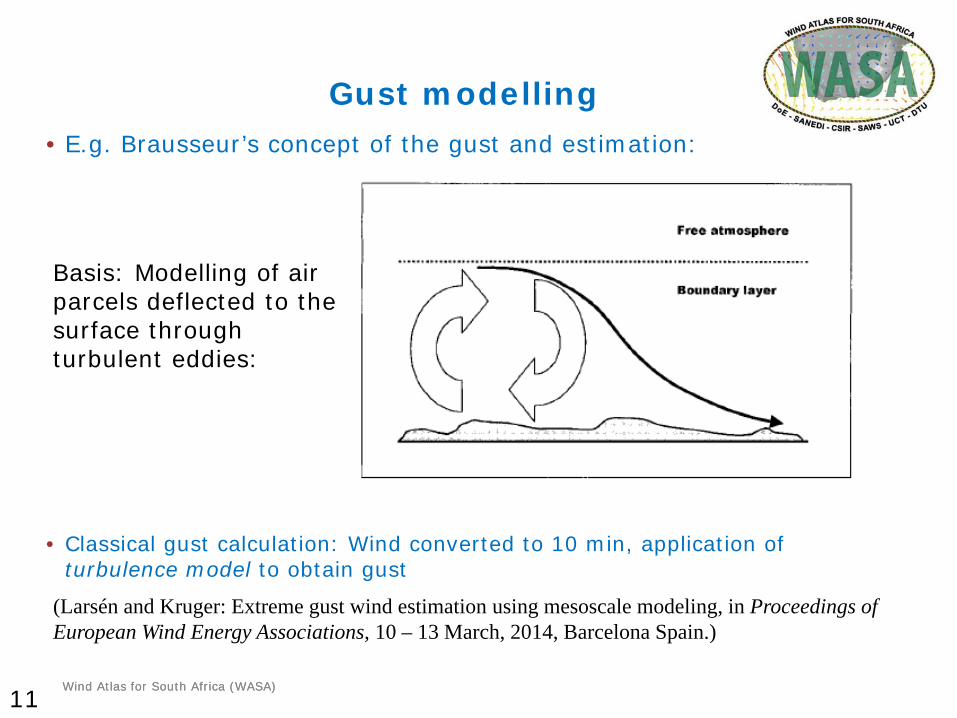
• E.g. Brausseur’s concept of the gust and estimation:
• Classical gust calculation: Wind converted to 10 min, application of turbulence model to obtain gust
11
Gust modelling
(Larsén and Kruger: Extreme gust wind estimation using mesoscale modeling, in Proceedings of European Wind Energy Associations, 10 – 13 March, 2014, Barcelona Spain.)
Basis: Modelling of air parcels deflected to the surface through turbulent eddies:

Wind Atlas for South Africa (WASA)Wind Atlas for South Africa (WASA)12
1:50 year 10-min wind at 10 m over roughness length = 5 cmHorizontal resolution: 4 km
22 23 24 25 26 27 28 29-35
-34.5
-34
-33.5
-33
-32.5
-32
-31.5
Longitude o
1
2
2
3
3
SDDM Outputs:
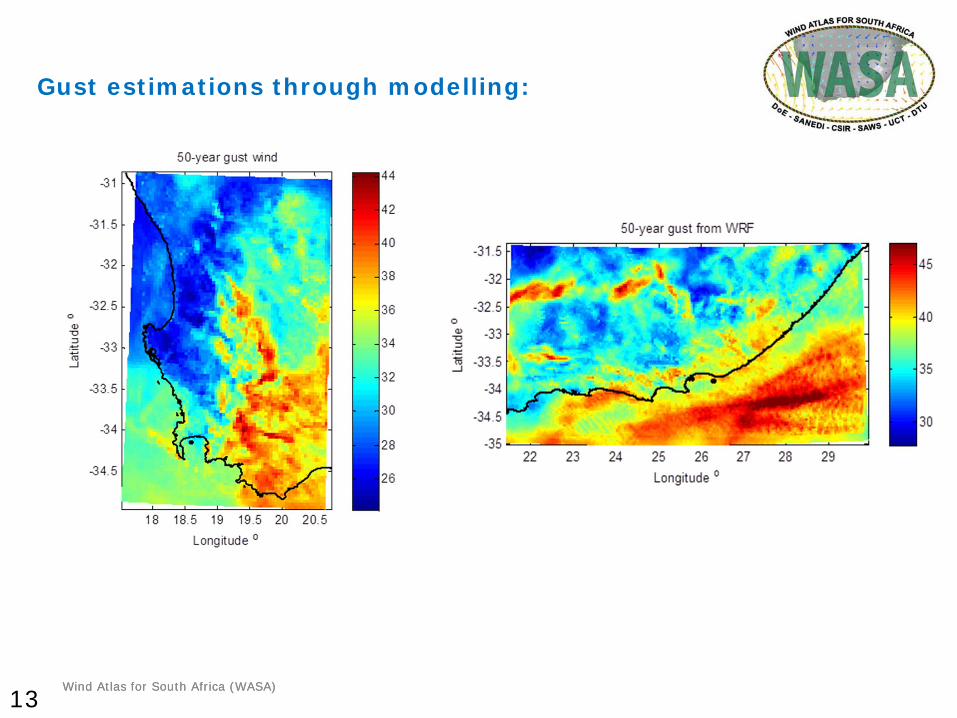
Wind Atlas for South Africa (WASA)Wind Atlas for South Africa (WASA)13
Gust estimations through modelling:
Wind Atlas for South Africa (WASA)
14
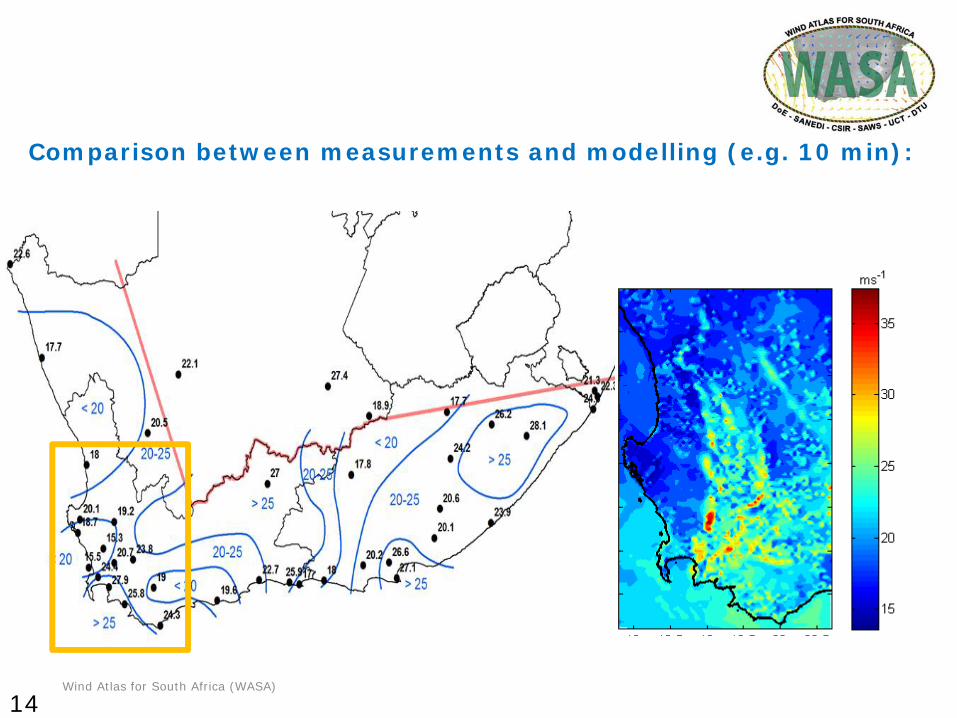
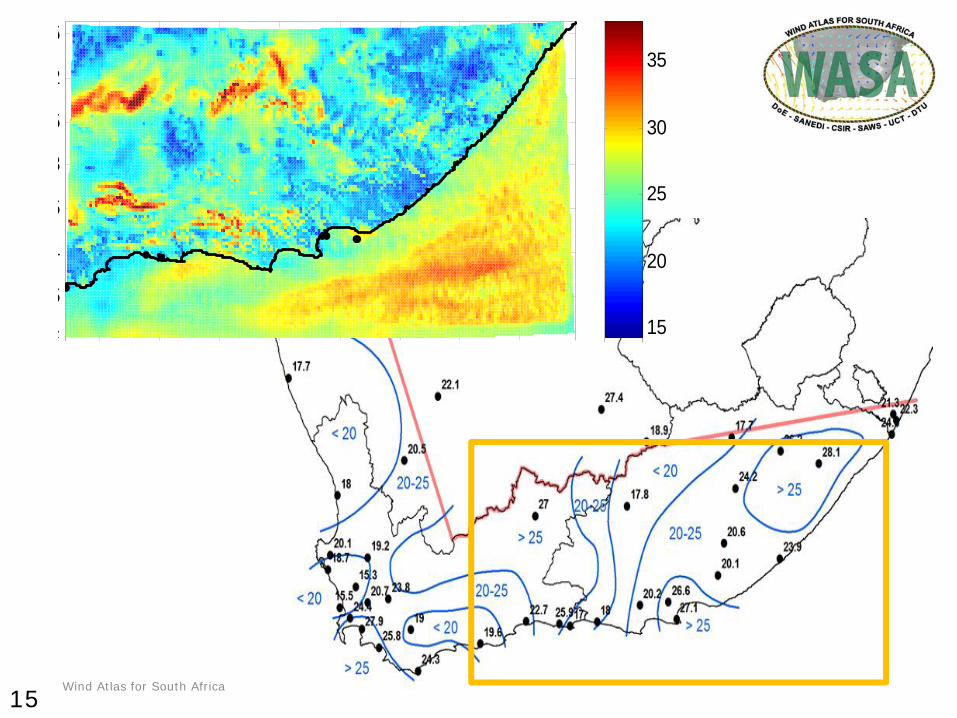
Comparison between measurements and modelling (e.g. 10 min):
Wind Atlas for South Africa (WASA) Sep 2013
5
5
4
5
3
5
2
5
15
20
25
30
35
15
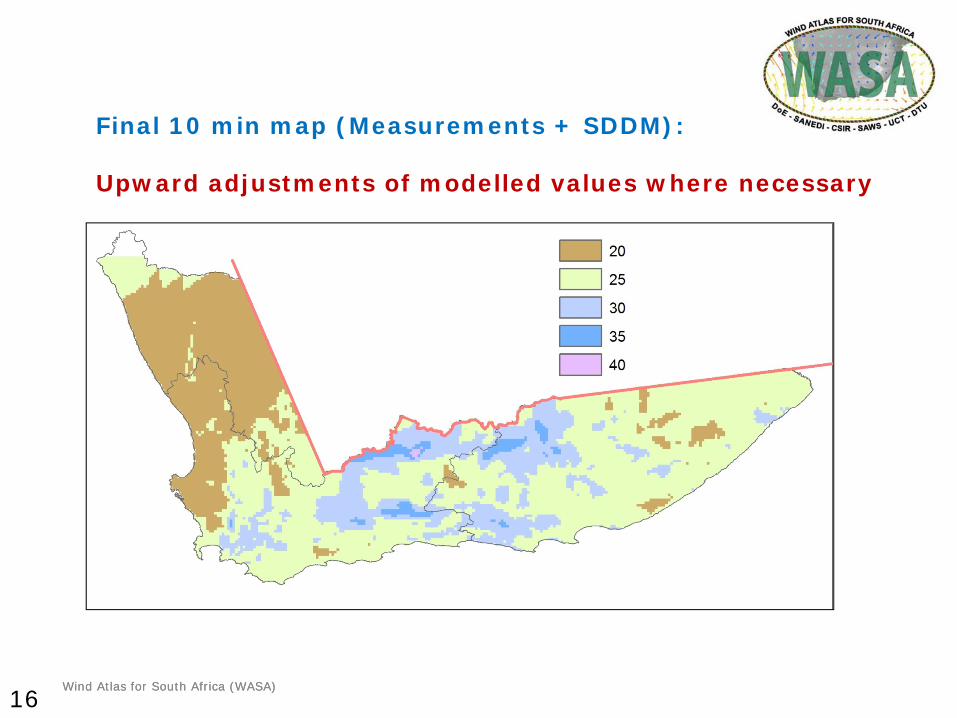
Wind Atlas for South Africa (WASA)Wind Atlas for South Africa (WASA)16
Final 10 min map (Measurements + SDDM):
Upward adjustments of modelled values where necessary

Wind Atlas for South Africa (WASA)Wind Atlas for South Africa (WASA)17
Wind Atlas for South Africa (WASA)
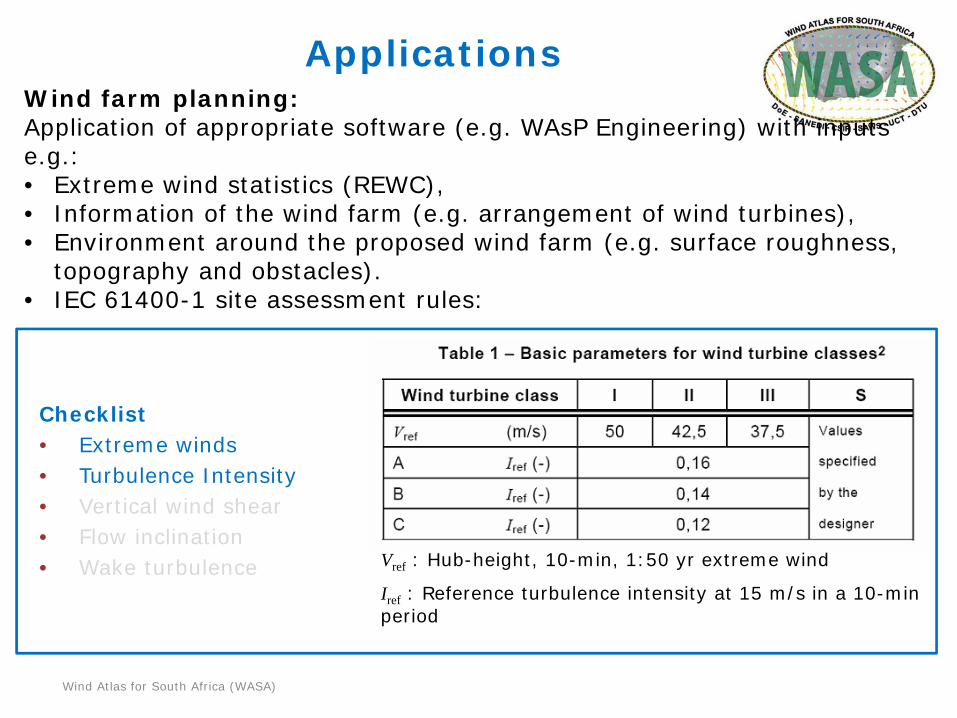
Checklist• Extreme winds • Turbulence Intensity• Vertical wind shear• Flow inclination• Wake turbulence Vref : Hub-height, 10-min, 1:50 yr extreme wind
Iref : Reference turbulence intensity at 15 m/s in a 10-min period
Wind farm planning:Application of appropriate software (e.g. WAsP Engineering) with inputs e.g.:• Extreme wind statistics (REWC),• Information of the wind farm (e.g. arrangement of wind turbines),• Environment around the proposed wind farm (e.g. surface roughness,
topography and obstacles).• IEC 61400-1 site assessment rules:
Applications

Wind Atlas for South Africa (WASA)
Built environment:Update of SABS SANS 10160-3 Wind Actions:• Fundamental value of basic wind speed vb,0:
Intervals range from 32 m/s (green), to 44 m/s (red)
• Based on measured values, but with WASA 1 modelling results considered
• Details in forthcoming suite of 4 papers (SAICE journal)
Applications

Wind Atlas for South Africa (WASA)
Disaster management:
• Quantification of wind hazard used in the relative assessment of risk (1: lowest – 5: highest), quantitatively defined as
risk=(hazard×vulnerability)/capacity
• Risk includes 4 factors defined by NDMC:1. Likelihood2. Frequency3. Magnitude4. Predictability
• Wind hazard: Wind gust > 20 m/s – damage to infrastructure possible (Kruger et al. 2016 - SAJS)
• As with loading code – wind hazard identified per local municipality to identify vulnerable local government areas:
Applications

Wind Atlas for South Africa (WASA)
Likelihood: Frequency:
Magnitude: Predictability:

Wind Atlas for South Africa (WASA)
Relative wind hazard (incl. of 4 factors) - seasonal:

Wind Atlas for South Africa (WASA)
Relative wind hazard (annual):
Wind Atlas for South Africa (WASA)Wind Atlas for South Africa (WASA)
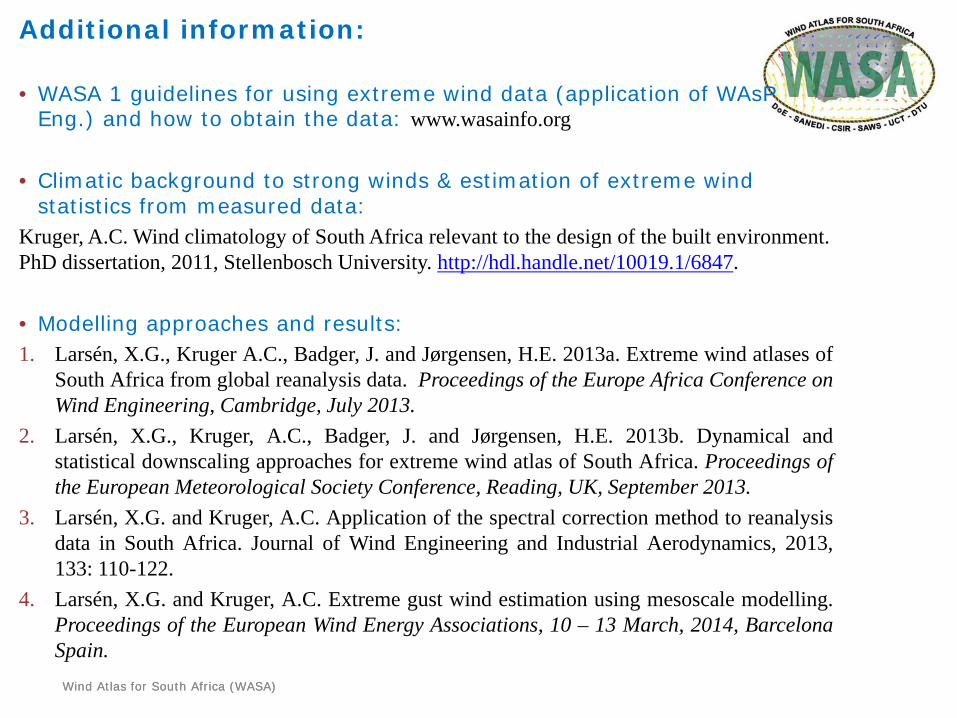
Additional information:
• WASA 1 guidelines for using extreme wind data (application of WAsP Eng.) and how to obtain the data: www.wasainfo.org
• Climatic background to strong winds & estimation of extreme wind statistics from measured data:
Kruger, A.C. Wind climatology of South Africa relevant to the design of the built environment. PhD dissertation, 2011, Stellenbosch University. http://hdl.handle.net/10019.1/6847.
• Modelling approaches and results:1. Larsén, X.G., Kruger A.C., Badger, J. and Jørgensen, H.E. 2013a. Extreme wind atlases of
South Africa from global reanalysis data. Proceedings of the Europe Africa Conference onWind Engineering, Cambridge, July 2013.
2. Larsén, X.G., Kruger, A.C., Badger, J. and Jørgensen, H.E. 2013b. Dynamical andstatistical downscaling approaches for extreme wind atlas of South Africa. Proceedings ofthe European Meteorological Society Conference, Reading, UK, September 2013.
3. Larsén, X.G. and Kruger, A.C. Application of the spectral correction method to reanalysisdata in South Africa. Journal of Wind Engineering and Industrial Aerodynamics, 2013,133: 110-122.
4. Larsén, X.G. and Kruger, A.C. Extreme gust wind estimation using mesoscale modelling.Proceedings of the European Wind Energy Associations, 10 – 13 March, 2014, BarcelonaSpain.

Wind Atlas for South Africa (WASA)Wind Atlas for South Africa (WASA)
Additional information:
• Wind loading code:1. Kruger et al. 2013a. Kruger A. C., Retief, J.V., Goliger, A. M. 2013. Strong winds in South
Africa: Part I – Application of estimation methods. Journal of the South African Institution of Civil Engineering.
2. Kruger A. C., Retief, J.V., Goliger, A. M. Strong Winds in South Africa: Part II - Mapping of Updated Statistics. 2013. Journal of the South African Institution of Civil Engineering.
3. Retief, J.V. and P. E. Dunaiski (ed.). Goliger, A. M., J. V. Retief, P.E. Dunaiski and A. C. Kruger. 2009. Revised wind-loading procedures for SANS 10160. In “Background to SANS 10160. Basis of Structural Design and Actions for Buildings and Industrial Structures.”, SunMedia, Stellenbosch.
4. Forthcoming set of papers in Journal of the South African Institution of Civil Engineering detailing development, application and consideration of uncertainties.
• Disaster management:Kruger, A.C. et al. 2016. Indicative hazard profile for strong winds in South Africa. South African Journal of Science.


![[NMDS] Ola Larsén | Blackberry](https://img.pdfslide.us/doc/110x75/5590e3fd1a28ab0e388b46d8/nmds-ola-larsen-blackberry.jpg)