Embed Size (px)
Citation preview

Final Report
AC INTERFERENCE ANALYSIS – 230 KV
TRANSMISSION LINE COLLOCATED WITH OLYMPIC PIPELINES OPL16 & OPL20
Puget Sound Energy Bellevue, Washington Report No.: OAPUS312DKEMP (PP116591)-1, Rev. 0
Date: December 13, 2016

Puget Sound Energy AC Interference Analysis – 230 kV Transmission Line Collocated with Olympic Pipelines OPL16 & OPL20
DNV GL – Report No. OAPUS312DKEMP (PP116591)-1, Rev. 0 – www.dnvgl.com Page ii
December 13, 2016
Project name: AC Interference Analysis for Puget Sound
Energy
Det Norske Veritas (U.S.A.), Inc.
DNV GL North America Oil & Gas
Pipeline Services
5777 Frantz Road
43017-1386 Dublin, OH
United States
Tel: +1 614 761 1214
Report title: AC Interference Analysis – 230 kV Transmission
Line Collocated with Olympic Pipelines OPL16 &
OPL20
Customer: Puget Sound Energy AC Interference Analysis – 230 kV Transmission Line Collocated with Olympic Pipelines OPL16 &
OPL20 355 110th Avenue NE
Bellevue, Washington 98004
Contact person: Mr. Andrew Lightfoot, P.E.
Date of issue: December 13, 2016
Project No.: PP16591
Organisation unit: Corrosion Management
Report No.: OAPUS312DKEMP (PP116591)-1, Rev. 0
Document No.: 1YZZ7NU-5
Task and objective:
Det Norske Veritas (U.S.A), Inc. (DNV GL) was retained by Puget Sound Energy (PSE) to perform an
induced AC mitigation study to investigate the possibility for AC interference effects and recommend
mitigation methods as required. The HVAC induction study considered two high pressure petroleum
pipelines, owned by Olympic Pipe Line Company and operated by British Petroleum, collocated with a
new 17 mile long 230 kV transmission line.
Prepared by: Verified by: Approved by:
David Kemp, P.E.
Engineer
Computational Modeling
Barry Krebs
Principal Engineer
Materials Advisory Services
Shane Finneran, P.E.
Group Lead
Computational Modeling
Unrestricted distribution (internal and external) Keywords:
[Keywords] Unrestricted distribution within DNV GL
Limited distribution within DNV GL after 3 years
No distribution (confidential)
Secret
Reference to part of this report which may lead to misinterpretation is not permissible.
Rev. No. Date Reason for Issue Prepared by Verified by Approved by
Draft 2016-12-06 Draft for review DK
0 2016-12-13 Final issue DK BK SF
Puget Sound Energy AC Interference Analysis – 230 kV Transmission Line Collocated with Olympic Pipelines OPL16 & OPL20
DNV GL – Report No. OAPUS312DKEMP (PP116591)-1, Rev. 0 – www.dnvgl.com Page iii
December 13, 2016
EXECUTIVE SUMMARY
Det Norske Veritas (U.S.A.), Inc. (DNV GL) was retained by Puget Sound Energy (PSE) to perform an
induced AC interference study to investigate the possibility for AC interference effects (i.e. corrosion
and safety) on two nearby high pressure petroleum pipelines, owned by Olympic Pipe Line Company
(Olympic) and operated by British Petroleum (BP), and recommend design considerations to minimize
AC interference effects. These pipelines are currently collocated within an existing Eastside 115 kV
transmission line corridor, which subsequently would be upgraded to 230 kV as part of the Energize
Eastside project.
Two routes proposed in the Energize Eastside project were specifically examined: the existing
transmission line corridor (commonly referred to as Willow 1), and a route that combines parts of the
existing corridor with the Newport Way area (commonly referred to as Willow 2). Additionally, both
operational scenarios of 230 kV/115 kV and a future 230 kV/230 kV scenario were evaluated. This
report presents the results, conclusions, and recommendations of the analysis. The Oak 1 and Oak 2
routes were considered, though not explicitly modeled in this study. The Oak 1 and Oak 2 routes are
similar to the Willow 2 routes, with an extended collocation length with OPL20. Thus it is expected that
the AC interference levels resulting from the Oak 1 and Oak 2 routes would be higher than the Willow
2 route, which was analyzed as part of this study.
Several industry guidance documents6,7 have presented general guidance parameters for locating
transmission lines and pipelines in shared corridors, which are conservative limits used to determine
when an engineering assessment, such as this one, may be required. Based upon the level of detail
included in this analysis, the results are intended to serve as a detailed assessment, considering the
many specific variables of this particular collocated pipeline/transmission line segment. Thus, these
results, conclusions, and recommendations presented herein, may be used to satisfy a detailed
engineering study, which may be used for this collocation to aid in the design and layout of the
transmission line, relative to the pipeline segments.
The transmission line consists of two circuits with the proposed Richards Creek substation located
approximately in the center of the collocation. The construction plan for the Energize Eastside project
is to upgrade both circuits of the existing 115 kV transmission line to 230 kV standards, initially
operating one circuit at 115 kV while operating the other at 230 kV. The 115 kV circuit would then be
operated at 230 kV at some point in the future.
To assess the AC interference levels, field surveys were performed by DNV GL along the collocated
pipeline segments to collect soil resistivity measurements to be used in the AC analysis. Additionally,
PSE provided the planned operating loads for winter and summer conditions (2028) with the 230
kV/115 kV and 230 kV/230 kV configurations. The winter peak loading scenarios were evaluated for
this study, as they resulted in the worst-case levels of AC interference on the collocated pipeline
segments (i.e., winter peaks exceed summer peaks as the system can carry more load due to ambient
cooling conditions).
Utilizing the Elsyca IRIS software program, the AC interference studies examined the following
objectives for each scenario:

Puget Sound Energy AC Interference Analysis – 230 kV Transmission Line Collocated with Olympic Pipelines OPL16 & OPL20
DNV GL – Report No. OAPUS312DKEMP (PP116591)-1, Rev. 0 – www.dnvgl.com Page iv
December 13, 2016
Determine if steady state conditions pose a threat to personnel safety. The common industry
standard is if AC potential on the pipeline exceeds 15 volts, as specified in NACE SP01772.
Under fault conditions, determine if personnel safety and/or the pipeline integrity could be
compromised (coating damage could occur if fault voltage exceeds the approximate coating
breakdown voltage of 10,825 volts).
Under fault conditions, determine if arcing between the pole structure grounds and the
pipeline is possible; if necessary, recommend mitigation methods.
Determine if steady state conditions are conducive to AC corrosion, thus potentially
compromising the pipeline integrity and necessitating mitigation using the following threshold
ranges from NACE Report 35110, “AC Corrosion State-of-the-Art: Corrosion Rate, Mechanism,
and Mitigation Requirements”5:
o Low likelihood: likelihood of accelerated AC corrosion is low at current densities
between 0 – 20 amps/m2
o Unpredictable: accelerated AC corrosion may or may not occur as it cannot be
accurately predicted when the current density is between 20 and 100 amps/m2;
therefore, after the transmission lines are energized field monitoring and/or mitigation
by the pipeline operator may be required.
o High likelihood: likelihood of accelerated AC corrosion is high when the current density
is greater than 100 amps/m2
A number of sensitivity studies were performed with varying transmission line pole structures and
routes in an effort to minimize the levels of AC interference on the collocated pipeline segments.
These sensitivity studies were used to layout varying pole structures along the collocation for the
Willow 1 and Willow 2 transmission line routes. These configurations were also assessed in this study
to determine the expected levels of AC interference on the collocated pipeline segments. In addition to
the AC analysis related to the upgrading of the transmission line circuits to 230 kV, the existing 115
kV transmission line route and transmission line structures were also analyzed in the same IRIS model
to compare model predictions to field measured AC potentials, provided by Olympic. This was done in
an effort to provide a level of validation and comparison to field measurements along the pipeline
corridor for the existing configuration.
Findings
During the course of the study, three principle factors were identified to have a significant effect on
the level of AC interference on the collocated pipeline segments:
Current load unbalance between the two circuits as a result of operating at 115 kV/ 230 kV.
Points of divergence between the transmission line and pipeline along the corridor (i.e. where
the respective utilities enter and exit the shared corridor).

Puget Sound Energy AC Interference Analysis – 230 kV Transmission Line Collocated with Olympic Pipelines OPL16 & OPL20
DNV GL – Report No. OAPUS312DKEMP (PP116591)-1, Rev. 0 – www.dnvgl.com Page v
December 13, 2016
Conductor geometry, where a true delta configuration provided the greatest level of field
cancellation.
Based upon the results of the sensitivity studies, optimized pole configurations were designed for both
the Willow 1 and Willow 2 routes for further assessment.
Considering the optimized conductor geometry, with both lines operating at 230 kV in the existing
corridor (Willow 1), the induced AC potentials and theoretical AC current densities satisfied accepted
industry levels:
The maximum induced AC potentials from the optimized conductor geometry analysis
were less than 15 volts, per NACE SP01772
The maximum theoretical AC current densities from the optimized conductor
geometry analysis were less than 20 amps/m2, indicating the likelihood of accelerated
AC corrosion is low5
For all of the other scenarios that were analyzed, the model predicted maximum theoretical AC current
densities between 20 amps/m2 and 100 amps/m2, indicating that accelerated AC corrosion may or
may not occur and is therefore unpredictable. After the transmission lines are energized, field
monitoring and/or mitigation by the pipeline operator may be needed to confirm that current densities
are at acceptable levels. For these same scenarios, the model also predicted induced AC potentials
greater than the 15 volt industry standard, indicating field monitoring and/or mitigation by the
pipeline operator may be needed to confirm AC potentials on the pipeline are at acceptable levels,
after the transmission lines are energized. Table E1 below summarizes the conclusions from the
various transmission line route and load configurations considered for this study and the resulting
predicted levels of AC interference on the two collocated pipelines, OPL16 and OPL20.
Table E1. Conclusion Summary: Optimized Willow 1 and 2 Results
Route
(Optimized Configuration)
Load Scenario
Maximum Induced AC
Potential (V) Maximum Theoretical AC Current
Density (Amps/m2)
OPL16 OPL20 OPL16 OPL20
Willow 1 230/230 Winter
Peak D D L L
Willow 1 230/115 Winter
Peak E D U L
Willow 2 230/230 Winter
Peak D E U U
Willow 2 230/115 Winter
Peak E E U U
Induced AC Potential: D – Does not exceed 15V NACE safety limit, E – Exceed 15V NACE safety limits. Current Density: L – Low risk range, U – Unpredictable risk range. Yellow: Requires additional post-construction monitoring and/or mitigation by the pipeline operator to verify that safety standards and/or thresholds are met.

Puget Sound Energy AC Interference Analysis – 230 kV Transmission Line Collocated with Olympic Pipelines OPL16 & OPL20
DNV GL – Report No. OAPUS312DKEMP (PP116591)-1, Rev. 0 – www.dnvgl.com Page vi
December 13, 2016
A fault analysis was also performed to determine the pipelines’ susceptibility to damage, resulting
from a fault incident. Several sensitivity studies were performed with varying pole configurations and
shield wire types to aid in the design of the transmission line layout. Considering the expected fault
current of 25 kA and either an Alumoweld or OPGW shield wire on the transmission lines, the
predicted coating stress voltage was well below the expected coating breakdown voltage for the coal
tar coated pipeline segments. Additionally, the maximum arcing distance was calculated for the
collocated pipeline segments, based upon the maximum single-phase-to-ground fault current
returning to ground at a single pole. The maximum arcing distance was found to be 13 feet,
considering an OPGW shield wire on the transmission lines.
Due to variation in soil resistivity and lack of precision related to the pipeline location coordinates,
relative to the transmission line poles, it is recommended to field verify the distance between the
pipeline and transmission line pole grounds where the pole to pipeline spacing is 13 feet or less. In
cases where the poles are located within 13 feet, site-specific soil resistivity tests should be conducted
to determine whether mitigation by arc shielding protection is needed.
Recommendations
The following general recommendations are suggested:
Based upon the AC interference modelling and considering certain conductor geometries,
operational voltages, and routing, the AC interference effects on the collocated pipeline
segments can be reduced to a level that satisfies acceptable industry thresholds for safety and
accelerated AC corrosion.
After the transmission lines are energized, field monitoring and/or mitigation may be needed
(to be performed by the pipeline operator) for those loading scenarios where the AC potential
is greater than 15 volts and the AC current density is greater than 20 A/m2.
Pipeline technicians should understand the hazards and safe practices associated with cathodic
protection and AC mitigation when working with these sections of pipeline.
It is recommended that AC pipe-to-soil potentials be recorded along with the DC pipe-to-soil
potentials during the annual cathodic protection survey. This can provide information, should
unexpected changes occur between the pipeline and transmission line.
PSE should notify the pipeline operator when there are planned outages on the individual
circuits, as the AC induction effects on the pipeline may be magnified when only one circuit (of
the double circuit transmission lines) is energized.
Final mitigation design, if necessary, should be based on field data collected after the system
is energized. Mitigation may include installation of additional grounding such as: grounding
mats, horizontal surface ribbon, and/or deep anode wells based upon a detailed mitigation
study.

Puget Sound Energy AC Interference Analysis – 230 kV Transmission Line Collocated with Olympic Pipelines OPL16 & OPL20
DNV GL – Report No. OAPUS312DKEMP (PP116591)-1, Rev. 0 – www.dnvgl.com Page vii
December 13, 2016
Table of Contents
EXECUTIVE SUMMARY .............................................................................................................. iii
1 INTRODUCTION .............................................................................................................. 1
2 SCOPE OF WORK ............................................................................................................ 3
2.1 Data Collection ...................................................................................................... 3
2.2 AC Analysis ........................................................................................................... 3
3 HVAC TRANSMISSION LINE EFFECTS ON ADJACENT PIPELINES ............................................ 3
4 DESCRIPTION OF FACILITIES ........................................................................................... 8
4.1 General Pipeline Routing ......................................................................................... 8
4.2 HVAC Power Transmission Line ................................................................................ 8
5 FIELD TESTING DATA ..................................................................................................... 10
5.1 Soil Resistivity ...................................................................................................... 10
6 THEORETICAL AC CURRENT DENSITY ............................................................................... 10
7 ELSYCA IRIS MODELING ................................................................................................. 11
7.1 Model Setup ......................................................................................................... 12
7.2 Steady State Induced AC Results ............................................................................ 12
8 FAULT VOLTAGE AND CURRENT RESULTS ......................................................................... 29
9 CONCLUSIONS AND RECOMMENDATIONS ......................................................................... 31
9.1 General Recommendations ..................................................................................... 33
10 GLOSSARY OF TERMS ..................................................................................................... 35
11 REFERENCES ................................................................................................................. 36
Puget Sound Energy AC Interference Analysis – 230 kV Transmission Line Collocated with Olympic Pipelines OPL16 & OPL20
DNV GL – Report No. OAPUS312DKEMP (PP116591)-1, Rev. 0 – www.dnvgl.com Page viii
December 13, 2016
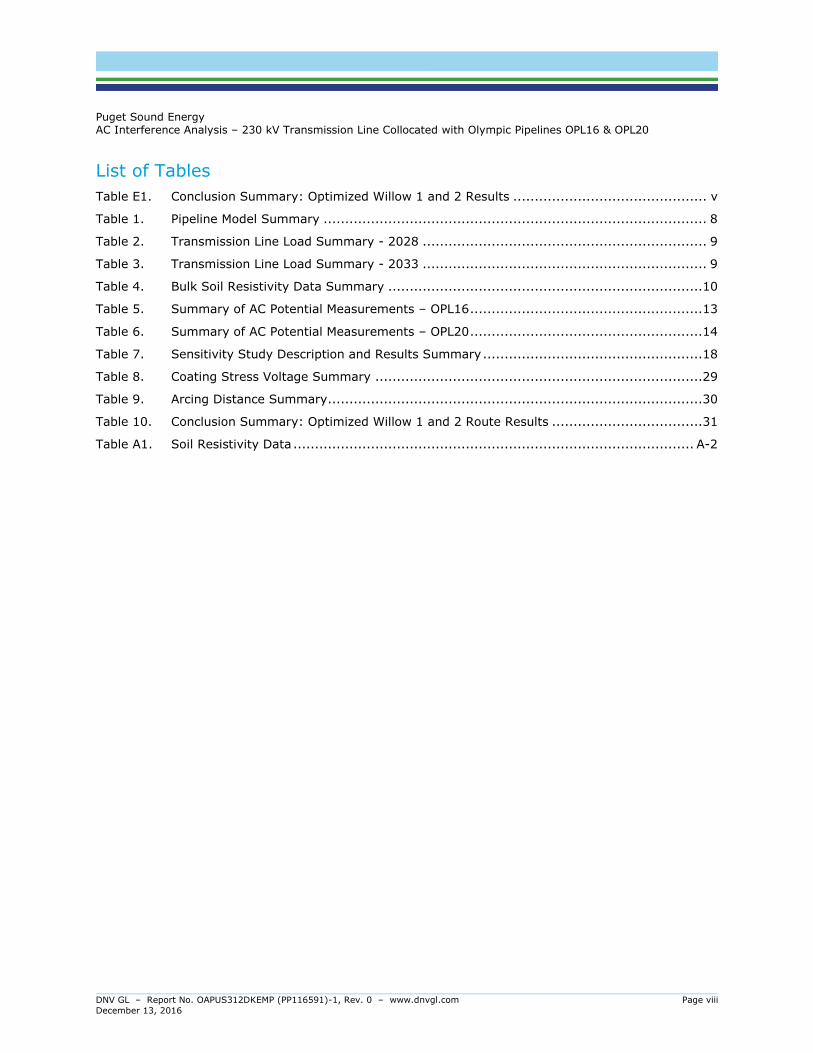
List of Tables
Table E1. Conclusion Summary: Optimized Willow 1 and 2 Results ............................................. v
Table 1. Pipeline Model Summary ......................................................................................... 8
Table 2. Transmission Line Load Summary - 2028 .................................................................. 9
Table 3. Transmission Line Load Summary - 2033 .................................................................. 9
Table 4. Bulk Soil Resistivity Data Summary .........................................................................10
Table 5. Summary of AC Potential Measurements – OPL16 ......................................................13
Table 6. Summary of AC Potential Measurements – OPL20 ......................................................14
Table 7. Sensitivity Study Description and Results Summary ...................................................18
Table 8. Coating Stress Voltage Summary ............................................................................29
Table 9. Arcing Distance Summary .......................................................................................30
Table 10. Conclusion Summary: Optimized Willow 1 and 2 Route Results ...................................31
Table A1. Soil Resistivity Data ............................................................................................. A-2

Puget Sound Energy AC Interference Analysis – 230 kV Transmission Line Collocated with Olympic Pipelines OPL16 & OPL20
DNV GL – Report No. OAPUS312DKEMP (PP116591)-1, Rev. 0 – www.dnvgl.com Page ix
December 13, 2016
List of Figures
Figure 1. General Layout of Pipelines and Existing 115 kV Transmission Line .............................. 2
Figure 2. General Layout of Pipelines and 230 kV Transmission Line – Willow 2 ........................... 2
Figure 3. Steady State HVAC Interference – Electromagnetic Induction Effect ............................. 4
Figure 4. HVAC Fault Condition – Inductive and Conductive Interference .................................... 5
Figure 5. Capacitive Interference Effect .................................................................................. 6
Figure 6. Pole Configurations Considered in the AC Analysis ...................................................... 9
Figure 7. Existing 115 KV Transmission Line Route and Data Logger Locations ...........................13
Figure 8. Model Results Compared to Field Measured AC Potentials – OPL16 ..............................15
Figure 9. Model Results Compared to Field Measured AC Potentials – OPL20 ..............................16
Figure 10. Map of Transmission Line Segments for Presentation of AC Model Sensitivity Study Results ................................................................................................................17
Figure 11. Willow 1 Transmission Line Route with C1 and C16 Structures ....................................19
Figure 12. OPL16 Induced AC Potential Model Results for Willow 1 Route with Optimized
Configurations ......................................................................................................20
Figure 13. OPL16 Theoretical AC Current Density Results for Willow 1 Route with Optimized Configurations ......................................................................................................21
Figure 14. OPL20 Induced AC Potential Model Results for Willow 1 Route with Optimized Configurations ......................................................................................................22
Figure 15. OPL20 Theoretical AC Current Density Results for Willow 1 Route with Optimized
Configurations ......................................................................................................23
Figure 16. Willow 2 Transmission Line Route with C1, C2, Low Profile, and C16 Structures ............24
Figure 17. OPL16 Induced AC Potential Model Results for Willow 2 Route with Optimized Configurations ......................................................................................................25
Figure 18. OPL16 Theoretical AC Current Density Results for Willow 2 Route with Optimized Configurations ......................................................................................................26
Figure 19. OPL20 Induced AC Potential Model Results for Willow 2 Route with Optimized
Configurations ......................................................................................................27
Figure 20. OPL20 Theoretical AC Current Density Results for Willow 2 Route with Optimized Configurations ......................................................................................................28
List of Appendices
Appendix A: Soil Resistivity Data
Puget Sound Energy
AC Interference Analysis – 230 kV Transmission Line Collocated with Olympic Pipelines OPL16 & OPL20
DNV GL – Report No. OAPUS312DKEMP (PP116591)-1, Rev. 0 – www.dnvgl.com Page 1
December 13, 2016
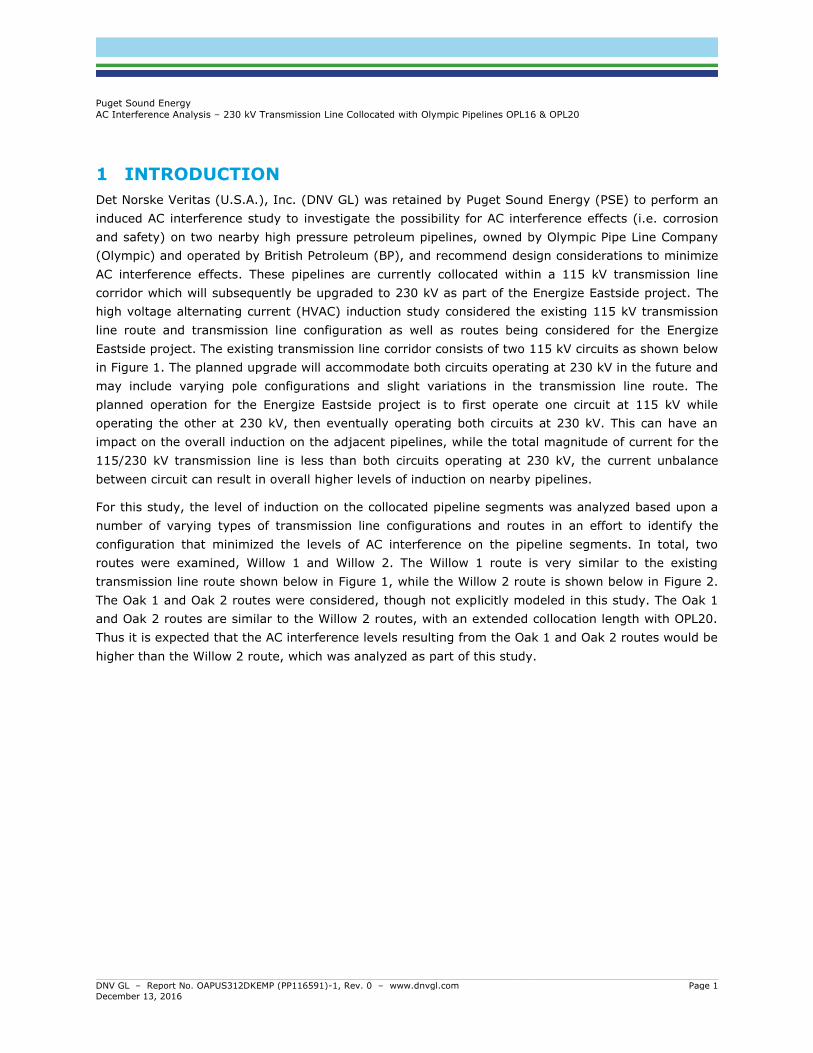
1 INTRODUCTION
Det Norske Veritas (U.S.A.), Inc. (DNV GL) was retained by Puget Sound Energy (PSE) to perform an
induced AC interference study to investigate the possibility for AC interference effects (i.e. corrosion
and safety) on two nearby high pressure petroleum pipelines, owned by Olympic Pipe Line Company
(Olympic) and operated by British Petroleum (BP), and recommend design considerations to minimize
AC interference effects. These pipelines are currently collocated within a 115 kV transmission line
corridor which will subsequently be upgraded to 230 kV as part of the Energize Eastside project. The
high voltage alternating current (HVAC) induction study considered the existing 115 kV transmission
line route and transmission line configuration as well as routes being considered for the Energize
Eastside project. The existing transmission line corridor consists of two 115 kV circuits as shown below
in Figure 1. The planned upgrade will accommodate both circuits operating at 230 kV in the future and
may include varying pole configurations and slight variations in the transmission line route. The
planned operation for the Energize Eastside project is to first operate one circuit at 115 kV while
operating the other at 230 kV, then eventually operating both circuits at 230 kV. This can have an
impact on the overall induction on the adjacent pipelines, while the total magnitude of current for the
115/230 kV transmission line is less than both circuits operating at 230 kV, the current unbalance
between circuit can result in overall higher levels of induction on nearby pipelines.
For this study, the level of induction on the collocated pipeline segments was analyzed based upon a
number of varying types of transmission line configurations and routes in an effort to identify the
configuration that minimized the levels of AC interference on the pipeline segments. In total, two
routes were examined, Willow 1 and Willow 2. The Willow 1 route is very similar to the existing
transmission line route shown below in Figure 1, while the Willow 2 route is shown below in Figure 2.
The Oak 1 and Oak 2 routes were considered, though not explicitly modeled in this study. The Oak 1
and Oak 2 routes are similar to the Willow 2 routes, with an extended collocation length with OPL20.
Thus it is expected that the AC interference levels resulting from the Oak 1 and Oak 2 routes would be
higher than the Willow 2 route, which was analyzed as part of this study.

Puget Sound Energy
AC Interference Analysis – 230 kV Transmission Line Collocated with Olympic Pipelines OPL16 & OPL20
DNV GL – Report No. OAPUS312DKEMP (PP116591)-1, Rev. 0 – www.dnvgl.com Page 2
December 13, 2016
Figure 1. General Layout of Pipelines and Existing 115 kV Transmission Line
Figure 2. General Layout of Pipelines and 230 kV Transmission Line – Willow 2
In order to confirm the AC interference model predictions, AC potential data was collected at targeted
locations along the corridor for both pipelines and the existing pole configurations were included in the
model. The existing transmission line configuration was analyzed at known operating loads and then

Puget Sound Energy
AC Interference Analysis – 230 kV Transmission Line Collocated with Olympic Pipelines OPL16 & OPL20
DNV GL – Report No. OAPUS312DKEMP (PP116591)-1, Rev. 0 – www.dnvgl.com Page 3
December 13, 2016
compared to field data collected and provided by Olympic for comparison. The results and conclusions
of the AC interference sensitivity studies are presented and described in further detail in this report.
2 SCOPE OF WORK
The scope of this project was to examine the Olympic pipeline segments’ susceptibility to HVAC
interference and to numerically model the magnitude and location(s) of possible AC current discharge.
The scope of work was divided into a data collection phase and an AC analysis phase, completed by
DNV GL as summarized in the following tasks:
2.1 Data Collection
Task 1: Information collection and familiarization with pipeline routing.
o Pipeline route, diameter, coating type, vintage, power line route, configurations, loads,
etc.
Task 2: Testing and measurements along the pipeline right-of-way.
o Soil resistivity measurements and AC potential measurements.
2.2 AC Analysis
Task 1: Development of a model of the pipeline locations for simulation purposes.
Task 2: Assess the existing 115 kV transmission line configuration and compare model
results to field data to confirm model predictions.
Task 3: Perform detailed numerical simulations to determine the levels of AC interference
which may be present on the collocated pipeline segments based upon varying pole design
configurations and routes.
Task 4: Assess two finalized route designs with varying structures, based upon lessons
learned from the AC interference sensitivity studies.
Task 5: Preparation and delivery of a final report describing the work performed.
3 HVAC TRANSMISSION LINE EFFECTS ON ADJACENT PIPELINES
Pipelines sharing, paralleling, or crossing HVAC transmission line (typically defined as 69 kV or higher)
rights-of-way (ROW) may be subjected to electrical interference from capacitive interference,
electromagnetic induction, and conductive effects. Electromagnetic induction is the primary effect of
the HVAC transmission line on the buried pipeline during normal (steady state) operation. This form of
interference is due to the magnetic field produced by AC current flowing in the conductors of the
transmission line coupling with the pipeline and inducing a voltage on the pipeline as indicated in
Figure 3 below.

Puget Sound Energy
AC Interference Analysis – 230 kV Transmission Line Collocated with Olympic Pipelines OPL16 & OPL20
DNV GL – Report No. OAPUS312DKEMP (PP116591)-1, Rev. 0 – www.dnvgl.com Page 4
December 13, 2016
Figure 3. Steady State HVAC Interference – Electromagnetic Induction Effect
Conductive interference results from currents traveling through the soils and onto the pipeline.
Conductive effects are primarily a concern when a fault occurs in an area where the pipeline is in close
proximity to the transmission line and the magnitudes of the fault currents in the soil are high. The
electromagnetic effects are also significant during a fault condition because the phase current of at
least one conductor is very high, as indicated in Figure 4 below.

Puget Sound Energy
AC Interference Analysis – 230 kV Transmission Line Collocated with Olympic Pipelines OPL16 & OPL20
DNV GL – Report No. OAPUS312DKEMP (PP116591)-1, Rev. 0 – www.dnvgl.com Page 5
December 13, 2016
Figure 4. HVAC Fault Condition – Inductive and Conductive Interference
Electrostatic coupling or capacitive interference occurs due to the electromagnetic field produced by
AC current flowing in the conductors on the transmission line induces charge on the pipeline while it is
electrically isolated from the ground. The pipeline can build up charge as a capacitor with the
surrounding air acting as the dielectric, which may result in a safety hazard for any personnel in
contact with the pipe. Capacitive effects are primarily a concern during pipeline maintenance and
construction when sections of the pipeline are isolated above ground, as indicated in Figure 5.

Puget Sound Energy
AC Interference Analysis – 230 kV Transmission Line Collocated with Olympic Pipelines OPL16 & OPL20
DNV GL – Report No. OAPUS312DKEMP (PP116591)-1, Rev. 0 – www.dnvgl.com Page 6
December 13, 2016
Figure 5. Capacitive Interference Effect
If these electrical effects are high enough during steady state normal operation, a possible shock
hazard exists for anyone that touches an exposed part of the pipeline such as a valve, CP test station,
or other aboveground appurtenance of the pipeline. During steady state normal transmission line
operation, AC current density at a coating holiday (flaw) above a certain threshold may cause
accelerated external corrosion damage to the pipeline. In addition, damage to the pipeline or its
coating can occur if the voltage between the pipeline and surrounding soil becomes excessive during a
fault condition.
In terms of personnel safety, the concern is the voltage a person is exposed to when touching or
standing near the pipeline. The “touch potential” is the voltage between an exposed feature of the
pipeline such as a CP test station or valve and surrounding soil or a nearby isolated metal object such
as a fence that can be touched at the same time. The “step potential” is the voltage across a person’s
two feet and is defined as the difference in the earth’s surface potential between two spots one meter
apart. The touch potential can be a concern during both normal steady state inductive and fault
conductive/inductive conditions. Typically, the step potential is a concern during conductive fault
conditions when there are high currents and voltage gradients in the soil.
An evaluation of the possible risk to personnel safety for those working on the pipeline and possible
pipeline coating damage should take place whenever a pipeline is in close proximity to an HVAC
transmission line. A mitigation system can be designed for those areas where potentials are above
permissible limits as specified in the Institute of Electrical and Electronics Engineers Standard IEEE-801

Puget Sound Energy
AC Interference Analysis – 230 kV Transmission Line Collocated with Olympic Pipelines OPL16 & OPL20
DNV GL – Report No. OAPUS312DKEMP (PP116591)-1, Rev. 0 – www.dnvgl.com Page 7
December 13, 2016
and NACE International Standard Practice SP0177-20142 Mitigation of Alternating Current and
Lightning Effects on Metallic Structures and Corrosion Control Systems (collectively “Standards”).
These Standards indicate mitigation is necessary in those cases where step or touch potentials are in
excess of 15.0 VAC.
A phase-to-ground fault on a power transmission line causes large currents in the soil at the location
of the fault and large return currents on the phase conductor and ground return. Although these faults
are normally of short duration (less than one second), unless appropriate mitigation measures are
implemented, pipeline damage can occur from high potential breakdown of the coating, resistive
conductive arcing across the coating near the fault and high-induced currents along the right of way.
In the absence of mitigation measures, these high current magnitudes may result in arc damage at
locations remote from the fault where a low resistance path to power ground is found. If these
currents are high enough, damage to the pipe wall is possible. The high current density can cause
molten pits on the pipe surface, resulting in cracks developing when the fault ceases and the pipe
cools, or even burn through. The potential occurrence and consequences of such events can be
significantly minimized or eliminated through appropriate design and/or mitigation measures.
Excessive conductive currents and induced voltages represent a significant localized safety hazard to
personnel working on or testing the pipeline during the fault condition. AC transmission line faults are
typically phase-to-ground faults and are usually caused by lightning, phase insulator failure,
mechanical failure of the phase conductor, or support pole allowing the phase conductor to touch the
ground and transformer failure.
Pipeline corrosion control considerations involving AC transmission lines include coating damage
during faults and accelerated corrosion (even in the presence of cathodically protected DC potentials)
due to high AC current density at coating holidays. Fault current conditions that produce excess
voltages across the coating are of concern for dielectric coatings. The dielectric strength of the coating
is dependent upon a number of factors ranging from coating type and thickness to fault duration.
Guidance on allowable coating stress voltage varies across references. NACE SP0177-20142 indicates
thresholds for coating stress voltages varying from 2 kV for tape wrap and coal tar enamel coatings to
3 to 5 kV for FBE and polyethylene coatings, considering a short-duration fault. However, multiple
industry references have shown higher tolerable limits, especially for thicker coatings such as coal tar
enamel. For reference NACE SP0188-20063 recommends the following equation for calculating
allowable test voltages for holiday detection:
𝑇𝑉 = 1,250√𝑡 (1)
Where:
TV = Test Voltage (V)
t= Average coating thickness in mils
This results in a test voltage of 10,825 volts for a pipeline coated with a 75 mil coal tar coating. For
thicker coatings, the Test Voltage can be approximated from Equation 1. While NACE SP0188-2006
specifically relates to holiday testing, it is referenced for calculating a voltage that will damage various
pipeline coatings as a function of coating thickness.
Puget Sound Energy
AC Interference Analysis – 230 kV Transmission Line Collocated with Olympic Pipelines OPL16 & OPL20
DNV GL – Report No. OAPUS312DKEMP (PP116591)-1, Rev. 0 – www.dnvgl.com Page 8
December 13, 2016
It should be noted that the steady state 15 VAC threshold (in the standards listed above) was
established with personnel safety in mind and not with consideration of corrosion influences. Recent
research and experience has shown that AC accelerated corrosion can occur in low resistivity soils at
AC voltages well below this threshold. The effects of the power transmission line on an adjacent
pipeline are a function of geometry, soil resistivity, coating resistance, and the transmission line
operating parameters. The geometry characteristics include separation, depth of cover (DOC), pipe
diameter, angle between pipeline and transmission line, pole footing design, and phase conductor
spacing and average distance above the ground. These remain constant over the life of the installation.
The coating resistance, power system ground resistance and soil resistivity may change slightly with
the seasonal variations and as the installation ages but remain reasonably constant. The operating
parameters of the transmission line such as phase conductor load, phase balance, voltage, and
available fault current and clearing time also have significant influence on the effects of AC accelerated
corrosion. The individual conductor current load and balance is dynamic and changes significantly with
load requirements and switching surges.
Individual phase conductor currents can vary up to 5% during typical transmission line operation. In
addition to the changes in load during the 24 hour period, there is typically 5%+/- ripple in the
measured AC pipe-to-soil voltage. This ripple has a period cycle much longer than the 60 hertz base
and can be seen with a typical digital multi-meter with a screen update rate of 4 per second.
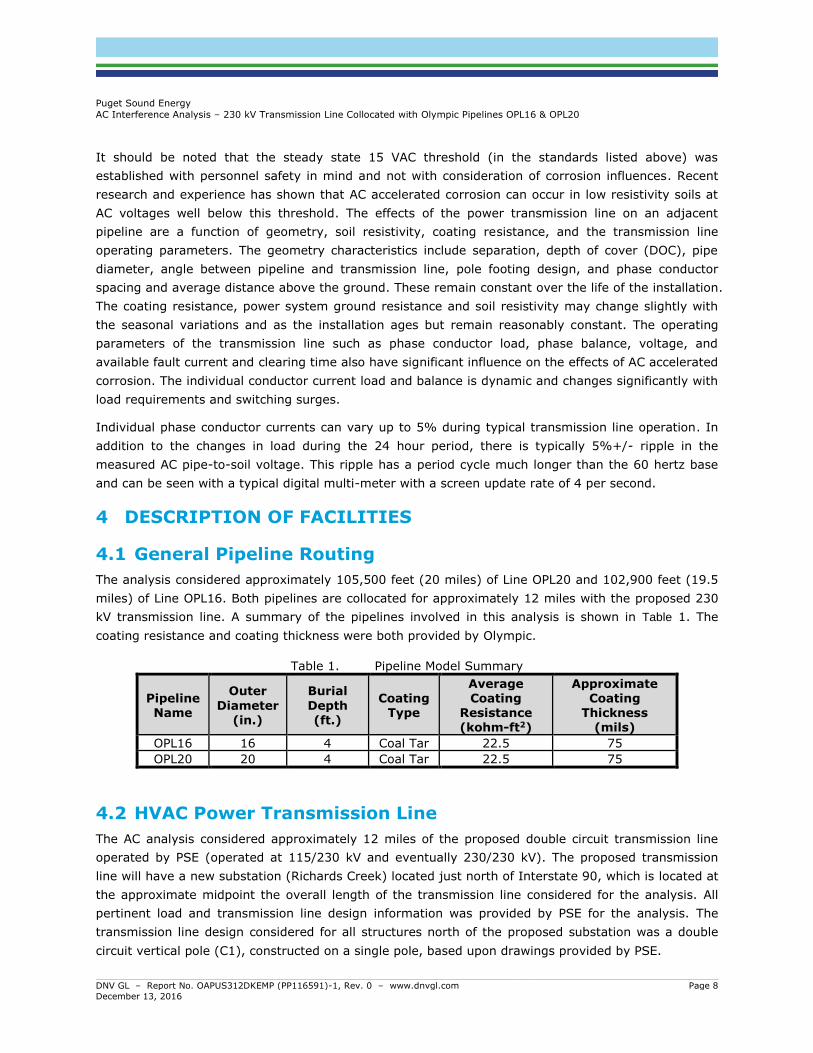
4 DESCRIPTION OF FACILITIES
4.1 General Pipeline Routing
The analysis considered approximately 105,500 feet (20 miles) of Line OPL20 and 102,900 feet (19.5
miles) of Line OPL16. Both pipelines are collocated for approximately 12 miles with the proposed 230
kV transmission line. A summary of the pipelines involved in this analysis is shown in Table 1. The
coating resistance and coating thickness were both provided by Olympic.
Table 1. Pipeline Model Summary
Pipeline Name
Outer
Diameter (in.)
Burial
Depth (ft.)
Coating Type
Average Coating
Resistance (kohm-ft2)
Approximate Coating
Thickness (mils)
OPL16 16 4 Coal Tar 22.5 75
OPL20 20 4 Coal Tar 22.5 75
4.2 HVAC Power Transmission Line
The AC analysis considered approximately 12 miles of the proposed double circuit transmission line
operated by PSE (operated at 115/230 kV and eventually 230/230 kV). The proposed transmission
line will have a new substation (Richards Creek) located just north of Interstate 90, which is located at
the approximate midpoint the overall length of the transmission line considered for the analysis. All
pertinent load and transmission line design information was provided by PSE for the analysis. The
transmission line design considered for all structures north of the proposed substation was a double
circuit vertical pole (C1), constructed on a single pole, based upon drawings provided by PSE.

Puget Sound Energy
AC Interference Analysis – 230 kV Transmission Line Collocated with Olympic Pipelines OPL16 & OPL20
DNV GL – Report No. OAPUS312DKEMP (PP116591)-1, Rev. 0 – www.dnvgl.com Page 9
December 13, 2016
For the two circuits south of the Richards Creek substation, the transmission line circuits would be
mounted on separate structures. Depending on the ROW, varying structure configurations were able
to be used along the corridor. Thus, in an effort to minimize the level of AC interference on the
collocated pipeline segments, several sensitivity studies were conducted to aid in the design and
layout of the transmission line. These sensitivity studies considered the same structure for the entire
corridor (north and south of the substation). In total four (4) sensitivity studies were conducted for
both the Willow 1 and Willow 2 routes considering all C2 structures, all C3 structures, all C16
structures, and all C13 structures. For each sensitivity study, the Winter Peak loads at 230 kV/115 kV
and 230 kV/230 kV ratings were evaluated for the maximum induction and current density on the
pipelines. The varying structure types are shown below Figure 6 while the varying load scenarios are
shown in Table 2 for the projected worst case loading for the year 2028 with the 115/230 kV
configuration while the projected worst case loading for the year 2032 with the 230/230 kV
configuration is shown in Table 3.
Figure 6. Pole Configurations Considered in the AC Analysis
Table 2. Transmission Line Load Summary - 2028
Circuit Voltage (kV)
Loading Scenario
North of Substation South of Substation
West Circuit
(Amps)
East Circuit (Amps)
West Circuit
(Amps)
East Circuit (Amps)
115/230 Winter 75% 452 74 503 921
115/230 Winter Peak 646 106 718 1315
Table 3. Transmission Line Load Summary - 2033
Circuit Voltage (kV)
Loading Scenario
North of Substation South of Substation
West Circuit (Amps)
East Circuit (Amps)
West Circuit (Amps)
East Circuit (Amps)
230/230 Winter 75% 449 407 758 676
230/230 Winter Peak 641 581 1083 966

Puget Sound Energy
AC Interference Analysis – 230 kV Transmission Line Collocated with Olympic Pipelines OPL16 & OPL20
DNV GL – Report No. OAPUS312DKEMP (PP116591)-1, Rev. 0 – www.dnvgl.com Page 10
December 13, 2016
The loading scenarios presented above represent the worst case loading scenarios for the 115 kV and
230 kV configuration and the eventual 230/230 kV loading scenario. The Winter Peak loading
scenarios represent the maximum current loading scenarios the transmission lines are expected to
experience, which is expected to be limited to a week or less per year. The Winter 75% loading
configurations represent the current loads the transmission lines are expected to operate at for the
majority of the time.
5 FIELD TESTING DATA
5.1 Soil Resistivity
Soil resistivity measurements were collected by DNV GL using the Wenner four-electrode method
(ASTM G57) at selected locations along the right-of-way. This test measures the bulk electrical
resistivity of the soil in half hemispheres at a depth equal to the pin spacing. Pin spacings of 2.5, 5,
7.5, and 10 feet were used. The average bulk resistivity to the pipeline depth is one of the controlling
factors in the analysis of HVAC interference. However, the specific resistivity of the soil layer directly
next to the pipe surface is the factor of concern in the corrosion activity (conventional galvanic and AC
assisted). Table 4 below shows the range of the bulk soil resistivity values taken at 32 locations along
the collocation at the average pipe depth. The complete set of soil resistivity measurements is
tabulated and provided in Appendix B.
Table 4. Bulk Soil Resistivity Data Summary
Pipeline Name
Minimum Resistivity (ohm-cm)
Maximum Resistivity (ohm-cm)
Average
Resistivity (ohm-cm)
Average Pipe Burial Depth (ft.)
Bulk Resistivity Depth (ft.)
OPL16 6,607 402,174 101,251 4 5
OPL20 6,607 402,174 100,564 4 5
6 THEORETICAL AC CURRENT DENSITY
In January of 2010, NACE International prepared and published a report entitled “AC Corrosion State-
of-the-Art: Corrosion Rate, Mechanism, and Mitigation Requirements”5, which provides the following
insight on AC corrosion current density.
“In 1986, a corrosion failure on a high-pressure gas pipeline in Germany was attributed to AC
corrosion. This failure initiated field and laboratory investigations that indicated induced AC-enhanced
corrosion can occur on coated steel pipelines, even when protection criteria are met. In addition, the
investigations ascertained that above a minimum AC density, typically accepted levels of cathodic
protection would not control AC-enhanced corrosion. The German AC corrosion investigators’
conclusions can be summarized as follows:
AC-induced corrosion does not occur at AC densities less than 20 A/m2 (1.9 A/ft2).
AC corrosion may or may not occur (is unpredictable) for AC densities between 20 to 100
A/m2 (1.9 to 9.3 A/ft2).
AC corrosion occurs at current densities greater than 100 A/m2 (9.3 A/ft2).”
The AC current density is related to the soil resistivity, the induced voltage and the size of a holiday in
the coating. Additionally, research has indicated the highest corrosion rates occur at holidays with

Puget Sound Energy
AC Interference Analysis – 230 kV Transmission Line Collocated with Olympic Pipelines OPL16 & OPL20
DNV GL – Report No. OAPUS312DKEMP (PP116591)-1, Rev. 0 – www.dnvgl.com Page 11
December 13, 2016
surface areas of one to three square centimeters. Holiday testing during installation of the pipeline
should catch all holidays of this magnitude, but in general smaller holidays could be missed; so the
smallest, or one square centimeter, is considered in calculation of AC current density.
After the pipeline was modeled, a theoretical AC current density at each node was calculated utilizing
the following equation provided in the aforementioned NACE state of the art publication in conjunction
with the data contained in Appendix B.
iac = (8xVac) / (ρ x π x d)
Where:
iac = ac current density (A/m2)
Vac = pipe ac voltage to remote earth (V) ρ = soil resistivity (ohm-m)
π = 3.1416 d = diameter of a circular holiday having a one square centimeter surface area (0.0113 meter)
It should be noted that this analysis is strictly based on the identified parameters and field conditions
can vary significantly. The theoretical AC current density is inversely proportional to the specific soil
resistivity values at the depth of the pipe, as shown in the equation above. As previously mentioned,
theoretical AC current density values less than 20 amps/m2 indicate the likelihood of AC corrosion is
low, while current densities between 20 amps/m2 and 100 amps/m2 indicate that AC corrosion may or
may not occur and is therefore, unpredictable. Current densities greater than 100 amps/m2 indicate
the likelihood of AC corrosion is high.
7 ELSYCA IRIS MODELING
The Elsyca Inductive and Resistive Interference Simulator (IRIS) software is a graphical simulation
platform developed to predict the steady state interference and resistive fault effects of HVAC
transmission lines on buried pipelines in shared ROWs. IRIS uses a transmission line model (TLM) to
calculate longitudinal electrical field (LEF) based on established fundamental Maxwell equations. This
LEF is then utilized to calculate the magnitude of induced AC potential, and current along the
collocated pipelines. Resistive coupling during single or three phase-to-ground fault conditions are
analyzed using a layered boundary element method (BEM) approach, which calculates the ground
potential rise (GPR) and voltage across the coating, as well as touch and step potentials and arcing
distance throughout the collocation.
The geometry and routing of the complete pipeline and transmission line network can be incorporated
in the model without restriction on number of pipelines, transmission lines, or poles. Data is entered
individually for each pipeline and transmission line at discrete nodes with each node’s spacing
generally defining specific HVAC poles, routing changes, pipeline stations, or other points of interest.
Model parameters such as specific pipeline geometry, depth, soil resistivity, pole geometry, pole-to-
earth resistance, conductor sag, and phasing can be input for each node individually and varied
throughout the model. Additionally, all direct or resistive bonds, insulators, and mitigation grounds are
input at the specific nodes. Model refinement is defined by the number of elements connecting each
node. Analysis outputs are calculated at the individual elements between the model nodes allowing for

Puget Sound Energy
AC Interference Analysis – 230 kV Transmission Line Collocated with Olympic Pipelines OPL16 & OPL20
DNV GL – Report No. OAPUS312DKEMP (PP116591)-1, Rev. 0 – www.dnvgl.com Page 12
December 13, 2016
data significantly more refined than the node spacing. For these reasons, IRIS is considered
appropriate for analyzing large pipeline network models, complex with regard to both collocation
geometry and the overall number of interacting transmission lines and pipelines.
7.1 Model Setup
Parameters for the AC interference study are described in section 4.1 and 4.2 and detailed in
appendices A and B. The steady state and fault analyses were performed considering the provided
pole locations, configurations, phasing, and loading conditions. The GPS coordinates of the pipeline
were obtained from As-Built drawings provided by Olympic, while the coordinates for the HVAC
transmission line poles were provided by PSE. This data was used to develop the IRIS model geometry
to enable accurate predictions of induced AC voltage and current levels. As the pipeline and
transmission lines are modeled individually, the geometry layout varies for each pipeline. The total
pipeline network was constructed with appropriate node and element distribution to accurately assess
the induced potential along the collocation.
However, details of the existing cathodic protection system, such as grounding resistance of anode
beds, were not included in the assessment to provide an added level of conservatism. The node and
element layout for the pipelines was identical between the model for the existing 115 kV transmission
lines and the 230 kV upgraded transmission line model.
7.2 Steady State Induced AC Results
7.2.1 Existing Transmission Line Comparison
In an effort to compare the model results to the levels of AC interference on the collocated pipeline
segments at present, the existing transmission line route and configuration was modeled. The existing
115 kV transmission line route is the same corridor that is proposed for the Willow 1 route discussed
previously and is comprised of two single circuit horizontal structures, as shown in Figure 7 below. The
model results were then compared to field measured AC potentials, collected by Olympic via data
loggers along with the date and time at which the measurements were recorded. The locations where
AC potentials were measured were requested by DNV GL based upon expected regions of elevated AC
potentials. PSE then provided the operating currents of the transmission lines for the times at which
the AC potentials were measured in order to provide a direct comparison to the model. In total, 11
sets of AC potential measurements were provided by Olympic: six (6) for OPL16 and five (5) for
OPL20 as indicated below in Figure 7.

Puget Sound Energy
AC Interference Analysis – 230 kV Transmission Line Collocated with Olympic Pipelines OPL16 & OPL20
DNV GL – Report No. OAPUS312DKEMP (PP116591)-1, Rev. 0 – www.dnvgl.com Page 13
December 13, 2016
Figure 7. Existing 115 KV Transmission Line Route and Data Logger Locations
A summary of the field measured AC potentials is shown below in Table 5 and Table 6 for OPL16 and
OPL20, respectively. The AC potential measurements were recorded between 8/24/2016 and
8/26/2016 at approximately 5 minute intervals. In general, the measured AC potentials were fairly low,
with a maximum of 5.6 volts recorded on line OPL20. The average potentials during the time the data
was collected were generally between 1 and 3 volts for all locations where data was collected.
Table 5. Summary of AC Potential Measurements – OPL16
OPL16
Label Measured AC Potential (V) Date Date for
Comparison
AC at Date for
Comparison (V) Min Max Average Start Stop
2 ETS 0.79 3.16 1.69 8/25/2016
14:07
8/26/2016
14:23
8/25/2016
14:00 2.42
3 ETS 1.45 1.45 1.45 8/25/2016
12:50 8/26/2016
13:05 8/25/2016
14:00 1.45
4 ETS 1.52 1.85 1.58 8/25/2016
11:23 8/26/2016
11:53 8/25/2016
14:00 1.68
5 TS 1.49 2.85 2.28 8/24/2016
11:43 8/25/2016
11:55 8/24/2016
16:30 2.56
6 TS 1.60 4.08 2.74 8/24/2016
12:26 8/25/2016
13:23 8/24/2016
16:30 3.75
7 WTS 0.52 0.94 0.73 8/25/2016
9:39 8/26/2016
11:19 8/25/2016
14:00 0.78

Puget Sound Energy
AC Interference Analysis – 230 kV Transmission Line Collocated with Olympic Pipelines OPL16 & OPL20
DNV GL – Report No. OAPUS312DKEMP (PP116591)-1, Rev. 0 – www.dnvgl.com Page 14
December 13, 2016
Table 6. Summary of AC Potential Measurements – OPL20
OPL20
Label Measured AC Potential (V) Date Date for
Comparison
AC at Date for
Comparison (V) Min Max Average Start Stop
1 WTS 1.44 1.61 1.59 8/25/2016
10:37
8/26/2016 12:22
8/25/2016 14:00
1.61
2 TS 1.48 5.63 3.44 8/25/2016
13:55
8/26/2016 14:10
8/25/2016 14:00
4.02
3 WTS 1.58 2.92 2.18 8/25/2016
13:01
8/26/2016 13:13
8/25/2016 14:00
2.41
4 WTS 1.31 2.52 1.73 8/25/2016
11:04
8/26/2016 11:41
8/25/2016 14:00
2.02
7 ETS 0.52 1.08 0.79 8/24/2016
9:16
8/25/2016 9:21
8/24/2016 16:30
1.07
When comparing the model results to field measured AC potentials, it is important to understand the
variables which affect AC induction on pipelines. As explained above, the effects of the power
transmission line on an adjacent pipeline are a function of geometry, soil resistivity, coating
resistance, and the transmission line operating parameters. The geometry characteristics include
separation distance, depth of cover (DOC), pipe diameter, angle between the pipeline and
transmission line, phase conductor spacing and distance above ground. These geometry
characteristics remain reasonably constant over time, with the exception being the construction of
new transmission lines or modifications of existing transmission lines in the corridor. The coating
resistance and soil resistivity may change with the seasonal variations and as the installation ages,
providing another source of variability. The operating parameters of the transmission line such as
phase conductor load and phase balance (i.e. the current load between the phases of each circuit)
have a significant influence on the induced AC potentials on the collocated pipeline segments. The
individual current load and balance is dynamic and changes significantly with load requirements and
switching surges with the power system.
There was not a single date/time where potentials were available at all data logger locations, thus the
model was analyzed at two different loads corresponding to 8/25/2016 at 14:00 (blue highlighted cells
above) and 8/24/2016 at 16:30 (magenta highlighted cells above). The far right column, labeled AC at
Date for Comparison (V), in Table 5 and Table 6 above was the AC potential measurement
corresponding to the date and times previously mentioned. This was the field measurement used
when comparing the Induced AC model results at the corresponding transmission line loads.
The model results along with the field measured AC potentials are shown below in Figure 8 and Figure
9. All figures are plotted with respect to the model number on the horizontal axis. The pipelines were
modeled starting at the north end, thus the pipeline nodes are ascending in a north to south direction.
Further, the location of the Richards Creek substation along the collocation is marked with vertical
lines on all plots to provide a further sense of location along the corridor. The blue curve corresponds
to the model results from the transmission line operating loads from 8/25/2016 at 14:00 while the

Puget Sound Energy
AC Interference Analysis – 230 kV Transmission Line Collocated with Olympic Pipelines OPL16 & OPL20
DNV GL – Report No. OAPUS312DKEMP (PP116591)-1, Rev. 0 – www.dnvgl.com Page 15
December 13, 2016
magenta curve corresponds to the model results at the operating loads from 8/24/2016 at 16:30. The
field measured AC potential symbols are colored accordingly based upon the proper AC model results
for comparison.
Figure 8. Model Results Compared to Field Measured AC Potentials – OPL16
2 ETS
3 ETS4 ETS
5 TS
6 TS
7 WTS
0
1
2
3
4
5
0 50 100 150 200 250
Ind
uce
d A
C P
ote
nti
al (
V)
Model Node Number
Induced AC VoltageOPL16 - Existing 115 kV Transmission Line Structures
OPL16 8-25-16 14:00 OPL16 8-24-16 16:30 Substation Field Reading

Puget Sound Energy
AC Interference Analysis – 230 kV Transmission Line Collocated with Olympic Pipelines OPL16 & OPL20
DNV GL – Report No. OAPUS312DKEMP (PP116591)-1, Rev. 0 – www.dnvgl.com Page 16
December 13, 2016
Figure 9. Model Results Compared to Field Measured AC Potentials – OPL20
Based upon the variables discussed above, the model results show generally very good agreement
with the field measured AC potentials for both lines OPL16 and OPL20 with similar trends in AC
potential trends along the collocation as well as overall magnitude. This indicates the model is
predicting AC interference levels similar to those measured in the field along the corridor.
7.2.2 Sensitivity Studies
The steady state model was analyzed considering various loading scenarios, pole configurations, and
transmission line routes, as discussed previously. For the majority of the sensitivity studies, a single
pole configuration was applied along the entire transmission line route for each circuit in the model.
The maximum induced AC potential and AC current density results were then recorded for several
regions along the pipeline, corresponding to specific transmission line segments along the corridor.
The segment names and the corresponding location along the transmission line route are shown below
in Figure 10.
1 WTS
2 TS
3 WTS4 WTS
7 ETS
0
1
2
3
4
5
6
0 50 100 150 200 250 300
Ind
uce
d A
C P
ote
nti
al (
V)
Model Node Number
Induced AC VoltageOPL20 - Existing 115 kV Transmission Line Structures
OPL20 8-25-16 14:00 OPL20 8-24-16 16:30
Substation Field Reading

Puget Sound Energy
AC Interference Analysis – 230 kV Transmission Line Collocated with Olympic Pipelines OPL16 & OPL20
DNV GL – Report No. OAPUS312DKEMP (PP116591)-1, Rev. 0 – www.dnvgl.com Page 17
December 13, 2016
Figure 10. Map of Transmission Line Segments for Presentation of AC Model Sensitivity Study Results
A summary of the results for the various sensitivity studies are shown below in Table 7 with the Load
Scenario corresponding to the operating current magnitudes listed in Table 2. The pole configuration
corresponds to those shown in Figure 6. For each sensitivity study, these poles were used for the
entire corridor which was being studied (i.e. Willow 1 or Willow 2). The pole structure location
corresponds to the segments displayed in Figure 10 above. All sensitivity studies were performed for
either the Willow 1 or Willow 2 route as noted in the transmission line route column. The Oak 1 and
Oak 2 routes were considered, though not explicitly modeled in this study. The Oak 1 and Oak 2
routes are similar to the Willow 2 routes, with an extended collocation length with OPL20. Thus it is
expected that the AC interference levels resulting from the Oak 1 and Oak 2 routes would be higher
than the Willow 2 route, which was analyzed as part of this study. The Low Profile poles were not
assessed for the entire collocation as part of these sensitivity studies, as the design intent for these
poles was only for a short segment of the Willow 2 route. Additionally, based upon the configuration
and lower height of the conductors, relative to the other pole configurations, it was expected that the
low profile pole configuration would result in higher levels of AC interference on the pipelines, and thus
their use along the collocation was minimized. The results shown below for the Low Profile poles were
obtained from the optimized Willow 2 route, discussed below in Section 7.2.4.

Puget Sound Energy
AC Interference Analysis – 230 kV Transmission Line Collocated with Olympic Pipelines OPL16 & OPL20
DNV GL – Report No. OAPUS312DKEMP (PP116591)-1, Rev. 0 – www.dnvgl.com Page 18
December 13, 2016
Table 7. Sensitivity Study Description and Results Summary
Structure Load
Scenario Pole Structure
Location
Maximum Induced AC Potential (V)
Maximum Theoretical AC Current Density
(Amps/m2)
OPL16 OPL20 OPL16 OPL20
C2 230/115
Winter Peak Renton Segment 9 14 3 27
C2 230/230
Winter Peak Renton Segment 6 3 2 1
C2 230/115
Winter Peak Bellevue South Segment
– Willow 1 Option 19 10 26 17
C2 230/230
Winter Peak Bellevue South Segment
– Willow 1 Option 4 4 13 10
C13 230/115
Winter Peak Renton Segment 17 18 5 6
C13 230/230
Winter Peak Renton Segment 18 18 6 5
C13 230/115
Winter Peak
Bellevue South – Willow 1 Option & Newcastle
Segment
13 16 18 31
C13 230/230
Winter Peak
Bellevue South – Willow 1 Option & Newcastle
Segment
12 17 22 34
C16 230/115
Winter Peak Renton Segment 7 9 2 3
C16 230/230
Winter Peak Renton Segment 5 6 1 2
C16 230/115
Winter Peak
Bellevue South – Willow 1 Option, Newcastle &
Renton Segments
9 9 11 10
C16 230/230
Winter Peak
Bellevue South – Willow 1 Option, Newcastle &
Renton Segments
6 6 14 7
Low Profile* 230/115
Winter Peak Bellevue South Segment
– Willow 2 Option 10 - 47 -
Low Profile* 230/230
Winter Peak Bellevue South Segment
– Willow 2 Option 11 - 52 -
C2 230/115
Winter Peak Bellevue South Segment
– Willow 2 Option 22 24 74 47
C2 230/230
Winter Peak Bellevue South Segment
– Willow 2 Option 18 18 83 71
*Results for the Low Profile Structures were obtained from the Optimized Willow 2 Route Configurations

Puget Sound Energy
AC Interference Analysis – 230 kV Transmission Line Collocated with Olympic Pipelines OPL16 & OPL20
DNV GL – Report No. OAPUS312DKEMP (PP116591)-1, Rev. 0 – www.dnvgl.com Page 19
December 13, 2016
For both the Willow 1 and Willow 2 routes, due to complexities along the ROW and construction
limitations, the same pole configuration cannot be used along the entire corridor. Considering these
limitations, the results of the sensitivity studies were used to design pole configurations along the
Willow 1 and Willow 2 corridors, which would result in an optimized, reduced level of AC interference
on the collocated pipeline segments. Based upon the outcomes of the sensitivity studies discussed
above, two additional simulations were performed using an optimized pole configuration along the
Willow 1 and Willow 2 routes. In each case, the structures vary along the collocation, in an effort to
minimize induced AC potentials and theoretical AC current density. The details of these analyses are
discussed in further detail below.
7.2.3 Willow 1 Optimized Pole Configurations
The Willow 1 route for this study was comprised of C1 and C16 structures as shown below in Figure 11.
All structures north of the proposed Richards Creek substation are a double circuit vertical pole
configuration (C1), as indicated below and detailed in Figure 6 above. A combination of C1 and C16
structures were used south of the proposed substation.
Figure 11. Willow 1 Transmission Line Route with C1 and C16 Structures
The transmission line route and corresponding structures, as noted above, were included in the model
and the analysis was performed considering the same 230 kV/115 kV and 230 kV/230 kV Winter Peak

Puget Sound Energy
AC Interference Analysis – 230 kV Transmission Line Collocated with Olympic Pipelines OPL16 & OPL20
DNV GL – Report No. OAPUS312DKEMP (PP116591)-1, Rev. 0 – www.dnvgl.com Page 20
December 13, 2016
loads discussed previously. The model results are displayed in a similar fashion to those for the
existing transmission line structures above. The NACE 15 volt threshold is indicated with a red dashed
line while the goal AC potential to satisfy a theoretical AC current density of 20 amps/m2 or less is
shown in orange. The model results corresponding to the 230 kV/115 kV Winter Peak loads are
represented by the blue curve, while the 230 kV/230 kV model results are represented by the pink
curve. The model results for the optimized Willow 1 Route structures are shown below in the following
sections for OPL16 and OPL20.
Line OPL16 Model Results
The model results for Induced AC potential and theoretical AC current density are shown below in
Figure 12 and Figure 13.
Figure 12. OPL16 Induced AC Potential Model Results for Willow 1 Route with Optimized Configurations
0
2
4
6
8
10
12
14
16
18
20
0 50 100 150 200 250
Ind
uce
d A
C P
ote
nti
al (
V)
Model Node Number
Induced AC VoltageOPL16 Willow 1 Optimized Configurations
OPL16 Willow1 Optimized 230-115 Winter Peak OPL16 Willow1 Optimized 230-230 Winter Peak
Current Density Goal (V) NACE 15V Threshold
Substation

Puget Sound Energy
AC Interference Analysis – 230 kV Transmission Line Collocated with Olympic Pipelines OPL16 & OPL20
DNV GL – Report No. OAPUS312DKEMP (PP116591)-1, Rev. 0 – www.dnvgl.com Page 21
December 13, 2016
Figure 13. OPL16 Theoretical AC Current Density Results for Willow 1 Route with Optimized Configurations
Considering the 230 kV/115 kV Winter Peak operating loads, the maximum induced AC potential along
the collocation was 16 volts, which is greater than the NACE 15 volt safety threshold. Under the same
loading conditions, the maximum theoretical AC current density along the collocation was
approximately 24 amps/m2. This is greater than the current density threshold of 20 amps/m2,
indicating the likelihood of accelerated AC corrosion is unpredictable. As discussed previously, the
Winter Peak loading scenario was the worst case loading scenario for the proposed transmission line
configuration which the lines will operate at for a limited time throughout the year.
Considering the 230 kV/230 kV Winter Peak operating loads, the maximum induced AC potential along
the collocation was approximately 5 volts, which is less than the NACE 15 volt safety threshold. Under
the same loading conditions, the maximum theoretical AC current density along the collocation was
approximately 14 amps/m2. This is less than the current density threshold of 20 amps/m2, indicating
the likelihood of accelerated AC corrosion is low. The balanced loading of the 230/230 kV configuration
is the principal factor that reduces the AC potential and theoretical AC current density when compared
to the 115/230 kV loading scenario. Additionally, following the Willow 1 route, using the optimized
pole configurations with the 230/230 kV loading scenario resulted in the least induced AC potential
and theoretical AC current density for OPL16.
0
5
10
15
20
25
0 50 100 150 200 250
Cu
rre
nt
De
nsi
ty (
amp
s/m
2)
Model Node Number
Estimated AC Current Density (amps/m²)OPL16 Willow 1 Optimized Configurations
OPL16 Willow1 Optimized 230-115 Winter Peak OPL16 Willow1 Optimized 230-230 Winter Peak
Current Density Criteria Substation

Puget Sound Energy
AC Interference Analysis – 230 kV Transmission Line Collocated with Olympic Pipelines OPL16 & OPL20
DNV GL – Report No. OAPUS312DKEMP (PP116591)-1, Rev. 0 – www.dnvgl.com Page 22
December 13, 2016
Line OPL20 Model Results
The model results for Induced AC potential and theoretical AC current density are shown below in
Figure 14 and Figure 15.
Figure 14. OPL20 Induced AC Potential Model Results for Willow 1 Route with Optimized Configurations
0
2
4
6
8
10
12
14
16
18
20
0 50 100 150 200 250 300
Ind
uce
d A
C P
ote
nti
al (
V)
Model Node Number
Induced AC VoltageOPL20 Willow 1 Optimized Configurations
OPL20 Willow1 Optimized 230-115 Winter Peak OPL20 Willow1 Optimized 230-230 Winter PeakCurrent Density Goal (V) NACE 15V ThresholdSubstation

Puget Sound Energy
AC Interference Analysis – 230 kV Transmission Line Collocated with Olympic Pipelines OPL16 & OPL20
DNV GL – Report No. OAPUS312DKEMP (PP116591)-1, Rev. 0 – www.dnvgl.com Page 23
December 13, 2016
Figure 15. OPL20 Theoretical AC Current Density Results for Willow 1 Route with Optimized Configurations
Considering the 230 kV/115 kV Winter Peak operating loads, the maximum induced AC potential along
the collocation was approximately 11 volts, which is less than the NACE 15 volt safety threshold.
Under the same loading conditions, the maximum theoretical AC current density along the collocation
was approximately 14 amps/m2. This is less than the current density threshold of 20 amps/m2,
indicating the likelihood of accelerated AC corrosion is low. As discussed previously, the Winter Peak
loading scenario was the worst case loading scenario for the proposed transmission line configuration
which the lines will operate at for a limited time throughout the year
Considering the 230 kV/230 kV Winter Peak operating loads, the maximum induced AC potential along
the collocation was approximately 7 volts, which is less than the NACE 15 volt safety threshold. Under
the same loading conditions, the maximum theoretical AC current density along the collocation was
approximately 9 amps/m2. This is less than the current density threshold of 20 amps/m2, indicating
the likelihood of accelerated AC corrosion is low. The balanced loading of the 230/230 kV configuration
is the principal factor that reduces the AC potential and theoretical AC current density when compared
to the 115/230 kV loading scenario. Additionally, following the Willow 1 route, using the optimized
pole configurations with the 230/230 kV loading scenario resulted in the least induced AC potential
and theoretical AC current density for OPL20.
0
5
10
15
20
25
0 50 100 150 200 250 300
Cu
rre
nt
De
nsi
ty (
amp
s/m
2)
Model Node Number
Estimated AC Current Density (amps/m²)OPL20 Willow 1 Optimized Configurations
OPL20 Willow1 Optimized 230-115 Winter Peak OPL20 Willow1 Optimized 230-230 Winter Peak
Current Density Criteria Substation

Puget Sound Energy
AC Interference Analysis – 230 kV Transmission Line Collocated with Olympic Pipelines OPL16 & OPL20
DNV GL – Report No. OAPUS312DKEMP (PP116591)-1, Rev. 0 – www.dnvgl.com Page 24
December 13, 2016
7.2.4 Willow 2 Optimized Pole Configurations
The Willow 2 route for this study was similar to the Willow 1 route presented above with the primary
difference being the transmission line route near the proposed 230 kV substation (Richards Creek).
This region is comprised of varying C1, C2, Low Profile, and C16 structures as shown below in Figure
16. The structures north and south of this region are the same as the Willow 1 route discussed in
section 7.2.3.
Figure 16. Willow 2 Transmission Line Route with C1, C2, Low Profile, and C16 Structures
The transmission line route and corresponding structures, as noted above, were included in the model
and the analysis was performed considering the same 230 kV/115 kV and 230 kV/230 kV Winter Peak
loads discussed previously. The model results are displayed in a similar fashion to those presented for
the Willow 1 optimized pole configuration study. The model results for the revised Willow 2 Route
structures are shown below in the following sections for OPL16 and OPL20.

Puget Sound Energy
AC Interference Analysis – 230 kV Transmission Line Collocated with Olympic Pipelines OPL16 & OPL20
DNV GL – Report No. OAPUS312DKEMP (PP116591)-1, Rev. 0 – www.dnvgl.com Page 25
December 13, 2016
Line OPL16 Model Results
The model results for Induced AC potential and theoretical AC current density are shown below in
Figure 17 and Figure 18.
Figure 17. OPL16 Induced AC Potential Model Results for Willow 2 Route with Optimized Configurations
0
4
8
12
16
20
0 50 100 150 200 250
Ind
uce
d A
C P
ote
nti
al (
V)
Model Node Number
Induced AC VoltageOPL16 Willow 2 Optimized Configurations
OPL16 Willow2 Optimized 230-115 Winter Peak OPL16 Willow2 Optimized 230-230 Winter Peak
Current Density Goal (V) NACE 15V Threshold
Substation

Puget Sound Energy
AC Interference Analysis – 230 kV Transmission Line Collocated with Olympic Pipelines OPL16 & OPL20
DNV GL – Report No. OAPUS312DKEMP (PP116591)-1, Rev. 0 – www.dnvgl.com Page 26
December 13, 2016
Figure 18. OPL16 Theoretical AC Current Density Results for Willow 2 Route with Optimized Configurations
Considering the 230 kV/115 kV Winter Peak operating loads, the maximum induced AC potential along
the collocation was approximately 17 volts, which is greater than the NACE 15 volt safety threshold.
Under the same loading conditions, the maximum theoretical AC current density along the collocation
was approximately 50 amps/m2. This is greater than the current density threshold of 20 amps/m2,
indicating the likelihood of accelerated AC corrosion is unpredictable. As discussed previously, the
Winter Peak loading scenario was the worst case loading scenario for the proposed transmission line
configuration which the lines will operate at for a limited time throughout the year.
Considering the 230 kV/230 kV Winter Peak operating loads, the maximum induced AC potential along
the collocation was approximately 11 volts, which is less than the NACE 15 volt safety threshold.
Under the same loading conditions, the maximum theoretical AC current density along the collocation
was approximately 55 amps/m2. This is greater than the current density threshold of 20 amps/m2,
indicating the likelihood of accelerated AC corrosion is unpredictable.
0
10
20
30
40
50
60
0 50 100 150 200 250
Cu
rre
nt
De
nsi
ty (
amp
s/m
2)
Model Node Number
Estimated AC Current Density (amps/m²)OPL16 Willow 2 Optimized Configurations
OPL16 Willow2 Optimized 230-115 Winter Peak OPL16 Willow2 Optimized 230-230 Winter Peak
Current Density Criteria Substation

Puget Sound Energy
AC Interference Analysis – 230 kV Transmission Line Collocated with Olympic Pipelines OPL16 & OPL20
DNV GL – Report No. OAPUS312DKEMP (PP116591)-1, Rev. 0 – www.dnvgl.com Page 27
December 13, 2016
Line OPL20 Model Results
The model results for Induced AC potential and theoretical AC current density are shown below in
Figure 19 and Figure 20.
Figure 19. OPL20 Induced AC Potential Model Results for Willow 2 Route with Optimized Configurations
0
2
4
6
8
10
12
14
16
18
20
0 50 100 150 200 250 300
Ind
uce
d A
C P
ote
nti
al (
V)
Model Node Number
Induced AC VoltageOPL20 Optimized Configurations
OPL20 Willow2 Optimized 230-115 Winter Peak OPL20 Willow2 Optimized 230-230 Winter PeakCurrent Density Goal (V) NACE 15V ThresholdSubstation

Puget Sound Energy
AC Interference Analysis – 230 kV Transmission Line Collocated with Olympic Pipelines OPL16 & OPL20
DNV GL – Report No. OAPUS312DKEMP (PP116591)-1, Rev. 0 – www.dnvgl.com Page 28
December 13, 2016
Figure 20. OPL20 Theoretical AC Current Density Results for Willow 2 Route with Optimized Configurations
Considering the 230 kV/115 kV Winter Peak operating loads, the maximum induced AC potential along
the collocation was approximately 19 volts, which is greater than the NACE 15 volt safety threshold.
Under the same loading conditions, the maximum theoretical AC current density along the collocation
was approximately 43 amps/m2. This is greater than the current density threshold of 20 amps/m2,
indicating the likelihood of accelerated AC corrosion is unknown. As discussed previously, the Winter
Peak loading scenario was the worst case loading scenario for the proposed transmission line
configuration which the lines will operate at for a limited time throughout the year.
Considering the 230 kV/230 kV Winter Peak operating loads, the maximum induced AC potential along
the collocation was approximately 18 volts, which is greater than the NACE 15 volt safety threshold.
Under the same loading conditions, the maximum theoretical AC current density along the collocation
was approximately 69 amps/m2. This is greater than the current density threshold of 20 amps/m2,
indicating the likelihood of accelerated AC corrosion is unpredictable.
0
10
20
30
40
50
60
70
0 50 100 150 200 250 300
Cu
rre
nt
De
nsi
ty (
amp
s/m
2)
Model Node Number
Estimated AC Current Density (amps/m²)OPL20 Willow 2 Optimized Configurations
OPL20 Willow2 Optimized 230-115 Winter Peak OPL20 Willow2 Optimized 230-230 Winter Peak
Current Density Criteria Substation

Puget Sound Energy
AC Interference Analysis – 230 kV Transmission Line Collocated with Olympic Pipelines OPL16 & OPL20
DNV GL – Report No. OAPUS312DKEMP (PP116591)-1, Rev. 0 – www.dnvgl.com Page 29
December 13, 2016
8 FAULT VOLTAGE AND CURRENT RESULTS
In addition to the sensitivity studies related to induced AC analysis presented above, several
sensitivity studies were performed with regards to the fault analysis whereby the effects of fault
currents, shield wire configurations, and pole configurations were evaluated to determine the pipelines’
susceptibility to damage, resulting from a fault incident. For each fault sensitivity study, a single line-
to-ground fault was considered at multiple locations south along the collocation. The resulting coating
stress voltage (voltage across the coating) on the pipeline was compared for the C1, C2, C3, and Low
Profile pole configurations, which showed for the same magnitude of fault current, the C2 and C3 pole
configurations resulted in the same coating stress voltages. Thus for the resistive fault simulation, as
the C2 and C3 poles were both single pole configurations, the coating stress voltage was the same in
each case. Based upon these results, a separate fault sensitivity study was not performed for the C16
structures, as the coating stress voltages were expected to be similar to the C2 and C3 structures. For
the Low profile structures, as they are comprised of two poles, the resulting coating stress voltage is
different, considering the same fault current.
A fault current value of 25 kA was used in this study, which is based on the maximum transmission
system fault current that could be experienced in the portions of the corridor where the pipelines are
co-located. The scenarios that were analyzed to arrive at 25 kA include a bus fault at the Sammamish,
the proposed Richards Creek, and Talbot Hill substations. The Olympic Pipelines first enter the PSE
transmission corridor approximately 3 miles north of the Talbot Hill substation, which was accounted
for in the calculation of fault current present at that location. Using a fault current of 25 kA the
sensitivity studies were analyzed with no shield wire, an Alumoweld shield wire, and an Optical Ground
Wire (OPGW). The same four poles were considered for the C1, C2, and C3 studies where the two
closest poles north and south of the substation were faulted in the analysis. For each case, the
maximum coating stress voltage and maximum arcing distance were calculated. A summary of the
fault model sensitivity studies is presented below in Table 8.
Table 8. Coating Stress Voltage Summary
Coating Stress Voltage (Volts) Resulting from 25 kA Fault Current
Fault Scenario
Pole Number
Pole Configuration
No Shield Wire Alumoweld OPGW
FC1 16 C1 18,840 3,219 2,833
FC2 48 C1 55,170 7,902 5,970
FC3 179 C2/C3 44,850 6,297 3,447
FC4 46 C2/C3 20,010 2,826 1,517
FC5 100 Low Profile - 2,595 1,637
FC6 106 Low Profile - 1,931 2,097
FC7 108 Low Profile - 2,560 2,428
Information provided by Olympic indicated lines OPL16 and OPL20 are both primarily coated with Coal
Tar Enamel, which Olympic indicated an approximate coating thickness of 75 mils. This equates to an
approximate coating breakdown voltage of 10,825 volts (per Equation 1 in section 3). The coating
stress voltages decrease dramatically when a shield wire is used, as the primary function of the shield

Puget Sound Energy
AC Interference Analysis – 230 kV Transmission Line Collocated with Olympic Pipelines OPL16 & OPL20
DNV GL – Report No. OAPUS312DKEMP (PP116591)-1, Rev. 0 – www.dnvgl.com Page 30
December 13, 2016
wire is to provide a low resistance path to carry the majority of the fault current to ground. In the
absence of a shield wire, the total fault current (in this case 25 kA) returns to ground at a single
location. The OPGW resulted in the lowest overall coating stress voltage while the faulted poles with
the low profile pole configuration showed an overall lower coating stress voltage than the worst case
faulted poles considering the C1, C2, or C3 pole configurations.
Based upon the data provided, the coating stress voltage for both pipelines is expected to be less than
the coating breakdown voltage as long as an Alumoweld or OPGW shield wire is used on the
transmission line poles. As discussed previously, the resulting coating stress voltages for the C16 pole
configuration are expected to be similar to the C2 and C3 results as poles are similar.
The maximum arcing distance for each region was obtained using the maximum soil resistivity and the
maximum fault current for each region.
Table 9. Arcing Distance Summary
Pole
Configuration Scenario
Fault Current
(kA)
Maximum Return Current
to Ground (Amps)
Maximum Soil Resistivity (Ohm-m)
Maximum Arcing
Distance (ft)
C1 and C2/C3 No Shield
Wire 25 25,000 4021.74 42
C1 and C2/C3 Alumoweld 25 3,805 4021.74 17
C1 and C2/C3 OPGW 25 2,207 4021.74 13
Low Profile Alumoweld 25 1,109 4021.74 10
Low Profile OPGW 25 602 4021.74 7
Due to the close proximity of the pipeline and transmission line poles along the collocation, there are
several poles which are within the maximum arcing distance. With a fault current level of 25 kA, PSE
will include a shield wire using OPGW on the pole structures. The initial screening for the arcing
distance was based upon the maximum soil resistivity for the collocation, which would result in the
maximum arcing distance. Considering the poles within the maximum arcing distance of 13 feet
(considering a fault current of 25 kA and an OPGW shield wire) the local soil resistivity ranged from 66
ohm-m to 3,256 ohm-m. Considering the local soil resistivity along the collocation, the resulting arcing
distances range from 4 ft to 13 ft at these pole locations. Due to variation in soil resistivity, and lack of
precision related to the pipeline location relative to the proposed transmission line poles, in those
areas where the transmission poles are proposed within 13 feet of the pipeline, the following is
recommended:
Distances between the pipeline and transmission line pole grounds should be field verified by
the transmission line and pipeline operators.
If the transmission line pole grounds are found to be within 13 feet of the pipeline, Arc
shielding protection should be installed, consisting of a single zinc ribbon extending a
minimum of 25 feet past the transmission line pole grounds in both directions. The zinc ribbon
should be connected to the pipeline through a single direct-current decoupler (DCD).

Puget Sound Energy
AC Interference Analysis – 230 kV Transmission Line Collocated with Olympic Pipelines OPL16 & OPL20
DNV GL – Report No. OAPUS312DKEMP (PP116591)-1, Rev. 0 – www.dnvgl.com Page 31
December 13, 2016
9 CONCLUSIONS AND RECOMMENDATIONS
During the course of the study, three principle factors were identified to have a significant effect on
the level of AC interference on the collocated pipeline segments:
Current load unbalance between the two circuits as a result of operating at 115 kV/ 230 kV.
Points of divergence between the transmission line and pipeline along the corridor (i.e. where
the respective utilities enter and exit the shared corridor).
Conductor geometry, where a true delta configuration provided the greatest level of field
cancellation.
The following conclusions and recommendations are provided based on the Elsyca Iris software, NACE
standards, and other common industry practices.
The model results for the steady state induced AC analysis indicated the following and are
summarized in Table 10. For both loading scenarios and optimized route configurations, the
maximum theoretical AC current density was less than 100 amps/m2, indicating that the
likelihood for accelerated AC corrosion is in the low or unpredictable range (0-20 amps/m2 and
20-100 amps/m2, respectively.
Table 10. Conclusion Summary: Optimized Willow 1 and 2 Route Results
Route
(Optimized Configuration)
Load Scenario
Maximum Induced AC
Potential (V) Maximum Theoretical AC Current
Density (Amps/m2)
OPL16 OPL20 OPL16 OPL20
Willow 1 230/230 Winter
Peak D D L L
Willow 1 230/115 Winter
Peak E D U L
Willow 2 230/230 Winter
Peak D E U U
Willow 2 230/115 Winter
Peak E E U U
Induced AC Potential: D – Does not exceed 15V safety limit, E – Exceed 15V safety limits
Current Density: L – Low risk range, U – Unpredictable risk range
Yellow: Requires additional post-construction monitoring and/or mitigation by the pipeline operator to verify that safety
standards and/or thresholds are met.
o The Optimized Willow 1 route presented in section 7.2.3 indicated maximum induced
AC potentials and theoretical AC current densities are less than 15 volts and the 20
amps/m2 level (low likelihood of AC corrosion) for the 230 kV/230 kV Winter Peak
Loads for both lines OPL16 and OPL20. This configuration resulted in the lowest

Puget Sound Energy
AC Interference Analysis – 230 kV Transmission Line Collocated with Olympic Pipelines OPL16 & OPL20
DNV GL – Report No. OAPUS312DKEMP (PP116591)-1, Rev. 0 – www.dnvgl.com Page 32
December 13, 2016
induced AC potentials and theoretical AC current densities of the scenarios which were
studied.
Considering the 230 kV/115 kV loading scenario, the maximum induced AC
potential for OPL16 was approximately 16 volts, which is greater than the
NACE 15 volt safety threshold. Based upon the model results, after the
transmission lines are energized, field monitoring and/or mitigation by the
pipeline operator may be needed to confirm these AC potentials are less than
the 15 volt safety threshold.
Considering the 230 kV/115 kV loading scenario, the maximum theoretical AC
current density was approximately 24 amps/m2 on line OPL16, which is
greater than the 20 amps/m2 current density threshold, indicating the
likelihood of accelerated AC corrosion is unpredictable. After the transmission
lines are energized, field monitoring and/or mitigation by the pipeline
operation may be needed to confirm these current density levels are at
acceptable levels.
o The Optimized Willow 2 route presented in section 7.2.4 indicated:
Maximum induced AC potentials did not exceed the 15 volt safety threshold for
the 230 kV/230 kV Winter Peak Loads for line OPL16. The maximum
theoretical AC current density was between 20 amps/m2 and 100 amps/m2,
indicating the likelihood of accelerated AC corrosion is unpredictable.
Considering the 230 kV/230 kV Winter Peak loading scenario, the maximum
induced AC potential for OPL20 was approximately 18 volts, which is greater
than the NACE 15 volt safety threshold. Based upon the model results, after
the transmission lines are energized, field monitoring and/or mitigation by the
pipeline operator may be needed to confirm these AC potentials are less than
the 15 volt safety threshold.
Under the same loading scenario, the theoretical AC current densities
were approximately 55 amps/m2 and 70 amps/m2 for OPL16 and
OPL20, respectively. This is greater than the 20 amps/m2 current
density threshold, indicating the likelihood of AC corrosion is
unpredictable. After the transmission lines are energized, field
monitoring and/or mitigation by the pipeline operator may be needed
to confirm these current density levels are at acceptable levels.
Considering the 230 kV/115 kV loading scenario, the maximum induced AC
potential for OPL16 and OPL20 was approximately 17 volts and 19 volts,
respectively, which is greater than the NACE 15 volt safety threshold. Based
upon the model results, after the transmission lines are energized field
monitoring and/or mitigation by the pipeline operator may be needed to
confirm these AC potentials are less than the 15 volt safety threshold.

Puget Sound Energy
AC Interference Analysis – 230 kV Transmission Line Collocated with Olympic Pipelines OPL16 & OPL20
DNV GL – Report No. OAPUS312DKEMP (PP116591)-1, Rev. 0 – www.dnvgl.com Page 33
December 13, 2016
Under the same loading scenario, the theoretical AC current densities
were approximately 50 amps/m2 and 43 amps/m2 for OPL16 and
OPL20, respectively. This is greater than the 20 amps/m2 current
density threshold, indicating the likelihood of AC corrosion is
unpredictable. After the transmission lines are energized, field
monitoring and/or mitigation by the pipeline operator may be needed
to confirm these current density levels are at acceptable levels.
The results of the fault analysis sensitivity studies are summarized in Table 8.
o Considering the expected fault current of 25 kA, the maximum coating stress voltage
for the Alumoweld and OPGW shield wire types were less than the expected coating
breakdown voltage for Coal Tar coating on both pipelines, indicating the risk of fault
damage from a fault incident is low.
o For the studies where no shield wire was included, the coating stress voltage far
exceeded the expected coating stress voltage, indicating the likelihood of damage
resulting from a fault incident is high.
Using the results of the fault analysis, the results of the corresponding arcing distance studies
are summarized in Table 9.
o For cases where the pipeline(s) are found to be located within 13 feet of the
transmission line pole grounds, arc shielding protection may be needed to reduce the
risk of damage from a fault incident. Arc shielding mitigation typically consists of a
single zinc ribbon, extending at a minimum of 25 feet past the transmission line pole
grounds in both directions, connected to the pipeline through a single DCD.
9.1 General Recommendations
The following general recommendations are suggested:
Based upon the AC interference modelling and considering certain conductor geometries,
operational voltages, and routing, the AC interference effects on the collocated pipeline
segments can be reduced to a level that satisfies acceptable industry thresholds for safety and
accelerated AC corrosion.
After the transmission lines are energized, field monitoring and/or mitigation may be need (to
be performed by the pipeline operator) for those loading scenarios where the AC potential is
greater than 15 volts and the AC current density is greater than 20 A/m2.
Pipeline technicians should understand the hazards and safe practices associated with cathodic
protection and AC mitigation when working with these sections of pipeline.
It is recommended that AC pipe-to-soil potentials be recorded along with the DC pipe-to-soil
potentials during the annual cathodic protection survey. This can provide information, should
unexpected changes occur between the pipeline and transmission line.

Puget Sound Energy
AC Interference Analysis – 230 kV Transmission Line Collocated with Olympic Pipelines OPL16 & OPL20
DNV GL – Report No. OAPUS312DKEMP (PP116591)-1, Rev. 0 – www.dnvgl.com Page 34
December 13, 2016
PSE should notify the pipeline operator when there are planned outages on the individual
circuits, as the AC induction effects on the pipeline may be magnified when only one circuit (of
the double circuit transmission lines) is energized.
Final mitigation design, if necessary, should be based on field data collected after the system
is energized. Mitigation may include installation of additional grounding installation such as:
grounding mats, horizontal surface ribbon, and/or deep anode wells based upon a detailed
mitigation study.

Puget Sound Energy
AC Interference Analysis – 230 kV Transmission Line Collocated with Olympic Pipelines OPL16 & OPL20
DNV GL – Report No. OAPUS312DKEMP (PP116591)-1, Rev. 0 – www.dnvgl.com Page 35
December 13, 2016
10 GLOSSARY OF TERMS
Appurtenance – an item associated with the pipeline(s), such as a valve
Bond – an electrical connection intended to provide electrical continuity between two metallic
objects
Coating Breakdown Voltage – the rated voltage of the coating which, if exceeded, results in the
destruction of the coating
Coating Stress Voltage – voltage difference across the coating isolating the pipe from the ground
(i.e. potential difference between the pipe and the soil in contact with the coating)
Direct Current Decoupler (DCD) – an isolation device used to allow DC current to pass while
blocking AC current
Fault Current – the current flowing from a single conductor to ground or to another conductor as a
result of an abnormal operating conditions such as a failed connection, electrical arc, or a lightning
strike (see fault scenario)
Fault Scenario – an abnormal operating condition in the power system, usually results in elevated
currents for a very short duration of time
Grounding Mat – a system of bare conductors connected to the energized structure and placed at
or below grade, usually at above grade appurtenances or stations, intended to provide localized
reduction in touch and step potentials
Shield Wire – a conductor or system of conductors suspended above the phase wires in the power
system which is intended to protect the phase wires from lightning strikes and dissipate elevated
currents in the power system

Puget Sound Energy
AC Interference Analysis – 230 kV Transmission Line Collocated with Olympic Pipelines OPL16 & OPL20
DNV GL – Report No. OAPUS312DKEMP (PP116591)-1, Rev. 0 – www.dnvgl.com Page 36
December 13, 2016
11 REFERENCES
1. IEEE Std 80-2000 “Guide for Safety in AC Substation Grounding,” 2000
2. NACE SP0177-2014 “Mitigation of Alternating Current and Lightning Effects on Metallic Structures and Corrosion Control Systems,” 2014
3. NACE SP0188-2006 “Discontinuity (Holiday) Testing of New Protective Coatings”
4. “AC Predictive and Mitigation Techniques – Final Report”, for Corrosion Supervisory Committee PRC International, 1999.
5. NACE TG 327, “AC Corrosion State-of-the-Art: Corrosion Rate, Mechanism, and Mitigation Requirements”, NACE Report 35110, 2010
6. R. Gummow, S. Segall, “AC Interference Guidelines,” CEPA 2014
7. S. Finneran, B. Krebs, “Criteria for Pipelines Co-Existing with Electric Power Lines,” The INGAA Foundation 2015-04

Puget Sound Energy
AC Interference Analysis – 230 kV Transmission Line Collocated with Olympic Pipelines OPL16 & OPL20
DNV GL – Report No. OAPUS312DKEMP (PP116591)-1, Rev. 0 – www.dnvgl.com Page A-1
December 13, 2016
APPENDIX A: SOIL RESISTIVITY DATA

Puget Sound Energy AC Interference Analysis – 230 kV Transmission Line Collocated with Olympic Pipelines OPL16 & OPL20
DNV GL – Report No. OAPUS312DKEMP (PP116591)-1, Rev. 0 – www.dnvgl.com Page A-2
December 13, 2016
Table A1. Soil Resistivity Data
ID # Latitude Longitude Northing
Easting Bulk Resistivity (Ω-cm) Barnes Layer Resistivity (Ω-cm)
2.5' SR 5' SR 7.5' SR 10' SR 0-2.5ft 2.5-5ft 5-7.5ft 7.5-10ft
1 47.683982 -122.158787 5281520.034 563132.766 22,024 25,854 25,854 24,896 22,024 31,297 25,854 22,407
2 47.678368 -122.158656 5280896.209 563149.373 49,314 37,345 33,036 38,302 49,314 30,051 26,842 73,413
3 47.671523 -122.158160 5280135.871 563194.865 292,055 220,238 143,634 112,992 292,055 176,770 84,707 68,897
4 47.664768 -122.158404 5279384.933 563184.702 62,241 67,029 71,817 59,369 62,241 72,615 83,786 39,058
5 47.656433 -122.158344 5278458.646 563199.265 148,421 248,965 330,357 402,174 148,421 771,791 954,366 1,156,251
6 47.650902 -122.158612 5277843.723 563185.814 119,695 181,936 201,087 248,965 119,695 379,033 254,710 871,377
7 47.643848 -122.158780 5277059.619 563181.704 129,270 134,058 143,634 1,378,883 129,270 139,214 167,573 -
8 47.637067 -122.158959 5276305.848 563176.435 306,418 354,296 402,174 268,116 306,418 419,907 551,128 134,058
9 47.630028 -122.159100 5275523.435 563174.327 306,418 402,174 430,901 497,930 306,418 584,981 502,718 933,619
10 47.622973 -122.159034 5274739.414 563187.788 44,048 49,793 57,453 61,284 44,048 57,262 82,988 76,605
11 47.616958 -122.159205 5274070.783 563182.187 15,800 9,384 6,464 5,362 15,800 6,674 3,984 3,549
12 47.609960 -122.159045 5273293.175 563202.642 16,757 20,109 17,236 18,385 16,757 25,136 13,406 22,981
13 47.602400 -122.158712 5272453.250 563236.781 20,109 11,491 9,623 8,618 20,109 8,043 7,263 6,561
14 47.594124 -122.158553 5271533.610 563258.707 52,666 101,501 147,943 157,039 52,666 1,395,640 1,742,435 192,560
15 47.589045 -122.158323 5270969.334 563282.121 52,666 47,878 35,908 26,812 52,666 43,888 23,939 15,234
15a 47.584699 -122.158223 5270486.415 563294.879 17,236 22,024 22,981 26,812 17,236 30,495 25,170 53,623
16 47.582174 -122.157924 5270206.039 563320.406 47,399 38,302 33,036 24,896 47,399 32,135 25,910 14,315
17 47.574487 -122.157421 5269352.143 563367.504 244,177 325,570 258,541 229,814 244,177 488,354 183,133 172,360
18 47.568057 -122.157877 5268637.163 563340.964 11,969 6,607 3,447 2,873 11,969 4,563 1,762 1,915
19 47.561888 -122.161718 5267948.435 563059.465 10,533 7,660 7,900 6,703 10,533 6,019 8,427 4,608
20 47.555240 -122.165852 5267206.250 562756.427 47,878 48,835 37,345 28,727 47,878 49,832 25,394 16,975
21 47.548630 -122.169677 5266468.555 562476.514 157,997 105,331 87,617 74,689 157,997 78,998 65,563 51,773
22 47.541416 -122.169851 5265666.680 562471.993 35,430 18,194 9,623 4,979 35,430 12,239 4,955 2,034

Puget Sound Energy AC Interference Analysis – 230 kV Transmission Line Collocated with Olympic Pipelines OPL16 & OPL20
DNV GL – Report No. OAPUS312DKEMP (PP116591)-1, Rev. 0 – www.dnvgl.com Page A-3
December 13, 2016
ID # Latitude Longitude Northing
Easting Bulk Resistivity (Ω-cm) Barnes Layer Resistivity (Ω-cm)
2.5' SR 5' SR 7.5' SR 10' SR 0-2.5ft 2.5-5ft 5-7.5ft 7.5-10ft
23 47.536463 -122.169402 5265116.585 562511.669 52,666 43,090 33,036 22,981 52,666 36,461 22,524 12,013
24 47.529893 -122.169165 5264386.614 562537.317 10,054 11,491 12,783 10,533 10,054 13,406 16,495 6,893
25 47.522802 -122.169186 5263598.535 562544.165 37,345 22,981 18,672 14,938 37,345 16,598 13,580 9,336
26 47.517809 -122.169061 5263043.736 562559.511 95,756 181,936 215,450 229,814 95,756 1,819,359 341,130 287,267
27 47.511271 -122.173335 5262313.698 562245.465 119,695 90,968 83,307 57,453 119,695 73,361 71,299 29,753
28 47.581572 -122.168860 5270130.266 562498.789 210,663 172,360 122,089 80,435 210,663 145,843 77,109 39,750
29 47.574156 -122.169784 5269305.333 562438.125 21,545 19,151 20,109 19,151 21,545 17,236 22,343 16,757
30 47.567900 -122.169122 5268610.597 562495.354 28,727 9,576 5,171 2,681 28,727 5,745 2,693 1,097
31 47.560610 -122.169414 5267800.178 562482.060 143,634 181,936 186,724 65,114 143,634 248,094 197,097 22,044

ABOUT DNV GL Driven by our purpose of safeguarding life, property and the environment, DNV GL enables organizations to advance the safety and sustainability of their business. We provide classification and technical assurance along with software and independent expert advisory services to the maritime, oil
and gas, and energy industries. We also provide certification services to customers across a wide range of industries. Operating in more than 100 countries, our 16,000 professionals are dedicated to helping our customers make the world safer, smarter and greener.