Embed Size (px)
Citation preview
AC 2012-3412: IMPLEMENTATION AND ASSESSMENT OF A VIRTUALREALITY EXPERIMENT IN THE UNDERGRADUATE THEMO-FLUIDSLABORATORY
Dr. Sushil K. Chaturvedi, Old Dominion UniversityDr. Jaewan Yoon, Old Dominion UniversityDr. Rick McKenzie, Old Dominion University
Rick McKenzie is the Graduate Program Director in the new Modeling, Simulation and Visualization En-gineering (MSVE) Department and a joint faculty member in the Department of Electrical and ComputerEngineering (ECE) at Old Dominion University. Before coming to Old Dominion University, he spent sixyears in the simulation industry as a Senior Scientist. McKenzie’s research has been in medical modelingand simulation, human behavior representation, and simulation architectures often focusing on aspects ofscientific visualization and virtual reality.
Dr. Petros J. Katsioloudis, Old Dominion University
Petros Katsioloudis is an Assistant Professor in the Department of STEM Education and ProfessionalStudies in the College of Education at Old Dominion University.
Hector M. Garcia, Old Dominion University
Hector Garcia is the lead Senior Project Scientist at Old Dominion University’s Virginia Modeling Anal-ysis and Simulation Center, in the areas of visualization, virtual environments, and virtual reality, inte-grating state of the art visualization systems with modeling and simulation applications. He received hismaster’s in architecture from University of Houston in 1997. Garcia’s expertise include the use of largescale visual simulation display systems, the use of tracking devices, haptic devices, and motion basesfor immersive virtual reality simulations. Garcia’s research interests are in the development of virtualenvironments for use in the areas of training, education, and scientific visualization.
Mr. Shuo Ren, Old Dominion University
Shuo Ren is a graduate student pursuing a master’s of science degree in modeling, simulation, and visual-ization engineering at Old Dominion University. He received his bachelor’s of science degree in electricalengineering from Virginia Tech in 2010. His research interests include virtual reality, immersive learning,3D visualization, and medical simulation. Currently, he is working on the development of 3D virtuallaboratory for solid mechanics lab.
c©American Society for Engineering Education, 2012
Implementation and Assessment of Virtual Reality Experiment in
the Undergraduate Thermo-fluids laboratory
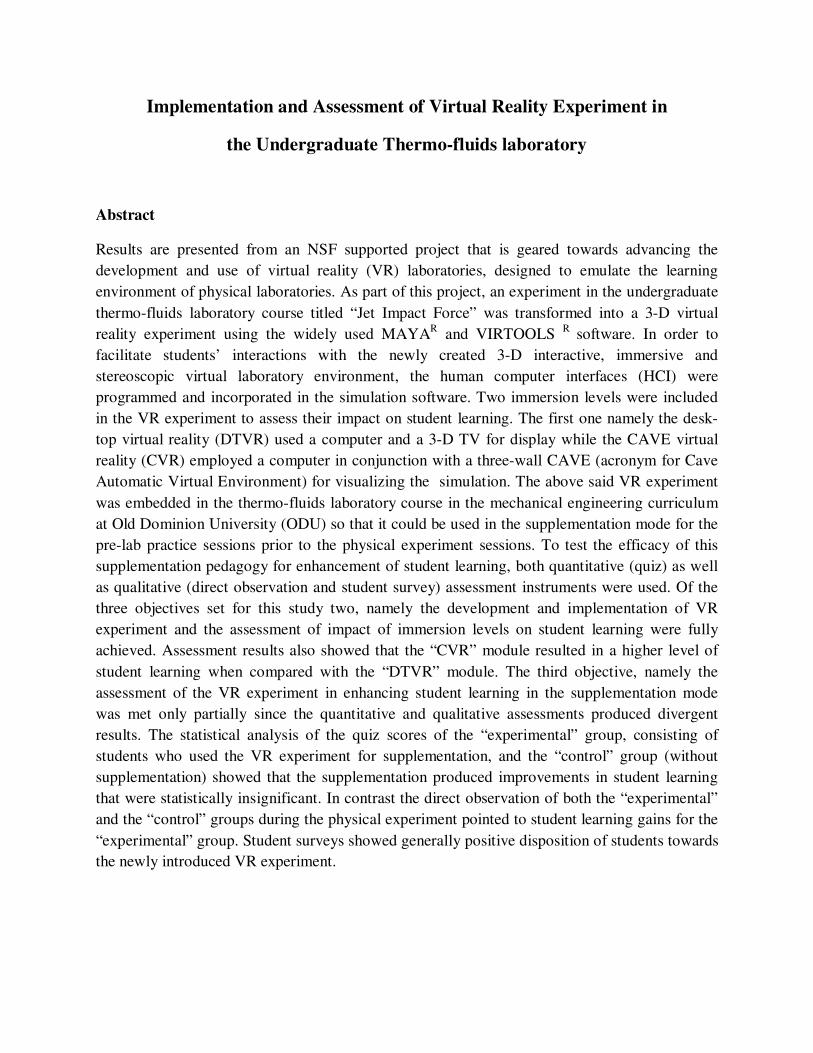
Abstract
Results are presented from an NSF supported project that is geared towards advancing the
development and use of virtual reality (VR) laboratories, designed to emulate the learning
environment of physical laboratories. As part of this project, an experiment in the undergraduate
thermo-fluids laboratory course titled “Jet Impact Force” was transformed into a 3-D virtual
reality experiment using the widely used MAYAR and VIRTOOLS
R software. In order to
facilitate students’ interactions with the newly created 3-D interactive, immersive and
stereoscopic virtual laboratory environment, the human computer interfaces (HCI) were
programmed and incorporated in the simulation software. Two immersion levels were included
in the VR experiment to assess their impact on student learning. The first one namely the desk-
top virtual reality (DTVR) used a computer and a 3-D TV for display while the CAVE virtual
reality (CVR) employed a computer in conjunction with a three-wall CAVE (acronym for Cave
Automatic Virtual Environment) for visualizing the simulation. The above said VR experiment
was embedded in the thermo-fluids laboratory course in the mechanical engineering curriculum
at Old Dominion University (ODU) so that it could be used in the supplementation mode for the
pre-lab practice sessions prior to the physical experiment sessions. To test the efficacy of this
supplementation pedagogy for enhancement of student learning, both quantitative (quiz) as well
as qualitative (direct observation and student survey) assessment instruments were used. Of the
three objectives set for this study two, namely the development and implementation of VR
experiment and the assessment of impact of immersion levels on student learning were fully
achieved. Assessment results also showed that the “CVR” module resulted in a higher level of
student learning when compared with the “DTVR” module. The third objective, namely the
assessment of the VR experiment in enhancing student learning in the supplementation mode
was met only partially since the quantitative and qualitative assessments produced divergent
results. The statistical analysis of the quiz scores of the “experimental” group, consisting of
students who used the VR experiment for supplementation, and the “control” group (without
supplementation) showed that the supplementation produced improvements in student learning
that were statistically insignificant. In contrast the direct observation of both the “experimental”
and the “control” groups during the physical experiment pointed to student learning gains for the
“experimental” group. Student surveys showed generally positive disposition of students towards
the newly introduced VR experiment.
Introduction
Computer-based immersive visualization in recent years has become an important catalyst in the
development of virtual reality (VR) laboratories that hold considerable promise for becoming a
powerful teaching and learning tool in engineering education. The fiscal realities of the shrinking
resources coupled with escalating cost of modernizing engineering laboratories have prompted
educators to investigate innovative ways in which VR labs can be used for laboratory instruction.
Maturation of digital technologies and their sharply declining costs has put cyberinfrastructure
applications such as virtual reality-based undergraduate engineering labs within the reach of
many cash strapped engineering institutions. Although virtual reality labs can potentially be used
in the several educational settings, one application explored in this paper for which VR labs are
eminently suited involves using them for supplementation of physical laboratories. Students in
this modality use the VR lab for pre-lab practice sessions prior to conducting a physical
experiment. This application is expected to enhance students’ knowledge of physical experiment,
pertaining to objectives, procedure and data collection. Over the years it has been authors’
experience that many students in laboratory courses come to physical lab sessions without
adequate preparation, often not knowing even the main objective of the experiment. This is
despite instructions to students to review the details of experiments from the lab book provided
to all students in the course. Due to their highly visual and immersive nature VR labs are
expected to remedy this situation and improve students’ preparedness for the physical lab
sessions. Students’ exposure to an experiment in both physical and virtual domains is expected to
reinforce students’ learning. Since majority of current engineering students are technology savvy
visual learners [1]
, the highly visual nature of the VR labs is also expected to make students’ lab
experience engaging and exciting. There is considerable published literature that documents
student learning gains from the supplementation of classroom instruction with the modern
technology tools [2]
. The authors of the present paper have also demonstrated that
supplementation of the engineering lecture and lab courses with web-based visualization and
simulation modules produces student learning gains [3-6]
, a conclusion also reached by others [7-9]
and highlighted in the NSF’s Fostering Learning in the Networked World [10]
.
Literature review
Engineering is an applied field that requires hands-on skills. The current educational practice is
to provide hands-on experience primarily through bench-type experiments in physical
laboratories. In order to gain acceptance as a tool for laboratory instruction a virtual experiment
at the very last must include: (a) hands-on activities (interactivity), and (b) a realistic simulation
of the experiment in a laboratory like environment (immersion). It should be noted that bench-
type physical experiments have drawbacks of high capital cost, limited (one time) exposure to
experiments and limited students’ interaction with experiments due to large student group sizes.
As a result student learning does not always reach expected levels [11-12]
. Bourne has stated that
student learning achieved through online virtual experiments may be comparable to learning
achieved through bench-type physical experiments [13]
. The virtual reality experiments do not
have some of the drawbacks of bench-type experiments mentioned earlier. However, creation of
life-like virtual reality laboratories rivaling physical laboratories in providing students hands-on
experience still remains a daunting task due to technical as well as perceptual challenges.
Application of virtual labs for providing hands-on experience in laboratory courses has lagged
because engineering professors generally view physical laboratories as the primary means of
providing students the hands-on experience for engineering practice. As a result many of them
are averse to using simulated virtual experiments. Students may also prefer using physical labs
instead of virtual labs [14]
due to equating of the term “virtual” with the term “non-real”.
However, it should be pointed out that the definition of “hands-on experience” itself is changing
as the industry is increasingly relying on computer simulations and virtual reality [15]
, and as a
result the term hands-on experience does not necessarily imply dealing only with physical
hardware. Instead “hands-on experience” can also be realized in the virtual domain, using
computers, the internet and virtual reality tools. Some industry leaders as well as education
leaders have suggested that computer modeling and visualization should be used in the
interactive mode to promote students’ hands-on skills now being demanded by industry [16-17].
Virtual laboratories can be broadly classified into four categories [18]
, namely recreative
(simulation without interactivity), interactive, immersive/interactive, and collaborative. At the
bottom of the hierarchy shown in Fig.1 are the recreative virtual labs that are merely a simulation
of a physical phenomenon or an experiment, visualized on a computer screen. These simulations
are used primarily for demonstration of complex physical phenomena. Ability to interact with the
simulation is not provided to users who just view the simulated phenomenon passively.
Interactive virtual labs attempt to replicate physical experiment on a computer screen generally
in two-dimensions. They provide the interactivity feature that allows users to input data and
receive responses from a simulation which changes dynamically as a result of changing input
setting such as opening or closing of a valve in a pipeline. A large percentage of virtual labs
reported in the literature belong to this category [19-24]
, spanning practically every field of
engineering. Immersive interactive virtual labs represent improvement over interactive virtual
labs since they provide both interactivity as well as immersion, in three-dimensions. The 3-D
immersion gives users a sense of presence in a simulated laboratory environment, mimicking
what one would experience during a physical experiment in a laboratory. Investigators in the
fields of science, medicine and engineering have developed a number of immersive experiments
(in the virtual domain) for educational purposes [25-29]
. Web-based collaborative experiments use
online collaboration of computers to allow users to: a) perform experiment as a team whose
members are geographically distributed, or b) share real time data in scientific experiment which
is being conducted at a central location. These labs have also been called collaboratories [30]
.
Application of these online collaborative labs to engineering education is still in its infancy.
However, their potential for use in distance engineering education programs is substantial and
needs to be explored. The web-based game technology and social network media such as
“Second life” have advanced rapidly in recent years to allow geographically distributed users to
either play games collaboratively or to enable their avatars to interact with one another on the
web. The Collaborative Web Technologies (CWT) have evolved to the extent that they can be
also applied to develop collaborative engineering laboratories for web-based engineering
programs.
Immersive and
Collaborative Virtual
Labs
Immersive Virtual Labs
Interactive Virtual Labs
Recreation of Physical Phenomenon (Simulation and Visualization)
Figure1. Classification of virtual laboratories
Objectives and Scope of the Present Work
The literature review of virtual labs presented in the previous section indicates that the state of
the art has advanced considerably in recent years. However despite recent developments, the
research in this field has yet to be translated into strategies that would make virtual reality
laboratories an integral part of engineering education. The present study is a step in that
direction. The overarching goal of this study is to advance the development and use of virtual
reality laboratories that will closely emulate the learning environment of physical engineering
laboratories. In this pilot study, a 3-D virtual reality experiment emulating a physical experiment
titled “Jet Impact Force” in the thermo-fluids laboratory course in the mechanical engineering
curriculum has been developed, implemented and assessed. The VR experiment is used in the
supplementation mode for pre-lab practice sessions to help prepare students for the physical
experiment. Two virtual reality environments with different level of immersion have been
developed and assessed. In the desk-top virtual reality (DTVR), a desk-top computer is coupled
with a 3-D TV while in the CAVE virtual reality (CVR), a computer is coupled with a three wall
“CAVE” to create laboratory like 3-D immersive environments for conducting virtual pre-lab
practice sessions. Both virtual reality versions were implemented and assessed to gage student
learning gain, due to pre-lab practice sessions. The assessment section in this paper presents the
“experimental design” and the statistical analysis of collected data to determine the impact of this
VR experiment on student learning.
In summary the main goals of this study are:
(a) Development and implementation of a virtual reality experiment in the thermo-fluids
laboratory course,
(b) Quantitative as well as qualitative assessment of the VR experiment as a supplementation
tool in the lab course, and
(c) Assessment of impact of different levels of immersion (“DTVR” vs. “CVR”) on student
learning.
Broader Impacts on Engineering Education
The broader impacts of this study relate to educational process in higher education. The project is
currently geared towards assessment of the virtual reality experiment used in the practice runs
prior to physical laboratory sessions. Pedagogical results and lessons learned from this project
are expected to advance the application of VR labs to other educational settings. The VR lab
development effort and its effectiveness in enhancing student learning is expected to pave
foundation for development of hybrid labs consisting of an optimal mix of physical and virtual
experiments. Due to their cost effectiveness, inherent flexibility and the ability to provide hands-
on experience in both physical and virtual domains, the hybrid labs have the potential of
revitalizing engineering education infrastructure for the new globally competitive knowledge-
based economy. In the other educational setting namely distance learning, virtual reality
experiments of the type discussed here are expected to become building blocks for development
of virtual reality labs enabling more advanced distance learning web-based programs that would
reach a more diverse non-traditional student base. It is interesting to note that Gross has
identified difficulty in providing laboratory experience on the web as the principal reason for
paucity of distance learning undergraduate programs [31]
. This project also advances the learning
environment in engineering schools through incorporation of exciting and user friendly modern
technology-based instructional tools, such as VR labs, that are more in tune with current
engineering students’ visual learning style [1]
in the modern digital age.
Thermo-fluids Laboratory Experiment
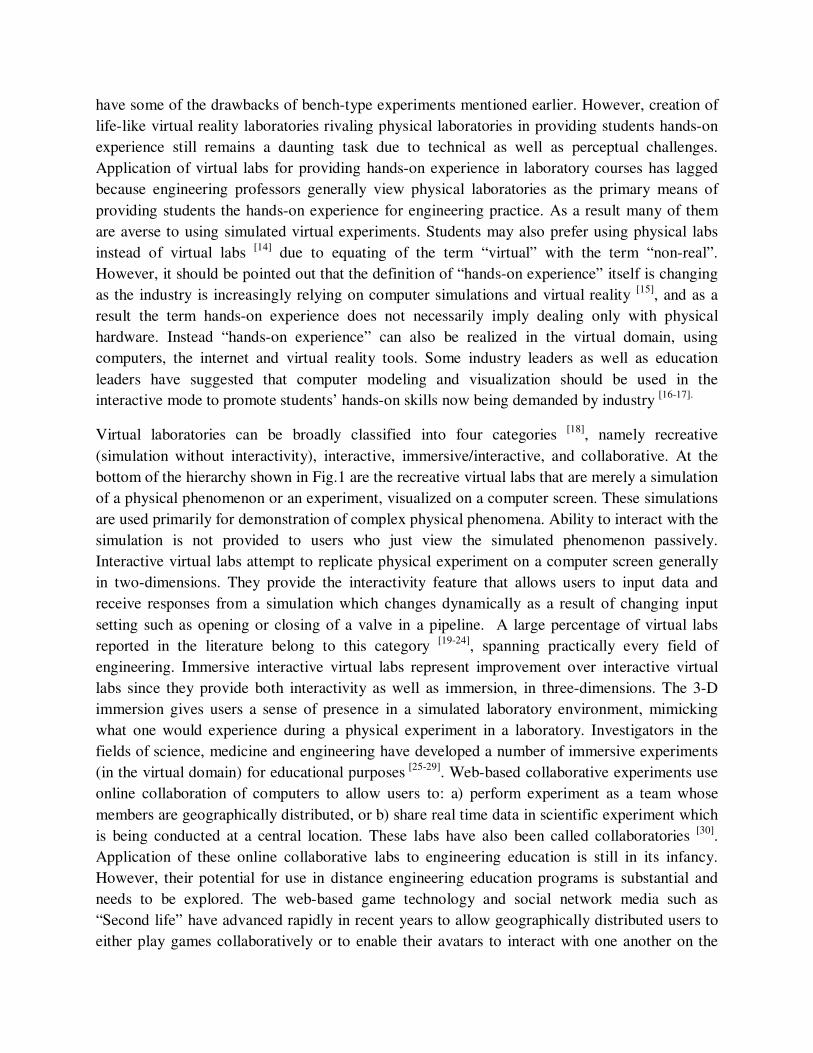
In this junior level laboratory (ME 305), the “Jet Impact Force on Vanes” has been chosen for
the physical-to-virtual reality experiment transformation. The experiment shown in Fig. 2
involves determination of jet impact force arising from reversal of a jet after hitting a vane. The
equation represents the relationship between force (F), mass flow rate ( ) and type of
vane (C). Water from a storage tank is pumped through a nozzle to create a jet directed towards a
vane mounted on a pivoted arm on which a known jockey weight can slide. The deflected beam
due to the impact of the jet is returned to its balanced (horizontal) position by sliding a jokey
weight on the spring loaded pivoted arm. The balance position is achieved when the moment of
the jokey weight about the pivot point equals the moment of the jet force (F). This results in a
reading of jokey weight displacement L in mm, and determination of force F. The mass flow rate
( ) is measured by determining the time required to collect a given mass of water in a tank. The
water collection tank is also mounted on one end of another pivoted arm whose opposite end
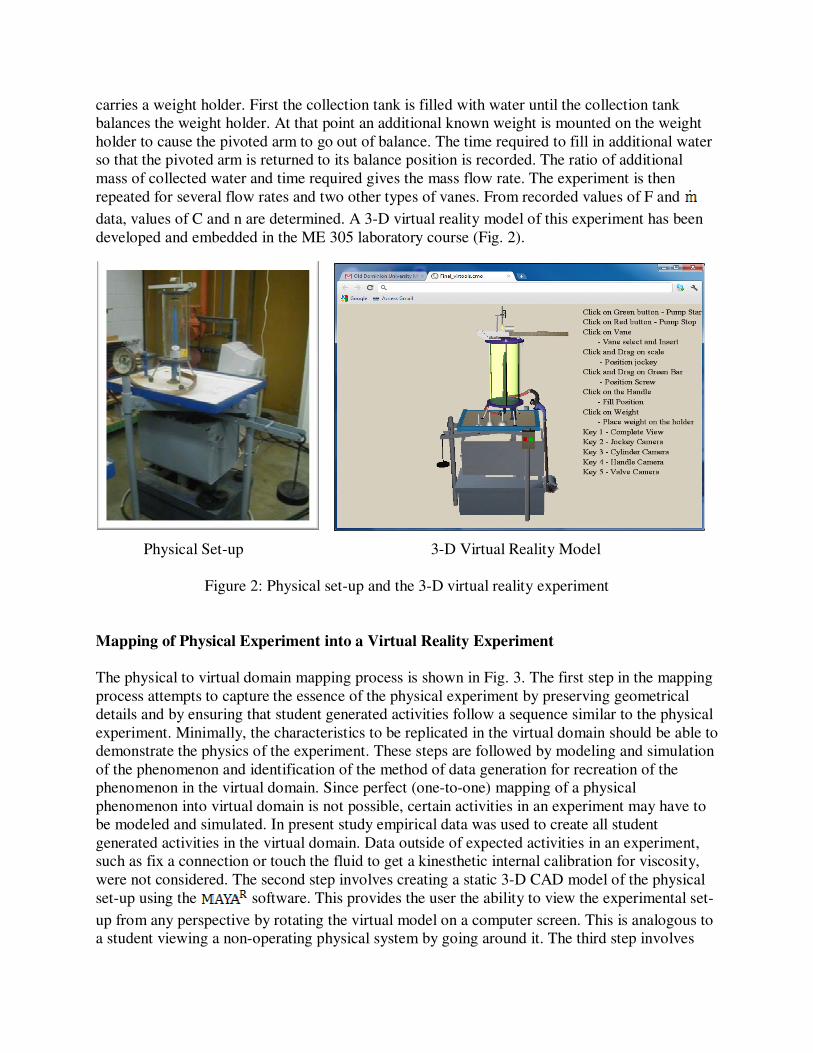
carries a weight holder. First the collection tank is filled with water until the collection tank
balances the weight holder. At that point an additional known weight is mounted on the weight
holder to cause the pivoted arm to go out of balance. The time required to fill in additional water
so that the pivoted arm is returned to its balance position is recorded. The ratio of additional
mass of collected water and time required gives the mass flow rate. The experiment is then
repeated for several flow rates and two other types of vanes. From recorded values of F and
data, values of C and n are determined. A 3-D virtual reality model of this experiment has been
developed and embedded in the ME 305 laboratory course (Fig. 2).
Physical Set-up 3-D Virtual Reality Model
Figure 2: Physical set-up and the 3-D virtual reality experiment
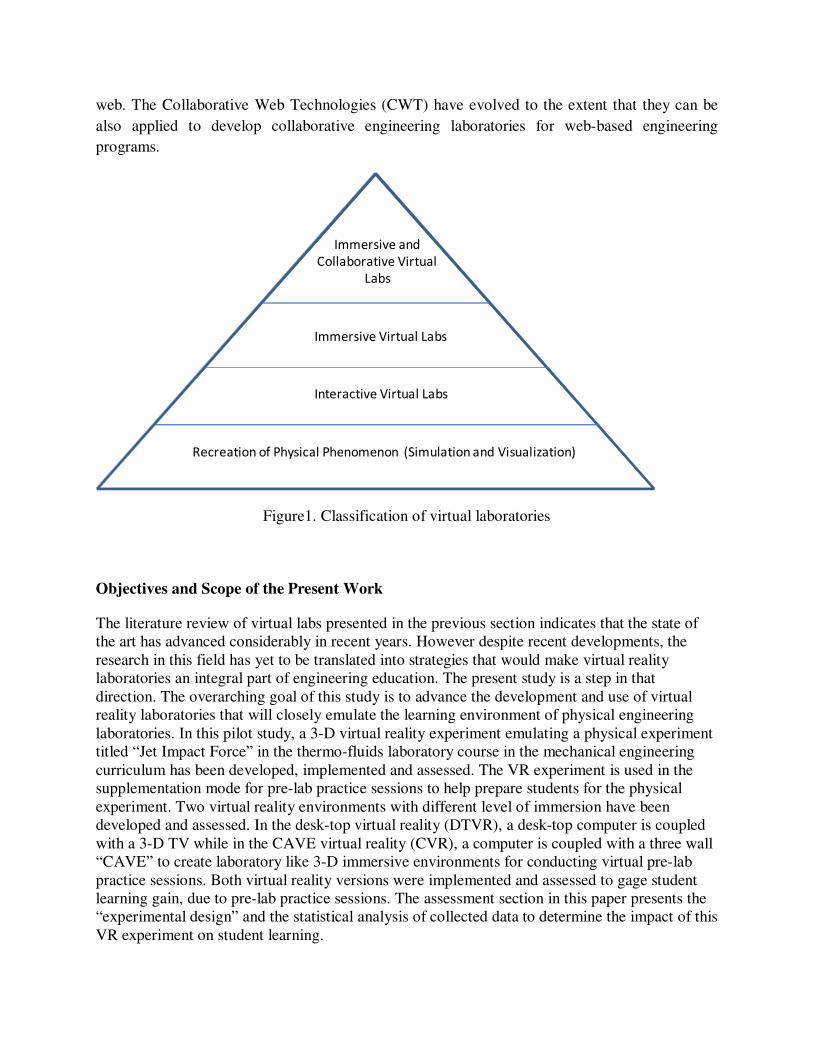
Mapping of Physical Experiment into a Virtual Reality Experiment
The physical to virtual domain mapping process is shown in Fig. 3. The first step in the mapping
process attempts to capture the essence of the physical experiment by preserving geometrical
details and by ensuring that student generated activities follow a sequence similar to the physical
experiment. Minimally, the characteristics to be replicated in the virtual domain should be able to
demonstrate the physics of the experiment. These steps are followed by modeling and simulation
of the phenomenon and identification of the method of data generation for recreation of the
phenomenon in the virtual domain. Since perfect (one-to-one) mapping of a physical
phenomenon into virtual domain is not possible, certain activities in an experiment may have to
be modeled and simulated. In present study empirical data was used to create all student
generated activities in the virtual domain. Data outside of expected activities in an experiment,
such as fix a connection or touch the fluid to get a kinesthetic internal calibration for viscosity,
were not considered. The second step involves creating a static 3-D CAD model of the physical
set-up using the software. This provides the user the ability to view the experimental set-
up from any perspective by rotating the virtual model on a computer screen. This is analogous to
a student viewing a non-operating physical system by going around it. The third step involves
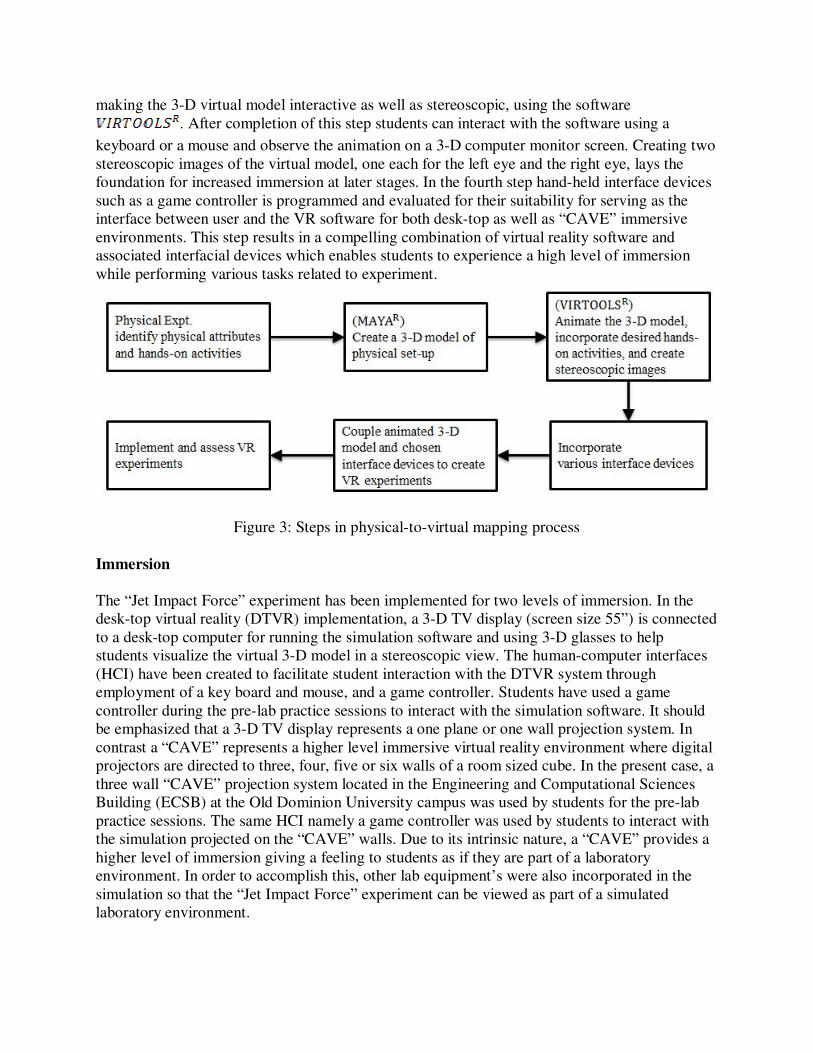
making the 3-D virtual model interactive as well as stereoscopic, using the software
. After completion of this step students can interact with the software using a
keyboard or a mouse and observe the animation on a 3-D computer monitor screen. Creating two
stereoscopic images of the virtual model, one each for the left eye and the right eye, lays the
foundation for increased immersion at later stages. In the fourth step hand-held interface devices
such as a game controller is programmed and evaluated for their suitability for serving as the
interface between user and the VR software for both desk-top as well as “CAVE” immersive
environments. This step results in a compelling combination of virtual reality software and
associated interfacial devices which enables students to experience a high level of immersion
while performing various tasks related to experiment.
Figure 3: Steps in physical-to-virtual mapping process
Immersion
The “Jet Impact Force” experiment has been implemented for two levels of immersion. In the
desk-top virtual reality (DTVR) implementation, a 3-D TV display (screen size 55”) is connected
to a desk-top computer for running the simulation software and using 3-D glasses to help
students visualize the virtual 3-D model in a stereoscopic view. The human-computer interfaces
(HCI) have been created to facilitate student interaction with the DTVR system through
employment of a key board and mouse, and a game controller. Students have used a game
controller during the pre-lab practice sessions to interact with the simulation software. It should
be emphasized that a 3-D TV display represents a one plane or one wall projection system. In
contrast a “CAVE” represents a higher level immersive virtual reality environment where digital
projectors are directed to three, four, five or six walls of a room sized cube. In the present case, a
three wall “CAVE” projection system located in the Engineering and Computational Sciences
Building (ECSB) at the Old Dominion University campus was used by students for the pre-lab
practice sessions. The same HCI namely a game controller was used by students to interact with
the simulation projected on the “CAVE” walls. Due to its intrinsic nature, a “CAVE” provides a
higher level of immersion giving a feeling to students as if they are part of a laboratory
environment. In order to accomplish this, other lab equipment’s were also incorporated in the
simulation so that the “Jet Impact Force” experiment can be viewed as part of a simulated
laboratory environment.

Quantitative and Qualitative Assessment
Overview and Hypothesis used in Assessment
MAE 305 Thermo-Fluids Lab, Fall semester, 2011 course had three sections and was
used for implementation and assessment of the VR experiment. Each section is then partitioned
into three student groups, each with five or six students that rotate over a number of laboratory
experiments per week. One particular laboratory experiment, “Jet Impact Force” in each section
was implemented with three different learning settings – (1) physical experiment only, (2) prior
desktop virtual reality (DTVR) practice and posterior physical experiment, and (3) prior CAVE
virtual reality (CVR) practice and posterior physical experiment – to investigate corresponding
students learning effectiveness achieved through these modules. Measures of evaluating students
learning effectiveness consist of both quantitative (quiz scores) and qualitative (survey and direct
observation) outcomes. Since current engineering students at Old Dominion University are
attuned to interactive visualization due to their familiarity with computers and video gaming, the
hypothesis is that either “DTVR” or “CVR” would supplement and enhance student learning
above and beyond levels achieved through conventional physical experiment only mode.
Assessment Experimental Design
The Intact Group method was used to assess the impact of different modules on student
learning. [32]
Among three learning settings, “physical experiment only” mode was set as a
“control” group, and the remaining two “DTVR” and “CAVE” modules were set as
“experimental” treatment groups. The “control” group consisted of students who did not have
access to either “DTVR” or “CAVE” modules. Learning of the subject matter in the “control”
group prior to the physical experiment was achieved mainly through the lab book provided to all
students. Students in the “experimental” groups supplemented their learning with “DTVR” or
“CAVE” modules. A pre-assessment survey containing self-reported questions on student
learning style (i.e., self-learner, group-learner, interactive-learner, structured-learner, etc.) and
computer literacy (i.e., intermediated, advanced, level of daily utilization of computer and typical
utilization category, etc.) was conducted. Collected data on student learning style and level of
computer literacy were used to balance each group with similar proportion of students in each
learning style and computer literacy level so that assessment can be performed unskewed from
particular learning style and computer literacy level bias.
Quantitative Assessment – Statistical Experimental Design
To objectively determine whether the implemented modules had contributed to enhanced
students' learning compared to the pre-implementation condition, i.e., was there any difference in
the mean scores of quizzes under “Without Module” (=control group) and “With Module”
(=experimental group) settings, course outcomes were collected and statistically analyzed.
Instead of simply comparing the arithmetic means of outcomes and subsequent visual display of
graphs, which is limited to the descriptive statistics on per-event sample data and seldom
provides any population-level intrinsicality and reproducibility (=true module effectiveness),
standard statistical analysis methodology in form of experimental designs was applied to make
an objective and correct inference about the module effectiveness.
As a preliminary step, quantitative student outcome dataset, quiz scores, from three
groups (one “control/Without Module” and two “experimental/With Module”) were evaluated by
using a median-based one-way, pairwise nonparametric statistics, Wilcoxon Rank Sum statistics [33]
to test the hypotheses on central tendency and dispersion at 95% level of confidence (α
=0.05).
H0: µ~ [Quiz{Without Module}] = µ~ [Course Outcomes{With Module}]
Ha: µ~ [Course Outcomes{Without Module}] < µ~ [Course Outcomes{With Module}]
or > µ~ [Course Outcomes{With Module}]
At 95% confidence level, if Wilcoxon Rank Sum p-value is less than 0.05, then a
conclusion can be made that there is a significant difference between the central tendency of the
course outcome/quiz score at their population levels, or mean scores of the student performance
under “Without Module” (=control) and “With Module” (=experimental) settings are different
To compare contribution of “Without Module” (=control) and “With Module”
(=experimental) settings toward enhancing students’ learning effectiveness, standard RCB
(Randomized Complete Block) design [34]
is used to construct control treatment levels (“Without
Module” and “With Module). All analyses are conducted by using SAS/STAT Statistical
Analysis System [35]
available on the ODU LIONS SunGRID HPC computing cluster. Statistical
analysis was performed on quiz scores from three groups (one “control/Without Module” and
two “DTVR” and “CAVE” experimental/With Module”) using the Statistical Analysis System
(SAS). To ensure objectivity, a blinded analysis was conducted without identifying “control”,
“DTVR” and “CAVE” groups. Instead, generic group identifications of “Batch 1,” “Batch
2”and“Batch 3” were used during the analysis.
The conclusions pertaining to module effectiveness (in form of quiz score only) in
enhancing student learning are summarized in Table 1. As reported in the table, the difference in
module effectiveness (in form of quiz score only) between “Batch 1” and “Batch 2” is
statistically insignificant, indicating the magnitudes of student learning enhancement achieved by
“Batch 1” and “Batch 2”modules for the Jet Impact Force experiment in MAE 305 Thermo-
Fluids Lab, Fall semester, 2011 were equivalent. The difference in module effectiveness (in
form of quiz score) between “Batch 1” and “Batch 3” is also statistically insignificant, indicating
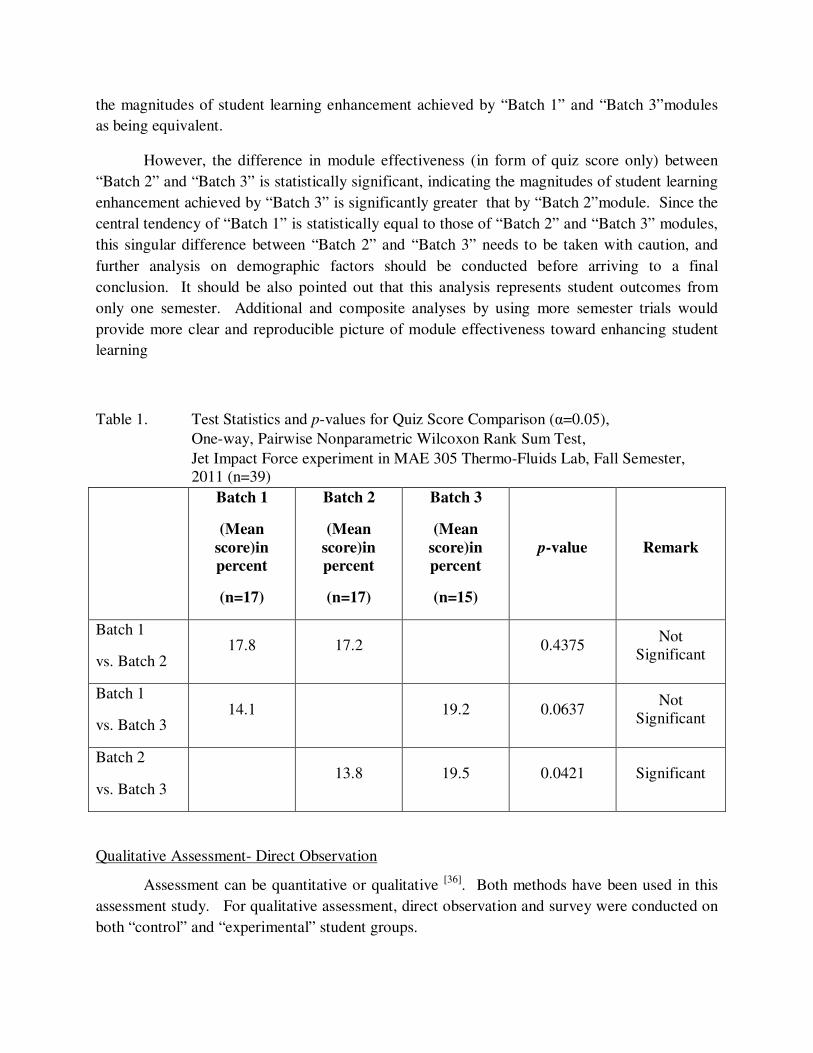
the magnitudes of student learning enhancement achieved by “Batch 1” and “Batch 3”modules
as being equivalent.
However, the difference in module effectiveness (in form of quiz score only) between
“Batch 2” and “Batch 3” is statistically significant, indicating the magnitudes of student learning
enhancement achieved by “Batch 3” is significantly greater that by “Batch 2”module. Since the
central tendency of “Batch 1” is statistically equal to those of “Batch 2” and “Batch 3” modules,
this singular difference between “Batch 2” and “Batch 3” needs to be taken with caution, and
further analysis on demographic factors should be conducted before arriving to a final
conclusion. It should be also pointed out that this analysis represents student outcomes from
only one semester. Additional and composite analyses by using more semester trials would
provide more clear and reproducible picture of module effectiveness toward enhancing student
learning
Table 1. Test Statistics and p-values for Quiz Score Comparison (α=0.05),
One-way, Pairwise Nonparametric Wilcoxon Rank Sum Test,
Jet Impact Force experiment in MAE 305 Thermo-Fluids Lab, Fall Semester,
2011 (n=39)
Batch 1
(Mean
score)in
percent
(n=17)
Batch 2
(Mean
score)in
percent
(n=17)
Batch 3
(Mean
score)in
percent
(n=15)
p-value Remark
Batch 1
vs. Batch 2 17.8 17.2 0.4375
Not
Significant
Batch 1
vs. Batch 3 14.1 19.2 0.0637
Not
Significant
Batch 2
vs. Batch 3 13.8 19.5 0.0421 Significant
Qualitative Assessment- Direct Observation
Assessment can be quantitative or qualitative [36]
. Both methods have been used in this
assessment study. For qualitative assessment, direct observation and survey were conducted on
both “control” and “experimental” student groups.

Qualitative direct observations were made on all three groups from each section while
conducting the “Jet Impact Force” experiment. Direct observation was made on overall
familiarity with the experimental procedure as well as two observatory components of (1)
Balancing Jockey Weight over the Beam, and (2) Mass Flow Rate Determination during the
experiment based on the Likert scale of 1 to 5 as shown in Table 2. Additional motion and group
kinetic data were collected. Time lapse measurement was made for the first trial of the
experiment procedure, immediately followed by circling the observed Likert scale (listed in the
Table 2) of student familiarity to the observatory component. Rationale is that after first trial,
students would become familiarized with procedure regardless of which module (i.e., Physical,
“DTVR” and “CAVE”) they belong to, and observing effect of such applicable module treatment
would become difficult. Rating of “Overall familiarity with the experimental procedure” was
made right after the third trial of the experiment. Rationale is that students become quite familiar
with the procedure by the third trial and yet the observer would still be able to detect the subtle
differences contributed by different treatments. After the third trial, observing effect of such
applicable treatments would become difficult.
Table 2. Qualitative Direct Observations,
Jet Impact Force experiment in MAE 305 Thermo-Fluids Lab, Fall Semester,
2011 (n=39)
No clue, does not
appear to have
any knowledge
of the required
procedure
Appear
recognizing
elements of the
required
procedure with a
high level of
hesitation and
guess
Reasonable
understanding of
the procedure,
with a level of
hesitation and
guess
Fair
understanding of
the procedure,
with a hint of
trial and error to
perform the
required
procedure
No guess or
hesitation, fully
understand and
able to perform
the required
procedure with
certaintlimuRy78
Scale 1 Scale 2 Scale 3 Scale 4 Scale 5
By nature, all students in a group conducting the physical experiment will be involved
with varying levels of engagement. Beta students are more “passive” (or mildly aloof in the
worst sense) in their involvement level compared to alpha students who are actively involved in
observed activities [37]
. Non- responsive category refers to students who do not respond at all to
the newly introduced treatment. Alpha students are likely to proactively accept and use the new
paradigm than Beta students. Thus measuring Alpha-Beta student kinetic would provide an
insight on different levels of effectiveness of virtual module to the proactive vs. passive
recipients. If the ratio of Alpha students in a group is larger than typical 10-15% composition, it
would indicate that the module was effective enough so that a significant Beta to Alpha
conversion had occurred before the physical experiment. Thus observing the transition of Beta
students into Alpha students during the physical experiment would be a good indicator that
virtual module was effective enough to boost Beta students’ confidence and facilitate them to
become more “active” for the specific physical experiment. The learning mode of Beta students
tends to stay “passive” in traditional learning.
During the direct observation, additional comments on group kinetics including Alpha vs.
Beta Student interactions were recorded to further understand student response to the virtual
modules by capturing followings;
i) Ratio of Alpha- vs. Beta-students in the group, i.e., 2 Alpha and 4 Beta, etc.
ii) Level of interaction/discussion between Alpha- vs. Alpha-, Alpha- vs. Beta-, and
Beta- vs. Beta-students, i.e., do Beta-students point out/correct procedural
mistake(s) made by Alpha-student?
iii) Gradual change, if there is any, in Alpha- vs. Beta-students ratio in the group at
the later part of the experiment.
Table 3 summarizes findings from the direct observation. For the “Balancing Jockey
Weight over the Beam” observatory component, Likert scales of both “DTVR” and “CAVE” are
scored higher than the scale of the “Physical only” group. The same tendency prevailed in the
“Mass Flow Rate Determination” observatory component. Measured time lapse data also
indicate a similar tendency. Correspondingly, based on Likert scale aggregates, students in the
“DTVR” and the “CAVE” modules appeared more familiar with experiment procedures than
students in the “Physical only” module. Alpha vs. Beta student group kinetics show that the
“DTVR” and the “CAVE” modules in general have more Alpha students in its group
composition, implying the number of students familiar with the experiment procedure via
“DTVR” or “CAVE” is larger than that of the “Physical only” module. Interaction among
group member and the level of involvement were also observed to be higher in the “DTVR” and
the “CAVE” modules compared to the “Physical only” module.

Table 3. Summary of Qualitative Direct Observations, Jet Impact Force experiment in
MAE 305 Thermo-Fluids Lab, Fall Semester, 2011
(Likert scale 1 to 5 with number one and five signifying “not familiar” and “very
familiar,” respectively
(1) Balancing Jockey Weight over the Beam (n=39)
Likert Scale Time Lapse (sec) Group Kinetics Comments
Physical #1 3 16.3 1 alpha, 3 beta, 2
non-responsive High hesitation
Physical #2 2 17.2 1 alpha, rest are
non-responsive
Not much
interest
Physical #3 1 27.5 2 alpha, 3 beta
High hesitation,
low interaction
among
DTVR #1 4 8.3 No alpha-beta
group observed
Good interaction
among group
members
DTVR #2 4 6.3
No alpha-beta
group except one
stayed passive
Good interaction
among group
members
DTVR #3 4 13.0
2 alpha, 3 beta,
one stayed
passive
High interest in
alpha group,
good interaction
CAVE #1 4 6.6 3 alpha, 3 beta Alpha group
driven
CAVE #2 4 10.5 1 alpha, 4 beta Excellent group
involvement
CAVE #3 3 22.2 2 alpha, 3 beta,
Group
involvement
moderate to high
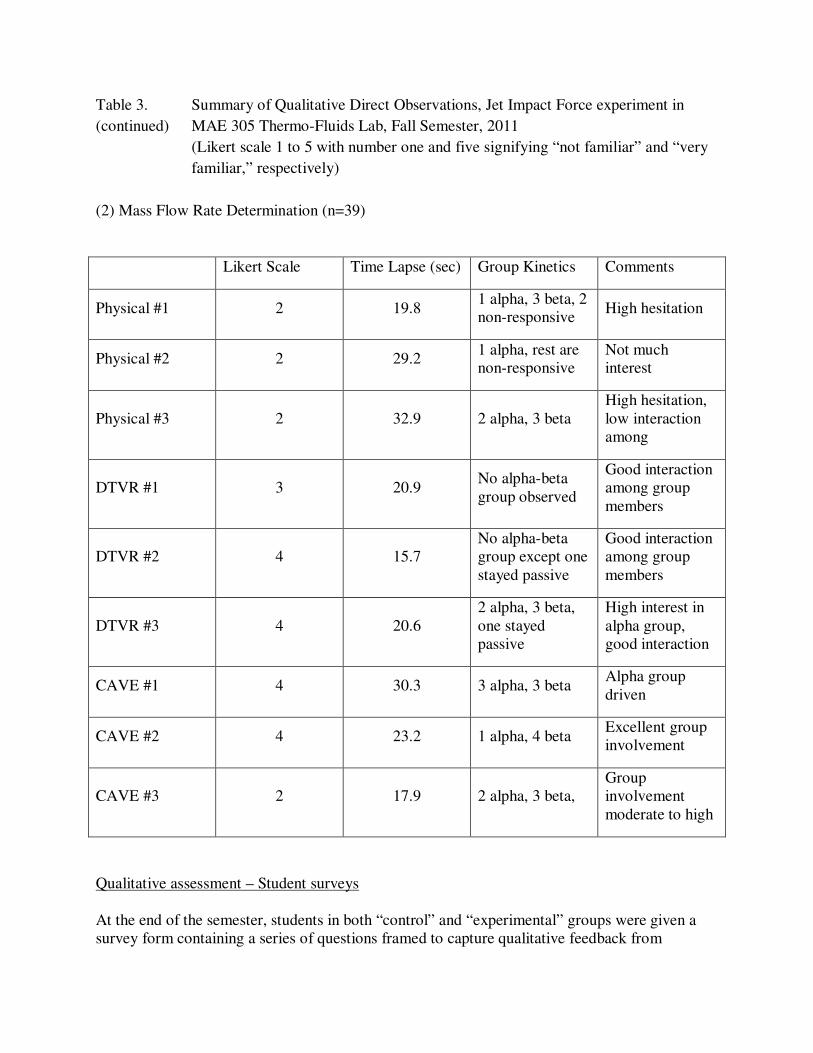
Table 3. Summary of Qualitative Direct Observations, Jet Impact Force experiment in
(continued) MAE 305 Thermo-Fluids Lab, Fall Semester, 2011
(Likert scale 1 to 5 with number one and five signifying “not familiar” and “very
familiar,” respectively)
(2) Mass Flow Rate Determination (n=39)
Likert Scale Time Lapse (sec) Group Kinetics Comments
Physical #1 2 19.8 1 alpha, 3 beta, 2
non-responsive High hesitation
Physical #2 2 29.2 1 alpha, rest are
non-responsive
Not much
interest
Physical #3 2 32.9 2 alpha, 3 beta
High hesitation,
low interaction
among
DTVR #1 3 20.9 No alpha-beta
group observed
Good interaction
among group
members
DTVR #2 4 15.7
No alpha-beta
group except one
stayed passive
Good interaction
among group
members
DTVR #3 4 20.6
2 alpha, 3 beta,
one stayed
passive
High interest in
alpha group,
good interaction
CAVE #1 4 30.3 3 alpha, 3 beta Alpha group
driven
CAVE #2 4 23.2 1 alpha, 4 beta Excellent group
involvement
CAVE #3 2 17.9 2 alpha, 3 beta,
Group
involvement
moderate to high
Qualitative assessment – Student surveys
At the end of the semester, students in both “control” and “experimental” groups were given a
survey form containing a series of questions framed to capture qualitative feedback from
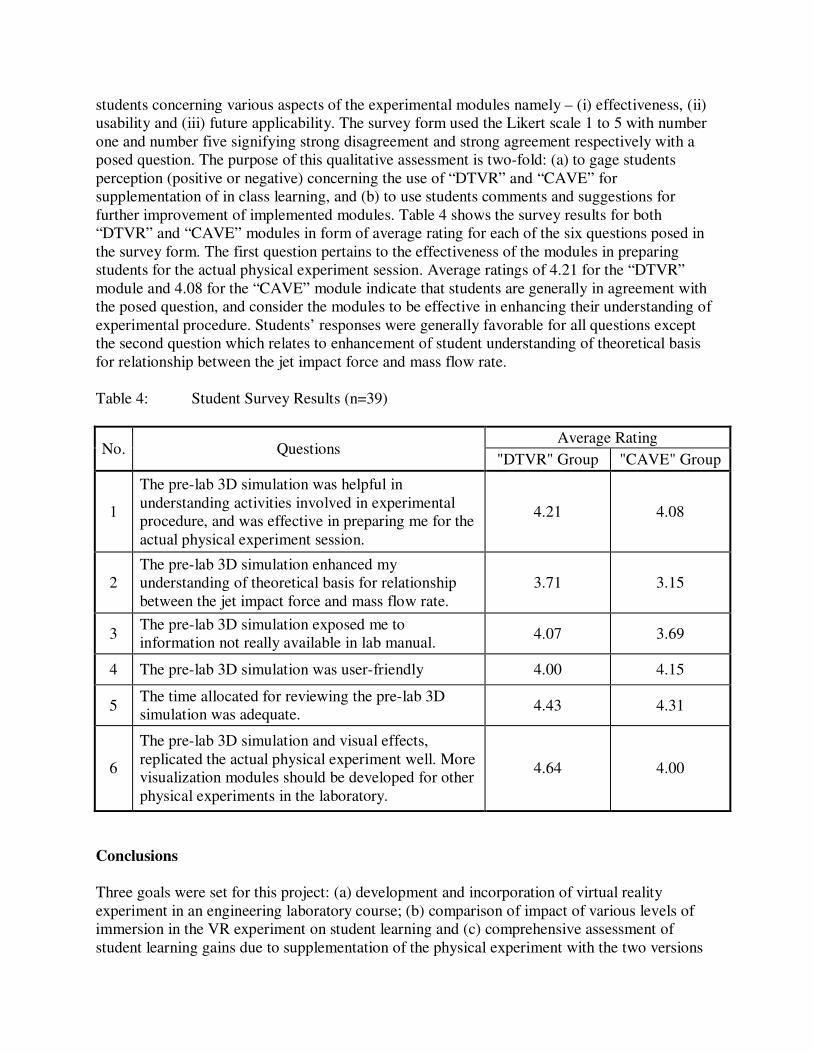
students concerning various aspects of the experimental modules namely – (i) effectiveness, (ii)
usability and (iii) future applicability. The survey form used the Likert scale 1 to 5 with number
one and number five signifying strong disagreement and strong agreement respectively with a
posed question. The purpose of this qualitative assessment is two-fold: (a) to gage students
perception (positive or negative) concerning the use of “DTVR” and “CAVE” for
supplementation of in class learning, and (b) to use students comments and suggestions for
further improvement of implemented modules. Table 4 shows the survey results for both
“DTVR” and “CAVE” modules in form of average rating for each of the six questions posed in
the survey form. The first question pertains to the effectiveness of the modules in preparing
students for the actual physical experiment session. Average ratings of 4.21 for the “DTVR”
module and 4.08 for the “CAVE” module indicate that students are generally in agreement with
the posed question, and consider the modules to be effective in enhancing their understanding of
experimental procedure. Students’ responses were generally favorable for all questions except
the second question which relates to enhancement of student understanding of theoretical basis
for relationship between the jet impact force and mass flow rate.
Table 4: Student Survey Results (n=39)
No. Questions Average Rating
"DTVR" Group "CAVE" Group
1
The pre-lab 3D simulation was helpful in
understanding activities involved in experimental
procedure, and was effective in preparing me for the
actual physical experiment session.
4.21 4.08
2
The pre-lab 3D simulation enhanced my
understanding of theoretical basis for relationship
between the jet impact force and mass flow rate.
3.71 3.15
3 The pre-lab 3D simulation exposed me to
information not really available in lab manual. 4.07 3.69
4 The pre-lab 3D simulation was user-friendly 4.00 4.15
5 The time allocated for reviewing the pre-lab 3D
simulation was adequate. 4.43 4.31
6
The pre-lab 3D simulation and visual effects,
replicated the actual physical experiment well. More
visualization modules should be developed for other
physical experiments in the laboratory.
4.64 4.00
Conclusions
Three goals were set for this project: (a) development and incorporation of virtual reality
experiment in an engineering laboratory course; (b) comparison of impact of various levels of
immersion in the VR experiment on student learning and (c) comprehensive assessment of
student learning gains due to supplementation of the physical experiment with the two versions

of VR experiment. All three goals were achieved either fully or partially, as indicated by
quantitative as well as qualitative assessment instruments used in the study. As discussed earlier,
the virtual reality experiment was successfully developed and embedded in the thermo-fluids
laboratory course during the Fall 2011 semester. The second objective related to assessment of
effects of different levels of immersion on student learning and it was also successfully achieved.
The quiz results indicated that students using the “CVR” module for pre-lab practice runs learned
better compared to students who used the “DTVR” module for practice runs. The student
learning gain as measured by the quiz scores was statistically significant, and indicated that the
“CVR” module with three wall projection system represented a better learning environment
compared to the “DTVR” module.
In order to address the student learning achieved through supplementation of the physical
experiment with virtual pre-lab practice sessions (third goal), both quantitative as well as
qualitative assessment instruments were used. Analysis of quiz results indicated there was no
statistically significant improvement in student learning due to either “DTVR” or “CVR”
supplementation as compared to the “control” group. It is interesting to note that the mean quiz
score for the “CVR” group increased by about 15 percent over the “control” group mean quiz
score. However, the analysis showed that this improvement was statistically insignificant. The
“direct observation” assessment did indicate that students who used either the “DTVR” or the
“CVR” supplementation: (a) were better prepared for the physical experiment; (b) made fewer
mistakes; (c) showed better collaboration among group members and (d) completed key
measurement activities in shorter time span as compared to students in the “control” group. The
student surveys for the “DTVR” and the “CVR” also corroborated the conclusion in (a). One of
the reasons for lack of statistically significant student learning gains, gaged through quiz scores,
may possibly be attributed to differences in demographic profiles of students belonging to
“control” and “experimental” groups. For instance, differences in cumulative GPA for the two
groups would make it difficult to interpret the data for student learning gain. Since demographic
data were not available to authors, further investigation should also account for differences in
demographic profiles, if any. The author plans to continue to assess the VR experiment in the
coming semesters to collect more data and to see if any statistically significant differences in the
outcomes are observed. The author would also like to put forth the argument that for assessing
the impact of interventions or new treatments in laboratory courses, “direct observation”, though
a qualitative measure can also be an indicator of the success of new treatments or educational
strategies of the type discussed here. This is because the “direct observation” rubric used in this
study is a mix of qualitative as well as quantitative measures such as time lapse data that tends to
capture the level of students preparedness reasonably well.
In summary, this paper makes contributions in two areas, namely the development of virtual
reality labs for engineering laboratory courses and assessment of the pedagogy which involves
using the VR experiment for supplementation of physical laboratory experiments. Although
ABET outcomes were not directly addressed, one outcome namely “Can use modern engineering
techniques, skills and tools necessary for engineering practice?” is relevant and directly related to
the project discussed here. Since most engineers use both physical as well as virtual
environments in engineering practice, students’ exposure to both physical and virtual reality
experiments is likely to inculcate in them, the importance of both methods for observing and
analyzing an engineering phenomenon.
Acknowledgement
This work has been supported by the “TUES” program of NSF under the grant DUE-1043895.
Any opinions, findings, conclusions or recommendations expressed in this paper are those of the
author and do not necessarily reflect the views of the National Science Foundation.
References
1. Felder, R. M., “Learning and Teaching Styles in Engineering Education”, Engineering Education, Vol.
78(7), 1988, pp. 674-681.
2. Bates, A. and Poole, G., Effective Teaching With Technology in Higher Education, Jossey-Bass Company,
2003.
3. Chaturvedi, S.K. and Abdel-Salam, T., “A Web-Based Student Learning Tool for Thermodynamics Concepts Related to Multistaging in Compressors and Turbines”, Innovations 2008: World Innovations in
Engineering Education and Research, Aug. 2008.
4. Chaturvedi, S.K. et al., “Mapping of a Thermo-fluids Laboratory Experiment into a Web-based Virtual
Experiment for Application as Prelab Practice Tool”, Innovations 2007: World Innovations in Engineering
Education and Research, Chap. 28, Aug. 2007.
5. Chaturvedi, S.K. and Abdel-Salam, T., “A Web-based Module for Teaching Students About Environment
Effects of Fossil Fuel Combustion”, Computers in Education, Vol. 17, 2007.
6. Mohammad, H., Nguyen, D. and Chaturvedi, S.K., “Simulation and Visualization Enhanced Engineering
Education: The Stiffness Matrix Method Module for Structural Analysis I course”, Modsim World 2007.
7. McCalley, J.D. et al., “Multimedia Courseware Sparks Interest in the Industry”, IEEE Journal of Computer
Applications in Power, Oct. 1998, pp. 26-32.
8. Ozer, T et al., “On Developments in Interactive Web-based Learning Modules in Thermal-Fluids
Engineering Course”, Int. Journal of Engineering Education, Vol. 19, 2003, pp. 305-315.
9. Aziz, E. and Chassapis, C, “On the Design of a Virtual Learning Environment for Mechanical Vibrations”,
37th ASEE/IEEE Frontiers in Education Conference, Oct. 2007, pp. F 2H-1-F 2H-7.
10. National Science Foundation, Fostering Learning in the Networked World, 2008.
11. Hofstein, A., and Lunetta, V.N., “The Role of the Laboratory in Science Teaching: Neglected Aspects of
Research”, Review of educational research, Vol. 52(2), 1982, pp.201-217.
12. Hofstein, A., and Lunetta, V.N., “The Laboratory in Science Education: Foundations of the Twenty-first
Century”, Science Education, Vol. 88(1), 2004, pp. 28-54.
13. Bourne, J. R et Al., “A Model for On-Line Learning Networks in Engineering Education,” Journal of
Engineering Education; Vol. 85, No. 3, 1996, pp. 256-260.
14. Engum, S.A., P. Jeffires, and L.Fisher. “Intravenous Catheter Training System: Computer-based Education Versus Traditional Learning Methods”, The American Journal of Surgery, Vol. 186 (1), 2003, pp. 67-74.
15. Bryden, M. and McCorkle, D., “Virtual Engineering”, Mechanical Engineering, Nov. 2005, pp. 38-42.
16. Bjorklund, S.A., and C.L. Colbeck, “The View from the Top: Leaders’ Perspectives on a Decade of Change
in Engineering Education ,” Journal of Engineering Education, Vol. 90, No. 1, January 2001, pp.13-19.
17. Gorman, M.E., et al. 21, “Transforming the Engineering Curriculum: Lessons Learned from a Summer at Boeing,” Journal of Engineering Education, Vol. 90, No. 1, January 2001, pp.149-149.
18. Chaturvedi, S.K and K. Dharwadkar, “Simulation and Visualization Enhanced Engineering Education-
Development and Implementation of Virtual Experiment in a Laboratory Course”, ASEE Conference,2010
19. Bhargava et al., Web-Based Virtual Torsion Laboratory, Wiley Periodical Inc. 2006.
20. Hashemi, J. et al., “Web-Based Delivery of Laboratory Experiments and Its Effectiveness Based on Student
Learning Style”, ASEE Annual Conference, 2006.
21. Jia, R., et al., “A Virtual Laboratory on Fluids Mechanics”, ASEE Annual Conference, 2006
22. Chaturvedi, S.K., et al., “Virtualization of Physical Experiments using Modeling, Simulation and
Visualization”, 6th Global Colloquium on Engineering Education, 2007, Istanbul, Turkey.
23. Buddu, M., “Virtual Laboratories for Engineering Educations”, International Conference on Engineering
Education, Aug. 2002.
24. Bean, J.C., and Vijaykumar, V., “The Creation of Web-Based Interactive Virtual Experiments on
Microelectronics and Nanoscience for Early Engineering Students”, IEEE/ASEE Frontiers in Education
Conference, 2002, Boston, MA.
25. Wu, Y. et al., “Web-Based Virtual Reality Physics Laboratory”, Proceedings of the 3rd IEEE International
Conference on Advanced Learning Technologies, 2003.
26. Shin, Y., Virtual Reality Simulation in Web- Based Science Education, Wiley Periodicals 2002.
27. Scerbo, M.W. et al., “A Virtual Operating Room for Context Relevant Training”, Proceedings of Human
Factors and Ergonomics Society, Annual Meeting, 2007.
28. Messner, J.I. et al., “Using Virtual Reality to Improve Construction Engineering Education”, Proceedings
of ASEE Annual Conference, 2006.
29. Bell, J.T. and Fogler, H.S., “Virtual Reality in Chemical Engineering Education”, Proceeding of the 1998
ASEE North Central Section Meeting, Detroit, Michigan.
30. Cerf, V. G., et al., National Collaboratories: Applying Information Technologies for Scientific Research,
National Academy Press, Washington, D. C., 1993
31. Grose, T.K., “Can Distance Learning Be Unlocked,” ASEE Prism, April 2003, pp. 19-23.
32. Tuckman, B.W., “Conducting Education Research,” Harcourt Brace Jovanovich Publishers, Orlando,
Florida, 1988.
33. Sprent, P. and N.C.Smeeton, (2007), Applied Nonparametric Statistical Methods, Fourth Edition, Texts
in Statistical Science Series, Chapman & Hall/CRC.

34. Montgomery, D.C and G.C.Runger, (2007), Applied Statistics and Probability for Engineers, 4th Ed., John
Wiley & Sons.
35. SAS/STAT, (1999), Statistical Analysis Systems/STAT User’s Guide, Version 8, SAS Institute.Dede, C.,
“The Evolution of Distance Education: Emerging Technologies and Distributed Learning” The American
Journal of Distance Education, 10(2), 1996.
36. Olds, B.M, Moskal, B.M and Miller, R.L, “Assessment in Engineering Education” Evolution, Approaches
and Future Collaborations, Journal of Engineering Education, Jan. 2005.
37. Canary, D.J and MacGregor, I.M., “Differences That make a difference in Assessing Student
Communication Competence”, Communication Education, Volume 57, issue 1, 2008