Embed Size (px)
Citation preview
AbstractsAmericAn Society of AnimAl Science
Southern Section
February 3-5, 2013Orlando, Florida
ASAS Southern Sectionfuture meeting DAteS AnD locAtionS
2014 Dallas, Texas February 1-4, 20142015 Atlanta, Georgia February 3-6, 20152016 Jacksonville, Florida February 6-9, 20162017 Mobile, Alabama February 4-7, 2017
table of contents
Undergraduate Student Competition .......................................................................................................................... 1
Graduate Student Competition ................................................................................................................................... 3
Teaching and Undergraduate Education .................................................................................................................... 6
Breeding and Genetics ............................................................................................................................................... 7
Meat Science ............................................................................................................................................................ 10
Ruminant Animal Production I ................................................................................................................................ 12
Pastures and Forages ................................................................................................................................................ 15
Physiology................................................................................................................................................................ 16
Extension I ............................................................................................................................................................... 22
Small Ruminant Production ..................................................................................................................................... 26
Ruminant Animal Production II ............................................................................................................................... 28
Extension II .............................................................................................................................................................. 29
2013 Southern Section ASAS Committees .............................................................................................................. 34
Southern Section ASAS Past Presidents .................................................................................................................. 35
Southern Section ASAS Past Award Recipients ...................................................................................................... 36
Author Index ............................................................................................................................................................ 40
Keyword Index ......................................................................................................................................................... 42

4
4 1
SymPoSiA AnD orAl SeSSionS
monday, february 4, 2013
undergraduate Student competition
1 Hypothalamic and Pituitary Gene Expression in Angus-Sired Steers Selected for Low and High Residual Feed Intake During Conditions of Heat Stress S. D. Perkins 1,*, C. N. Key 1, C. F. Garrett 1, C. D. Foradori 2, C. L. Bratcher 1, L. A. Kriese-Anderson 1, T. D. Brandebourg 1, 1Animal Sciences, 2Anatomy Physiology & Pharmacology, Auburn Univer-sity, Auburn, AL
Residual feed intake (RFI) is a heritable feed efficiency measure. The relationship between RFI, heat stress and expression of neuroregula-tory genes is unknown. To address these issues, 48 Angus-sired steers were trained to the Calan Gate (Northwood, NH) system. Daily feed intake and RFI were assessed during a 70 day feeding trial conducted July through September. The test diet was 50% balage consisting of a winter annual mix, 50% grain (2.9 Mcal ME/kg DM). Feed intake was recorded daily while body weights and hip heights were record-ed at 14 day intervals. RFI was calculated for each animal as the dif-ference between actual dry matter intake and the expected intake to create two divergent cohorts consisting of High (H) and Low (L) RFI individuals. At slaughter, hypothalamic and pituitary tissue samples were collected to fac and ilitate gene studies into the mechanisms un-derlying variation in RFI. Growth data were analyzed using a mixed model with RFI level (L, H) as the independent variable (SAS, 2002). Means were separated using lsmeans at a significance level of P < .05. The lsmeans for RFI were -1.2 and .99 respectively for the L and H cohorts (P < .0001) and were greater than two standard deviations apart. As expected dry matter intake was higher for the H individuals versus the L steers (P < .0001) while on-test gain was not different between groups. Real-Time PCR studies in the arcuate nucleus indi-cate that neuropeptide Y (NPY), agouti related protein (AgRP), and relaxin-3 mRNA were expressed 2.8-fold, 1.95-fold and 2.04-fold greater while Pro-opiomelanocortin (POMC)mRNA was expressed 36% lesser in L than H animals. Interestingly, gonadotropin releas-ing hormone (GnRH) mRNA expression was 76% lower in L than H animals which correlated to lower expression of follicle stimulat-ing hormone beta (FSH) and luteinizing hormone beta (LH) in the pituitary of L animals. These data indicate the mRNA expression of neuropeptides that stimulate feed intake were increased in efficient animals during heat-stressed conditions and GnRH may play a role in this adaptive response.
Keywords: cattle, heat stress, RFI
2 Leptin is Involved in the Vascularization of the Corpus Lu-teumA. Arellano 1,*, L. Ayala 1, M. Ramirez 1, A. Calderon 1, R. Flores 1, D. Keisler 2, R. Stanko 1, M. Garcia 1, 1Animal, Rangeland & Wild-life Sciences, Texas A&M University, Kingsville, 2Division of Animal Science, University of Missouri, Columbia
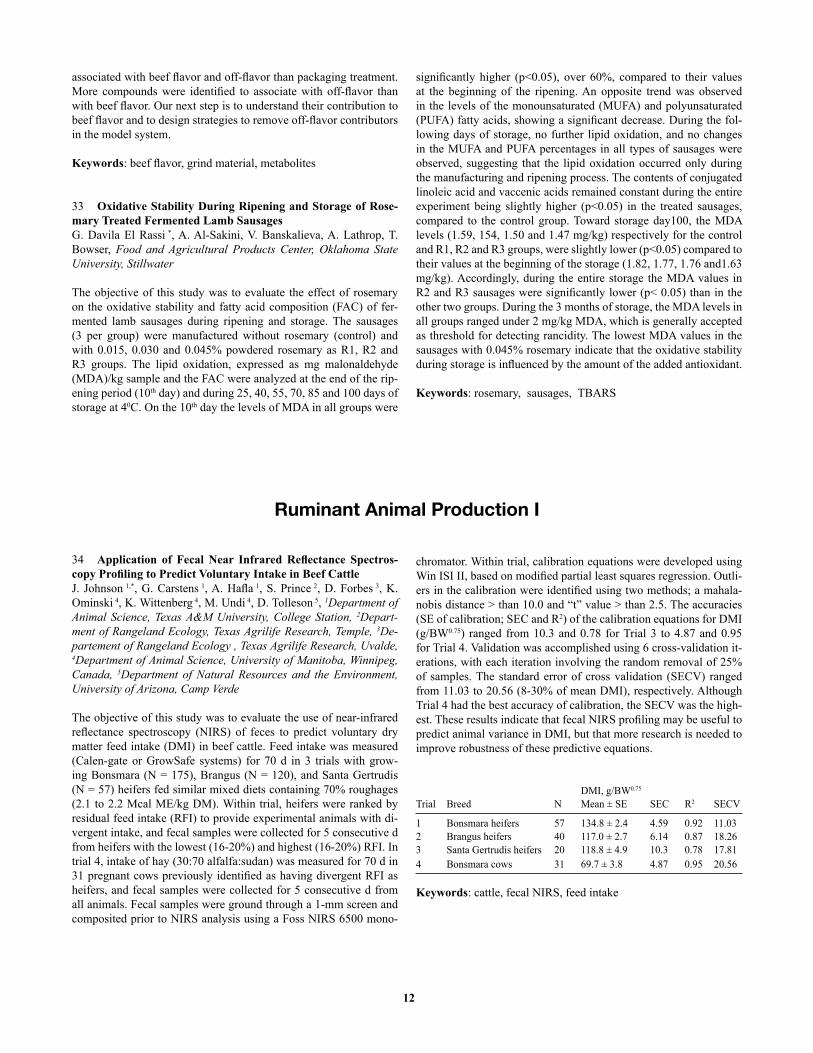
Improper vascularization of the corpus luteum (CL) has been im-plicated in the loss of a conceptus. We previously reported that an-giogenic hormones in the CL are regulated by leptin during luteal development; therefore, it is hypothesized that modifying available ovarian leptin will alter vascularization of the developing CL. The objectives were to determine the in vivo effect of leptin 1) on early luteal development and 2) on luteal angiogenic hormones. Eleven cycling crossbred does of similar age were randomly allocated to one of four treatment groups: Control [C; saline in 2.5U heparin (ve-hicle) only; n=3], rabbit anti-leptin antibody + saline [AL+S; AL an-tibody (1:10 dilution) in vehicle + vehicle only; n=3], saline + leptin [S+L; vehicle + leptin (1ug, ovine leptin) in vehicle; n=2), and rab-bit anti-leptin antibody + leptin (AL+L; in vehicle; n=3). At estrus (D0), a 7-day osmotic infusion pump-catheter apparatus was surgi-cally inserted in apposition to the convoluted ovarian artery. The catheter contained the first component of each treatment (vehicle or anti-leptin) for infusion over 3 days and pumps contained the second component of each treatment (vehicle or leptin) for infusion over the remaining 4 days at a flow rate of 0.5 μl/hr. On D8, ovaries were sur-gically removed for CL collection and analysis. Blood samples were collected via jugular venipuncture, from D0 until D8 for analysis of serum progesterone during the infusion period. Data was analyzed using MIXED procedures of SAS. Lutea from the AL+L treatment were underdeveloped but tended (P=0.08) to have a higher number of large diameter vessels (1392 ± 264) per CL than the C group (825 ± 80). Moreover, progesterone production was low (P<0.05) in all treatment groups (0.35 ± 0.12 ng/ml; pooled means) compared to controls (1.87 ± 0.86 ng/ml). Although luteal expression of VEGF and FGF2 did not differ relative to treatment, Ang1 was significantly lower (P<0.05) in all treatments compared to controls. Collectively, the evidence supports the supposition that leptin appears to be in-volved in early luteal vascularization.
Keywords: leptin CL vascularization
2
3 Characterizing the Growth and Metabolic Phenotype of the Obese Mangalica PigC. F. Garrett 1,*, S. D. Perkins 1, R. H. Amin 2, C. L. Bratcher 1, J. L. Bartosh 1, T. D. Brandebourg 1,1Animal Sciences, 2Pharmacal Sci-ences, Auburn University, Auburn, AL
The Southeast is at the epicenter of an obesity epidemic causing in-creased incidences of diabetes and heart failure in our stakeholders. Unfortunately, mechanisms underlying the development of obesity are poorly understood. To address this, the Blonde Mangalica (BM) pig was imported to Auburn University for use as a translational model of human obesity and as a model to study adipose devel-opment and meat quality given its extreme, early onset, morbidly obese phenotype. Feed intake and growth data were assessed dur-ing a growth trial. After chilling for 24 hours post harvest, carcass characteristics were measured. Carcass and growth data were ana-lyzed using a mixed model with breed as the independent variable (SAS, 2002). BM exhibit 3-fold greater subcutaneous (s.c.) and 2.5-fold greater intramuscular (i.m.) adipose tissue mass than weight-matched, lean Yorkshire (YS) controls (P<.001). Likewise feed per gain was 13% higher and average daily gain 32% lower in BM than YS pigs (P<.01). Leptin and TNFα mRNA expression were 80% and 173% higher in Mangalica s.c. (P < .05), suggesting the extreme adiposity of these pigs is associated with the development of an in-flammatory state. Obese Mangalica exhibit severe fasting hypogly-cemia, decreased blood creatine kinase activity, and increased blood AST and g-glutamyl transpeptidase (GGT) levels, indicating devel-opment of hepatic dysfunction. BM pigs also displayed impaired glucose tolerance following oral glucose challenge, consistent with the development of obesity-induced insulin resistance. Initial im-aging studies at the Auburn University MRI Research Center have optimized parameters to measure ventricular wall thickening, sys-tolic and diastolic ejection volumes and vessel wall thickness. Al-lelic variation in the porcine melanocortin-4 receptor (pMC4R) gene sequence within BM is being characterized with initial sequences indicating potential mutations exist. These data indicate obese Man-galica pigs have a metabolic phenotype as evidenced by impaired glucose homeostasis and a proinflammatory shift in gene expression that is consistent with the development of frank diabetes.
Keywords: adipose tissue, obesity, pig
4 Relationship of Prenatal Transportation Stress with Post-natal Temperament of Brahman CalvesB. P. Littlejohn 1, 2,*, D. M. Price 1, 2, A. W. Lewis 2, D. A. Neuendorff
2, J. A. Carroll 3, R. C. Vann 4, T. H. Welsh, Jr. 1, 5, R. D. Randel 2, 1Ani-mal Science, Texas A&M University, College Station, 2Texas A&M AgriLife Research, Texas A&M University System, Overton, 3Live-stock Issues Research Unit, USDA-ARS, Lubbock, TX, 4MAFES- Brown Loam, Mississippi State University, Raymond, 5Texas A&M AgriLife Research, Texas A&M University System, College Station
The objective of this experiment was to examine the relationship be-tween prenatal stress (S) and gestation length (GL), calf birth weight (CBW), and subsequent temperament during the first 28 d of life. There were 44 control (n= 27 male and n= 17 female) and 45 pre-natally stressed (n= 21 male and n= 24 female) calves. The prenatal stressor was transportation for 2 hr at 60, 80, 100, 120, and 140 d of gestation. By 24 hr after parturition, GL, CBW and sex of calf were recorded. On d14 and 28 after birth, pen score (PS; 1= calm and 5= excitable), exit velocity (EV; m/sec) and temperament score (TS= PS + EV/2) were recorded for each calf. Gestation length and
CBW were analyzed by ANOVA. The GL (d) tended to be affected by a treatment by sex interaction (P= 0.0767) and was less for S vs control females (291.4 ± 1.3 vs 295.3 ± 1.6 d) but similar in S vs control males (296.4 ± 1.4 vs 295.2 ± 1.3 d). Birth weight (kg) was greater (P= 0.006) in males, and tended (P= 0.088) to be greater in S calves (S= 39.5 ± 0.07; control= 37.8 ± 0.07). Pen score, EV and TS data were analyzed using procedures of SAS specific for repeated measures. Pen score was affected by prenatal stress (P= 0.0475) but not by sex (P= 0.6806) or sex by treatment (P= 0.3236). Specifi-cally, PS was greater for S (d14= 2.8 ± 0.2 and d28= 3.0 ± 0.2) than control calves (d14= 2.3 ± 0.2 and d28= 2.3 ± 0.2). Exit velocity was affected by treatment (P= 0.0435) but not by sex (P= 0.5674) or sex by treatment (P= 0.3382) with EV greater in S (d14= 1.4 ± 0.1 and d28= 1.9 ± 0.1 m/sec) than control calves (d14= 0.9 ± 0.1 and d28= 1.7 ± 0.1 m/sec). The TS was affected by treatment (P= 0.0269) but not by sex (P= 0.5517) or sex by treatment (P= 0.3461). Tempera-ment score was greater in S (d14= 2.1 ± 0.02 and d28= 2.5 ± 0.2) than control calves (d14= 1.6 ± 0.2 and d28= 2.0 ± 0.2). In this study prenatal stress was associated with tendencies for decreased GL of heifer calves and increased CBW of calves perhaps due to alteration of fetal growth and adrenal function during gestation. As calves sub-jected to stress during gestation were more excitable, this excitability could impact their future health and performance as neonates.
Keywords: Calves, Prenatal Stress, Temperament
5 Investigating the Population Structure and Genetic Diver-sity of Angus CattleR. A. Lemcke 1,*, R. Zanella 1, 2, K. C. Caires 1, 1Department of Animal Science, Berry College, Mount Berry, GA, 2Genética e Melhoramen-to Animal, Embrapa Suínos e Aves, Concórdia, SC, Brazil
Understanding the structure of animal populations is essential for sustainable genetic improvement. The objectives of this study were to determine the population structure and the genetic diversity of Angus cattle, a beef breed of economic importance, using families of the breed’s most prominent sires. To accomplish these goals, the generation interval (L), quantity of effective founders, inbreeding co-efficient (Fx), relationship coefficient (Rxy) and effective population size (Ne) were calculated per annum from pedigree records of 3,121 animals born 1842-2005 and registered in the American Angus As-sociation’s herdbook. Pedigree and kinship2 packages were used in an R-statistical environment to determine Fx and Rxy values, respec-tively. Pedigree depth and L for the sample population were calculat-ed to be 14.9±0.15 generations and 5.98±0.071 years, respectively, and effective founders (≥150 associated offspring) consisted of 136 sires (9.043%) and 102 dams (6.308%). Fx levels for animals from birth years 1955-2005 were 0.478±0.0744%, and Rxyvalues for the reference population were 2.29 ± 0.00358%.The calculated Ne from 1955-2005 was 74±17 individuals. The Ne in 2005 was large (>62 reproducing unrelated animals) and the number of founder animals supplying genetic variation to descendants is diminutive in relation to the reference population (1955-2005), indicating acceptable lev-els of genetic diversity in the registered Angus cattle population. Interestingly, intense selection pressure to improve economically important traits (e.g., carcass merit) in recent years (2000-2005) was concomitant with increased levels of Fx and Rxy between animals. This rapid tradeoff in diversity may be detrimental to genetic im-provement in the future and will be the focus of future investigation.
Keywords: Animal Breeding, Genetic Improvement, Quantitative Genetics
2 3
graduate Student competition
6 Replacing Corn with Brewers Rice in Swine Diets and Ef-fect on Performance and Carcass Quality of Growing-Finishing PigsT. Dokes *, O. Gekara, Agriculture, University of Arkansas, Pine Bluff
The objective of this study was to determine the effect of replacing corn, with brewers rice which is a by-product of rice milling, in swine diets on performance and carcass of growing-finishing pigs. Sixteen Yorkshire x Duroc x Hampshire crosses BW = 75 ± 6kg were randomly assigned to either corn/soybean meal (CSM; control) or brewers rice/soybean meal (BSM) diet. The CSM diet comprised of 78.2% corn, 10.0% soybean meal, 8.15% alfalfa pellets and the rest were mineral and vitamin ingredients; the BSM diet contained 76.8% brewers rice, 13.2% soybean meal, 5.6% alfalfa pellets and the rest were mineral and vitamin ingredients. The two diets were isonitrogenous and for-mulated to contain 14% CP; ME for CSM and BSM diet was 3,018 and 2,730 Kcal/kg, respectively. The experiment lasted 32 d and the average BW of finished pigs was 97 ± 6kg. All data were analyzed using ANOVA of SAS. Variables determined included ADG, fecal DM output, apparent total tract digestibility (ATTD) of N, G:F, cost of gain, back fat thickness and carcass quality (yield, LEA, and fat depth). Re-placing all corn with brewers rice had no (P>0.10) significant effect on G:F, back fat thickness, and carcass quality of growing-finishing pigs. Compared to pigs on corn diet, pigs fed brewers rice diet gained faster (P<0.01; 0.712 vs. 0.581 kg/day), had lower (P<0.001) fecal DM (0.171 vs. 0.322 kg/day) and N (0.006 vs. 0.012 kg/day) output, greater (P<0.001) ATTD (91.6 vs. 84.1%), and lower (P<0.05) cost of gain ($1.23 vs. $1.88/kg gain). Brewers rice can replace all corn in diets for growing-finishing pigs and greatly reduce fecal loss of N without compromising pig performance and carcass quality.
Keywords: Corn, Brewers Rice, Growing-Finishing Pigs, Pig Per-formance, Pig Performance, Carcass Quality
7 Analysis of Quality of Non-Traditional Vs. Traditional Beef Grind MaterialS. Degeer *, D. A. Tigue, C. Bratcher, Animal Sciences, Auburn Uni-versity, Auburn, AL
Increased amounts of fat in ground beef negatively effects shelf life. High fat ground beef should oxidize faster and become unacceptable to consumers. Oxidative and color quality differences were evalu-ated between traditional (non-branded beef) and non-traditional (branded beef) beef trim used as grind materials for ground beef products. Three traditional grinds (T) were compared with seven non-traditional grinds (N) with % fat as defined: 7 (T1), 11 (T2), 16 (T3), and 6 (N1), 8 (N2), 11 (N3), 20 (N4), 21 (N5), 28 (N6) and 29 (N7). Grind material was selected based on current industry avail-ability. All grinds were packaged in overwrapped trays (OW), clear chubs (CH), or overwrapped trays in a low oxygen modified atmo-sphere bag (MAP). The packages were placed in a retail display case. Three packages from each grind/package treatment were removed on d0. Daily, 5 packages from each package/grind treatment were selected at random for instrumental color evaluation. After d5 of re-
tail display, packages were evaluated based on oxidative rancidity by thiobarbituric acid reactive substances (TBARS). Data were ana-lyzed using the PROC GLM procedure of SAS. For days of display, L* values were not different (P > 0.05) until d3, a* values were all different (P < 0.0001), and b* values were different (P < 0.05) except d2 and d3 (P = 0.06). Among packaging, all treatments were differ-ent for L*, a* and b* (P < 0.05). N5 and N7 had the greatest TBARS values. Days 4 and 5 had the greatest values for TBARS (1.7 and 1.5 mg malondialhyde (MDA)/kg meat, respectively). All packaging treatments were different for TBARS values. MAP had the highest level, followed by OW and CH (1.73, 1.34 and 0.90 of mg MDA/kg of meat, respectively). Overall, as the fat percentage in ground beef increases, the TBARS and L* values increase, and a* and b* values decrease. Additionally, as day of display increase, TBARS values do not change until d3. Packaging can reduce lipid oxidation with CH slowing oxidation the most followed by OV and MAP.
Keywords: color, ground beef, packaging
8 Effects of Mannan Oligosaccharide on Beef Cow Perfor-mance and Passive Immunity Transfer to Calves S. K. Linneen *, G. L. Mourer, J. D. Sparks, D. L. Lalman, Animal Science, Oklahoma State University, Stillwater
The objective of this experiment was to determine whether feeding mannan oligosaccharide (MOS) to beef cows during late gestation through 30 d lactation would improve cow and calf growth perfor-mance and passive immunity transfer to the calf. Angus and Angus x Hereford cows (n = 74; BW = 569 ± 68kg) were allotted by BW and age in a completely randomized design. Cows were assigned and individually fed 1 of 2 treatments: 1) 1.36 kg/d during gesta-tion of a cottonseed meal-based 30% CP supplement and 1.81 kg/d during lactation of a cottonseed meal-based 38% CP supplement (Control); 2) Control plus 10 g/d MOS (Bio-Mos®; Alltech, Inc., Nicholasville, KY). Experimental supplementation began on Febru-ary 14, 2012 and was terminated after cows consumed the lactation diet for at least 30 d. Cow and calf blood and colostrum were col-lected within 12 h of parturition. Supplementation ended on May 1, 2012 resulting in an experimental treatment period ranging from 52 to 80 d. Data were analyzed using Mixed Models in SAS 9.3 with animal as experimental unit, treatment as a fixed effect, and cow age, calving d, initial body condition score, and D-0 Ig concentration as potential covariates. MOS treated cows tended to maintain more BW from calving through the end of the feeding period (P=0.07). Simi-larly, cows consuming MOS were better able to maintain BCS from initiation of the study through weaning (P=0.05). At parturition, sig-nificant differences for IgG1 concentrations in colostrum (P=0.36; CV = 96), cow serum (P=0.55; CV=39) or calf serum (P=0.11; CV=93) were not detected. Similarly, parturition calf serum IgG2, IgA, or IgM concentrations were not significantly different (P>0.14). Adding MOS to winter supplement may limit BCS loss following parturition in spring calving beef cows. However, further research is needed to determine if passive immunity is enhanced.
Keywords: Calves, Cows, immunity
4
9 Effect of Lactic Acid Enhancement pH on Beef Quality At-tributes of Mature Bull Strip LoinsJ. Hollenbeck *, J. Apple, J. W. Yancey, A. Young, C. Moon, T. John-son, D. Galloway, Division of Agriculture, University of Arkansas, Fayetteville
Beef from mature bulls was used to test the effects of lactic acid (LA) enhancement solution pH (2.5, 3.0, or 3.5) on fresh and cooked color and tenderness of strip loin steaks. Treatments included a non-enhanced USDA Select (Sel; pH = 5.62) control, a non-enhanced bull (B0, pH = 6.09) control, and bull sections injected to 111% with pH 2.5 (B25; pH = 6.32), 3.0 (B30; pH = 6.10), or 3.5 (B35; pH = 5.70) solutions made by buffering LA into a 0.25% sodium bicarbon-ate and tap water. After enhancement, strip loin sections were vac-uum-tumbled, and vacuum-packaged overnight before fabrication into 2.5-cm-thick steaks that were either aerobically packaged and placed into simulated retail display (4°C and 1,600 lux lighting) for 5 d, or vacuumed-packaged and frozen (-20°C) for Warner-Bratzler shear force (WBSF) and myofibril fragmentation index (MFI). In-strumental color was measured each day of display. Packaged steaks were cooked to 71°C, evaluated for cooked color within 2 min of slicing, and cores from each steak were used to measure WBSF. Post-enhancement pH of B25 and B35 sections tended to be less (P = 0.06) than B0, but the pH of enhanced sections was similar to Sel. On d 0 of display, Sel steaks were redder (higher a*) than B0 steaks, but, on d 4 and d 5, Sel steaks were less red than B0, B25, B30, and B35 (treatment × time, P < 0.01). Steaks from B0 were least (P < 0.05) yellow (lowest b*), and Sel steaks were more (P < 0.05) yellow than B25 and B30 steaks. Instrumental cooked color was similar (P ≤ 0.08) among the treatments; however, Sel and B35 steaks received greater (P < 0.05) visual cooked color scores than B0, whereas Sel, B25, and B35 were rated higher (P < 0.05) for internal doneness than B0. Sel steaks had greater (P < 0.05) MFI, and lower (P < 0.05) WBSF, values than steaks from bull strip loins, regardless of LA enhancement solution pH. Results suggest that LA enhancement im-proved fresh and cooked color attributes similar to Sel, but solution pH failed to produce WBSF values comparable to Sel.
Keywords: Bull Beef, Color, Lactic Acid Enhancement
10 Sensory Evaluation of Non-Traditional vs. Traditional Beef Grind SourcesD. A. Tigue *, S. L. Degeer, C. L. Bratcher, Department of Animal Sciences, Auburn University, Auburn, AL
Sensory evaluation was performed to determine the role of fat per-centage in traditional (non-branded) and non-traditional (branded) grind materials. Three traditional grind sources (T) were compared with seven non-traditional grind sources (N): 7% fat (T1), 11% fat (T2), 16% fat (T3), and 6% fat (N1), 8% fat, (N2), 11% fat (N3), 20% fat (N4), 21% fat (N5), 28% fat (N6) and 29% fat (N7). All grind materials were packaged in overwrapped foam trays (OW), clear chubs (CH), and overwrapped foam trays in low oxygen modi-fied atmosphere bags (MAP). Retail display was conducted for 5 d immediately after packaging on OW, CH was kept in dark storage for 3 d and MAP was kept in dark storage for 11 d and then placed in re-tail display for 5 d to simulate industry practices for each respective packaging treatment. Starting at d 0, 3 packages from each grind/package treatment were removed and frozen for further analysis on each display day. After completion of the retail display period, the
packages were thawed and samples were taken from each for sen-sory evaluation of initial juiciness, sustained juiciness, cohesiveness, beef flavor intensity, off flavor, and cook loss. Data were analyzed using the mixed procedure of SAS. Between grinds and display days, differences were seen (P<0.05) in all sensory attributes. Between package types, differences were seen (P<0.05) in all sensory attri-butes except initial juiciness. Data indicate that packaging treatment and display time as well as additional factors beyond fat percentage influence sensory attributes in traditional (non-branded) and non-traditional (branded) grind materials.
Keywords: Ground beef, packaging, Sensory Evaluation
11 Effects of Bale Feeder Type and Supplementation of Mo-nensin on Hay Waste, Intake, and Performance of Beef CattleJ. D. Sparks 1,*, A. J. Sexten 1, C. P. McMurphy 1, G. L. Mourer 1, M. A. Brown 2, C. J. Richards 1, D. L. Lalman 1, 1Animal Science, Okla-homa State University, Stillwater, 2Grazinglands Research Labora-tory, USDA-ARS, El Reno, OK
The effects of feeder type and supplemental monensin on hay utiliza-tion in beef cows was investigated using 56 crossbred gestating beef cows (BW= 494 ± 50 kg; BCS= 5.2 ± 0.5) in a split-plot treatment ar-rangement with a completely randomized design. Supplement treat-ment served as the main plot and round bale feeder design was the subplot. Supplement treatments included a 36% CP cottonseed meal based pellet with 0 (CONT; control) or 200 mg/head of monensin (MON), fed at a rate of 1.36 kg/ head daily. Feeder design treatments included a conventional open bottomed steel ring (OBSR), a sheeted bottomed steel ring (RING), a polyethylene pipe ring (POLY), and a modified cone feeder (MODC). Cows were weighed and allot-ted based on BW to one of four previously grazed 2.0 ha paddocks equipped with a 12.2 x 7.6 m concrete feeding pad. Hay waste was measured daily and orts were measured when approximately 100 kg of hay remained in the feeder. Hay waste was significantly af-fected by hay feeder design with 5.6, 20.6, 21.5, and 12.7% waste for MODC, OBSR, POLY, and RING respectively (P<0.01). There was a trend for DMI to differ among feeder types (P=0.12), but not for supplement treatments (P=0.45). Supplementing with MON resulted in improved cow performance with regard to final BCS, weight gain, BCS gain, and ADG (P<0.05). Apparent OM, NDF, and ADF di-gestibility was increased (P<0.05) with MON supplementation. The results of this study indicate that feeder design can greatly impact the amount of hay required to maintain beef cows. Furthermore, supplemental MON in this study positively altered apparent digest-ibility. The combination of using a hay conserving feeder design and supplemental monensin has the potential to dramatically reduce the amount of hay required in wintering systems for beef cows.
Keywords: beef cattle, hay feeding, monensin
12 Effects of Increasing Metabolizable Protein Supply on the Acute Phase Response of Beef Steers Following VaccinationP. Moriel *, P. G. Martins, J. M. Vendramini, J. D. Arthington, Range Cattle Research and Education Center, University of Florida, Ona
Our objective was to evaluate the effects of increasing metabolizable protein (MP) supply, through RUP supplementation, on the acute phase response of beef steers following vaccination. Brangus-cross-
4 5
bred steers (n = 24; 173 ± 31 kg; 175 ± 16 d of age) were randomly assigned to receive 1 of 3 isocaloric diets (85% concentrate, 15% stargrass hay; DM basis) formulated to provide 85, 100 and 115% of the daily MP requirements of a beef steer gaining 0.66 kg of BW dai-ly. Diets were limit-fed at 1.77% of BW (DM basis) and individually provided to steers once daily (0800 h) from d -7 to 22. Steers were weighed on d -7 and 22, following a 12-h period of feed and water withdrawal. On d 0, steers were vaccinated against Mannheimia hae-molytica (OneShot, Pfizer), and blood samples were collected on d -7, 0, 1, 3, 7, 14 and 22. Data were analyzed as repeated measures us-ing the MIXED procedure of SAS. Final BW and ADG were similar (P ≥ 0.68) among treatments (mean = 184 ± 9 kg and 0.5 ± 0.08 kg/d, respectively). Time effects were detected (P < 0.01) for plasma con-centrations of all acute phase proteins, which peaked between d 1 to 7, returning to baseline concentrations by d 22. No treatment effects were detected (P ≥ 0.19) for plasma concentrations of fibrinogen, se-rum amyloid-A, acid-soluble protein, and albumin. Plasma concen-trations of total plasma protein (TPP) and blood urea nitrogen (BUN) increased (P ≤ 0.05) with increasing supply of MP (87.1, 89.6 and 90.1 ± 1.09 mg TPP/mL and 6.1, 8.3 and 10.3 ± 0.41 mg BUN/dL for 85, 100 and 115% MP respectively). Steers provided 115% MP had lower (P < 0.001) plasma concentrations of ceruloplasmin (Cp) from d 0 to 22 than steers fed 85 and 100% MP, which had similar plasma concentrations of Cp. On d 7, plasma concentrations of haptoglobin were greatest (P ≤ 0.06) for steers fed 115% MP, intermediate for steers fed 100% MP, and least for steers fed 85% MP (0.98, 0.71 and 0.44 ± 0.099 mg/mL, respectively). Thus, the acute phase response of beef steers fed increasing metabolizable protein supply was en-hanced following vaccination against M. haemolytica, as indicated by greater plasma concentrations of haptoglobin.
Keywords: Acute phase protein, steers, vaccination
13 Estrous Response and Pregnancy Rates in Beef Cows Fol-lowing a 6 or 7 Day CIDR Synchronization ProtocolA. J. Davis *, R. W. Rorie, J. G. Powell, T. D. Lester, E. A. Backes, B. R. Lindsey, Animal Science, University of Arkansas, Fayetteville
Objective was to compare estrus response and pregnancy rates of Angus and Angus x Hereford cows synchronized with 6 (n = 30) or 7 d (n = 31) CIDR and bred via AI. We hypothesize that an es-trus synchronization protocol utilizing CIDR removal 24 h after prostaglandin F2α (PGF) administration may result in tighter estrus synchronization than protocols where CIDRs are removed at time of PGF injection. Cows were assigned to treatment based on par-ity, BW, BCS, cyclicity, and postpartum interval (PPI). All cows re-ceived a CIDR progesterone insert on d 0 and were treated with PGF on d 6. Treatment (Trt) 1 CIDRs were removed on d 6 while Trt 2 CIDRs were removed on d 7 (24 h after PGF injection). All cows were observed for estrus and inseminated 8 to 24 h following onset of estrus. Any cows not displaying estrus by 72 h following PGF treatment were treated with gonadorelin (GnRH) and inseminated at 96 h. One week following the end of estrus detection, all cows were placed with fertile bulls for 45 d. Pregnancy rates were determined via ultrasonography approximately 45 d following AI and 30 d fol-lowing removal of bulls. Analysis of variance indicated the interval from CIDR removal to estrus was less for Trt 2 than Trt 1 (45.2 versus 52.0 h, respectively; P < 0.01). In Trt 2, 100% of cows that exhibited estrus did so within a 12 h period versus 75% in Trt 1. Chi
Square was used to determine effects of Trt upon estrus response, AI pregnancy, and seasonal pregnancy. Cows detected in estrus after synchronization were similar (P = 0.83) at 74.1 and 71.4% for Trt 1 and Trt 2, respectively. AI pregnancy rates were similar (P = 0.66) at 63% for Trt 1 and 57.1% for Trt 2. Seasonal pregnancy rates were also similar (P = 0.53) at 92.6 and 96.4% for Trt 1 and Trt 2, respec-tively. Data indicates removal of CIDR 24 h following PGF injec-tions in Trt 2 resulted in earlier estrus and tighter synchronization of cows over a 12 h period. Additional studies are needed to determine if differences exist for AI pregnancy rates achieved through use of 6 or 7 day CIDR protocols.
Keywords: artificial insemination, estrus synchronization, pregnan-cy rates
14 Sericea Lespedeza as an Aid in the Control of Eimeria Spp. in LambsM. Acharya 1,*, J. M. Burke 2, J. Miller 3, T. Terrill 4, J. A. Mosjidis 5, 1Animal Science, University of Arkansas, Fayetteville, 2USDA, Ag-ricultural Research Service, Booneville, AR, 3Department of Patho-biological Sciences, School of Veterinary Medicine, Louisiana State University, Baton Rouge, 4Agricultural Research Station, Fort Valley State University, Fort Valley, GA , 5Department of Agronomy and Soils, Auburn University, Auburn, AL
Coccidia, a diarrhea causing protozoan parasite, is a significant health and production challenge for sheep during times of stress. Typical treatment involves the administration of sulfa drugs and am-prolium, a thiamine antagonist. This research examines the effect of sericea lespedeza (SL) for control of coccidiosis in lambs. In Exp. 1, naturally infected lambs (n = 76; 23 ± 1 kg) weaned at 102.7 ± 1.4 d of age were randomly assigned to groups receiving 2% BW/d of either alfalfa pellets (n = 38, control) or SL (n = 38, treatment) with or without amprolium added to drinking water. Fecal oocyst count (FOC), fecal egg count (FEC), and fecal score (FS; 1 = solid pellets; 5 = slurry) were determined from the day of weaning to 21 d post-weaning in 7 d intervals. In Exp. 2, naturally infected lambs (n = 72; 20 ± 1 kg) were randomly assigned to groups. They were fed either control creep feed (n = 40, 16% CP) or SL pellets (n = 32, 14% CP) 30 d prior to weaning. Intake of SL was increased from 100 g/lamb/d (before weaning) to 454 g/lamb/d (after weaning). Lambs were weaned at 103.6 ± 0.9 d of age and moved to semi-confinement. The FEC, FOC, packed cell volume (PCV), FS, and dag score (soil-ing around rear of lamb; DS; 1 = no soiling; 5 = heavy soiling) were determined 14 d prior to weaning and in 7 d intervals from weaning until 21 d post weaning. A mixed model was used for data analysis. To determine treatment differences, chi square analysis was used. In Exp. 1, dietary group showed similar FOC, but in amprolium treat-ed lambs FOC decreased (P < 0.001). Higher fecal score in control compared with SL lambs (P = 0.05) indicated signs of coccidiosis. In Exp 2, pre-weaning FOC was similar but decreased in post-weaning SL lambs and remained lower (P = 0.004). Post-weaning coccidiosis treatment was required for 33% of control (P < 0.001) but not in SL lambs. Dag (P = 0.01) and FS (P = 0.001) were similar pre-weaning, but lower at weaning and thereafter in SL fed lambs. The use of SL was effective in prevention and control of coccidiosis in lambs.
Keywords: coccidia, lambs, sericea lespedeza
6
teaching and undergraduate education
15 Glycolytic Enzymes are Reversibly Inactivated by De-creased pH in Postmortem Skeletal MuscleE. M. England 1,*, S. K. Matarneh 1, C. Wachet 2, M. C. Rittenhouse
1, T. L. R. Scott 1, H. Zhu 1, D. E. Gerrard 1, 1Animal and Poultry Sciences, Virginia Tech, Blacksburg, 2Animal Science, Agrocampus Ouest, Rennes, France
Skeletal muscle attempts to replenish ATP postmortem through glycogenolysis and glycolysis, but stops despite possessing resid-ual glycogen. The exact cause of this abrupt cessation is unknown, though pH-mediated inactivation of critical enzymes has been pro-posed. To test this hypothesis, we compared the functionality of gly-colytic enzymes of muscle tissues excised early and late postmortem using an in vitro anaerobic glycolytic system designed to mimic postmortem metabolism. Six pigs were euthanized and samples were excised from the longissimus dorsi at 5 min and 24 h post-exsangui-nation. Tissue samples were homogenized in a reaction buffer that simulated an early postmortem pH (6.6). Aliquots of the reactions
were removed at 0, 2, 4, 6, and 24 h to determine glycogen, glu-cose 6-phosphate, lactate, adenosine nucleotide (ATP, ADP, AMP, and IMP) concentrations, and pH. Means were separated using a Fit Model in SAS JMP and considered significantly different at the P < 0.05 level. As expected, glycogen decreased (P < 0.05) and lactate increased (P < 0.05) with time. For both tissue sampling times, pH declined similarly to that shown to occur in vivo, but reactions con-taining 24 h tissue exhibited a more rapid pH decline (P < 0.05). Cor-respondingly, ATP depletion was faster in 24 h muscle samples (P < 0.05), but ATP was metabolized to IMP in a time-dependent manner by both tissue-based reactions. These data show that muscle from 24 h pork carcasses is capable of breaking down glycogen when the pH is elevated to an early postmortem pH and suggest that inactivation of carbohydrate metabolism postmortem in skeletal muscle is likely due to a reversible inactivation of glycolytic enzymes.
Keywords: Anaerobic Glycolysis, pH, Postmortem Metabolism
16 Developing a Curriculum Addressing Legal Issues in Ani-mal AgricultureE. Rumley *, Animal Science, University of Arkansas, Fayetteville
Consider laws such as California’s Proposition 2, regulations includ-ing those governing organic production, and policies such as FDA’s guidance for the use of antimicrobials in livestock and poultry. In today’s increasingly regulated society, legal issues are affecting ag-riculture, and specifically animal agriculture, in more varied ways. As a result, students focusing on animal sciences are increasingly confronted by laws and regulations that affect their future lives and careers. To address this need, an issues-oriented course discussing the legal issues involved in the production of poultry, swine and livestock has been developed at the University of Arkansas. The curriculum focuses on the laws, regulations and policy arguments in-volved in different aspects of animal agriculture. The course begins with an overview of the American legal system and develops into a discussion of animal welfare vs. Animal rights, highlighting the le-gal implications of each viewpoint. From there, course topics range from animal welfare to humane slaughter, from farm animal confine-ment to the use of antimicrobials, and from food labeling to animal identification. Students completing the course are able to identify areas in need of additional legal study, areas undergoing policy shifts at the local, state, regional and national levels, and areas in which close scrutiny of legal and policy matters can result in impacts to poultry, swine and livestock operations.
Keywords: legal issues, undergraduate education
17 Preparing to Teach an “Inherited” Animal Science CourseD. K. Aaron *, Animal and Food Science, University of Kentucky, Lexington
A faculty member resigns or retires and you are “drafted” to teach the course he(she) has taught for years. Congratulations. It is now “your” course. While you may be trained in the subject area, you may not be ready to teach said course. You may find yourself without course materials and little time for planning. You may or may not have previous teaching experience. Although this challenge is usual-ly reserved for new faculty, with shrinking departments and decreas-ing budgets, even veteran faculty may encounter this predicament. The purpose of this paper is to discuss what to do if you find yourself preparing to teach, for the first time, a pre-existing course in an ani-mal science curriculum. If possible, begin the process early, giving yourself at least 6 mo to plan. In planning consider the following steps: 1) Define course goals. What do you expect students to learn? 2) Transform goals into course content. What materials do students need? What assignments will give them the opportunity to reinforce learning? 3) Prepare course outline. What are the major topics and in what order will you teach them? 4) Develop teaching methods. How will content be presented? How will your teaching style suit the course? What instructional technologies will you use? 5) Plan exams. How will student learning be evaluated? 6) Select reference material (text, handouts, videos). 7) Develop course schedule. How much can you accomplish during each class period? Will there be time for active learning in the classroom? 8) Set class policies (at-tendance, late assignments, missed exams, cell phones). 9) Prepare syllabus. This stepwise process will help you get ready to teach the course you have “inherited.” Throughout the process, interact with colleagues teaching similar courses at other universities. Confer with faculty teaching pre-requisite courses and those for whom your course will be a pre-requisite. Finally, remember course planning is a continual process. “Your” course is a “work in progress.”
Keywords: Animal Science, Teaching, Students
6 7
Breeding and genetics
18 Milk Production Traits of Beef Cows as Affected by Horn Fly Numbers and Breed TypeA. Mays 1,*, M. A. Brown 2, S. M. Clifton 3, C. F. Rosenkrans, Jr.
1, 1Animal Science, University of Arkansas, Fayetteville, 2Grazing-lands Research Laboratory, USDA-ARS, El Reno, OK, 3Animal Sci-ence, Oklahoma State University, Stillwater
Horn flies negatively impact profitability traits of cattle. Increased re-sistance to pesticides has lead to the evaluation of current production methods. Cows sired by Bonsmara (BONS; n=7), Brangus (BRAN; n=13), Charolais (CHAR; n=8), Gelbvieh (GELV; n=5), Hereford (HERF; n=12), and Romosinuano (ROMO; n=8) from Brangus dams were used to determine breed differences in horn fly count (HFC) and effect of HFC on milk yield and quality. Total HFC and milk yield estimates were collected every 28 d from May to October. Milk weight was adjusted to 24-h milk yield. Horn fly counts were transformed to natural log fly count (LFC) prior to analysis. Data for milk yield and quality and HFC were analyzed by mixed model least squares using a linear model including breed group, cow in breed group (random), month (repeated), month x breed and a linear co-variate for calf birth date. Effects of HFC on milk yield and qual-ity were estimated by including linear covariate of LFC and LFC x breed group. Horn fly counts varied over time (P<0.0001), with low-est population recorded in May (94 ± 42 flies) and peaking in August (503 ± 41 flies). Bonsmara and GELV had greater milk yield com-pared to HERF (8.7 ± 0.73 and 8.6 ± 0.86 vs. 6.0 ± 0.57 kg/d, respec-tively, P<0.05), with CHAR, ROMO and BRAN intermediate (7.3 ± 0.65, 7.0 ± 0.65, 6.9 ± 0.56 kg/d, respectively). An effect of breed type x LFC affected (P<0.05) milk yield. Milk yield was reduced by 0.99 and 0.64 kg/d per unit increase in LFC in GELV and BONS (P<0.05). There was less evidence of HFC effects on milk yield in other breeds (P>0.25), but the regression coefficients were negative, with the exception of BRAN. The regression coefficient for milk yield on LFC was lesser in GELV than BRAN, CHAR, HER, and ROMO (P<0.05) and lesser in BONS than BRAN (P<0.05), where lesser indicates greater reductions in milk yield. For every one unit increase in LFC milk fat decreased by 0.15% (P<0.05), solids not fat decreased by 0.10% (P<0.05) and milk urea nitrogen decreased by 0.62 mg/dL (P<0.02). Our results indicate horn fly infestation nega-tively impacts milk production and quality of beef cows and future multi trait selection should include parasite resistance.
Keywords: Horn flies, milk quality, milk quantity
19 Estimation of Genetic Parameters in Berkshire Popu-lation Reared in a Hoop StructureS.-H. Oh *, Dept. of Animal Sciences, North Carolina A&T State Uni-versity, Greensboro
The objective of this study is to estimate genetic parameters in Berk-shire population reared in a hoop structure at the university farm of North Carolina Agricultural and Technical State University (NC A&T SU). The swine unit at NC A&T SU has a 15m x 30m hoop fa-cility that is different from standard confinement facilities. The deep bedding, generally straw, corn stalks, or hay, is spread approximately 34-45 cm thick and provides a comfortable environment for the ani-
mals which allows rooting and other natural behaviors. The Berkshire population has been being constructed since 2011 for the selection experiment. Pigs were farrowed outdoor in farrowing huts, weaned at 4 weeks of age, and reared within deep-bedded hoop houses after that. The number of pigs in the pedigree was 161. Average daily gain (ADG) and backfat thickness (BF) were collected from 43 pigs at 20 weeks of age. There were 22 intact male and 21 female pigs, and two contemporary groups (birth year-month). Contemporary group and sex were included in the model as fixed effects, and the animal effect was included as a random effect. The animal model was analyzed with MTDFREML. The means of ADG and BF were 0.28±0.06kg and 7.68±1.25mm. The coefficients of variation were 20.18 and 16.34, and the estimated heritabilities were 0.26±0.01 and 0.35±0.01 in ADG and BF, respectively. Average daily gain and the heritability were lower than the results reported in the past, which may be due to rearing outdoor. The breeding values estimated in this study will be used to select the individuals that fit outdoor environment better.
Keywords: Genetic parameter, Berkshire, Outdoor
20 Influence of Body-Weight of Cows on Weaning Weight of Calves in Two Lines of Angus Cattle in AlabamaD. Kuhlers 1,*, K. Nadarajah 1, G. L. Thompson 2, B. E. Norris 3, H. D. Harkins 3, 1Animal Sciences, Auburn University, Auburn, AL, 2Re-gional Office, Alabama Cooperative Extension, 3Experiment Station, Tennessee Valley Research and Extension Center, Belle Mina
Beef cattle producers are often puzzled and like to know whether large cows are economically more efficient than small cows in their cow-calf operation. Objective of this study was to examine the influ-ence of BW of cows on 205 d weaning weight (205ADJW) of calves and cow efficiency (COWE) from two lines of cows, namely, small to medium frame (SM) and medium to large frame (ML). Lines were established based on mature cow size (weight, height and age of cow) from a base population of Angus herd at TVREC. Cow ef-ficiency (COWE) was defined as ratio of 205ADJW of calf per unit of cow BW for each cow-calf pair. Cows were mated in single-sire breeding groups in 4 pasture paddocks using two bulls per line that were selected on EPDs for mature height and milk. Calves were not creep-fed and each year, a few older or open cows were culled and selected replacement heifers based on their frame size were added into respective lines. Data on 373 calves weaned during 2006-2012 and BW of their respective dams selected for frame size in respec-tive lines, SM (n= 225) and ML (n=148) were analyzed using GLM procedure in SAS. Linear statistical model used for analyses of 205ADJW and COWE included fixed effects of weaning year, line, sex of calf, age of cow and their interactions while BW of the cow was a covariate within subclass. Means for 205ADJW of calves (ML = 220.9 ± 1.9 vs. SM = 225.6 ± 1.4 kg, P= 0.048) and for COWE in SM line (40.5 ± 0.2%) were higher (P = 0.0932) compared to the ML line (39.7 ± 0.3%). Regression of 205ADJW of calves on BW of cows was significant (P < 0.05). The estimate showed an increase in BW of cows by 100 kg would increase the 205ADJW of calves by 4.9 kg. Difference between the estimates of regressions between lines was not significant. Regression of COWE on BW of cows was negative across lines (P < 0.05) indicating that COWE goes down as the BW of cow increases. Age of cow influenced 205ADJW of
8
calves (P < 0.001) as well as COWE (P < 0.001). Influence of sex of calf on 205ADJW and COWE were significant (P < 0.001). Larger cows may wean heavier calves but the unit of increase of 4.9 kg / 100 kg increase in BW of cow may not be economically efficient.
Keywords: Cow Body Weight, Calf Growth, Cow Efficiency
21 Eye Pigmentation in Hereford, Hereford X Bos Taurus or Hereford X Bos Indicus Cows and CalvesK. Davis 1,*, T. Smith 2, J. D. Arthington 3, N. DiLorenzo 4, B. Bolt
5, M. D. Garcia 6, J. G. Powell 7, D. L. Lalman 8, G. R. Hansen 9, R. C. Vann 10, S. Meadows 11, D. G. Riley 1, 1Department of Animal Science, Texas A&M Univeristy, College Station, 2Department of Animal and Dairy Sciences, Mississippi State University, Starkville,
3Range Cattle Research and Education Center, University of Florida, Ona, 4North Florida Research and Education Center, University of Florida, Marianna, 5Department of Animal and Veterinary Science, Clemson University, Clemson, SC, 6Department of Animal Sciences, Louisiana State University, Baton Rouge, 7Department of Animal Science, University of Arkansas, Fayetteville, 8Department of Animal Science, Oklahoma State University, Stillwater, 9Department of Ani-mal Science, North Carolina State University, Plymouth, 10MAFES-Brown Loam, Mississippi State University, Raymond, 11Cooperative Extension Service, Clemson University, Clemson, SC
Ocular neoplasia in cattle with white faces contributes to large produc-tion losses. It occurs less frequently in cattle with pigmented eyelids; the relationship of corneoscleral pigmentation (irregular extension of color from the iris into the sclera) with cancer is not known. The ob-jective of this study was to evaluate eyelid pigmentation and corneo-scleral pigmentation in Hereford, Hereford x Bos taurus and Hereford x Bos indicus cross cows and calves (n = 868). Eyelid pigmentation was subjectively scored for both eyes from 1 to 5: 1 = 0% pigmenta-tion, 2 = 1 to 39% pigmentation, 3 = 40 to 60% pigmentation, 4 = 61 to 99% pigmentation and 5 = 100% pigmentation. Corneoscleral pigmentation was scored as 1 (presence) or 0 (absence) in either eye, and was assumed binomially distributed and evaluated with a logit link function. Fixed effects investigated included breed type (straightbred Hereford, Bos taurus cross, Bos indicus cross), location (n = 11), type of animal (calf, cow) and sex. Breed type within location was sig-nificant; no other effects met criteria for inclusion in the final model. Eyelid pigmentation scores for Bos indicus and Bos taurus crossbreds were numerically larger than those of straight Hereford (P < 0.11). Pigmentation scores for Hereford (3.46 ± 0.09 left, 3.47 ± 0.09, right) were lower (P < 0.001) than for Bos taurus cross (4.57 ± 0.04 left, 4.54 ± 0.05 right) or Bos indicus cross (4.67 ± 0.05 left, 4.64 ± 0.05 right). Breed type means differed (P < 0.001) for corneoscleral pigmentation: 0.34 ± 0.05, 0.81 ± 0.02, 0.64 ± 0.03, for Hereford, Bos taurus cross, and Bos indicus cross, respectively. Crossbreeding with Bos taurus or Bos indicus may result in more eyelid pigmentation.
Keywords: Eyelid pigmentation, Hereford
22 Balking Behavior in Cattle: Breed-Type Predominance Based on Coat Color and Carcass ImplicationsM. L. Thomas 1,*, Y. V. Thaxton 2, A. H. Brown, Jr 1, K. E. Pfalzgraf 1, K. S. Anschutz 1, C. F. Rosenkrans, Jr 1, 1Animal Science, 2Center for Food Animal Wellbeing, University of Arkansas, Fayetteville
Balking behavior in the cattle processing line can pose welfare issues as electric prod use to coerce forward movement is implemented.
Temperament differences have been shown among breed-type cate-gories, within breed-type categories, among crossbreds, and between genders. Objectives in this study were to determine if breed-type predominance, based on coat color or gender, has an effect on balk-ing behavior, and if this behavior affects carcass economics. A total of 2,375 balking observations, on a scale of 1 - 5 by a single observer, were recorded at the entrance to the restrainer in a high-capacity pro-cessing plant. Balking score, coat color, and characteristic markings were correlated with mean pen weights and dressing percentages. Descending balk mean ranking of breed-types during two consecu-tive day observations is Holsteins, red-mottled face, spotted (other than Holsteins), yellow, red-white face, black-white face, red, white, yellow-white face, black, black-mottle face, brown, brindle, and gray, with differences among some colors (P < 0.05). At processing, previous environment and pen behavior of other animals cannot be segregated, so it is necessary to view large numbers of animals from different environments to establish correlations. Correlations among breed-types, pen weights, and dressing percentages revealed a highly negative correlation (r = -0.71; P = 0.0001) between dressing per-centage and balking. Factors decreasing dressing percentage include gut fill, degree of muscling and finish, and weight of the hide, head, and feet. Data, excluding the Holstein breed effect, revealed nega-tive correlations between pen weight (r = -0.49; P = 0.02) and dress-ing percentage (r = -0.58; P = 0.004) with balking. Balking behavior has both a breed-type effect and negative carcass implications. Balk score correlations with accepted temperament indicator tests and in-dividual carcass data are underway to further evaluate these data.
Keywords: balking, behavior, breed-types
23 Evaluation of a Hair Coat Scoring System for Winter Growth and Relationship to Performance of Angus Dams. S. Plank 1,*, N. B. Simmons 1, M. L. Marks 1, S. T. Willard 2, T. Smith 1, 1Animal and Dairy Sciences, 2Biochemistry and Molecular Biology, Mississippi State University, Starkville
The objectives of this study were to (1) determine the effectiveness of a visual hair scoring system for winter hair growth (WG) and winter length (WL) and (2) evaluate the effect of rate of (WG) on beef cattle performance of Angus females. Data were collected from Angus females (n=98) every 28 d from August 2011 to February of 2012. Animals were observed by trained technician for WG and WL and were given a visual numeric rating of 1 to 5 respectively. A score of 1 for WG indicated no winter growth and a 5 indicated a full winter coat. A score of 1 for WL was rated as short and a 5 rated as long. A 5.08 cm by 10.16 cm hair sample was clipped directly be-hind the left shoulder below the top line and weighed. Month of first winter growth (MFWG) was determined when the female reached a WG score of 3 or greater. Data were analyzed using the MIXED procedure in SAS with birth weight and d 205 weaning wt (WW) as the response variables and included fixed effects of gender of calf and MFWG with sire as a random effect. Birth weight and WW were considered traits of the dam. Body condition score was also evaluat-ed excluding gender of the calf in the model. Phenotypic correlations were estimated on WG, WL, and hair weight. Positive correlations were found between WG and WL (0.86), WG and hair weight (0.44) and WL and hair weight (0.64). Visual scores for WG and WL were found to be different for hair weight (P > 0.001). Month of first win-ter growth was not different for WW (P > 0.28), BCS (P > 0.06), and birth weight (P > 0.17). In a separate analysis, age of the dam was found not to be different (P > 0.98) for winter coat growth. Results
8 9
indicate validity of the visual method for determining hair growth and do not suggest an association between winter growth scores and performance traits of Angus dams.
Keywords: beef cattle, hair coat
24 Relationship of Heifer Pubertal Status to LDHB Single Nu-cleotide PolymorphismsC. Turner 1,*, A. H. Brown 1, D. Hallford 2, B. R. Lindsey 1, J. L. Reyn-olds 1, J. G. Powell 1, C. F. Rosenkrans 1, 1Division of Agriculture, University of Arkansas, Fayetteville, 2Animal and Range Sciences, New Mexico State University, Las Cruces
Objectives of this study were to determine affiliations among lactate dehydrogenase B gene (LDHB) single nucleotide polymorphisms (SNP) on heifer pubertal status when under heat duress based on the temperature humidity index (THI). Angus (n = 45) and Angus-Hereford cross (n = 29) breed types were utilized, and genotyped for the G348A SNP. Genomic DNA, prepared from buffy coat, was sequenced using Sequenome technology through Washington University at St. Louis. Results revealed three genotypes: homozy-gous guanine (GG), homozygous adenine (AA), and heterozygous guanine-adenine (GA), with a guanine to adenine base substitution identified at bp 348 of the complete nucleotide sequence. Heifers, maintained on endophyte infected tall fescue, measured at 9 and 12 months of age respectively, had blood samples procured from the jugular vein. Up to ten days post collection, subjects were monitored, morning and evening, for physical displays of estrus. Serum samples, processed through New Mexico State University, were measured for progesterone (P4) concentration to corroborate estrus detection. Animals having P4 concentrations above, or equal to, 1 nanogram were noted for truly being within estrus, unless otherwise noted by visual displays. SNP displayed no effects at 9 months (P = 0.88), but displayed significant effects at the yearling marker (P = 0.037). Observations show the homozygous adenine genotype generally out-performing the homozygous guanine genotype by point estimate of 7.6%. Heterozygous individuals displayed a 28% odds increase in being cyclic compared to homozygous guanine and a 27.2% odds increase to the homozygous adenine. Data from this study indicate SNP within LDHB appear to affect pubertal status. Further research is needed to conclude if LDHB SNP genotypes provide a superior genetic marker for earlier pubertal activity under heat duress.
Keywords: heifer, LDHB, pubertal status
25 Association of Newborn Calf Cannon Bone Length with Preselected Snp Chosen Based on Proximity to Genes with Sus-pected InfluenceD. G. Riley *, T. H. Welsh, C. A. Gill, L. L. Hulsman, A. D. Herring, P. K. Riggs, J. E. Sawyer, J. O. Sanders, Animal Science, Texas A&M University, College Station
The objective of this study was to describe associations between F2 Nelore-Angus newborn calf cannon bone length (n = 463) and SNP (n = 860) that were chosen for analysis based on proximity to genes (n = 38) with expected influence on endochondral bone growth. Re-siduals for cannon bone length were produced from models that in-cluded birth year-season of birth combinations and family as fixed effects. Those residuals were regressed on genotypic values for each locus, in which 0 and 2 were assigned to alternate homozygotes and
1 to heterozygotes. Associations were detected (false discovery rate 0.15) for 18 loci relative to 7 of the genes with purported influence (VDR, IGF1R, IGF1, GH1, NR3C1, GLI1, and PTHLH) on BTA5, BTA7, BTA19, and BTA21. From those, representative loci were chosen from linked SNP as a final set (n = 8). In 2 analyses, step-wise regression was utilized to select a subset that best accounted for variation: 1) genotypic values from each locus were available as linear covariates, and 2) that group plus all possible linear × linear covariates were available. Inclusion (P < 0.01) was reevalu-ated for all variables upon entry of additional variables. Markers in the physical regions of genes coding Vitamin D3 Receptor (VDR) and IGF-I receptor (IGF1R) as linear and linear × linear covariates explained 0.06 of the phenotypic variation in cannon bone length. Genome-wide association analysis was conducted using SNP loci (n = 34,980). This identified SNP loci (n = 363) as associated with cannon bone length (false discovery rate 0.05). The majority (n = 323) were on BTA14, which has been associated with growth-related cattle traits. Evaluation of a subset of the SNP loci proximal to genes with likely influence resulted in omission of the large association on BTA14. Preselection of SNP for association analyses has lower val-ue than routines that consider candidate genes near to SNP detected from whole genome association.
Keywords: cannon bone length, genome-wide association, SNP
26 Effect of Genetic Markers for Marbling on Performance in Angus FemalesL. L. Jury *, R. C. Vann, T. Smith, Animal and Dairy Sciences, Mis-sissippi State University, Mississippi State
The objective of this study was to utilize a commercially available genetic marker panel to determine the effect of known genetic mark-ers for marbling on beef cattle performance. The GeneSTAR® Qual-ity Grade markers used consisted of 2 markers (QG1, a SNP up-stream from the start of the first exon of thyroglobulin, and QG2, an anonymous SNP) and is associated with marbling and quality grade carcass traits. Angus heifers of known QG1 and QG2 genetic marker composition were utilized for this study (n = 114). Cattle were di-vided into three groups for analysis based on the number of QG1 and QG2 genetic markers present: Low (L), 0; Medium (M), 1 to 2; and High (H), 3 to 4. Ultrasonography was performed on the females at approximately 1 yr of age for estimates of body composition. Data were analyzed using the MIXED procedure in SAS with year and group as independent variables, where group was L, M, or H based on number of genetic markers present and with sire as the random variable. Records were obtained from the American Angus Associa-tion for the following performance traits: Adjusted (Adj) birth wt, Adj weaning wt, Adj yearling wt, Adj intramuscular fat, Adj ribeye area, Adj fat thickness (FT), and Adj rump fat thickness. Ultrasound scan data for Adj FT varied (P < 0.05) among L, M, and H marker groups with H having a greater (P < 0.05) mean Adj FT than M. No differences (P > 0.05) were observed between H and L marker groups; however, L tended (P > 0.0535) to have a greater mean Adj FT than M. All other performance and carcass traits did not differ (P > 0.08) between marker groups. These data suggest that genetic markers for marbling do not have an effect on growth traits but may have an effect on carcass traits, particularly fat thickness, of Angus heifers.
Keywords: cattle, genetic markers, marbling
10
meat Science
27 Single Nucleotide Polymorphisms of LDHB and Effects on Immune ResponseC. M. Turner *, A. H. Brown, M. L. Thomas, K. S. Anschutz, J. A. Hornsby, B. R. Lindsey, J. G. Powell, C. F. Rosenkrans, Division of Agriculture, University of Arkansas, Fayetteville
The objective of this study was to determine associations among LDHB single nucleotide polymorphisms (SNP) on immune re-sponse in heifer calves. Angus (A= 42) and Angus-Hereford cross (AH= 27) breed types were utilized, and genotyped for the A163G SNP. Genomic DNA, prepared from buffy coat, was sequenced us-ing Sequenom technology through Washington University in St. Louis, Missouri. Results rendered two genotypes: heterozygous adenine-guanine (AG), with an adenine to guanine base substitution identified at base 163 of the complete nucleotide sequence, and ho-mozygous guanine (GG). The homozygous adenine (AA) genotype was not observed in this study. Over the duration of a 48 hr immune challenge, initiated with phytohemagglutinin (PHA-M), caudal fold measurements were collected at 0, 12, 24, and 48 hr markers. In ad-
dition to caudal measures, blood samples were procured at 24 and 48 hr. Cell counts were determined using the Drew Hemavet 950. SNP displayed effects at both hr markers regarding white blood cell (WBC) counts (P < 0.02 & P < 0.03, respectively). Two cell types, comprising WBC, neutrophils (NE) and eosinophils (EO) also ex-hibited SNP effects at both hr marks. NE and EO 24 hr counts were significant (P < 0.0001), as well as 48 hr NE and EO counts (P = 0.0002 and P = 0.0006). In each observation, the heterozygous geno-type AG generally outperformed the homozygous (WBC 24: 15.09 ± 2.4 vs. 11.70 ± 2.43, WBC 48: 13.76 ± 2.28 vs. 11.13 ± 2.27, NE 24: 7.37 ± 1.12 vs. 4.01 ± 1.05, NE 48: 6.06 ± 1.08 vs. 3.88 ± 1.05, EO 24: 1.19 ± .26 vs. .537 ± .24, EO 48: .88 ± .24 vs. .42 ± .24). Data from this study indicate SNP within the LDHB gene appear to affect immune response. Further research is needed to conclude if LDHB SNP genotypes provide a superior genetic marker for innate immune response.
Keywords: immune response, LDHB, polymorphisms
28 Consumer Acceptability of Commercially-Available Do-mestic Grass-Fed and Grain-Fed Beef C. Strong *, L. Stewart, D. Johnson, L. Eubanks, C. Carr, Animal Sci-ences, University of Florida, Gainesville
With the current economic climate, many beef producers are explor-ing new ways to increase their profit margin by becoming niche meat marketers. One of the most popular niche markets in the southeast is to utilize available forage resources, to produce and market grass-fed beef. The purpose of this project was to evaluate consumer ac-ceptance of commercially available grass-fed and grain-fed beef steaks. Ribeye rolls with a low Choice quality grade were acquired from commercial providers, fabricated into steaks, randomized to ensure steaks from at least two animals per treatment were fed to each sensory session (n=10), then vacuum sealed and allowed 21 d postmortem aging prior to freezing. Steaks were thawed for 18 hours at 4 °C prior to cooking to an internal temperature of 71 °C on Hamilton BeachTM Indoor/Outdoor Grills. The longissimus muscle from each steak was cut into 1.27 cm³ sample cubes and panelists were served two cubes from each treatment while still warm. Each panelist was given a ballot to record their demographic information (gender, age range, and farm/non-farm background) and to evalu-ate cooked tenderness and juiciness from 1 to 9 (1 extremely tough/dry to 9 extremely tender/juicy) and flavor acceptability and overall acceptability from 1 to 9 (1 dislike extremely to 9 like extremely). Data were analyzed using the mixed model procedure of SAS with treatment (grain or grass-fed), gender, age range, and background as fixed effects and panel event as a random effect. A total of 410 panelists evaluated samples over 10 sessions. Age, gender, or back-ground of panelists did not affect findings. Panelists found grain-fed steaks to be more tender (P=0.02; 6.0 vs. 5.4) and juicy (P < 0.01; 6.9 vs. 6.2) than grass-fed steaks. Panelists also rated grain-fed steaks higher for flavor acceptability (P < 0.01; 6.5 vs. 5.8) and overall acceptability (P < 0.01; 6.4 vs. 5.7) than grass-fed steaks. Despite greater mean ratings for grain-fed beef, 24% of panelists preferred
grass-fed beef overall. These results compliment those of previous preference studies.
Keywords: Beef Palatability, Grain-Fed Beef, Grass-Fed Beef
29 Feeding a Commercially-Available By-Product Ration In-creases Value of Culled CowsC. Carr *, J. Savell, D. Johnson, M. Hersom, T. Thrift, Animal Sci-ences, University of Florida, Gainesville
The value of culled cows is at an all-time high; but, so is the cost of traditional feedstuffs. The purpose of this trial was to determine the efficacy of feeding a moderately priced, commercially-available ration of dried bakery waste and broiler litter, on the growth, carcass merit, and value of culled beef cows. Culled beef cows (n = 80, 8.5 ± 2 yr) of similar genetics were received from a single ranch. Live BW and BCS were gathered prior to stratifying cows (n = 20) to 1 of 4 days of feeding (DOF; 0, 42, 69, or 98) within 8 pens (n = 10). Cows were fed up to 9.1 kg/cow of the by-product ration, and offered ad libitum access to bermudagrass hay, prior to being transported to a commercial slaughter facility after their allotted DOF. Carcass data and LM steaks were collected at 48 h postmortem. Data were ana-lyzed using the mixed model procedure of SAS with DOF or feeding period (1-42, 43-69, or 70-98) as fixed effects. Cow age was used as a covariate and pen as a random effect for all analyses. Individual cow was the experimental unit for analysis of the carcass data and pen for all other analyses. At initial processing, cow live BW (424.2 ± 5.3 kg) and BCS (4.0 ± 0.1) did not differ across DOF groups; however, final live BW, BCS, and HCW increased linearly (P < 0.001) as DOF increased. Cow ADG was greater (1.5 kg/d; P = 0.002) for the feed-ing period from d 1-42 than from d 43-69 or d70-98, at 0.6 and 1.1 kg/d, respectively. The increase in live BW, HCW, ribeye area, and corrected total carcass value between cows given 42 and 0 DOF, was greater (P < 0.05) than the increases in the same traits from cows
10 11
given 98 and 42 DOF, despite 2 wks additional DOF. Carcasses of cows given 69 or 98 DOF had more youthful USDA lean maturity scores (P < 0.01) than cows given 0 or 42 DOF. Carcasses of cows given 98 DOF had greater (P < 0.001) USDA marbling scores than cows given any other DOF. Cooked LM steaks from carcasses of cows given 98 or 69 DOF had lower (P < 0.03) slice shear force val-ues than steaks from cows given 42 DOF. However, the HCW gained for cows given 42 DOF was of greater economic value than the lean quality and tenderness improvements seen at greater DOF.
Keywords: By-product feeds, Culled cows
30 Effect of Packaging Type, Storage Time and Temperature and the Effect of Steak Location on Palatability of Center Cut Gluteus MediusA. G. Osterhout *, D. D. Johnson, C. Carr, Animal Science, Univer-sity of Florida, Gainesville
a study was conducted to examine the combination of packaging type, temperature and extended aging on the palatability, retail color stability, and Warner-Bratzler shear force (WBSF) values of center-cut sirloin steaks, as well as the effect of steak location on palatability and WBSF values. Beef carcasses used for subprimal collection were preselected using USDA-AMS instrumentation data to have mar-bling scores between Slight50 and Small50 at the 12th/13th rib interface. Paired top sirloin butts (IMPS # 184; n = 74) were collected at 24h postmortem from 37 A-maturity beef carcasses, with one subprimal from each pair being stored at 0°C and 4°C. Subprimals were aged for 14, 28 or 42 days, in a DryBag®, or a traditional vacuum-bag. Sirloin steaks from subprimals aged for 14 d were lighter (P<0.001), more red (P<0.001), and more yellow (P<0.001) throughout retail display than steaks aged for 28 or 42 d, and steaks aged for 42 d had greater subjective color scores (P<0.001) than steaks from subpri-mals aged for 14 or 28 d meaning those steaks are more red in ap-pearance. Subprimal packaging type or storage temperature did not affect (P ≥ 0.29) WBSF values, or trained sensory panel values for juiciness, beef flavor, or off-flavor, and the postmortem aging period did not affect (P ≥ 0.29) trained sensory panel values for juiciness, beef flavor, or off-flavor. Steaks from subprimals aged for 28 d had greater (P ≤ 0.01) WBSF values than steaks from subprimals aged for 42 d, but steaks from subprimals aged for 14 and 42 d, respec-tively had similar WBSF values. Steak location did have an effect on WBSF. Steaks were taken from top to bottom (anterior to posterior) and from side to side of the subprimals (dorsal to ventral). Lateral position did not affect (P ≥ 0.69) trained sensory panel values for juiciness, beef flavor, tenderness, connective tissue or off-flavor of sirloin steaks. Steaks from the dorsal side of sirloin subprimals aged for 28 or 42 days had lower WBSF values (P<0.05) than steaks from the ventral side of the same subprimal. Steaks tended to increase in WBSF from anterior to posterior location within the subprimal.
Keywords: Beef Palatability, location, postmortem aging
31 Effect of Packaging Type, Storage Time and Temperature on the Beef Longissmus Lumborum and Triceps Brachii MusclesA. G. Osterhout *, D. D. Johnson, C. Carr, Animal Science, Univer-sity of Florida, Gainesville
Beef carcasses were preselected to have marbling scores between Slight50 and Small50 at the 12th/13th rib interface. Paired beef strip
loins (IMPS# 180; n =52) and paired clod hearts (IMPS # 114E; n = 108) were collected at 24 h postmortem from 26, and 54 A-maturity beef carcasses, respectively, with a subprimal from each pair being stored at 0°C or 4°C. Subprimals from both muscles were aged for 14, 21, 28, 32, 35, or 42 days in one of three packaging options, DryBag®, traditional vacuum-bag, and no bag. Warner-Bratzler shear force, color stability, and sensory attributes were studied. Strip steaks from subprimals aged for 42 d became lighter (>L* values; P<0.01) throughout display, compared with steaks from subprimals given 21 or 32 d of aging, which became darker (P<0.01). Subprimal packaging type and storage temperature did not affect (P≥0.39) light-ness values of strip steaks during retail display and storage tempera-ture did not affect (P=0.99) subjective color scores. All clod steaks had similar lightness values at the start of retail display, but steaks from subprimals aged for 35 d became darker (<L* values; P<0.01) throughout display, compared with steaks from subprimals given 21 or 28 d of aging which became lighter. Subprimal packaging type and storage temperature did not affect (P≥0.13) WBSF or sensory attributes for clod hearts. Postmortem aging did not affect (P≥0.38) trained sensory panel values for juiciness, beef flavor, or off-flavor of strip steaks, but clod steaks from muscles aged for 35 d had more off-flavors (P<0.001) than clod steaks aged for 21 or 28 days, which did not differ. Strip steaks from subprimals aged for 32d had greater (P≤0.01) WBSF values than steaks from subprimals aged for 42d which had the lowest (P≤0.01) WBSF values. This study showed that only 14 to 21 days of aging are needed to effectively tenderize the clod heart. Strip steaks did become more tender as the length of aging progressed, but the actual difference was minimal.
Keywords: Beef Palatability, packaging, postmortem aging
32 Metabolic Profiling of Ground Beef Samples from Various Grind Sources and Correlation to Sensory Evaluation T. Jiang *, Y. Wu, H. M. Finegan, and C. L. Bratcher, Department of Animal Sciences, Auburn University, Auburn, AL
The objective of this study was to investigate the metabolites in ground beef associated with beef flavor as a function of grind source and packaging. Three traditional grinds (non-branded beef with 10, 11, or 16% fat) and 7 non-traditional grinds (branded beef with 6, 8, 11, 20, 21, 28 or 29% fat) were purchased and prepared by a com-mercial meat grinder. Three packaging treatments were 1) 0.454 kg loaves packaged in a traditional overwrap package, 2) 0.454 kg loaves packaged in a modified atmosphere package (0.4% CO, 30% CO2, and 60% N2) and 3) 0.454 kg stuffed into a clear plastic re-tail chub. Ground beef samples were extracted into methanol and profiled total metabolites in both positive and negative electrospray ionization mass spectrometry. A trained sensory panel evaluated beef sensory attributes. Data were analyzed in a 10 × 3 factorial design with the Pearson correlation among treatments and sensory attributes by individual compounds. A total of 576 compounds were registered, among which grind source affected 366 compounds and packaging affected 61 compounds (P < 0.05). Also, 256 compounds were cor-related with beef flavor and 283 compounds were correlated with off-flavor (P < 0.05). Over 200 compounds, correlated with beef fla-vor or off-flavor, were affected by grind source and packaging. Fifty-nine compounds were positively correlated with beef flavor and 200 compounds were positively correlated with off-flavor (P < 0.05). Most compounds are fatty acids and their conjugates, followed by aldehydes, fatty aldehydes, fatty amides, sphingoids, and very little isoprenoids and eicosanoids. Grind source affected more compounds
12
ruminant Animal Production i
associated with beef flavor and off-flavor than packaging treatment. More compounds were identified to associate with off-flavor than with beef flavor. Our next step is to understand their contribution to beef flavor and to design strategies to remove off-flavor contributors in the model system.
Keywords: beef flavor, grind material, metabolites
33 Oxidative Stability During Ripening and Storage of Rose-mary Treated Fermented Lamb Sausages G. Davila El Rassi *, A. Al-Sakini, V. Banskalieva, A. Lathrop, T. Bowser, Food and Agricultural Products Center, Oklahoma State University, Stillwater
The objective of this study was to evaluate the effect of rosemary on the oxidative stability and fatty acid composition (FAC) of fer-mented lamb sausages during ripening and storage. The sausages (3 per group) were manufactured without rosemary (control) and with 0.015, 0.030 and 0.045% powdered rosemary as R1, R2 and R3 groups. The lipid oxidation, expressed as mg malonaldehyde (MDA)/kg sample and the FAC were analyzed at the end of the rip-ening period (10th day) and during 25, 40, 55, 70, 85 and 100 days of storage at 40C. On the 10th day the levels of MDA in all groups were
significantly higher (p<0.05), over 60%, compared to their values at the beginning of the ripening. An opposite trend was observed in the levels of the monounsaturated (MUFA) and polyunsaturated (PUFA) fatty acids, showing a significant decrease. During the fol-lowing days of storage, no further lipid oxidation, and no changes in the MUFA and PUFA percentages in all types of sausages were observed, suggesting that the lipid oxidation occurred only during the manufacturing and ripening process. The contents of conjugated linoleic acid and vaccenic acids remained constant during the entire experiment being slightly higher (p<0.05) in the treated sausages, compared to the control group. Toward storage day100, the MDA levels (1.59, 154, 1.50 and 1.47 mg/kg) respectively for the control and R1, R2 and R3 groups, were slightly lower (p<0.05) compared to their values at the beginning of the storage (1.82, 1.77, 1.76 and1.63 mg/kg). Accordingly, during the entire storage the MDA values in R2 and R3 sausages were significantly lower (p< 0.05) than in the other two groups. During the 3 months of storage, the MDA levels in all groups ranged under 2 mg/kg MDA, which is generally accepted as threshold for detecting rancidity. The lowest MDA values in the sausages with 0.045% rosemary indicate that the oxidative stability during storage is influenced by the amount of the added antioxidant.
Keywords: rosemary, sausages, TBARS
34 Application of Fecal Near Infrared Reflectance Spectros-copy Profiling to Predict Voluntary Intake in Beef CattleJ. Johnson 1,*, G. Carstens 1, A. Hafla 1, S. Prince 2, D. Forbes 3, K. Ominski 4, K. Wittenberg 4, M. Undi 4, D. Tolleson 5, 1Department of Animal Science, Texas A&M University, College Station, 2Depart-ment of Rangeland Ecology, Texas Agrilife Research, Temple, 3De-partement of Rangeland Ecology , Texas Agrilife Research, Uvalde, 4Department of Animal Science, University of Manitoba, Winnipeg, Canada, 5Department of Natural Resources and the Environment, University of Arizona, Camp Verde
The objective of this study was to evaluate the use of near-infrared reflectance spectroscopy (NIRS) of feces to predict voluntary dry matter feed intake (DMI) in beef cattle. Feed intake was measured (Calen-gate or GrowSafe systems) for 70 d in 3 trials with grow-ing Bonsmara (N = 175), Brangus (N = 120), and Santa Gertrudis (N = 57) heifers fed similar mixed diets containing 70% roughages (2.1 to 2.2 Mcal ME/kg DM). Within trial, heifers were ranked by residual feed intake (RFI) to provide experimental animals with di-vergent intake, and fecal samples were collected for 5 consecutive d from heifers with the lowest (16-20%) and highest (16-20%) RFI. In trial 4, intake of hay (30:70 alfalfa:sudan) was measured for 70 d in 31 pregnant cows previously identified as having divergent RFI as heifers, and fecal samples were collected for 5 consecutive d from all animals. Fecal samples were ground through a 1-mm screen and composited prior to NIRS analysis using a Foss NIRS 6500 mono-
chromator. Within trial, calibration equations were developed using Win ISI II, based on modified partial least squares regression. Outli-ers in the calibration were identified using two methods; a mahala-nobis distance > than 10.0 and “t” value > than 2.5. The accuracies (SE of calibration; SEC and R2) of the calibration equations for DMI (g/BW0.75) ranged from 10.3 and 0.78 for Trial 3 to 4.87 and 0.95 for Trial 4. Validation was accomplished using 6 cross-validation it-erations, with each iteration involving the random removal of 25% of samples. The standard error of cross validation (SECV) ranged from 11.03 to 20.56 (8-30% of mean DMI), respectively. Although Trial 4 had the best accuracy of calibration, the SECV was the high-est. These results indicate that fecal NIRS profiling may be useful to predict animal variance in DMI, but that more research is needed to improve robustness of these predictive equations.
DMI, g/BW0.75
Trial Breed N Mean ± SE SEC R2 SECV
1 Bonsmara heifers 57 134.8 ± 2.4 4.59 0.92 11.032 Brangus heifers 40 117.0 ± 2.7 6.14 0.87 18.263 Santa Gertrudis heifers 20 118.8 ± 4.9 10.3 0.78 17.814 Bonsmara cows 31 69.7 ± 3.8 4.87 0.95 20.56
Keywords: cattle, fecal NIRS, feed intake
12 13
35 Effect of Early Weaning and Diet on Age at Puberty in Bos Indicus Influenced HeifersL. Ayala 1,*, A. Calderon 1, F. Xie 1, M. A. Ramirez 1, A. Arellano 1, M. R. Garcia 1, R. L. Stanko 1, 2, 1Animal, Rangeland, & Wildlife Sci-ences, Texas A&M University-Kingsville, Kingsville, 2Animal Repro-duction Laboratory, Texas A&M AgriLife Research, Beeville
Early weaning and feeding a high-concentrate diet has been reported to induce precocious puberty in Bos taurus beef heifers and spring-born, Bos indicus influenced (25%) beef heifers. In this study, fall-born, Bos indicus influenced (25%) heifers were early-weaned (4 mo) to determine if precocious puberty could be initiated through dietary manipulation similar to that reported in spring-born, Bos indicus influenced heifers. Eighteen crossbred (Angus x Hereford/Brahman F1) heifers were weaned at 129 ± 3 d of age and weighed 149 ± 4.5 kg. Heifers were blocked by BW and randomly allocated to be fed a high-concentrate (60% corn; H) or control diet (30% corn; C). Heifers were bunk-fed at 2.5% of mean pen BW, and target ADG were 0.91 and 0.45 kg/d for H and C treatment groups, respective-ly. Heifers were weighed every 7 d. Blood samples were collected twice weekly and assayed for serum progesterone concentration to determine age at puberty. Puberty was defined as the initial date of 4 consecutive serum samples with progesterone concentration > 1 ng/mL, indicative of a functional corpus luteum, followed by continu-ous estrous cyclicity. Heifers fed the H diet had greater (P < 0.01) ADG (0.81 ± 0.04 vs. 0.59 ± 0.04 kg/d) during d 0 to 90 following weaning and greater (P < 0.01) ADG (0.97 ± 0.01 vs. 0.79 ± 0.01 kg/d) from weaning to puberty. ADG (kg/d) from d 0 to 30 (0.57 ± 0.04 vs 0.43 ± 0.05, P<0.05), d 30 to 60 (0.77 ± 0.08 vs 0.56 ± 0.09, P=0.066), and d 60 to 90 (1.11 ± 0.04 vs 0.81 ± 0.03, P < 0.01) was greater in H-fed than in C-fed heifers. Body weight at puberty was greater (P < 0.05) in heifers fed H diet (336.4 ± 9.3 kg) than in heifers fed C diet (300.5 ± 8.5 kg). However, age at puberty (d) was similar (P > 0.1) between the C-fed (321 ± 9) and H-fed (319 ± 5) heifers. Early weaning (4 mo) and feeding a high-concentrate diet increased BW at puberty but did not hasten the onset of puberty in fall-born, Bos indicus influenced (25%) heifers in contrast to what has been shown in spring-born, Bos indicus influenced (25%) beef heifers. Results indicate that season of birth may affect incidence of precocious puberty in high-concentrate fed Bos indicus influenced (25%) beef heifers.
Keywords: diet, heifer, weaning
36 Residual Feed Intake and Body Weight Gain and its Rela-tionships with Performance and Carcass of Nellore SteersM. Lopes Do Nascimento 1,*, A. Saturnino Chaves 1, A. R. Duarte Lopes Souza 2, R. R. Tullio 3, M. Mello de Alencar 4, G. E. Carstens
5, A. N. Rosa 6, D. Pazzanese Duarte Lanna 1, 1Animal Science, Uni-versity of Sao Paulo, Piracicaba, 2Animal Science, Universidade Federal Rural de Pernambuco, Recife, 3Animal Nutrition, 4Animal Breedings, Embrapa Pecuaria Sudeste, São Carlos, Brazil, 5Animal Science, Texas A&M, College Station, 6Animal Breedings, Embrapa Gado de Corte, Campo Grande, Brazil
Residual feed intake and body weight gain (RIG), a combination between residual feed intake (RFI) and residual gain (RG), was recently proposed as an index for genetic selection of beef cattle, however, is important to ensure no antagonistic correlations between
RIG, carcass and meat quality parameters. The aim of this work was to study the relationship between RIG and carcass characteristics of Nellore steers. Dataset from three years of study were used, totaling 363 progeny steers from 30 bulls. The animals were individually fed twice daily with 5% of orts, for at least 70 days (2.8 Mcal of ME/kg DM; 13.5% of CP). Body weight (BW) was measured at 14-d intervals and ultrasound measurements on 11-12th-rib (fat thickness and ribeye area) obtained at the start, middle and final of the experi-mental period. The animals were divided into contemporary group (CG), based on the year, animal origin and pen type (individual or collective). Daily gain (DG) was estimated by slope of the regres-sion between BW and days on feed. Mixed models were used to obtain RFI and RG, while effect of CG was considered random. The RIG was calculated as -1 x RFI + RG, both standardized to a vari-ance of 1. The animals were classified as low, medium and high RIG (mean±0.5 SD). The classes were compared using mixed model, where RFI class and CG were considered fixed effects, sire as ran-dom, and initial age as a covariate. BW was not related to RIG class (P> 0.05), despite efficient animals (high RIG) consuming 11.5% less and gaining 19.5% more weight than inefficient ones (low RIG) (P<0.05). High RIG animals also had higher changes in ribeye area during the trial (P<0.05), while the change in fat thickness was the same (P>0.05). Low RIG animals had smaller cold carcass weights than those with high RIG (P<0.05). The ether extract content is also smaller in high RIG animals (P<0.05). Selection by residual intake and gain (RIG) needs to be more studied, despite independent of the BW, it can affect the size of the carcass and the intramuscular fat content of the meat.
Keywords: beef cattle, Feed efficiency, Genetic Selection Index
37 Crude Glycerin Decreases Production and Quality of Parti-cle-Associated Bacteria from Bovine Ruminal ContentsE. H. C. B. Van Cleef 1,*, J. M. B. Ezequiel 2, A. C. Homen Junior
2, F. B. O. Scarpino 2, 1Animal Science and Industry, Kansas State University, Manhattan, 2Animal Science, São Paulo State University, Jaboticabal, Brazil
Five rumen-cannulated Nellore steers (402 ± 44 kg BW) were used to compare the effects of diets containing increasing levels of crude glycerin to a control on the amount and quality of protozoa and bac-terial fractions from bovine ruminal contents. Cattle were assigned to five treatments in a 5 × 5 Latin square design. Each period consist-ed of 14 d adaptation and 16 d sampling. Diets consisted of 30% corn silage and 70% concentrate with or without crude glycerin, which replaced mainly corn grain. The inclusion levels of crude glycerin were 0; 7.5; 15; 22.5; and 30%, respectively for treatments 1 to 5. Samples of ruminal contents were taken 2, 4, and 12 h after feeding, during three days. Samples were strained through a nylon filter to separate liquid and solid phases. Liquid-associated protozoa (LAP) and bacteria (LAB) were obtained using series of filtrations, dilution with salt solution and centrifugations. Particle-associated bacteria (PAB) were obtained using agitation with a salt solution, as well as filtrations and centrifugations. Microbial mass was analyzed for total N using a micro-Kjeldahl apparatus. Data were analyzed using the MIXED procedure of SAS and contrasts were used to determine the linear and quadratic effects of glycerin and 0% glycerin × glycerin treatment. Treatment means were computed with the LSMEANS op-tion. The inclusion of crude glycerin linearly decreased (P ≤ 0.01)
14
the amount of PAB (3958.6; 3522.7; 3505.5; 3313.6; and 2930.7 mg/kg DM, respectively to treatments 1 to 5, 4 h after feeding), and decreased (P ≤ 0.01) its amount of N (254.2; 262.7; 188.26; 166.18; and 162.7 mg/kg MS). There was no effect (P > 0.05) of glycerin on the production of LAB (mg/L), but intermediary levels promoted greater (P ≤ 0.01) amounts of N (168.3, and 139.6, respectively to treatments with 15 and 22.5% glycerin). LAP were not influenced (P > 0.05) by adding glycerin to the diets. Feeding up to 30% crude glycerin to Nellore steers reduces the amount of particle-associated bacteria, which may cause a decrease on digestion of dietary fiber fraction. This research was funded by FAPESP, São Paulo, Brazil.
Keywords: biodiesel, byproducts, microorganisms
38 Effect of Stocking Density on Cattle Behavior During TransportL. L. Jury 1,*, J. A. Parish 1, R. C. Vann 1, T. Smith 1, J. K. Ward 2, H. T. Boland 1, 1Animal and Dairy Sciences, 2Agricultural and Biological Engineering, Mississippi State University, Mississippi State
This study was conducted to assess the effects of low (L; 168 ± 16.9 kg/m2) or high (H; 344 ± 14.8 kg/m2) trailer stocking density on behavior in cattle. British x Continental steers (BW = 350 ± 8.6 kg) were loaded onto one of two truck-towed trailers: a 16.15 x 2.59 x 4.14 m air-ride or 15.85 x 2.59 x 4.14 m spring-ride trailer. Behavior was recorded for 9 h by video recorders. Behaviors recorded include
aggressive behaviors (head butting, pushing, threatening, and mock-ing); sexual behaviors (mounting and chin resting); non-aversive be-haviors (laying and ruminating); and behaviors indicating a loss of balance (shifting and struggling). Cattle position within each trailer compartment was recorded at 5-min intervals using one of six direc-tional orientations: side left (SL), side right (SR), parallel front, par-allel back, diagonal front, and diagonal back. Acceleration tilt data loggers were installed in the center of the upper and lower decks of each trailer. All data were analyzed using PROC MIXED in SAS, with behavioral and positional data analyzed as percentages of total observations within each trailer compartment (L, n=4; H, n=5), and cumulative G-forces analyzed at 5-min intervals. Head-butting and chin-resting behaviors were observed more frequently (P < 0.05) in L compartments, whereas mounting was more prevalent (P < 0.05) in H compartments. There was a tendency (P = 0.09) for more rumi-nation to occur in L compartments. All other behaviors did not differ (P > 0.10) between the two stocking densities. More (P < 0.05) diag-onal orientations were observed in L compartments; however, there were no differences (P > 0.15) among other orientations. At both stocking densities, SL and SR orientations were preferred (P < 0.05) to all other orientations, and SL was preferred (P < 0.05) over SR in H compartments only. More cumulative G-forces were observed (P < 0.05) in the L trailer with greater (P < 0.05) forces on the upper level. The H trailer could be considered a damped system, having a heavier load; still the differences in trailer design (air vs. spring ride) should be considered. These results suggest that stocking density af-fects cattle behavior, orientation, and riding conditions en route.
Keywords: cattle, stocking density, transportation
14 15
tuesday, february 5, 2013
Pastures and forages
39 Sward Responses of Rhizoma Peanut Genotypes Under a Range of Grazing Management StrategiesK. Mullenix 1,*, L. Sollenberger 1, D. Rowland 1, A. Blount 1, J. Vendr-amini 1, M. Silveira 2, A. Vaccaro 1, 1Agronomy, 2Soil Science, Univer-sity of Florida, Gainesville
Recently released genotypes of rhizoma peanut (Arachis glabrata; RP) represent a range of growth habits which may affect their per-sistence under grazing. Their response to grazing, however, has not yet been evaluated and optimal management practices have not been defined. The objective was to quantify sward canopy responses to grazing frequency and intensity in order to assess relative grazing tolerance among RP genotypes. Treatments were the factorial com-binations of four RP genotypes [Florigraze, UF Peace, UF Tito, and Ecoturf], two grazing intensities (50 and 75% canopy removal), and two grazing frequencies (3 or 6 wk), arranged in two replications of a randomized complete block design. Sward canopy responses related to grazing tolerance were measured from June through Oc-tober 2012. They included pregraze light interception (LI) and leaf-to-stem ratio and postgraze residual leaf area index (RLAI). Grazing frequency affected LI, with the 6-wk treatment having greater LI (P < 0.05) compared with the 3-wk interval (91.4 and 85.0%, re-spectively). A genotype effect was observed for postgraze RLAI (P < 0.0001) where Ecoturf had greater RLAI than Florigraze and UF Tito (1.2 vs. 0.81 and 1.05, respectively). UF Peace was not different from Ecoturf and UF Tito, but had greater RLAI (1.19) than Flori-graze. Residual leaf area was less for 75 than 50% canopy removal (P < 0.0001; 0.89 vs. 1.23, respectively). Pregraze leaf-to-stem ratio was greater (P < 0.01) for Ecoturf (1.75) compared with UF Peace, Florigraze, and UF Tito (1.34, 1.47, 1.44, respectively). The 3-wk grazing frequency resulted in lesser leaf-to-stem ratio compared to the 6-wk frequency (1.41 and 1.59, respectively). These data suggest that the prostrate growth habit of Ecoturf is associated with greater leaf-to-stem ratio before grazing and RLAI following defoliation events. Greater pregraze LI with 6- vs. 3-wk grazing frequency and greater RLAI with 50 vs. 75% removal suggest that these levels of the treatment factors likely favor RP persistence.
Keywords: Rhizoma peanut
40 Animal Preference for Winter Annual Legumes Overseed-ed into Bermudagrass Pastures over 2 Growing SeasonsS. Freeman *, M. Poore, A. Shaeffer, Animal Science, North Carolina State University, Raleigh
With feed costs rising, beef farmers are seeking ways to decrease stored feed expenses through use of pasture. One option for extend-ing grazing season is overseeding annuals into dormant Bermudag-rass (Cyndon dactylon). One objective of our trial was to evaluate animal graing preference among hairy vetch (Vicia villosa, V) Aus-trian winter peas (Pisum sativum, P), arrowleaf clover (Trifolium ve-siculosum Savi, A) and crimson clover (T. Incarnatum, C). Legumes were overseeded into Bermudagrass in a randomized complete block
design (4 replicates/yr) in 2 yr. Plots were used in one yr, only. Sub-plots (3 per yr) within replicates were randomly assigned to grazing sequence and grazed at 2-wk intervals beginning when forage was 10cm tall. In addition to measuring forage quantity and quality over the 6-wk grazing period, animal choice of legume was observed at 15 min intervals for 2 h and then 30 min intervals for an additional hour at the onset of grazing sub-plots to determine animal preference for the legumes. Sub-plots were grazed once. Impact of legumes on grass stand vigor was monitored. Based on percentage of herd graz-ing each legume at the times of observation, a was the preferred le-gume (Table 1). Cattle moved away from C between sequence 1 and 2 in favor of P and a (P ≤ 0.038), likely the result of earlier matura-tion of this species as compared to the latter. Preference for V and control plots (no legume) was consistent over the trial. While a was preferred overall, C had the least deleterious effect on the Bermudag-rass and was consumed well while vegetative. Table 1. Relationship between grazing sequence and legume preference in cattle (% cattle grazing, SEM = 4.46; legume and legume x sequence P < 0.01)
Grazing sequence 1 2 3 Overall
Crimson 8.7ac, 1 3.3a, 2 2.0a, 2 4.6a
Vetch 5.0a 4.2a 4.8a 4.6a
Peas 6.9a, 1 13.0ac, 2 12.6ac, 2 10.8ac
Arrowleaf 36.0b, 1 49.0b, 2 48.1b, 2 44.4b
No legume 20.2c 18.8c 18.9c 19.3c
a,b,c Means within a column without common superscripts differ (P < 0.05)1,2 Means within a row without common superscripts differ Keywords: cattle, preference, winter annual legumes
41 Evaluation of Early Weaned Beef Calves Grazing Annual Ryegrass or Annual Ryegrass-Triticale Mixtures in South FloridaJ. M. Vendramini 1,*, J. D. Arthington 1, A. Blount 2, A. D. Aguiar 1, P. Moriel 1, R. S. Hallworth 1, 1UF/IFAS Range Cattle Research and Ed-ucation Center, University of Florida, Ona, 2UF/IFAS North Florida Research and Education Center, University of Florida, Marianna
Mixing small grains with annual ryegrass (Lolium multiflorum Lam.) may be a feasible management practice to improve forage produc-tion and extend the winter grazing season in South Florida. The ob-jective of this study was to evaluate forage characteristics and animal performance of early weaned beef calves grazing annual ryegrass or annual ryegrass-triticale (Triticosecale sp.) mixed pastures. The experiment was conducted at Ona, FL from February to April 2011 (Yr. 1) and 2012 (Yr. 2). Treatments were annual ryegrass (RG) or annual ryegrass-triticale (RT) pastures distributed in a completely randomized design with four replicates. Pastures were broadcast-seeded with 17 kg/ha of ‘Jumbo’ RG with or without 100 kg/ha of ‘Trical 2700’ triticale. Four calves (mean initial BW = 100 ± 13 kg) grazed 0.3 ha pastures continuously at a fixed stocking rate. Calves were supplemented daily with concentrate (14% CP and 78% TDN) at 1% BW. Forage was evaluated every 14 d for herbage mass (HM)
16
and nutritive value. Botanical composition and calf BW were record-ed every 28 d. Data were analyzed using the GLIMMIX procedure of SAS, with the main effects of treatment, month, year, and their interaction. There was a treatment x year interaction on HM (P = 0.05; SE = 150). Herbage mass was similar in Yr. 1 (1,700 kg/ha), however, the RT treatment had greater HM than the RG treatment in Yr. 2 (2,700 vs. 2,000 kg/ha). There was a month effect on HM; RG and RT had greater HM (P =0.01, SE = 100) in February (2,400 kg/ha) than April (1,700 kg/ha). The proportion of triticale in the mix-ture decreased from February to April in Yr. 1 (79 to 51%; P = 0.001, SE = 3) and increased during the same period in Yr. 2 (64 to 84%, P = 0.0001, SE = 3). The RG had greater CP (19%) and IVOMD (79%) than the RT treatment (16 and 73%, for CP and IVOMD, re-spectively; P < 0.0001). There was no difference in calf ADG (mean = 0.83 kg/d, P = 0.23, SE = 0.05) and gain per hectare (mean = 1138 kg/ha, P = 0.21, SE = 70). Annual ryegrass-triticale mixture may have greater HM than annual ryegrass pastures but the inclusion of triticale did not increase the grazing period and animal performance.
Keywords: annual ryegrass , early weaned calves, triticale
42 Grazing Behavior of Heifers Grazing Mixed, Adjacent or Monoculture Pastures of Ryegrass and CloversG. Scaglia 1,*, H. T. Boland 2, 1Iberia Research Station, LSU AgCen-ter, Jeanerette, 2Prairie Unit, Mississippi State University, Prairie
Combination of grasses and legumes provide a better balance of nutrients and may satisfy the animal’s preference for a mixed diet; however it is known that spatial variability and selective grazing in-crease foraging costs. Spatially separated pastures may reduce these costs. The effect of clovers with different growth habits on grazing behavior patterns is unknown. The objectives were to evaluate the grazing behavior and performance of stocker heifers. Treatments (3 replicates) were: 1) ryegrass (Lolium mulitflorum, RG) alone, 2) mixed (MIX) sward of ryegrass and clover mix [berseem (Trifolium alexandrinum), white (T. repens), and red clover (T. pratense)], 3) clover mix (CL) alone; and 4) adjacent areas (ADJ) of ryegrass and clover mix. Crossbred heifers (n=48; 224 ± 14 kg; 10 mo of age) were continuously stocked at 2.5 heifers/ha. A pedometer was at-tached to the left-back leg of one heifer randomly selected from each treatment-replicate. PROC mixed was used with treatment as the fixed effect, year as random effect and pasture as the experimen-tal unit. Orthogonal contrasts were also analyzed. Forage mass and nutritive value parameters were not limiting factors during the ex-perimental period. There were no year or treatment effect on ADG (P = 0.87 and 0.12, respectively) and kg beef/ha produced (P = 0.77 and 0.15, respectively). All contrasts were not different (P > 0.05) except when simple (RG, CL) vs. complex swards (MIX, ADJ) were compared. Daily gains and beef produced/ ha were greater in legume/grass swards (1.26 kg, 275 kg/ha, respectively) than in grass or legume-only swards (1.17 kg and 255 kg/ha). Number of steps and grazing time were greater (P < 0.05) in heifers grazing RG com-pared to CL and ADJ while MIX was intermediate. Complex swards increase feed diversity and may improve animal performance. Spa-tially separated swards may be a useful tool to improve grazing ef-ficiency in intensive pastoral ecosystems.
Keywords: grazing behavior, ryegrass, stockers
43 Additivity of Stacked Technologies in Stocker CattleR. Reuter 1,*, D. Dhuyvetter 2, D. Hufstedler 3, 1Agriculture Division, the Noble Foundation, Ardmore, OK, 2Research Dept., Ridley, Inc., Mankato, MN, 3Technical Services, Elanco Animal Health, Guthrie, OK
Mixed-breed, sale barn-sourced stocker steers (n=90, BW=246 ± 19.7 kg) were used to evaluate the additivity of proven technolo-gies (ionophores and implants) when they are used simultaneously. Steers were preconditioned for 51 d, and were then either not im-planted or implanted with 40 mg trenbolone acetate, 8 mg estradiol, and 29 mg tylosin tartrate (Component TE-G with Tylan). Implanted and non-implanted steers were then randomly allocated to graze 4-ha cereal rye paddocks (n=9) in southern Oklahoma. Paddocks were supplemented with either white salt blocks (SALT), non-medicated mineral blocks (MIN) or Rumensin mineral blocks with 882 mg/kg monensin (R-MIN). Blocks were provided ad libitum in plastic feeders located in the center of each paddock, at the rate of 1 block per 5 steers. Blocks were weighed weekly and were replaced when 80% disappeared. Steers were weighed individually on calibrated scales following a 16-h shrink at the beginning and end of the 84-d grazing season. Average daily gain was analyzed as a split-plot design. The main plot factor was supplement block type, and the split-plot factor was implant status. Effects and interactions were considered significant when P<0.10. As expected, there was no in-teraction P=0.13 between block type and implant status for ADG, indicating that implants and monensin supplements are both fully efficacious when they are used simultaneously. Implanting dramati-cally improved ADG as compared to the control (1.15 and 0.94 kg/d, respectively; P=0.001). R-MIN improved ADG as compared to SALT (1.13 and 0.96 kg/d, respectively; P=0.02). MIN was interme-diate (1.05 kg/d) and not different from either supplement P=0.18). Season-long mean daily block disappearance was 41, 84, and 106 g/steer (all different P=0.03) for SALT, R-MIN and MIN, respec-tively. Using 2012 retail costs for technologies and $2.2/kg value of gain, the implant and R-MIN technologies each increased expected net return (P<0.001 and P=0.15, respectively) as compared to the control systems (no implant and salt supplementation). When used simultaneously, these two technologies increased expected net return by approximately $60 per steer.
Disclosure of Interest: R. Reuter: This research was sponsored by Ridley, Inc and Elanco Animal Health. Component TE-G with Tylan and Rumensin are registered trademarks of Elanco Animal Health.; D. Dhuyvetter: None Declared, D. Hufstedler: None Declared
Keywords: grazing supplement, implant, stocker cattle
44 Forage Productivity, Phosphorus Uptake and Soil Phospha-tase Activity in a Cool-Season Pasture as Influenced By Nitrogen FertilizationS. L. Dillard 1,*, W. F. Owsley 1, C. W. Wood 2, B. H. Wood 2, C. J. Weissend 1, R. B. Muntifering 1, 1Animal Sciences, 2Agronomy and Soils, Auburn University, Auburn University, Auburn, AL
Pastureland soils in many areas of the southeastern US are high in concentration of P because of long-term application of fertilizer and/or animal manures, including excreta returns under intensive graz-ing. Nutrient cycling in a pasture system may be enhanced by man-agement practices that facilitate phytoextraction of nutrients from nutrient-enriched soils and incorporate grazing livestock. An experi-

16 17
ment was conducted to determine effects of N-fertilization regime on forage productivity, foliar P uptake and soil phosphatase activity in a cool-season pasture with high soil-test P. In October 2010 and 2011, 6 0.28-ha plots were overseeded with triticale (Triticum secale) and crimson clover (Trifolium incarnatum) into a tall fescue (Lolium arundinacea) sod and assigned randomly to 1 of 3 treatments (trts; n = 2): 100% of N recommendation for tall fescue in a split application (100N), 50% of N recommendation (50N) and 0% of N recommen-dation (0N). In February 2011 and January 2012, 6 cattle (1 animal/plot; 339 ± 11 and 345 ± 60 kg BW in 2011 and 2012, respectively) were randomly assigned to plots. Forages were sampled biweekly until grazing was terminated in May, and soil was sampled prior to animal grazing in both yr. Data were analyzed as a completely ran-domized design using PROC MIXED of SAS. Mean forage mass was not different between 2011 (2,764 kg DM/ha) and 2012 (3,051 kg DM/ha), or among trts. Mean foliar P concentrations were greater (P < 0.05) for 50N (0.29%) than 100N (0.25%), but were not differ-ent between yr. A yr × trt interaction was observed such that foliar P concentration in 100N was greater (P < 0.05) in 2011 (0.29%) than 2012 (0.21%). Mean foliar P mass was not different among trts or between yr, but was less in 0N (6.0 kg P/ha) than 100N (9.4 kg P/ha) in 2011 (yr × trt interaction; P < 0.10). Acid phosphatase activ-ity was not different among trts or between yr, but base phosphatase activity was greater (P < 0.05) in 50N and 0N than 100N. Results are interpreted to mean that forage productivity, P uptake and soil acid phosphatase activity were unaffected by N-fertilization regime in the grazed cool-season pasture.
Keywords: Forage, Nitrogen, Phosphorus
45 Effect of Grazing Legume or Grass Forages with or With-out Corn Supplementation on Animal Performance and Meat Quality of Forage-Finished Beef.A. Wright *, J. Andrae, M. Miller, P. Gunter, C. Rosso, E. Pavan, S. Duckett, Animal and Veterinary Sciences, Clemson University, Clemson, SC
Angus x Hereford steers (n = 32) were used in a 2-yr study to ex-amine forage type (legume: alfalfa and soybeans, LG vs. grass: tall fescue and sudangrass, GR) and individual daily corn supplementa-tion (0, NS vs. 0.75% BW, CS) on animal performance and carcass quality. Steers were finished to an equal time endpoint (105 d) and slaughtered. Steaks (2.5 cm thick) from LM were obtained for proxi-mate analysis and tenderness after different postmortem aging times (2, 4, 7, 14, 28 d). Data were analyzed in a mixed model using a 2x2 factorial arrangement of treatments. Steer was the experimental unit and year included as a random effect. Corn supplementation (CS) increased (P < 0.05) average daily gain (ADG), hot carcass weight (HCW), dressing percentage (DP) and tended (P < 0.06) to increase fat thickness at the 12th rib (FT). CS also increased (P < 0.05) yield grade (YG) and tended to increase (P < 0.07) quality grade (QG). In terms of forage, LG increased (P < 0.05) DP and HCW, with a tendency to increase ADG (P < 0.06). CS resulted in lower (P < 0.05) concentrations of CLA c9t11 and n-3 FA in LM. Steers receiv-ing CS had a higher (P < 0.05) n-6:n-3 ratio (3.1 vs. 2.4), but both are lower than the 4:1 ratio recommend by health officials. Steers on GR had higher (P < 0.05) concentrations of saturated FA in the LM due to increased (P < 0.05) stearic (C18:0) acid percentages. Longis-simus muscle calcium content was higher (P < 0.05) for LG than GR. Alpha-tocopherol and beta-carotene were altered (P < 0.05) by forage-type and corn supplementation. Tenderness was only affected
(P < 0.05) by postmortem aging. Grazing legumes during finishing improves HCW and DP, and tends to improve ADG. Corn grain sup-plementation to grazing steers improved animal performance while not negatively impacting the nutritional qualities of the meat.
Keywords: beef, corn supplementation, legume
46 Proteolysis Inhibiting Polyphenol Oxidase Present in Pe-rennial PeanutM. Sullivan 1, J. Foster 2,* , 1U.S. Dairy Forage Research Center, Ag-ricultural Research Service, U.S. Department of Agriculture, Madi-son, 2Texas A&M AgriLife Research, Beeville
Previous work with perennial peanut (Arachis glabrata) hay and haylage shows that it has greater rumen undegraded protein (RUP) than other legume forages, including alfalfa (Medicago sativa). Tan-nin is commonly associated with increased RUP, however, reports of the presence of tannin in perennial peanut are not consistent and vary from no tannin to moderate levels of tannin. Red clover (Trifolium pretense) contains polyphenol oxidase (PPO) and PPO substrates that are attributed to reduced post-harvest proteolysis and possibly increased RUP as compared to alfalfa. The objective of this study was to determine if perennial peanut contained PPO and PPO sub-strates as this would explain the increased RUP despite inconsistent reports of the presence of tannins. Perennial peanut does contain de-tectible PPO protein and levels of activity greater (>100 nkatal/mg protein) than that of red clover. In perennial peanut leaf extracts de-pleted of endogenous phenolics, addition of a PPO substrate (caffeic acid) reduced proteolysis by about 90%. Phenolics extracted from perennial peanut leaves inhibited proteolysis in leaf extracts of both perennial peanut and transgenic alfalfa plants expressing red clover PPO by >70%. It is likely that the reduced proteolysis is due largely to PPO-mediated oxidation of o-diphenols and subsequent reac-tions of the formed o-quinones that inactive endogenous proteases. Although a PPO/o-diphenol system may explain the relatively high RUP of perennial peanut, in vivo experiments comparing perennial peanut, red clover, and alfalfa with and without PPO expression are suggested. Perennial peanut and other PPO containing legumes have an important environmental role because of enhanced protein utiliza-tion efficiency and reduced nitrogen in excrement.
Keywords: perennial peanut, polyphenol oxidase, rumen undegrad-able protein
47 Level of Forage Allocation and Protein Tubs Influence For-age Utilization and Pasture Productivity in Heifers Grazing Stockpiled Tall FescueM. H. Poore 1,*, A. D. Shaeffer 1, S. R. Freeman 1, D. H. Poole 1, G. R. Hansen 1, M. L. Alley 1, C. S. Whisnant 1, M. E. Drewnoski 2, 1Animal Science, North Carolina State University, Raleigh, 2Animal Science, University of Idaho, Moscow
Stockpiled tall fescue managed with strip grazing is an efficient win-ter forage system but performance may be inadequate for developing heifers (H). This study evaluated 2 levels of forage allocation (FA) and two supplements (S) during 56-d (Nov and Dec) before breed-ing. Pastures were fertilized in early Sept with 56 kg/ha N, were 83% fescue (Ky-31, 49% infected), and were 11.1% CP and 29% ADF on d 1. Yearling H (initially 273 kg and BCS 5.2) were blocked by BW and assigned to 16 pastures arranged in 4 land reps. Each group had
18
5 animals (3 H and 2 steers of similar BW), and group was the ex-perimental unit. Treatments were provided in a 2 x 2 factorial, with 2 S types [mineral (M) or a 25% CP molasses-based tub (TUB, Southern States Maxi-Cattle)], and 2 levels of FA [the normal for this system at this location (NA, 80% utilization with a target grazing height of 5 cm), and a FA judged to leave 25% more residual than NA (EA)]. The decision of how much forage to allocate was made when a new strip was given every other day by an experienced tech-nician. Forage mass was determined pre- and post-grazing twice to determine forage DMI. Pre-grazing mass was 4059 kg/ha at a 5 cm clipping height and 6046 kg/ha to soil surface. Forage utilization ef-ficiency (FUE) was greater (P<0.05) for NA than EA (77, 79, 71, and 69% to 5 cm, and 52, 53, 48, and 46% to soil surface for NA-M, NA-TUB, EA-M and EA-TUB, respectively). S intake was greater (P<0.05) for Tub than M (0.26, 0.56, 0.16 and 0.74 kg/d for NA-M, NA-Tub, EA-M and EA-Tub, respectively). Area grazed and forage DMI were lower (P<0.05) for NA than EA (0.071, 0.072, 0.104, and 0.099 ha/H; and 4.57, 4.27, 6.02, and 5.81 kg/d for NA-M, NA-TUB, EA-M and EA-TUB, respectively). Gain per ha was greater (P<0.05) for TUB than for M (204.8, 345.7, 263.4 and 319.4 kg/ha for NA-M, NA-Tub, EA-M and EA-Tub, respectively). Increased FA increased forage DMI and area grazed, but reduced FUE. Supple-menting with a TUB did not influence FUE but increased total gain per ha compared to M.
Keywords: Replacement heifers, Stockpiled Fescue, Supplementa-tion
48 Effect of Cow Size and Stocking Rate on Calf Growth, Hay Requirements and Cow Herd Efficiency P. Beck 1,*, B. Stewart 2, H. Gray 2, S. Gadberry 3, 1Department of Ani-mal Science, 2SWREC, University of Arkansas, Hope, 3Cooperative Extension Service, University of Arkansas, Little Rock
Eight 4 ha mixed warm-season grass pastures at the University of Arkansas SWREC Cow-Calf Unit were stocked with spring calving cows at 4 stocking rates (SR, 1, 1.5, 2, or 2.5 cow calf pairs per ha) over 4 yr. Cows were segregated into large (BW = 555 ± 41.9 kg) and small (BW = 440 ± 24.8 kg) BW groups. Each pasture received 112 kg/ha N as ammonium nitrate in May and was broadcast seeded to annual ryegrass in mid October each fall along with 112 kg/ha N as ammonium nitrate. Forage availability of pastures was estimated monthly by rising plate meter during the grazing period. At time of rising plate data collection, forage grab samples were collected for estimation of diet quality. Data were analyzed by regression to determine the effects of cow size and stocking rate on calf perfor-mance, cow BW change, calf gain and weaning weight per ha, and hay feeding requirements. Over the entire 4-yr period predicted calf weaning weights decreased (P = 0.05) with increasing SR for both large and small cows but calf BW at weaning were decreased to a greater extent in large cows compared with small (-21 kg vs. -17 kg, respectively; P = 0.05). There was however a linear effect (P = 0.05) of SR on predicted calf gains = 162 - 0.02 Cow BW – 14.9 SR (R2 = 0.04, P = 0.01). Weaning efficiency (WE, kg of calf weaning weight per kg of cow BW at weaning) was affected by a cow BW by SR interaction (P = 0.02), for large cows WE = 0.58 – 0.62 SR + 0.46 SR2 while for small cows WE = 0.53 – 0.24 SR + 0.18 SR2. There were linear increases (P < 0.01) in calf weaning weight per ha and total calf gain per ha with increasing SR, but cow size only affected weaning weight per hectare (increasing 0.24 kg for each kg increase in cow BW (P = 0.05). Hay feeding days, total hay fed per
cow, and hay fed per kg metabolic BW increased linearly (P = 0.05) with increasing SR, yet cow BW had no affect (P > 0.13). These data indicate that increasing cow size can increase weaning BW of calves, but does not affect total production per ha and reduces wean-ing weight efficiency ratios. Increasing SR reduces individual calf BW gain but increases total calf gain per ha, and increased require-ments of conserved forages.
Keywords: beef cattle, cow body weight, stocking rate
49 Toxic Tall Fescue Exposure Timing Negatively Affects Re-productive Success in Two and Three Year Old Beef CowsM. G. Burns 1, J. G. Andrae 2,*, M. C. Miller 1, F. N. Schrick 3, S. L. Pratt 1, 1Dept. of Animal and Vet Science, 2School of Ag Forestry and Environmental Sciences, Clemson University, Clemson, 3Dept of Animal Science, University of Tennessee, Knoxville
This study was conducted to determine if grazing toxic endophyte-infected tall fescue (E+) negatively impacts reproduction pre- or post-insemination, and its effects on calf performance. In the first two years of a three year grazing study, 2- and 3-yr old beef cows (114 cows total) were blocked by breed, body condition score (BCS) and age and allotted to treatment groups grazing E+ (> 70% wild-type infected) or other nontoxic forages (O; common bermudagrass and annual ryegrass) for 90 d prior to timed artificial insemination (TAI). All animals received a CIDR 8 d prior to TAI, which was re-moved after 5 d followed by 2 injections of PGF2α 8 h apart. Timed AI was performed 72 ± 2 h post-CIDR removal. Immediately fol-lowing TAI, approximately 50% of cows from each original grazing treatment were switched to the alternate grazing treatment for the remainder of the trial (130 d), consistent with a 2x2 factorial arrange-ment. The experimental design resulted in the following treatment combinations: fescue-fescue (E+E+, n = 32), fescue-other (E+O, n = 26), other-fescue (OE+, n = 30), and other-other (OO, n = 36). Ten days after TAI, bulls were placed with cows for 60 d. Blood was collected pre- (d -18) and post-TAI (year 1 = d 10; year 2 = d 30) for prolactin (PRL) concentrations. Pregnancy was determined using transrectal ultrasonography at d 30, 60, and 130 and verified with calving records. Fescue exposure decreased serum PRL levels (P < 0.05) compared to O. Grazing E+ pre-AI lowered (P < 0.05) d 30, 60 and 130 pregnancy rates when compared to O. Grazing E+ post-AI lowered d 60 and 130 pregnancy rates compared to O treatment (P < 0.05). Pre-weaning calf growth was negatively affected by E+ treat-ment post-AI as E+ decreased (P < 0.05) ADG and adjusted weaning weight compared with calves grazing O. Grazing 2 and 3 yr old beef cattle on toxic tall fescue prior to the breeding season decreases TAI and final pregnancy rates.
Keywords: beef cattle, Reproduction, Tall Fescue
50 Feeding Ergot Alkaloids to Gestating Ewes Reduces Lamb Weight, Organ Size and Muscle Mass S. K. Duckett 1,*, T. A. Burns 1, M. C. Miller 1, K. J. Mercer 1, M. G. Burns 1, J. G. Andrae 1, F. N. Schrick 2, S. L. Pratt 1, 1Animal and Veterinary Sciences, Clemson University, Clemson, 2Animal Science, University of Tennessee, Knoxville
Twenty Southdown ewes were mated to one ram and confirmed pregnant via transrectal ultrasonography. Pregnant ewes were ran-domly assigned to one of two dietary treatments at d 35 of gestation.
18 19
Physiology
Treatments were: 1) endophyte-infected (Neotyphodium coenophi-alum) tall fescue seed (E+; 0.8 ug of ergovaline /g diet DM) and 2) endophyte-free tall fescue seed (E-; 0.0 ug of ergovaline/g diet DM). Seed was delivered in a total mixed ration, which was formulated to meet NRC requirements. Serum prolactin levels of ewes prior to treatment (d 30) did not differ (P > 0.05); however prolactin levels of the E+ ewes at d 50 were lower (P < 0.05) than E- and pretreat-ment levels for both. At parturition, a male lamb (E+ = 8; E- = 8) was removed from each ewe, given artificial colostrum, and harvested within 12 h of birth. Data were analyzed using a mixed model with dietary treatment as fixed effect and ewe as random effect. E+ ewes had shorter (P < 0.05) gestation length than E- controls (140 vs. 144 d). Live weight and hot carcass weight of lambs at birth were re-duced (P < 0.01) by 37% for E+ compared to E- lambs. Dressing per-cent did not differ (P > 0.05) among treatments. Organ weights were also smaller (P < 0.05) for E+ than E-. Total muscle weight from the
right side of each carcass tended to be lighter (P = 0.08) for E+ than E-. Individual muscle weights for LM, semitendinosus, semimem-branosus, biceps femoris, quadriceps femoris, and gluteus medius were heavier (P < 0.05) for E- than E+. Kidney fat amounts were lower (P < 0.05) for E+ than E-. Thymus and spleen mass tended (P < 0.10) to be smaller for E+ than E- even when adjusted for body or carcass weight. All other organs and muscle weights did not differ (P > 0.05) when expressed on a weight basis. Total viscera weight was greater (P < 0.05) for E+ than E- when expressed on a body weight or hot carcass weight basis. Fetal growth is restricted in ewes fed endophyte-infected tall fescue seed to simulate fescue toxicosis during gestation (d 35 to parturition). Additional research is needed to determine if the restrictions in fetal growth are related to shorter gestation length and/or nutrient restriction due to vasoconstriction.
Keywords: Fescue toxicosis, Fetal growth, Sheep
51 Emerging Young Scholar: Effect of ergot alkaloids from en-dophyte-infected tall fescue on ruminal vasculature, blood flow, and nutrient absorptionA.P. Foote *, University of Kentucky, Lexington
Ergot alkaloids (EA) are thought to cause fescue toxicosis mainly through peripheral vasoconstriction. However, there is data indicat-ing that blood flow to the gastrointestinal tract is altered. The objec-tives of these experiments were to determine the constrictive poten-tial of EA on bovine foregut vasculature and the effect on nutrient absorption. Right ruminal artery and veins were used to determine the vasoconstrictive potential of EA incubated in a multi-myograph. Results indicated EA have the potential to induce vasoconstriction of ruminal artery and vein. A preliminary study showed that a toxic tall fescue seed extract (E+EXT) induced a greater contractile response than ergovaline at the same concentration (P<0.05). A second exper-iment was conducted to determine if E+EXT has a greater vasoactive potential than ergovaline in ruminal artery and vein and saphenous vein. The treatments included E+EXT, pure ergovaline, a mixture of ergot alkaloids (ALK), and a non-toxic tall fescue seed extract (E-EXT). Ergovaline, E+EXT, and ALK had similar responses in all vessels. The E-EXT did not induce vasoconstriction (P>0.1). Results indicate that ergovaline is largely responsible for the vasoconstric-tion. An additional study was conducted to determine the effect of EA on ruminal epithelial blood flow. Steers received endophyte-in-fected (E+) or endophyte-free (E-) tall fescue seed at thermoneutral (TN) and heat stress (HS). On day 8, the rumen was emptied and washed. VFA-containing buffer was incubated in the following se-quence: control (CON), 15 µg ergovaline/kg BW (1×EXT), and 45 µg ergovaline/kg BW (3×EXT). Epithelial blood flow was calculat-ed as clearance of D2O. The E+ seed decreased epithelial blood flow at TN during the CON incubation but the two groups of steers were not different during the 1×EXT and 3×EXT (P<0.01). Inclusion of the extract in the buffer caused at least a 50% reduction in epithe-lial blood flow (P<0.01). VFA absorption was reduced compared to CON (P<0.01). Results from this series of experiments show that ergot alkaloids, mainly ergovaline, can induce vasoconstriction of blood vessels in the foregut of cattle, likely leading to a decrease in
blood flow to the absorptive surface of the rumen and a decrease in VFA absorption.
52 Emerging Young Scholar: Characterization of the interac-tions between Porcine Reproductive and Respiratory Syndrome Virus and its intracellular environment.J. Hicks *, North Carolina State University, Raleigh.
Porcine reproductive and respiratory syndrome (PRRS) is character-ized by abortions in pregnant sows and respiratory disease, particu-larly in young pigs. The causative agent is porcine reproductive and respiratory syndrome virus (PRRSV), a member of the arterivirus family. Here we demonstrate by means of a yeast two-hybrid system that the cellular protein Snapin specifically interacts with GP5 and M, the major viral envelope proteins. Snapin interacts with many proteins involved in membrane fusion via its interaction with the SNARE complex. Through the use of siRNA-mediated knock-down of snapin we demonstrate that the GP5/M/snapin interaction is an important aspect of PRRSV pathogenesis. Reduced snapin expres-sion results in reduced PRRSV replication as evidenced by reduced viral titers and reduced nucleocapsid expression. It is likely that the interaction between GP5 and M with snapin is involved in intracel-lular trafficking events during PRRSV infections. To further assess the interactions between PRRSV with its intracellular environment we determined changes in cellular microRNA (miRNA) expression during the course of an in vitro PRRSV infection in swine alveolar macrophages (SAMs). We have shown that expression of ~40 cel-lular miRNAs is altered within the first 48 hours of PRRSV infection in SAMs. Analysis of the potential genes and pathways regulated by these differentially expressed miRNAs suggests that they are involved in regulating multiple cellular pathways including the im-mune related and intracellular trafficking pathways. Interestingly we found that one of the differentially expressed miRNAs, miR-147, which was significantly down regulated in PRRSV infected cells at 24hpi, likely regulates snapin expression. As demonstrated here per-turbations in the interaction between GP5/M with snapin negatively impacts PRRSV replication, providing a new avenue for antiviral
20
therapy research. In addition the work presented here revealed that PRRSV has a great impact on cellular miRNA expression and this alteration of expression likely contributes to both host response to infection as well as to PRRSV pathogenesis.
53 Does Sex of Littermate Affect Reproductive Performance of Ewes?J. A. Brown 1,*, D. P. Kirschten 2, G. S. Lewis 2, 1Department of Biolo-gy, Wingate University, Wingate, NC, 2USDA, Agricultural Research Service, U.S. Sheep Experiment Station, Dubois, ID
Our objective was to determine whether lifetime reproductive perfor-mance of ewes born and reared co-twin with a ewe differed from that of ewes born and reared co-twin with a ram. Lifetime records from Columbia, Polypay, Rambouillet, and Targhee ewes born during a 7-yr period were evaluated to accomplish our objective (n = 1,272 ewes and 8,660 lambings; 62% lambed as 1-yr olds; 70% twinning rate; ewes culled before ≈ 8 yr of age). Models used to analyze the data included terms for year, breed, sex of littermate (SL), birth type, rearing type, parity, age at first lambing, and interactions. Sex of lit-termate did not affect (P > 0.05) lifetime number of lambs born alive or weight of lambs born and weaned; mean lamb birth weight or weaning weight; or mean number of parities before culling. How-ever, SL affected (P = 0.04) lifetime number of lambs weaned; 6.1 lambs for ewes born and reared co-twin with a ram vs. 5.2 for ewes born and reared co-twin with a ewe. Breed affected (P = 0.001) total weight of lambs born and weaned, total number of lambs born alive and weaned, mean birth and weaning weight, mean number of lambs born alive and weaned, mean number of parities, and age of first lambing. A SL × parity interaction was observed for total weight of lamb weaned (P = 0.04) and total number of lambs born alive and weaned (P = 0.04 and 0.03, respectively). The SL × breed × parity effects for lifetime weight of lambs born and weaned (both P < 0.01), mean birth (P = 0.04) and weaning weight (P = 0.01), and total lambs born (P < 0.001) were observed. Despite the finding that ewes born and reared co-twin with a ram weaned more lambs in their lifetime than did ewes born and reared co-twin with a ewe, SL did not have any major effects on other lifetime reproductive performance mea-sures of ewes. Because of the complexity of the interactions and varied responses across breeds and parities, we determined that the traits should be analyzed within the respective breeds.
Keywords: lifetime productivity, littermate, Sheep
54 Effect of Dietary Menhaden Fish Oil (MFO) on Growth Performance in Gilts Farrowed By Sows Fed Gestation and Lac-tation Diets with or without MFO M. J. Estienne *, A. F. Harper, Tidewater Agricultural Research and Extension Center, Virginia Tech, Suffolk
Positive effects of dietary Omega-3 PUFA on swine reproduction, such as an increase in boar sperm numbers, have been reported (Es-tienne et al., 2008). The effect of a rich source of PUFA on growth and reproduction in replacement gilts has received little attention. Thus, the objective was to determine the effects of dietary MFO on growth in gilts born to sows fed gestation and lactation diets con-taining MFO. Pregnant sows received one of two isocaloric diet regimens that were also equal with respect to amino acids, minerals and vitamins: corn-soy gestation and lactation diets (control, CON) (n = 4) or corn-soy gestation and lactation diets that included 4%
MFO (n = 3). At weaning (21 d of age), gilt pigs (n = 24) farrowed by sows fed CON or MFO diets were placed in pens of three gilts each and allowed ad libitum access to nursery and then grow-finish CON or MFO diets as per a 2 x 2 factorial arrangement of treat-ments (n = 3 pens per group). There were no effects (P > 0.1) of pig diet or sow diet x pig diet for ADG, however, pigs born to sows fed MFO diets tended (P = 0.09) to have greater overall ADG than pigs from sows fed CON diets (0.78 vs. 0.67 kg). For gilt BW, there was an effect (P < 0.01) of sow diet x time; BW of pigs at weaning was similar (P > 0.1) among groups, however, at the end of the 18-wk trial, gilts born to sows fed MFO diets had greater (P < 0.01) BW than pigs from sows fed CON diets (105.2 vs. 94.1 kg). There were tendencies (P = 0.07) for effects of pig diet on ADFI and G:F with gilts consuming MFO diets consuming less feed (1.67 vs. 2.0 kg) but displaying a greater G:F (0.43 vs. 0.36) than control diet-fed counterparts. Feed consumed and G:F were not affected (P > 0.1) by sow diet or sow diet x pig diet. We suggest that feeding sows diets containing Omega-3 PUFA during gestation and/or lactation affects gilt offspring such that growth is enhanced during grow-finish. Also, gilts fed diets with MFO have decreased ADFI but enhanced G:F. (Financial support by Omega Protein, Inc., Houston, TX)
Keywords: Gilts, Growth, Menhaden fish oil
55 Effect of Citrus Pulp on the Viability of the Probiotic Sac-charomyces Cerevisiae Boulardii and Subsequent Effects in Presence of PathogensJ. R. Donaldson 1,*, J. A. Carroll 2, T. C. McLaurin 1, N. C. Burdick Sanchez 2, 1Biological Sciences, Mississippi State University, Missis-sippi State, 2Livestock Issues Research Unit, USDA-ARS, Lubbock, TX
The probiotic Saccharomyces cerevisiae subtype boulardii is com-monly provided to weaned piglets and nursing sows to promote in-testinal health through stabilization of the gut flora. Recent research from our group identified that supplementation of this probiotic to feed containing the alternate carbohydrate citrus pulp reduced (P = 0.01) the ADG of newly weaned pigs challenged with the enteric bacterium Salmonella. The objective of this study was to determine if this reduction in ADG could potentially be attributed to an abnor-mal interaction of the live yeast with Salmonella and citrus pulp and whether similar interactions would occur in the presence of other pathogens, such as Escherichia coli O157:H7. Using an in vitro ap-proach, viability was assessed for the live yeast and Salmonella or E. coli in swine fecal growth medium supplemented with either 0% or 5% citrus pulp through viable plate counts for 48 h. Citrus pulp reduced (P < 0.01) populations of live yeast by 1.5 log10 within 48 h post-exposure, suggesting citrus pulp may exhibit fungicidal activ-ity. In co-cultures of Salmonella and live yeast, the populations of live yeast decreased (P < 0.001) by 1.5 log10. However, when citrus pulp was included in the co-culture, greater reductions in the popula-tions of Salmonella and live yeast were observed than in either single treatment. Together with the decreased ADG previously observed, these data suggest the increase in Salmonella lysis from exposure to both live yeast and citrus pulp may increase cytotoxins released and potentially compound the immune response. Populations of E. coli did not decrease in the presence of live yeast, indicating that this enteric pathogen responds differently to this treatment than Salmo-nella. In fact, we identified that E. coli could utilize carbon sources provided by lysed yeast, potentially providing protection to this pathogen in a nutrient-starved environment. Though further research
20 21
is needed to determine if this effect occurs in vivo, these data suggest caution should be exercised in providing citrus pulp to swine being fed diets supplemented with live yeast probiotics.
Keywords: citrus pulp, feed supplementation, probiotics
56 Prenatal Transportation and Immune Indices in Neonatal and Growing Brahman CalvesD. M. Price 1, 2,*, B. P. Littlejohn 1, 2, D. Neuendorff 2, A. W. Lewis 2, N. C. Burdick Sanchez 3, J. A. Carroll 3, R. C. Vann 4, S. D. Lawhon
5, T. H. Welsh, Jr. 1, R. D. Randel 2, 1Animal Science, Texas A&M University, College Station, 2Texas A&M Agrilife Research, Texas A&M University System, Overton, 3Livestock Issues Research Unit, USDA-ARS, Lubbock, 4MAFES-Brown Loam, Mississippi State Uni-versity, Raymond, 5Veterinary Pathobiology, Texas A&M University, College Station
The objective of this study was to investigate effects of prenatal transportation on immune indices in neonatal calves. Ninety-six pregnant Brahman cows matched by age and parity were separated into a transported group (TRANS, n = 48; transported for 2 h on ges-tational d 60, 80, 100, 120, and 140) and an untouched control group (CONT, n = 48). Blood samples were collected from the calves via jugular venipuncture within 24 h after birth, at d 14 and at d 28 of age for complete blood count (CBC). Samples were collected in EDTA vacutainers and processed within 10 min of collection using the IDEXX Procyte Dx Hematolyzer Analyzer. Data were analyzed with GLM procedures specific for repeated measures in SAS. Pre-natal TRANS did not affect WBC, basophil, eosinophil, monocyte, lymphocyte, or neutrophil cell count, (P > 0.05). Age of calf was sig-nificant for all cell types, except eosinophils, (P < 0.10). Neutrophil cell count differed by sex, (P < 0.02). CONT females had neutrophil counts of 12.1 ± 0.9, 5.7 ± 0.4, and 7.5 ± 0.8 K/µL while TRANS females had 10.1 ± 0.8, 5.8 ± 0.3, and 5.3 ± 0.7 K/µL, at 24 h, d 14, and d 28 respectively. CONT males had neutrophil counts of 8.0 ± 0.7, 5.4 ± 0.3, 5.6 ± 0.7 K/µL, and TRANS males had counts of 10.2 ± 0.9, 5.3 ± 0.4, 5.2 ± 0.8 K/µL at 24 h, d 14, and d 28 respectively. Basophil cell count differed by sex (P < 0.01). CONT female baso-phil counts were 0.02 ± 0.004, 0.01 ± 0.003, and 0.02 ± 0.004 K/µL, and TRANS female counts were 0.02 ± 0.004, 0.01 ± 0.003, and 0.01 ± 0.003 K/µL at 24 h, d 14, and d 28, respectively. CONT male basophil counts were 0.01 ± 0.003, 0.01 ± 0.003, and 0.01 ± 0.003 K/µL with TRANS male counts of 0.02 ± 0.004, 0.01 ± 0.003, 0.01 ± 0.003 K/µL at 24 h, d 14, and d 28, respectively. Trends for treat-ment by sex interactions for neutrophil (P < 0.10), and basophil (P < 0.10) cell count were observed. Neutrophil and basophil cell count were consistently numerically greater in CONT females than CONT males indicative of sexual dimorphism in immune indices as early as 24 h of age in Brahman cattle. Sexual dimorphism in immune function likely also exists in these calves and should be investigated.
Keywords: Neonatal, Neutrophils, Transportation
57 Changes in Immune Indices in Response to Primary Vac-cination in Weaned Brahman Calves Exposed to Prenatal Trans-portationN. C. Burdick Sanchez 1,*, D. M. Price 2, J. A. Carroll 1, B. P. Little-john 2, D. A. Neuendorff 2, A. W. Lewis 2, R. C. Vann 3, S. D. Lawhon
4, T. H. Welsh, Jr. 4, R. D. Randel 2, 1Livestock Issues Research Unit, USDA-ARS, Lubbock, 2Texas A&M AgriLife Research, Texas A&M
University, Overton, 3MAFES-Brown Loam, Mississippi State Uni-versity, Raymond, 4Texas A&M AgriLife Research, Texas A&M Uni-versity, College Station
This study was designed to determine if prenatal transportation influ-enced immune indices in response to vaccination at weaning. Forty-two pregnant Brahman cows matched by age and parity were sepa-rated into a transported group (TRANS, n = 20; transported for 2 h on gestational d 60, 80, 100, 120, and 140) and an untouched control group (CONT, n = 22). Blood samples for complete blood cell count (CBC) were collected from the calves via jugular venipuncture into vacutainers containing EDTA at d 0, 2, 6, and 9 relative to primary vaccination at weaning (i.e, 176 ± 2 d of age). Samples were pro-cessed within 30 min after collection using the IDEXX Procyte Dx Hematology Analyzer. Data were analyzed using the Mixed proce-dure of SAS specific for repeated measures, with treatment (CONT vs TRANS), sex, day, and their interactions included as fixed effects, calf temperament included as a covariate, and calf within treatment as the subject. Temperament accounted for a significant amount of variation in total white blood cell (WBC), lymphocyte, and neutro-phil counts (P<0.01). All blood cell counts changed over d (P<0.01). There was a tendency (P<0.07) for a treatment by sex interaction for total WBC such that the average WBC count was greater in CONT bulls (12.3±0.5 K/μL) than CONT heifers (10.8±0.4 K/μL), but no difference was observed between TRANS bulls (11.5±0.5 K/μL) and TRANS heifers (11.8±0.5 K/μL). A similar tendency (P<0.07) was observed in neutrophil counts between CONT bulls (3.9±0.2, K/μL) and heifers (3.2±0.2 K/μL) and TRANS bulls (3.4±0.2 K/μL) and heifers (3.5±0.2 K/μL). There was an effect of sex on eosinophils counts such that heifers (0.25±0.02 K/μL) had greater average eo-sinophil counts than bulls (0.17±0.03 K/μL; P=0.02). Additionally, there was a trend for CONT calves (0.0071±0.0009 K/μL) to have a greater average basophil count than TRANS calves (0.0048±0.0010 K/μL; P=0.10). These data suggest that weaning and vaccination, calf sex, and prenatal transportation may influence CBC in weaned calves. This is one of the first studies to report changes in CBC in prenatally-stressed calves post-vaccination.
Keywords: cattle, immune, Transportation
58 Circulating Concentrations of NEFA as Mediators of the Innate Immune Response in CattleN. C. Burdick Sanchez 1,*, J. A. Carroll 1, J. R. Donaldson 2, J. O. Buntyn 3, T. B. Schmidt 4
1Livestock Issues Research Unit, USDA-ARS, Lubbock, 2Depart-ment of Biological Sciences, 3Department of Animal and Dairy Sci-ences, Mississippi State University, Mississippi State, 4Department of Animal Science, University of Nebraska, Lincoln
We previously reported that temperamental cattle have greater NEFA concentrations and an altered innate immune response compared to calm cattle. This trial was designed to determine if increasing energy availability via a lipid infusion or bolus dextrose injection would al-ter the innate immune response to a lipopolysaccharide (LPS; 0.5 µg/kg BW) challenge. Holstein steers (n = 21; 165 ± 5 kg BW) were ran-domly assigned to 1 of 3 groups: saline at 0.5 mL/kg BW (CON; n = 7), 50% dextrose (0.5 mL/kg BW; DX, n = 7) administered immedi-ately prior to LPS to mimic peak LPS-induced glucose observed in calm cattle, or continuous lipid emulsion infusion (Intralipid 20%; 0.5 mL/kg/h; LIP; n = 7) via a jugular cannula from -1 to 6h post-LPS. On d-1, steers were fitted with jugular cannulas and indwelling
22
extension i
rectal temperature (RT) probes and placed into tie stalls. On d0 blood samples were collected every 0.5h from -3h and continuing until 8h post-LPS. Serum was analyzed for cortisol, interferon-γ (IFNγ), IL6, NEFA, and glucose. Infusion of LIP prior to LPS administration (-1 to 0h) resulted in a time x treatment interaction for NEFA (P < 0.01) and a tendency for cortisol (P = 0.06) such that NEFA and cortisol were greater in LIP than CON and DX steers. All response measures increased following LPS challenge (P < 0.01). Post-LPS administra-tion there was a time x treatment interaction for NEFA (P < 0.01) and cortisol (P < 0.01) such that NEFA remained greater while cortisol was decreased in LIP compared to CON and DX steers. Glucose was decreased in CON than LIP and DX steers (P = 0.04) post-LPS, while the change in RT relative to baseline was less in DX than CON and LIP steers (P < 0.01). Concentrations of IL6 and the change in IFNγ relative to baseline were less in LIP than CON and DX steers (P < 0.01), with DX having lower IL6 than CON steers (P < 0.01). To our knowledge, these are the first data to suggest that increas-ing circulating NEFA concentrations may modulate the innate im-mune response in cattle, and that the greater NEFA concentrations observed in temperamental cattle may be responsible for the altered innate immune response reported in these cattle following a LPS challenge.
Keywords: cattle, immunity, NEFA
59 National Pork Board Swine Industry Award for Innova-tion: Novel Use of Lipid-Producing Bacteria to Increase Circu-lating Triglycerides in SwineJ. R. Donaldson 1,*, J. A. Carroll 2, T. B. Schmidt 3, T. R. Callaway 4, J. Grissett 1, N. C. Burdick Sanchez 2, 1Biological Sciences, Mississippi State University, Mississippi State, 2Livestock Issues Research Unit, USDA-ARS, Lubbock, 3Animal Sciences, University of Nebraska, Lincoln, 4Food and Feed Safety Research Unit, USDA-ARS, College Station
Weanling pigs are at a high risk of succumbing to illness primar-ily due to an insufficient supply of available energy and therefore a weakened immune system. Solutions have been investigated to sup-plement feed with alternate energy sources, yet limitations still arise with the utilization of these sources by pigs due to their relatively im-mature gastrointestinal (GI) systems. The objective of this study was to evaluate whether providing bacteria that produce triglycerides (TAGs), such as the bacterium Rhodococcus opacus, to swine could increase the concentrations of circulating TAGs and thus available energy. Thirty-six weaned pigs (30 d of age) housed in individual pens were allowed 2-wks for acclimation prior to being randomly assigned to 1 of 3 treatment groups (n = 12/group) stratified by BW. Treatments consisted of daily oral supplementation for 5 d with: 1) R. opacus (Ro; 1x10¹⁰ CFU); 2) an alternate form of Ro (JD103; 1x10¹⁰ CFU) that secretes TAGs into the surrounding environment; or 3) an equivalent volume of PBS. Serum samples were collected every 6 h for 96 h and analyzed for NEFA, TAGs, free glycerol, and glucose concentrations. Fecal samples were collected daily to assess shedding of Ro or JD103 by viable plate counts. At the conclusion of the trial, GI contents were collected and analyzed for coloniza-tion patterns of Ro or JD103. Circulating TAGs increased by 84 h in pigs supplemented with either Ro (P = 0.04) or JD103 (P = 0.01) in comparison to PBS controls. Both Ro and JD103 were present in the GI tract with minimal shedding observed, suggesting that both forms of R. opacus are capable of colonizing within the GI tract. These data indicate that lipid-producing bacteria can be used to provide an available source of utilizable lipids to weanling pigs and could po-tentially decrease detrimental effects associated with illness and re-duced feed intake during this transitional period. Further research is needed to determine whether this correlates with improved immune function in the presence of pathogens. This is the first data to demon-strate the potential use of a non-pathogenic bacterium to improve the health, well-being and overall productivity of swine.
Keywords: Energy source, Lipids, Weanling pigs
60 Efficacy of Concurrent Use of Fenbendazole and Ivermec-tin versus Ivermectin Alone on Parasite Egg Count and Perfor-mance of Beef SteersR. S. Wells *, R. Reuter, Agriculture, Noble Foundation, Ardmore, OK
A total of 498 steers (209 ± 21 kg) sourced from livestock markets in Oklahoma and Texas were utilized in a study to compare com-monly used anthelmintics on 14-d fecal egg count reduction (FECR) and 42-d ADG. Upon arrival, steers were commingled in one trap and fed ad libitum rye hay until commencement of the study. Steers were then randomly assigned to one of three treatments: no anthel-mintic (CTRL), injectable ivermectin (IVER; Ivomec 1%), or IVER with concurrent fenbendazole drench (IV+SG; SafeGuard), and all administered per label directions. Treatments were administered at the initiation of the study, and steers were weighed, vaccinated, and
sorted by treatment to one of 10 2.4-ha grass traps. Traps contained 49 or 50 steers each (4, 4 and 2 traps for the IV+SG, IVER, CTRL treatments, respectively). Traps were fed ad libitum grass hay and 2.3 kg·hd-1·d-1 of a commercial supplement containing decoquinate for 42 d. Fecal samples were collected from all steers per rectum on d 1 and 14. Fecal samples were sent to a blinded commercial labora-tory where eggs were counted. Pen FECR was calculated with pen mean egg counts as (d 1 – d 14) / d 1. Analysis of variance was used to analyze the data with pen as the experimental unit. No difference was observed for d-1 fecal egg counts (68, 78, and 65 eggs/g for CTRL, IV+SG, and IVER treatments, respectively; P = 0.54). An-thelmintic affected 14-d FECR (9%, 99% and 36%, respectively for CTRL, IV+SG and IVER treatments; P ≤ 0.02). Forty-two d ADG was not different among anthelmintic treatments (0.68, 0.85, 0.82 kg/d, respectively for CTRL, IV+SG, and IVER, P = 0.26). Further, using the 431 animals in which all fecal egg count and BW data were
22 23
available, 14-d FECR and 42-d ADG were correlated at r = 0.177 (P < 0.002). Fecal egg count at d 1 was not correlated with ADG (r = -0.08, P = 0.08, n = 467), however d-14 fecal egg count was cor-related with ADG (r = -0.176, P < 0.001, n = 468). Ivermectin alone was not able to maximize 14-d FECR, however IV+SG was 99% effective, P≤ 0.02. Additional data is needed to determine how fecal egg count affects ADG of stocker steers.
Disclosure of Interest: R. Wells: Funding provided by Merck Ani-mal Health, R. Reuter: None Declared
Keywords: anthelmintic, fecal egg count, stocker cattle
61 Effect of Injection Site Protocol on Efficacy of a Modified-Live Virus Respiratory Vaccine and Injectable Anthelmintic Ad-ministered to Beef CattleJ. G. Powell 1,*, J. T. Richeson 2, E. B. Kegley 1, J. L. Reynolds 1, J. A. Hornsby 1, 1Department of Animal Science, University of Arkansas, Fayetteville, 2Department of Agricultural Sciences, West Texas A& M University, Canyon
Beef quality assurance program guidelines recommend injectable products be administered subcutaneously at least 1 hand-width apart to mitigate lesions that could cause carcass defects; however, little is known about the impact of injection site protocol on the efficacy of injectable products. Crossbred bull and steer calves (n = 84, initial BW = 256 kg) were procured from regional auction markets. On arrival (d -1) cattle were weighed, identified with an eartag, gender determined, and ear notched for PI-BVDV testing. Cattle were strati-fied by gender and d -1 BW and allocated randomly to pen (n = 8) then pens were allocated to treatment. On d 0, cattle were weighed, administered antibiotic metaphylaxis postscapula in the lower girth region, and bulls surgically castrated. Then 4 experimental treat-ments were applied: 1) 5-way modified-live virus (MLV) respiratory vaccine and injectable anthelmintic administered on opposite sides of neck, 2) MLV respiratory vaccine and injectable anthelmintic ad-ministered on the same side of neck but at least 12 cm apart, 3) MLV respiratory vaccine and injectable anthelmintic administered on same side on neck and in the same location, and 4) negative control (no MLV vaccine or anthelmintic). After processing, calves were housed in 0.45 ha grass pens and fed an identical receiving supple-ment (2.7 kg) with ad libitum access to bermudagrass hay for 42 d. There was no effect of treatment on ADG (P = 0.16), or serum anti-body titers to BVDV on d 0, 14, 28, or 42 (treatment, P = 0.87; treat-ment × day, P = 0.20). Negative-control cattle had greater (treatment × day, P < 0.0001) fecal egg counts on d 14 and 28 than did cattle on other treatments, which did not differ. The efficacy of a MLV respiratory vaccine and injectable anthelmintic were not affected by injection site location protocol.
Keywords: Beef Cattle, Injection site, Vaccine efficacy
62 Characteristics of Drought Stressed Corn SilageJ. Lehmkuhler 1,*, W. Burris 1, C. Lee 2, 1Animal and Food Sciences, 2Plant and Soil Sciences, University of Kentucky, Lexington
Extreme heat combined with low levels of precipitation negatively impacted the corn growing regions of the state. Hay yields were also negatively impacted during this time leading to concerns of hay shortages similar to previous drought years. Producers that opted to
salvage the crop for livestock feed by harvesting it for silage were re-porting challenges with equipment. The question posed was whether barren corn had elevated sugar content as it was not translocated to the ear for starch production. In an effort to answer this question 7 non-irrigated (NI) and 3 irrigated (IR) fields were selected for sam-pling. From each field, six random corn stalks were harvested and assessed for sugar content using a digital refractometer. The brix level was recorded for each corn stalk as was the height post-cutting. Individual corn stalks were then processed using a wood chipper. Approximately 100 gm subsample was collected, sealed using a food vacuum sealer, and allowed to ferment for approximately six weeks. Three random silage samples from each field were then processed for proximate analysis and fermentation characteristics. The mean brix reading for irrigated and non-irrigated samples was 10.5 and 9.8, respectively. The mean post-cutting height in inches measured 94 and 79 for irrigated and non-irrigated stalks. Silage samples were found to be similar with mean percent dry matter being 20.9 vs. 19.6, crude protein 11.9 vs. 10.8, acid detergent fiber 48.7 vs. 32.0, and nitrate level being 1,036 vs. 1,367 for NI and IR, respectively. Fer-mentation characteristics differed slightly for some variables with mean values for pH, total acid, lactic acid and acetate being 4.0 vs. 3.9, 10.6 vs. 8.2, 7.5 vs. 5.6, and 3.0 vs. 2.5 for NI and IR, respec-tively. Based on these samples, we concluded that it was not likely the sugar content that was problematic with the mechanical harvest-ing equipment, but rather the excessive moisture in the corn plant.
Keywords: corn silage, drought, extension
63 Southern Carcass Improvement ProjectT. Brink 1,*, M. Gardiner 2, L. Corah 3, 1President, J&F Oklahoma Holdings, Inc., Greeley, OK, 2Owner, Gardiner Angus Ranch, Ash-land, KS, 3Animal Science, Kansas State University, Manhattan
The objective of this field study was to determine the impact one mating of high carcass value Angus sires could have on the carcass quality and carcass value of progeny from cows representing the southern U.S. environment. Twelve southern bred dams (¼-½-blood visual Bos indicus influence) were purchased in 2009 to serve as em-bryo producing dams. These dams produced 112 progeny (59 Angus sired and 53 by southern bulls) that were fed at a commercial Kansas feedlot in spring-summer and harvested in 2011 and 2012. Semen from three Angus bulls, selected by carcass merit, and eight southern sire breeds, randomly slected on available semen (one sire each from Beef Master, Red Brangus, Santa Gertrudis, Simbrah, Charbray, Brahman, Senepol and Braford), were used to fertilize embryos. All semen originated from bulls available in commercial AI com-panies or individual seedstock breeders. Recipient dams receiving embryos were all of common genetics. All resulting progeny were managed within the same environment from birth to harvest. Post weaning calves grazed wheat pasture before being placed in feedlot. Calves were harvested at 735 days of age (year 1) and 752 days of age (year 2). Complete carcass data was gathered at harvest. An-gus sired calves had a 5 day shorter gestation length (P<.01), 3.9 kg lighter birth weight (P<.01), similar weaning weight and were 29.1 kg heavier as yearlings. Carcasses resulting from Angus sired mat-ings had an increased marbling score of 78 points (P<.01), carcass weights were 21.4 kg heavier (P<.01) and had .25 cm more fat thick-ness (P<.01) with no significant yield grade difference. Seventy-seven percent of Angus-sired carcasses graded Choice compared to 25% of the carcasses from southern sires. Grid premium advantage was $56.99 per head for Angus-sired calves and a $73 per animal net
24
economic advantage was observed when carcass weight, net carcass price and feed costs were combined ($117 carcass value advantage minus $44 added feed costs). Using one cross of high carcass value Angus genetics significantly increased carcass quality, resulting in an increased net economic advantage.
Keywords: Angus, Brahman influenced dam, Quality Grade
64 Population and Price Differences for Sale Barn Marketed Calves in 2000, 2005 and 2010 Due to Genetically Influenced Phenotype.M. S. Gadberry *, T. R. Troxel, Animal Science, University of Arkan-sas, Little Rock
This study examined phenotypic influence, associated with genetics, on calf selling price discounts and premiums in 2000 (00), 2005 (05), and 2010 (10), a period when the USA calf crop declined 293,000 calves per yr. Data was collected at 10, weekly sale barn locations in Arkansas. The mean (SD) selling price was $93.94 ($12.80), $117.00 ($13.41), and $109.12 ($13.42) for 00, 05, and 10. Genetically in-fluenced characteristics included gender, horn status, USDA muscle score, USDA frame score, color, and apparent breed composition. The price received ($/45.45 kg) was standardized within year (mean = 0). Data were analyzed for population changes by chi-square anal-ysis and a generalized linear model was used to estimate the stan-dardized price response to yr and calf characteristic. The maximum sample size was 137,894 (62,058; 43,286; and 32,550 for 00, 05, and 10). Steers and bulls received the greatest premium in 10 ($8.21 and $1.38) and heifers the greatest discount in 10 (-$5.79, P < 0.01). The percentage horned declined yr-over-yr (P < 0.001) and the discount for horned calves was greatest in 10 (-$4.25, P < 0.01). Muscle score 1 and 2 values were greatest in 05 ($2.75 and -$5.40), intermediate in 10 ($2.21 and -$5.91), and least in 00 ($0.51 and -$8.49, P < 0.01). The percentage large-frame calves was greatest in 05 (66%), inter-mediate in 10 (60%), and least in 00 (56%, P < 0.001). The premium for large-frame calves was greatest in 10 ($0.74), and the premium for medium-frame calves was greatest in 05 ($1.32). The percentage straight Angus calves increased 160% and the percentage solid black calves increased 69% for yr 10 compared to 00 (P < 0.001). The percentage red and red, white-face calves decreased for yr 10 com-pared to 00 (P < 0.001). The premium for black and black, white-face did not differ between 05 and 10 but was greater than 00 (P < 0.01). Spotted and striped calves received the greatest discount in 10 (-$14.58, P < 0.01). The results indicate discounts do not decrease among all genetically selectable calf phenotypic traits, even when calf supplies are declining.
Keywords: Calf, Genetics, Sale barn price
65 Population and Price Differences for Sale Barn Marketed Calves in 2000, 2005 and 2010 Due to Management Influenced Phenotype.M. S. Gadberry, T. R. Troxel *, Animal Science, University of Arkan-sas, Little Rock
This study examined phenotypic influence, associated with manage-ment, on calf selling price discounts and premiums in 2000 (00), 2005 (05), and 2010 (10), a period when the USA calf crop declined 293,000 calves per yr. Data was collected at 10, weekly sale barn locations in Arkansas. The mean (SD) selling price was $93.94
($12.80), $117.00 ($13.41), and $109.12 ($13.42) for 00, 05, and 10. Management influenced characteristics included selling in groups, fill, condition, and health. The price received ($/45.45 kg) was stan-dardized within year (mean = 0). Data were analyzed for population changes by chi-square analysis and a generalized linear model was used to estimate the standardized price response to yr and calf char-acteristic. The maximum individual calf sample size was 137,894 (62,058; 43,286; and 32,550 for 00, 05, and 10). The proportion of calves sold as singles decreased from 82.4% (00) to 74.8% (10; P < 0.001). The premium for calves sold in groups was similar in 05 and 10 but both were greater than 00 (P < 0.01). The discount for calves sold as singles was greater in 00 (-$0.86) compared to 10 (-$0.42, P < 0.01). The discount for full and tanked calves was similar in 05 and 10 but greater than the discount in 00 (P < 0.01). Calves in very thin condition were discounted the greatest (-$8.66) in 10, and fleshy calves were discounted the greatest in 05 (-$5.78, P < 0.01). The discount for fat calves did not differ between 05 (-$17.87) and 10 (-$12.38) but both were greater than the discount of 00 (-$5.67, P < 0.01). Most calves were identified as healthy among yrs (>95%). The discount for sick calves did not differ (P > 0.1) among yrs. Calves exhibiting dead hair coat or stale appearance were discounted similarly in 05 and 10 which were greater than those of 00 (P < 0.001). Preconditioned cattle received a greater premium in 10 ($6.84) compared to 05 ($4.68, P < 0.01). The results indicate buyers discounted undesirable management characteristics and were willing to spend more for preconditioned cattle during a period of declining calf supplies.
Keywords: Calf, Management, Sale barn price
66 The Southeast Cattle Advisor: An Integrated Educational ProgramL. Stewart 1,*, R. C. Lacy 2, J. W. Prevatt 3, G. C. Lamb 4, D. E. Mayo 5, B. Beer 6, 1Animal and Dairy Science, the University of Georgia, Ath-ens, 2Agricultural and Applied Economics, The University of Geor-gia, Tifton, 3Agricultural Economics and Rural Sociology, Auburn University, Auburn, AL, 4Animal Sciences, 5Jackson County Exten-sion, University of Florida, Marianna, 6Clemson University Exten-sion, Clemson University, Lancaster, SC
The Southeast Cattle Advisor is an integrated educational program that utilizes distance technology and regional experts to deliver live-stock risk management education via regional and local meetings to help beef cattle producers more effectively manage risks. The proj-ect was a collaborative effort between the Extension services of the University of Florida, Clemson University, Auburn University, and the University of Georgia. Regional workshops were organized and conducted during March-May of 2010 to teach participants how to calculate breakeven prices, provide market outlook, assess market price potential, and provide practical management information on how small and medium-sized cattle producers can profitably diver-sify their beef production system. A web conferencing system al-lowed the program to be offered live, at six satellite locations, or as single person viewers in multiple states. Additionally, a regional beef cattle risk management website and newsletter were developed (SECattleAdvisor.com) to distribute information and decision aids. The website featured livestock market information/analysis/strate-gies; presentations, educational modules, and printed materials from regional workshops; the newsletter; and links to university websites. From December 2010 to December 2011, the website averaged 251
24 25
visits per day and a total of 58,635 unique viewers. The newsletter was written by Extension specialists and county agents within the project area and included a blend of current economic and production information. The newsletter was printed for distribution at meetings and made available on the website. Follow-up meetings were held in each state to extend the educational programs and promote the use of the website. The Southeast Cattle Advisor has proved to be an effective integrated educational program to disseminate information. In the future, the program will build on the current format to employ more technologies to help beef cattle producers.
Keywords: beef cattle, educational program, website
67 The Kentucky Beef Leadership Program: Empowering In-dustry Leaders to Shape Educational ProgrammingL. Anderson 1,*, K. D. Bullock 1, J. W. Lehmkuhler 1, W. R. Burris 2, 1Animal & Food Science, University of Kentucky, Lexington, 2Ani-mal & Food Science, University of Kentucky, Princeton
The University of Kentucky Beef IRM team investigated the effec-tiveness of conducting a beef leadership conference on development of new state extension programming. Agricultural agents from 24 counties were asked to invite two cattlemen that were leaders in their local extension programming. These agents, their leaders, and the UK Beef IRM team were joined by 10 leaders from the Kentucky Cattlemen’s Association, Kentucky Farm Bureau, and agribusiness (n = 110 total) on a three-day conference to redefine beef extension programming in Kentucky. Leaders were divided into small groups (8-10) and were asked to determine the 5 most limiting factors to beef production in Kentucky. Each of these small groups reported to the large group and all factors were listed. Leaders were then asked to rate their top three issues and the ratings were tallied. The top five issues identified were 1) education of the general public on agricul-ture, 2) advancing age of cattlemen, 3) competition for land and effi-cient use of land resources, 4) improved marketing opportunities and more efficient beef production, 5) dealing with animal rights/animal welfare issues. Once identified, producers were broken into small groups again to discuss methods to overcome these issues and each group presented their ideas to the entire group. The leaders were then dismissed into their county groups to discuss potential new county extension programs. Likewise, the UK Beef IRM team met with industry leaders to develop new state beef extension program-ming. The new state programs develop include the Kentucky Profes-sional Cattlemen’s Program, the Certified Cattle Handling and Care Program, the Kentucky Young Producers Program, Master Marketer, Graze 300, and the Kentucky Beef Cow-Calf Conference: Focus on Efficiency. These new programs are proactive and identify many of the main issues also recently identified by the NCBA as important
issues in the beef industry. Thus, we conclude that conducting a beef leadership program is an effective method to develop new extension programming that directly reflects the needs of the beef industry.
Keywords: beef, extension
68 Deep South Stocker Conference: Multi-State Extension Programming for Stocker Cattle Operators Across the Southeast B. B. Karisch 1,*, L. L. Jury 1, J. A. Parish 1, R. L. Stewart 2, D. Rankins, Jr 3, 1Animal and Dairy Science Department, Mississippi State Uni-versity, Mississippi State, 2Animal Science, University of Georgia, Athens, 3Animal Science, Auburn University, Auburn, AL
The fourth annual “Deep South Stocker Conference” was held in Meridian, MS in August 2012. The objective of this conference was to bring together and educate stocker producers from several states on topics ranging from forage systems to economics. This confer-ence is a joint effort among the Mississippi State University Ex-tension Service, Alabama Cooperative Extension System, and the University of Georgia Cooperative Extension Service. It is held in each cooperating state on a triennial rotation. This year’s confer-ence was well attended by producers, extension agents, and industry professionals from MS, AL, GA, FL, and TX. Participants could at-tend educational seminars, a tradeshow, as well as a tour of a local order buyer’s processing facility. As participants arrived, they had the opportunity to visit with 22 trade show exhibitors, whose prod-ucts represented many segments of beef industry. These trade show exhibitors and conference partners covered industry segments from animal health to nutrition to seed and weed control. The educational program topics included forage production systems for southeastern stocker producers, use of by-product feeds for stocker production, strategic parasite control for stocker cattle, health management strat-egies for high-risk calves, and an economic analysis of Mississippi Feeder Calf Board Sales. The conference was well received by par-ticipants with an overall rating of 4.45 on a Likert-type scale, where 1= poor and 5 = excellent. of the educational topics included in the program, participants rated the talk on health management with high-est score at 4.69, followed closely by forage production systems at 4.66. This rating along with comments on future topics indicated that producers would like to learn more about health and diseases, as well as forage production and management. The evaluation also indicated that 98% of respondents thought the information presented would be useful in their operation, with the remaining 2% indicating the infor-mation would maybe be useful. General comments indicated that the information presented was highly relevant and useful to producers.
Keywords: beef cattle, Extension, stocker cattle

26
Small ruminant Production
69 Parasite Management Practices and Anthelmintic Resis-tance in Alpaca Herds in the Mid-Atlantic Region - A SurveyS. Wildeus 1,*, A. Zajac 2, 1Agricultural Research Sation, Virginia State University, Petersburg, 2Department of Biomedical Sciences & Pathobiology, Virginia-Maryland Regional College of Veterinary Medicine, Blacksburg
An on-farm survey was conducted in the mid-Atlantic region to document deworming practices and evidence of anthelmintic resis-tance in alpaca herds. Surveys were completed in late spring and summer of 2010 and 2011 on 24 farms. The survey identified herd health management and current deworming practices. Fecal samples were collected from a minimum of 8 and maximum of 39 alpacas on each farm. Fecal egg count reduction tests were conducted when 8 or more alpacas on a farm had strongylid eggs counts >10 eggs/g to determine the presence of dewormer resistance. Fifty-eight per-cent of breeders considered gastrointestinal parasitism of moderate concern, while 21% considered it a severe problem. Eighty-three percent of breeders knew or heard of somebody losing an animal to parasitism. Breeders judged the impact of parasitism on their own farm over time as follows: less severe 29%, the same 50%, or more severe 21%. All farms had done some form of fecal testing. For-ty-six percent of farms dewormed alpacas routinely when entering the farm. Seventy-five percent of farms routinely dewormed their herd, while 25% used on-demand deworming. The most common primary anthelmintics were ivermectin-based (83%), and were used since the establishment of each farm. Routine deworming intervals ranged from 4 to 6 weeks. Deworming schedules were described as preset on 25% and as needed on another 25% farms, while 50% used a combination of both. Dewormer use was discontinued on 14% of farms (all located in the western part of the region). Fecal egg count reduction tests were conducted at 16 locations that satisfied mini-mum sampling requirements, and ivermectin (9 farms), fenbenda-zole (5), albendazole (1) and a combination of ivermectin and fen-bendazole (1) was tested. In all cases reduction of initial egg counts were less than 90%. Survey results indicate a widespread presence of anthelmintic resistance to marcocyclic lactones in strongylid para-sites in mid-Atlantic alpaca herds. Together with indications of al-pacas dying from haemonchosus, there may be a need to re-evaluate deworming practices for alpacas.
Keywords: Alpacas, Anthelmintic resistance, Parasites
70 Gastro-Intestinal Parasitic Infestation in Bucks on Perfor-mance Test and its Relationships with Production Traits.K. Nadarajah 1,*, S. Schoenian 2, M. Penick 3, D. L. Kuhlers 1, 1Animal Sciences, Auburn University, Auburn, 2Extension Office, University of Maryland, Keedysville, 3Livestock Division, Kerr Center, Poteau
Understanding the animal variation for resistance to gastro-intestinal parasitic (GIP) infestation and its relationships with animal perfor-mance should benefit meat goat industry. Objective was to study ani-mal variation for GIP infestation and its effect on performance data of 370 bucks tested over 3 yrs at Western Maryland (WM, n=212) and Kerr Center, Oklahoma (KC, n=158), respectively. Data were analyzed within-location for fecal egg counts (FEC), FAMACHA
scores (FAM), body condition scores (BCS) and growth performance of bucks. Means, variance and correlations among bucks for initial entry weight (IE_WT), fecal egg counts (IE_FEC), FAMACHA score (IE_FAM) and body condition score (IE_BCS), and similarly, for end-of test weight (ET_WT), fecal egg counts (ET_FEC), FAM-ACHA score (ET_FAM), body condition score (ET_BCS) and ADG were estimated using SAS for data pooled over years. Distributions of FEC at IE and ET were not normal, thus log transformed values were obtained. Test at WM showed following means among bucks: for IE_WT 20.1 ± 4.2 kg, for IE_FEC 857 ± 1342, for IE_FAM 1.9 ± 0.86, for LogIE_FEC 5.3 ± 2.0 and for IE_BCS 2.5 ± 0.4. Phenotypic correlations between IE_WT with IE_FAM was -0.21(P < 0.01) and with IE_BCS 0.58 (P < 0.001). Correlation between IE_FAM with IE_FEC was 0.08 and with IE_BCS was -0.39 (P < 0.001). Correla-tions between ET_WT with ET_FAM was -0.22 (P < 0.01), with ET_BCS = 0.46 (P < 0.001) and with ADG 0.36 (P < 0.001). Linear regression of IE_WT on IE_FAM was -1.038 (P < 0.01). Regres-sion on ET_WT on ET_FAM was -1.116 (P < 0.01) and on ET_FEC was negative, but non-significant. Results at KC test showed fol-lowing means among bucks: for IE_WT 23.7 ± 3.8 kg, for IE_FEC 869 ± 1531, for IE_FAM 2.4 ± 0.68 and for LogIE_FEC 5.7 ± 1.7. Phenotypic correlations between IE_WT with IE_FAM was -0.43(P <0.001). Correlation between ET_WT with ET_FEC was -0.37(P <0.001), and with ADG was 0.79 (P < 0.001). Correlation between ET_FAM and ET_FEC was 0.27(P <0.001). Regression of ET_WT on ET_FEC was -0.002 (P <0.001). Knowledge of GIP infestation and its effects on animal performance may help to select animals to benefit the meat goat industry.
Keywords: Gastro-intestinal Parasites, Goats, Growth Performance
71 Sericea Lespedeza Alters Trace Mineral Status of Lambs and Haemonchus ContortusJ. Burke 1,*, J. Miller 2, T. Terrill 3, M. Acharya 4, S. Orlik 2, J. Garza 2, 1USDA, ARS, Booneville, 2School of Veterinary Medicine, LSU, Ba-ton Rouge, 3Agricultural Research Station, FVSU, Fort Valley, GA, 4Animal Science, University of Arkansas, Fayetteville
Sericea lespedeza (SL) is a legume rich in condensed tannins used as an aid to control Haemonchus contortus infection in small rumi-nants. Long term grazing or feeding of SL leads to reduced weight gains. The objective was to determine the effects of SL on trace min-eral concentrations in serum, liver, and nematodes collected from the abomasum of lambs. Worm-free Katahdin ram lambs (38.5 ± 2.0 kg; 183 d of age) were inoculated with 5,000 L3 H. contortus 27 d before dietary treatments began (d 0). Lambs were fed 907 g of a control supplement (CO; 15.8% CP, 68% TDN) or SL pellets (15.4% CP, 66% TDN; Sims Bros. Inc.; n = 6/diet) and ad lib grass hay, trace mineralized salt and water for 42 d. Blood and feces were collected every 7 d to determine blood packed cell volume (PCV) and fecal egg counts (FEC), respectively. Lambs were humanely slaughtered on d 43 and abomasum and liver removed. Nematodes (500 mg) were removed from abomasum within 32 h and rinsed to remove feed. Serum, liver, and nematodes were analyzed for trace minerals us-ing inductively coupled plasma/mass spectroscopy (Michigan State University). Data were analyzed using GLM (minerals), repeated
26 27
measures (PCV, FEC), or PROC COR. As expected, SL reduced FEC (P = 0.02) and tended to increase PCV (P = 0.08). Serum con-centrations of cobalt were increased (P < 0.001) and molybdenum (P < 0.001), zinc (P = 0.004), and selenium (P < 0.001) were reduced by feeding SL. Cobalt (P = 0.09) and iron (P = 0.06) tended to increase and molybdenum (P = 0.05) and selenium (P < 0.001) were reduced in the liver of SL-fed lambs. Similarly, cobalt (P = 0.04) and iron (P = 0.004) increased in nematodes from SL-fed lambs, while molyb-denum was reduced (P < 0.001). There was a positive correlation between cobalt in the liver and nematodes (P = 0.05; R = 0.59), as well as molybdenum (P = 0.03; R = 0.64) and selenium (P = 0.04; R = 0.63). Condensed tannins in SL could be binding to molybdenum and selenium, reducing the availability to the animal and nematode. This suggests a mechanism of action for the negative effect of SL on H. contortus and could lead to lower weight gains.
Keywords: lambs, parasite control, sericea lespedeza
72 Sericea Lespedeza Affects Serum Concentrations of Trace Minerals in Small RuminantsJ. Burke 1,*, J. Miller 2, T. Terrill 3, S. Orlik 2, J. Garza 2, 1USDA, ARS, Booneville, AR, 2School of Veterinary Medicine, LSU, Baton Rouge, LA, 3Agricultural Research Station, FVSU, Fort Valley, GA
Sericea lespedeza (SL) has been used in recent years to aid in the control of gastrointestinal nematodes in sheep and goats by reduc-ing egg output. However, we have observed slower growth rates in lambs and kids when fed SL for more than 56 d. The objective was to determine the effects of feeding SL pellets for ≥56 d on ADG and serum concentrations of trace minerals in lambs and kids. Lambs (ARS, Katahdin; LSU, Suffolk x Gulf Coast Native) or kids (Spanish or Kiko) weaned between 56 and 108 d of age (d 0) were supple-mented with up to 907 g of a control supplement (CO) or SL pellets (Sims Bros. Inc.) for ≥56 d while grazing grass pastures with ad lib trace minerals offered (ARS: 2011 lambs, n = 20 CO, n = 19 SL; 2012 lambs, n = 25 CO, n = 25 SL; 2012 kids, n = 16 CO, n = 16 SL; LSU: 2011 lambs, n = 14 CO, n = 15 SL). Animals were weighed every 28 d and blood collected for serum concentrations of trace minerals between d 56 and 112. Serum was analyzed for trace min-erals using inductively coupled plasma/mass spectroscopy (Michi-gan State University). Data were analyzed using GLM. Between d 0 and 56, ADG was greater (P = 0.02) in SL than CO lambs at ARS in 2012, but lower in SL than CO kids (P = 0.02), tended to be lower in 2011 lambs (P = 0.06), and similar in LSU lambs. Between d 56 and 112, ADG was reduced in SL compared with CO-fed ARS lambs in 2011 (P = 0.02) and 2012 (P = 0.007), and kids (P = 0.02) between d 56 and 112, and similar between LSU groups. There were marked changes in trace minerals found in serum between diets among all studies. Molybdenum was always reduced in SL compared with CO-fed animals, with as much as a 90-fold reduction (P < 0.001 for all studies). Manganese and zinc were reduced in SL compared with CO-fed ARS lambs and kids (P < 0.01). Selenium was reduced in SL compared with CO-fed lambs and kids in 2012 and LSU lambs (P < 0.01). A reduction in trace mineral status could certainly influence growth of lambs and kids, possibly leading to other metabolic issues. Feeding SL for parasite control should be limited to approximately 8 wk during the greatest challenges.
Keywords: goats, lambs, parasite control
73 Evaluation of Producer Submitted Meat Goat Performance DataK. Andries *, Food and Animal Science, Kentucky State University, Frankfort
Meat goat production is continuing to grow in the US though there is limited information on average animal growth and performance. Most meat goat producers keep minimal or no performance data on their herds which limits the progress that can be achieved through se-lection for economically important traits. Several groups, including breed associations, have made attempts to implement and improve performance data collection with limited success. Several local and regional on-farm performance testing programs have been started with varied success. The Kentucky State University Goat Herd Im-provement program was started in 2005 and is continuing today to accumulate producer supplied production data on meat goats from birth through weaning. The program currently has 46 farms partici-pating in the program. The data set has 5,841 total kid data records submitted. The combined data set was evaluated, using SAS, to de-termine factors that impact kid performance from birth to weaning and estimate means from producer supplied data. Table 1 contains the means and SD for the data set for birth to weaning performance. Factors that impacted growth from birth to weaning included sex, type of birth and rearing, age of dam, herd, and year. Age at wean-ing impacted weight at weaning. Male kids were heavier at birth and weaning than female kids. Castrated male kids were similar in weight to non-castrated male kids at weaning. Kids born single were heavier at birth than other birth types. Kids that were born single but raised twin were similar in weight at weaning but single born and raised were heavier than other classifications. Age of dam has a quadratic effect on birth and weaning weight peaking around 6 years of age. Continued evaluation of this type of data set will lead to improved adjustment factors for goat performance data and establish bench marks for goat production that will benefit producers and researchers in the future.
Table 1. Means for growth traits in producer supplied meat goat data.
Variable N Mean SD
Age of Dam (yr) 2862 3.24 1.83Birth Wt (Kg) 5472 3.42 0.76Wean Age (d) 4691 90.22 19.25Wean weight (Kg) 4678 16.90 5.09ADG (kg/d) 4564 0.15 0.05Wt/d of age 4676 0.19 0.05
Keywords: Goat, Growth, Performance data
74 Summer Annual Grasses for Meat GoatsJ.-M. Luginbuhl *, J. P. Mueller, Crop Science, North Carolina State University, Raleigh
A 3-year (YR) grazing study was conducted to evaluate the perfor-mance of recently-weaned doe (Capra hircus) kids (1/2 Boer; ini-tial BW: 17 kg) control-grazed on pearlmillet (PM – Pennisetum americanum, var. Tifleaf II), soybean (SB – Glycine max, var. John-ston) and cowpea (CO – Vigna unguiculata, var. Pinkeye Purplehull BVR). The experimental area was divided into 9 plots of 0.07 ha each in a randomized complete block design with 3 field replications and treatment responses were analyzed by ANOVA and orthogonal
28
contrasts. Forage species were sod-drilled in May (kg/ha, corrected for germination: PM, 24; SB, 109; CO, 129) and PM was fertilized with ammonium nitrate (56 kg N/ha) 32 d after planting. Grazing started 37 to 56 d after planting. Kids (YR 1, 18; YR 2, 27; YR 3, 27) were placed into groups of animals with similar BW and ran-domly assigned to 1 of 9 plots. Plots were divided into 6 sections and goats were moved to a new section every 2 to 4 d. Additional goats were used as put-and-take animals to control forage growth. Goats had free access to a mineral mix and water. The CP values of for-age samples hand-plucked periodically from experimental pastures averaged 18.8, 30.4 and 25.0% for PM, SB and CO, respectively. Forage species had no effect on ADG between PM and the average of SB + CO (YR 1: 78, 114, 96 g/d; YR 2: 61, 70, 90 g/d; YR 3: 65, 71, 67 g/d for PM, SB and CO, respectively). Gain/ha did not differ between PM and the average of SB + CO in YR 1 (320, 326, 185 kg, respectively) but was greater for SB than CO (P < 0.01). In YR 2, gain/ha was greater for PM than the average of SB + CO (480, 266, 280 kg, respectively; P < 0.03), whereas in YR 3 gain/ha was similar for PM and the average of SB + CO (263, 267, 163 kg, respectively) but greater for SB than CO (P < 0.007). Total number of grazing days/ha averaged over 3 YR was greater for PM than the average of SB + CO (5355, 3486, 2452; P < 0.04) but similar between SB and CO. Results indicated that these forages are suitable for weaned kids during the summer months under controlled grazing management, but that responses can vary substantially between years.
Keywords: Goat, Grazing, Performance
75 Fatty Acid Profile and Lipid Oxidation of Meat Goat Fed Varying Levels of Pine BarkB. R. Min *, S. Solaiman, N. Gurung, E. Taha , Animal and Poultry Science, Tuskegee University, Tuskegee, AL
Fatty acids are the major component of lipids and affect meat quality. Twenty-two Kiko-cross meat goats (Capra hircus; 27.46 kg) were used to quantify lipid oxidation and fatty acid profile fed condensed tannins (CT)-containing pine bark (PB) diets for 83 d experimental period. Experimental treatments included: control diet – 0% PB and 30% wheat straw (WS; 0.17 % CT DM; n = 8); 15% PB and 15% WS (1.6% CT DM; n = 7) and 30% PB and 0% WS (3.2 % CT DM; n = 7) as fed. Freshly dried PB and WS were finely (1.5-3 mm) ground and incorporated in the grain mix portion of the diet to provide 0, 16, and 32 g CT/kg DM in 0, 15, and 30% PB diets. Goats were individ-ually housed indoors in pens (1.2 m2). After 83 d in the experiment, goats were slaughtered and fatty acid profile was determined. The Thiobarbituric Acid Reactive Substances (TBARS)-test was used to quantify the amount of malondialdehyde (MDA) in meat (expressed in ng of MDA/g meat). Data were analyzed by the Mixed model procedure of the SAS for completely randomized design. Linear and quadratic effects were determined utilizing poly-nominal orthogonal contrasts for equally spaced treatments. The TBARS increased from d 1 to d 5 of storage (P<0.001), but were not affected by PB diet. The most prominent saturated fatty acids (SFA; Linear P<0.01), polyun-saturated fatty acid (PUFA, Linear, P<0.008), and PUFA/SFA ratios (P<0.03) in subcutaneous muscle were increased (Linear, P<0.01) with increasing PB supplementation. Mono-unsaturated fatty acids (MUFA; (C 18:1) tended to be higher (P < 0.10) in PB as compared to control diet, which may promote direct and indirect chemical oxidation of meat from PB diet goats. In addition, both MUFA and PUFA composition of mesentric kidney fat (MKF) were linearly in-creased (Linear P < 0.01) with increasing PB supplementation. How-
ever, SFA and PUFA/SFA ratios in MKF were not affected by PB diet. These results indicate that goat received PB supplementation increased both SFA and unsaturated fatty acids, but produced car-casses with more MUFA and higher PUFA. In the present study, ratio of PUFA/SFA for PB diet were lower (P < 0.03) than control and PB diet goat had more desirable ratio for consumer health.
Keywords: condensed tannins; fatty acids; goats; pine bark
76 Corn Gluten Feed Supplementation Effects on Growth and Intake in Hair Sheep Lambs Fed Hay-Based DietsS. Wildeus 1,*, C. D. Teutsch 2, 1Agricultural Research Station, Vir-ginia State University, Petersburg, 2Southern Piedmont Agricultural Research and Extension Center, Virginia Tech, Blackstone
The experiment evaluated the effect of increasing levels corn gluten feed (CGF) inclusion as source of digestible fiber and energy for hair sheep lambs fed a hay-based diet. Thirty-six Barbados Black-belly and St. Croix ram lambs (6 mo of age; mean BW 27.0 kg; 18/breed) were allocated to 12 pens, and fed diets of orchard grass hay (15.1% CP; 43.1% ADF; 58% TDN) ad lib and pelleted CGF (21.3% CP; 19.5% ADF; 74.3% TDN) at either 0, 1, 2, or 3% BW (3 animals/pen; 3 pens/diet). Hay was chopped for feeding, and fed as a separate component from CGF. Hay was offered at 125% of previ-ous day’s consumption and refused hay recorded daily. There was complete consumption of corn gluten feed at the 1 and 2% inclusion levels, and sporadic refusal of CGF (up to 20% of amount offered) during the later stages of the trial at the 3% level. Animals were on trial for 56 d and BW was recorded in 14 d intervals (CGF levels were adjusted at time of weighing). Intake and feed efficiency was determined on a pen basis and growth on an animal basis. Daily gain increased linearly (P<0.01) from 60 to 152 g/d as CGF inclusion increased from 0 to 3%. There was a breed by diet interaction (P < 0.05) for ADG, with similar ADG between breeds at 0% CGF and higher ADG in St. Croix than Barbados Blackbelly. There was a pe-riod of reduced growth in all treatment groups between d 29 and 44 of the experiment for reasons not readily apparent that reduced over-all ADG by 25 to 35%. Dry matter hay intake (% BW) decreased linearly (P < 0.01) from 3.55 to 1.78%, whereas total DM intake increased from 3.55 to 4.48% as CGF inclusion increased from 0 to 3%. Feed efficiency (feed : gain) improved linearly (P < 0.01) from 17.6 to 9.5 as CGF inclusion increased from 0 to 3%. Data suggest that daily gain and feed efficiency improved with inclusion of CGF at 2 to 3% BW as a source of digestible fiber and energy in forage-based diets fed to hair sheep lambs.
Keywords: Corn gluten feed, Growth, Hair sheep
77 Residual Frying Oil Reduces Fiber Digestibility on Feedlot SheepF. B. O. Scarpino 1,*, J. M. B. Ezequiel 1, E. H. C. B. van Cleef 2, 1Animal Science, Sao Paulo State University, Jaboticabal, Brazil, 2Animal Science and Industry, Kansas State University, Manhattan
Costs of feeding can be one of the factors that limit the feedlot activ-ity in many counties around the world. The use of alternative feed ingredients aims to minimize production costs and maximize the production of animal products such as meat and milk. Crossbred non-castrated male lambs (n=24, initial body weigh 24.9 kg ± 2.4 kg), were used to evaluate the effects of lipid sources (soybean oil or
28 29
ruminant Animal Production ii
frying soybean oil) on digestibility of dry matter, neutral and acid de-tergent fibers, ether extract and crude protein of finishing lamb diets. The animals were distributed in a randomized block design and as-signed to one of three isocaloric (2.6 Mcal ME/kg MS) and isoproteic (18.5% CP MS) diets which were formulated in forage:concentrate ratio of 40:60. Corn silage was fed as roughage and the control con-centrate was composed of 10.8% corn grain, 9.8% soybean hulls, 37.5% sunflower meal, 0.6% urea, 0.4% limestone, and 1% supple-ment. The other two diets contained 6% soybean oil or 6% residual soybean frying oil replacing mainly corn grain and soybean hulls. The apparent digestibilities of dry matter and nutrients of experi-mental diets were estimated by using the internal marker indigestible acid detergent fiber. Diets and refused feed were sampled daily and fecal samples were collected each 4 hours during 3 d. Subsequently, samples were pre-dried, ground (2mm), and incubated in a bovine
rumen for 264 h. Data were analyzed by using Mixed Model proce-dures. Addition of oil, regardless the source, had negative effect (P ≤ 0.01) on apparent digestibility of dry matter, ADF, and, especially NDF, which had its digestibility reduced by 5.7%. Furthermore, ether extract digestibility was increased (P > 0.05) by adding oil to the diets and no difference was observed (P > 0.05) between sources of oil used. Digestibility of crude protein was not influenced by the addition of oil. Caution should be taken regarding to the inclusion of supplemental oil sources, since the addition of 6% had negative impact on digestibility of dry matter and nutrients, according to this study. Residual soybean frying oil has potential to be used as alterna-tive energy source for finishing lambs.
Keywords: digestibility, frying oil, lambs
78 Impact of Protein Supplementation And/Or Increased For-age Allowance on Growth and Reproductive Performance of Re-placement Heifers D. H. Poole 1,*, A. Shaeffer 1, S. Freeman 1, G. Hansen 1, M. Alley 2, S. Whisnant 1, M. Poore 1, 1Animal Science, 2Population Health and Pathobiology, North Carolina State University, Raleigh
Stockpiled fescue is an effective wintering strategy for beef cattle. However, previous research has demonstrated that the nutritive val-ue of stockpiled fescue alone may be inadequate for developing re-placement heifers (H). This study evaluated growth parameters and reproductive performance in H receiving 2 levels of forage alloca-tion (FA) and 2 supplements (S) 56 d prior to breeding. Yearling H (initially 273 kg and BCS 5.2) were blocked by body weight (BW) and assigned to 16 pastures arranged in 4 land reps. Treatments were provided in a 2 x 2 factorial, with 2 S types [mineral (M) or a 25% CP molasses-based tub (TUB, Southern States Maxi-Cattle)], and 2 levels of FA [normal stocking density (N) and a reduced stocking density allowing for an increased amount of forage per animal (E)]. Each group had 5 animals (3 H and 2 steers), only H were used for statistical analysis, and group was the experimental unit. Following 56 d of grazing, H were synchronized (7-d Select-Synch plus CIDR), bred AI, and then exposed to a bull. Consumption of S was greater (P<0.05) for TUB than M (0.2 vs. 0.6 kg/h/d) regardless of FA. Sup-plementation with TUB or E alone or in combination increased (p< 0.05) ADG (0.26, 0.45, 0.49, 0.56 kg/d for M-N, TUB-N, M-E, and TUB-E, respectfully). A positive change in BCS prior to breeding was greater (P <0.05) for E than N (5.22 to 5.43 vs. 5.28 to 5.32) regardless of S type. Supplementation with TUB or E alone or in combination did not effect reproductive tract scores, pelvic area (P > 0.05). Overall, first service conception rates (48, 52, 43, 42% for M-N, TUB-N, M-E, and TUB-E, respectfully) and pregnancy rates (88, 82, 79, 71% for M-N, TUB-N, M-E, and TUB-E, respectfully) were lower than expected and no difference were observed among the treatment groups (P > 0.05). In conclusion, supplementation with either TUB or E increased BW, ADG and BCS in H grazing stockpiled fescue, although exogenous factors may have negatively impacted fertility.
Keywords: replacement heifers, Reproduction, Stockpiled fescue
79 Effect of Supplement Level on Adaptation to Dried Distill-ers Grains in a Round Bale Silage Based Diet for Beef SteersE. Alava , M. Hersom *, J. Yelich, Animal Sciences, University of Florida, Gainesville
The objective was to evaluate intake, ruminal and plasma metabolite parameters in steers during adaptation to dried distillers grains (DDG) while consuming Tifton 85 bermudagrass round bale silage (RBS). Di-ets were designed to simulate a 14-d adaption to a concentrate diet. On d -2 and -1 steers received RBS only; thereafter, DDG was offered accordingly: d 0, 1.13 kg; d 4, 2.26 kg; d 8, 3.39 kg, and d 12, 4.52 kg until d 15. Eight ruminally cannulated steers (2-4 yr; 581 ± 100 kg) were used with each steer receiving the step-up diet. Ruminal fluid was collected at 0, 3, 6, 12, 24, and 36 h; blood samples were collected at 0, 6, 12, 24, and 36 h after each diet change. Intake, rumen measures, and blood metabolite concentrations were analyzed using the PROC MIXED procedure of SAS. The model contained the effect of DDG level and hour (level); BW was included as a covariate. Level of DDG did not affect DMI of RBS, but increased total DMI (P < 0.05). Mean ruminal pH decreased (P ≤ 0. 05) as DDG increased. Mean ruminal flu-id NH3-N was less (P ≤ 0.05) when steers consumed 0, 1.13, or 2.26 kg of DDG (mean = 21.0 mg/dL) compared to 3.39 and 4.52 kg of DDG (mean = 32.2 mg/dL). Steers consuming 0 and 1.13 kg of DDG had a greater mean plasma NEFA concentration (mean = 304 mEq/ml; P ≤ 0.09) compared to 2.26 kg DDG (242.2 mEq/ml), but were not differ-ent (P > 0.05) than RBS alone, 3.39 or 4.52 kg DDG (mean = 275 mEq/ml). Mean PUN concentration was increased (P ≤ 0.05) when steers consumed 3.39 kg DDG (45.1 mg/dL) compared to 2.26 and 4.52 kg DDG (mean = 35.6 mg/dL). However, PUN concentrations were not different (P > 0.05) when steers consumed 3.39 kg DDG compared to 0 or 1.13 kg DDG (mean = 39.8 mg/dL). Mean glucose concentration in steers offered RBS only (65.9 mg/dL) was greater (P ≤ 0.05) than 1.13 or 2.26 kg DDG (mean =61.9 mg/dL), but was not different (P > 0.05) when steers consumed any other amount of DDG. When DDG were introduced at increasing levels, total DMI, ruminal pH and NH3-N were comparable to cattle fed supplement over longer periods of time. Blood metabolite data was dependent upon level of DDG intake.
Keywords: adaptation, dried distillers grains, Forage
30
80 Effects of Different Calf Management Systems Following Early-Weaning on Growth Performance of Beef CalvesP. Moriel *, P. G. Martins, A. D. Aguiar, J. M. Vendramini, J. D. Arthington, Range Cattle Research and Education Center, Univer-sity of Florida, Ona
Our objective was to evaluate the growth performance of early-weaned (EW) calves reared on different calf management systems. On d -9 (late January), Brangus crossbred calves (28 steers and 28 heifers; 98 ± 18 kg of BW; 80 ± 14 d of age) were EW and kept in drylot pens with free choice access to water, hay and concentrate. On d 0, calves were stratified by sex and BW and randomly allotted into 1 of 12 pastures (4 to 5 calves/pasture). Treatments were randomly assigned to pastures (4 pastures/treatment) and consisted of ryegrass grazing + concentrate supplementation at 1% of BW (RG1), and bahiagrass grazing + con-centrate supplementation at 2% of BW (BA2) or free-choice access to concentrate (BAFC). Calves were supplemented daily with a soybean hulls-based concentrate for 84 d, and BW was recorded every 28 d following a 6 h-period of feed and water withdrawal. Initial and final herbage mass (HM) were obtained by double-sample technique (initial HM = 5230 and 2679 ± 206 kg DM/ha for bahiagrass and ryegrass pastures, respectively). Data was analyzed as a CRD with pasture as the experimental unit. From d 0 to 28, RG1 and BA2 calves had simi-lar ADG (P = 0.28), but less (P ≤ 0.05) than BAFC calves (0.82, 0.89 and 1.02 ± 0.04 kg/d, respectively). From d 56 to 84, BAFC calves had greater (P < 0.01) ADG than BA2 calves, which was greater (P < 0.01) than RG1 calves (1.41, 1.04 and 0.61 ± 0.03 kg/d, respectively). Final HM was greatest (P < 0.01) for BAFC calves, but similar (P = 0.13) between RG1 and BA2 calves (2458, 877 and 1331 ± 206 kg/ha, respectively). On d 84, BAFC calves were heaviest, BA2 lightest and RG1 calves intermediate (190, 154 and 169 ± 5 kg, respectively; P ≤ 0.04). However, RG1 and BA2 calves had similar overall ADG (P = 0.63), but less (P < 0.01) than BAFC calves (0.79, 0.77 and 1.14 ± 0.03 kg/d, respectively). In conclusion, EW calves fed concentrate at 1% of BW on ryegrass pastures had similar overall growth performance as calves on bahiagrass pastures with concentrate supplementation at 2% of BW. However, both systems resulted in inferior growth performance compared with calves provided free choice access to concentrate on bahiagrass pastures.
Keywords: Early-weaned calves, Free choice supplementation, Ryegrass
81 Evaluation of High Moisture and Dry Feed Both with and Without Hay Fed to Weaned Calves Subjected to Transportation Shrink.D. Rankins, Jr., J. Starnes *, Animal Sciences, Auburn University, Au-burn, AL
Shrink is a major factor in the marketing of feeder cattle. It is espe-cially important for long-hauls (20+h) from the southeastern back-grounders to the midwestern feedlots. Shrink occurs in two forms: 1) loss of body fill and 2) loss of tissue fluids, which is observed during longer periods of transport. The objectives of this research were to compare the effects of various pre-shipment feeding regi-mens on shrink and subsequent BW gain in shipped and unshipped feeder calves (steers and heifers). One hundred eighteen British cross calves (54 heifers, 64 steers with initial WW 297 and 320 kg) were
fed high moisture (HM) or dry feed (DF) for 49 d and then offered hay or no hay 48 h prior to shipment. Factors were imposed facto-rially (2x2x2), steers and heifers were represented in all 12 pens. Daily gain during the backgrounding period was not different for HM versus DF (P> 0.10) and averaged 0.90kg. On day 49,half of the calves were shipped, while their pen-mates remained in the pen of origin (59 shipped; 59 unshipped). Shipped calves were loaded on a semi in cuts of 4, 25, 26, and 4. Average shipping BW was 347kg. Transported calves were hauled for 21 h. Upon arrival, BW were decreased (P< 0.01) for transported calves (29 kg) versus their pen mates (0.0 kg). Neither HM or DF or hay affected shrink (P> 0.10). Throughout 15 d post-shipment BW differences between shipped calves and unshipped calves remained different (P< 0.10; 4.5kg vs. 10.8kg). Post-shipment weight recovery was faster for the pens that received hay 48 h prior to shipment (P< 0.10). Following 21 h of transportation feeder calves shrank 8.4%. In summary, feeding HM or DF had no effect on shrink or subsequent BW gain after transpor-tation. Offering hay 48 h prior to shipment had no effect on shrink but did alter post-shipment BW gain.
Keywords: Transportation shrink, beef cattle, diet
82 Effects of Copper Oxide Bolus Administration on Produc-tivity and Copper Status in Grazing Beef Calves Supplemented with Dried Distillers GrainsJ. Hawley, E. B. Kegley *, J. G. Powell, J. M. Bauer, J. A. Hornsby, J. L. Reynolds, D. L. Galloway, Department of Animal Science, Uni-versity of Arkansas, Fayetteville
A 2-yr study was conducted to assess the effects of copper oxide (CuO) bolus administration on productivity and Cu status in beef calves supplemented with dried distillers’ grains (DDG). Calves (Angus sired; n = 74, yr 1; n = 54, yr 2) were assigned randomly to treatments: 1) a single intraruminal CuO bolus (12.5 g CuO needles; Copasure; Animax Ltd., Columbus, OH), or 2) non-bolus control for a growth trial (141 d, yr 1; 92 d, yr 2). Calves grazed predominantly stockpiled dormant bermudagrass (Cynodon dactylon [L]) pastures, and were offered bermudagrass hay for ad libitum consumption when forage became limiting (0.36% S, yr 1; 0.34% S, yr 2). Supple-mental DDG (0.44% S, yr 1; 0.69% S, yr 2) were offered at a rate of 0.75% of BW (as fed). Calves were weighed at 28-d intervals, and DDG amount was adjusted after each weigh day. Cattle had ad libitum access to a trace mineral salt containing 300 (yr 1) or 100 (yr 2) mg Cu/kg. Blood samples were collected for plasma Cu and Zn concentrations (d 0, yr 1 and 2; d 140, yr 1; d 35, yr 2). There were no (0.70 kg/d, P = 0.70, yr 1; 0.92 kg/d, P = 0.83, yr 2) differences in ADG between bolused and non-bolused calves. Administration of the CuO bolus did not (P = 1.00, yr 1; P = 1.00, yr 2) increase plasma Cu concentrations compared with non-bolused calves. Initial and fi-nal plasma Cu concentrations differed (P < 0.05, yr 1; P < 0.05, yr 2) with an overall decrease in plasma Cu (0.88 and 0.72 mg/L, yr 1; 0.8 and 0.68 mg/L, yr 2; initial and final, respectively). Results sug-gest that in beef calves consuming DDG, CuO bolus administration did not influence weight gain nor alleviate reduced Cu bioavailabil-ity (as indicated by plasma Cu status) caused by high-S supplements.
Keywords: Beef cattle, Copper, dried distillers grains
30 31
extension ii
83 Finishing Steers with Corn or Soybean Hulls on Ryegrass PasturesG. M. Hill 1,*, R. C. Lacy 2, G. W. Stone 1, D. R. Tillman 1, A. N. Franklin 1, 1Animal and Dairy Science, 2Agricultural Economics, the University of Georgia, Tifton
In a 2-yr study, steers grazing ryegrass pastures were supplemented (SUP) with either corn (DM 89 %; CP 10 %) or pelleted soybean hulls (SH; DM 90%, CP 11%) at approximately 1% of steer BW. Prepared seedbed pastures (n=6; 1.42 ha each) were drilled with ryegrass (33.6 kg/ha; Yr 1: cultivar ‘Big Daddy’; November 11, 2008; grazed 98 d beginning January 28, 2009; Yr 2: cultivar ‘Jumbo’; November 13, 2009; grazed 99 d beginning February 24, 2010). Ryegrass cultivars differed because ‘Big Daddy’ was not available in 2009. Variable stocking rates in a put-and-take system were employed to keep for-age height at 10 to 12 cm. Tester steers (Yr 1: n=28; initial BW 458 ± 34.3 kg; Angus crossbred and Brangus; Yr 2: n=28; initial BW 374 ± 23.3 kg; Angus and Angus crossbred) were grouped with regard to BW and breeding, and two groups were randomly assigned to each treat-ment. Steers grazed ryegrass with No SUP (RNS), with Corn (RC), or with SH (RSH). The SUP DMI, initial BW, ADG, carcass wt (kg), and quality grade (10 = Select) of tester steers, by treatments were: Yr 1, 0.0, 4.34, 3.88; 463.5, 455.8, 456.2; 1.02b, 1.20b, 1.44a; 317b, 337b, 350a; 10.2, 10.5, 11.1; Yr 2, 0.0, 3.71, 3.78; 376.0, 371.9, 374.1; 1.46, 1.40, 1.56; 281b, 289ab, 297a; 10.5b, 11.6a, 11.2a; means with differ-ent letters differ (P < 0.05). Although steers in Yr 1 had greater initial BW than steers in Yr 2, steer ADG increased for RSH in Yr 1, while carcass wt and quality grades tended to increase in both yr for RC and RSH. The trends for increased steer performance and carcass merit for RSH suggest that SH can be effectively fed as an alternative to corn in ryegrass finishing programs.
Keywords: steer ryegrass gain
85 Misconceptions That Lead to Straightbreeding in Commer-cial Beef Cattle OperationsD. Bullock *, L. Anderson, J. Lehmkuhler, R. Burris, Animal and Food Sciences, University of Kentucky, Lexington
Advantages gained through heterosis have long been the reason for widespread adoption of crossbreeding programs in the commercial cow/calf segment of the beef industry. However, survey results of Kentucky beef producers administered in 2002 and again in 2012 showed a reduction in commercial herds using crossbreeding from 88% to 78%. This trend away from crossbreeding is likely due to the success of Certified Angus Beef (CAB) and subsequent Angus
84 The Effects of Stocker-Phase Implant Strategies on Subse-quent Feedlot Performance and Carcass CharacteristicsD. O. Alkire *, R. R. Reuter, Agricultural Division, the Samuel Rob-erts Noble Foundation, Ardmore. OK
In each of three years, 125 Continental and British crossbred heifers were randomly assigned to one of five stocker-phase implant pro-tocols to determine their effects on stocker-phase performance and subsequent feedlot performance and carcass characteristics. Treat-ments were 1) no stocker phase implant (CON), 2) a single Revalor-G implant on d 0 of grazing (REVG), 3) a Synovex-H implant on d 0 followed by second Synovex-H implant on d 70 (SH2X), 4) a single Synovex-H implant on d 0 (SHE), and 5) a single Synovex-H im-plant on d 70 (SHL). Heifers (188 ± 18 kg initial BW; P = 0.49) were grazed on rye (Secale cereale) pasture for 144 d. During the finishing phase, all cattle received a Synovex-H implant on d 0 followed by a Finaplix-H implant on d 60. Data were pooled across years and analyzed by ANOVA with animal as the experimental unit, except for G:F which used pen. Implanted heifers exhibited greater stocker-phase ADG compared with controls (contrast P < 0.001). Heifers that did not receive an implant at d 0 of the stocker phase gained less than those implanted at d 0 (contrast P = 0.005). Stocker-phase ADG differences resulted in greater feedlot placement BW for implanted animals (contrast P < 0.001). Days on feed, ADG and G:F were not different among treatments (P > 0.39), but final BW was greater for implanted animals (P = 0.002). In addition, dressing percentage, marbling score, LM area, yield grade and adjusted fat thickness were not different among treatments (P ≥ 0.10). However, stocker-phase implantation increased HCW (P = 0.04), and implanting early in the stocker phase increased HCW compared to implanting only at d 70 (P = 0.02). Mixed results were found for shear force in that when steaks were aged for only 7 d, stocker-phase implants increased shear force (P = 0.002). However, when aged for 14 d, the only difference observed was that REVG heifers exhibited greater shear force than heifers implanted with estrogen only (P = 0.03). This data suggests that implant protocols during the stocker phase can be used to increase growth performance without substantial negative effects on feedlot growth performance or carcass quality in heifers.
Keywords: beef cattle, carcass, implant
branded products. Ironically, many of these programs do not require any Angus breeding for inclusion, including CAB. The name brand recognition of Angus by consumers has not been lost on cattlemen and has potentially led to some misconceptions that may be leading to increased straightbreeding; negatively impacting the production and profitability of many beef herds. To assess some of these mis-conceptions a survey was conducted utilizing rapid response devices in the Genetics session of the Kentucky Master Cattleman program on issues associated with coat color in beef cattle. From 2010 to 2012 a total of 392 producers responded representing 16 sessions. When asked “How important is color in your bull selection?”: 66.1% responded “Very Important”; 30.2% “Somewhat”; and 3.7% “Not
32
Very Important. In response to the question “What traits do you think color impacts?”: 1.6% indicated “Birth Weight”, 2.1% “Weaning Weight”; 5.3% “Carcass Traits”; 41.3% “Color”; and 49.7% “All of the Above”. Lastly, they were asked “How much Angus Breeding is Required for CAB?”: and the responses were 11.2% - “100%”; 19.4% - “75%”; 36.2% - “50%”; 20.2% - “25%”; and 13.0% - “0%”. These results clearly indicate two misconceptions that likely leads to reduced crossbreeding in the commercial beef industry: 1) coat color has an impact on traits other than coat color and 2) that it actually requires Angus to qualify for CAB. In conclusion, it appears there are beef producers that are choosing to forego the advantages of crossbreeding to illogically breed their cattle black to take advantage of increased calving ease, heavier weights and improved carcass per-formance while straightbreeding Angus in hopes of gaining access to added value through CAB.
Keywords: Beef, Crossbreeding, Survey
86 Performance of Beef Calves Fed Supplements Containing GlycerinR. Burris *, J. Lehmkuhler, J. Randolph, Animal and Food Sciences, University of Kentucky, Princeton
Two feeding trials were conducted with weaned beef calves to evalu-ate a by-product feed supplement containing 10% glycerin (a by-product of biodiesel production). All calves were individually fed in electronic Calan feeding gates. Trial 1 utilized 20 heifer calves averaging 315 kg in an 84-day feeding trial. Each calf was given 1 kg of cottonseed hulls as a roughage source along with a supplement containing 70% soyhulls, 20% distillers dried grain with an addi-tional 10% of the supplement from either soyhulls (SH), glycerin (GLY) or corn (CORN). All calves were allowed ad libitum intake of their respective supplement for the first 28 days and then intake was restricted to 1.75% of their bodyweight for the remainder of the trial. Calves receiving GLY supplement gained more (P=0.04) during the first 28 days of the trial than calves on the other treat-ments (2.15 GLY vs. 1.77 SH and 1.78 CORN. Overall average daily gain (ADG,kg), Feed intake (kg) and Feed/gain ratio was 1.21, 9.09, 7.6; 1.26, 9.59, 7.7; and 1.22, 9.22, 7.6 for SH, GLY and CORN, respectively with no differences (P<0.10) among treatments. Trial 2 utilized 22 steer calves averaging 331.3 kg in a 43-day feeding trial. Calves were fed 1 kg of hay daily and allowed ad libitum intake of a commercial preconditioning supplement (COMM) or the glycerin-containing by-product supplement (GLY) from trial 1. ADG, kg; feed intake, kg and feed/gain ratio was 2.04, 10.3, 5.0 for COMM and 2.17, 10.1 and 4.6 for GLY. There were no differences (P<0.10) among treatments. These data indicate that glycerin, a by-product of biodiesel production from soybean oil, can replace 10% of more expensive energy feeds like corn or soyhulls in a supplemental feed for weaned beef calves without any decrease in performance.
Keywords: beef, by-products, glycerin
87 The Junior Beef Excellence Program and Comparison of Carcass Characteristics from Southern Oklahoma Show Steers Versus the Commercial Beef IndustryB. Nichols 1,*, R. Reuter 1, F. Schmedt 1, S. Ingram 1, L. McDaniel 2, 1Agriculture Division, The Samuel Roberts Noble Foundation, Ar-dmore, OK, 2Oklahoma Cooperative Extension Service, Oklahoma State University, Ardmore, OK
Since 1988, the Samuel Roberts Noble Foundation in Ardmore, OK has sponsored a youth program called the Junior Beef Excellence Program (JBEP). The JBEP is a carcass quality contest involving 4-H and FFA members that exhibit in junior livestock shows in eight south-central Oklahoma counties. The program is an outgrowth of a long standing tradition of ‘terminal’ junior steer shows in Carter County dating back to 1968. In 1988, the Noble Foundation took over sponsorship of the county contest from an informal group called the Carter County Beef Eaters Association. After the county junior livestock shows, steers entered in the JBEP are delivered to the Noble Foundation and commingled for two days before being slaughtered at a commercial packing plant. Carcass measurements are collected and carcasses are ranked based on current market value of quality grade and yield grade. From 2002-2012, this pro-gram has involved 674 participants and 788 steers. Total value of these cattle was $904,425, all of which was distributed back to the participants based on their individual steer’s market value. In addi-tion, added prize money was awarded to participants as an incen-tive to produce high quality carcasses. The awards are distributed at an educational event featuring programs concerning quality beef production. Results are also showcased on the internet at: www.noble.org/ag/jrbeef/. In the last ten years, cattle in this contest have exhibited marbling scores and ribeye areas greater than industry av-erage (National Beef Quality Audit data), and lesser than average hot carcass weights. Marbling scores in JBEP have been consistent until a substantial decline in 2012 while industry marbling has been trending up. Hot carcass weight in JBEP has been trending down, op-posite the industry trend toward heavier carcass weight. These trends have been used as discussion points to educate youth, parents, and other interested individuals about genetic selection and feeding man-agement of market steers. This program provides commercial beef production education to a demographic whose principal interest is non-commercial beef cattle exhibition.
Keywords: youth education
88 Beef Cattle Herd Health and Operation Facilities Interac-tive Video Short CoursesJ. A. Parish 1, B. B. Karisch 1, C. L. Huston 2, S. Hankins 3, L. L. Jury
1,*, 1Animal and Dairy Sciences, 2College of Veterinary Medicine, 3Extension Center for Technology Outreach, Mississippi State Uni-versity, Mississippi State
The Mississippi State University Extension Service offered a Beef Cattle Herd Health Management short course in December 2011 and a Cattle Operation Facilities workshop in March 2012. The ob-jectives of these programs were to provide producer education and extension agent in-service training on beef cattle herd health and op-eration facilities topics. The herd health program consisted of the following topics: health benchmarks, diseases, parasite control, vac-cination, health management practices, and medical management. The cattle operation facilities program topics included cattle han-dling facility design, virtual facilities tour, cattle handling facilities construction, fencing systems, watering and shade systems, and feed storage structures. Topics were chosen based on input from previ-ous extension program participants. Instructors included animal sci-ence, veterinary, and agricultural engineering faculty. Additionally, extension facilitators with expertise in livestock production were on site at each interactive video site for both programs as well as local veterinarians for the herd health program. Each course spanned a 6-h period including a provided mid-day meal and was offered as a
32 33
live, interactive broadcast over a Polycom system to 4 sites located in different quadrants of Mississippi. Participants were able to ask questions and engage in discussions with the presenters. Participants rated the herd health program as a 4.52 on average based on a Likert-type scale, where 1= poor and 5 = excellent. Comparably, the cattle operation facilities program was rated by participants as a 4.42 on the same scale. All program evaluations indicated that the informa-tion presented would be useful to their cattle operations. Specific comments were also captured regarding program quality and sug-gestions for improvements and topics for future programming. Feed-back indicated that the interactive video program delivery format is still a desirable means of communicating with beef cattle producers and that a variety of delivery formats are wanted across the total beef cattle extension program. Results also showed that cattle producers appreciate interdisciplinary extension programming efforts.
Keywords: beef cattle, extension, interactive video
89 Hands-On Workshops Spark Interest in North Carolina Beef ProducersM. H. Poore, S. R. Freeman, M. L. Alley, J. L. Etheridge, A. D. Shaeffer *, Animal Science, North Carolina State University, Raleigh
Beef producers in North Carolina enjoy a variety of educational op-portunities, and especially value hands-on workshops. During spring and summer of 2012, 4 Hands-On Beef Cattle Workshops funded by the NC Cattle Industry Assessment Program were conducted across the state. This program was a partnership between North Carolina Cooperative Extension, the North Carolina Cattlemen’s Associa-tion, and the NC Department of Agriculture and Consumer Services. Workshops started at 3 pm and formally adjourned at 6 pm, followed by additional time to interact informally with the instructors. Topics were selected to highlight research and extension activities funded by the NC Cattle Industry Assessment Program and included 1) Low Stress Cattle Handling, 2) Mineral Supplementation, 3) Improving Efficiency of Feeding and Grazing, and 4) Improving Your Market-ing Program. During the 3-hr program the full group heard a pre-sentation about the Cattle Industry Assessment Program and saw a low-stress cattle handling demonstration, after which the group was broken into small groups to rotate through the other topic stations. Following the evaluation, participants were invited to stay and return to the station they wished to know more about. Total registration at the events averaged 49±12 (mean±SD), and there were an average of 34±12 evaluations. The evaluators were 82% men and 18% women. Total pasture ha owned or managed by the evaluators was 1529±461 and total hay ha was 921±421. They owned 1412±408 total beef cows, 887±538 total stockers or yearlings, and 80±25 bulls. Evalu-ators left the workshop with a high level of intent to improve their management programs, with 88% indicating intent to improve their mineral program, 96% to improve their grazing and feeding manage-ment, 89% to improve their marketing program, and 99% to imple-
ment low-stress cattle handling practices. It is clear that this work-shop format was well received and that NC producers highly value hands-on training opportunities. This series of workshops has led to many additional hands-on workshops with a similar format but a variety of more focused topics.
Keywords: Beef Cattle, Hands-on workshop
90 Impact of a Wild Game Safety and Processing Program on Attendee Food Safety, Quality, and Processing KnowledgeD. Griffing 1,*, M. Cheshire 1, S. Talley 2, C. Carr 1, D. Johnson 1, L. Eubanks 1, 1Animal Sciences, University of Florida, Gainesville, 2Florida Fish and Wildlife Conservation Commission, Florida Fish and Wildlife Conservation Commission, Tallahassee
According to a 2006 survey, almost 6 million Florida residents over the age of 16 are involved in outdoor recreation, with approximate-ly 236 thousand participating in hunting. Nationally, 87.5 million Americans spent 122 billion dollars on outdoor recreation. During the downturn of the economy, a greater percentage of outdoorsmen are processing their own game, rather than sending products to cus-tom processors, but still want high quality, easy-to-prepare products for home use. Additionally, many hunters lack a clear understanding of the practices needed to maintain food safety and minimize the risk of foodborne illness. A six hour wild game safety and quality program was conducted on two consecutive years with a total of 130 participants. The program included lectures on zoonotic diseases, game meat safety, postmortem handling to improve meat quality, and demonstrations of large game dressing, skinning, carcass fabrication, and processing of fresh, smoked, and fermented sausage. A total of 83 participants responded to the exit survey. The survey consisted of two sections. The first section was designed to measure the degree of learning achieved across workshop sessions and presented the respondents with three choices ranging from “Nothing New” being the lowest possible degree of learning and “A Great Deal Learned” being the highest possible degree of learning. According to the exit survey results, 98% of respondents indicated that they gained some degree of new knowledge, ranging from “A Great Deal Learned” to “Some New Knowledge” attained. The second section was a series of 4 true-false questions to evaluate hunter knowledge of food safety principles; with respondents having a mean score of 79% correct. Additionally, 88% of respondents indicating they would adopt two or more new practices to improve game meat safety, quality, or pro-cessing. Finally, respondents scored the overall educational value of the extension program as 9.4 on a 10-point scale, suggesting that the workshop was an effective method of teaching outdoorsmen how to improve the safety and quality of game meats and that a similar program would be successful in other states.
Keywords: game meat products, meat quality, meat safety
34
BoArDExecutive BoardVI–R. W. Godfrey (President)AL–L. W. Greene (President Elect)OK–D. L. Lalman (Secretary-Treasurer)TX–T. H. Welsh (Past President)FL–J. D. Arthington (Secretary-Treasurer
Elect)TX–A. N. Loyd (Student Representative)AR–A. J. Davis (Student Representative)FL–J. V. Yelich (Southern Section
Director)
generAl committeeSAcademic QuadrathlonFL–J. V. Yelich (Chair) GA–K. J. Johnson-Duberstein VA–C. M. Wood AL–L. A. Kriese-Anderson AL–O. Bolden-Tiller LA–C. C. Williams
Advisory CommitteeNC–M. T. See (Chair) FL–G. E. Dahl TN–F. N. Schrick GA–J. K. Bertrand TX–J. C. Paschal
Necrology CommitteeAR–P. A. Beck (Chair) NC–J. W. Spears AL–S. P. Schmidt
Nominating CommitteeAR–E. B. Kegley (Chair) LA–D. G. Morrison NC–M. H. Poore TX–T. H. Welsh
Resolution CommitteeVA–M. J. Estienne (Chair) FL–S. W. Coleman AL–R. B. Muntifering
AwArD committeeSDistinguished Service AwardVA–J. P. Fontenot (Chair) TX–R. D. Randel TX–F. M. Rouquette TX–P. G. Harms LA–D. G. Morrison
Emerging Scholar AwardTX–T. H. Welsh (Chair) FL–M. A. Elzo TN–J. D. Rhinehart OK–B. Morgan AR–P. A. Beck AL–O. Bolden-Tiller GA–G. M. Hill AL–S. G. Solaiman MS–B. J. Rude
Extension AwardNC–E. van Heugten (Chair) NC–M. T. See KY–R. D. Coffey GA–W. R. Getz
Graduate Student Paper CompetitionTX–M. R. Garcia (Chair) MO–J. Escobar TN–P. D. Krawczel AR–J. M. Burke AL–C. L. Bratcher TX–C. A. Gill
National Pork Board AwardAL–L. W. Greene (Chair) LA–L. L. Southern NC–J. P. Cassady AL–W. F. Owsley
Undergraduate Student Paper CompetitionTX–R. K. Miller (Chair) OH–B. D. Whitaker VA–R. K. Splan GA–T. D. Pringle TX–E. G. Brown AL–D. A. Coleman
Young Animal Scientist-Education AwardOK–G. G. Hilton (Chair) MO–T. J. Wistuba TX–J. C. Brooks DE–D. J. OBrien TX–R.
StankYoung Animal Scientist-Research AwardAL–J. L. Sartin (Chair) FL–J. D. Arthington OK–D. L. VanOverbeke TX–J. C. Brooks NC–N. C. Whitley
Program committeesBreeding and GeneticsMS–T. Smith (Chair) LA–M. D. Garcia TX–D. G. Riley NC–G. R. Hansen
ExtensionKY–J. W. Lehmkuhler (Chair) GA–L. Stewart KY–W. R. Burris LA–K. W. Harborth
MeatsFL–C. Carr (Chair) SC–S. K. Duckett VA–J. M. Scheffler TX–T. E. Lawrence
Pasture and ForageLA–G. Scaglia (Chair) TX–V. A. Corriher OK–D. O. Alkire SC–J. G. Andrae
PhysiologyVA–M. J. Estienne (Chair) MS–J. E. Larson MS–R. C. Vann TX–J. A. Carroll
Ruminant AnimalAL–R. B. Muntifering (Chair) OK–R. Reuter TX–G. E. Carstens TX–T. A. Wickersham
Small Ruminant ProductionKY–K. M. Andries (Chair) AR–S. M. Jones DE–D. J. OBrien AL–K. Nadarajah TX–T. R. Whitney
Teaching and UndergraduateTX–R. K. Miller (Chair) OH–B. D. Whitaker VA–R. K. Splan GA–T. D. Pringle TX–E. G. Brown AL–D. A. Coleman
2013 Southern Section ASAS committees
34 35
2011–12 T. H. Welsh, Jr. Texas A&M University2010–11 M.H. Poore North Carolina State University2009–10 D.G. Morrison Louisiana State University Agricultural Center2008–09 E. B. Kegley University of Arkansas2007–08 C. C. Chase, Jr USDA, ARS, STARS2006–07 D. A. Coleman Auburn University2005–06 R. D. Randel Texas A&M University2003–05 K. L. Esbenshade NC State University2002–03 D. K. Aaron University of Kentucky2001–02 T. R. Troxel University of Arkansas2000–01 L. L. Southern Louisiana State University1999–00 R. P. Wettemann Oklahoma State University1998–99 J. D. Armstrong Purdue University1997–98 D.G. Ely University of Kentucky1996–97 P.R. Harms Texas A&M University1995–96 P.R. Utley University of Georgia1994–95 D.S. Buchanan Oklahoma State University1993–94 P.R. Nolan University of Arkansas1992–93 D.R. Marple Auburn University1991–92 R.W. Harvey NC State University1990–91 D.E. Franke Louisiana State University1989–90 A.L. Eller, Jr. VPI & SU1988–89 C.R. Long Texas A&M University1987–88 D.G. Spruill University of Georgia1986–87 G.L. Cromwell University of Kentucky1985–86 B. Baker, Jr. Mississippi State University1984–85 C.B. Ammerman University of Florida1983–84 W.G. Luce Oklahoma State University1982–83 J.R. Hill Clemson University1981–82 J.W. Turner Louisiana State University1980–81 A.M. Sorenson Texas A&M University1979–80 W.C. McCormick University of Georgia1978–79 E.R. Barrick NC State University1977–78 R.L. McGuire Auburn University1976–77 J.J. Guenther Oklahoma State University1975–76 C.J. Brown University of Arkansas1974–75 S.L. Hansard University of Tennessee
Southern SectionAmerican Society of Animal Science
PASt PreSiDentS1973–74 M. Koger University of Florida1972–73 J.P. Fontenot VPI & SU1971–72 G.E. Mitchell, Jr. University of Kentucky1970–71 L.S. Pope Texas A&M University1969–70 L.C. Ulberg NC State University1968–69 R.C. Carter VPI & SU1967–68 G.L. Robertson Louisiana State University1966–67 C.E. Lindley Mississippi State University1965–66 R.F. Sewell University of Georgia1964–65 W.M. Warren Auburn University1963–64 R.F. Wheeler Clemson University1962–63 E.J. Warrick USDA1961–62 G.K. Davis University of Florida1960–61 W. Gifford University of Arkansas1959–60 J.A. Whatley Oklahoma State University1957–58 B.L. Southwell University of Georgia1956–57 W.P. Garrigus University of Kentucky1955–56 J.C. Miller Texas A&M University1954–55 R.A. Damon Louisiana State University1953–54 A.E. Cullison University of Georgia1952–53 C.M. Kincaid VPI & SU1951–52 R.S. Glasscock University of Florida1950–51 H.H. Levek Mississippi State University1949–50 J.E. Foster University of Maryland1948–49 H.M. Briggs Oklahoma State University1947–48 E.C. Godbey Clemson University1946–47 J.C. Grimes Auburn University1941–42 R.E. Hunt VPI & SU1940–41 M.G. Snell Louisiana State University1939–40 L.E. Richardson University of Tennessee1938–39 E.W. Sheets USDA1937–38 L.I. Case NC State University1936–37 M.P. Jarnigan University of Georgia1935–36 J.B. Francioni Louisiana State University1934–35 A.L. Shealy University of Florida1933–34 L.V. Starkey Clemson University1932–33 W.L. Blizzard Oklahoma State University
36
Southern SectionAmerican Society of Animal Science
PASt AwArD reciPientS
2012 Michael Shane Gadberry University of Arkansas 2011 Richard D. Coffey University of Kentucky 2010 M. Todd See North Carolina 2009 Eric van Heugten North Carolina 2008 Ted McCollum Texas A&M University 2007 Matthew H. Poore North Carolina 2006 Allen F. Harper Virginia 2005 Glen Selk Oklahoma State University 2004 Roger L. McCraw North Carolina 2003 Darrh Bullock Kentucky 2002 Warren Gill Tennessee 2001 Walter R. Burris Kentucky 2000 Tom R. Troxel Arkansas 1999 George V. Davis, Jr. Arkansas 1998 G. L. Monty Chappel Kentucky 1997 Steven H. Umberger Virginia 1996 Clyde D. Lane, Jr. Tennessee
extension Award recipients
1995 John T. Johns Kentucky 1994 David W. Freeman Oklahoma 1993 J.R. Jones North Carolina 1992 James B. Neel Tennessee 1991 Keith Lusby Oklahoma 1990 Joe Hughes Oklahoma 1989 Henry Webster Clemson 1988 Donald R. Gill Oklahoma 1987 H. John Gerken, Jr. Virginia 1986 M.K. Cook Georgia 1985 W.G. Luce Oklahoma 1984 Charles Cooper Virginia 1983 C.W. Absher Kentucky 1982 C.M. Triplett Georgia 1981 Arden N. Huff Virginia 1980 A.L. Eller, Jr. Virginia
2012 David Morrison Louisiana State University 2011 Paul G. Harms Texas A&M University 2010 Monte Rouquette, Jr. Texas AgriLife Research 2009 Not Given 2008 Ronald D. Randel Texas A&M University 2007 A. Hayden Brown, Jr. Arkansas 2006 Gary M. Hill Georgia 2005 Samuel W. Coleman USDA 2004 Don G. Ely Kentucky 2003 Don E. Franke Louisiana 2002 Fred Thrift Kentucky 2001 Robert Wettmann Oklahoma 2000 Philip Utley Georgia 1999 Paul R. Noland Arkansas 1998 Not Given 1997 William G. Luce Oklahoma 1996 Raymond W. Harvey North Carolina 1995 Gary L. Cromwell Kentucky 1994 George E. Mitchell, Jr. Kentucky 1993 L.E. McDowell Florida 1992 Joseph Fontenot Virginia 1991 Robert Totusek Oklahoma 1990 Virgil Hays Kentucky 1989 Frank Baker Arkansas
Distinguished Service Award recipients
1988 Clarence B. Ammerman Florida 1987 Lowell E. Walters Oklahoma 1986 Lemuel Goode North Carolina 1985 O.M. Hale Georgia 1984 L.C. Ulberg North Carolina 1983 C.J. Brown Arkansas 1982 W.C. McCormick Georgia 1981 Elliot R. Barrick North Carolina 1980 J.A. Whatley, Jr. Oklahoma 1979 Marvin Koger Florida 1978 Thomas J. Marlowe Virginia 1977 Sam Hansard Tennessee 1976 J.C. Hillier Oklahoma 1975 J.K. Riggs Texas 1974 T.J. Cunha Florida 1973 O.D. Butler Texas 1972 George W. Litton Virginia 1971 Ray H. Dutt Kentucky 1970 Robert C. Carter Virginia 1969 Henry H. Leveck Mississippi 1968 Wesley P. Garrigus Kentucky 1967 Byron L. Southwell Georgia 1966 Charles S. Hobbs Tennessee
36 37
20122 Surendranath Suman University of Kentucky 20121 Deb VanOverbeke Oklahoma State University 20112 J. Chance Brooks Texas Tech 20111 J. Chance Brooks Texas Tech 20102 Troy J. Wistuba Morehead State University 20101 Deborah L. VanOverbeke Oklahoma State University 20092 Michael L. Looper USDA, ARS 20091 Gretchen Hilton Oklahoma State University 20082 Jeffery Escobar Virginia Tech 20081 Jodi A. Sterle Texas A&M University 20072 S-W Kim Texas Tech University 20071 L. Anderson University of Kentucky 20062 Scott T. Willard Mississippi State University 20061 Michael L. Looper USDA, ARS 20052 Clinton Krehbiel Oklahoma State University 20041 M. Todd See North Carolina State University 20042 Theo Van Kempen North Carolina State University 20031 Sam Jackson Texas Tech University 20032 Tom Spencer Texas A&M University 20021 Joel Yelich University of Florida 20022 Beth Kegley University of Arkansas 20011 Shawn Ramsey Texas A&M University 20012 Jason Apple University of Arkansas 20001 Andy D. Herring Texas Tech University 19992 Chad C. Chase, Jr. USDA, ARS 19981 Markus F. Miller Texas Tech University 19982 Arthur L. Goetsch Langston University 19971 Tim Marshall University of Florida
young Animal Scientist Award recipients
19961 William L. Flowers North Carolina State University 19962 Markus F. Miller Texas Tech University 19951 Craig H. Wood University of Kentucky 19952 Jeffrey D. Armstrong North Carolina State University 19941 Debra K. Aaron University of Kentucky 19942 Peter J. Hansen University of Florida 19931 Kevin Pond North Carolina State University 19932 Rod Geisert Oklahoma State University 19921 David S. Buchanan Oklahoma State University 19922 James L. Sartin Auburn University 19911 W.E. Beal VPI & SU 19912 Wayne Greene Texas A&M University 19901 J.W. Mabry University of Georgia 19902 T.H. Welsh Texas A&M University 1989 J.W. Spears North Carolina State University 1988 S.B. Smith Texas A&M University 1987 D.L. Thompson, Jr. Louisiana State Univ. 1986 G.J. Hausman USDA, ARS, Athens, GA 1985 J.W. Savell Texas A&M University 1984 D.R. Notter VPI & SU 1983 T.S. Stahly University of Kentucky 1982 D.N. Marple Auburn University 1Education 2 Research
nPB Swine industry Award recipients2012 Mark Estienne Virginia Tech 2011 Mark Estienne Virginia Tech 2010 Jeffery A. Carroll ARS, USDA 2009 Eric Van Heugten NC State University 2008 Sung Woo Kim North Carolina State Unversity 2007 Chad O’Gormon Texas A&M University 2006 Jeffery A. Carroll USDA, ARS 2005 Zelpha B. Johnson University of Arkansas 2004 Jason Apple University of Arkansas 2003 Theo van Kempen North Carolina State University 2002 Kim Cole University of Arkansas 2001 G. E. Conatser University of Tennessee 2000 Not given 1999 Not given 1998 Robert A. Cushman North Carolina State University 1997 M. Todd See North Carolina State University 1996 William L. Flowers North Carolina State University 1995 M. Todd See North Carolina State University 1994 Robert Dove University of Georgia
38
emerging Scholar Award2010 Christina Taylor-Edwards University of Kentucky
graduate Student Paper Award recipientsYear Awardee Place of Meeting University 2010 J. S. Fry Orlando North Carolina State University 2009 S.J. Winterholler Atlanta Oklahoma State University 2008 S.L. Hansen Dallas North Carolina State University 2007 P. Williams Mobile Texas A&M University-Kingsville 2006 L. R. Legleiter Orlando North Carolina State University 2005 M. Bowman Little Rock University of Arkansas 2004 E. G. Brown Tulsa Texas A&M University 2003 C. Realini Mobile University of Georgia 2002 J. A. Parish Orlando University of Georgia 2001 J. Montgomery Ft. Worth Texas Tech University 2000 M. R. Stivarious Lexington University of Arkansas 1999 T. E. Engle Memphis North Carolina State University 1998 C. Barnett Little Rock Univ. of Tennessee 1997 D.H. Crews, Jr. Birmingham Louisiana State University 1996 None Given 1995 E.B. Kegley New Orleans North Carolina State University 1994 R.D. Coffey Nashville University of Kentucky 1993 D.K. Bishop Tulsa Oklahoma State University 1992 R.L. Stanko Lexington North Carolina State University 1991 G.A. Rohrer Ft. Worth Texas A&M University 1990 K.A. Meurer Little Rock Mississippi State Univ. 1989 G.M. Davenport Nashville University of Kentucky 1988 M.J. Esteinne New Orleans University of Georgia 1987 T.W. Burnell Nashville University of Kentucky 1986 M.J. Wylie Orlando Texas A&M University 1985 M.W. Richards Biloxi Clemson University 1984 J.C. Betts Nashville Texas A&M University 1983 J.B. Lutz Atlanta University of Georgia 1982 K.R. Pond Orlando Texas A&M University 1981 L.W. Greene Atlanta VPI & SU 1980 D.K. Aaron Hot Springs University of Kentucky 1979 T.W. Robb New Orleans University of Kentucky 1978 E.F. Gray Houston University of Kentucky 1977 T.A. Puglisi Atlanta University of Georgia 1976 D.L. Thomas Mobile Oklahoma State University 1975 J.C. Cornwell New Orleans Louisiana State University 1974 D.M. Hallford Memphis Oklahoma State University 1973 A.C. Mills Atlanta University of Florida 1972 C. McLellan, Jr. Richmond Oklahoma State University 1971 C.L. Fields Jackonsville University of Kentucky 1970 A.R. Bellve Memphis North Carolina State University 1969 W.L. Brown Mobile Auburn University 1968 W.E. Powell Louisville Auburn University 1967 F.W. Bazer New Orleans North Carolina State University 1966 D.G. Ely Jackson University of Kentucky 1965 R.D. Goodrich Dallas Oklahoma State University 1964 C.K. Vincent Atlanta North Carolina State University 1963 C.B. Ramsey Memphis University of Tennessee 1962 J.R. Crockett Jacksonville University of Florida
38 39
2012 Texas A&M University 2010 University of Florida 2009 Univeristy of Georgia 2008 University of Kentucky 2007 Texas A&M University 2006 Texas A&M University 2005 North Carolina State University 2004 University of Kentucky 2003 Texas A&M University 2002 University of Florida 2001 University of Kentucky 2000 Texas A&M University 1999 University of Kentucky 1998 University of Kentucky
1997 Oklahoma State University 1996 Oklahoma State University 1995 Virginia Tech 1994 Oklahoma State University 1993 Texas A&M University 1992 Oklahoma State University 1991 University of Kentucky 1990 Virginia Tech 1989 Oklahoma State University 1988 Texas A&M University 1987 University of Georgia 1986 University of Georgia 1985 University of Kentucky 1984 Texas A&M University
Year Awardee Place of Meeting University 2010 W. N. Tapp III Orlando University of Arkansas 2009 C.M. Ballou Atlanta North Carolina State University 2008 C.R. Boldt Dallas Texas A&M University 2007 K. Starkey Mobile University of Arkansas 2006 D. Sykes Orlando Mississippi State University 2005 N. Burdick Little Rock Texas A&M University-Kingsville 2004 J. L. Roberts Tulsa Oklahoma State University 2003 M. Seitz Mobile Mississippi State Univ. 2002 B. Spader Orlando University of Missouri 2001 R. Horsley Ft. Worth Virginia Polytechnic Univ. 2000 B. Robbins Lexington Virginia Tech 1999 J. L. Bardugone Memphis Virginia Tech 1998 S. F. Flohr Little Rock Virginia Tech 1997 T. M. Weick Birmingham Louisiana State Univ. 1996 K. J. Goodson Greensboro Texas A&M University 1995 B. C. Bloom New Orleans Auburn University 1994 Beth Good Nashville Oklahoma State University 1993 C. J. Kirby Tulsa North Carolina State University
undergraduate Student Paper Award recipients
Academic Quadrathlon winners
40
Author inDeXPlease Note: Numbers following author’s name indicate abstract numbers.
AAaron, D.K., 17Acharya, M., 14, 71Aguiar, A.D., 41, 80Al-Sakini, A., 33Alava, E., 79Alkire, D.O., 84Alley, M.L., 47, 78, 89Amin, R.H., 3Anderson, L., 67, 85Andrae, J., 45Andrae, J.G., 49, 50Andries, K., 73Anschutz, K.S., 22, 27Apple, J., 9Arellano, A., 2, 35Arthington, J.D., 12, 21, 41, 80Ayala, L., 2, 35
BBackes, E.A., 13Banskalieva, V., 33Bartosh, J.L., 3Bauer, J. M., 82Beck, P., 48Beer, B., 66Blount, A., 39, 41Boland, H.T., 38, 42Bolt, B., 21Bowser, T., 33Brandebourg, T.D., 1, 03Bratcher, C.L., 1, 03, 07;O10Brink, T., 63Brown, A.H., 24, 27Brown, J. A., 53Brown, M.A., 11, 18Brown, Jr, A.H., 22Bullock, D., 85Bullock, K.D., 67Buntyn, J.O., 558Burdick Sanchez, N.C., 55, 56, 57, 58,
59Burke, J.M., 14, 71, 72Burns, M.G., 49, 50Burns, T.A., 50Burris, R., 85, 86Burris, W.R., 62, 67
cCaires, K.C., 5Calderon, A., 2, 35
Callaway, T.R., 59Carr, C., 28, 29, 30, 31, 90Carroll, J.A., 4, 55, 56, 57, 58, 59Carstens, G.E., 34, 36Cheshire, M., 90Clifton, S.M., 18Corah, L., 63
DDavila El Rassi, G., 33Davis, A.J., 13Davis, K., 21Degeer, S.L., 7, 10Dhuyvetter, D., 43Dillard, S.L., 44DiLorenzo, N., 21Dokes, T., 6Donaldson, J.R., 55, 58, 59Drewnoski, M.E., 47Duarte Lopes Souza, A.R., 36Duckett, S.K., 45, 50
eEngland, E.M., 15Estienne, M.J., 54Etheridge, J.L., 89Eubanks, L., 28, 90Ezequiel, J.M.B., 37, 77
fFlores, R., 2Foote, A.P., 51Foradori, C.D., 1Forbes, D., 34Foster, J., 46Franklin, A.N., 83Freeman, S.R., 40, 47, 78, 89
gGadberry, M.S., 64, 65Gadberry, S., 48Galloway, D. L., 9, 82Garcia, M.D., 21Garcia, M.R., 2, 35Gardiner, M., 63Garrett, C.F., 1, 03Garza, J., 71, 72Gekara, O., 6Gerrard, D.E., 15Gill, C.A., 25Gray, H., 48
Griffing, D., 90Grissett, J., 59Gunter, P., 45Gurung, N., 75
hHafla, A., 34Hallford, D., 24Hallworth, R.S., 41Hankins, S., 88Hansen, G.R., 21, 47, 78Harkins, H.D., 20Harper, A.F., 54Hawley, J., 82Herring, A.D., 25Hersom, M., 29, 79Hicks, J., 52Hill, G.M., 83Hollenbeck, J., 9Homen Junior, A.C., 37Hornsby, J. A., 27, 61, 82Hufstedler, D., 43Hulsman, L.L., 25Huston, C.L., 88
iIngram, S., 87
JJiang, T., 32Johnson, D.D., 28, 29, 30, 31, 90Johnson, J., 34Johnson, T., 9Jury, L.L., 26, 38, 68, 88
KKarisch, B.B., 68, 88Kegley, E. B., 61, 82Keisler, D., 2Key, C.N., 1Kirschten, D.P., 53Kriese-Anderson, L.A., 1Kuhlers, D.L., 20, 70
lLacy, R.C., 66, 83Lalman, D.L., 8, 11, 21Lamb, G.C., 66Lathrop, A., 33Lawhon, S.D., 56, 57Lee, C., 62
40 41
Lehmkuhler, J., 62, 67, 85, 86Lemcke, R.A., 5Lester, T.D., 13Lewis, A.W., 4, 56, 57Lewis, G.S., 53Lindsey, B.R., 13, 24, 27Linneen, S.K., 8Littlejohn, B.P., 4, 56, 57Lopes Do Nascimento, M., 36Luginbuhl, J.-M., 74
mMarks, M.L., 23Martins, P.G., 12, 80Matarneh, S.K., 15Mayo, D.E., 66Mays, A., 18McDaniel, L., 87McLaurin, T.C., 55McMurphy, C.P., 11Meadows, S., 21Mello de Alencar, M., 36Mercer, K.J., 50Miller, J., 14, 71, 72Miller, M., 45Miller, M.C., 49, 50Min, B. R., 75Moon, C., 9Moriel, P., 12, 41, 80Mosjidis, J.A., 14Mourer, G.L., 8, 11Mueller, J.P., 74Mullenix, K., 39Muntifering, R.B., 44
nNadarajah, K., 20, 70Neuendorff, D.A., 4, 56, 57Nichols, B., 87Norris, B.E., 20
oOminski, K., 34Orlik, S., 71, 72Osterhout, A.G., 30, 31Owsley, W.F., 44
PParish, J.A., 38, 68, 88Pavan, E., 45Pazzanese Duarte Lanna, D., 36Penick, M., 70Perkins, S.D., 1, 03Pfalzgraf, K.E., 22Plank, S., 23
Poole, D.H., 47, 78Poore, M., 40, 47, 78, 89Powell, J.G., 13, 21, 24, 27, 61, 82Pratt, S.L., 49, 50Prevatt, J.W., 66Price, D.M., 4, 56, 57Prince, S., 34
rRamirez, M.A., 2, 35Randel, R.D., 4, 56, 57Randolph, J., 86Rankins, Jr, D., 68, 81Reuter, R.R., 43, 60, 84, 87Reynolds, J. L., 24, 61, 82Richards, C.J., 11Richeson, J. T., 61Riggs, P.K., 25Riley, D.G., 21, 25Rittenhouse, M.C., 15Rorie, R.W., 13Rosa, A.N., 36Rosenkrans, Jr., C.F., 22, 24, 27, 18Rosso, C., 45Rowland, D., 39Rumley, E., 16
SSanders, J.O., 25Saturnino Chaves, A., 36Savell, J., 29Sawyer, J.E., 25Scaglia, G., 42Scarpino, F.B.O., 37, 77Schmedt, F., 87Schmidt, T.B., 58, 59Schoenian, S., 70Schrick, F.N., 49, 50Scott, T.L. R., 15Sexten, A.J., 11Shaeffer, A.D., 40, 47, 78, 89Silveira, M., 39Simmons, N.B., 23Smith, T., 21, 23, 26, 38Solaiman, S., 75Sollenberger, L., 39Sparks, J.D., 8, 11Stanko, R.L., 2, 35Starnes, J., 81Stewart, B., 48Stewart, L., 28Stewart, L., 66Stewart, R.L., 68Stone, G.W., 83Strong, C., 28Sullivan, M., 46
tTaha, E., 75Talley, S., 90Terrill, T., 14, 71, 72Teutsch, C.D., 76Thaxton, Y.V., 22Thomas, M.L., 22, 27Thompson, G.L., 20Thrift, T., 29Tigue, D.A., 7, 10Tillman, D.R., 83Tolleson, D., 34Troxel, T.R., 64, 65Tullio, R.R., 36Turner, C.M., 24, 27
uUndi, M., 34
VVaccaro, A., 39Van Cleef, E.H.C.B., 37, 77Vann, R.C., 4, 21, 26, 38, 56, 57Vendramini, J.M., 12, 39, 41, 80
wWachet, C., 15Ward, J.K., 38Weissend, C.J., 44Wells, R.S., 60Welsh, Jr., T.H., 4, 56, 57Whisnant, C.S., 47Whisnant, S., 78Wildeus, S., 69, 76Willard, S.T., 23Wittenberg, K., 34Wood, B.H., 44Wood, C.W., 44Wright, A., 45
XXie, F., 35
yYancey, J.W., 9Yelich, J., 79Young, A., 9
ZZajac, A., 69Zanella, R., 5Zhu, H., 15
42
Key worD inDeXPlease Note: Numbers following a keyword indicate abstract numbers.
AAcute phase protein, 12Adaptation, 79Adipose tissue, 3Alpacas, 67Anaerobic Glycolysis, 15Angus, 63Animal Breeding, 5Animal Science, 17Annual ryegrass, 41Anthelmintic, 60Anthelmintic resistance, 67Artificial insemination, 13
BBalking, 22Beef, 45, 67, 85, 86Beef cattle, 11, 23, 36, 48, 49, 61, 66,
68, 81, 82, 84, 88, 89Beef flavor, 32Beef Palatability, 28, 30, 31Behavior, 22Biodiesel, 37Brahman influenced dam, 63Breed-types, 22Brewers rice, 6Bull Beef, 9By-product feeds, 29By-products, 37, 86
cCalf, 64, 65Calf Growth, 20Calves, 4, 8Cannon bone length, 25Carcass, 84Carcass quality, 6Cattle, 1, 26, 34, 38, 40, 57, 58Citrus pulp, 55Coccidia, 14Color, 7, 9Condensed tannins, 75Copper, 82Corn, 6Corn gluten feed, 76Corn silage, 62Corn supplementation, 45Cow body weight, 20, 48
Cow Efficiency, 20Cows, 8Crossbreeding, 85Culled cows, 29
DDiet, 35, 81Digestibility, 77Dried distillers grains, 79, 82Drought, 62
eEarly weaned calves, 41, 80Educational program, 66Energy source, 59Estrus synchronization, 13Extension, 62, 67, 68, 88Eyelid pigmentation, 21
fFatty acids, 75Fecal egg count, 60Fecal NIRS, 34Feed efficiency, 36Feed intake, 34Feed supplementation, 55Fescue toxicosis, 50Fetal growth, 50Forage, 44, 79Free choice supplementation, 80Frying oil, 77
gGame meat products, 90Gastro-intestinal Parasites, 70Genetic Improvement, 5Genetic markers, 26Genetic Selection Index, 36Genetics, 64Genome-wide association, 25Gilts, 54Glycerin, 86Goat, 73, 74Goats, 70, 72, 75Grain-Fed Beef, 28Grass-Fed Beef, 28Grazing, 74Grazing behavior, 42
Grazing supplement, 43Grind material, 32Ground beef, 7, 10Growing-Finishing pigs, 6Growth, 54, 73, 76Growth performance, 70
hHair coat, 23Hair sheep, 76Hands-on workshop, 89Hay feeding, 11Heat stress, 1Heifer, 24, 35Hereford, 21Horn flies, 18
iImmune, 57Immune response, 27Immunity, 8, 58Implant, 43, 84Injection site, 61Interactive video, 88
lLactic Acid Enhancement, 9Lambs, 14, 71, 72, 77LDHB, 24, 27Legal issues, 16Legume, 45Leptin CL vascularization, 2Lifetime productivity, 53Lipids, 59Littermate, 53Location, 30
mManagement, 65Marbling, 26Meat quality, 90Meat safety, 90Menhaden fish oil, 54Metabolites, 32Microorganisms, 37Milk quality, 18Milk quantity, 18Monensin, 11
42 43
nNEFA, 58Neonatal, 56Neutrophils, 56Nitrogen, 44
oObesity, 3
PPackaging, 7, 10, 31Parasite control, 71, 72Parasites, 67Perennial peanut, 46Performance, 74Performance data, 73pH, 15Phosphorus, 44Pig, 3Pig performance, 6Pine bark, 75Polymorphisms, 27Polyphenol oxidase, 46Postmortem aging, 30, 31Postmortem Metabolism, 15Preference, 40Pregnancy rates, 13Prenatal Stress, 4Probiotics, 55Pubertal status, 24
QQuality Grade, 63Quantitative Genetics, 5
rReplacement heifers, 47, 78Reproduction, 49, 78RFI, 1Rhizoma peanut, 39Rosemary, 33Rumen undegradable protein, 46Ryegrass, 42, 80
SSale barn price, 64, 65Sausages, 33Sensory Evaluation, 10Sericea lespedeza, 14, 71Sheep, 50, 53SNP, 25Steer ryegrass gain, 83Steers, 12Stocker cattle, 43, 60, 68Stockers, 42Stocking density, 38Stocking rate, 48Stockpiled fescue, 47, 78Students, 17Supplementation, 47Survey, 85
tTall Fescue, 49TBARS, 33Teaching, 17Temperament, 4Transportation, 38, 56, 57Transportation shrink, 81Triticale, 41
uUndergraduate education, 16
VVaccination, 12Vaccine efficacy, 61
wWeaning, 35Weanling pigs, 59Website, 66Winter annual legumes, 40
yYouth education, 87