Embed Size (px)
Citation preview

GeoCart’2003 National Cartographic Conference - Proceedings © New Zealand Cartographic Society, 2004
35
Abstraction and Scale in Spatialisation
Sara Irina Fabrikant Department of Geography
University of California Santa Barbara, Santa Barbara CA, United States [email protected]
Abstract Cartographers have recently become involved in extending geographic concepts and cartographic design approaches to the depiction of non-geographic data archives, using so-called spatialised views or information spaces. Spatialisations differ from ordinary data visualisation and geovisualisation in that they may be explored as if they represented spatial information. This short paper highlights abstraction and scale as two important design elements for spatialisation that should be extracted from a design framework for the construction of cartographically sound spatialised displays that is informed by GI Science.
As recent usability studies on spatialised displays suggest, cartographically informed design guidelines enable information designers to not only construct conceptually robust and usable information spaces, but also allow information seekers to more efficiently extract knowledge that is buried in large digital data archives. Keywords: spatialisation – information visualisation – scale – generalisation Introduction Information visualisation (infoviz) has emerged within the human-computer interaction field in the last ten years or so as a visual strategy for navigating, exploring and extracting information from rapidly growing, and often distributed, non-spatial data warehouses (Card et al., 1999). Infoviz is inspired by and, borrows from, methods used by scientific visualisation (sciviz). Sciviz focuses on visual methods to analyze large amounts of numerical data collected at high rates through sensors of all kinds. Its aim is the analysis and monitoring of time-space processes and phenomena in the world, including the Earth’s land surface, oceans and atmosphere (McCormick et al., 1987). On the other hand, infoviz is mainly concerned with multivariate datasets from the anthroposphere. Examples of such multivariate and dynamic data archives are time-sensitive socio-economic databases, such as analog and digital telecommunication flows, business transactions, medical records, or very large structured or unstructured document collections made accessible in abundance by the World Wide Web. The datasets used in infoviz are often non-numerical, and may include unstructured full-text archives (e.g., news reports), semi-structured text collections (e.g., conference abstracts), highly structured text (e.g., metadata records of bibliographic databases), purely graphic content such as image databases (e.g. fMRI scans in medical databases), or mixed formats such as multimedia documents (e.g., DVD collections). Displays generated by Infoviz, also known as spatialised views, often look like cartographic maps. However, the data used to generate these abstract maps do not have inherent spatial properties in a space-time sense, but may benefit from the deployment of space as a metaphor to portray aspects of their internal structure. Looking back at the recent mapping history one is tempted to say we

Sara Irina Fabrikant Abstraction and Scale in Spatialisation
GeoCart’2003 National Cartographic Conference - Proceedings © New Zealand Cartographic Society, 2004
36
have come full circle with infoviz. The use of non-physical (often intangible) data depicted in a Cartesian display space should remind us of the statistical graphics emerging in the early18th century Europe, for example, by William Playfair in Britain, or Baron Dupin and Charles Minard in France. Like infoviz today, the thematic mapping revolution in 19th century Europe was lead by engineers and not cartographers. As Tufte (1983) puts it, Minard’s map of Napoleon’s Russia campaign may very well be the best statistical graphic ever drawn. Visualisation3: Sciviz, Infoviz and Geoviz Two distinctive design strategies can be identified for information visualisations. The first and most important is the use of space and spatial metaphors as a data generalisation and visualisation method to reduce the complexity of knowledge discovery in any given domain. The second strategy is to allow highly interactive viewing of the data spaces by using increasingly sophisticated direct-manipulation graphic user interfaces which allow the navigation and pro-active data exploration of multidimensional data spaces in real-time (Ahlberg and Shneiderman, 1994). Considering the emphasis on spatial representation as an abstraction and visualisation vehicle it is unfortunate that the Cartographic/Geographic Visualisation/GIScience community at large has mostly ignored the developments in information visualisation. Exceptions to this, however, are Kuhn and Blumenthal (1996), Couclelis (1998), Dodge and Kitchin (2000), Skupin and Fabrikant, (2003), Fabrikant and Skupin (in press); just to mention a few GIScientists active in this domain.Only recently has the University Consortium for Geographic Information Science (UCGIS) identified spatialization as one of the future research challenges(Skupin et al., 2003). After an initial phase of graphic ideation (Dent, 1999) and creative exploration of a huge and very diverse set of visual forms information visualisation now seems mature enough for synthesis. It has experimented with 2/3D, immersive, semi-immersive or manipulable data spaces in various contexts on a largely ad hoc basis, and has come to believe that fundamental design issues like symbology, scale, perception and cognition of graphic forms employed in infoviz work need to be examined using a GIScience perspective and a cartographic design approach. The construction of a solid theoretical design framework based on empirical evaluation is also necessary. As argued in this paper a cartographic perspective is well suited to advance such a task, as the formalisation of a visual language for geographic representation based on semiotic and semantic principles is already in place (Bertin, 1967, 1977; MacEachren, 1995). How is spatialisation related to geovisualisation and scientific visualisation? All three data handling approaches are an attempt to deal with the information overload problem. Whereas data for scientific visualisation typically focuses on numerical data sets describing properties of the dynamic physical environment in two and three dimension s (e.g. tornadoes, fluid dynamics, geology and sub-surface mining), geovisualisation is mostly concerned with data on the Earth’s two dimensional curved surface, including the human built environment and physical geographic data. A defining component of data sets used for scivis and geovis is that the first three dimensions are typically reserved for the inherent physical extension of corporeal phenomenon under study, that is, its width, height and depth (scivis), and/or its geographic location on the Earth’s surface (geovis). The order of the assignment is also meaningful. The x-y and z coordinates cannot be switched. However, unlike scivis, geovis is rarely concerned with depicting solid objects volumetrically in true three-dimensional space, although the third dimension is often used for the more flexible display of surface data, additional data variables, minor features such as trees and buildings, or time. By contrast, information visualisation attempts to depict inherently non-spatial and n-dimensional data through spatial metaphors in lower dimensional display space, usually one to three dimensions (while ignoring the 2D curvature of the Earth’s surface). The goal is to derive a humanly perceivable and cognizable information space that reveals new knowledge by condensing the n-

Abstraction and Scale in Spatialisation Sara Irina Fabrikant
GeoCart’2003 National Cartographic Conference - Proceedings © New Zealand Cartographic Society, 2004
37
dimensional dataset onto a graphic output space of appropriate dimensionality. The assignment of a phenomenon’s attributes onto display space dimensions, or the mapping of relationship characteristics between phenomena, is purely arbitrary in an absolute sense and is not representational of real world objects. Figure 1, below, provides an example based on Google’s reporting of related web sites. Here the absolute orientation of the map is not meaningful (in the way that up for North orients a cartographic maps to real space). The axes of the reference frame simply encapsulate the sum of the n-dimensional attribute space that is projected onto them. Still, the emerging pattern, determined by relative distances between, and the relative orientation amongst, the features, becomes meaningful through the interpretation of the revealed proximities between items. In essence, the map becomes the metaphorical window, or the looking glass, for exploration of an abstract information world.
Figure 1. The network map as a visual spatial metaphor for the “what’s related” query feature of the Google web site.
It does this by interpreting the n-dimensional semantic space of inter-connected web sites on the World Wide Web as a node-link network in two dimensions. The derivation of the relative location of the nodes representing web sites is based on content and structural (linkage) information, and nodes that are connected are specifically more related with one another. Applying (Tobler, 1970) ‘First law of Geography’ one would expect that closer nodes be more related than distant ones, but this is not quite the case. In fact the TouchGraph browser used to create the graphic rearranges the links through a spring-node (also known as force-feedback) layout algorithm to rearrange items based on a chosen relatedness measure. With this procedure the more related sites gravitate towards each other, while less related sites are pushed farther apart. However, in parallel with this layout algorithms modify the configuration based on aesthetic criteria, such as evenness of edge links, and minimization of edge crossings to achieve a visually balanced and pleasing layout. These almost diametrically aimed procedures are problematic as our

Sara Irina Fabrikant Abstraction and Scale in Spatialisation
GeoCart’2003 National Cartographic Conference - Proceedings © New Zealand Cartographic Society, 2004
38
own empirical studies suggest that document similarity along links of a network override similarity judgments between documents based on straight-line Euclidean distance. Moreover, the length of the links is linearly associated with similarity strength (Fabrikant et al., 2002). Figure 2 extends the map metaphor in that here the map becomes the interactive user-interface to a meta search engine on the WWW (kartoo.com). The graphics show the query results for a web search on the author’s name. The retrieved results for this are organized semantically and presented to the information seeker as an “isopleth map”, including labelled “information peaks”. In this case the information seeker has selected a peak labelled “information” just West of the centre of the landscape, and the dynamic map has highlighted respective relationships with yellow connecting links. As in Figure 1, the link lengths are not represented consistently within a cognitive framework where similarity and length are directly related, so this too is not an optimal metaphorical mapping.
Figure 2. The spatialised display as a query interface for the WWW. Most spatialisations are not designed by cartographers, or people trained in cartographic design. As a result, key spatial concepts such as metric distance, functional distance, arrangement and scale are not fully exploited. Associated and well-established design practices that include cartographic generalisation, map abstraction and scale, symbolisation are also often under-used. The next sections illustrate ‘cartographic’ work in infoviz with examples, and propose avenues for additional cartographic involvement. Cartographically Informed Spatialisation What are key contributions of GIScience and cartography that may aid in improving infoviz designs? Elsewhere we have proposed a two-stage transformation process informed by cartographic practice, and including semantic generalisation and geometric generalisation (Fabrikant and Buttenfield, 2001); (Fabrikant and Skupin, in press) for designing cognitively adequate spatialisations. Semantic generalisation is concerned with encoding database meaning into appropriate spatial representations for knowledge discovery (e.g., spatial metaphors), whereas geometric generalisation deals with employing adequate visuo-spatial structure to depict this meaning (e.g., space transformations, space types and symbology). In this paper we highlight two concepts in geometric generalisation that need to be considered carefully when designing spatialisations: abstraction and scale.

Abstraction and Scale in Spatialisation Sara Irina Fabrikant
GeoCart’2003 National Cartographic Conference - Proceedings © New Zealand Cartographic Society, 2004
39
Abstraction It is a truism that geographers use a variety of visual forms to depict the world. Visual forms range from the highly realistic and tangible (e.g., aerial photographs) to the more abstract and intangible (e.g., graph). There are a series of tradeoffs inherent to visual forms in general that need to be negotiated when making a specific choice of one.
Figure 3. The relationship of fidelity versus abstraction for the representation of geographic datasets.
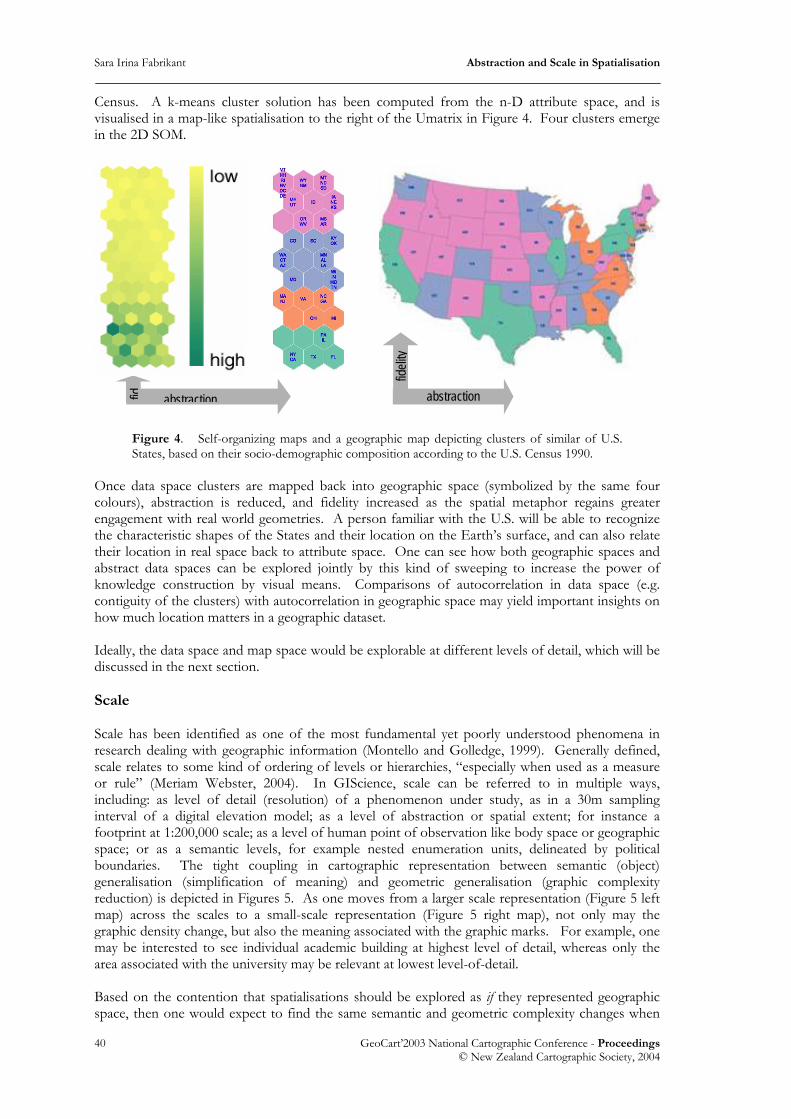
Very realistic representations, such as an aerial photograph (as shown on the left side in Figure 3) are easy to grasp, even by most non-specialist audiences. Realistic images have high fidelity with the real world (through their high recognizability with the real objects), and capitalise on people’s strong visual perception capabilities. Little cognitive effort is needed to make sense of the information presented as the represented item looks like the “real thing”. However, more realistic depictions only work well with tangible things, that is, features that can be perceived in the landscape. As a result they have a narrower, more specific focus. Abstract representations on the other hand require more cognitive effort to be decoded (often with the help of a key or legend of some sort), but are especially powerful in revealing non-tangible or invisible aspects of the environment. An example for this might be depicting names for areas in the landscape, or to designate features that have changed since the last map release. The labels and pink campus buildings shown in the topographic map in Figure 3 illustrate this. The power of abstraction lies in its potential for mobilizing a greater degree of generalisation at the expense of reduced fidelity and a lesser visual authenticity. The use of the knife and fork symbol to represent food outlets along a freeway is a case in point. With abstraction in spatialisation, the fidelity of the data space representation typically ranges from medium to very low, and thus such spaces should be always accompanied with a detailed legend. An example for such a low spatial fidelity/high abstraction combination is given in Figure 4. Here United States census data is depicted on the left side in the form of two diagrams: a self-organizing map (SOM) (Kohonen, 1995) and a dimensionalised map of the attribute space. In this the two display space dimensions are semantically the sum of all 46 attribute dimensions from the U.S. census 1990 projected into a two dimensional space, and the green-to-yellow U-Matrix visualisation on the very left shows the characteristics of the 46-dimensional attribute space. The color gradation from green to yellow illustrates that the bottom third of the space is qualitatively very different than the top third. The higher the numerical values in the variables the darker the green the color in the U-Matrix. The location of 48 U.S. states (conterminous U.S.) in the SOM is based on similarity of their socio-demographic composition, as measured by the U.S.
fidel
ity
abstraction fid
elity
abstraction
Sara Irina Fabrikant Abstraction and Scale in Spatialisation
GeoCart’2003 National Cartographic Conference - Proceedings © New Zealand Cartographic Society, 2004
40
Census. A k-means cluster solution has been computed from the n-D attribute space, and is visualised in a map-like spatialisation to the right of the Umatrix in Figure 4. Four clusters emerge in the 2D SOM.
Figure 4. Self-organizing maps and a geographic map depicting clusters of similar of U.S. States, based on their socio-demographic composition according to the U.S. Census 1990.
Once data space clusters are mapped back into geographic space (symbolized by the same four colours), abstraction is reduced, and fidelity increased as the spatial metaphor regains greater engagement with real world geometries. A person familiar with the U.S. will be able to recognize the characteristic shapes of the States and their location on the Earth’s surface, and can also relate their location in real space back to attribute space. One can see how both geographic spaces and abstract data spaces can be explored jointly by this kind of sweeping to increase the power of knowledge construction by visual means. Comparisons of autocorrelation in data space (e.g. contiguity of the clusters) with autocorrelation in geographic space may yield important insights on how much location matters in a geographic dataset. Ideally, the data space and map space would be explorable at different levels of detail, which will be discussed in the next section. Scale Scale has been identified as one of the most fundamental yet poorly understood phenomena in research dealing with geographic information (Montello and Golledge, 1999). Generally defined, scale relates to some kind of ordering of levels or hierarchies, “especially when used as a measure or rule” (Meriam Webster, 2004). In GIScience, scale can be referred to in multiple ways, including: as level of detail (resolution) of a phenomenon under study, as in a 30m sampling interval of a digital elevation model; as a level of abstraction or spatial extent; for instance a footprint at 1:200,000 scale; as a level of human point of observation like body space or geographic space; or as a semantic levels, for example nested enumeration units, delineated by political boundaries. The tight coupling in cartographic representation between semantic (object) generalisation (simplification of meaning) and geometric generalisation (graphic complexity reduction) is depicted in Figures 5. As one moves from a larger scale representation (Figure 5 left map) across the scales to a small-scale representation (Figure 5 right map), not only may the graphic density change, but also the meaning associated with the graphic marks. For example, one may be interested to see individual academic building at highest level of detail, whereas only the area associated with the university may be relevant at lowest level-of-detail. Based on the contention that spatialisations should be explored as if they represented geographic space, then one would expect to find the same semantic and geometric complexity changes when
abstraction abstraction fid
elity
fid.

Abstraction and Scale in Spatialisation Sara Irina Fabrikant
GeoCart’2003 National Cartographic Conference - Proceedings © New Zealand Cartographic Society, 2004
41
zooming in and out of spatialised views. Figure 6 is an example of this. In this Figure, when zooming into a spatialised Reuters news stories database one may identify six thematic regions at highest level of detail (scale 1:6), whereas only two may be discernible at lowest (most general) level of detail (scale 1:2).
Figure 5. Graphic and Semantic changes of level-of-detail as a function of scale change across standard scales from the topographical map series provided by the U.S. Geological Survey1.
Figure 6. Changing semantic level-of-detail when zooming in and out of a spatialised Reuters news stories database (Fabrikant, 2001).
This kind of scale-dependence experienced in the real world provides information seekers with a frame of reference in the metaphorical world, ranging from an entire collection to the individual information-bearing item (e.g. the book, the video, the news story). As discussed for the network distance above, our empirical experiments have shown that a document’s membership in a topical region alters people’s use of straight-line distance to judge similarity. Items within a region are believed to be more similar than items closer in straight-line distance but in different regions (Fabrikant et al., 2002).
1 The change in spatial resolution from left to right in Figure 5 (e.g., lowest resolution in the image on the far right) is solely an artifact of the low resolution of the images used, and is not relevant for the discussion.
Scale 1:2
Scale 1:6
Scale 1:4
world affairs/politics
middle eastsports
world economy
stock market
technology
Themes at 1:6 scale
EC
ON
OM
Y
PO
LIT
ICS
Sara Irina Fabrikant Abstraction and Scale in Spatialisation
GeoCart’2003 National Cartographic Conference - Proceedings © New Zealand Cartographic Society, 2004
42
Do Scale and Abstraction Work in Spatialisation? The applicability of the scale metaphor in combination with abstraction was investigated empirically in Fabrikant (2001). A spatialised query metaphor, a zoom-in and zoom-out tool, was evaluated to access a spatialised portion of GeoRef, a collection of geology and earth sciences documents. Response times and accuracy of responses of participants using the zoom tools were collected during experiments on querying spatialised views that were very similar to Figure 6. Results indicate that people are indeed able to associate hierarchical document relationships in a collection with the cartographically enhanced spatialised metaphor of scale change (zooms). An important finding is that regardless of participants’ backgrounds, the tested metaphor seems to yield similar responses. The series of empirical findings on the distance-similarity metaphor regarding point, network, region displays and the scale-change tool, have led us to formulate a basic principle we call “the first law of cognitive geography” (Montello et al., 2003) by analogy to the well-known First Law of Geography (Tobler, 1970). The cognitive law embodies the basic idea that people believe closer things to be more similar than distant things. A major concern in our empirical spatialisation research agenda has subsequently been to assess how the first law of cognitive geography applies to spatialised displays; Specifically, how are closer features on information displays (points, lines, areas, complex objects) perceived or conceived to be more or less similar in two and three dimensional spaces? Summary and Prospects This paper highlights the applicability of two key concepts in geography, abstraction and scale, to the design of cognitively adequate spatialised views. In related work we have identified three design areas, based on empirical findings, in which abstraction and scale need to be considered as well for the construction of spatialised views: the visuo-spatial structure employed to represent the world of information; the representation of meaning encapsulated in the database for knowledge discovery; and finally the potential experiential effects spatialised views have on information seekers when exploring semantic spaces to satisfy a particular information need (Fabrikant and Buttenfield, 2001, Fabrikant and Skupin, in press). A theoretically sound representational framework of spatialisation grounded on ontological and semantic principles can, once established, arguably also be transferred to the explicit geographic domain as a basis to reduce current limitations of how geographic space is represented within GISystems. Acknowledgments A world of thanks go to Igor Drecki and Pip Forer for providing me with the wonderful opportunity to share my research ideas with New Zealand’s cartographic community at the GeoCart’ 2003 conference. This paper would never have materialized without Igor’s patience, kind persistence and good humour! I would also like to thank the reviewers for their detailed and thoughtful feedback. which have substantially improved the quality of the paper. The remaining errors, of course, are only mine. References
Ahlberg C and B Shneiderman, 1994, Visual Information Seeking: Tight Coupling of Dynamic Query Filters with Starfield Displays, Proceedings, CHI '94, Conference on Human Factors in Computing Systems, Boston, MA, April, 24-28, 1994, 313-321.
Bertin J, 1967, Sémiologie Graphique: Les Diagrammes – les Réseaux – les Cartes, Mouton, Paris.
Abstraction and Scale in Spatialisation Sara Irina Fabrikant
GeoCart’2003 National Cartographic Conference - Proceedings © New Zealand Cartographic Society, 2004
43
Bertin J, 1977, La Graphique et le Traitement Graphique de l' Information, Flammarion, Paris.
Card SK, JD Mackinlay and B Shneiderman, 1999, Readings in Information Visualization. Using Vision to Think, Morgan Kaufmann, San Francisco, CA.
Couclelis H, 1998, Worlds of Information: The Geographic Metaphor in the Visualization of Complex Information, Cartography and Geographic Information Systems, 25 (4), 209-220.
Dent BD, 1999, Cartography. Thematic Map Design, Wm C Brown, Dubuque, IA.
Dodge M and R Kitchin, 2000, Mapping Cyberspace, Routledge, London, U.K.
Fabrikant SI, 2001, Evaluating the Usability of the Scale Metaphor for Querying Semantic Spaces, in: Montello DR (ed), Spatial Information Theory. Foundations of Geographic Information Science, Lecture Notes in Computer Science 2205, Springer, Berlin, Germany, 156-172.
Fabrikant SI and BP Buttenfield, 2001, Formalizing Semantic Spaces For Information Access, Annals of the Association of American Geographers, 91 (2), 263-280.
Fabrikant SI., M Ruocco, R Middleton, DR Montello and C Jörgensen, 2002, The First Law of Cognitive Geography: Distance and Similarity in Semantic Space, Proceedings, GIScience 2002, Boulder, CO, 31-33.
Fabrikant SI and A Skupin, in press, Cognitively Plausible Information Visualization, In: Dykes J, AM MacEachren and M-J Kraak (eds), Exploring geoVisualization, Elsevier, Amsterdam, The Netherlands.
Kohonen T, 1995, Self-Organizing Maps, Springer, Berlin, Germany.
Kuhn W and B Blumenthal, 1996, Spatialization: Spatial Metaphors for User Interfaces, Department of Geoinformation, Technical University of Vienna, Vienna.
MacEachren AM, 1995, How Maps Work. Representation, Visualization, and Design, Guilford Press, New York, NY.
McCormick BH, TA DeFanti and MD Brown, 1987, Visualization in Scientific Computing, ACM SIGGRAPH Computer Graphics, 21 (6).
Montello DR., SI Fabrikant, M Ruocco and R Middleton, 2003, Spatialization: Testing the First Law of Cognitive Geography on Point-Spatialization Displays. In: Kuhn W, MF Worboys and S Timpf (eds), Spatial Information Theory: Foundations of Geographic Information Science, Conference on Spatial Information Theory (COSIT) 2003, Lecture Notes in Computer Science, Springer Verlag, Berlin, Germany, 335-351.
Montello DR and RG Golledge, 1999, Scale and Detail in the Cognition of Geographic Information, Varenius Project Report, Specialist Meeting, Santa Barbara, CA, National Center of Geographic Information and Analysis (NCGIA), May 14-16, 1998.
Skupin A, SI Fabrikant and H Couclelis, 2003, Spatialization: Spatial Metaphors and Methods for Handling Non-Spatial Data, UCGIS Research Priority 2002, http://www.ucgis4.org/ priorities/research/2002researchPDF/shortterm/p_spatialization.pdf (accessed June 2004).
Skupin A and SI Fabrikant, 2003, Spatialization Methods: A Cartographic Research Agenda for Non-Geographic Information Visualization, Cartography and Geographic Information Science, 30 (2), 95-119.
Tobler WR, 1970, A Computer Movie Simulating Urban Growth in the Detroit Region, Economic Geography, 46 (2), 234-240.
Tufte E, 1983, The Visual Display of Quantitative Information, Graphics Press, Cheshire, Connecticut.