Embed Size (px)
Citation preview
Evaluation of the Marine Debris Tracker App on the U.S. West CoastCourtney Hann
West Coast Marine Debris Alliance Intern30th March 2017
ABSTRACTCombating a large spatial and temporal scale issue, such as the accumulation of marine
debris in our oceans, requires immense data collection and collaboration. The Marine Debris Tracker project utilizes a mobile application, harnessing the potential of volunteers to record marine debris data. The aim of the app is to acquire data on marine debris composition, location, and quantity to assist in defining the problem, advocate for new policy, and come up with novel solutions to reduce the negative impacts and sources of marine debris. This project recruited 25 volunteers from Washington, Oregon, and California to test the Marine Debris Tracker App and provide feedback through an online survey and interviews. Results suggest that volunteers enjoyed using the app, found it easy to use, felt their data collection was worthwhile, and would recommend it to others. At the same time, they critiqued specific components of the project and needed more direction on how to use the app and complete a marine debris survey. Volunteers were also interested in knowing how the data would be used and the importance of recording specific details. Improved connectivity between the MDT App, the MDT website, NOAA, and the Marine Debris Alliance will increase user access to project information and understanding. In sum, this study recommends implementing several revisions to the app, developing a tutorial video to explain how to use the app, and posting more west coast specific articles on how the data is being used.
1

TABLE OF CONTENTS PageABSTRACT............................................................................................................................................................... 1INTRODUCTION..................................................................................................................................................... 4METHODS................................................................................................................................................................ 5
MILESTONE 1.............................................................................................................................................................................. 5MILESTONE 2.............................................................................................................................................................................. 5MILESTONE 3.............................................................................................................................................................................. 6
RESULTS.................................................................................................................................................................. 6SURVEY......................................................................................................................................................................................... 6
Table 1: Table of emails sent, outreach material sent, number of testers, and the response rate....................................7Table 2: Table of various groups interested in the MDT App and those who participated..................................................7Table 3: Number of testers and interviewed testers (in parentheses) who have filled out a marine debris card zero times, 1-5 times, and more than 5 times. Totals for each state and data card categories are also presented...8Table 4: Breakdown of testers who collected marine debris on their own and with an organized beach cleanup.. 8Table 5: Tester ranking of various statements regarding how the MDT App data will be used........................................9Table 6: Number and percent of testers who agreed to various statements about the MDT App.................................10Figure 1: Number of testers who would choose not to use the MDT App for various reasons........................................10Table 7: Number of testers who would choose not to use the MDT App for various reasons that they wrote-in the “other” option, as well as quotations from their survey responses.............................................................................................10Figure 2: Testers ranking of various components of the MDT App, ranging from difficult/unsatisfactory components to easy/very satisfying components. A rating of “No Opinion/ NA” means that the testers either did not use that component (downloading data, viewing data on the MDT website) or had no opinion about it..........11Table 8: Testers responses to Question 19 regarding what they would change about the app, found unclear, or would add............................................................................................................................................................................................................. 12Figure 3: Image of A) the start page with various Marine Debris Items lists, B) the recording page where users use the (+) and (–) buttons to enter the number of items, and C) the final data submission page................................13Table 9: Testers responses to Question 20: What did you like about the Marine Debris Tracker app?......................13
FOLLOW UP INTERVIEWS....................................................................................................................................................... 14Figure 4: Four major themes drawn from the interviews, along with specific codes/categories present within each major theme.............................................................................................................................................................................................. 14Table 10: Specific codes within the “Overall Views” theme and their frequency (repetition within the interviews) for each specific code....................................................................................................................................................................................... 15Table 11: Specific codes within the “MDT App Components” theme and their frequency................................................15Table 12: Specific codes within the “Deterrents to Using the App” theme and their frequency (repetition within the interviews) for each specific code......................................................................................................................................................16Table 13: Specific codes within the “Suggested Additions” theme and their frequency (repetition within the interviews) for each specific code..............................................................................................................................................................16
DISCUSSION.......................................................................................................................................................... 17RECRUITMENT..........................................................................................................................................................................17OVERALL EXPERIENCE.............................................................................................................................................................17MDT APP CRITIQUE AND SUGGESTED REVISIONS..............................................................................................................18
Navigation of the MDT App........................................................................................................................................... 18Recording marine debris data..................................................................................................................................... 19Submitting data.................................................................................................................................................................. 19
SUGGESTED ADDITIONS TO THE MDT APP.........................................................................................................................19NEXT STEPS............................................................................................................................................................................... 20
CONCLUSION........................................................................................................................................................ 20LITERATURE CITED........................................................................................................................................... 20APPENDIX............................................................................................................................................................. 23
APPENDIX A: EMAILS..........................................................................................................................................................23APPENDIX B: TESTERS FLIER............................................................................................................................................25APPENDIX C: MARINE DEBRIS TRACKER APP SURVEY................................................................................................28
Introduction......................................................................................................................................................................... 28Questions............................................................................................................................................................................... 28
APPENDIX D: FINAL SUMMARY OF THE REPORT SENT TO ALL TESTERS WITH A THANK YOU EMAIL...................35
2

INTRODUCTIONCitizen science represents an emerging field in which volunteers, called citizen scientists,
help researchers collect, process, and analyze scientific data (Hames et al. 2002; Cooper et al. 2006). The past decade has seen an expansion of citizen science projects (Silvertown 2009; Conrad and Hilchey 2011; Thiel et al. 2014), with future projections focused on using technology-based platforms such as mobile apps (Newman et al. 2012).
Citizen science projects can provide a vast array of benefits, ranging from traditional research and knowledge gain to social and educational remunerations. Citizen science projects provide a low cost method for gathering data over a large geographic area (Goffredo et al. 2010; Raddick et al. 2009). All together, participating volunteers contribute more data than scientists could feasibly achieve given average budget and time (Goffredo et al, 2010; Hochachka et al. 2012; Kelling et al. 2013; Paul et al. 2014). Government organizations and NGOs are also using citizen science data for estimating species occurrences on both public and private landholdings, as well as completing environmental impact statements (Sullivan et al. 2014). Furthermore, public engagement has been deemed necessary for connecting the public to scientific governance (Stilgoe et al. 2014). Overall, citizen science represents a unique method for gathering data across large spatial and temporal scales, and has been shown to facilitate increase in content knowledge and an opportunity for changes in attitude towards science and the environment (Conrad and Hilchey 2011; Crall et al. 2012; Raddick et al. 2009).
Undoubtedly, citizen science projects can have immense potential and contribution to combating large-scale problems, such as marine debris pollution. With an estimated 4.8 to 12.7 million metric tons of plastic entering the ocean per year (Jambeck 2015), strategies for removing and finding the sources of marine debris can seem daunting. Understanding the scope of economic and ecological impacts of marine debris, as well as coming up with novel and effective methods for removing marine debris requires an immense amount of data (Browne et al. 2015; Hardesty et al. 2015; Jambeck 2015). Embracing citizen science volunteers may be the key to collecting enough data. Currently, there are two main citizen science mobile applications in the United States, the Marine Debris Tracker App and the Ocean Conservancy’s Clean Swell App. These apps provide a standardized mobile platform for volunteers to record information about the marine debris they remove from coastal, lake, and river shorelines.
This study evaluates the Marine Debris Tracker (MDT) App. The MDT App was created in 2011 under a grant from NOAA Marine Debris Program (MDP) and in partnership with the College of Engineering at the University of Georgia. The free app, available for both iPhone and Android platforms, enables citizen scientists to record the location, identity, and number of marine debris items removed along ocean, river, and lake edges. The app also allows users to download, analyze, and map the data, while providing users with additional information and mapping capabilities on the MDT website (www.marinedebris.engr.uga.edu).
After being launched, the MDT App was adopted and used the most on the east coast. Therefore, the aim of this study was to recruit west coast (Washington, Oregon, and California) MDT App users, evaluate their experience with an online survey and follow up interviews, analyze the results, and present the information in a final report. This analysis and recruitment of west coast MDT users is a project of the West Coast Marine Debris Alliance sponsored by the National Marine Sanctuary Foundation and the NOAA Marine Debris Program.
3
METHODSThe project took place from September 16th 2016 to March 31st 2017, and can be divided
into three project milestones: 1) developing recruitment material, informational flier, and online survey; 2) recruiting testers from each state and completing follow up interviews; and 3) analyzing survey and interview results, writing up a final report, and sending out thank you notes. Throughout this report, a tester is defined as a volunteer who used the MDT App and completed the online survey.
Milestone 1The first milestone took place from September 16th to November 7th 2016. Tasks
completed included developing recruitment material and emails (Appendix A), creating a MDT recruitment and information flier (Appendix B), and developing an online survey (Appendix C). The recruitment materials were designed to fit a broad range of audiences, from beach cleanup leaders to environmental nonprofits. The MDT flier focused on why people should use the MDT App, what this project is about, and a step-by-step guide on how to participate in the project.
The survey was developed to evaluate the user experience, demographics, what they liked and disliked about the app, and suggestions for improving the app. The electronic survey was administered online using Survey Planet software. Following Dillman (2007), several steps were taken to maximize effectiveness of the online survey. For instance, a welcome screen provided information about the questionnaire and directions for how to proceed. Instructions on how to respond were also included for each question. In addition, the survey was pre-tested and edited by MDT developer Dr. Jenna Jambeck and the West Coast Marine Debris Alliance team. Feedback from this initial review was incorporated to make the questionnaire as understandable and user-friendly as possible.
Milestone 2The second milestone took place from November 8th 2016 to February 17th 2017. This
milestone focused on recruiting MDT App testers, following up with testers for completing the online survey, and conducting follow up interviews.
Both purposeful sampling and opportunity sampling were employed. Emails were sent out to pre-existing contacts, and to opportunistic contacts that were provided throughout the recruitment period. If a contact expressed interest, they were sent more information and asked to send a recruitment flier and email to their organization’s volunteer or employee contact list, and post a link to the project on Facebook, Twitter, and their newsletter if appropriate. Targeted recruitment groups included Universities, government (NOAA, EPA), state (State Parks, Fish and Wildlife), and tribal organizations, non-profits, beach cleanup specific organizations (Surfrider, SOLVE), local community groups, coastal ports, and coastal community centers.
While a majority of these recruitment emails were sent in November and December, recruitment and new contacts continued into the months of January and February. Phone calls were conducted when appropriate and to assist in project clarification. Follow up emails were sent to remind interested participants to complete the online survey and to inquire about a follow up interview. This resulted in 25 participants who completed the online survey, of which more than 65% were recruited via opportunity sampling (through volunteer list serve emails, Facebook posts, newsletter posts, word of mouth, etc.). The remaining 35% were directly contacted with the initial 260 emails.
In addition, 14 testers completed interviews. These twenty to sixty minute semi-structured interviews were completed by phone and primarily took place in January and February
4

2017, with one interview conducted on November 14th, 2016. Interviews began with broad questions regarding the testers’ experience using the MDT App. More detailed questions, or clarifications, were derived from the individual’s survey results. Furthermore, based on guidance from the MDT team, each interviewee was asked if providing information on how the MDT App data was being used would influence their motivation to participate.
Milestone 3The third milestone took place from February 18th 2016 to March 31st 2017. This
milestone focused on analyzing the survey results, interview notes, writing a final report, and sending out “thank you” notes to all testers.
All quantitative survey data was analyzed using Excel and the software package R (R Core Team 2015). Evaluation of the two written response survey questions and interviews were analyzed using a thematic analysis (Braun and Clarke 2006). This involved coding the survey question responses and interview notes in a consistent way, and subsequently grouping these codes into themes. Themes were inter-related and combined to elaborate on the survey questionnaire.
The “thank you” notes were completed and sent to participants the week of March 27th to the 31st. The rest of the report will focus on results from the survey and interviews.
RESULTS
SurveyFrom November 8th 2016 to February 17th 2017, 25 testers from Washington, Oregon, and
California used the Marine Debris Tracker App and completed an online survey about their experience. Three surveys that were taken were discarded because one tester was from Tonga, one survey was a duplicate, and the third tester had never used the MDT App. Around 63% of testers used the iPhone version, while the remaining used an Android version of the app. All testers were new to using the MDT App, while two had used the Clean Swell App prior to participating.
Recruitment of the MDT App testers was primarily done by email, and with the occasional phone call. Altogether, 260 recruitment emails were sent out, recruiting 11 testers from Washington, 7 from Oregon, and 7 from California equating to an average response rate of 10% (Table 1). Interested participants, of which not all took the survey, worked or were associated with State, Federal, tribal, naturalist-based, aquarium, beach cleanup specific, University, and non-profit organizations, with several individuals from Surfrider Foundation or none of the above (Table 1). Ultimately, a majority of testers were recruited either by email (43.3%) or through a colleague/friend (40%). Testers also learned about the project through volunteer newsletters, beach naturalist programs, a marine debris course, the Marine Debris Alliance, and Facebook.
Specific organizations that requested recruitment emails and the MDT App flier included Quinault Indian Nation, Washington Department of Fish and Wildlife, Stillaguamish Tribe, Washington Department of Natural Resources, CoastSavers, Washington Department of Ecology, Surfrider Foundation, Orca Islands teachers, Marine Resource Committees, Olympic Coast National Marine Sanctuary, Port Townsend Marine Science Center, The Pacific Coast Shellfish Growers, Fiero Marine Life Center (Port Angeles, WA), Great Peninsula Land Trust, San Juan Preservation Trust, North Olympic Salmon Coalition, Oregon Parks and Recreation
5

Department, Oregon Fish and Wildlife Department, SOLVE Beach Cleanups, OSU Marine Team, OSU’s The Coastal Society, I Love a Clean San Diego, Heal the Bay, Save the Bay, The Clean Oceans Project, Monterey Bay Aquarium, Yuba River Waterkeeper, San Luis Obispo Coastkeeper, and San Diego Coastkeeper. Fewer organizations requested Facebook, twitter, or website postings (Table 1). These organizations included the Marine Debris Tracker App website, Container Recycling Institute, SOLVE Oregon Beach Cleanups, OSU Marine Team, Washington Marine Resource Committees, Port Townsend Marine Science Center, The Pacific Coast Shellfish Growers, Fiero Marine Life Center, San Luis Obispo Coastkeeper, and San Diego Coastkeeper.
Initial emails sent
Recruitment emails and fliers sent
Facebook and Twitter posts sent
Newsletter posts sent
Number of testers
Response rate
Washington 136 17 4 2 11 8%
Oregon 42 6 2 0 7 17%
California 76 11 2 1 7 9%
National 6 1 2 1
Total 260 35 10 4 25 10%
Table 1: Table of initial emails sent, various outreach material sent, the number of testers who participated, and the overall response rate.
Group Represented Washington Oregon California
State government X X (tester)
Federal government X (tester)
Tribes X (tester)
Naturalist group X (tester) X (tester) X
Surfrider Foundation X X (tester) X (tester)
Aquarium X X (tester)
Beach cleanup specific organization X (tester) X (tester) X (tester)
University X (tester) X
Non-profit X (tester) X X (tester)
Independent X (tester) X (tester) X (tester)
Table 2: Table of various groups that requested further information about the MDT App project and those who actually took the survey (in parentheses), divided by each state.
6

As requested by the project description, at least two testers were recruited from each state who had never filled out a marine debris card, who had filled it out a few times (less than 5), and who had filled it out relatively frequently (more than 5 times). This resulted in an approximately even distribution of user types, with 8 west coast testers having never used a marine debris card, 9 having used one less than 5 times, and 8 having used one more than 5 times (Table 2). In addition, the interviewees included people from all three categories from each state, representing all user groups evenly (Table 2).
Number of testers who have filled out a marine debris data card
and (completed a follow up interview) for each category
Never 1-5 times More than 5 times Total
Washington 4 (1) 5 (3) 2 (1) 11 testers, 5 interviews
Oregon 2 (1) 2 (2) 3 (2) 7 testers, 5 interviews
California 2(1) 2 (2) 3 (1) 7 testers, 4 interviews
Total 8 (3) 9 (7) 8 (4) 25 testers, 14 interviews
Table 3: Number of testers and interviewed testers (in parentheses) who have filled out a marine debris card zero times, 1-5 times, and more than 5 times. Totals for each state and data card categories are also presented.
Every tester had previously collected marine debris either individually or with an organized beach cleanup. In sum, 56% of the testers (13 people) had collected marine debris on their own more than 20 times, while another 32% (9 people) had collected marine debris 6-20 times on their own (Table 4). In comparison, 44% of testers (12 people) had participated in an organized beach cleanup 1 to 5 times, while only 20% (5 people) had participated 6 to 20 times and more than 20 times (Table 4).
Number of testers who have collected marine debris on their
own and (with a organized beach cleanup) for each category
0 times 1-5 times 6 – 20 times More than 20 times
Washington 1 (2) 1 (7) 3 (1) 6 (1)
Oregon 0 (1) 0 (3) 2 (1) 5 (2)
California 0 (0) 1 (2) 4 (3) 2 (2)
Total 1 (3) 2 (12) 9 (5) 13 (5)
Table 4: Number of testers who have collected marine debris on their own and with an organized beach cleanup (in parentheses) zero times, 1-5 times, 6-10 times, and more than 20 times.
7
On average, people recorded 78.32 + 39.92% of the trash they picked up while using the MDT App. Testers were interested in how this data would be used. They ranked all statements about data usage as somewhat compelling (4) to very compelling (5) in motivating them to collect and report marine debris data (Table 5).
Statement
Mean ranking + Std Dev. (4 = somewhat compelling, 5 = very compelling)
Knowing the types of debris present helps us to identify targets for prevention.
4.83 + 0.39
We need data on debris in the environment to better understand the impacts on marine life.
4.78 + 0.42
Your data feeds into a larger assessment of marine debris on U.S. shorelines.
4.52 + 0.59
Identifying differences in debris loads helps agencies to allocate resources.
4.30 + 0.82
We need data to identify the most common litter and their potential sources (ex/ cigarette butts).
4.39 + 1.20
We need data to more accurately build models that identify marine debris hotspots and predict future trends.
4.39 + 0.94
Your data can help you track how litter on your beach changes over time.
4.35 + 1.07
Table 5: Tester ranking of various statements regarding how the MDT App data will be used, ranging from somewhat compelling (4) to very compelling (5).
Overall, a majority of testers enjoyed using the MDT App and would choose it over another method of data recording (Table 6). For instance, 76% of testers enjoyed using the MDT App, 80% believed their effort was worth it for the data, 84% would recommend the MDT App, and 72% felt that the app was not too time consuming (Table 6).
The top reasons people would choose not to use the MDT App were due to poor weather, multi-tasking, or “other”, followed by a technology problem or no cell service (Figure 1). Reasons listed as “other” included inability for the user to submit data, too time consuming to record small pieces of trash, high usage of phone’s battery, poor visual presentation, prioritizing other activities at the beach, or forgetfulness (Table 7). The “other” information is presented because these same themes are present throughout the survey and interview results.
Testers’ expected future use of the app was variable. In total, 36% of participants anticipated using the MDT App every time they went to the beach, while 20% projected using the app if it was not raining and 12% would use the app if they were alone. In comparison, 12% anticipated infrequent, or minimal, use of the app. Several testers listed multiple factors for determining their future use rate, including using the app if it was not raining and part of an organized beach cleanup. Another 24% wrote in specific reasons including if they had extra time
8

at the beach, the type of beach cleanup, the involvement of other people, and if they remembered.
Number of participants who agreed to the following statement:
Yes Unsure No
Enjoyed using the MDT App 19 (76%) 6 (24%) 0
Effort was worth it for the data 20 (80%) 4 (16%) 1 (4%)
Would recommend the MDT App 21 (84%) 3 (12%) 1 (4%)
MDT App took too much time 2 (8%) 5 (20%) 18 (72%)
Table 6: Number and percent (in parentheses) of testers who agreed to various statements about the MDT App.
02468
1012
Why the tester would choose not to use the MDT App
Nu
mb
er o
f Peo
ple
Figure 1: Number of testers who would choose not to use the MDT App for various reasons.
Choose not to use the app because:
Frequency
In their own words…
Problems submitting data
3 “I wasn’t sure how to submit the data”; “The data upload was super slow, often failed and chief frustration with my overall user experience”
Technology issue 2 “eats battery life”; “technological problems prevented me from being able to submit any of the information”
Time consuming 3 “takes some time to find the appropriate/matching categories”; “for all the itty bitty pieces of garbage it simply takes too long to record”
Other 5 “It is very wordy”; “currently use the Clean Swell app”; “forgot”; “doing other things on the beach”
9
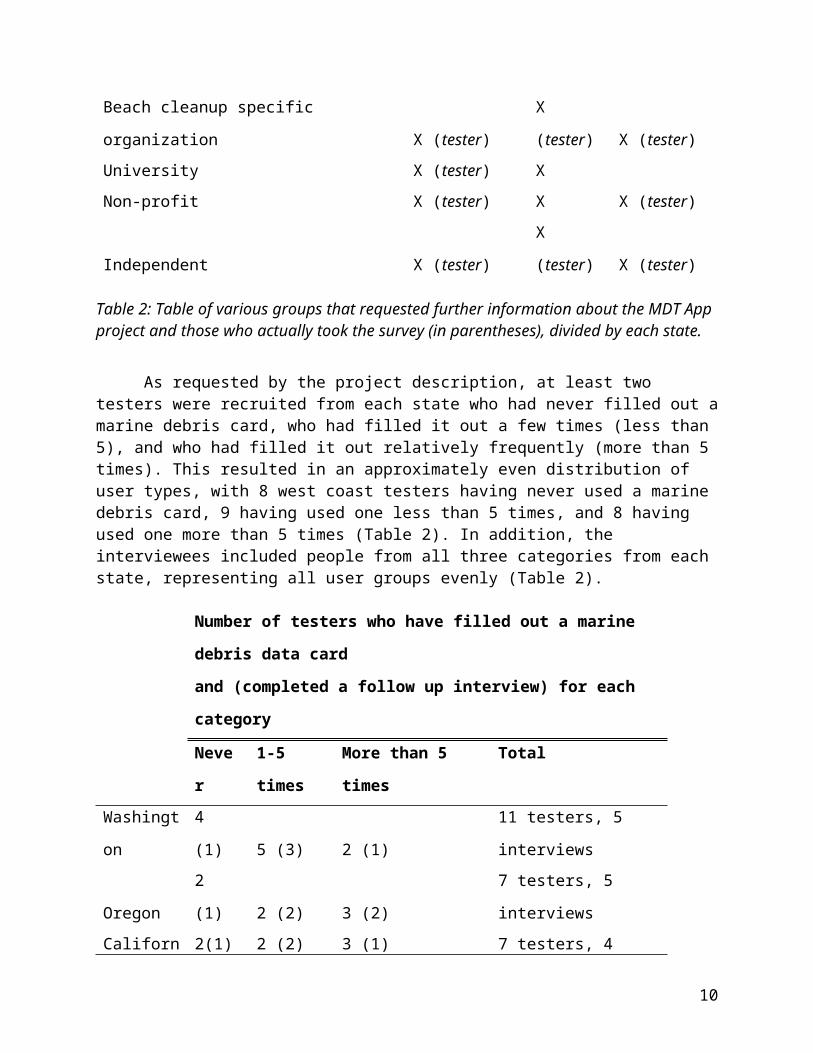
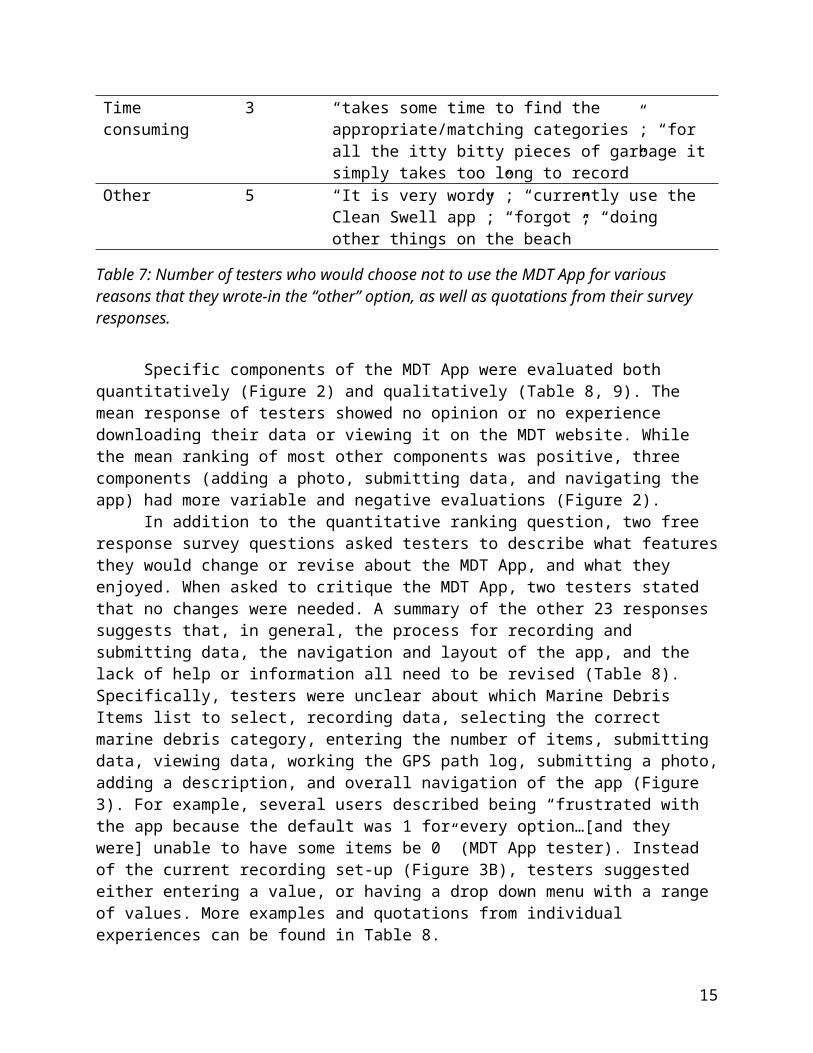
Table 7: Number of testers who would choose not to use the MDT App for various reasons that they wrote-in the “other” option, as well as quotations from their survey responses.
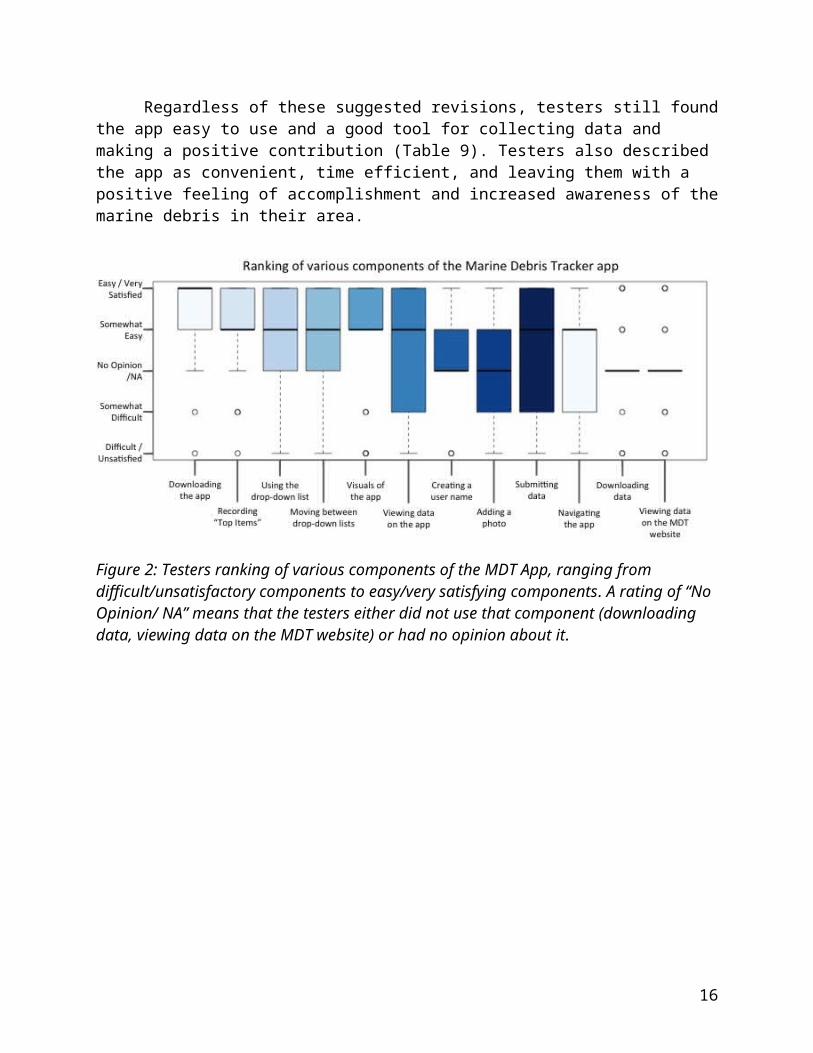
Specific components of the MDT App were evaluated both quantitatively (Figure 2) and qualitatively (Table 8, 9). The mean response of testers showed no opinion or no experience downloading their data or viewing it on the MDT website. While the mean ranking of most other components was positive, three components (adding a photo, submitting data, and navigating the app) had more variable and negative evaluations (Figure 2).
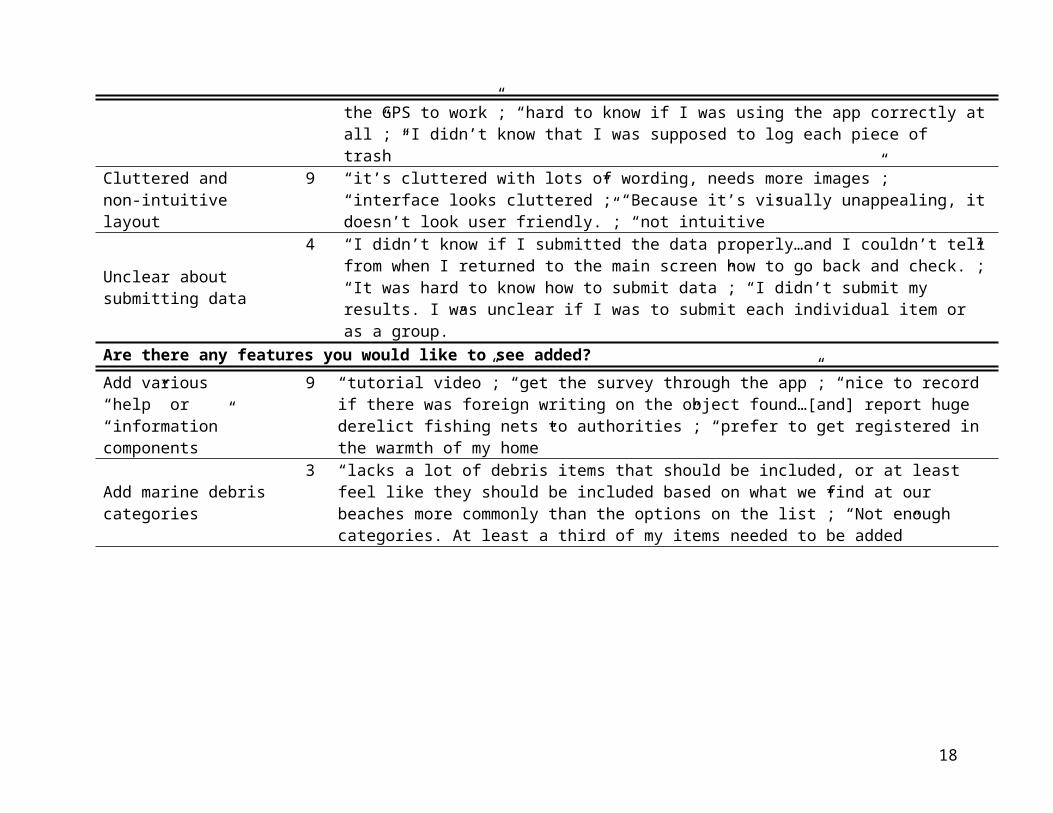
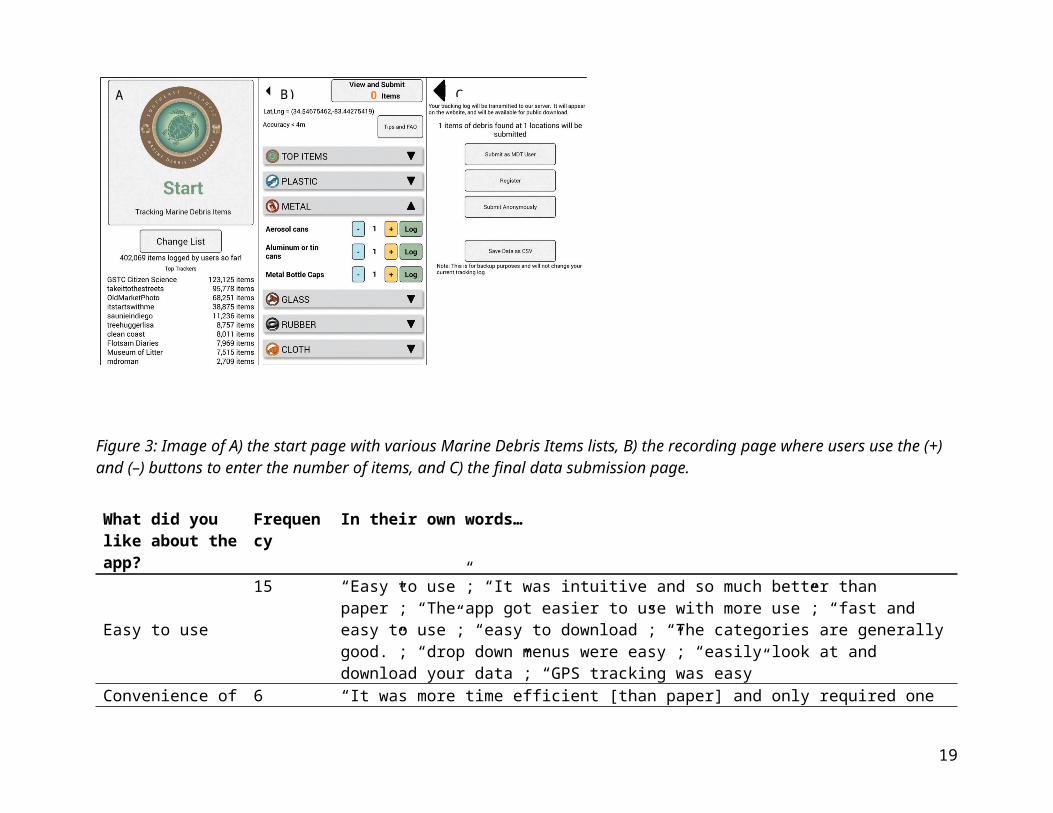
In addition to the quantitative ranking question, two free response survey questions asked testers to describe what features they would change or revise about the MDT App, and what they enjoyed. When asked to critique the MDT App, two testers stated that no changes were needed. A summary of the other 23 responses suggests that, in general, the process for recording and submitting data, the navigation and layout of the app, and the lack of help or information all need to be revised (Table 8). Specifically, testers were unclear about which Marine Debris Items list to select, recording data, selecting the correct marine debris category, entering the number of items, submitting data, viewing data, working the GPS path log, submitting a photo, adding a description, and overall navigation of the app (Figure 3). For example, several users described being “frustrated with the app because the default was 1 for every option…[and they were] unable to have some items be 0” (MDT App tester). Instead of the current recording set-up (Figure 3B), testers suggested either entering a value, or having a drop down menu with a range of values. More examples and quotations from individual experiences can be found in Table 8.
Regardless of these suggested revisions, testers still found the app easy to use and a good tool for collecting data and making a positive contribution (Table 9). Testers also described the app as convenient, time efficient, and leaving them with a positive feeling of accomplishment and increased awareness of the marine debris in their area.
10

Figure 2: Testers ranking of various components of the MDT App, ranging from difficult/unsatisfactory components to easy/very satisfying components. A rating of “No Opinion/ NA” means that the testers either did not use that component (downloading data, viewing data on the MDT website) or had no opinion about it.
11

Table 8: Testers responses to Question 19 regarding what they would change about the app, found unclear, or would add.
Would you change anything about the app?
Frequency In their own words….
Revising how data is recorded
6 “I was frustrated with the app because the default was 1 for every option. I was unable to have some items be 0.”; “I would recommend…to add a total number for an item vs. just adding one by one”; “maybe click estimated range –0-10, 10-20, 20-30 etc?”; “it took several entries for me to figure out 1 was the default”; “It was not clear how to handle ‘piles’.”
App didn’t work4 “A few times it looked like the app stopped tracking when my phone went to sleep”; “when I took a
picture and hit ‘use photo’ the app would close. Same would happen if I entered a description and then ‘enter’.”; “I did not always have a reliable service”
Time consuming 3 “Less components to record data.”; “too many buttons and some of the words don’t even fit in the button space”; “took time to figure out how to navigate”
User privacy 2 “A government app that will access my location when not being used?? Nope.”Were any steps particularly confusing or unclear?
Confusion/ frustration when using the MDT App
15 “sometimes it’s hard to figure out what debris it was before breaking up”; “I was confused….Maybe some more explanation about what the different lists are”; “for the longest time I couldn’t get the GPS to work”; “hard to know if I was using the app correctly at all”; “I didn’t know that I was supposed to log each piece of trash”
Cluttered and non-intuitive layout
9 “it’s cluttered with lots of wording, needs more images”; “interface looks cluttered”; “Because it’s visually unappealing, it doesn’t look user friendly.”; “not intuitive”
Unclear about submitting data
4 “I didn’t know if I submitted the data properly…and I couldn’t tell from when I returned to the main screen how to go back and check.”; “It was hard to know how to submit data”; “I didn’t submit my results. I was unclear if I was to submit each individual item or as a group.”
Are there any features you would like to see added?
Add various “help” or “information” components
9 “tutorial video”; “get the survey through the app”; “nice to record if there was foreign writing on the object found…[and] report huge derelict fishing nets to authorities”; “prefer to get registered in the warmth of my home”
Add marine debris categories
3 “lacks a lot of debris items that should be included, or at least feel like they should be included based on what we find at our beaches more commonly than the options on the list”; “Not enough categories. At least a third of my items needed to be added”
12

Figure 3: Image of A) the start page with various Marine Debris Items lists, B) the recording page where users use the (+) and (–) buttons to enter the number of items, and C) the final data submission page.
What did you like about the app?
Frequency In their own words…
Easy to use
15 “Easy to use”; “It was intuitive and so much better than paper”; “The app got easier to use with more use”; “fast and easy to use”; “easy to download”; “The categories are generally good.”; “drop down menus were easy”; “easily look at and download your data”; “GPS tracking was easy”
Convenience of the MDT App
6 “It was more time efficient [than paper] and only required one hand.”; “It’s right on my phone”; “Automatic GPS coordinates”; “ability to add photos”
Idea of the tool and collecting data
6 “The idea of the tool is great.”; “I also appreciate the usefulness of this app!”; “Data! It’s necessary!”; “I also like participating in citizen science”
Positive feeling and increased awareness
4 “I’ve been picking up trash for years. The app makes me feel like I’m making a difference”; “made me feel as though I was making a positive contribution”; “It made me more aware of the types of debris found”
B) C)A)
13

Table 9: Testers responses to Question 20: What did you like about the Marine Debris Tracker app?
14
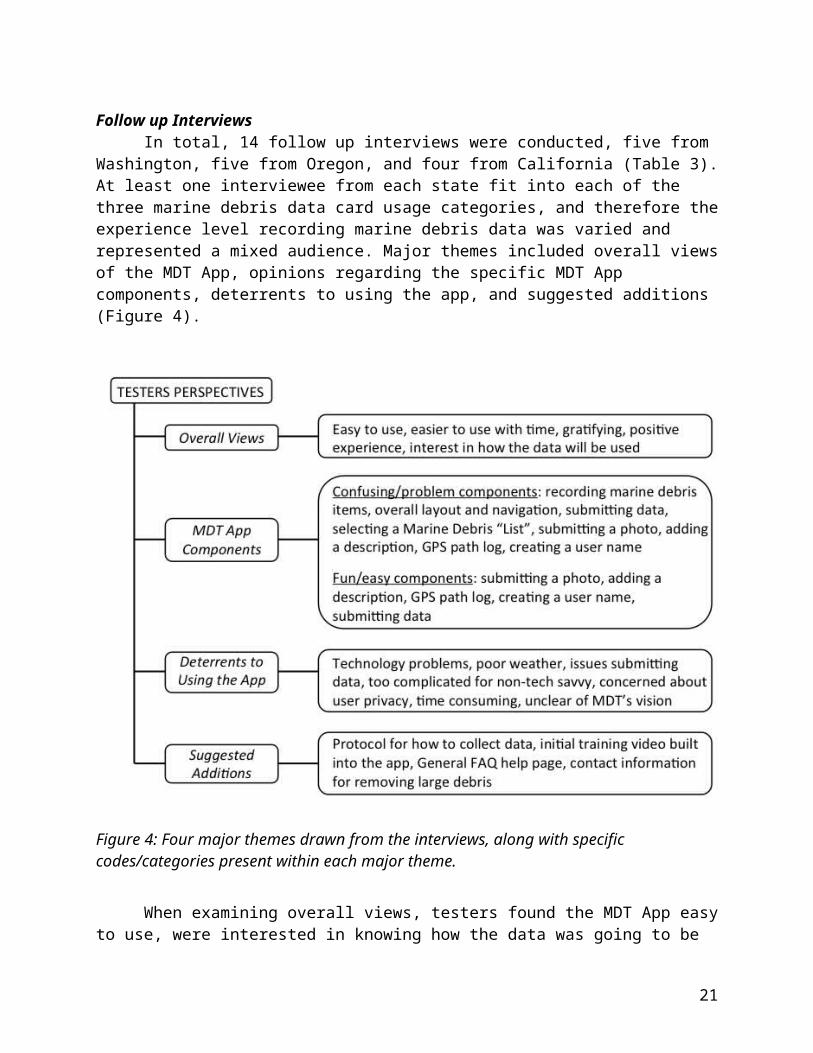
Follow up InterviewsIn total, 14 follow up interviews were conducted, five from Washington, five from
Oregon, and four from California (Table 3). At least one interviewee from each state fit into each of the three marine debris data card usage categories, and therefore the experience level recording marine debris data was varied and represented a mixed audience. Major themes included overall views of the MDT App, opinions regarding the specific MDT App components, deterrents to using the app, and suggested additions (Figure 4).
Figure 4: Four major themes drawn from the interviews, along with specific codes/categories present within each major theme.
When examining overall views, testers found the MDT App easy to use, were interested in knowing how the data was going to be used, and had an overall poistive experience (Table 10). The most frequent comments were on how easy it was to use the app and interest in how the data will be used. In addition, testers also mentioned that the app got easier to use with time, as one interviewee stated:
“I like the mission, and overall the look and drop down menus worked ok. I think using it a few more times and it would be pretty easy to use.” (MDT App interviewee)
15
Testers’ interest in data usage may have, in comparison to the other codes, a higher frequency because participants were directly asked if providing information on how the MDT App data will be used would influence their motivation to participate. Only a small proportion (4 users, or 29% of interviewees) said that it would effect their motivation to participate. Lastly, testers had a positive experience using the MDT App and thought it was a good tool.
Overall Views Frequency
Ease of useEasy to use 18 Easier to use with time 7Easy to use various components of the app 5
Information on how the collected data will be used
Interested in knowing more 13This knowledge would increase their participation
4
Interested in the MDT App Gratifying to use the MDT App 6Good tool for various interest groups 5
Table 10: Specific codes within the “Overall Views” theme and their frequency (repetition within the interviews) for each specific code.
While interviewees found overall participation easy, most testers critiqued at least one component of the MDT App. The top three most frustrating components included recording marine debris items, navigation and layout of the app, and submitting data (Table 11). Other, less notable and more mixed views were noted with regards to adding a description, uploading a photo, using the GPS path log, and creating a user name (Table 11).
MDT App Components Frequency
Recording marine debris items
(–) Confusion recording an item 4(–) Critique on categories 4(–) Unsure which category to use 4(–) Revise entering a value 3
Layout and navigation (–) Cluttered 4(–) Confusing vocabulary 3(–) Non-intuitive navigation 2
Submitting data (–) Confusion or challenges to submitting data 9(+) Easy to submit data 1
Marine Debris Items list(s) (–) Confusion on what the different lists are 4
Adding a description (–) Unclear when to add a description 3(+) Easy to add a description 1
Adding a photo (–) Unclear when/how to add a photo 3(+) Easy to add a photo 2
GPS path log (–) Unclear what it is/how to use it 3(+) Fun to see the GPS path 1
Creating a user name (–) Unclear how to register 3
16

Table 11: Specific codes within the “MDT App Components” theme and their frequency.
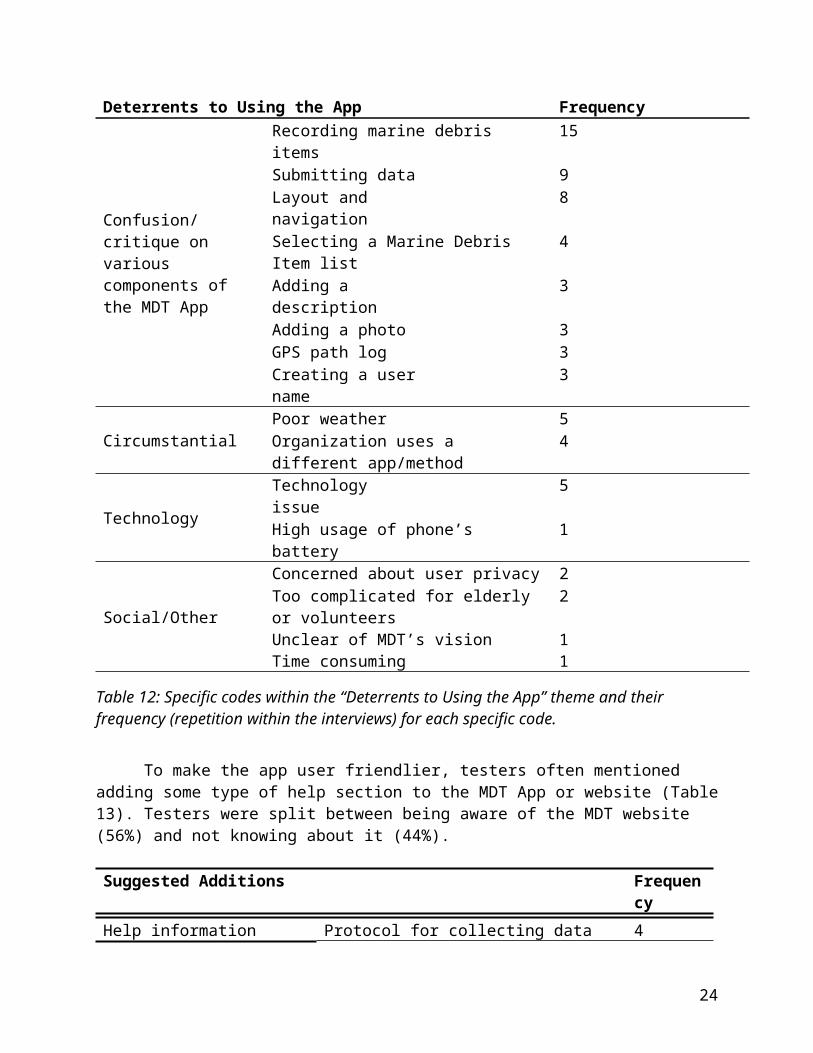
Common deterrents for using the MDT App included confusion with the app itself, circumstantial, technology problems, and social or people-specific concerns (Table 12). Of these, confusion recording marine debris items, submitting data, and the layout and navigation of the app were the most frequently recorded deterrents to successfully using the MDT App.
Deterrents to Using the App Frequency
Confusion/ critique on various components of the MDT App
Recording marine debris items 15Submitting data 9Layout and navigation 8Selecting a Marine Debris Item list 4Adding a description 3Adding a photo 3GPS path log 3Creating a user name 3
Circumstantial Poor weather 5Organization uses a different app/method 4
Technology Technology issue 5High usage of phone’s battery 1
Social/Other
Concerned about user privacy 2Too complicated for elderly or volunteers 2Unclear of MDT’s vision 1Time consuming 1
Table 12: Specific codes within the “Deterrents to Using the App” theme and their frequency (repetition within the interviews) for each specific code.
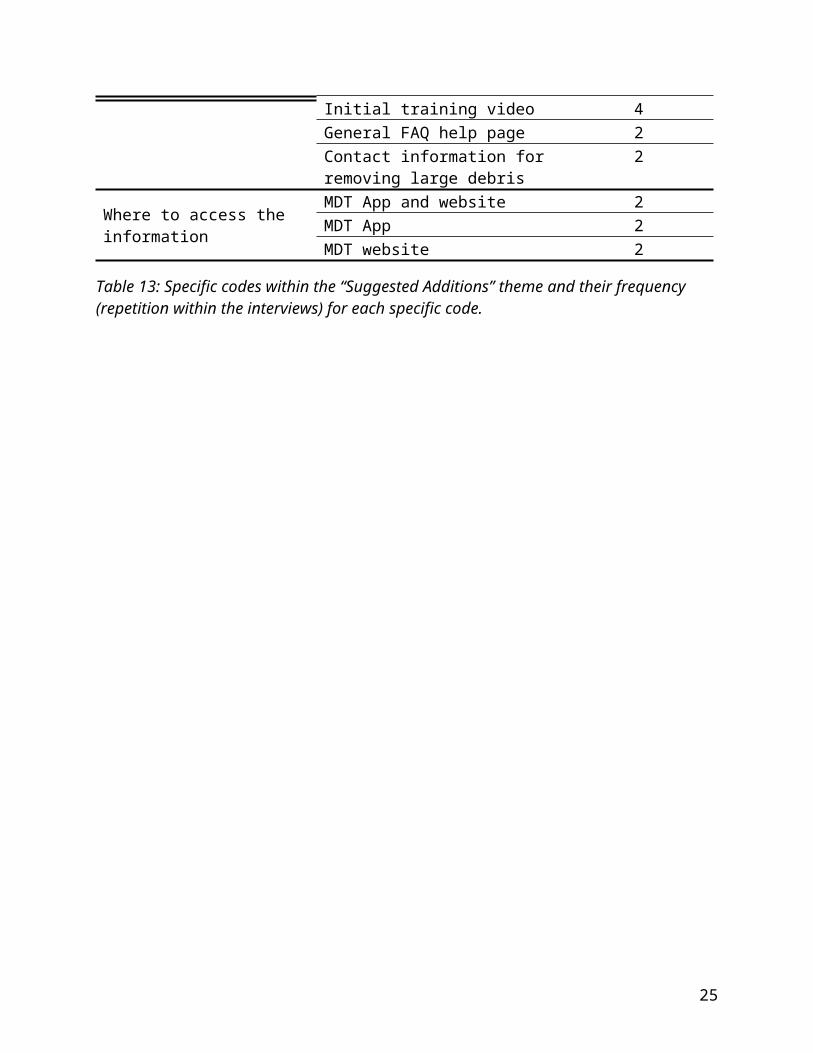
To make the app user friendlier, testers often mentioned adding some type of help section to the MDT App or website (Table 13). Testers were split between being aware of the MDT website (56%) and not knowing about it (44%).
Suggested Additions Frequency
Help information
Protocol for collecting data 4Initial training video 4General FAQ help page 2Contact information for removing large debris 2
Where to access the information
MDT App and website 2MDT App 2MDT website 2
Table 13: Specific codes within the “Suggested Additions” theme and their frequency (repetition within the interviews) for each specific code.
17
18
DISCUSSIONThe purpose of this study was to evaluate west coast opinions of the MDT App to make
the app more accessible, well known, and used on the west coast of the United States. Results suggest that although MDT App users found the app easy to use and would recommend it to others, many encountered challenges and emphasized the need for more instruction.
RecruitmentVolunteers were recruited from a variety of organizations, all of which were
focused on conservation or community volunteering. With an overall 10% response rate via email recruitment, other recruitment methods including in-person recruitment at community events and working directly with beach cleanup organizations will likely build a more solid foundation and network of MDT App users on the west coast. Jennett et al. (2016) found citizen scientists primarily learn about tech-based citizen science projects through science articles, news stories and citizen science portals (e.g. Zooniverse, SciStarter). The MDT App is already on SciStarter and has multiple posts on various websites, science articles, and news stories, yet a majority of people contacted had never heard of the project. Refocusing MDT App publicity on the west coast and to west coast specific websites will likely increase the project’s presence.
Results also suggest that although the recruitment emails (sent directly to testers and indirectly through organizations’ list serves) were primarily responsible for recruiting participants, almost the same percentage of participants were recruited via a colleague or friend. This once again illustrates the importance of spreading the word and making more connections on the west coast to the MDT project. In addition, recruiting during the spring or summer will likely yield a higher response rate, as 7 interested participants never used the MDT App because their winter beach cleanup events got cancelled or were not scheduled until spring. Focusing on broader environmental groups should also be emphasized as local naturalist groups, especially in Oregon and Washington, recruited a surprising number of volunteers and may represent a good area of future focus.
Overall experienceOverwhelmingly, testers found the MDT App easy to use, especially after using it
several times, and would recommend the app to others. Testers enjoyed the convenience of the app, and were enthusiastic about the tool and collecting marine debris data. In addition, participation left users feeling positive about making a contribution and increased awareness of marine debris items found in their local area. As one user stated:
“I’ve been picking up trash for years. The app makes me feel like I’m making a difference.” (MDT App tester, survey response)
Testers were also very interested in how the data collected would be used. This is not surprising, as contributing to useful research is a common motivation for many citizen scientists (Raddick et al. 2010, 2013; Nov, Arazy and Anderson 2010; Curtis 2015; Jennett et al. 2014, 2016; Reed et al. 2013; Geoghegan et al. 2016). While testers were motivated by all “marine debris data usage” statements provided in the survey, less than 30% of interviewees indicated this information would change their motivation levels. Instead, users more frequently
19

emphasized their interest, versus motivation, in knowing how the data would be used. For instance, several interviewees asked about data usage:
“What are you doing with that information? How would you go about addressing that at the source? Are we doing it for NOAA? Well, why is NOAA interested in it and who is Marine
Debris Tracker – are they separate from NOAA or is NOAA buying the product?” (MDT App interviewee)
These results allude to there being both interest and confusion about the MDT App objectives and the likelihood of multiple motivations driving user participation. Geoghegan et al. (2016) emphasizes the importance of good communication and feedback, in the form of email, online maps and graphics, and project reports, in inspiring and retaining participants. A good start towards improving communication with MDT App users would be to keep the MDT, NOAA, and Marine Debris Project websites updated with new information, and linking these posts back to the app for easy use of all platforms. Linking the app to the website is important as the survey indicated that a majority of MDT App testers were unaware of, or had no opinion of, downloading their data or using the MDT website to view data. When the MDT website was brought up in the interviews, half the participants did not know, or forgot, about the MDT website. Increasing connectivity between the MDT App, MDT website, NOAA, Marine Debris Alliance, and overall objectives of the project is imperative for retaining current and future west coast users.
MDT App critique and suggested revisionsEvery component of the MDT App was critiqued. Even the easiest and most
straightforward components, including adding a photo and description, creating a user name, and using the GPS path log led to confusion. Most of this confusion was less about how to use the functions, and more about why you would use them. Especially through the interviews, it was clear that more direction should be provided on how to conduct a marine debris survey, what type of data is the most important to record, and how a photo, description, and GPS path log will be used in data analysis. As one user noted:
“The most frustrating part was figuring out what object this was I was picking up and what category it was in and what details were wanted? I was trying to figure out the bigger picture, taking a photo of every piece of trash doesn’t make sense…maybe the more interesting pieces
are better to take a photo of?” (MDT App interviewee)
More notable areas of hindrance included navigating around the app, recording marine debris items, and submitting data with the MDT App. For these MDT App components, testers knew why collecting and submitting data was important, but had issues on the actual functionality and physical act of completing these actions.
Navigation of the MDT AppNavigation of the MDT App refers to how users moved through the app, as well
as the app’s layout, visual presentation, and overall function. Although testers varied in their opinions on how easy or difficult it was to navigate the MDT App, the app’s navigation and layout was most frequently described as being cluttered, non intuitive, visually unappealing, confusing vocabulary, and having too much wording. When
20
comparing the MDT App to the Clean Swell App, users described the Clean Swell App as more user friendly, simpler, and more visually engaging. Testers suggested adding more photos, reducing the number of buttons involved, and simplifying the layout as ways to improve the overall MDT App navigation.
Recording marine debris dataTesters were unsure of both the methods they should use to record marine debris data, as
well as the physical act of entering the records into the MDT App. With regards to the methods, data collectors were confused about where data should be collected (i.e. the distance from the shoreline, lakefront, riverfront cleanups), what type of data should be collected (i.e. micro plastics, large piles, individual pieces of trash), how to collect the data (i.e. set transects, walking parallel or zig zag to the shoreline, when to start the GPS path log), and what to do if they ran into a problem (i.e. MDT App shut down, GPS path log did not work, who to contact to remove large debris items). In the follow up interviews, testers often noted that just a little bit of guidance, help section, or FAQ section would go a long way in clearing up their concerns. As one interviewee stated:
“I got a sense that we are tracking not just to track, but to figure out what. I don’t know what the what is?” (MDT App interviewee)
Testers also had trouble with actually using the app to record data. For instance, some testers could not find the correct category, were confused by the process of entering the number of trash items, and suggested adding west coast specific categories for items frequently found (crab pots, firecracker pellets, plastic children’s toys). Making the recording process more straight forward (i.e. typing in the number of items versus using the (+) and (–) buttons) and making the “top recorded items” more local for the west coast region would likely combat many of these issues.
Submitting dataConfusion and frustration submitting data was a frequent and key theme. Some
testers found submitting data so time consuming or infeasible that they either gave up or never ended up submitting their recorded marine debris items. Many interviewees asked how they were supposed to know if their data was submitted. This raises a huge concern, as submitting marine debris data is key to the MDT project’s success. As one tester noted:
“The data upload was super slow, often failed and chief frustration with my overall user experience” (MDT App tester, survey response)
Suggested additions to the MDT AppWhile this report highlights several major areas of concern about the MDT App,
many of the testers’ issues can be fixed by adding a help section or app tutorial, and adding marine debris categories specific for the west coast. Testers suggested various ways of how to provide guidance to MDT App users. One commonly repeated suggestion was to create a tutorial video, which can be opened on the app, with a step-through guide on how to use the app and why the data is being collected. Other testers suggested a
21

general help section, Frequently Asked Questions section, and contact information for technology problems or for reporting large marine debris items that cannot be removed.
In addition, creating more west coast specific debris lists, or at least revising the “top items” list to be representative of the west coast, would assist in categorizing marine debris items. One tester stated that at least a third of the trash items needed to be added, while another tester described the MDT App as:
“lack[ing] a lot of debris items that should be included, or at least feel like they should be included based on what we find at our beaches more commonly than the options on the list”
(MDT App tester, survey response).
These few revisions would go a long way in improving the user experience and reducing confusion about how to record data, why certain data is important, and how to use the MDT App. Lastly, to feel their participation was worthwhile, citizen scientists needed to know their participation had an impact (reports, data analysis, knowledge the data is being used to inform policy), receive feedback and communication (thank you messages, acknowledging receipt of data, seeing results, reports), and enjoy participating (Geoghegan et al. 2016). As many users already enjoyed using the app, increasing communication, linking the MDT App to various webpages, and providing information on data results would likely enhance participant gratification.
Next stepsThe last step for this project was to provide this report to the National Oceanic and
Atmospheric Administration, the Marine Debris Alliance, and to Jenna Jambeck at the University of Georgia. A summary of the report was presented during the March 28th monthly West Coast Marine Debris Alliance meeting. A meeting will be held with Jenna Jambeck to discuss the findings of the project. Furthermore, a final summary of the results was sent to all testers on March 30th, 2017 (Appendix D).
CONCLUSIONOverall, the MDT App was well received on the west coast, with a majority of testers
enjoying the experience and finding the app easy to use. Several areas of critique, including editing the MDT App’s navigation, submitting data, and recording data components would greatly benefit the project. Testers were confused about how to both use the MDT App, as well as how to conduct a marine debris survey and why various data was important. Providing testers with an easy to access tutorial video or help section would greatly assist in reducing user frustration. Furthermore, west coast specific top items should be included for those users and linkage between the app and website is imperative for ease of use. Future work should focus on user recruitment, providing more information about data usage, editing several components of the MDT App, and developing a solid help section.
LITERATURE CITEDBraun, V. and V. Clarke. 2006. Using thematic analysis in psychology. Qualitative research in
psychology 3: 77-101.
22

Conrad, C.C. and K.G. Hilchey. 2011. A review of citizen science and community-based environmental monitoring: issues and opportunities. Environ. Monit. Assess. 176: 273 – 291.
Cooper, T. L., T.A. Bryer and J.W. Meek. 2006. Citizen-centered collaborative public management. Public Administration Review: 76-88.
Crall, A.W., R. Jordan, K. Holfelder, et al. 2012. The impacts of an invasive species citizen science training program on participant attitudes, behavior, and science literacy. Public Understanding of Science 0: 1 – 20.
Curtis, V. 2015. Online citizen science projects: an exploration of motivation, contribution and participation. Doctoral dissertation, The Open University.
Dillman, D.A. and J.D. Smyth. 2007. Design effects in the transition to web-based surveys. American journal of preventive medicine 32: S90-S96.
Geoghegan, H., A. Dyke, R. Pateman, et al. 2016. Understanding Motivations for Citizen Science. Final report on behalf of UKEOF, University of Reading. Stockholm Environment Institute (University of York) and University of the West of England.
Goffredo, S., F. Pensa, P. Neri, et al. 2010. Unite research with what citizens do for fun: “recreational monitoring” of marine biodiversity. Ecological Applications 20: 2170 – 2187.
Hames R, K. Rosenberg, J. Lowe et al. 2002. Adverse effects of acid rain on the distribution of the Wood Thrush Hylocichla mustelina in North America. Proc. Natl. Acad. Sci. USA 99:11235–40
Hardesty, B.D., T.P. Good, and C. Wilcox. 2015. Novel methods, new results and science-based solutions to tackle marine debris impacts on wildlife. Ocean & Coastal Management 115: 4-9.
Jambeck, J.R., R. Geyer, C. Wilcox, et al. 2015. Plastic waste inputs from land into the ocean. Science 347: 768-771.
Jennett, C. and A.L. Cox. 2014. Eight Guidelines for Designing Virtual Citizen Science Projects. In Second AAAI Conference on Human Computation and Crowdsourcing.
Jennett, C., L. Kloetzer, D. Schneider et al. 2016. Motivations, learning and creativity in online citizen science. Journal of Science Communication 15.
Kelling, S., C. Lagoze, K.W. Wong, et al. 2013. EBird: a human/computer learning network to improve biodiversity conservation and research. AI Magazine 34:10–20.
Newman, G., A. Wiggins, A. Crall, et al. 2012. The future of citizen science: emerging technologies and shifting paradigms. The Ecological Society of America.
Nov, O., O. Arazy, and D. Anderson. 2011. Dusting for science: motivation and participation of digital citizen science volunteers. In Proceedings of the 2011 iConference (p. 68 – 74). ACM.
Paul, Kylie, et al. 2014. An evaluation of a citizen science data collection program for recording wildlife observations along a highway. Journal of environmental management 139:180-187.
R Core Team. 2015. R: A language and environment for statistical computing. R Foundation for Statistical Computing, Vienna, Austria. URL http://www.R-project.org/.
Raddick, M.J., G. Bracey, K. Carney, et al. 2009. Citizen science: status and research directions for the coming decade. AGB Stars and Related Phenomenastro 2010: The Astronomy and Astrophysics Decadal Survey, 2010, p.46.
23
Raddick, M.J., G. Bracey, P.L. Gay, et al. 2013. Galaxy Zoo: Motivations of citizen scientists. arXiv preprint arXiv:1303.6886.
Reed, J., M.J. Raddick, A. Lardner, and K. Carney. 2013. An exploratory factor analysis of motivations for participating in Zooniverse, a collection of virtual citizen science projects. In System Sciences (HICSS), 2013 46th Hawaii International Conference on (p. 610-619). IEEE.
Silvertown, J. 2009. A new dawn for citizen science. Trends in Ecology & Evolution 24:467–471.
Stilgoe, J., S.J. Lock and J. Wilsdon. 2014. Why should we promote public engagement with science? Public Understanding of Science 23: 4-15.
Sullivan, B.L., J.L. Aycrigg, J.H. Barry, et al. 2014. The eBird enterprise: an integrated approach to development and application of citizen science. Biological Conservation 169: 31-40.
Thiel, Martin, et al. 2014. Citizen scientists and marine research: volunteer participants, their contributions, and projection for the future. Oceanography and Marine Biology: An Annual Review 52:257-314.
24
APPENDIX
APPENDIX A: EmailsI. Preliminary email sent to contacts
Dear Name,
My name is Courtney Hann and I am the new West Coast Marine Debris Alliance Intern primarily tasked with evaluating the Marine Debris Tracker app for west coast (California, Oregon, and Washington) users.
The Marine Debris Tracker is a mobile application that enables citizen scientists to collect standardized data on marine debris quickly, easily, and globally. Monitoring marine debris can help gauge the success of marine debris prevention measures, add value to beach cleanups, and provide baseline information used to inform solutions and policy.
I am contacting you to see if you or your organization would be interested in helping recruit Marine Debris Tracker app “testers”. Testers are asked to use the Marine Debris Tracker app when completing beach cleanups and fill out a 5-10 minute survey about their experience. Information from the survey will be use to curve the future direction of the Marine Debris Tracker app and improve the accessibility and efficiency of this citizen science project for the west coast.If you are interested in promoting the opportunity to take place in this research project to members of Organization, I will forward you a brief recruitment email and flier to send to your email list serve. I can also provide short blog posts about the project to advertise on your organization’s website, Facebook, and Twitter pages. Any other suggestions or feedback on recruiting testers are greatly appreciated.Thank you for your time and have a wonderful day,Courtney HannCourtney HannWest Coast Marine Debris Alliance InternNational Marine Sanctuary [email protected](530)426-2981
II. Recruitment email (sent by contacts to their lists serves)
Calling all beach goers! Can you help us test a citizen science app, Marine Debris Tracker, on the west coast? We are looking for volunteers to use the app and provide feedback through a short online survey (survey link). Your input is important for improving the tool so that we can use the data to find solutions for reducing the estimated 15 metric tons of marine debris that enters our oceans every second. That's the weight of 15 polar bears! For more information see the attached flier and/or contact Courtney Hann at [email protected]
25

III. Description on how to participateTo get started, you can download the Marine Debris Tracker app online by selecting on the following link (downloaded online for an iPhone or Android) and use it to record all marine debris removed while going on your beach clean ups. Then, when you get back to internet, click on this survey link (survey link) and fill out the 5-10 minute survey to provide feedback on the app right after using it. You need to use the app at least once before taking the survey. We are trying to get all our testers to use the app and fill out the online survey before the end of January 2017. By filling out the survey, we can evaluate how well the app worked and what you would like to see changed or improved.
IV. Facebook postsDo you pick up litter at your local beach, river, lake, or on the streets? Every wonder where the trash comes from or how it impacts wildlife? Help solve these questions by using the Marine Debris Tracker app to record the trash you pick up. We are recruiting testers on the west coast to use the app and provide feedback with a short online survey (survey link). To get involved contact Courtney Hann at [email protected]
Have you been noticing more and more marine debris landing on your beaches from the 2011 tsunami in Japan? Researchers need your help to collect data on where this debris is landing. Your reporting of marine debris using the Marine Debris Tracker can help us track marine debris flow and mitigate the negative impacts. We also want to know your opinions about the Marine Debris Tracker as a recording tool. Can you take 5-10 minutes to fill out an online survey (survey link) and tell us about your experience using the Marine Debris Tracker? To take part contact Courtney Hann at [email protected]
Interested in citizen science projects and the ocean? Can you help us test the Marine Debris Tracker, a mobile app used to record marine debris, on the Oregon/California/Washington coast? We want to know what you think about it, how to make it better and if you liked using it by filling out a survey (survey link). We want all types of marine debris removers, people who have recorded data and those who are trying for the first time. For more information contact Courtney Hann at [email protected]
V. Twitter postsDo you pick up litter on the beach? Can you help test the #MarineDebrisTracker and tell us your opinions with the online survey survey link?
Can you take 15 minutes to give us feedback on the #MarineDebrisTracker (survey link), the cool way to record marine debris data.
Check out our west coast evaluation of #MarineDebrisTracker by taking the online survey at survey link
Hey West Coasters! Tell us about your experience with #MarineDebrisTracker by filling out survey link
VI. Survey reminder
26

Dear Name,
Just checking in to see if you have had time to use the app and fill out the short online survey (survey link)? We are trying to get all our testers to use the app at least once and fill out the online survey before the end of January 2017. By filling out the survey, we can evaluate how well the app worked and what you would like to see changed or improved.
Thank you,CourtneyCourtney HannWest Coast Marine Debris Alliance InternNational Marine Sanctuary [email protected](530)426-2981
VII. Follow up interview requestDear Name,
Thank you for filling out the online survey and using the Marine Debris Tracker app! At the end of the survey, you indicated you might be interested in participating in a follow up interview to go over details/specifics you would like to add about your experience using then Marine Debris Tracker app. If you are still interested, would you like to schedule a short, 20 minute follow up interview?
Best,CourtneyCourtney HannWest Coast Marine Debris Alliance InternNational Marine Sanctuary [email protected](530)426-2981
APPENDIX B: Testers Flier(see following two pages)
27

28
APPENDIX C: Marine Debris Tracker App Survey
Introduction
Questions
29
30

31

32

33

34
35

APPENDIX D: Final summary of the report sent to all testers with a thank you email.
36