Embed Size (px)
Citation preview
St Louis Large Office Building Paper 1-System DesignKirby Nelson, PE Life member ASSHRAE
PREFACE: ASHRAE approved this paper for presentation at St. Louis 2016. I agreed to present if DOE/PNNL or anyone would present EnergyPlus or other model papers dealing with the same large office building as defined here. No response so the papers were moved to Vegas 2017. Again no response so the papers were pulled. My effort to advance ASHRAE Building Energy Modeling capability will continue with development of Advanced Energy Design Guides for specific cities in varies parts of the World. Let me know a city you would like me to work on.
PREFACE
ASHRAE does not have a building energy model that is consistent with the laws of
thermodynamics and can provide real time energy analysis of a building as evidenced by the
studies performed, (Lin 2011), to establish ASHRAE Standard 90.1-2010. The author has
searched and not found verification of the U.S. Department of Energy (DOE) model used by
Pacific Northwest National Laboratory (PNNL) to establish ASHRAE Standard 90.1-2010.
The July 2014 ASHRAE Journal ,page 70, makes the obvious but not stated point that 40 years
after the oil embargo an airside model is not in the ASHRAE and (PNNL) accepted DOE building
energy models. The ASHRAE Journal of September 2014 published a letter that concluded, “Is it
not time for all to admit we have been on the wrong modeling path for more than 40 years?”
The purpose of this series of three papers is to present an alternative to the present methods of
modeling building energy consumption, a method based on the laws of thermodynamics and
model equations solved on a lap top computer. A fundamental difference in the model
presented here is that it is configured to model 24 hours verses 8,760 hours of the DOE and
other models.
1
MODEL VERIFICATION
Several years ago there were comparisons of 8,760 hour building energy models to see which
gave the closest result to the annual energy consumption of a facility; a fool’s errand. An
analogy would be NASA modeling a trip to the moon after the space craft returned to earth.
NASA must model real time performance. ASHRAE must have building energy models that can
model real time performance of buildings if the objective of energy efficient buildings is to be
achieved. The building energy model presented here is set up to model real time energy
performance over any real or assumed 24 hour period giving flows, temperatures, cooling
loads, kW demand of equipment, and total site kW as weather and operational conditions
change. The model presented here consists of a set of simultaneous equations solved by
Microsoft Excel. The model iterates to steady state energy equilibrium after a perturbation to
the system just as a real system responds, a defining characteristic of a System Energy
Equilibrium (SEE) model.
THE CHALLENGE
The purpose of this series of three papers is to present a method of building energy analysis
that models real time building energy performance. The author does not suggest that the
model is complete after six years of development. Note that after forty years of development
the DOE and PNNL models do not have a good infiltration model (Ng, 2014).
Chiller and tower performance data is given in Paper 2 and manufactures are requested to
provide critical review. DOE and PNNL are requested to provide detail analysis of the large
office building defined in the ASHRAE Standard 90.1-2010 study, (Liu 2011), the building used in
this three paper study.
2
The ideal research project would identify several office buildings in varies parts of the world and
install and monitor data hourly so that models could be verified and improved.
INTRODUCTION
This Paper-1 deals with system design at St. Louis peak weather conditions, Paper-2 deals with
operation and control during summer operation and addresses supply air temperature reset at
summer weather conditions, Paper-3 addresses spring/fall operation and control issues. Paper
3 also presents Building Energy Quotient (bEQ) estimates and summarizes the three papers.
(SEE) MODEL CHARACTERISTICS
Understanding the performance of a complex system, in this case a Central Chilled Water
System (CCWS) that serves an office building requires a model that includes detail model
equations of all components of the system. These equations of each system component are
solved simultaneously by Excel giving the effect of each component on the operation of the
total system and the effect of the system on the performance of the component. Real building
energy systems operate according to the laws of thermodynamics and the performance
characteristics of the equipment installed; therefore the model must incorporate equations
that are consistent with the laws of thermodynamics and input the characteristics of the system
components consistent with the manufactures verified data. To accomplish this detail the
model must incorporate every design and control feature of the real system; resulting in a
model as presented here consisting of more than 150 performances and design variables (see
nomenclature). Each variable is defined by an equation and/or is a design constant that changes
if the design is changed. The set of equations is solved simultaneously by computer and will
duplicate the performance of a real system if sufficient detail has been incorporated into the
3
model and the detail is consistent with the actual equipment and controls of the real system.
The model is always at System Energy Equilibrium (SEE) as is the real system.
The primary challenge in developing a (SEE) model might be summarized as; a real system is
very complex where minor changes in weather, design, and control, can have a major effect on
the performance of the system; therefore the system model must be equally complex
incorporating all characteristics of the real system within a set of equations solved by a
computer.
THE BUILDING DEFINED AND ASSUMED WEATHER
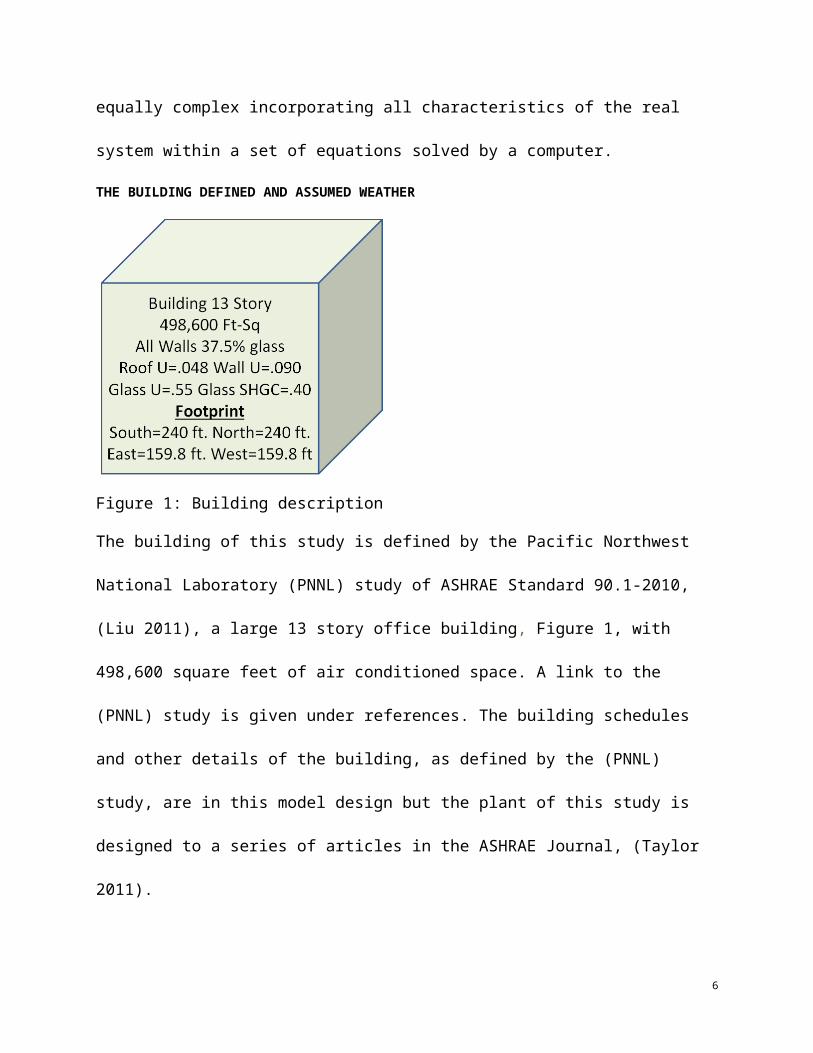
Figure 1: Building description
The building of this study is defined by the Pacific Northwest National Laboratory (PNNL) study
of ASHRAE Standard 90.1-2010, (Liu 2011), a large 13 story office building, Figure 1, with
498,600 square feet of air conditioned space. A link to the (PNNL) study is given under
references. The building schedules and other details of the building, as defined by the (PNNL)
study, are in this model design but the plant of this study is designed to a series of articles in
the ASHRAE Journal, (Taylor 2011).
4
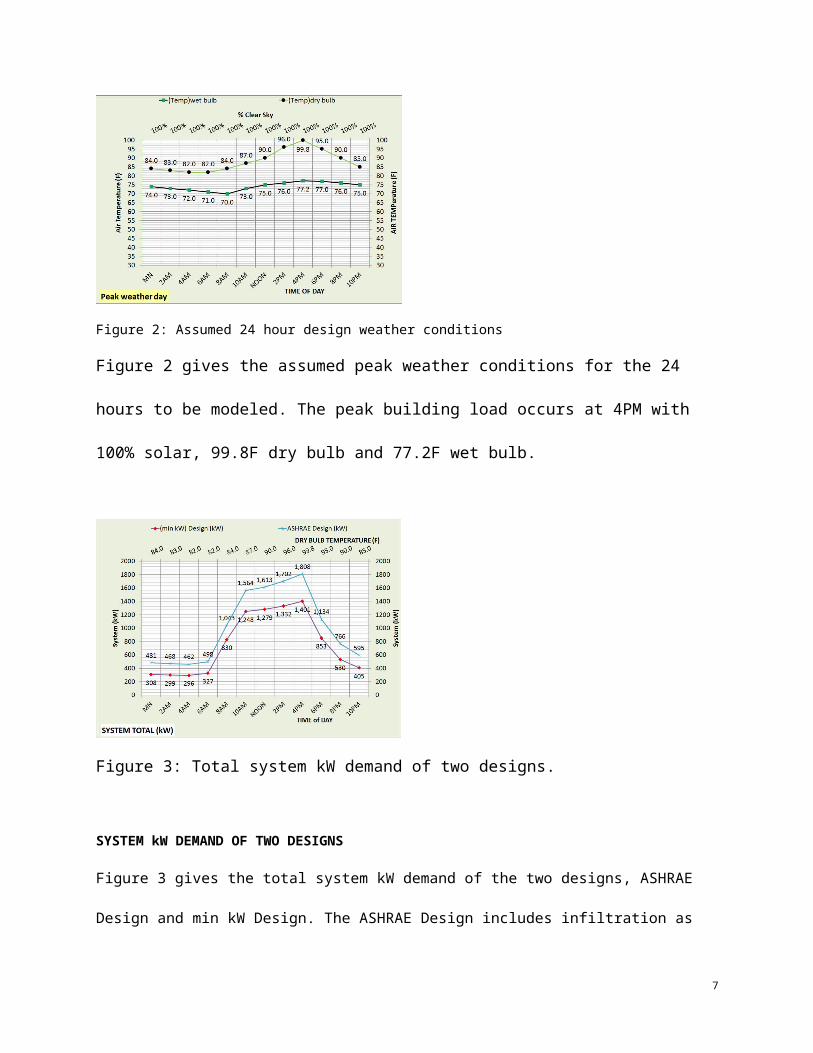
Figure 2: Assumed 24 hour design weather conditions
Figure 2 gives the assumed peak weather conditions for the 24 hours to be modeled. The peak
building load occurs at 4PM with 100% solar, 99.8F dry bulb and 77.2F wet bulb.
Figure 3: Total system kW demand of two designs.
SYSTEM kW DEMAND OF TWO DESIGNS
Figure 3 gives the total system kW demand of the two designs, ASHRAE Design and min kW Design. The
ASHRAE Design includes infiltration as defined by the (PNNL) study of ASHRAE Standard 90.1-2010, and
also includes return air fans and fan powered terminals as part of the air handler system. The ASHRAE
Design plant is based on the concepts given by (Taylor 2011).
5
The min kW Design assumes the building is pressurized with resulting exfiltration, return air fans are
eliminated and the fan powered terminals are not in the design and the plant is designed to minimize
kW demand. Figure 3 illustrates that the reduction in kW demand for the min kW Design is significant.
Defining why these reductions in kW demand occur with these rather minor changes in design can best
be explained with Energy Equilibrium Schematics as presented below. Figure 4 defines the basic
structure of the schematics.
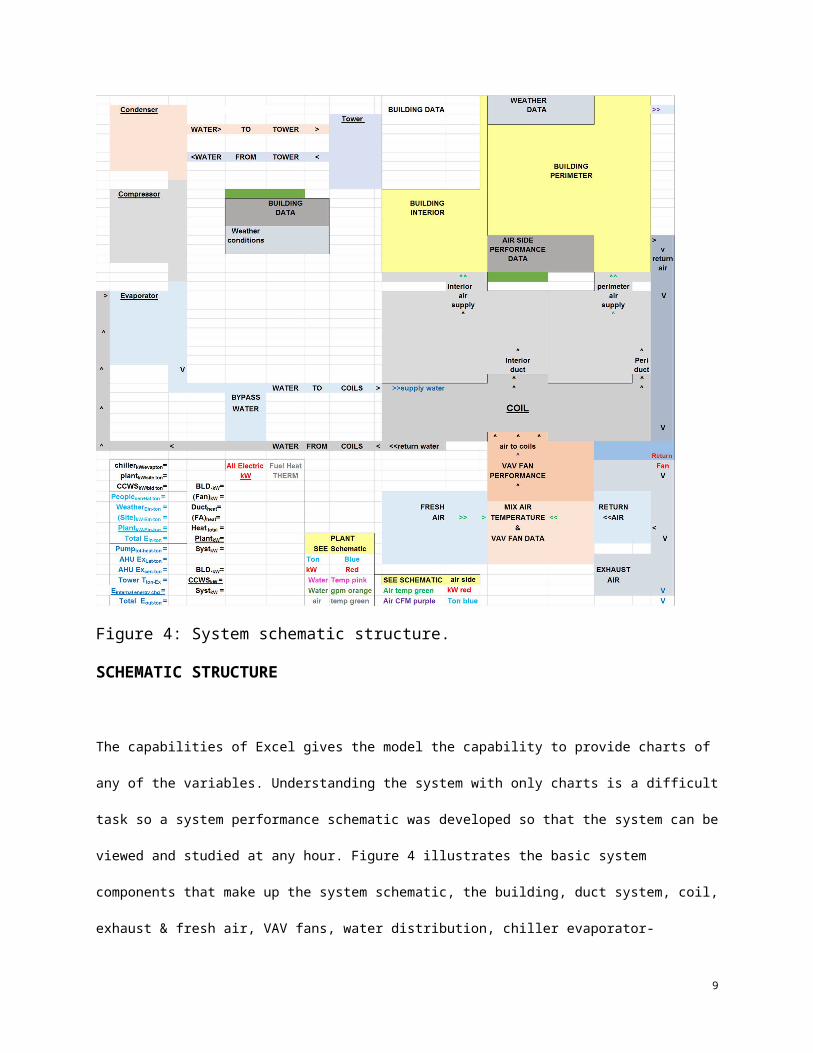
Figure 4: System schematic structure.
SCHEMATIC STRUCTURE
6
The capabilities of Excel gives the model the capability to provide charts of any of the variables. Understanding the
system with only charts is a difficult task so a system performance schematic was developed so that the system can
be viewed and studied at any hour. Figure 4 illustrates the basic system components that make up the system
schematic, the building, duct system, coil, exhaust & fresh air, VAV fans, water distribution, chiller evaporator-
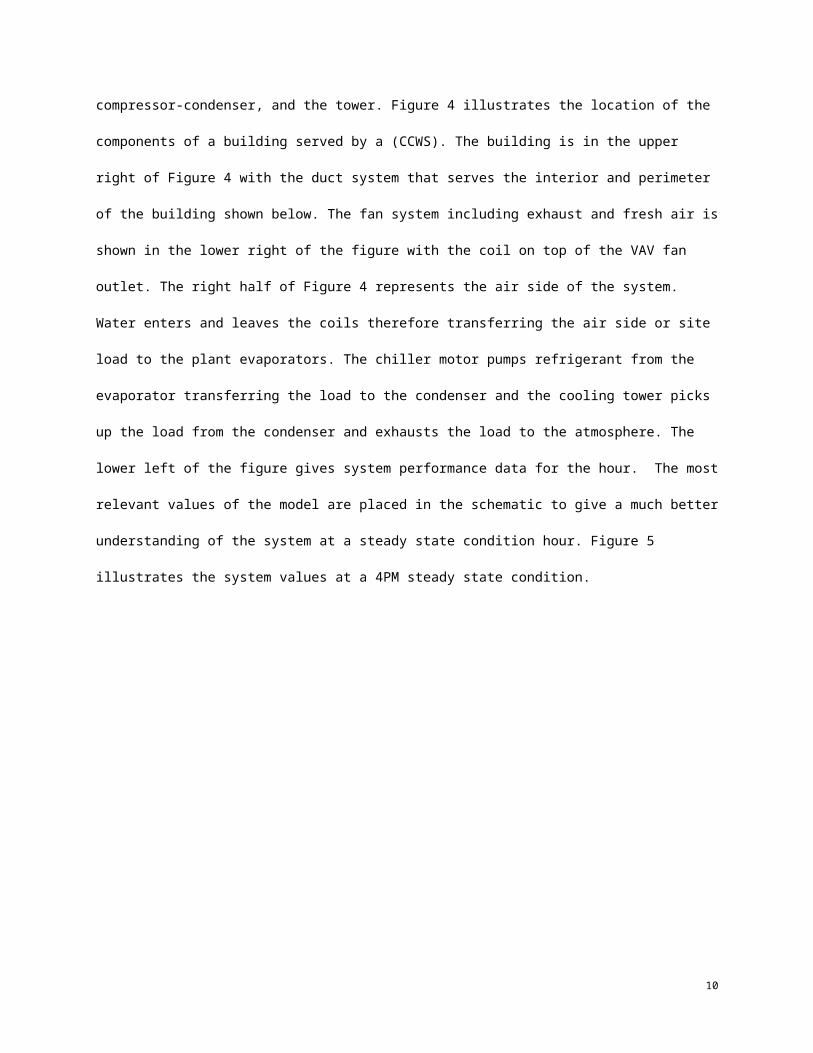
compressor-condenser, and the tower. Figure 4 illustrates the location of the components of a building served by a
(CCWS). The building is in the upper right of Figure 4 with the duct system that serves the interior and perimeter of
the building shown below. The fan system including exhaust and fresh air is shown in the lower right of the figure
with the coil on top of the VAV fan outlet. The right half of Figure 4 represents the air side of the system. Water
enters and leaves the coils therefore transferring the air side or site load to the plant evaporators. The chiller
motor pumps refrigerant from the evaporator transferring the load to the condenser and the cooling tower picks
up the load from the condenser and exhausts the load to the atmosphere. The lower left of the figure gives system
performance data for the hour. The most relevant values of the model are placed in the schematic to give a much
better understanding of the system at a steady state condition hour. Figure 5 illustrates the system values at a 4PM
steady state condition.
7
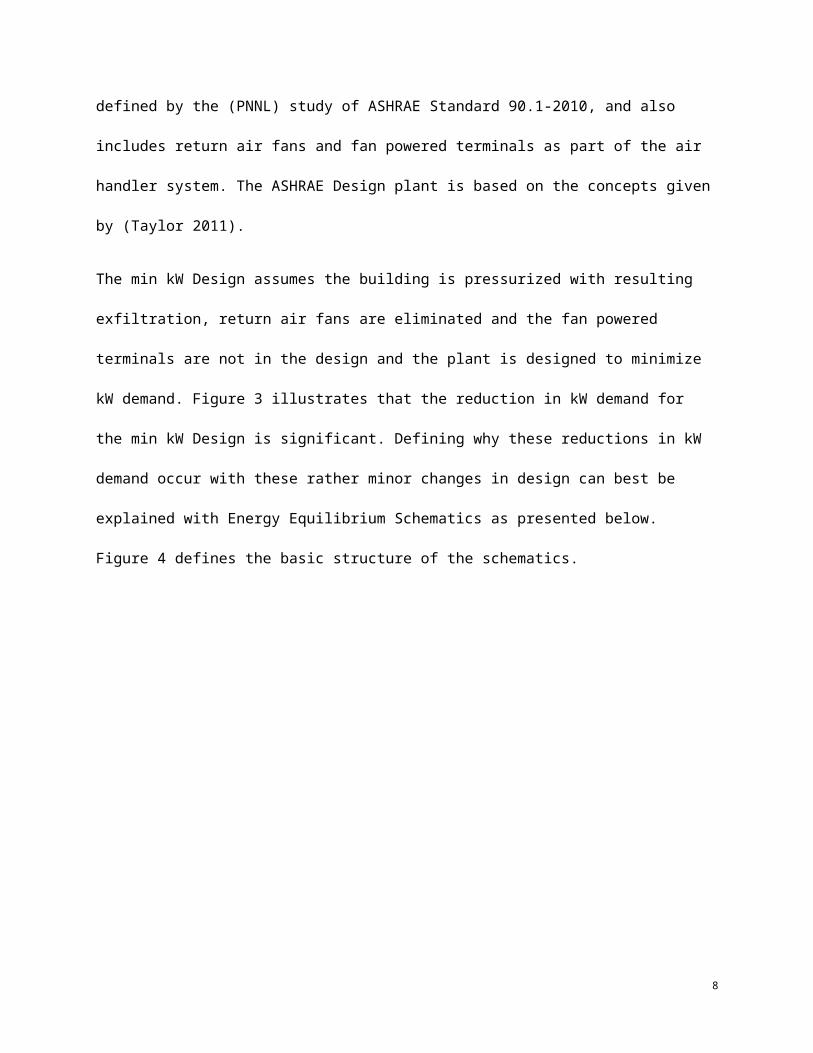
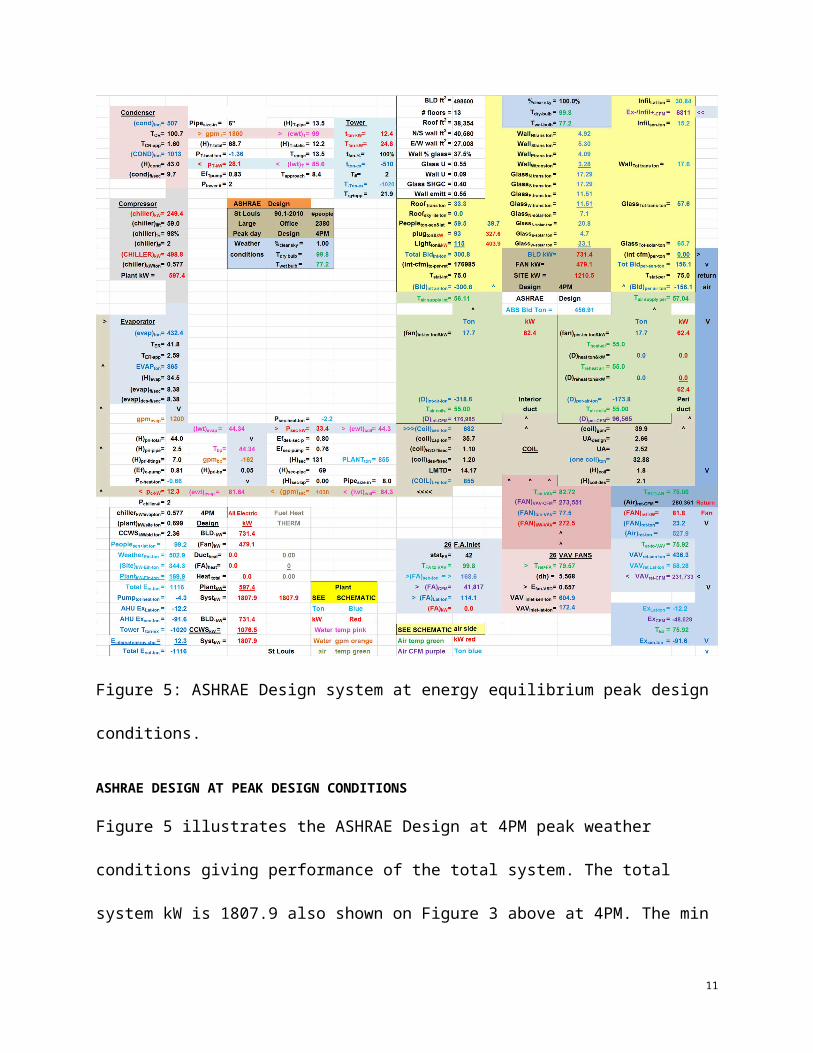
Figure 5: ASHRAE Design system at energy equilibrium peak design conditions.
ASHRAE DESIGN AT PEAK DESIGN CONDITIONS
Figure 5 illustrates the ASHRAE Design at 4PM peak weather conditions giving performance of
the total system. The total system kW is 1807.9 also shown on Figure 3 above at 4PM. The min
kW Design has four changes as defined above. Three of the design changes are to the air side of
the system, exfiltration verses infiltration and removal of the return fans and fan powered
terminals, the forth change is the plant designed to minimize kW demand. The next Figure 6 is
8
the min kW Design at 4PM peak conditions illustrating the effect of these rather minor design
changes. Comparing Figures 5 and 6 can give understanding of the difference in the two
designs.
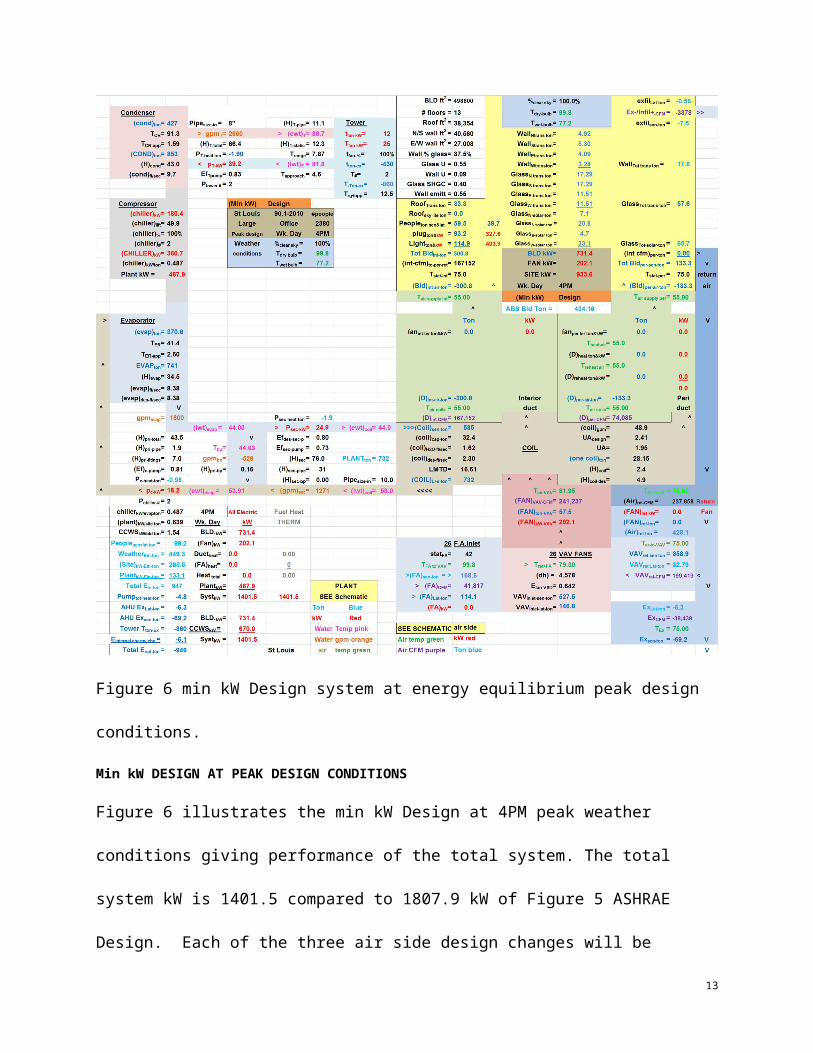
Figure 6 min kW Design system at energy equilibrium peak design conditions.
Min kW DESIGN AT PEAK DESIGN CONDITIONS
Figure 6 illustrates the min kW Design at 4PM peak weather conditions giving performance of
the total system. The total system kW is 1401.5 compared to 1807.9 kW of Figure 5 ASHRAE
9
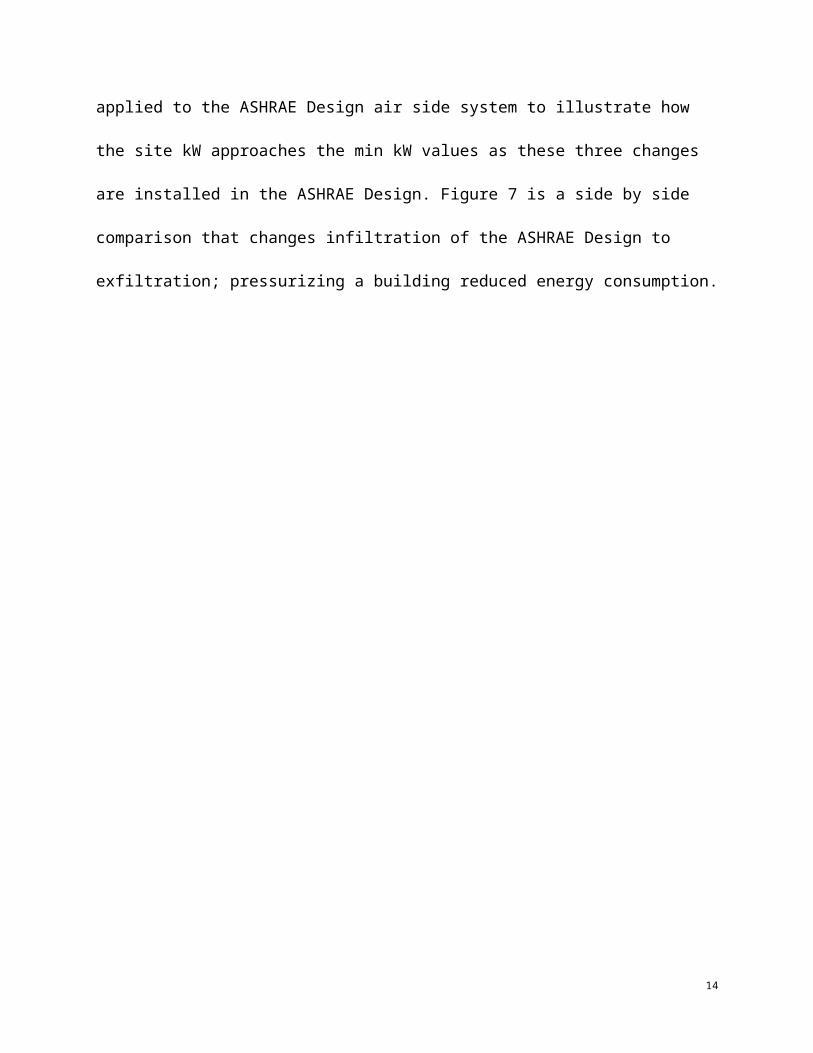
Design. Each of the three air side design changes will be applied to the ASHRAE Design air side
system to illustrate how the site kW approaches the min kW values as these three changes are
installed in the ASHRAE Design. Figure 7 is a side by side comparison that changes infiltration of
the ASHRAE Design to exfiltration; pressurizing a building reduced energy consumption.
Figure 7 ASHRAE Design, Infiltration (6811 CFM) left schematic & exfiltration (3405 CFM) right schematic.
Infiltration Verses Exfiltration for ASHRAE Design
The upper right corner of the air side schematic on the left gives infiltration of 6811 CFM and the schematic on the
right changes to exfiltration of 3405 CFM. Infiltration adds energy to the system and exfiltration removes energy
from the system. The result is a perimeter building load of 133.3 ton verses 156.1 ton with infiltration. The air return
10
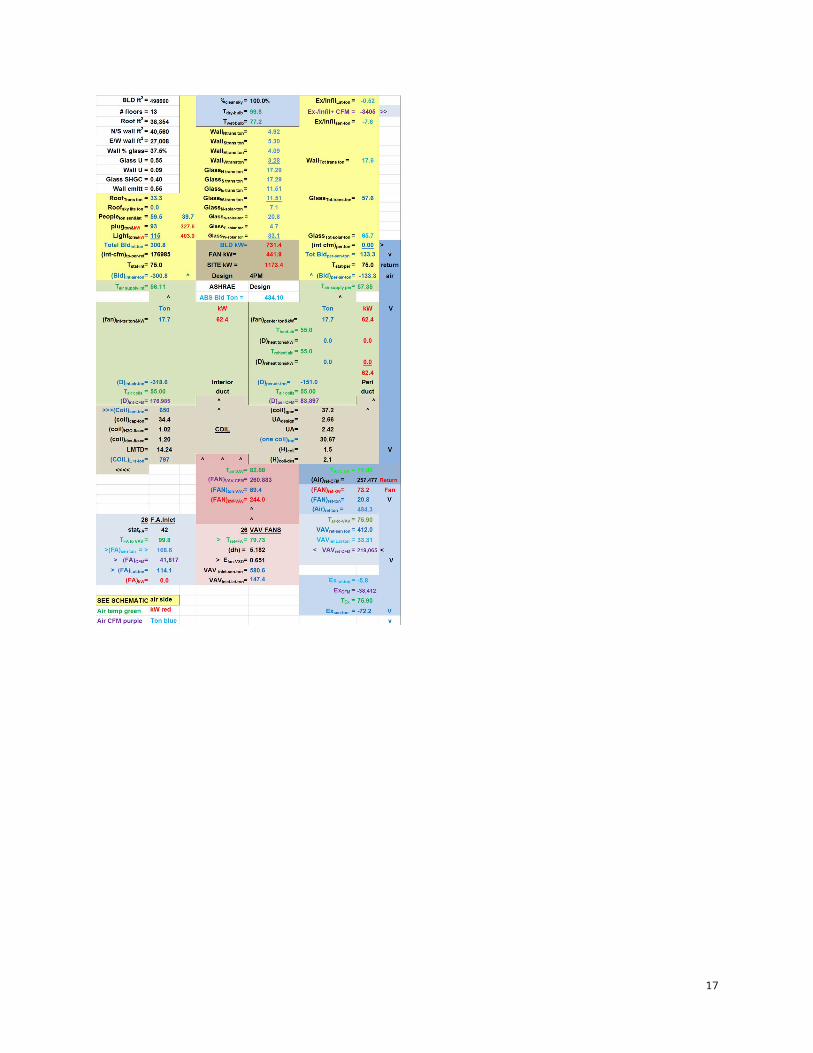
CFM is less and therefore the return fan kW is less with exfiltration as shown by comparing the two schematics.
Less air CFM to the VAV fans reduces kW as shown, 244 kW verses 272.5 kW. The net result is a site kW of
1173.4 verses 1210.5 kW but also note that the load to the plant is reduced from 855 ton to 797 ton with exfiltration.
This will reduce the plant kW for the exfiltration or pressurized building control design. Next the building return air
fans will be removed.
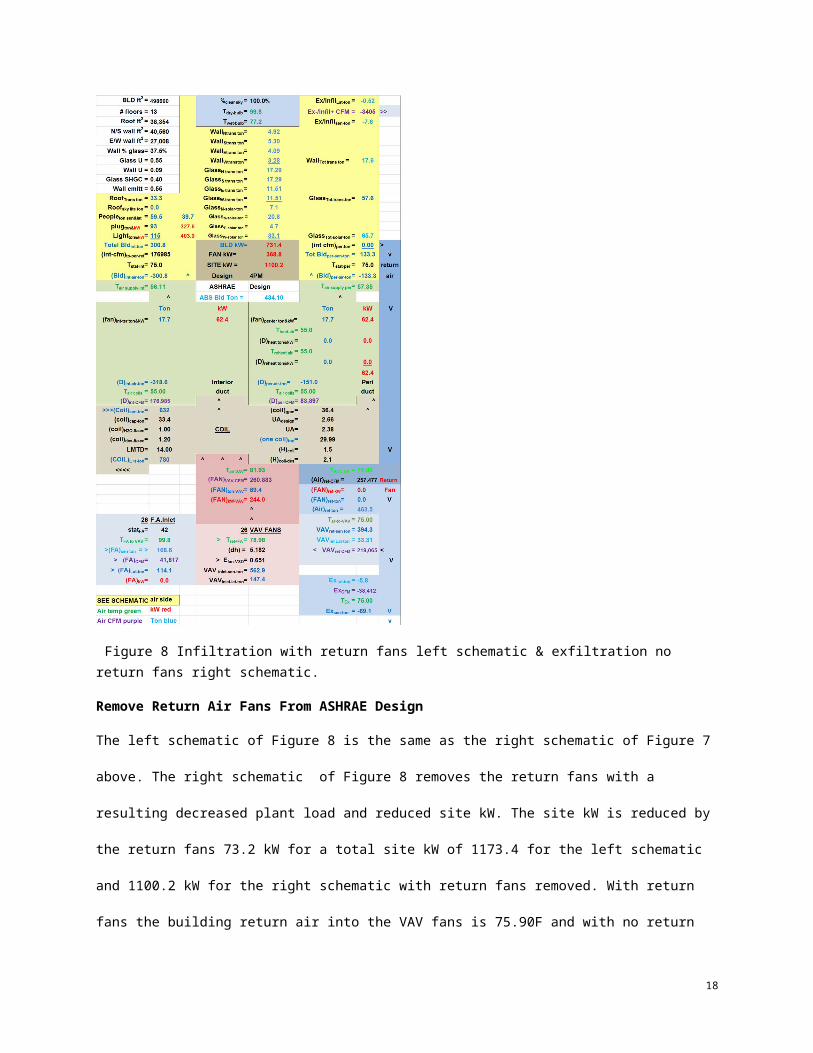
Figure 8 Infiltration with return fans left schematic & exfiltration no return fans right schematic.
Remove Return Air Fans From ASHRAE Design
The left schematic of Figure 8 is the same as the right schematic of Figure 7 above. The right schematic of Figure 8
removes the return fans with a resulting decreased plant load and reduced site kW. The site kW is reduced by the
return fans 73.2 kW for a total site kW of 1173.4 for the left schematic and 1100.2 kW for the right schematic with
11
return fans removed. With return fans the building return air into the VAV fans is 75.90F and with no return fans the
air return temperature is 75.0F, resulting in less load on the coil and therefore the plant load is decreased from 797
ton to 780 ton. Next the fan powered terminals will be removed from the ASHRAE Design.
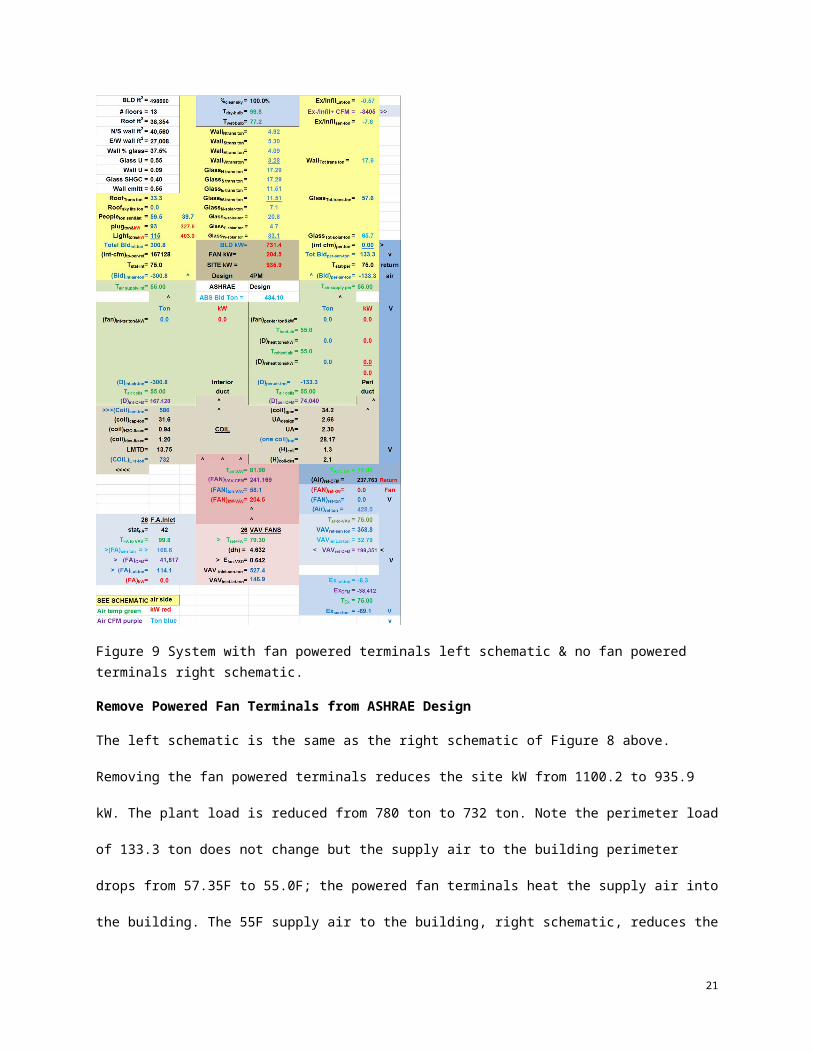
Figure 9 System with fan powered terminals left schematic & no fan powered terminals right schematic.
Remove Powered Fan Terminals from ASHRAE Design
The left schematic is the same as the right schematic of Figure 8 above. Removing the fan powered terminals
reduces the site kW from 1100.2 to 935.9 kW. The plant load is reduced from 780 ton to 732 ton. Note the perimeter
load of 133.3 ton does not change but the supply air to the building perimeter drops from 57.35F to 55.0F; the
powered fan terminals heat the supply air into the building. The 55F supply air to the building, right schematic,
12
reduces the required CFM and therefore the VAV fans kW. Comparing the left schematic of Figure 7 to the right
schematic of Figure 9 illustrates that these three changes in the air side design has reduced the site kW from 1210.5
to 935.9 kW, a 23% reduction. The load to the plant has been reduced from 855 ton to 732 ton a 14% reduction.
Note this is the same load as the min kW Design presents the plant as shown by Figure 6 above. Also note the site
kW of Figure 6 min kW Design is 933.6, a little less than the 935.9 kW of the right schematic of Figure 9. The min
kW Design site kW is a little less because the selected VAV fan is a little smaller than the ASHRAE Design VAV
fans. Next we will look at each plant response to the load of 732 ton.
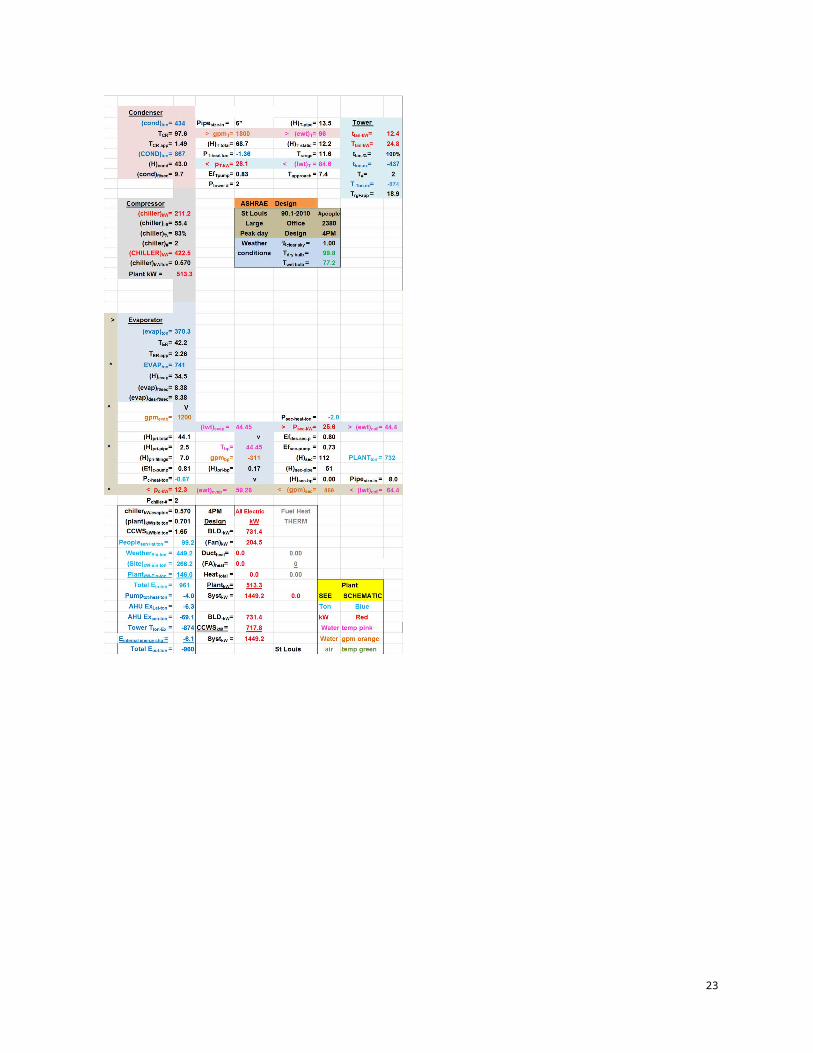
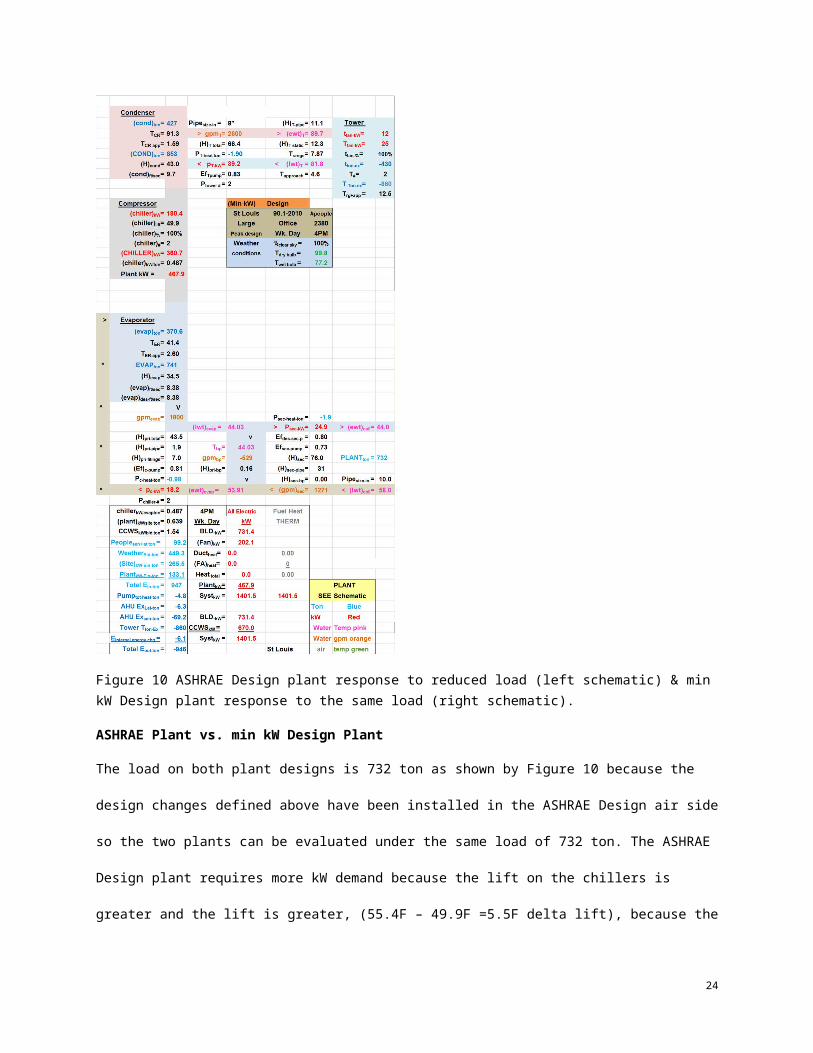
Figure 10 ASHRAE Design plant response to reduced load (left schematic) & min kW Design plant response to the same load (right schematic).
13
ASHRAE Plant vs. min kW Design Plant
The load on both plant designs is 732 ton as shown by Figure 10 because the design changes defined above have
been installed in the ASHRAE Design air side so the two plants can be evaluated under the same load of 732 ton.
The ASHRAE Design plant requires more kW demand because the lift on the chillers is greater and the lift is
greater, (55.4F – 49.9F =5.5F delta lift), because the ASHRAE Design tower is smaller with a range plus approach
of 18.9F as required by (Taylor 2011) verses 12.5F for the min kW Design plant. Note the condenser refrigerant
temperature is 97.6F for the ASHRAE Design and 91.3F for the min kW Design. The ASHRAE Design plant calls
for a larger kW chiller and smaller tower verses the min kW Design that selects a larger tower therefore requiring a
smaller kW chiller. The plant kW for the min kW design is (513.3 – 467.9 = 45.4 kW) less than the ASHRAE
Design, each at the same load of 732 ton. Note that the ASHRAE Design plant of Figure 10 is at reduced load of
88% due to the changes made to the air side and the min kW chiller is at 100% load. The next figure will look at the
system components kW demands of each design.
14
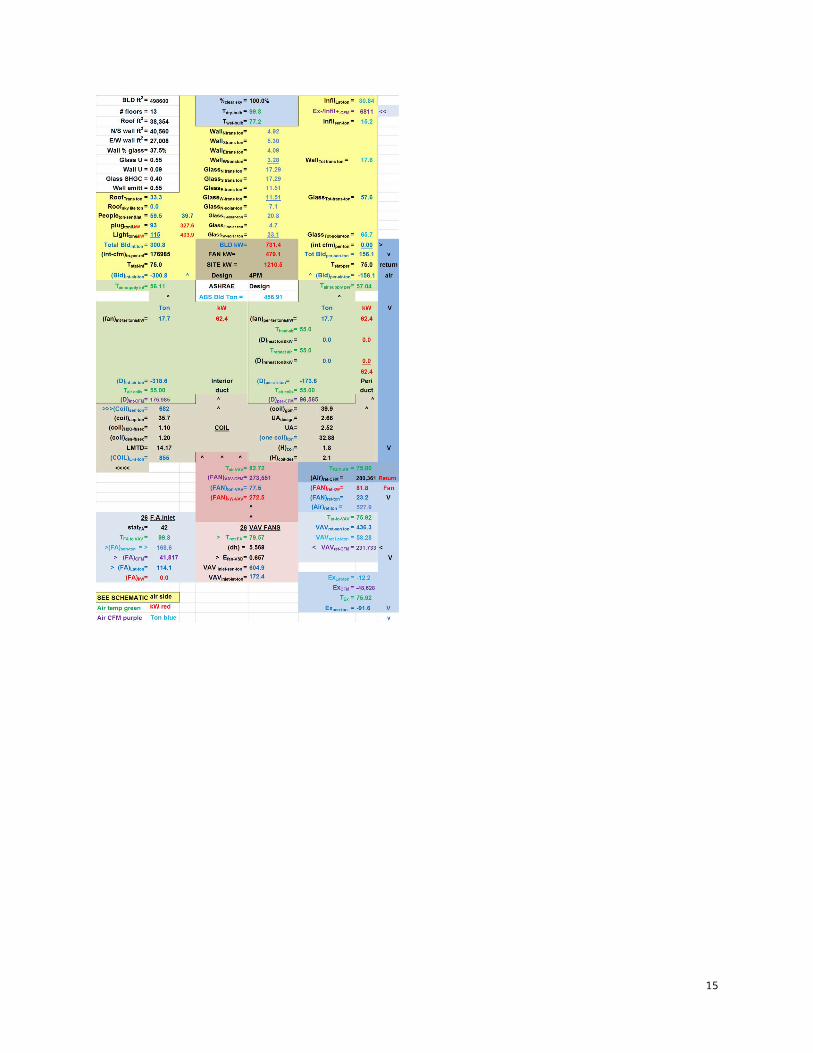
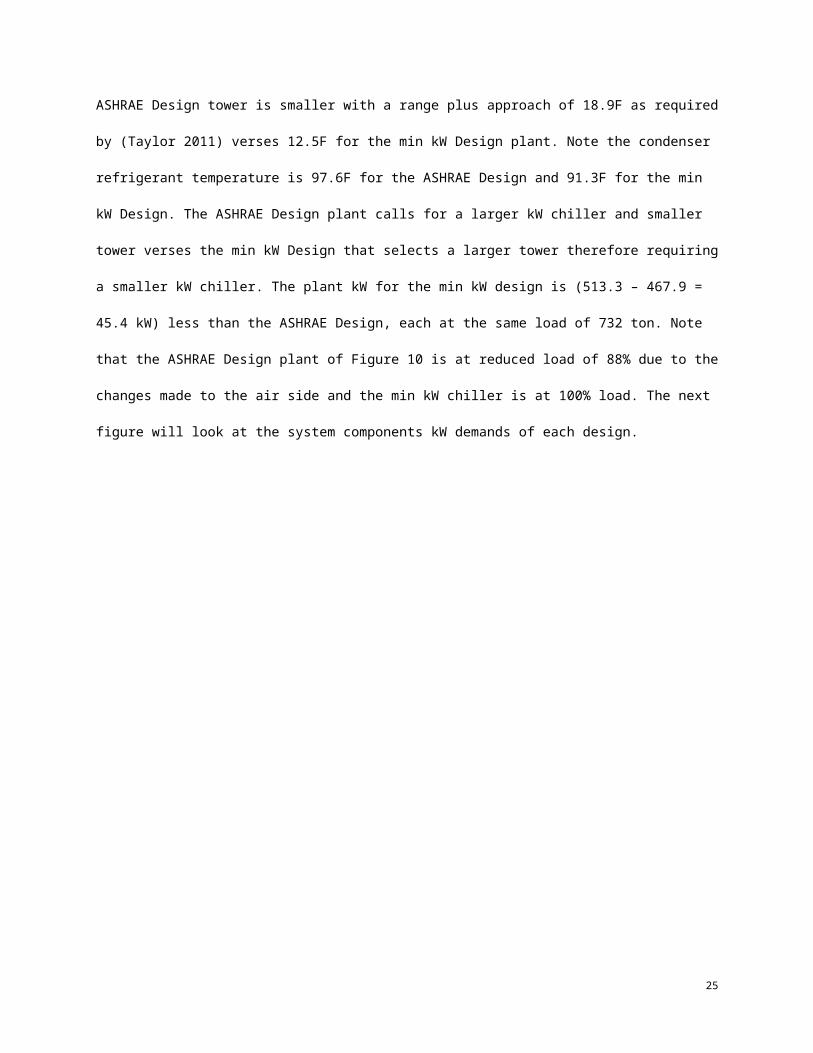
Fig 11 System kW Demand of both designs
ASHRAE Design System kW vs. min kW Design System kW
Figure 11 gives the 24 hour kW demand of the building, air handler system, plant, and total kW of heat. Heat is zero
and will not occur until Paper 3 spring/fall weather conditions. The top chart is for the ASHRAE Design and the
bottom chart for the min kW Design. The secondary horizontal axis gives the total system kW. Note that the
ASHRAE Design total system kW at 4PM is the same as Figure 5 above and the min kW Design is the same as
Figure 6 above. The building kW is due to the lights and plug loads and is the same for both designs, dropping off at
night as given by the PNNL study (Liu 2011). The plant is the next biggest energy user and then the air handler
system as shown by Figure 11. The next figure will present 24 hour values; area under the curves of Figure 11.
15
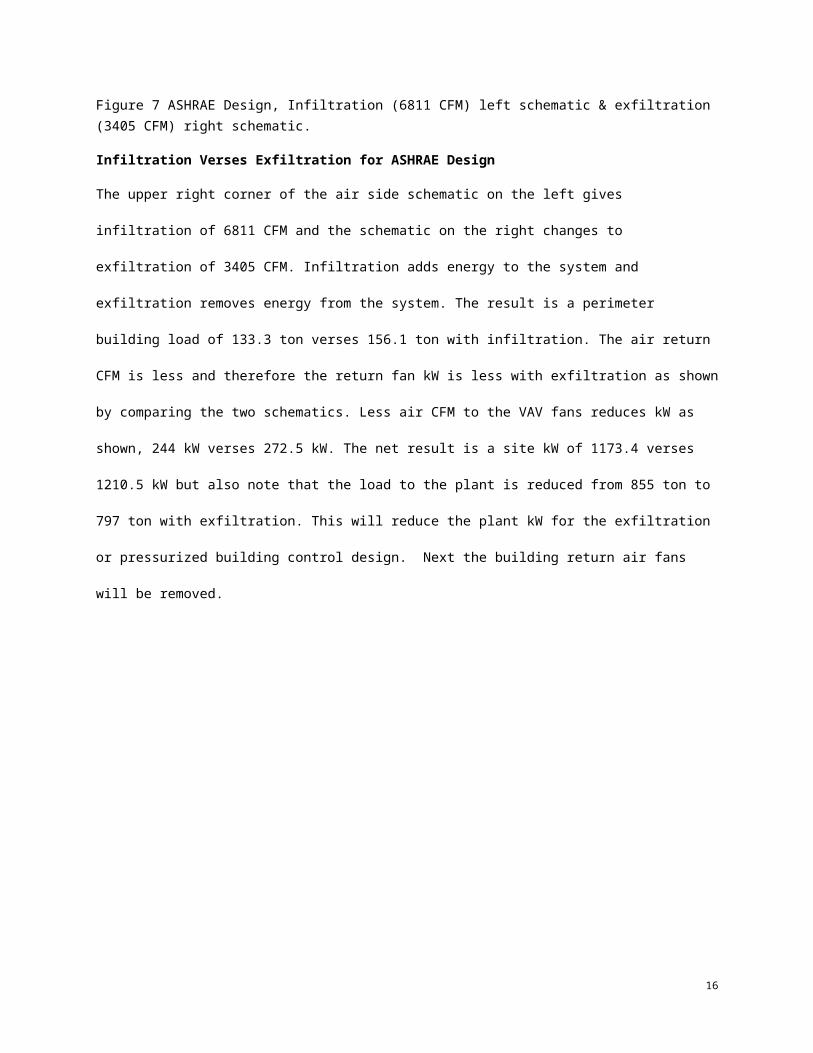
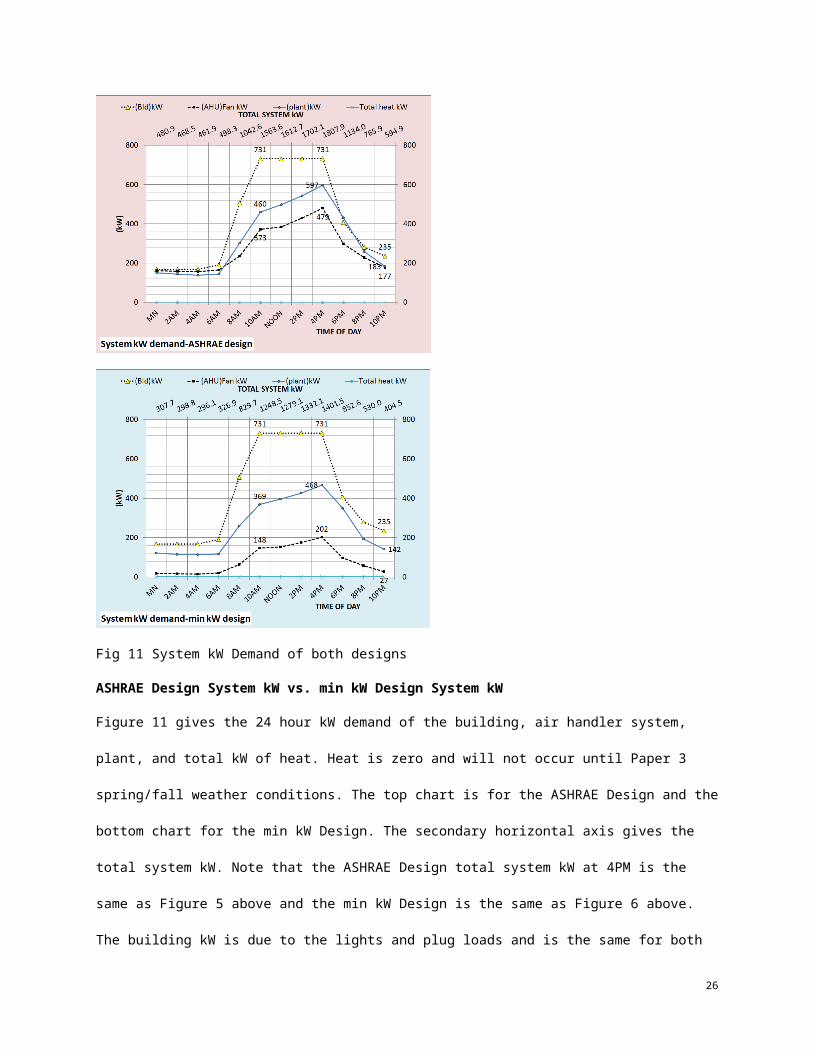
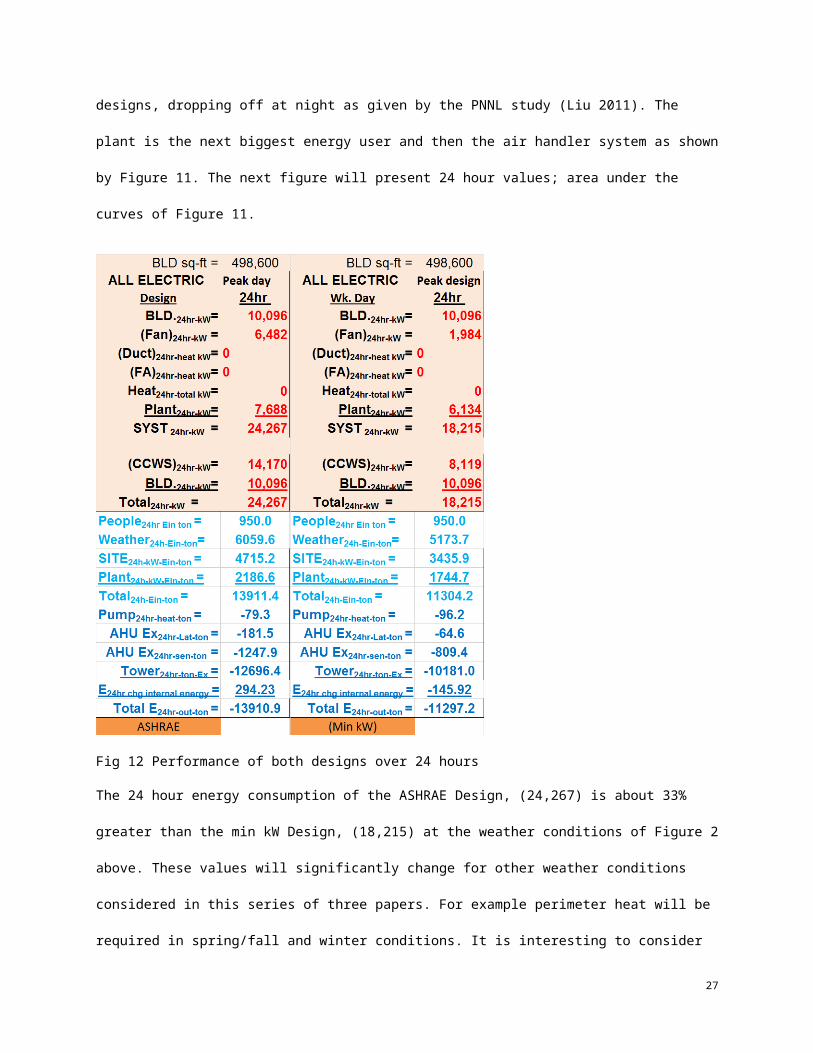
Fig 12 Performance of both designs over 24 hours
The 24 hour energy consumption of the ASHRAE Design, (24,267) is about 33% greater than the min kW Design,
(18,215) at the weather conditions of Figure 2 above. These values will significantly change for other weather
conditions considered in this series of three papers. For example perimeter heat will be required in spring/fall and
winter conditions. It is interesting to consider that the CCWS consumes more energy than the building for the
ASHRAE Design and a little less than the building for the min kW Design. Perhaps a standard for CCWS design
should be established?
The energy in and out for the two designs illustrates that the people energy in is the same for both designs as
required. The weather energy in is a little greater for the ASHRAE Design because of infiltration verses exfiltration
for the min kW Design. Removing the return fans and powered terminals results in significantly less site energy in
for the min kW Design and the plant energy in is similarly less for the min kW Design.
16
Energy out for the two designs is primarily by the tower with exhaust being about 10% of the total energy out. The
pump heat out is that portion of energy to the pumps that escapes as heat. If the pumps were assumed to be in the air
conditioned space then this term would be in the energy in. The change in internal energy is positive for the
ASHRAE Design due to infiltration and negative for the min kW Design due to exfiltration.
The difference in energy in to energy out for the ASHRAE Design is about .004% and about .06% for the min kW
Design. This difference is somewhere in the group of equations and is probably due to a slight difference in a
conversion factor.
CONCLUSION
This first paper of three has given an understanding of the model characteristics, suggesting that real time modeling
of building energy consumption is possible and necessary if ASHRAE is to meet its obligations of minimizing
energy consumption of facilities. The purpose of this series of three papers is to present a method of building
energy analysis that is consistent with the laws of thermodynamics, has an air side model and can be verified
against the 24 hour performance of real buildings. The model used to establish ASHRAE Standard 90.1-2010 is not
consistent with the laws of thermodynamics and has not and cannot be verified against a real building over a 24
hour period. The author does not suggest that the model presented here is complete after six years of
development. Note that after forty years of development the model used to establish ASHRAE Standard 90.1-2010
has not been verified and does not have an infiltration-air side model (Ng, 2014).
This paper has shown that minor changes in design can have a significant effect on system kW demand.
The next Paper 2 will consider operation of the two designs at typical summer weather conditions and show that
system control can have a significant effect on system kW demand.
17
References
Liu, B. May 2011. “Achieving the 30% Goal: Energy and Cost Savings Analysis of ASHRAE
Standard 90.1-2010” Pacific Northwest National Laboratory.
http://www.energycodes.gov/achieving-30-goal-energy-and-cost-savings-analysis-
ashrae-standard-901-2010
Ng, Lisa C., Persily, Andrew K., Emmerich, Steven J. 2014. “Improving Infiltration In
Energy Modeling.” ASHRAE Journal July 2014
Taylor, S. 2011. “Optimizing Design & Control of Chilled Water Plants.” ASHRAE Journal
NOMENCLATURE (Note, nomenclature will only be given by this first paper)
Air Side System Nomenclature
Each of the more than 100 variables of
the air side system will be defined.
Building structure;
BLD ft2 = air conditioned space
# Floors = number of building floors
Roof ft2 = roof square feet
N/S wall ft2 =north/south wall square
feet
E/W wall ft2 =east/west wall square feet
Wall % glass = percent of each wall that
is glass
Glass U = glass heat transfer coefficient
Wall U = wall heat transfer coefficient
Glass SHGC = glass solar heat gain
coefficient
Wall emit = wall solar index
Building interior space;
Rooftrans-ton =transmission through roof
(ton)
Roofsky-lite-ton =sky lite load (ton)
18

Peopleton sen&lat = sensible & latent cooling
load due to people (ton)
Plugton&kW = cooling load & kW due to
plug loads
Lightton&kW = cooling load & kW due to
lights
Total Bldint-ton = total building interior
load (ton)
(int-cfm) to-per-return = CFM of interior
supply air that returns to perimeter of
building
Tstat-int = interior stat set temperature (F)
Bldint-air-ton = supply air ton to offset
interior load
BLD kW = total building kW demand
Building perimeter space;
%clear sky = percent clear sky
Tdry bulb = outside dry bulb temperature
(F)
Twet bulb = outside wet bulb temperature
(F)
Ex/Infillat-ton = latent load due to air
infiltration or exfiltration (ton)
Ex/InfilCFM = air infiltration or exfiltration
CFM
Exfilsen-ton =sensible load due to air
exfiltration or infiltration (ton)
Walln trans ton = north wall transmission
(ton)
Walls trans ton = south wall transmission
(ton)
WallE trans ton = east wall transmission
(ton)
Wallw trans ton = west wall transmission
(ton)
Walltot-trans-ton = total wall transmission
(ton)
GlassN-trans-ton = north wall glass
transmission (ton)
GlassS-trans-ton = south wall glass
transmission (ton)
GlassE-trans-ton = east wall glass
transmission (ton)
19

GlassW trans-ton = west wall glass
transmission (ton)
Glasstot-trans-ton = total transmission thru
glass (ton)
GlassN-solar-ton = north glass solar load
(ton)
GlassS-solar-ton = south glass solar load (ton)
GlassE-solar-ton = east glass solar load (ton)
GlassW-solar-ton = west glass solar load (ton)
Glasstot-solar-ton = total glass solar load (ton)
(int cfm)per-ton = effect of interior CFM to
wall (ton)
Total Bldper-sen-ton total perimeter sensible
load (ton)
Tstat-per = perimeter stat set temperature
(F)
Bldper-air-ton = supply air ton to offset
perimeter load
Air handler duct system
Interior duct
Tair supply int = temp air supply to building
interior (F)
(fan)int ter ton&kW = interior ton & kW due to
terminal fans
(D)int-air-ton = cooling (ton) to building
interior duct
Tair coils = supply air temperature off coils
to duct (F)
(D)int-CFM = supply air CFM to building
interior duct
Perimeter duct
Tair supply per =temp (F) air supply to
building perimeter
(fan)per ter ton&kW = perimeter ton & kW of
terminal fans
Theat-air = temp supply air before terminal
fan heat (F)
(D)heat-ton&kW = heat to perimeter supply
air ton & kW
Treheat air = temp perimeter supply air after
reheat (F)
(D)reheat ton&kW = reheat of perimeter
supply air ton & kW
20
(D)per-air-ton = cooling (ton) to perimeter
duct
Tair coils = supply air temperature off coils
to duct (F)
(D)per-CFM = supply air CFM to perimeter
duct
(ABS Bld Ton) = absolute building load
on (CCWS)
Coil
(coil)sen-ton = sensible load on all coils
(ton)
(coil)cap-ton = LMTD * UA = capacity (ton)
one coil
(coil)H2O-ft/sec = water velocity thru coil
(ft/sec)
(coil)design-ft/sec = coil design water velocity
(ft/sec)
LMTD = coil log mean temperature
difference (F)
(coil)L+s-ton = latent + sensible load on all
coils (ton) transferred to Plant
(coil)gpm = water flow (gpm) thru one coil
UAdesign = coil UA design value
UA = coil heat transfer coefficient * coil
area. UA varies as a function water
velocity (coil)gpm thru the coil, as the
(coil)gpm decreases the coil capacity
decreases.
(one coil)ton = load (ton) on one coil
(H)coil = air pressure drop thru coil
(inches)
(H)coil-design = design air pressure drop
(inches)
VAV Fan system
Fresh air
statFA = fresh air freeze stat set
temperature (F)
TFA to VAV = temperature of fresh air to
VAV fan
(FA)sen-ton = fresh air sensible load (ton)
(FA)CFM = CFM fresh air to VAV fan inlet
(FA)Lat-ton = fresh air latent load (ton)
(FA)kW = heat kW to statFA set
temperature
21
Air return
TBLD-AR = return air temp (F) before return
fans
(Air)ret-CFM = CFM air return from building
(FAN)ret-kW = return fans total kW
(FAN)ret-ton = cooling load (ton) due to
(FAN)ret-kW
(Air)ret-ton = return air (ton) before return
fans
TAR to VAV = TBLD-AR + delta T due to return
fans kW
VAVret-sen ton = return sensible (ton) to
VAV fans inlet
VAVret-lat ton = return latent (ton) to VAV
fans inlet
VAVret-CFM = return CFM to VAV fans inlet
Exhaust air
ExLat-ton = latent load (ton) exhausted
ExCFM = CFM of exhaust air
TEx = temperature of exhaust air
Exsen-ton = sensible load (ton) exhausted
VAV Fans
Tret+FA = return and fresh air mix
temperature (F)
(dh) = VAV air static pressure (in)
Efan-VSD = VAV fans efficiency
VAVinlet-sen-ton = sensible load (ton) inlet to
VAV fans
VAVinlet-lat-ton = latent load (ton) inlet to
VAV fans
Tair-VAV = temp air to coils after VAV fan
heat
(FAN)VAV-CFM = CFM air thru coils
(FAN)ton-VAV = load (ton) due to VAV fan
kW
(FAN)kW-VAV = total VAV fan kW demand
AIR SIDE SYSTEM PLUS BUILDING
FAN kW = total air handlers kW
SITE kW = total site or air side kW
Plantton = (COIL)L+s ton load (ton) to plant
CENTRAL PLANT
22
Nomenclature will be defined by
addressing each component of the
plant.
Primary/secondary pumping
nomenclature
gpmevap = total gpm flow thru
evaporators
(H)pri-total = total primary pump head (ft) =
(H)pri-pipe + (H)pri-fittings + (H)pri-bp + (H)evap
(H)pri-pipe = primary pump head due to
piping (ft)
(H)pri-fittings = primary head due to pump &
fitting (ft)
(Ef)c-pump = efficiency of chiller pump
Pc-heat-ton = chiller pump heat to
atmosphere (ton)
Pc-kW = one chiller pump kW demand
(kW)
Pchiller-# = number chiller pumps operating
(lwt)evap = temperature water leaving
evaporator (F)
Tbp = temperature of water in bypass (F)
gpmbp = gpm water flow in bypass
(H)pri-bp = head if chiller pump flow in
bypass (ft)
(ewt)evap = temp water entering
evaporator (F)
Psec-heat-ton = secondary pump heat to
atmosphere (ton)
Psec-kW = kW demand of secondary pumps
Efdes-sec-p = design efficiency of secondary
pumping
Efsec-pump = efficiency of secondary
pumping
(H)sec = secondary pump head (ft) = (H)sec-
pipe + (H)sec-bp + (H)coil + (H)valve
(H)sec-pipe = secondary pump head due to
pipe (ft)
(H)sec-bp = head in bypass if gpmsec >
gpmevap
gpmsec = water gpm flow in secondary
loop
(ewt)coil = water temperature entering
coil (F)
23
Plantton = load (ton) from air side to plant
Pipesize-in = secondary pipe size (inches)
(lwt)coil = temperature of water leaving
coil (F)
Evaporator
(evap)ton = load (ton) on one evaporator
TER = evaporator refrigerant temp (F)
TER-app = evaporator refrigerant approach
(F)
EVAPton = total evaporator loads (ton)
(H)evap = pump head thru evaporator (ft)
(evap)ft/sec = velocity water flow thru
evaporator
(evap)des-ft/sec = evaporator design flow
velocity
Compressor:
(chiller)kW = each chiller kW demand
(chiller)lift = (TCR – TER) = chiller lift (F)
(chiller)% = percent chiller motor is
loaded
(chiller)# = number chillers operating
(CHILLER)kW = total plant chiller kW
(chiller)kW/ton = chiller kW per evaporator
ton
Plant kW = total kW demand of plant
Condenser nomenclature:
(cond)ton = load (ton) on one condenser
TCR = temperature of condenser
refrigerant (F)
TCR-app = refrigerant approach
temperature (F)
(COND)ton = total load (ton) on all
condensers
(H)cond = tower pump head thru
condenser (ft)
(cond)ft/sec = tower water flow thru
condenser
Tower piping nomenclature
Pipesize-in = tower pipe size (inches)
gpmT = each tower water flow (gpm)
(H)T-total = total tower pump head (ft)
PT-heat = pump heat to atmosphere (ton)
PT-kW = each tower pump kW demand
EfT-pump = tower pump efficiency
24
Ptower # = number of tower pumps
(H)T-pipe = total tower pump head (ft)
(ewt)T = tower entering water
temperature (F)
(H)T-static = tower height static head (ft)
Trange = tower range (F)= (ewt)T – (lwt)T
(lwt)T = tower leaving water
temperature (F)
Tapproach = (lwt)T – (Twet-bulb)
Tower nomenclature
tfan-kW = kW demand of one tower fan
Tfan-kW = tower fan kW of fans on
tfan-% = percent tower fan speed
tton-ex = ton exhaust by one tower
T# = number of towers on
Tton-ex = ton exhaust by all towers on
Trg+app = tower range + approach (F)
One hour performance indices
BLDkW = kW demand of building lights &
plug loads
FankW = air side fans kW, VAV, return
terminals
Ductheat = perimeter heat to air supply
FAheat = heat added to fresh air
Heattotal = total heat added to air
PlantkW = total plant kW
SystkW = total system kW
CCWSkW = air side + plant kW
ChillerkW/evap ton = chiller kW/evaporator
ton performance
PlantkW/site ton = plant kW per site or air
side ton
CCWSkW/site ton = CCWS kW per load to
plant
WeatherEin-ton = weather energy into the
system
SitekW-Ein-ton = load (ton) due to site kW
PlantkW-Ein-ton = load (ton) due to plant kW
TotalEin-ton = total energy in to system
(ton
Pumptot-heat-ton = total pump heat out
(ton)
AHU Exlat ton = air exhausted latent ton
AHU Exsen ton = air exhausted sensible ton
25
Tower Tton Ex = energy exhausted by
tower (ton)
Total Eout ton = total energy out of system
(ton)
24 hour performance indices
BLD24hr-kW = building 24 hour kW usage
Fan24hr-kW = fan system 24 hour kW usage
Duct24hr-heat kW or therm = duct heat
FA24hr heat kW or therm = fresh air heat
Heat24hr total kW or therm = total heat into
system air
Plant24hr kW = plant 24 hour kW usage
Syst24hr kW & therm = total system 24 hour
energy usage
(CCWS)24hr-kW = Central chilled water
system (air side + plant) 24 hour kW
usage
Weather24hr-Ein-ton = 24 hour weather
energy into system
SITE24hr-kW-Ein-ton = 24 hour energy into site,
building & air side system
Plant24hr-kW-Ein-ton = 24 hour kW energy into
plant
Total24hr-Ein-ton = total 24 hour energy into
system
Pump24hr Heat out-ton = pump heat to
atmosphere (ton)
AHU Ex24hr Lat ton = exhausted latent load
from building
AHU Ex24hr-sen-ton = exhausted sensible
load from building
Tower24hr out-ton = tower exhaust from
system (ton)
Total E24hr-out-ton = total 24 hour energy
out of system
26
27