Embed Size (px)
Citation preview
ABSTRACT
Title of Dissertation/Thesis: FISH ASSEMBLAGE STRUCTURE IN MARYLAND’S COASTAL LAGOON COMPLEX
Robert F. Murphy, Master of Science, 2005 Dissertation/Thesis Directed By: Professor David H. Secor, Marine, Estuarine, and
Environmental Science Program
Fish assemblage structure of Maryland’s coastal lagoon complex was analyzed for
spatial and seasonal patterns for the period 1991-2000. Non-metric multidimensional
scaling ordinated sites from Maryland’s state trawl and seine surveys into discrete groups
associated with each embayment. Dominant species from both surveys included
Callinectes sapidus, Anchoa mitchilli, Leiostomous xanthurus, Bairdiella chrysoura, and
Brevoortia tyrannus. One hundred two species were identified in the surveys, with total
species richness highest in Chincoteague and lowest in Assawoman and Sinepuxent. The
seine survey had the lowest catch-per-site in Chincoteague Bay while the other three
embayments were of similar magnitude. The trawl survey had the lowest catch-per-site
in Sinepuxent Bay (3,079) and the highest in Assawoman Bay (27,146). There was clear
seasonality in assemblage structure with peak abundance and diversity in the summer
compared to other seasons. Factors influencing the structure of Maryland’s coastal
lagoon complex included proximity to oceanic exchange and trophic status.

FISH ASSEMBLAGE STRUCTURE IN MARYLAND’S COASTAL LAGOON COMPLEX
By
Robert F. Murphy
Thesis submitted to the Faculty of the Graduate School of the University of Maryland, College Park, in partial fulfillment
of the requirements for the degree of Master of Science
2005
Advisory Committee: Professor David H. Secor, Chair Professor Walter R. Boynton Professor John E. Olney (School of Marine Science, College of William & Mary)

© Copyright by Robert F. Murphy

ii
ACKNOWLEDGEMENTS
This research would not have been possible without the assistance from many organizations and individuals. Several people from the Maryland Department of Natural Resources provided assistance in acquisition of the data set used in this analysis including J. Casey, S. Doctor, C. Wazniak, and M. Hall. I would also like to thank those organizations that provided financial support to me over the course of my graduate career, including Maryland SeaGrant, Maryland Coastal Bays Program, and the Virginia National Estuarine Research Reserve. Obtaining a graduate education certainly necessitates intangibles and experiences beyond the scope of program requirements. Colleagues within the school, usually the students, best provide these experiences. Such assistance was provided by E. Martino, R. Kraus, J. Callihan, B. Puckett, R. Woodland, S. McGuire, L. Kerr, and R. Shcroepfer. Special thanks are given to my advisory committee, including J. Olney, W. Boynton, and E. Koch. Dr. David Secor, chair of my committee, showed patience as my thesis evolved through my time at CBL. He provided excellent guidance, advice, and support. For this, I thank him. Lastly, but most importantly, I would like to thank those closest to me for providing emotional support. My family has been extremely supportive and patient as I completed my research. My wife Beth and sons Ian and Declan endured many moons of a graduate student’s erratic schedule. I am indebted to them for the unconditional love and support they provided.

iii
TABLE OF CONTENTS
Acknowledgements………………………………………………………...…………….. ii Table of Contents………….……………………………………………………………...iii List of Figures…….………..………………………………………………..…………....iv List of Tables……………………………………………………………….……………..v Introduction………………………………………………………….…………………….1 Materials and Methods………………………….……………….………………………...9
Study Area……………………………………………..………………………….9 Survey Design………………………………………..…………………………..11 Statistical Analyses…………………………………..…………………………..13 Single Species…………….……………………..……………………………….13 Community Analysis…………..………………………….……………………..15
Results…………………………………………………………………..………….…….19 Water Quality……………………………………………………………….…….19 Catch Characteristics……………………...…………………………….………..19 Single Species……….……………..…...………………………….……………..29
Assemblages and Embayments………………………………………….……….49 Diversity………………………………………………………………………….58
Discussion…………………………………...…………………………………………...69 Fish Assemblage by Embayment………………………………..……………….69 Seasonal Variability of Dominant Species………………………………………75 Community Structure………………..……………………..………….…….…...80 Habitat and Assemblage Metrics……………………………………..………….82
Literature Cited……………………………………...…………………………………...86

iv
LIST OF FIGURES
Figure 1: Map of sampling locations….…………………………………………………10 Figure 2: Seagrass coverage by embayments, 1991-2002……………………………….12 Figure 3: Temperature and salinity across years for both seine and trawl surveys…..…20 Figure 4: Blue crab abundance for trawl survey, 1991-2002……….……………………31 Figure 5: Blue crab abundance for seine survey, 1991-2002 ……………………………32 Figure 6: Bay anchovy abundance for trawl survey, 1991-2002……...…………………34 Figure 7: Bay anchovy abundance for seine survey, 1991-2002………………………...35 Figure 8: Spot abundance for trawl survey, 1991-2002 …………………………………36 Figure 9: Spot abundance for seine survey, 1991-2002………….………………………37 Figure 10: Weakfish abundance for trawl survey, 1991-2002………...…………………38 Figure 11: Atlantic herring abundance for trawl survey, 1991-2002……….……………39 Figure 12: Croaker abundance for trawl survey, 1991-2002…….………………………41 Figure 13: Summer flounder abundance for trawl survey, 1991-2002……..……………42 Figure 14: Silver perch abundance for trawl survey, 1991-2002……...…………………43 Figure 15: Silver perch abundance for seine survey, 1991-2002………………………...44 Figure 16: Atlantic menhaden abundance for seine survey, 1991-2002…………………45 Figure 17: Atlantic menhaden abundance for trawl survey, 1991-2002…………………46 Figure 18: Classification and regression tree (CART) diagrams for bay anchovy, Atlantic
herring, croaker, and summer flounder in the trawl survey, 1991-2002…………48 Figure 19: Non-metric multidimensional scaling (MDS) plots of trawl and
seine data 1991-2002…………………………………………………………….50 Figure 20: Non-metric multidimensional scaling plots of trawl
data (1991-2002) by season …………………………………………...…….…..51 Figure 21: Cluster dendrogram for all sites from trawl (a) and
seine (b) data, 1991-2002 ………………………………………………………..52 Figure 22: Non-metric multidimensional scaling plot of trawl data by season. ………...55 Figure 23: Mean number of species per haul for 1991-2002 trawl survey ……………...60 Figure 24: Mean number of species per haul for 1991-2002 seine survey …………...…61 Figure 25: Shannon-Weiner diversity index (H’) for 1991-2002 finfish survey ………..64 Figure 26: K-dominance curves for each embayment by gear type ………….…………67 Figure 27: K-dominance plot for each season by gear type…………………………...…68

v
LIST OF TABLES Table 1: Number of sampling stations for each bay by gear type………………...……..12 Table 2: Seasonal assignment for sampling month by gear……………………………..14 Table 3: Results of a two-factor nested model ANOVA comparing water quality data...20 Table 4: Mean water quality values collected during trawl………………………….…..21 Table 5: List of species caught and CPUE (no. per gear deployment) for each
embayment and gear type, 1991-2002…………………………………...23 Table 6: Number of species, individuals, and mean catch per site for each embayment and
season by gear type, 1991-2002………………………………………….30 Table 7: Analysis of Similarity by embayment for trawl and seine survey…………...…54 Table 8: Analysis of Similarity on trawl data for seasonal comparisons……………...…56 Table 9: Results from Similarity Percentage (SIMPER) analysis on trawl data…...……57 Table 10: Results from Similarity Percentage (SIMPER) analysis on seine data……….59 Table 11: Comparison of mean species richness (per haul) between bays and seasons…63 Table 12: Pairwise comparisons of Shannon-Wiener diversity index (H’) values for
each gear type…………………………………………………………....66 Table 13: Comparison of species richness between adjacent coastal systems
along the mid-Atlantic shore……………………………………………..70

1
INTRODUCTION
Coastal lagoons are often highly productive systems that function as nursery areas
and feeding grounds for coastal fishes and thereby potentially support important
commercial and recreational fisheries. Fish assemblages in coastal lagoons and estuaries
have been widely studied in both tropical and temperate regions (Warburton 1978;
Pollard 1994; Whitfield 1999; Mariani 2001; Pombo and Rebelo 2002; Jung and Houde
2003; Perez-Ruzafa et al. 2004). Regardless of geographical region, such coastal habitats
can play a crucial role in providing shelter (Orth et al. 1984; Heck Jr. et al. 2003) and
trophic resources for various stages of many marine fish species (Perez-Ruzafa et al.
2004). Adjacent coastal systems can theoretically provide similar ecological functions,
but it has been shown that coastal lagoons contain assemblages distinct from adjacent
open coastal habitats (Ishitobi et al. 2000).
Fish assemblages in estuaries are largely structured by abiotic gradients
(Kupschius and Tremain 2001) that include salinity (Wagner 1999; Martino and Able
2003), temperature (Maes et al. 2004), dissolved oxygen (Weisberg et al. 1996; Eby and
Crowder 2004), habitat heterogeneity and structure such as reefs or submerged vegetation
(Heck Jr. et al. 2003; Martino and Able 2003) and turbidity (Cyrus and Blaber 1992).
Coastal lagoons are arranged differently than the more typical east coast estuaries that
have strong salinity gradients due to higher freshwater input (Yanez-Arincibia et al.
1994). These systems are more influenced by oceanic exchange via inlets as opposed to
watershed effects commonly examined in drowned river valley estuaries. Therefore, the
fish assemblages may be structured differently with less influence from watershed effects
and greater influence from oceanic proximity.

2
Like other lagoon systems, the coastal embayments of Maryland (USA) located
on the Delmarva Peninsula (the coastal plain peninsula between the Chesapeake Bay and
Atlantic Ocean, comprised of the states of Delaware, Maryland, and Virginia) support a
diverse array of fish and invertebrates (Cargo 1958; Schwartz 1961; Schwartz 1964;
Wazniak et al. 2004). These four coastal embayments each have distinct characteristics
related to flow, area, depth, connectivity to ocean waters, and anthropogenic habitat
alterations (see further description below). Still, the embayments share connections with
the ocean and are well connected as a series of lagoons. The degree of similarity of fish
assemblage between embayments remains an open question, and one of consequence to
similar lagoon systems elsewhere. In this study, I hypothesized that the four
embayments that comprise Maryland’s lagoon complex support differing assemblages of
finfish and blue crab populations, and that these differences are related to marine
influences (here, related to the principal connection of the Ocean City Inlet). Similarly,
because this is a temperate system, I hypothesized that spatial differences in assemblage
structure will vary seasonally. Assemblage structure related to season and embayment
must also be examined in the context of water quality parameters known to affect fish
distributions in estuarine systems (i.e., temperature, salinity, dissolved oxygen, and
bottom structure).
The definition of estuary has been the subject of extensive and controversial
discussion, due in part to the several geomorphological features and physiochemical
characteristics of these systems (Lalli and Parsons 1997). Here the term estuarine coastal
lagoon is used to indicate a shallow body of water lying parallel to the neritic shore and
separated from it by a barrier (e.g., barrier island) except for small connections where

3
freshwater enters from land or inlets to the ocean (Lankford 1977). In this, they differ
geologically from typical estuaries, which are defined in terms of the hydrological
conditions and gradients of salinity and temperature (density) (Fairbridge 1980). The
particular abiotic attributes of lagoons (shallowness, high turbidity, nature of the
substrate, temperature fluctuation, salinity, and oxygen levels) associated with its high
biotic productivity often offer excellent conditions for colonization by many marine
species of fish (Pollard 1994; Yanez-Arincibia et al. 1994; Nixon et al. 2001; Poizat et al.
2004; Vega-Cendejas and Hernandez de Santillana 2004). Fish utilize coastal
embayments during different phases of their life-cycle: as a nursery, juveniles apparently
benefit from abundant food supply and protection from predators (Ross and Epperly
1985; Perez-Ruzafa et al. 2004); as a permanent home for sedentary species (Szedlmayer
and Able 1996; Mariani 2001); and as a migratory route for diadromous species (Mariani
2001; Paperno et al. 2001). Much information is now available on the life cycles of
fishes in relation to the lagoon-estuarine environment (Day Jr. and Yanez-Arincibia 1985;
Henderson and Margetts 1988; Yanez-Arincibia et al. 1994) and various explanations
have been proposed to link abundances with environmental parameters (Nixon 1982;
Whitfield 1999; Martino and Able 2003).
Previous investigations examining ichthyofaunal assemblages in coastal areas
have identified several environmental parameters that affect structural components of the
assemblage (Whitfield 1999; Desmond et al. 2002; Perez-Ruzafa et al. 2004). The
primary variables affecting species in nearshore regions are salinity (Wagner 1999;
Martino and Able 2003; Poizat et al. 2004), temperature (Desmond et al. 2002),
chlorophyll a (Perez-Ruzafa et al. 2004), oxygen (Eby and Crowder 2004), and habitat

4
heterogeneity, particularly with regard to structural components such as vegetation or reef
systems (Whitfield 1999; Martino and Able 2003). In typical drowned river valley
estuarine systems, environmental gradients are often steep due to the large watershed to
surface area ratio and associated freshwater influence. This can cause dramatic shifts in
salinity and temperature that estuarine organisms must either adapt to, or avoid (Vernberg
1982). Coastal lagoons, on the other hand, are less influenced by high freshwater flow
(less stratification) but are influenced by winds, tides, and location of oceanic input
(Mariani 2001; Poizat et al. 2004). Assemblages in these systems, therefore, must
contain those species capable of thriving under dynamic conditions or shift structure as
conditions vary. Additionally, many species use estuaries facultatively at different
phases of their life cycles that include nursery (Gillanders et al. 2003), reproduction
(Hagan and Able 2003), and opportunistic foraging (Franzoi et al. 1993). Many of these
life history traits are ontogenetic in nature and thus a species will occupy multiple niches
throughout its life (Able and Fahay 1998). Therefore, one would expect seasonal
turnovers in species in temperate estuaries and lagoons and that the phenology (seasonal
appearance of species) can be a characteristic attribute of lagoon/estuarine systems.
Yáňez-Arincibia (1994) noted differential use of lagoon-estuarine systems along a
latitudinal gradient, pointing out that there are a greater number of fish species in tropical
and sub-tropical lagoon-estuarine ecosystems than in comparable temperate or boreal
systems (Yanez-Arincibia 1985). However, some large temperate-latitude estuaries, such
as Chesapeake Bay, Delaware Bay, and Narraganset Bay, also have a large number of
fish species (Day Jr. et al. 1989; Jung and Houde 2003). The theory of island
biogeography (MacArthur and Wilson 1967), which relates species number to the size of

5
habitats could possibly provide a framework for these exceptions. Additionally,
considering estuaries and lagoons as nutrient sinks, the agricultural paradigm of
eutrophication promoting secondary production may also play a role in increasing fish
production and diversity (Lee and Jones 1991; Pauly and Yanez-Arincibia 1994;
Jeppesen et al. 2000; Nixon and Buckley 2002).
Like other coastal environments, the coastal lagoons of Maryland, Delaware, and
Virginia play an important role in the regional economies of these three states due to
increased tourism and residents moving into the watershed and increasing demands on
the natural resources for both commercial and recreational purposes (Derickson and Price
1973; Maxted et al. 1997; Wazniak et al. 2004). As urban and suburban development
proceeds and society places greater demands on the shared public resources, it is essential
that we better understand the complexities of the biota that inhabit these diverse lagoons.
The last comprehensive analysis of the ichthyofauna from Maryland’s lagoonal system
(Schwartz 1961; Schwartz 1964) approached the issue of fish utilization of the Delmarva
coastal bays from primarily a qualitative perspective and did not attempt a quantitative
analysis of assemblage structure. Still, Schwartz (1964) speculated that there were
differences in the faunal composition of the northern bays (Assawoman and Isle of
Wight) versus the southern bays (Sinepuxent and Chincoteague) due largely to the
stronger currents deflected north from the inlet at Ocean City (Fig 1). Because of the
various influences on the specific embayments including eutrophication (Boynton et al.
1996), abiotic variability (Wazniak et al. 2004), habitat variation including submerged
macrophyte coverage (Wazniak et al. 2004), wetland acreage, anthropogenic alteration
(Maxted et al. 1997), and differing geomorphologies (Pritchard 1960; Cerco et al. 1978),

6
it is likely that each embayment would support a distinct, identifiable fish and
macroinvertebrate community. Furthermore, due to the noted transient nature of many of
the species likely to use these systems, I characterized seasonal changes in the
assemblage.
I used several quantitative measures of assemblage structure, including individual
species abundance, indices of diversity and species richness, and multivariate approaches
to evaluate spatial and seasonal patterns of species co-occurrence. This analysis was
supported by a twelve-year survey conducted by the state of Maryland. Community
ecology has struggled with the definition of biodiversity and its measurements and causal
factors (Hurlbert 1971; Peet 1974; Lambshead et al. 1983; Weisberg et al. 1996; Wagner
1999). An analysis of large data sets spanning several years with fixed stations provides
a rare opportunity to use multiple metrics of diversity in order to gain insight into
assemblage dynamics (Peet 1975; Desmond et al. 2002; Mouillot et al. 2005). In this
study, I used several assemblage metrics each as a lens, which can potentially describe
multiple attributes of the community and its spatial and temporal structure.
Coastal lagoons by definition are shallow systems and the Delmarva embayments
are typical in this regard (mean depths of embayments <2 m). Nonetheless, there are
distinct “profundal” habitats in the channels (largely tidally mediated) and large expanses
of littoral habitat that grade into marshes, mussel beds, fields, lawns, docks, and
bulkheads. The design of the Maryland fish survey includes two capture techniques
(seine and trawl) that sample community data from these two habitat types (profundal
and littoral). Although comparisons of data from differing gear types can be fraught with
errors associated with sampling efficiency (for example area covered, mesh size

7
differences, and behavioral aspects of specific species), each gear is efficient for the
intended habitat type and comparisons of species richness and concurrence of trends for
species captured will be treated separately.
In the mid-Atlantic coastal lagoons of Maryland, fluctuations in salinity,
temperature, and dissolved oxygen vary primarily on a seasonal basis, but important
differences also occur between embayments (Boynton et al. 1996; Wazniak et al. 2004).
Although biologists frequently study the influence of one or a few environmental factors
at a time, it is important to recognize that many factors may act in concert to affect an
organism’s physiology and behavior (Vernberg 1982). Individual species are expected to
have differing preferences and tolerance ranges for mixtures of environmental factors.
To evaluate environmental influences on assemblage structure, I assumed that such
factors would influence assemblages by their influence on dominant individual species.
Multiple environmental factors were analyzed through Classification and Regression
Tree (CART) analysis.
The Delmarva coastal lagoon complex represents an opportunity to analyze
assemblage structure related to season, and habitat attributes specific to constituent
embayments. Here, I analyzed a moderately long-term data set (12 years, 1991-2002)
available from Maryland Department of Natural Resources. Objectives were:
a) Examine interannual variability and spatial patterns in key (dominant)
species and test associations between their abundance and environmental
parameters.
b) Evaluate differences in assemblage structure among the four primary
embayments in Maryland and identify the discriminating species.

8
c) Contrast metrics of biodiversity across the four embayments and compare
these metrics to other assemblage characteristics.
d) Characterize seasonal changes in assemblage structure.

9
MATERIALS AND METHODS
I. Study Area
The Maryland coastal lagoon complex extends along the entire Atlantic coast of
the state behind the barrier islands of Assateague and Fenwick. The system consists of
four major embayments: the southern embayments bays of Chincoteague and
Sinepuxent, and the northern embayments of Assawoman and Isle of Wight (Figure 1).
The principal population center is the resort town of Ocean City, located on Fenwick
Island. These embayments are connected to several smaller tidal creek systems with low
freshwater discharge and exhibit little stratification due primarily to wind driven mixing
(Cerco et al. 1978). As a result of the low relief landscape and sandy soils, rainwater
permeates the ground quickly and seeps into the bays as groundwater that can have a
localized effect on salinity.
The coastal bays and associated tributaries are shallow, with an average depth of
1.2 m. The watersheds of the embayments are relatively small compared to open water
areas: 45,246 ha, or about 1.7 times the area of the bays (Boynton et al. 1996). By
comparison, the Chesapeake Bay’s watershed is 16-fold that of open-water areas.
Additionally, the coastal bays maintain a constricted connection to the ocean at the Ocean
City Inlet and at the southern end of Chincoteague Bay via a series of channels. Pritchard
(1960) estimated the flushing rate for Chincoteague Bay at 7.5% per day. Flushing rates
and oceanic exchange of the northern embayments are predicted to be higher, but still
substantially less than large estuarine systems such as the Chesapeake or Delaware Bays.
The combination of reduced freshwater input and limited oceanic exchange results in low
water replacement times and thus these systems retain nutrients, sediments, and other

10
Figure 1: Map of study location with trawl (triangle) and seine (circle) sites. (courtesy MD Dept. of Natural Resources; Wazniak et al 2004)
1
2 3
4 5
67
8
9
10
1112
13
14
15
17
16
18
19
Assawoman Bay
Isle of Wight Bay
Sinepuxent Bay
Chincoteague Bay
11
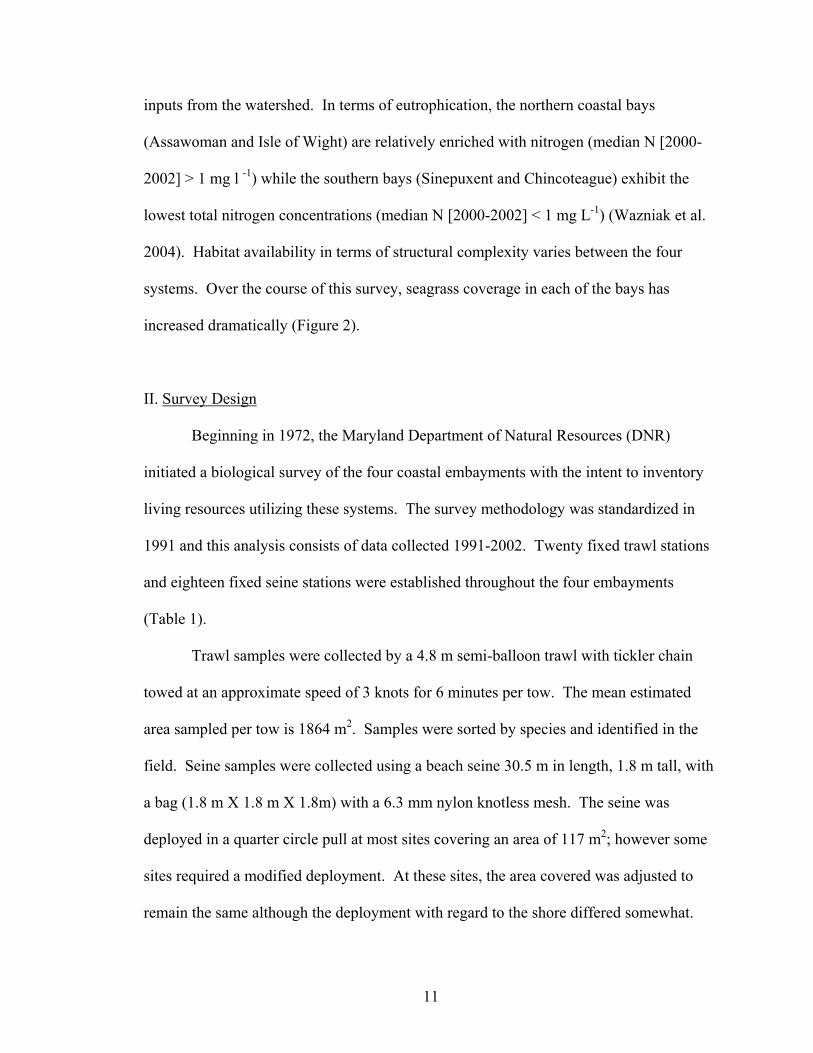
inputs from the watershed. In terms of eutrophication, the northern coastal bays
(Assawoman and Isle of Wight) are relatively enriched with nitrogen (median N [2000-
2002] > 1 mg l -1) while the southern bays (Sinepuxent and Chincoteague) exhibit the
lowest total nitrogen concentrations (median N [2000-2002] < 1 mg L-1) (Wazniak et al.
2004). Habitat availability in terms of structural complexity varies between the four
systems. Over the course of this survey, seagrass coverage in each of the bays has
increased dramatically (Figure 2).
II. Survey Design
Beginning in 1972, the Maryland Department of Natural Resources (DNR)
initiated a biological survey of the four coastal embayments with the intent to inventory
living resources utilizing these systems. The survey methodology was standardized in
1991 and this analysis consists of data collected 1991-2002. Twenty fixed trawl stations
and eighteen fixed seine stations were established throughout the four embayments
(Table 1).
Trawl samples were collected by a 4.8 m semi-balloon trawl with tickler chain
towed at an approximate speed of 3 knots for 6 minutes per tow. The mean estimated
area sampled per tow is 1864 m2. Samples were sorted by species and identified in the
field. Seine samples were collected using a beach seine 30.5 m in length, 1.8 m tall, with
a bag (1.8 m X 1.8 m X 1.8m) with a 6.3 mm nylon knotless mesh. The seine was
deployed in a quarter circle pull at most sites covering an area of 117 m2; however some
sites required a modified deployment. At these sites, the area covered was adjusted to
remain the same although the deployment with regard to the shore differed somewhat.

12
Figure 2: Seagrass coverage by embayment 1991-2002. Note the difference in scale along the y-axis for each bay. Data courtesy Virginia Institute of Marine Science. (www.vims.edu/bio/sav)
ASSAWOMAN
50
100
150
200
250
300
ISLE OF WIGHT
20
40
60
80
100
120
140
1991
1992
1993
1994
1995 19
9619
9719
98 1999
2000 20
0120
02
SINEPUXENT
100
200
300
400
500
600
700
800
CHINCOTEAGUE
1000
2000
3000
4000
5000
6000
7000
8000
1991
1992 19
9319
9419
9519
9619
97 1998
1999
2000
2001
2002
YEAR
No.
acr
es S
AV
Table 1: Number of sampling stations for each bay by gear type for MD DNR coastal bays fish monitoring survey, 1991-2002.
Embayment Gear Type Assawoman Isle of Wight Sinepuxent Chincoteague
Seine 3 4 3 8 Trawl 3 4 3 10

13
Samples were processed similarly between surveys. Water quality and environmental
parameters collected at each sampling event included dissolved oxygen (mg/l), salinity,
temperature, tidal state, and weather phenomena. From 1991-2000, dissolved oxygen
and temperature were measured in situ using a YSI © 51B, and salinity was measured
with a YSI © 33 meter. Beginning in 2000, dissolved oxygen, temperature, and salinity
were all measured using a YSI © 85 meter. Trawl sites were sampled seasonally (see
Table 2 for seasonal assignments) whereas seine sites were only sampled two times per
year. All data was transcribed into an Access (Microsoft Office, 2000) database and data
manipulation was done in Excel spreadsheets.
III. Statistical Analyses
Because sampling effort was uneven between the four embayments, catch per unit
effort (CPUE; i.e., catch per tow or haul) statistics were calculated for each bay.
Furthermore, CPUE was calculated for each site with sample catches pooled across years.
Water quality parameters were tested for significance using a two-way ANOVA with site
nested within embayment and embayment nested within season (Sokal and Rohlf 1995).
Assumptions for the ANOVA (normality and homogeneity of variances) were examined
both visually and using the Shapiro-Wilkes test statistic. Water quality data met the
assumptions of the ANOVA model and did not require transformations.
Single Species

14
Table 2: Seasonal assignment for sampling month by gear type for MD DNR’s coastal fish survey, 1991-2002
Gear Month sampled Season Assignment
Range of Dates
Seine June, July Early Summer June 14 – July 27 Seine September Late Summer Sept. 9 – Sept. 30 Trawl April, May Spring April 1 – May 31 Trawl June, July Early Summer June 10 – July 31 Trawl August, September Late Summer Aug. 5 – Sept. 30 Trawl October Fall Oct. 1 – Oct. 30

15
Variations in individual species abundance were analyzed for differences among
bays, seasons, and for possible associations with environmental variables. Individual
species abundance was first transformed if necessary, and then analyzed for potential bay
or seasonal effects. If normality was not achieved through data transformation, a
Kruskal-Wallis non-parametric test was used to determine departure from the null
hypothesis (Sokal and Rohlf 1995). To investigate environmental associates with
patterns of species abundance, I employed a Classification and Regression Tree (CART)
analysis (Breiman et al. 1984). CART is a flexible nonparametric multivariate analysis
that provides dichotomous keys for each species’ abundance based on both continuous
and categorical variables, including DO, salinity, temperature, embayment, submerged
aquatic vegetation (SAV) coverage of each bay (specific to year). The CART algorithm
constructs a structural tree (dichotomous key) by repeated splits of the subsets of the
multivariate records into descendent pairs of subsets selecting the combination of
parameters that most minimize error. The model was run allowing interaction of
variables to better estimate confounding responses. For each dichotomous branch, a
criteria coefficient is estimated (e.g., less than or greater than 20 C). If the resulting node
was an interaction of a categorical and continuous variable, the coefficient was
nonsensical (and therefore not presented). I included potential explanatory variables:
DO, temperature, embayment, tidal state, SAV coverage, and abundance of other
dominant species.
Community Analysis
The fish abundance data was transformed after determining non-normality of the dataset,
due primarily to a large number of zero observations for a given species. Various

16
attempts at transforming the data (e.g., fourth-root and ln +1) failed to normalize the
distribution, so non-parametric analyses were selected. There are several methods
available for reducing the high dimensionality of species abundance data to evaluate the
assemblage structure. Each of these techniques is sensitive to various aspects of
structural variation and thus each has its advantages and disadvantages (Hurlbert 1971;
May 1975; Peet 1975; Magurran 1991). In order to adequately assess various attributes
of the community, and to make certain that defensible conclusions are drawn about
emergent patterns, I used a variety of community descriptors to provide a broad view of
community structure. Three univariate measures of diversity were calculated: species
richness (an overall measure of niche availability) and the Shannon-Weiner index (H),
which is most sensitive to changes in rare species (Peet 1974).
As a complement to the traditional univariate descriptors of community structure,
k-dominance curves were generated to show structure relative to dominant species and
number of individuals (Lambshead et al. 1983). K-dominance curves are constructed by
plotting the log species rank (k) against the percent cumulative abundance. More diverse
communities (less dominance) have less arced curves with lower slopes, and curves from
different populations or samples plotted on the same graph may be compared for
diversity if the curves do not intersect (Lambshead et al. 1983). These curves were
constructed to compare dominance patterns between bays and seasons for each gear type.
The assemblage metrics described thus far do not take into account the individual
species in the samples. Thus, they are ineffective at detecting events or factors that cause
one species to occur more or less abundantly than others that share similar ecology. By
using these emergent metrics of community alone, one could potentially fail to observe

17
structural changes in the community structure; therefore additional analyses that include
species identity are considered (Rice 2000; Martino and Able 2003). Ordination and
clustering techniques are multivariate procedures that provide a means for assessing
spatial and temporal differences while taking species composition into account. Of the
available methods, non-metric multidimensional scaling (MDS) has been shown to be a
robust non-parametric technique (Fasham 1977; Clarke and Ainsworth 1993) that can
ordinate non-parametric data (Clarke 1993). MDS plots are based on similarity matrices
that are constructed using an abundance weighted Bray-Curtis similarity index. MDS
ordination positions samples in two- (or three, if necessary) dimensional space so that the
relative distance between samples reflects their relative dissimilarity, with the samples
most similar to one another occurring closest together. Sample sites were used as the
sampling unit (pooled across season and year) to look for patterns among embayment
assemblages. The goodness of fit of the data distributed across two composite axes was
indexed by the stress coefficient, which tends towards zero when the data are perfectly
represented. Stress may be thought of as the distortion involved in representing multi-
dimensional data in two dimensions (Field et al. 1982). MDS plots are deemed an
acceptable representation of the data when stress values are < 0.2 (Clarke 1993).
To examine the underlying structure of the MDS plots, a cluster analysis were
performed. The cluster analysis represents the same data as the MDS; therefore any
inconsistencies between the two approaches should be attributed to the inadequacy of the
two-dimensional ordination (i.e., the MDS approach). The scale on the dendrogram of
the cluster analysis represents dissimilarity.

18
Differences in assemblage structure between embayments or seasons identified by
MDS was further analyzed by another non-parametric analysis: permutation-based, one-
way analysis of similarity (ANOSIM) (Clarke 1993). Where appropriate, R-statistic
values were used to determine the dissimilarity of groups. R values were protected for
pairwise comparisons and represent the extent of similarity between two groups. Values
close to 1 indicated very different composition between samples, while values near zero
are expected to exhibit little difference. ANOSIM was used to test the null hypothesis
that within seasons, no changes in community structure were observed between the
embayments, and secondly to test that within single embayment assemblages, there was
no difference between seasons.
To establish which species most contributed to community structure, the SIMPER
(similarity percentage analysis) approach was used (Clarke 1993). This method identifies
which species (due to their relative abundances) are contributing most to the overall
dissimilarity between defined (a priori) groups. Groups were defined by either specific
embayment or season.
ANOVA and CART analyses were carried out in Systat version 11.0.
Multivariate community analyses including cluster analysis, MDS, ANOSIM, and
SIMPER procedures were carried out in the Community Analysis Package (Pisces
Conservation, Ltd., 1997). Species richness and diversity calculations were performed
using the software program Species Richness and Diversity (Pisces Conservation, Ltd.,
1997).
19
RESULTS
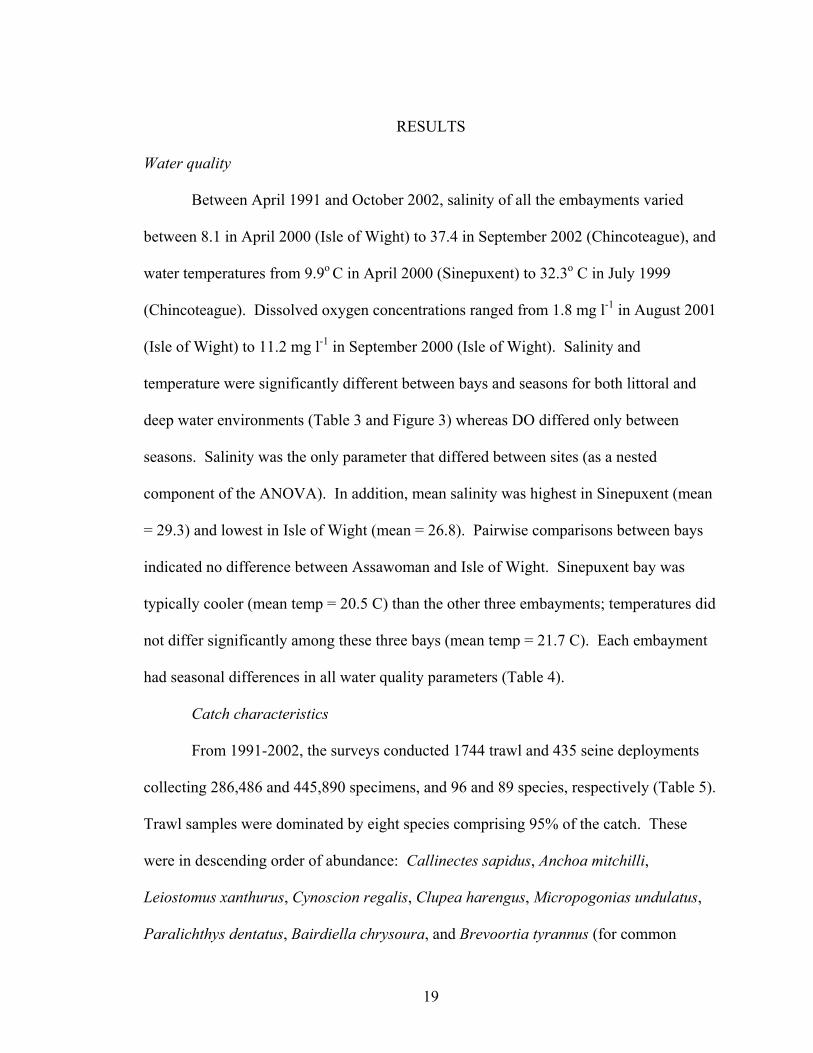
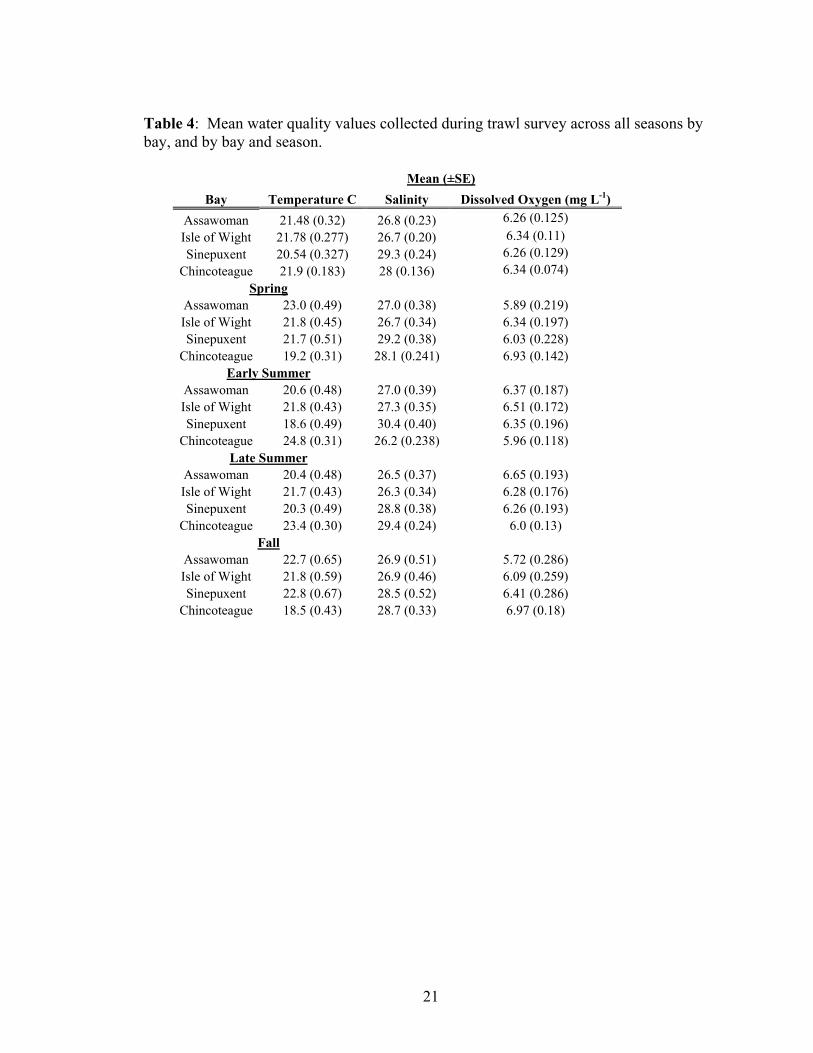
Water quality
Between April 1991 and October 2002, salinity of all the embayments varied
between 8.1 in April 2000 (Isle of Wight) to 37.4 in September 2002 (Chincoteague), and
water temperatures from 9.9o C in April 2000 (Sinepuxent) to 32.3o C in July 1999
(Chincoteague). Dissolved oxygen concentrations ranged from 1.8 mg l-1 in August 2001
(Isle of Wight) to 11.2 mg l-1 in September 2000 (Isle of Wight). Salinity and
temperature were significantly different between bays and seasons for both littoral and
deep water environments (Table 3 and Figure 3) whereas DO differed only between
seasons. Salinity was the only parameter that differed between sites (as a nested
component of the ANOVA). In addition, mean salinity was highest in Sinepuxent (mean
= 29.3) and lowest in Isle of Wight (mean = 26.8). Pairwise comparisons between bays
indicated no difference between Assawoman and Isle of Wight. Sinepuxent bay was
typically cooler (mean temp = 20.5 C) than the other three embayments; temperatures did
not differ significantly among these three bays (mean temp = 21.7 C). Each embayment
had seasonal differences in all water quality parameters (Table 4).
Catch characteristics
From 1991-2002, the surveys conducted 1744 trawl and 435 seine deployments
collecting 286,486 and 445,890 specimens, and 96 and 89 species, respectively (Table 5).
Trawl samples were dominated by eight species comprising 95% of the catch. These
were in descending order of abundance: Callinectes sapidus, Anchoa mitchilli,
Leiostomus xanthurus, Cynoscion regalis, Clupea harengus, Micropogonias undulatus,
Paralichthys dentatus, Bairdiella chrysoura, and Brevoortia tyrannus (for common

20
Table 3: Results of a two-factor nested model ANOVA comparing water quality data collected in littoral (seine) and profundal (trawl) environments. Hierarchy of nesting indicated by parentheses. Significance levels are indicated by * p < 0.05, ** p ≤ 0.01, *** p≤ 0.001, NS non-significant at the α = 0.05 level. Source of variation df DO Salinity Temperature Trawl Season 3 *** *** *** Bay 3 NS *** *** Site (Bay(Season)) 65 NS *** NS Error 1658 Seine Season 1 * *** *** Bay 3 NS ** ** Site (Bay(Season)) 28 NS NS NS Error 402
Figure 3: Temperature and salinity across years for profundal (trawl) survey (a) and littoral (seine) survey (b). Values are pooled across all embayments for a composite mean. Bars represent standard error. Temperature is given in oC and salinity as parts per thousand.
5
10
15
20
25
30
35
1991 1993 1995 1997 1999 2001 2003
5
10
15
20
25
30
35
TemperatureSalinity
5
10
15
20
25
30
35
5
10
15
20
25
30
35
(a)
(b)
21
Table 4: Mean water quality values collected during trawl survey across all seasons by bay, and by bay and season.
Mean (±SE) Bay Temperature C Salinity Dissolved Oxygen (mg L-1)
Assawoman 21.48 (0.32) 26.8 (0.23) 6.26 (0.125) Isle of Wight 21.78 (0.277) 26.7 (0.20) 6.34 (0.11) Sinepuxent 20.54 (0.327) 29.3 (0.24) 6.26 (0.129)
Chincoteague 21.9 (0.183) 28 (0.136) 6.34 (0.074) Spring
Assawoman 23.0 (0.49) 27.0 (0.38) 5.89 (0.219) Isle of Wight 21.8 (0.45) 26.7 (0.34) 6.34 (0.197) Sinepuxent 21.7 (0.51) 29.2 (0.38) 6.03 (0.228)
Chincoteague 19.2 (0.31) 28.1 (0.241) 6.93 (0.142) Early Summer
Assawoman 20.6 (0.48) 27.0 (0.39) 6.37 (0.187) Isle of Wight 21.8 (0.43) 27.3 (0.35) 6.51 (0.172) Sinepuxent 18.6 (0.49) 30.4 (0.40) 6.35 (0.196)
Chincoteague 24.8 (0.31) 26.2 (0.238) 5.96 (0.118) Late Summer
Assawoman 20.4 (0.48) 26.5 (0.37) 6.65 (0.193) Isle of Wight 21.7 (0.43) 26.3 (0.34) 6.28 (0.176) Sinepuxent 20.3 (0.49) 28.8 (0.38) 6.26 (0.193)
Chincoteague 23.4 (0.30) 29.4 (0.24) 6.0 (0.13) Fall
Assawoman 22.7 (0.65) 26.9 (0.51) 5.72 (0.286) Isle of Wight 21.8 (0.59) 26.9 (0.46) 6.09 (0.259) Sinepuxent 22.8 (0.67) 28.5 (0.52) 6.41 (0.286)
Chincoteague 18.5 (0.43) 28.7 (0.33) 6.97 (0.18)

22
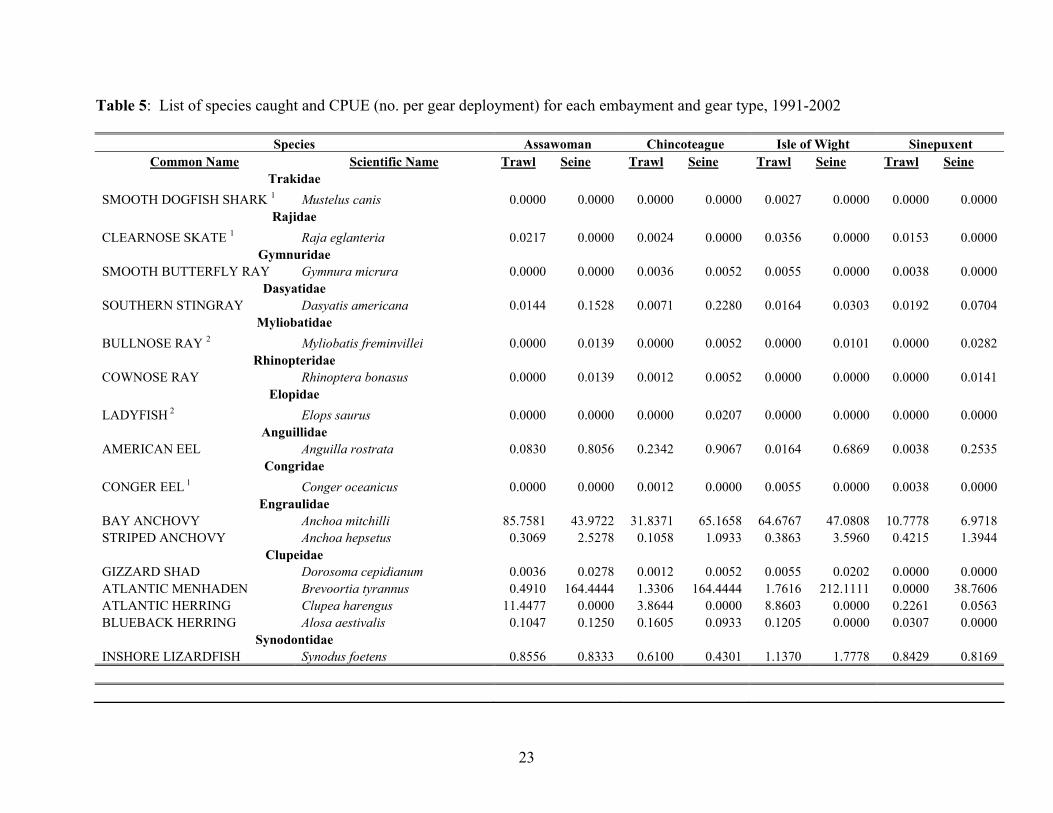
23
Table 5: List of species caught and CPUE (no. per gear deployment) for each embayment and gear type, 1991-2002
Species Assawoman Chincoteague Isle of Wight Sinepuxent Common Name Scientific Name Trawl Seine Trawl Seine Trawl Seine Trawl Seine
Trakidae SMOOTH DOGFISH SHARK 1 Mustelus canis 0.0000 0.0000 0.0000 0.0000 0.0027 0.0000 0.0000 0.0000
Rajidae CLEARNOSE SKATE 1 Raja eglanteria 0.0217 0.0000 0.0024 0.0000 0.0356 0.0000 0.0153 0.0000
Gymnuridae SMOOTH BUTTERFLY RAY Gymnura micrura 0.0000 0.0000 0.0036 0.0052 0.0055 0.0000 0.0038 0.0000
Dasyatidae SOUTHERN STINGRAY Dasyatis americana 0.0144 0.1528 0.0071 0.2280 0.0164 0.0303 0.0192 0.0704
Myliobatidae BULLNOSE RAY 2 Myliobatis freminvillei 0.0000 0.0139 0.0000 0.0052 0.0000 0.0101 0.0000 0.0282
Rhinopteridae COWNOSE RAY Rhinoptera bonasus 0.0000 0.0139 0.0012 0.0052 0.0000 0.0000 0.0000 0.0141
Elopidae LADYFISH 2 Elops saurus 0.0000 0.0000 0.0000 0.0207 0.0000 0.0000 0.0000 0.0000
Anguillidae AMERICAN EEL Anguilla rostrata 0.0830 0.8056 0.2342 0.9067 0.0164 0.6869 0.0038 0.2535
Congridae CONGER EEL 1 Conger oceanicus 0.0000 0.0000 0.0012 0.0000 0.0055 0.0000 0.0038 0.0000
Engraulidae BAY ANCHOVY Anchoa mitchilli 85.7581 43.9722 31.8371 65.1658 64.6767 47.0808 10.7778 6.9718 STRIPED ANCHOVY Anchoa hepsetus 0.3069 2.5278 0.1058 1.0933 0.3863 3.5960 0.4215 1.3944
Clupeidae GIZZARD SHAD Dorosoma cepidianum 0.0036 0.0278 0.0012 0.0052 0.0055 0.0202 0.0000 0.0000 ATLANTIC MENHADEN Brevoortia tyrannus 0.4910 164.4444 1.3306 164.4444 1.7616 212.1111 0.0000 38.7606 ATLANTIC HERRING Clupea harengus 11.4477 0.0000 3.8644 0.0000 8.8603 0.0000 0.2261 0.0563 BLUEBACK HERRING Alosa aestivalis 0.1047 0.1250 0.1605 0.0933 0.1205 0.0000 0.0307 0.0000
Synodontidae INSHORE LIZARDFISH Synodus foetens 0.8556 0.8333 0.6100 0.4301 1.1370 1.7778 0.8429 0.8169

24
Species Assawoman Chincoteague Isle of Wight Sinepuxent Common Name Scientific Name Trawl Seine Trawl Seine Trawl Seine Trawl Seine
Batrachoididae OYSTER TOADFISH Opsanus tau 0.1444 2.6806 0.2069 0.7202 0.2027 1.0101 0.0383 1.2535
Gobiesocidae SKILLETFISH Gobiesox strumosus 0.0072 0.0139 0.0095 0.0725 0.0055 0.0000 0.0000 0.0000
Gadidae ATLANTIC POLLOCK 1 Pollachius virens 0.0000 0.0000 0.0000 0.0000 0.0027 0.0000 0.0038 0.0000 SPOTTED HAKE 1 Urophycis regia 0.3502 0.0000 0.1724 0.0000 0.4082 0.0000 0.1188 0.0000 RED HAKE 1 Urophycis chuss 0.0000 0.0000 0.0000 0.0000 0.0000 0.0000 0.0038 0.0000
Ophidiidae STRIPED CUSK EEL Ophidion marginatum 0.0000 0.0000 0.1332 0.0155 0.0055 0.0000 0.0230 0.0000
Belonidae ATLANTIC NEEDLEFISH Strongylura marina 0.0000 2.1806 0.0012 2.0052 0.0055 1.9596 0.0000 4.0423
Hemiramphidae HALFBEAK 2 Hyporhamphus meeki 0.0000 0.5139 0.0000 0.0363 0.0000 0.0000 0.0000 0.5070
Cyprinodontidae SHEEPSHEAD MINNOW Cyprinodon variegatus 0.0036 2.1944 0.0143 0.6373 0.0000 0.7475 0.0000 0.4085
Fundulidae BANDED KILLIFISH 1 Fundulus diaphanus 0.0000 0.0000 0.0024 0.0000 0.0027 0.0000 0.0000 0.0000 SPOTFIN KILLIFISH 2 Fundulus luciae 0.0000 0.0000 0.0000 0.0000 0.0000 0.0404 0.0000 0.0000 MUMMICHOG Fundulus heteroclitus 0.0000 17.4028 0.0963 8.4093 0.4493 8.2727 0.0000 17.8028 STRIPED KILLIFISH Fundulus majalis 0.0000 9.4583 0.0071 2.9016 0.0164 10.1616 0.0000 12.6479 RAINWATER KILLIFISH Luciana parva 0.0000 6.5278 0.4875 2.9741 0.0055 0.8485 0.0345 8.4085
Atherinopsidae ATLANTIC SILVERSIDE Menidia menidia 0.2383 105.2083 0.5505 53.7047 0.9562 252.4747 0.2567 352.0141 INLAND SILVERSIDE Menidia beryllina 0.0000 1.4583 0.0000 0.1295 0.0740 0.1515 0.0000 0.0000 ROUGH SILVERSIDE Membras martica 0.0000 4.7778 0.0083 0.5855 0.0000 3.1818 0.0000 0.2113
Gasterosteidae FOURSPINE STICKLEBACK Apeltes quadracus 0.0072 1.0000 0.7812 0.9637 0.0164 0.1212 0.0000 0.1690 THREESPINE STICKLEBACK 2 Gasterosteus aculeatus 0.0000 0.0417 0.0000 0.0000 0.0000 0.0000 0.0000 0.0000

25
Species Assawoman Chincoteague Isle of Wight Sinepuxent Common Name Scientific Name Trawl Seine Trawl Seine Trawl Seine Trawl Seine
Syngnathidae LINED SEAHORSE Hippocampus erectus 0.0578 0.0278 0.0392 0.0155 0.1397 0.1414 0.0651 0.1268 DUSKY PIPEFISH Syngnathus floridae 0.0000 0.0139 0.0012 0.0000 0.0000 0.0000 0.0000 0.0000 NORTHERN PIPEFISH Syngnathus floridae 0.2347 2.8194 0.7313 0.9534 0.3342 1.3030 0.1456 1.0986
Fistularidae BLUESPOTTED CORNETFISH Fistularia tabacaria 0.0000 0.0278 0.0048 0.0000 0.0164 0.0202 0.0077 0.0423
Triglidae NORTHERN SEAROBIN Prionotus carolinus 0.3105 0.4583 0.1795 0.2694 0.3699 0.2525 0.8697 0.1127 STRIPED SEAROBIN Prionotus evelans 0.1191 0.0694 0.0476 0.0052 0.1068 0.0808 0.0498 0.0423
Stromateidae HARVESTFISH Peprilus alepidotus 0.0072 0.0000 0.0000 0.0881 0.0027 0.1515 0.0000 3.5775 BUTTERFISH Peprilus triacanthus 0.3574 0.0278 0.0119 0.0000 0.1726 0.0404 0.0038 0.0000
Ammodytidae AMERICAN SAND LANCE 1 Ammodytes americanus 0.0000 0.0000 0.0012 0.0000 0.0000 0.0000 0.1149 0.0000
Carangidae ATLANTIC MOONFISH 1 Selene setapinnis 0.0108 0.0000 0.0012 0.0000 0.0000 0.0000 0.0000 0.0000 LOOKDOWN Selene vomer 0.0325 0.1528 0.0024 0.0104 0.0548 0.2222 0.0000 0.0704 BLUE RUNNER 2 Caranx crysos 0.0000 0.0000 0.0000 0.0000 0.0000 0.0101 0.0000 0.0000 CREVALLE JACK Caranx hippos 0.0794 0.1111 0.0131 0.1399 0.0822 0.3333 0.0000 0.1408 HORSE-EYE JACK 2 Caranx latus 0.0000 0.0000 0.0000 0.0000 0.0000 0.0101 0.0000 0.0000 PERMIT 1 Trachinotus falcatus 0.0000 0.2083 0.0000 0.0052 0.0000 0.5253 0.0000 0.2394 ROUGH SCAD Trachurus llathami 0.0000 0.0000 0.0000 0.0000 0.0027 0.0101 0.0000 0.0000
Rachycentridae COBIA Rachycentron canadum 0.0000 0.0000 0.0000 0.0000 0.0110 0.0202 0.0000 0.0000
Scombridae KING MACKEREL 1 Scomberomorus cavalla 0.0000 0.0000 0.0048 0.0000 0.0110 0.0000 0.0000 0.0000 SPANISH MACKEREL 1 Scomberomorus maculatus 0.0181 0.0000 0.0048 0.0000 0.0164 0.0000 0.0000 0.0000
Mullidae DWARF GOATFISH Upenus parvus 0.0000 0.0000 0.0012 0.0000 0.0027 0.0000 0.0000 0.0141

26
Species Assawoman Chincoteague Isle of Wight Sinepuxent Common Name Scientific Name Trawl Seine Trawl Seine Trawl Seine Trawl Seine
Mugilidae STRIPED MULLET Mugil cephalus 0.0000 0.5139 0.0048 0.6995 0.0055 3.9293 0.0000 0.3380 WHITE MULLET Mugil curema 0.0000 24.5139 0.0000 3.1658 0.0795 43.8283 0.0000 8.0704
Sphyraenidae NORTHERN SENNET Sphyraena borealis 0.0000 0.3056 0.0000 0.0052 0.0027 0.3131 0.0000 0.3380
Uranoscopidae NORTHERN STARGAZER Astroscopus guttatus 0.0000 0.0139 0.0024 0.0207 0.0110 0.0000 0.0690 0.0000
Sciaenidae SILVER PERCH Bairdiella chrysoura 2.6895 81.9444 2.0892 26.3782 2.0329 24.9495 0.2375 21.7042 SPOTTED SEA TROUT Cynoscion nebulosus 0.0000 0.1111 0.0095 0.1399 0.0000 0.0000 0.0000 0.0704 WEAKFISH Cynoscion regalis 39.9639 0.2222 2.7729 0.4767 18.1671 0.1414 0.3793 0.0000 SPOT Leiostomous xanthurus 76.2238 76.7917 36.0357 27.6995 57.0493 41.1111 3.9042 63.6338 NORTHERN KINGFISH Menticirrhus saxatilis 0.0505 0.4444 0.0369 0.2228 0.1753 0.4444 0.3218 0.1127 CROAKER Micropogonias undulatus 12.6065 0.4861 1.9548 0.4197 8.0767 1.6061 0.2682 0.0563 BLACK DRUM Pogonias chromis 0.1047 1.0000 0.0250 0.6736 0.0822 0.9394 0.0077 0.2958 RED DRUM 2 Scianops ocellatus 0.0000 0.0000 0.0000 0.0155 0.0000 0.0101 0.0000 0.0423
Ephippidae SPADEFISH Chaetodipterus faber 0.0108 0.0000 0.0131 0.0104 0.0055 0.0000 0.0038 0.0000
Pomatomidae BLUEFISH Pomatomous saltatrix 0.0650 2.6528 0.0095 0.3420 0.1041 2.2323 0.0038 0.7324
Gobiidae NAKED GOBY Gobiosoma bosc 0.0578 3.3333 0.4637 0.5130 0.1671 0.1111 0.0192 0.6901 GREEN GOBY Microgobius thalassinus 0.0325 0.0694 0.1451 0.0466 0.0986 0.0000 0.0038 0.0000
Blenniidae STRIPED BLENNY Chasmodes bosquianus 0.0000 0.1944 0.0048 0.0570 0.0137 0.0202 0.0000 0.0141 FEATHER BLENNY Hypsoblennius hentz 0.0361 0.4583 0.0476 0.2021 0.0274 0.1212 0.0575 0.3521
Moronidae WHITE PERCH Morone americana 0.0144 0.0000 0.0262 0.0311 0.0027 0.0000 0.0000 0.0000 STRIPED BASS Morone saxatilis 0.0000 0.0694 0.0119 0.0415 0.0027 0.0303 0.0038 0.0000
Chaetodontidae SPOTFIN BUTTERFLYFISH Chaetodon ocellatus 0.0072 0.0000 0.0012 0.0000 0.0000 0.0202 0.0192 0.0000
Species Assawoman Chincoteague Isle of Wight Sinepuxent

27
Common Name Scientific Name Trawl Seine Trawl Seine Trawl Seine Trawl Seine Gerreidae
SPOTFIN MOJARRA Eucinostomus argenteus 0.1047 1.5139 0.0036 0.1088 0.0877 3.1010 0.0307 0.9296 Sparidae
SHEEPSHEAD Archosargus probatocephalus 0.0072 0.1667 0.0036 0.0570 0.0027 0.0303 0.0000 0.1408 SPOTTAIL PINFISH Diplodus holbrooki 0.0000 0.0000 0.0000 0.0000 0.0027 0.0505 0.0000 0.0000 PINFISH Lagodon rhomboides 0.0433 8.3611 0.0488 0.2694 0.2411 2.7576 0.0345 3.2254 SCUP Stenotomus chrysops 0.0108 0.0417 0.0178 0.0104 0.0110 0.0202 0.0958 0.0000
Lutjanidae RED SNAPPER Lutjanus campechanus 0.0181 0.9722 0.0024 0.0415 0.0055 0.1818 0.0000 0.0141 GREY SNAPPER Lutjanus griseus 0.0000 0.1528 0.0012 0.0000 0.0000 0.0202 0.0000 0.0000
Haemulidae PIGFISH Orthopristis chrysoptera 0.0469 5.4306 0.1320 0.1710 0.0849 1.8283 0.0728 1.0282
Labridae TAUTOG Tautoga onitis 0.0072 0.2083 0.0107 0.0000 0.0082 0.1616 0.0230 0.2676 CUNNER 1 Tautogolabrus adspersus 0.0000 0.0000 0.0012 0.0000 0.0000 0.0000 0.0038 0.0000
Serranidae BLACK SEA BASS Centropristis striata 0.5307 0.4861 0.3853 0.0984 0.7123 0.6566 0.5364 1.1408 GAG Mycteroperca microlepis 0.0000 0.5417 0.0012 0.0052 0.0000 0.1414 0.0038 0.3380
Balistidae GRAY TRIGGERFISH Balistes capriscus 0.0000 0.0139 0.0024 0.0104 0.0137 0.1919 0.0307 0.1127
Monocanthidae ORANGE FILEFISH 1 Aluterus schoepfi 0.0000 0.0000 0.0000 0.0000 0.0000 0.0000 0.0038 0.0000 PLANEHEAD FILEFISH 1 Monocanthus hispidus 0.0036 0.0000 0.0012 0.0000 0.0137 0.0000 0.0077 0.0000
Diodontidae STRIPED BURRFISH Chilomycterus schoepfi 0.0072 0.0000 0.0749 0.1554 0.0247 0.0101 0.0307 0.0000
Tetraodontidae SOUTHERN PUFFER 1 Lagocephalus laevigatus 0.0000 0.0000 0.0012 0.0000 0.0000 0.0000 0.0038 0.0000 NORTHERN PUFFER Sphoeroides maculatus 0.2888 1.9167 0.3817 0.8912 0.6438 1.9192 0.8889 2.2817
Cynoglossidae BLACKCHEEK TONGUEFISH Symphurus plagiusa 0.1083 0.0278 0.0809 0.2539 0.0986 0.0808 0.0192 0.0704

28
Species Assawoman Chincoteague Isle of Wight Sinepuxent Common Name Scientific Name Trawl Seine Trawl Seine Trawl Seine Trawl Seine
Achiridae HOGCHOKER Trinectes maculatus 0.6679 0.0000 1.7420 0.4041 0.5890 0.0202 0.0460 0.0000
Pleuronectidae WINTER FLOUNDER Pleuronectes americanus 2.0325 7.9722 0.1700 0.1658 1.1041 11.1515 0.2414 8.4930
Scophthalmidae WINDOWPANE FLOUNDER Scophthalmus acquosus 0.1083 0.0000 0.0071 0.0052 0.3288 0.0606 0.6360 0.0141
Paralichthyidae SMALLMOUTH FLOUNDER Etropus microstomus 0.0650 0.0139 0.0380 0.0104 0.6466 0.3535 0.9540 0.0986 SUMMER FLOUNDER Paralichthys dentatus 5.5596 1.9583 3.8312 1.9119 4.3260 1.6263 1.4866 1.1831
Portunidae BLUE CRAB Callinectes sapidus 51.3032 101.8056 57.6611 66.5648 57.0192 40.5859 10.8544 69.1408 1 Present in trawl survey only 2 Present in seine survey only

29
names, see Table 5). Seine samples were dominated by 12 species that comprised 95%
of the catch, including in descending order: Menidia menidia, B. tyrannus, C. sapidus, A.
mitchilli, L. xanthurus, B. chrysoura, Mugil curema, Fundulus heteroclitus, F. majalis,
Pleuronectes americanus, Lucania parva, and Lagodon rhomboides. Differences in
species encountered between gear types were moderate as most species were encountered
in both gear types. However, differences were noticeable in the relative abundance of
some demersal species (e.g., P. dentatus) that were abundant in trawl but were relatively
rare in seine samples. Likewise, typically littoral species (e.g. M. curema) were rarely
encountered in the trawl survey but were abundant in seine samples.
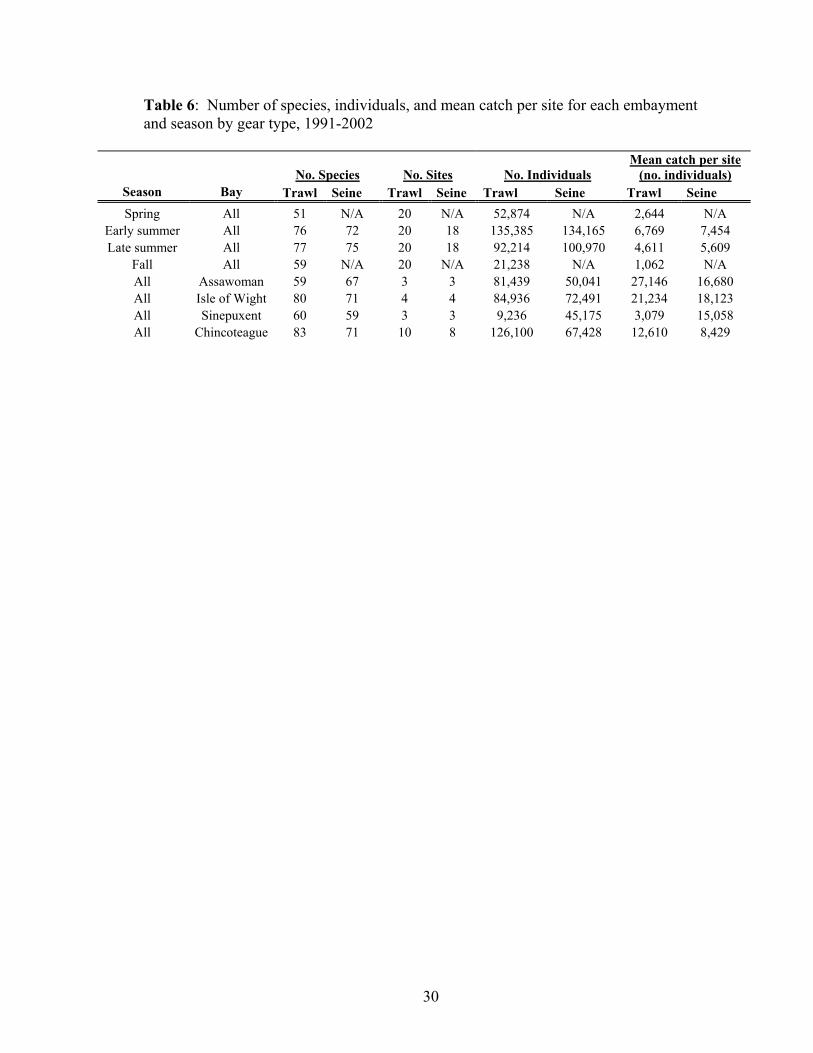
Catch per site (CPS) differed between bays and seasons for both gear types (Table
6) with the northern bays of Assawoman and Isle of Wight exhibiting higher CPS than
the southerly bays of Sinepuxent and Chincoteague. In addition, the trawl data indicated
a seasonal pattern in CPS, with lower numbers of species and organisms caught in the
spring and fall than in summer months.
Single Species
The species that comprised the top 95% of the catch differed significantly among
bays, seasons, and years. For example, C. sapidus abundance was significantly different
between seasons (p < 0.0001) consistently showing peaks in the early summer across all
years (Figure 4 and 5), but exhibiting fairly low interannual variability (Coefficient of
Variation [CV] of annual means= 0.33 for trawl, 0.51 for seine). C. sapidus distribution
30
Table 6: Number of species, individuals, and mean catch per site for each embayment and season by gear type, 1991-2002
No. Species No. Sites No. Individuals Mean catch per site
(no. individuals) Season Bay Trawl Seine Trawl Seine Trawl Seine Trawl Seine Spring All 51 N/A 20 N/A 52,874 N/A 2,644 N/A
Early summer All 76 72 20 18 135,385 134,165 6,769 7,454 Late summer All 77 75 20 18 92,214 100,970 4,611 5,609
Fall All 59 N/A 20 N/A 21,238 N/A 1,062 N/A All Assawoman 59 67 3 3 81,439 50,041 27,146 16,680 All Isle of Wight 80 71 4 4 84,936 72,491 21,234 18,123 All Sinepuxent 60 59 3 3 9,236 45,175 3,079 15,058 All Chincoteague 83 71 10 8 126,100 67,428 12,610 8,429

31
Figure 4: Blue crab abundance transformed (ln x + 1) across years (a) and embayments (b) for trawl survey. Bars indicate standard error.
1
2
3
4
5
1991 1992 1993 1994 1995 1996 1997 1998 1999 2000 2001 2002
SPRING
EARLY SUMMER
LATE SUMMER
FALL
1
2
3
4
5
ASSAWOMAN ISLE OF WIGHT SINEPUXENT CHINCOTEAGUE
Blu
e cr
ab a
bund
ance
(ln
x +
1)
(a)
(b)

32
Figure 5: Blue crab abundance transformed (ln x + 1) across years (a) and embayments (b) for seine survey. Bars indicate standard error.
1
2
3
4
5
ASSAWOMAN ISLE OF WIGHT SINEPUXENT CHINCOTEAGUE
1
2
3
4
5
6
1991 1992 1993 1994 1995 1996 1997 1998 1999 2000 2001 2002
EARLY SUMMER
LATE SUMMER
Blu
e cr
ab a
bund
ance
(ln
x +
1)
(a)
(b)

33
was also different between bays (p < 0.0001, both surveys) with c. half the abundance
observed (trawl) in Sinepuxent than that observed in other bays (Figure 4b).
A. mitchilli abundances showed moderate interannual variation (CVTrawl= 0.60,
CVSeine = 0.66) with a low point across both gear types in 2001 (Figures 6 and 7).
Significant differences occurred between seasons (p < 0.001) and bays (p < 0.0001) for
both gear types. Similar to C. sapidus, A. mitchilli mean abundance was c. 50% lower in
Sinepuxent than other Bays for both gear types. L. xanthurus, a schooling demersal
species, showed high interannual variation in abundance (CVTrawl =1.68, CVSeine = 1.49 ;
Figures 8 and 9). No significant differences occurred between bays (p = 0.20) for the
seine gear, but a significant difference between bays was observed for trawl samples,
where Sinepuxent exhibited lower abundance (p < 0.0001). Both gear types indicated
significant differences in L. xanthurus abundances between seasons, with highest
abundances during early summer (p < 0.0001).
C. regalis, a demersal species, was not a dominant species from the seine samples
(rank in CPUE=35), but was abundant in the trawl survey, with significant seasonal and
embayment differences (p < 0.0001 each) (Figure 10). Abundance tended to peak in
summer months, and the northern bays of Assawoman and Isle of Wight had c. 2-fold
higher abundances of weakfish than the Chincoteague or Sinepuxent. This species
exhibited moderate interannual variation in abundance (CV= 0.74).
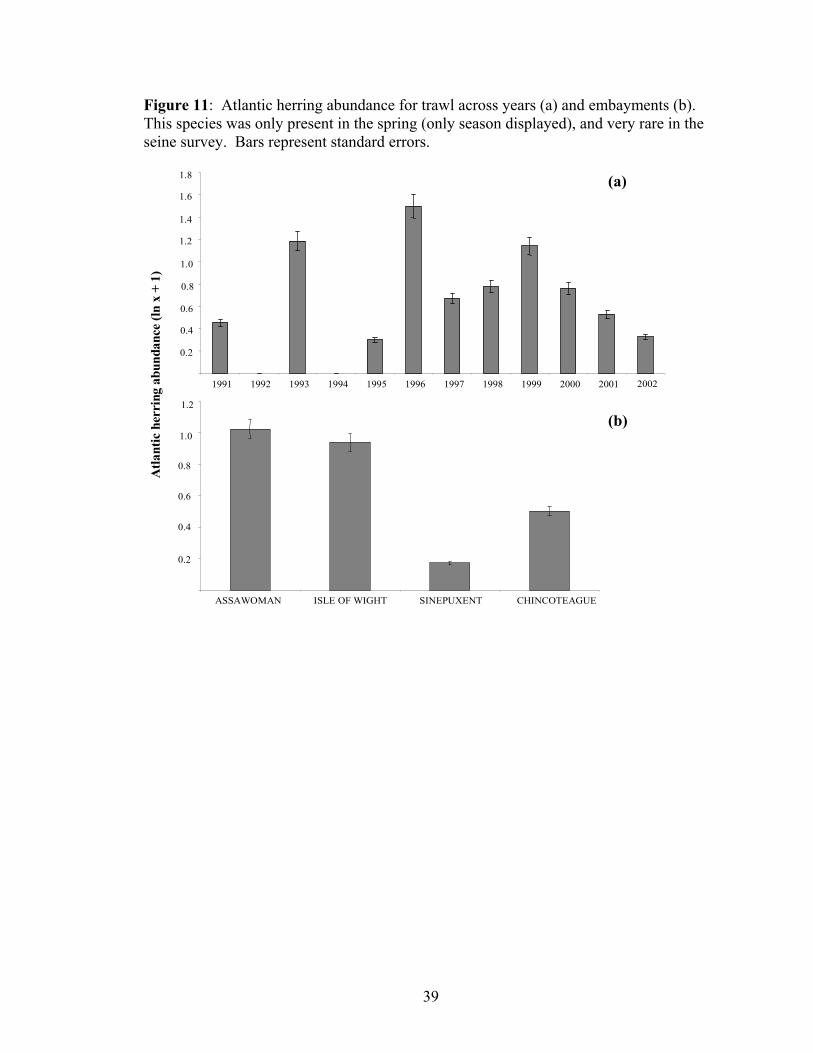
C. harengus was a dominant spring-time species in the trawl survey, but was very
rare in the seine survey. The species only occurred in spring (Figure 11) and Sinepuxent
Bay showed significantly lower abundance than other embayments (p <0.01). C.

34
Figure 6: Bay anchovy abundance transformed (ln x + 1) across years (a) and embayments (b) for trawl survey. Bars indicate standard error.
0.5
1.5
2.5
3.5
1991 1992 1993 1994 1995 1996 1997 1998 1999 2000 2001 2002
SPRING
EARLY SUMMER
LATE SUMMERFALL
Bay
anc
hovy
abu
ndan
ce (l
nx
+ 1)
1
2
3
4
ASSAWOMAN ISLE OF WIGHT SINEPUXENT CHINCOTEAGUE
(a)
(b)
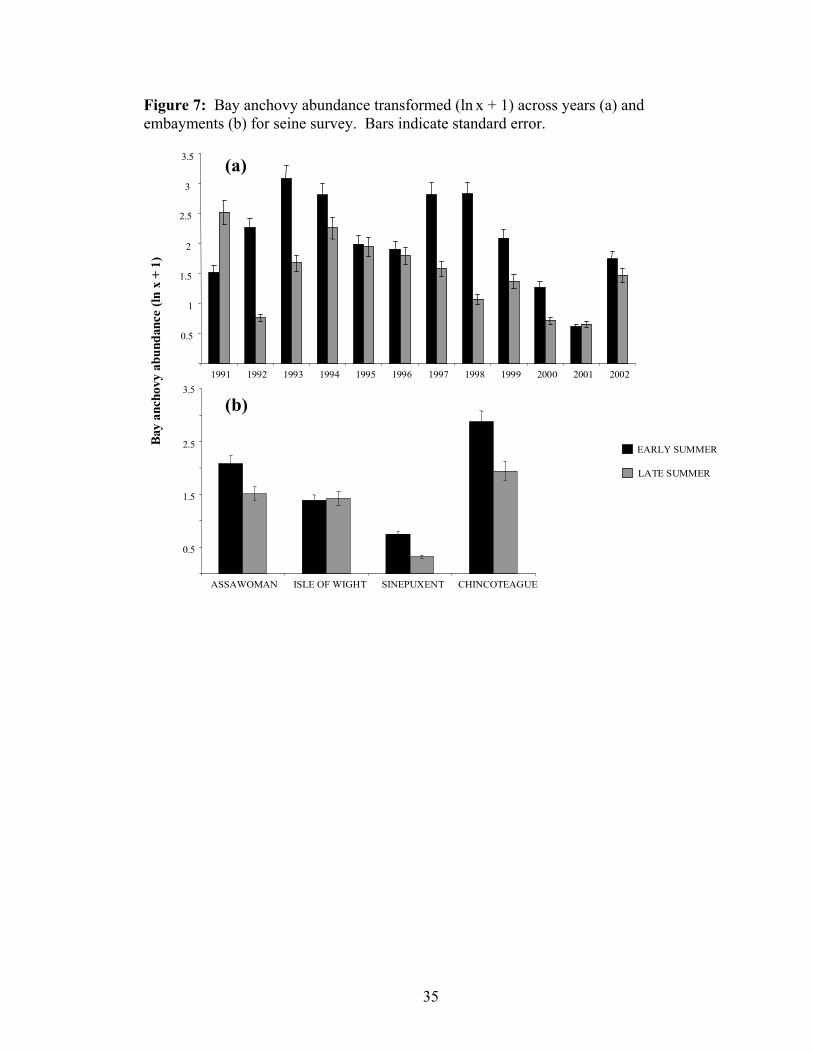
35
Figure 7: Bay anchovy abundance transformed (ln x + 1) across years (a) and embayments (b) for seine survey. Bars indicate standard error.
0.5
1.5
2.5
3.5
ASSAWOMAN ISLE OF WIGHT SINEPUXENT CHINCOTEAGUE
0.5
1
1.5
2
2.5
3
3.5
1991 1992 1993 1994 1995 1996 1997 1998 1999 2000 2001 2002
EARLY SUMMER
LATE SUMMER
Bay
anc
hovy
abu
ndan
ce (l
nx
+ 1)
(a)
(b)

36
Figure 8: Spot abundance transformed (ln x + 1) across years (a) and embayments (b) for trawl survey. Bars indicate standard error.
1
2
3
4
5
6
1991 1992 1993 1994 1995 1996 1997 1998 1999 2000 2001 2002
SPRING
EARLY SUMMER
LATE SUMMER
FALL
1
2
3
ASSAWOMAN ISLE OF WIGHT SINEPUXENT CHINCOTEAGUE
Spot
abu
ndan
ce (l
nx
+ 1)
(a)
(b)

37
Figure 9: Spot abundance transformed (ln x + 1) across years (a) and embayments (b) for seine survey. Bars indicate standard error.
1
2
3
4
ASSAWOMAN ISLE OF WIGHT SINEPUXENT CHINCOTEAGUE
1
2
3
4
5
6
1991 1992 1993 1994 1995 1996 1997 1998 1999 2000 2001 2002
EARLY SUMMER
LATE SUMMER
Spot
abu
ndan
ce (l
nx
+ 1)
(a)
(b)

38
Figure 10: Weakfish seasonal abundance for trawl across years (a) and embayments (b). Bars represent standard error.
0.5
1
1.5
2
2.5
1991 1992 1993 1994 1995 1996 1997 1998 1999 2000 2001 2002
SPRING
EARLY SUMMER
LATE SUMMER
FALL
0.5
1.5
2.5
3.5
ASSAWOMAN ISLE OF WIGHT SINEPUXENT CHINCOTEAGUE
Wea
kfis
h ab
unda
nce
(lnx
+ 1)
(a)
(b)
39
Figure 11: Atlantic herring abundance for trawl across years (a) and embayments (b). This species was only present in the spring (only season displayed), and very rare in the seine survey. Bars represent standard errors.
0.2
0.4
0.6
0.8
1.0
1.2
1.4
1.6
1.8
1991 1992 1993 1994 1995 1996 1997 1998 1999 2000 2001 2002
0.2
0.4
0.6
0.8
1.0
1.2
ASSAWOMAN ISLE OF WIGHT SINEPUXENT CHINCOTEAGUE
Atla
ntic
her
ring
abu
ndan
ce (l
nx
+ 1)
(a)
(b)

40
harengus showed fairly high interannual variation (CVTrawl = 0.99) and was completely
absent from the survey in 1992 and 1994.
M. undulatus was a dominant species in the trawl survey (rank = 6), but occurred
less frequently in the seine survey (rank=31). Its distribution was significantly different
between bays and seasons (Kruskal-Wallis non-parametric test, p < 0.0001 for each
factor). Overall, M. undulatus abundance was generally highest in the fall, but this
pattern was variable between years (Figure 12; CV among years was 0.72). Abundances
in the northern two bays were 2-fold than those in the southern two bays. P. dentatus
also showed dominance in the trawl data (rank=7) relative to the seine data (rank=17),
with highest abundances occurring early summer (seasonal effect; K-W, p<0.0001)
(Figure 13). Its distribution varied significantly between bays (K-W, p < 0.0001), with
generally lower abundances in the Sinepuxent than elsewhere. The species exhibited
relatively low intrannual variation across the bays (CV= 0.44).
B. chrysoura was a dominant species collected by both gear types and differed in
abundance significantly by season (K-W, p <0.0001 for seine and trawl) with a peak
abundance in late summer (Figures 14 and 15). There was a significant difference in
trawl abundances by bay (K-W, p<0.0001), but no significant differences occurred for the
seine survey. Similar to other dominant species, trawl CPUE’s were >50% less in
Sinepuxent than the other bays. This species exhibited moderate interannual variation
(CVTrawl =0.61, CVSeine = 0.84). B. tyrannus was important in both surveys, but was of
particularly high abundance (based on CPUE-Table 5) in the seine survey. B. tyrannus
abundance (Figure 16 and 17) tended to peak early summer (seine and trawl). CPUE was
significantly influenced by embayment in both trawl and seine survey (K-W, p <0.001, p

41
Figure 12: Croaker seasonal abundance for trawl by years (a) and embayments (b). Croaker was infrequently captured in the seine survey. Bars represent standard errors.
1
2
3
1991 1992 1993 1994 1995 1996 1997 1998 1999 2000 2001 2002
SPRING
EARLY SUMMER
LATE SUMMER
FALL
1
2
3
ASSAWOMAN ISLE OF WIGHT SINEPUXENT CHINCOTEAGUE
Cro
aker
abu
ndan
ce (l
nx
+ 1)
(a)
(b)

42
Figure 13: Summer flounder seasonal abundance for trawl by embayment and across years (a) and embayments (b). Bars represent standard error.
0.5
1
1.5
2
2.5
ASSAWOMAN ISLE OF WIGHT SINEPUXENT CHINCOTEAGUE
0.5
1
1.5
2
2.5
1991 1992 1993 1994 1995 1996 1997 1998 1999 2000 2001 2002
SPRING
EARLY SUMMER
LATE SUMMER
FALL
Sum
mer
flou
nder
abu
ndan
ce (l
nx
+ 1)
(a)
(b)

43
Figure 14: Silver perch seasonal abundance for trawl across years (a) and embayments (b). Bars represent standard error. .
0.2
0.4
0.6
0.8
1
1.2
ASSAWOMAN ISLE OF WIGHT SINEPUXENT CHINCOTEAGUE
0.2
0.4
0.6
0.8
1
1.2
1.4
1.6
1991 1992 1993 1994 1995 1996 1997 1998 1999 2000 2001 2002
SPRING
EARLY SUMMER
LATE SUMMER
FALL
Silv
er p
erch
abu
ndan
ce (l
nx
+ 1)
(a)
(b)

44
Figure 15: Silver perch seasonal abundance for seine across years (a) and embayments (b). Bars represent standard error.
0.5
1.5
2.5
3.5
ASSAWOMAN ISLE OF WIGHT SINEPUXENT CHINCOTEAGUE
1
2
3
4
1991 1992 1993 1994 1995 1996 1997 1998 1999 2000 2001 2002
EARLY SUMMER
LATE SUMMER
Silv
er p
erch
abu
ndan
ce (l
nx
+ 1)
(a)
(b)

45
Figure 16: Atlantic menhaden seasonal abundance for seine across years (a) and embayments (b). Bars represent standard error.
1
2
3
ASSAWOMAN ISLE OF WIGHT SINEPUXENT CHINCOTEAGUE
1
2
3
4
5
1991 1992 1993 1994 1995 1996 1997 1998 1999 2000 2001 2002
EARLY SUMMER
LATE SUMMER
Atla
ntic
men
hade
n ab
unda
nce
(lnx
+ 1)
(a)
(b)

46
Figure 17: Atlantic menhaden seasonal abundance for trawl across years (a) and embayments (b). Bars represent standard error.
0.1
0.2
0.3
0.4
0.5
0.6
0.7
0.8
ASSAWOMAN ISLE OF WIGHT SINEPUXENT CHINCOTEAGUE
0
0.1
0.2
0.3
0.4
0.5
0.6
0.7
0.8
1991 1992 1993 1994 1995 1996 1997 1998 1999 2000 2001 2002
SPRINGEARLY SUMMERLATE SUMMERFALL
Atla
ntic
men
hade
n ab
unda
nce
(lnx
+ 1)
(a)
(b)

47
<0.01, respectively) and by season in trawl (K-W, p < 0.001) and seine (Mann-Whitney
U-test, p <0.0001). No menhaden were observed for the Sinepuxent trawl sample, and
the Isle of Wight showed significantly higher abundances than elsewhere. Seine data
indicated that menhaden tended to occur at higher abundance in the northern two bays.
Interannual variations for menhaden were relatively high (CVTrawl =1.19, CVSeine =1.14).
CART analysis provided some insight into possible explanatory variables
affecting abundances, but did so for only a minority of the dominant species. For the
trawl data (focusing on the top species = 95% of catch), there were no significant
explanatory variables for C. sapidus, L. xanthurus, C. regalis, B. chrysoura, or B.
tyrannus. A. mitchilli abundance was partially explained by SAV coverage and dissolved
oxygen levels (Figure 18). At those sites containing SAV, mean abundance was >10-fold
higher. D.O. levels less than 6.6 mg l -1 were associated with c. 3-fold higher abundances
of A. mitchilli. On the other hand, C. harengus abundance was related to temperature,
which can be seen as a proxy for season because C. harengus was absent during the
warmer seasons of early and late summer and fall. M. undulatus abundance appeared to
be driven by an interaction of salinity and year and dissolved oxygen. Although there
appeared to be a discrete seasonal component to croaker abundance (Fig. 12), the CART
procedure did not indicate season as a significant explanatory variable. Lastly, P.
dentatus abundance was best explained by an interaction between SAV coverage and
tidal state. Like M. undulatus, summer flounder showed seasonal variability (Fig. 13)
that was not detected by the CART procedure.

48
Figure 18: Classification and regression tree (CART) diagrams for bay anchovy, Atlantic herring, croaker, and summer flounder in the trawl survey, 1991-2002. For each box: Mean = mean abundance for parameters at that node; SD = standard deviation; n = number of samples meeting the criteria of listed parameter values. Caution should be used when interpreting these trees as some of the interactive parameters are not scaled in a way that permits classification of habitat variables and therefore the explanatory variable is directionless.
A. Herring
Mean=4.3SD=54.3
N=703
Mean=2.4SD=38.4
N=688
Mean=89.4SD=260.1
N=15
TEMP < 11.9
Bay anchovyMean=57.2SD=274.0
N=703
Mean=37.1SD=126.1
N=673Mean=509.2SD=1108.3
N=30
SAV
Mean=307.2SD=638.7
N=25Mean=1519.6SD=2219.7
N=5
DO < 6.6
CroakerMean=4.2SD=24.8
N=703
Mean=2.5SD=11.6
N=651
Mean=26SD=79.2
N=52
SALINITY
Mean=6.6SD=14.7
N=38
DO < 7.9
Mean=78.6SD=141.1
N=14
Summer flounder
Mean=4.2SD=7.9
N=703
Mean=3.8SD= 5.9
N=689
Mean=25.1SD=31.7
N=14
TEMP + TIDAL STATE
Mean=51.2SD=37.9
N=5
Mean=10.6SD=15.7
N=9
SAV

49
Assemblages and Embayments
The MDS plots for trawl data indicated fairly tight ordination of specific
embayments (Figure 19a) based on relative abundances of all species encountered and
grouped by site. The stress statistics were all low, signifying that the two-dimensional
plots were representative of the relationship between sites. Within the trawl data (Fig.
19a), sites 20 and 12 were discrete from other Chincoteague sites, while site 7 (Isle of
Wight) was separate from the other sites of that embayment. The northern bays of
Assawoman and Isle of Wight ordinated consistently along axis 1 and broadly overlapped
whereas Sinepuxent ordinated along both axes, remaining separate from the other
embayments. Chincoteague sites generally clustered together with dispersion along both
axes. Within the seine data, sites 18 and 14 showed separation from other Chincoteague
sites (Fig. 19b), and site 4 was discrete from other Isle of Wight sites, while all the
Sinepuxent sites were fairly equidistant. Overall, the trawl MDS plots showed better
segregation of embayments than the seine plots, as indicated by the lower stress value.
When data for each embayment were compared on a seasonal basis, separations of sites
according to bays remained apparent (Figure 20). The ordination plots showed varying
degrees of overlap between bays on a seasonal basis. The fall season showed the greatest
separation between bays whereas there was greater overlap in the spring. Both early and
late summer seasons had similar patterns with regard to separation of embayments, with
sites 7, 11, 12, and 20 consistently ordinating outside the clusters of their defined system.
The cluster analysis (Bray-Curtis similarity) in general showed similarity of sites
within embayments (Figure 21). For the trawl dendrogram, all northern bays sites except
site 7 split at the node indicating ~ 30% dissimilarity. This same node included site 12

50
Figure 19: Non-metric multidimensional scaling (MDS) plots of trawl (a) and seine (b) data by site (numbered), 1991-2002. Site identification numbers are referenced in Fig. 1. Squares = Assawoman, Ovals = Isle of Wight, Diamonds = Sinepuxent, Triangles = Chincoteague. Stress values for each plot are indicated.
Axis 1210-1
Axis
2
0.6
0.55
0.5
0.45
0.4
0.35
0.3
0.25
0.2
0.15
0.1
0.05
0
-0.05
-0.1
-0.15
-0.2
-0.25
-0.3
-0.35
-0.4
-0.45
-0.5
-0.55
-0.6
1
2
3
1112
1314
15
16
1718
19
20
4
5
6
7
8
9
10
Axis 110-1
Axis
2
10.90.80.70.60.50.40.30.20.1
0-0.1-0.2-0.3-0.4-0.5-0.6-0.7-0.8-0.9
-1-1.1-1.2-1.3-1.4-1.5-1.6
12
3
11
12
13
14
15
16
17
18
4
5
67
8
9
10
(a)
(b)
Stress= 0.04
Stress= 0.12

51
Figure 20: Non-metric multidimensional scaling plots of trawl data (1991-2002) by season and site (numbered). Squares = Assawoman, Ovals = Isle of Wight, Diamonds = Sinepuxent, Triangles = Chincoteague. Stress values for each plot are indicated.
Axis 110-1
Axis
2
1.2
1.1
1
0.9
0.8
0.7
0.6
0.5
0.4
0.3
0.2
0.1
0
-0.1
-0.2
-0.3
-0.4
-0.5
-0.6
-0.7
-0.8
1
2
3
11
12
1314
15
16
1718
19
20
4
5 6
7
8
9
10
Axis 1210-1
Axis
2
0.650.6
0.550.5
0.450.4
0.35
0.30.250.2
0.150.1
0.050
-0.05-0.1
-0.15-0.2
-0.25-0.3
-0.35-0.4
-0.45-0.5
-0.55-0.6
-0.65-0.7
-0.75
12
3
11
12
1314
15
16
17
18
19
20
4
5
6
7
8
9
10
Early summer trawl
Axis 1210-1
Axis
2
0.65
0.6
0.55
0.5
0.45
0.4
0.35
0.3
0.25
0.2
0.15
0.1
0.05
0
-0.05
-0.1
-0.15
-0.2
-0.25
-0.3
-0.35
-0.4
-0.45
-0.5
-0.55
1
2
3
11
12 13
14
15
16
17
18
19
20
4
5
6
7
8
910
Late summer trawl
Axis 110-1
Axis
2
1.4
1.3
1.2
1.11
0.9
0.8
0.7
0.60.5
0.4
0.3
0.2
0.10
-0.1
-0.2
-0.3
-0.4-0.5
-0.6
-0.7
-0.8
-0.9-1
-1.1
-1.2
-1.3
1
2
3
11
12
13
14
15
16
17
18
19
20
4
5 6
7
8
9
10
Fall trawl
Spring
Early summer
Late summer Fall
Stress = 0.02 Stress = 0.015
Stress = 0.021
Stress = 0.13

52
Fig. 21: Cluster dendrogram for all sites from trawl (a) and seine (b) data, 1991-2002 using agglomerative clustering and the Bray-Curtis similarity coefficient as distance measure. The upper line represents the dissimilarity (percent) along the dendrogram (e.g. 0 = no dissimilarity). Numbers are sites (referenced in Fig. 1), with the following embayment codes: ASW = Assawoman, IOW = Isle of Wight, SIN = Sinepuxent, CHI = Chincoteague.
0.70 0.50 0.35 0.20 0
1ASW4IOW3ASW2ASW6IOW5IOW12CHI7IOW11CHI13CHI14CHI16CHI18CHI19CHI15CHI17CHI8SIN9SIN10SIN20CHI
0.70 0.50 0.35 0.15 0
(a)
(b)

53
from Chincoteague Bay. The Sinepuxent sites all separated at the node associated with ~
47% dissimilarity. The seine dendrogram followed the MDS plots in that the nodes for
each of the site cluster showed a lesser degree of dissimilarity. The northern bay sites
(except sites 3 and 4) all split from a node at ~ 41% dissimilarity. Outlier sites included
trawl sites 7 (IOW), 10 (SIN), 12, and 20 (CHI) and seine sites 1 (ASW), 4 (IOW), 8, 9
(SIN), and 13 (CHI) (for bay abbreviations, see Figure 20).
The separation of sites by embayment was supported by the ANOSIM analysis
(trawl: R = 0.45, p < 0.004; seine: R = 0.28, p < 0.03) (Table 7). For the trawl, pairwise
comparisons (Boneferroni adjusted significance level to account for multiple [6]
comparisons) were significant between Assawoman and Chincoteague (R = 0.42, p <
0.04), and between Sinepuxent and each of the other bays indicating Sinepuxent is
distinct in terms of its profundal community. The seine survey ANOSIM analysis also
indicated a significant difference between bays (R = 0.28, p < 0.04), although the only
pairwise differences were between Chincoteague and Isle of Wight and Chincoteague and
Sinepuxent. MDS plots of trawl data by season showed moderate separation between
early and summer samples, but broad overlap across other seasons (Figure 22). The
ANOSIM procedure confirmed this pattern in that there was a significant difference
between seasons, but a low R value (R = 0.30; p<0.001) indicated high overlap (Table 8).
The SIMPER analysis of trawl data showed that each bay had distinctive species
in terms of their relative abundances. For example, the higher relative abundances of A.
mitchilli, L. xanthurus, and C. sapidus distinguished the fauna of Assawoman Bay (Table
9) from other bays. In general the relative abundance of these three species, in addition
to C. regalis and P. dentatus were diagnostic among the bays. Note that these dominant

54
Table 7: Analysis of Similarity by embayment for trawl and seine survey, 1991-2002. Pariwise tests between bays are protected at α = 0.005 level. See text for discussion of interpretations for R values. The number in parentheses by each embayment indicates number of sites used in analysis.
ANOSIM By Bay TRAWL
Sample R: 0.45 p < 0.004
1st Group 2nd Group p Sample R
Assawoman (3) Chincoteague(10) 0.04 0.42 Assawoman (3) Isle of Wight (4) 0.85 -0.19 Assawoman (3) Sinepuxent (3) 0.05 1
Chincoteague (10) Isle of Wight (4) 0.08 0.25 Chincoteague (10) Sinepuxent (3) 0.01 0.7 Isle of Wight (4) Sinepuxent (3) 0.05 0.78
SEINE
Sample R: 0.28 p < 0.04
1st Group 2nd Group p Sample R
Assawoman (3) Chincoteague(8) 0.14 0.18 Assawoman (3) Isle of Wight (4) 0.22 0.09 Assawoman (3) Sinepuxent (3) 0.25 0.11
Chincoteague (8) Isle of Wight (4) 0.008 0.49 Chincoteague (8) Sinepuxent (3) 0.02 0.46 Isle of Wight (4) Sinepuxent (3) 0.31 0.07

55
Figure 22: Non-metric multidimensional scaling plot of trawl data by season. Spring = diamond, early summer = square, late summer = oval, fall = triangle. Stress values for each plot indicate adequacy of two-dimensional relationships, where lower values (< 0.2) indicates true relationships of the data points.
Axis 1210-1
Axis
2
1.3
1.2
1.1
1
0.9
0.8
0.7
0.6
0.5
0.4
0.3
0.2
0.1
0
-0.1
-0.2
-0.3
-0.4
-0.5
-0.6
-0.7
-0.8
-0.9
Stress = 0.10

56
Table 8: Analysis of Similarity on trawl data (1991-2002) for seasonal comparisons. Pairwise tests are protected at α = 0.005 level. Numbers in parentheses indicate number of sites used for each seasonal comparison.
ANOSIM by Season Sample R: 0.30
p < 0.001
1st Group 2nd Group p Sample R Early Summer (20) Fall (20) 0.001 0.53 Early Summer (20) Late Summer (20) 0.001 0.22 Early Summer (20) Spring (20) 0.001 0.31
Fall (20) Late Summer (20) 0.001 0.24 Fall (20) Spring (20) 0.001 0.25
Late Summer (20) Spring (20) 0.001 0.26

57
Table 9: Results from Similarity Percentage (SIMPER) analysis on trawl data, 1991-2002. Diagnostic species are listed in descending order of percent contribution to overall bay similarity. Those species that contribute to the top 90% ranked species are shown. Mean abundance is mean number of individuals per embayment. For common names, see Table 5.
Typifying Species Mean
abundance %
contribution Cumulative % Assawoman
A. mitchilli 7930.3 30.2 30.2 L. xanthurus 7038.0 27.2 57.4 C. sapidus 4739.7 19.3 76.7 C. regalis 3690.0 12.2 88.9 M. undulatus 1164.0 3.6 92.5
Isle of Wight L. xanthurus 5205.8 30.0 30.0 C. sapidus 5201.0 26.4 56.4 A. mitchilli 5892.8 24.6 81.0 C. regalis 1657.7 7.4 88.4 P. dentatus 395.0 2.9 91.3
Sinepuxent C. sapidus 944.3 31.9 31.9 A. mitchilli 937.7 23.1 55.0 L. xanthurus 339.7 9.5 64.5 P. dentatus 129.0 7.3 71.7 S. maculatus 77.4 4.2 75.9 P. carolinus 75.6 4.1 80.0 S. foetens 73.3 3.7 83.7 E. microstomus 83.0 3.0 86.7 S. aquosus 55.0 2.1 88.8 C. striata 46.7 2.0 90.8
Chincoteague C. sapidus 4849.3 43.6 43.6 L. xanthurus 3030.6 24.7 68.3 A. mitchilli 2677.5 20.7 89.0 P. dentatus 322.2 2.7 91.7

58
species were consistently higher in relative abundance in the northern two bays than in
the southern two bays. In this analysis, Sinepuxent required the greatest number of
species (10) to meet the 90% similarity measure.
Analysis of the seine survey data by the SIMPER procedure showed that six
species (B. tyrannus, C. sapidus, M. menidia, A. mitchilli, B. chrysoura, L. xanthurus)
were diagnostic for each embayment (Table 10). Two additional species (Fundulus
heteroclitus and F. majalis) were necessary to statistically distinguish Sinepuxent. M.
menidia (the most abundant species collected in the seine survey) abundance was greatest
in Sinepuxent (CPUE = 352) and lowest in Chincoteague (CPUE = 53.7). B. tyrrannus,
the second most abundant species in the seine survey, was most abundant in Assawoman
(CPUE = 81.9) compared to Sinepuxent (CPUE = 21.7) and Chincoteague (CPUE =
26.4). C. sapidus abundance was highest in Assawoman (CPUE = 101.2) and Sinepuxent
(CPUE= 69.1) and lowest in Chincoteague (CPUE = 66.6) and Isle of Wight (CPUE =
40.6).
Diversity
Species richness varied between bays and seasons, and across years (Figs.23 and
24) for both gear types. For the trawl data, there was a significant difference between
bays (ANOVA, F= 58.5, p< 0.0001) and season (F = 153.3, p < 0.0001). The northern
bays of Assawoman (mean= 7.6 and 13.5 for trawl and seine, respectively) and Isle of
Wight (mean=7.3 and 11.6 for trawl and seine, respectively) were higher in species
richness compared to those of Sinepuxent (mean = 4.8 and 10.1 for trawl and seine,
respectively) and Chincoteague (mean=6.2 and 10.6 for trawl and seine, respectively)

59
Table 10: Results from Similarity Percentage (SIMPER) analysis on seine data, 1991-2002. Diagnostic species are listed in descending order of percent contribution to overall bay similarity. Those species that contribute to the top 90% ranked species are shown. Mean abundance is mean number of individuals per embayment. For common names, see Table 5.
Typifying Species Mean
abundance % contribution Cumulative % Assawoman
B. tyrannus 3946.6 30.7 30.7 C. sapidus 2443.3 18.6 49.3 M. menidia 2525.0 15.4 64.8 L. xanthurus 1843.0 14.9 79.7 B. chrysoura 1966.6 9.4 89.0 A. mitchilli 1055.3 2.6 91.6
Isle of Wight M. menidia 6248.7 31.6 31.6 B. tyrannus 5249.7 31.5 63.1 L. xanthurus 1017.5 9.6 72.7 M. curema 1084.7 7.3 80.0 C. sapidus 1004.5 5.2 85.2 B. chrysoura 617.5 4.0 89.2 A. mitchilli 1165.2 2.6 91.8
Sinepuxent M. menidia 8331.0 42.0 42.0 L. xanthurus 1506.0 24.7 66.7 C. sapidus 1636.3 17.9 84.6 B. tyrannus 917.4 2.5 87.1 F. heteroclitus 421.4 2.0 89.1 F. majales 299.3 2.0 91.1
Chincoteague C. sapidus 1605.9 25.6 25.6 A. mitchilli 1572.1 20.2 45.8 M. menidia 1295.6 19.5 65.2 L. xanthurus 668.3 12.9 78.2 B. tyrannus 1796.5 8.8 86.9 B. chrysoura 636.4 4.1 91.1

60
Figure 23: Mean number of species per haul for 1991-2002 MD DNR coastal finfish trawl survey by season (a) and embayment (b). Bars represent standard error.
2
4
6
8
10
12
14
1991 1992 1993 1994 1995 1996 1997 1998 1999 2000 2001 2002
ASSAWOMANISLE OF WIGHTSINEPUXENTCHINCOTEAGUE
1
2
3
4
5
6
7
8
9
10
1991 1992 1993 1994 1995 1996 1997 1998 1999 2000 2001 2002
SPRINGEARLY SUMMERLATE SUMMERFALL
Mea
n no
. spe
cies
hau
l -1
(a)
(b)

61
Figure 24: Mean number of species per haul for 1991-2002 MD DNR coastal finfish seine survey by bay (a) and season (b). Bars represent standard error.
2
4
6
8
10
12
14
16
18
20
1991 1992 1993 1994 1995 1996 1997 1998 1999 2000 2001 2002
ASSAWOMANISLE OF WIGHTSINEPUXENTCHINCOTEAGUE
2
4
6
8
10
12
14
16
1991 1992 1993 1994 1995 1996 1997 1998 1999 2000 2001 2002
EARLY SUMMERLATE SUMMER
Mea
n no
. spe
cies
hau
l -1
(a)
(b)

62
(Table 11). The two summer seasons (early and late) were not statistically different from
each other, but each was significantly higher than spring and fall samples based on
Tukey’s protected pairwise comparisons. The mean species richness per haul for the
trawl data was without trend during the survey period, but showed a small peak in all
bays except Chincoteague in 1995. A second peak was evident for 2002 for Isle of Wight
bay.
For the seine data, there was a significant difference between mean species
richness by bay (F = 13.8, p < 0.0001) with Assawoman, Isle of Wight, and Chincoteague
being statistically different from each other (Table 11) and Sinepuxent grouping with the
neighboring bays of Isle of Wight and Chincoteague. The two northern bays again had
the highest diversity values. There was no significant seasonal difference between early
and late summer seasons (F = 0.93, p > 0.335). From 1991 through 2002, there was a
general downward trend in richness through the 1990’s followed by an upward trend in
1998 through 2002, particularly evident for Sinepuxent and Assawoman Bays. In
Assawoman Bay, species richness dropped c. 40% from 1991 (S=13.8 haul -1) to 1996
(S=7.6), but subsequently regained the 1991 level in 2002.
The Shannon-Wiener diversity index H’ varied across years for both gear types
(Figure 25) and was statistically different between bays for seine (F = 6.9, p < 0.0001)
and trawl surveys (F = 5.5, p < 0.001). For the seine survey, H’ values declined 1991-
1996 across all bays, but this trend was highly variable between bays (as noted by greater
separation of curves in Fig 25a). After the 1996 low point, diversity increased and the
difference between systems decreased as the curves are closer together. There was no
significant difference between early and late summer for seine H’, but there was a

63
Table 11: Comparison of mean species richness (per haul) between bays and seasons by gear type, using Tukey’s protected test for pairwise comparisons. Bays or seasons with same group letter were not statistically different. N/S = non-significant; NA = not applicable
Group Mean N Bay Trawl Seine Trawl Seine Trawl Seine
Assawoman A A 7.61 13.5 277 72 Isle of Wight A B 7.26 11.6 365 99 Sinepuxent B C 4.78 10.1 261 71
Chincoteague C BC 6.25 10.6 841 193 Season
Spring A NA 4.8 NA 482 NA Early summer B N/S 7.75 10.93 503 217 Late Summer B N/S 7.45 11.31 505 218
Fall A NA 5.12 NA 254 NA
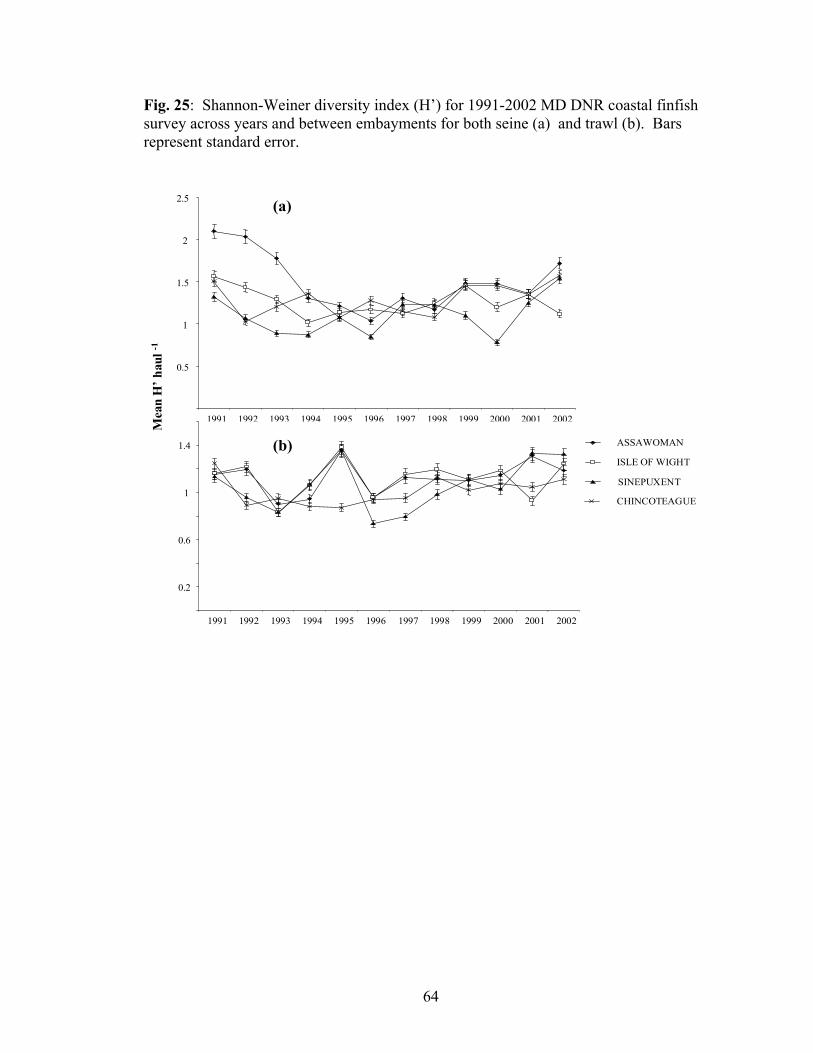
64
Fig. 25: Shannon-Weiner diversity index (H’) for 1991-2002 MD DNR coastal finfish survey across years and between embayments for both seine (a) and trawl (b). Bars represent standard error.
0.5
1
1.5
2
2.5
1991 1992 1993 1994 1995 1996 1997 1998 1999 2000 2001 2002
ASSAWOMAN
ISLE OF WIGHT
SINEPUXENT
CHINCOTEAGUE
0.2
0.6
1
1.4
1991 1992 1993 1994 1995 1996 1997 1998 1999 2000 2001 2002
Mea
n H
’hau
l -1
(a)
(b)

65
seasonal effect in the trawl data (F = 67.9, p < 0.0001) (Table 12). Similar to species
richness, H’ was highest in the northern bays and higher during summer months than
during spring or fall.
The k-dominance curves (Figure 26) for the trawl data overlapped and therefore it
is difficult to make definitive statements about dominance patterns across the bays.
Nonetheless, greater dominance by just a few species in Chincoteague Bay was indicated
by a higher y-intercept. The slopes were similar for the trawl curves, but Sinepuxent
flattened out sooner indicating less dominance and perhaps a greater number of rare
species. K-dominance curves for the seine data showed greater separation between
embayments, but again because of crossing curves, one cannot make definitive
interpretations regarding dominance patterns. Assawoman Bay exhibited a lower curve
and reached an asymptote at a higher cumulative number of species, indicating greater
diversity and reduced dominance. Sinepuxent, on the other hand, was dominated by a
few species as indicated by a high y-intercept. The k-dominance curves for each season
(Figure 27) in the trawl data showed good separation among seasons. The fall curve was
consistently lower demonstrating greater diversity and less dominance in comparison to
summer seasons. Seine k-dominance curves indicated higher diversity in the early
summer in comparison to late summer.

66
Table 12: Pairwise comparisons of Shannon-Wiener diversity index (H’) values for each gear type between season and embayment. Bays or seasons with same group letter were not statistically different. NA = not applicable, N/S = not significant
Group Mean N Bay Trawl Seine Trawl Seine Trawl Seine
Assawoman AC A 1.10 1.50 277 72 Isle of Wight C B 1.1 1.26 365 99 Sinepuxent ABC B 1.05 1.11 261 71
Chincoteague B B 1.01 1.29 841 193 Season
Spring A NA 0.84 NA 482 NA Early summer B N/S 1.13 1.33 503 217 Late Summer BC N/S 1.20 1.25 505 218
Fall D NA 0.96 NA 254 NA

67
Fig. 26: K-dominance curves for each embayment by gear type.
Log Species Rank
1.0 10.0
Abu
ndan
ce
100
95
90
85
80
75
70
65
60
55
50
45
40
35
30
ASSAWOMANCHINCOTEAGUEISLE OF WIGHTSINEPUXENT
Log Species Rank1.0 10.0
100
95
90
85
80
75
70
65
60
55
50
45
40
35
30
25
Abu
ndan
ce
trawl
seine

68
Fig. 27: K-dominance plot for each season by gear type
Log Species Rank1.0 10.0
Abu
ndan
ce
100989694929088868482807876747270686664626058565452504846444240383634
EARLY SUMMERFALLLATE SUMMERSPRING
Log Species Rank1.0 10.0
100989694929088868482807876747270686664626058565452504846444240383634
EARLY SUMMERLATE SUMMER
Abu
ndan
ce
trawl
seine

69
DISCUSSION Fish Assemblage by Embayment
The coastal bays of Maryland support a diverse array of fish species comparable
to other estuarine systems of the Mid-Atlantic Bight (Table 13) in terms of number of
species and diversity. Ordination and cluster analyses demonstrated that each bay
harbors a distinct grouping of finfish and blue crab, and that these differences between
systems were due to the relative abundances of just a few species. Further, there was a
general pattern of higher diversity and abundance of dominant species in the two northern
bays in comparison to the two southern bays.
Inlets are the major, if not only source for marine transients into coastal lagoons
(Mariani 2001). While each of the Maryland embayments supports distinct assemblages,
it is apparent that there is a discrete effect produced by the inlets on those sites closest to
them. Most of the sites align with other sites of the same embayment suggesting that the
sites represented the assemblage of the embayment closely. Yet, some sites were
distinctly ordinated away from their respective embayment and these may have been
related to proximity to direct connections to coastal and freshwater inputs. For example,
trawl sites 12 and 20 were anomalous from other sites in Chincoteague Bay (Fig.19).
Site 12 lies within the northwestern portion of the bay in the sub-embayment of Newport
Bay. This watershed (fed by Trappe Creek and Ayres Creek) drains the town of Berlin
and the water quality is marginal to poor (Wazniak et al. 2004). This site is more aligned
with those of the northern bays presumably due to similar water quality conditions
supportive of similarly tolerant species (e.g., menhaden). On the other hand, site 20 is the
southernmost site and while it was an outlier across all bay sites, it was loosely ordinated

70
Table 13: Comparison of species richness between adjacent coastal systems along the mid-Atlantic shore.
System No.
Species Duration of
Study (years) Sampling
Gear Source Chesapeake Bay 57 5 Mid-water trawl Jung and Houde, 2003 Delaware River 63 14 Beach seine Weisberg et al, 1996
DE Coastal Bays 46 3 Beach seine and otter trawl Derickson and Price, Jr., 1973
MD Coastal Bays 94 12 Beach seine and otter trawl This study
Great Bay, NJ 26 3 Otter trawl Martino and Able, 2003 Atlantic Ocean surf zone, VA 12 3 Surf seine Layman, 2000
Pamlico Sound, NC 78 2 Otter trawl Ross and Eppersly, 1985

71
with Sinepuxent sites (Fig. 19). This site was most proximate to the southern inlet
(Chincoteague, VA) and increased marine influence may have caused this site to ordinate
close to Sinepuxent Bay, which is most proximate to the marine influence of Ocean City
Inlet. Trawl site 7 was anomalous among Isle of Wight sites and appeared to be more
associated with the Sinepuxent sites. Again, this may reflect the proximity of this site to
the Ocean City Inlet and the marine influence on the assemblage there.
Among embayments, seine sites showed considerably more overlap than trawl
sites (Fig.12b), although the embayments maintained similar ordination. Anomalous
sites included sites 4 (Isle of Wight), and sites 14 and 18 (Chincoteague). Site 4 is
adjacent to the Ocean City Inlet and therefore corresponds more closely to the sites of
Sinepuxent (e.g., site 9 that ordinates similarly). Interestingly, sites 14 and 18 ordinated
closely and remained somewhat separated from the other Chincoteague sites. The initial
expectation would be for site 18 (the southernmost seine site) to ordinate more closely to
those sites in Sinepuxent, as observed for the trawl data. This would not explain its
similarity to site 14, which is located mid-bay between the Ocean City Inlet and the
Chincoteague Inlet. A more likely explanation is that these are the only sites occurring
on the eastern side of Chincoteague Bay on Assateague Island. Dense and large seagrass
beds uniquely occur in this region. Therefore, this could be a result of differing SAV
habitat availability in this area.
Previous studies comparing assemblages in estuarine and coastal systems have
focused on trends in species richness along gradients (Wagner 1999; Jung and Houde
2003; Martino and Able 2003), but rarely make direct comparisons between constituent
systems using community metrics (Weinstein 1985). Maryland’s coastal embayment

72
assemblages were characterized broadly by the species richness trends, Shannon-Weiner
index and the k-dominance curves. In terms of trawl diversity measurements,
Assawoman and Isle of Wight were not different, and Sinepuxent shared attributes of all
the other embayments (Table 12). Chincoteague, on the other hand, was different than
Isle of Wight and Assawoman Bays. The k-dominance curves supported these univariate
interpretations of biodiversity between systems. The lower curves (Fig. 26) of
Assawoman (primarily the seine survey) indicated greater diversity and less dominance
in this bay. Conversely, Sinepuxent tended to show higher dominance indicated by a
more arced curve, particularly evident in the seine data.
The seine data (i.e., the littoral zone) shows a more compelling dominance pattern
as indicated by the dominance curves. Sinepuxent and Isle of Wight littoral zones were
dominated by fewer species, perhaps indicative of either less habitat heterogeneity or less
influence by transients. The first scenario is unlikely since Sinepuxent is well covered
with eelgrass and has topographic heterogeneity due to the tidal action maintaining the
channel. This dominance pattern may be alternatively the result of few species capable
of prolonged inhabitance in these two embayments due to higher flow and other oceanic
influences. The lower dominance seen in Assawoman and Chincoteague suggests that
marine transients (which favor littoral habitats) are not spending time in Sinepuxent or
Isle of Wight, but may be using these systems as corridors to reach areas in Chincoteague
or Assawoman Bays. If this were the case, transient species would be using the channel
for movement and the trawl survey would show more equitability in the dominance
curves, which it does. In addition, the SIMPER analysis showed that Sinepuxent and Isle
of Wight littoral zones were dominated most by M. menidia (Table 10) and that this

73
species is replaced as the dominant species in the other two bays by B. tyrranus
(Assawoman) and C. sapidus (Chincoteague). M. menidia feeds primarily on
zooplankton and it is likely that this preferred food source is in greater abundance nearer
to the inlet region. In addition, because of this visual feeding strategy, M. menidia may
face difficulties in feeding success in Assawoman where water clarity is decreased
(Wazniak et al. 2004) and the dominant species switches to a filter feeder, B. tyrrannus.
Wazniak et al (2004) report low Secchi depth (a measure of water clarity) in Assawoman
Bay suggesting that decreased visibility may play a role in structuring the fish
assemblage there.
Species richness is the most widely used diversity measure and perhaps the easiest
metric to use when assessing the biodiversity of a system (Hill 1973; Stirling and Wilsey
2001; Foggo et al. 2003). The number of species that a system can support indicates
ecosystem stability, suitable habitat, niche availability, and trophic structure. There were
significant differences in the number of species taken per sample between each of the
bays, with the northern bays (Assawoman and Isle of Wight) supporting a higher richness
than the southern bays. The trawl data indicated no difference between the two northern
bays, while Chincoteague and Sinepuxent were different, with a particularly low number
of species found in Sinepuxent (~4.8 haul -1) (Table 11). The seine data exhibited a
comparable pattern although there was greater overlap between Isle of Wight and
Chincoteague, and a significant difference between the two northern bays. For both data
sets, Assawoman consistently supported a higher number of species and individuals per
unit effort even though the total number of species caught in the system (by trawl) was
lowest (59 total). Total species richness for Assawoman seine data was second lowest

74
(after Sinepuxent-Table 6). This presents an interesting contrast from several viewpoints.
On one hand, Assawoman Bay is supporting high diversity at the sample level as
measured by species richness, diversity, and abundance. However, overall, not as many
species are coming into the system over a larger temporal scale as it had the fewest
number of species encountered. Assawoman Bay therefore is supporting a resident
assemblage that is fairly diverse, but a fewer number of species exploits the bay over
time. Causal factors of these differences could include eutrophication and associated
water quality, habitat heterogeneity, or disturbance.
Eutrophication is an ongoing issue in coastal areas, and the lagoon system of
Maryland is no exception (Boynton et al. 1996; Wazniak et al. 2004). The northern bays
face increasing nutrient loads coupled with reduced habitat heterogeneity due to
relatively low coverage of seagrasses (predominantly Z. marina) and increased
development of the surrounding resort community. Thus, the carrying capacity of these
systems may be altered. It has been argued that increased nutrient loads lead to increased
fish productivity (Lee and Jones 1991; Nixon and Buckley 2002) as a result of escalated
primary production. The higher abundances in the northern bays are consistent with this
view because these bays are significantly more eutrophic than the southern two bays
(Boynton et al. 1996). Still, eutrophication can also significantly affect the types of fish
present in a waterbody (Caddy 2000). Generally, highly eutrophic waterbodies tend to
have dominant populations of “rough” or pelagic fish that feed at lower trophic levels
(Lee and Jones 1991; Price 1998). While the exact mechanism of the change from higher
trophic level species (piscivores) to lower trophic level species with increasing fertility is
poorly understood, some authors have suggested that it is related to such factors as

75
reduced foraging by piscivorous species brought about by increased turbidity from
increased concentrations of phytoplankton (median values [2001-2004] for Chl a [µg L -
1]: Assawoman = 15, Isle of Wight = 11, Sinepuxent = 5, Chincoteague = 5, from
Wazniak et al, 2004). This phenomenon may be taking place in Assawoman (and to an
extent Isle of Wight) as the overall number organisms caught is consistent with higher
eutrophication, but the higher mean species per haul in the northern systems is
inconsistent with expectations. Price (1998) compared patterns of littoral species
assemblages in the Maryland embayments with those of Delaware (heavily eutrophied
and lacking seagrass habitat) and concluded that the eutrophied systems in Delaware shift
to a Fundulus-dominated system in contrast to menhaden, spot, and silversides in more
oligotrophic systems. However, CPUE (seine) for F. heteroclitus and F. majalis was
generally higher in Sinepuxent Bay (Table 5) than the other bays contrary to an
expectation of higher abundances in the two northern bays should this genus represent
eutrophication patterns. Caddy (2000) has proposed that eutrophication may cause a shift
in dominance from demersal species to pelagic species that are better equipped to exploit
increases in primary production. Experimental work addressing issues of reduced
foraging ability and a demersal-pelagic shift would prove quite valuable for resource
managers as most piscivores are also commercially or recreationally valuable species.
Seasonal Variability of Dominant Species
Due to the differing temporal nature of the two surveys, the primary focus of
seasonal analysis rested with the trawl data. The trawl statistics showed that peak catches
occurred in the summer seasons, with abundances much reduced in spring and fall. The
ordinations of sites by bay were maintained in large part across seasons (Fig.20).

76
Interestingly, sites 7, 12, and 20 consistently ordinated away from other sites of the same
embayment, regardless of season. There was only moderate support for seasonal changes
in the assemblages; early and late summer data ordinated in separate clusters. The
pairwise comparisons between seasons, although all statistically significant, resulted in
low R values, indicative of strong overlap in species composition between seasons. This
suggests that while the seasons were discrete in terms of assemblage structure, many
species were using these embayments for longer than one season, with the notable
exception of herring (C. harengus) that is dominant within the overall survey dataset, but
only appears in the spring (Fig. 11). This predictable springtime appearance of herring
once supported a short-term anchor gill net fishery in upper Chincoteague Bay (Schwartz
1961) but its abundance or fishery has not been historically noted for Assawoman Bay
(Schwartz 1964). The differential use of the embayments has apparently shifted as the
CPUE for this species was highest in Assawoman and lowest for Sinepuxent over the
course of this survey. Seasonality of this species was also reflected within the CART
analysis which showed that temperature was the most important explanatory variable for
their abundance. Herring caught during the course of this survey were generally small (<
70 mm) (R. Murphy, unpublished data), though, suggesting that only juvenile herring are
entering the bays. Schwartz’s work (1960, 1964) suggests that adult herring exploited the
bays in large numbers that have not been recorded in recent times. This discrepancy
indicates differential use of the habitat over large temporal scales where adults no longer
enter the system and are therefore absent from the data. Another possible explanation for
this apparent shift in life stage is the differing gears; gill nets select larger fish than the
trawl and seine gear used in state surveys.

77
Not only did herring show considerable seasonal abundance patterns, but other
important commercial species showed temporal variation based on migratory, foraging,
or exploitation factors. Blue crab (C. sapidus) showed a consistent peak in abundance in
early summer in both the trawl and seine data (Figs. 4 and 5). This pattern occurred
across all embayments. Blue crabs exhibit migratory patterns in the coastal embayments
(Cargo 1958) although little salinity gradient exists. Cargo (1958) showed through
tagging experiments that crabs migrated to the southern inlet at Chincoteague although
they were released much nearer to the inlet at Ocean City. Cargo also noted that there
may be a resident population that completes its life cycle entirely within the embayments
without migrating into coastal waters. The seasonal patterns in abundance in this study
supported a possible late summer emigration to the ocean, although another possible
explanation that deserves further investigation is that harvest pressure on a closed
population from commercial and recreational crabbers during the summer months may
cause a marked decline from early summer to fall months. Although seasonal catch data
is not currently available for the coastal bays crab fishery and thus fishing mortality
estimates are unattainable, the fishing pressure follows that of the Chesapeake Bay where
peak effort occurs in mid-to late summer. Therefore, the seasonal decline in abundance
was likely due to fishing pressure. Lastly, a recent infestation of a crustacean parasite
(Hematodinium sp.) may also play a role in decreasing abundance over the course of a
year (Wazniak et al. 2004). The impact of this parasite is currently under investigation.
Bay anchovy (A. mitchilli) was a dominant species in both trawl and seine surveys
and showed modest fluctuations in abundance across years (Figs. 6 and 7). This species
is abundant in mid-Atlantic estuaries (Weisberg et al. 1996; Jung and Houde 2003) and is
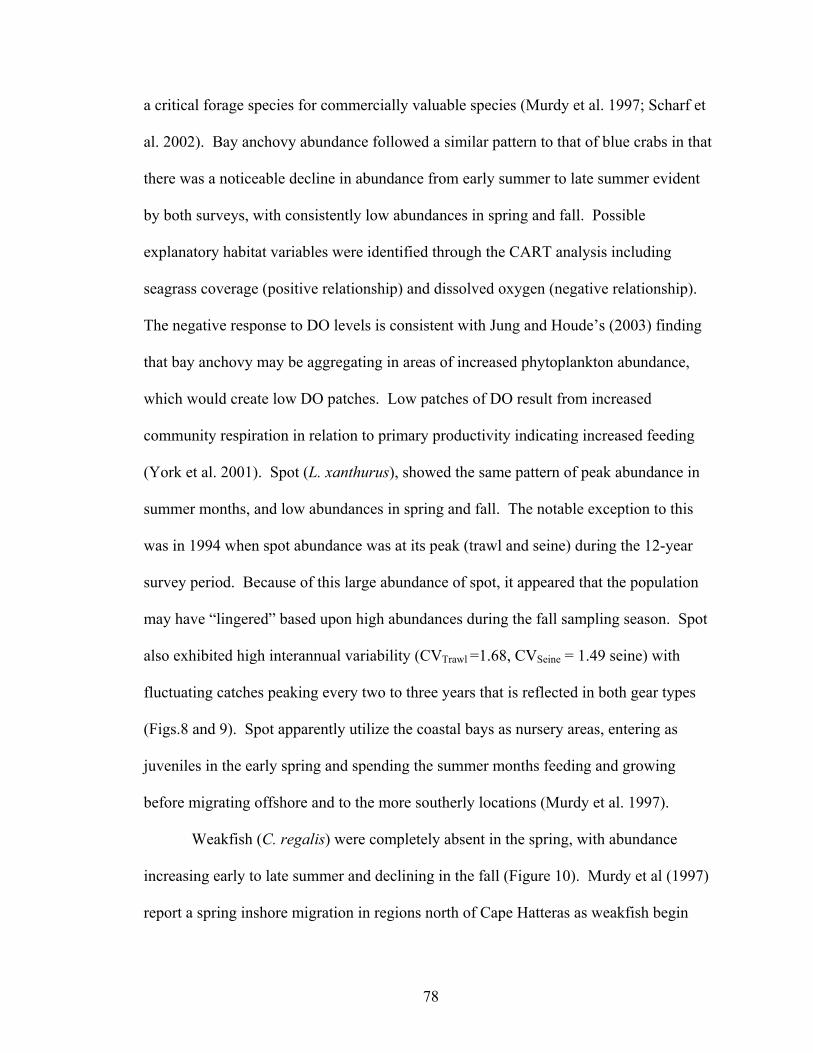
78
a critical forage species for commercially valuable species (Murdy et al. 1997; Scharf et
al. 2002). Bay anchovy abundance followed a similar pattern to that of blue crabs in that
there was a noticeable decline in abundance from early summer to late summer evident
by both surveys, with consistently low abundances in spring and fall. Possible
explanatory habitat variables were identified through the CART analysis including
seagrass coverage (positive relationship) and dissolved oxygen (negative relationship).
The negative response to DO levels is consistent with Jung and Houde’s (2003) finding
that bay anchovy may be aggregating in areas of increased phytoplankton abundance,
which would create low DO patches. Low patches of DO result from increased
community respiration in relation to primary productivity indicating increased feeding
(York et al. 2001). Spot (L. xanthurus), showed the same pattern of peak abundance in
summer months, and low abundances in spring and fall. The notable exception to this
was in 1994 when spot abundance was at its peak (trawl and seine) during the 12-year
survey period. Because of this large abundance of spot, it appeared that the population
may have “lingered” based upon high abundances during the fall sampling season. Spot
also exhibited high interannual variability (CVTrawl =1.68, CVSeine = 1.49 seine) with
fluctuating catches peaking every two to three years that is reflected in both gear types
(Figs.8 and 9). Spot apparently utilize the coastal bays as nursery areas, entering as
juveniles in the early spring and spending the summer months feeding and growing
before migrating offshore and to the more southerly locations (Murdy et al. 1997).
Weakfish (C. regalis) were completely absent in the spring, with abundance
increasing early to late summer and declining in the fall (Figure 10). Murdy et al (1997)
report a spring inshore migration in regions north of Cape Hatteras as weakfish begin
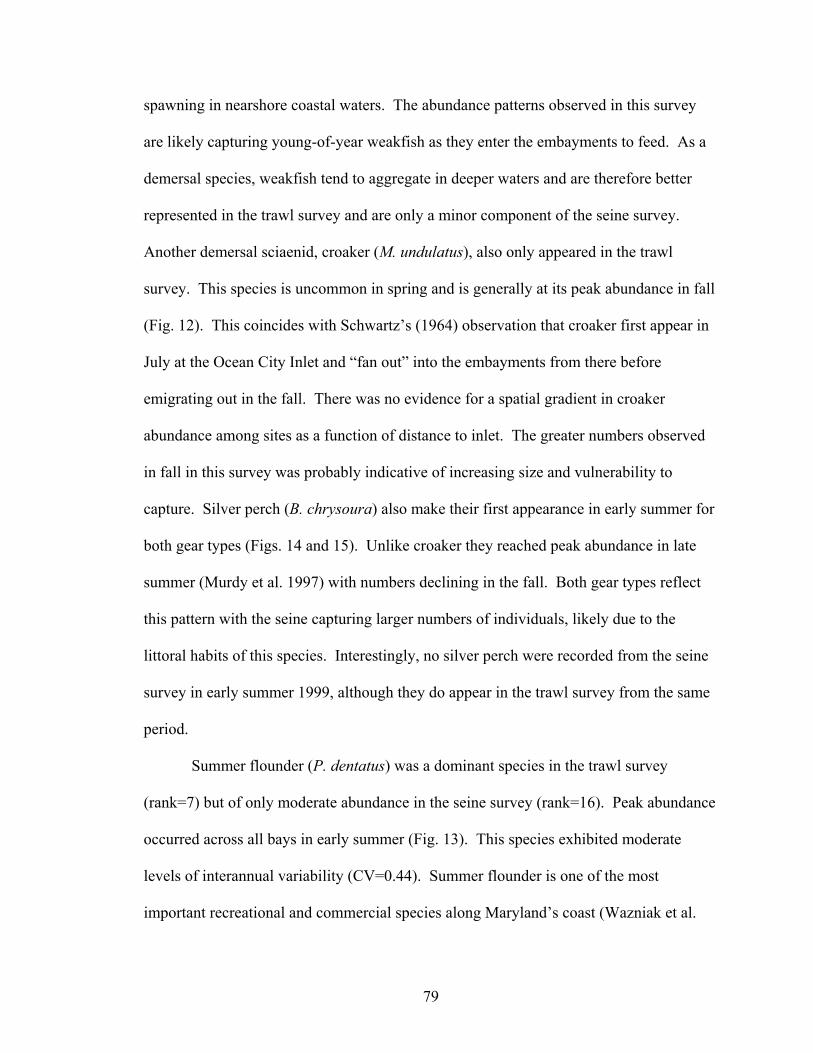
79
spawning in nearshore coastal waters. The abundance patterns observed in this survey
are likely capturing young-of-year weakfish as they enter the embayments to feed. As a
demersal species, weakfish tend to aggregate in deeper waters and are therefore better
represented in the trawl survey and are only a minor component of the seine survey.
Another demersal sciaenid, croaker (M. undulatus), also only appeared in the trawl
survey. This species is uncommon in spring and is generally at its peak abundance in fall
(Fig. 12). This coincides with Schwartz’s (1964) observation that croaker first appear in
July at the Ocean City Inlet and “fan out” into the embayments from there before
emigrating out in the fall. There was no evidence for a spatial gradient in croaker
abundance among sites as a function of distance to inlet. The greater numbers observed
in fall in this survey was probably indicative of increasing size and vulnerability to
capture. Silver perch (B. chrysoura) also make their first appearance in early summer for
both gear types (Figs. 14 and 15). Unlike croaker they reached peak abundance in late
summer (Murdy et al. 1997) with numbers declining in the fall. Both gear types reflect
this pattern with the seine capturing larger numbers of individuals, likely due to the
littoral habits of this species. Interestingly, no silver perch were recorded from the seine
survey in early summer 1999, although they do appear in the trawl survey from the same
period.
Summer flounder (P. dentatus) was a dominant species in the trawl survey
(rank=7) but of only moderate abundance in the seine survey (rank=16). Peak abundance
occurred across all bays in early summer (Fig. 13). This species exhibited moderate
levels of interannual variability (CV=0.44). Summer flounder is one of the most
important recreational and commercial species along Maryland’s coast (Wazniak et al.

80
2004) and its population trends are closely monitored. Juvenile summer flounder utilize
Zostera beds (Murdy et al. 1997) in nearshore regions and migrate to deeper waters as
they age. After age 3, summer flounder migrate to and remain in coastal waters where
spawning takes place. Therefore, the fact that both of the northern bays, which have
lesser coverage of Zostera, generally supported higher numbers of summer flounders in
all seasons is at odds with the known life history pattern. Furthermore, the CART
analysis for summer flounder abundance indicated that although SAV coverage was
important, this species’ abundance was largely determined by an interaction of
temperature and tidal state (Fig. 18), although the mechanism of tidal influence is non-
directional.
Menhaden (B. tyrannus) is another valuable commercial species that also serve as
an important forage species. Menhaden was a dominant species in both gear types,
particularly in the littoral zone sampled by seine. Both surveys showed an increase in
abundance in the early summer with the total catch tapering off in late summer and fall
months. This was most apparent particularly in the seine data, while the trawl data
showed a greater degree of variability between seasons (Figs. 16 and 17). Menhaden in
the US mid-Atlantic exhibit protracted spawning with a peak during the winter offshore
(~ 16-32 km) where the larvae are then transported into estuarine systems to feed and
grow through the summer. Both gear types demonstrate high interannual variability
(CVTrawl = 1.19, CVSeine = 1.14) for this species.
Community structure

81
Contemporary theories attribute local community structure to at least four
parameters (or combinations thereof): predation, competition, disturbance, and spatial
heterogeneity (Menge and Sutherland 1976; Menge 1995; Connell 2002). Most studies
on the role of competition and disturbance in fish communities have come from coral
reefs (Steele 1997; Almany 2004) or freshwater systems (Werner and Hall 1977), while
few estuarine studies have considered these factors (Weinstein 1985). Although this
study was not undertaken to identify those factors responsible for community structure
per se, inferences may be possible based upon the emergent assemblage structure
described. For example, the continued decline of the forage fish index (comprised of the
annual log CPUE of spot, bay anchovy, Atlantic silverside, and Atlantic menhaden)
developed by the state (Wazniak et al. 2004) may reflect the continued loss of littoral
habitat in the more developed bays to the north, thus reducing overall habitat
heterogeneity. Yet, the production levels for these embayments are much higher (Table
6) which may serve to dampen the influence of low structural complexity. The forage
fish index is a useful measure of overall prey availability as distributed across all bays,
but lacks the spatial resolution that may be underlying changes in the index. The CART
analysis did not indicate relationships between the various species comprising the index,
suggesting that these populations are responding independently of each other.
Furthermore, because the embayments are supporting varying populations of these
species, the overall downward trend of this index may only be driven by one species, or
abundances in a given bay. If this is the case, there may be confounding underlying
mechanisms determining the composition of the forage species, and lack of a

82
straightforward reason (e.g., degraded habitats throughout the lagoon complex) for
negative or positive trends.
Habitat complexity and competition are likely influences on fish assemblages in
coastal lagoon systems, but simple area or volume of habitat can explain substantial
variability in species richness across ecosystems (Wootton 1999; Frank and Shackell
2001). Wootton (1999) asserts several hypotheses that may account for a positive
correlation between species richness and area. Large areas by definition provide more
space and thus are more likely to support rare species. Chincoteague Bay (area = 189 x
106 m2 from Boynton et al, 1996) is by far the largest embayment and did exhibit the
highest overall species count (Table 6). Additionally, larger areas are more likely to
support diverse habitats (e.g. oyster reefs, seagrass, and channel edges) thus supporting
more species exploiting these niches. Chincoteague has a greater amount of seagrass
coverage than the other three embayments, but all are devoid of reef structure (Wazniak
et al. 2004). The third possible reason for the area-richness relationship suggested by
Wootton (1999) is that assemblages in small areas are more likely to incur high rates of
extinction and lower rates of immigration. The extinction scenario is unlikely in the
coastal bays due to the proximity of alternative habitats; however, differential
immigration may be a plausible explanation for the low mean species per haul seen in
Sinepuxent Bay, if this bay receives less oceanic influence due to reduced advection (see
Introduction). Still, species are arriving in high diversity to Chincoteague. It is possible
that the southern route for immigration is a dominant determinant of diversity throughout
the Chincoteague. Lastly, it is possible that overall richness values were higher in
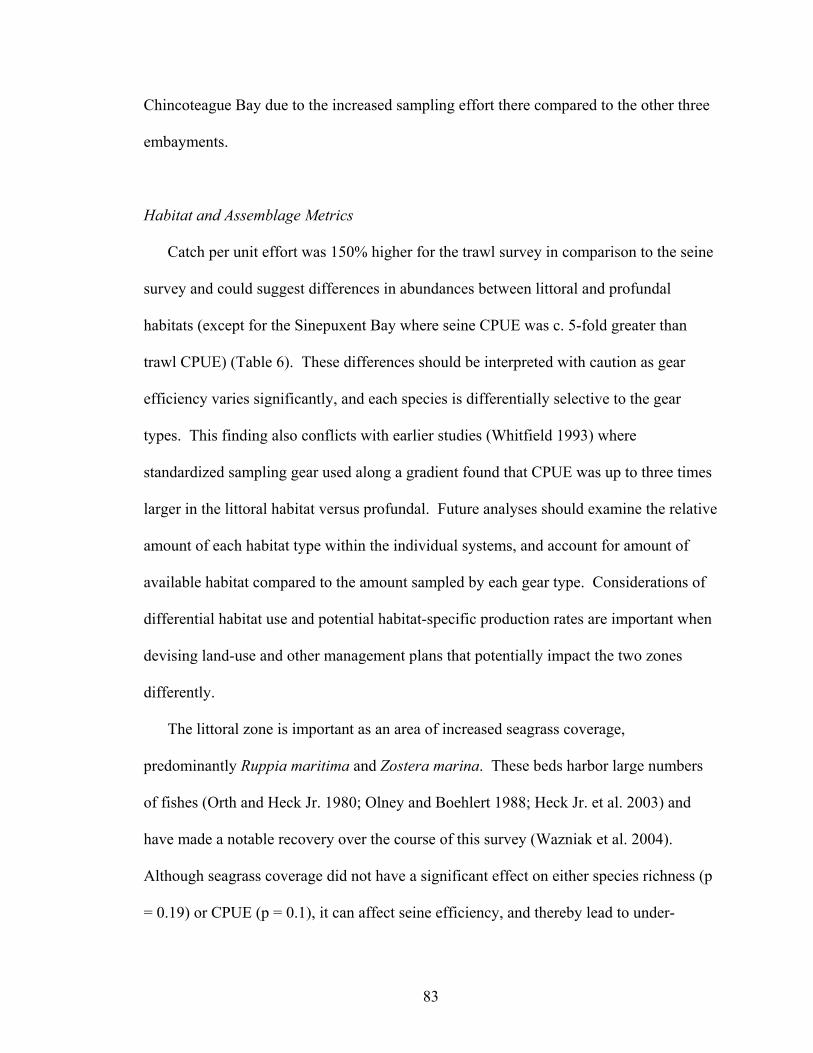
83
Chincoteague Bay due to the increased sampling effort there compared to the other three
embayments.
Habitat and Assemblage Metrics
Catch per unit effort was 150% higher for the trawl survey in comparison to the seine
survey and could suggest differences in abundances between littoral and profundal
habitats (except for the Sinepuxent Bay where seine CPUE was c. 5-fold greater than
trawl CPUE) (Table 6). These differences should be interpreted with caution as gear
efficiency varies significantly, and each species is differentially selective to the gear
types. This finding also conflicts with earlier studies (Whitfield 1993) where
standardized sampling gear used along a gradient found that CPUE was up to three times
larger in the littoral habitat versus profundal. Future analyses should examine the relative
amount of each habitat type within the individual systems, and account for amount of
available habitat compared to the amount sampled by each gear type. Considerations of
differential habitat use and potential habitat-specific production rates are important when
devising land-use and other management plans that potentially impact the two zones
differently.
The littoral zone is important as an area of increased seagrass coverage,
predominantly Ruppia maritima and Zostera marina. These beds harbor large numbers
of fishes (Orth and Heck Jr. 1980; Olney and Boehlert 1988; Heck Jr. et al. 2003) and
have made a notable recovery over the course of this survey (Wazniak et al. 2004).
Although seagrass coverage did not have a significant effect on either species richness (p
= 0.19) or CPUE (p = 0.1), it can affect seine efficiency, and thereby lead to under-
84
represented estimates of diversity and abundance (Serafy et al. 1988). Still, as indicated
previously, the CART analysis showed a positive relationship between seagrass coverage
with abundances of A. mitchilli and P. dentatus (Fig.18). Although increased seagrass
coverage might be expected to result in increased juvenile fish production across the
embayments, the forage fish index has declined concomitantly with increasing SAV
coverage. One possible explanation may be that the bays differ in suitable seagrass
habitat. However, Wazniak et al (2004) standardized the seagrass coverage for each
system by calculating percentage of embayment covered. Chincoteague and Sinepuxent
Bays are well vegetated (32 and 36 %, respectively) compared to Assawoman and Isle of
Wight (8 and 6 %, respectively). Seagrass coverage may be important in many coastal
systems, but other factors appear to be reducing the effects.
Most species encountered in the mid-Atlantic coastal bays are spawned elsewhere and
enter the coastal bays either passively (via oceanic transport) (Warlen et al. 2002) or
actively as they search for foraging regions and/or refugia (Heck Jr. et al. 2003).
Recruitment (e.g., menhaden and blue crab) is often driven externally by drivers such as
oceanic circulation and wind patterns (Epifanio and Garvine 2001; Warlen et al. 2002)
although it is likely that many of the Fundulids represent a population recruiting from
within the coastal bays. Thus, the assemblages of these systems are structured by
processes of differing degree with large-scale external processes likely affecting the four
connected bays similarly. In this respect, the embayments respond as open systems with
the chief external driver at the Ocean City Inlet (and to a lesser extent, the Chincoteague
Inlet given its further distance from the northern bays) serving as the oceanic vector. On
a smaller scale, the embayments may exhibit attributes of closed systems. The northern

85
bays are differentially affected by anthropogenic influences and therefore the
assemblages here are shaped by local conditions in comparison to the southern bays,
which are less impacted and maintain different populations.
This study used multiple assemblage metrics to evaluate faunal attributes across four
interconnected coastal lagoons. The ability to discriminate differences between the
associated coastal lagoons based solely on the composition of species suggests that
management actions may need to be tailored to individual lagoon systems and their
attributes rather than applied generically across all bays. Likewise, the possible influence
of increased eutrophication is a likely explanation for the increased productivity levels
observed in the northern bays given the lower habitat availability and reduced water
quality. In addition, because the differences between each embayment were
characterized by changes in relative abundances of a few species (as opposed to a
complete turnover in species), there seems to be a suggestion of varying carrying
capacities of each embayment. Seagrass coverage, although increasing over the course of
this survey, did not have obvious effects on species diversity and abundance across or
within the embayments, although it did have positive associations with two important
species. Further experimental work is warranted to provide greater understanding of
aspects driving species diversity, community structure, and trophic changes within these
systems.

86
LITERATURE CITED
Able, K. W. and M. P. Fahay (1998). The First Year in the Life of Estuarine Fishes in the Middle Atlantic Bight. New Brunswick, New Jersey, Rutgers University Press.
Almany, G. R. (2004). "Does increased habitat complexity reduce predation and
competition in coral reef fish assemblages?" Oikos 106: 275-284. Boynton, W. R., L. Murray, J. D. Hagy, C. Stokes and W. M. Kemp (1996). "A
comparative analysis of eutrophication patterns in a temperate coastal lagoon." Estuaries 19(2B): 408-421.
Breiman, L., J. H. Friedman, R. A. Olshen and C. J. Stone (1984). Classification and
regression trees. Belmont, California, Wadsworth International Group. Caddy, J. F. (2000). "Marine catchment basin effects versus impacts of fisheries on semi-
enclosed seas." ICES Journal of Marine Science 57: 628-640. Cargo, D. G. (1958). "The migration of adult female blue crabs, Callinectes sapidus
Rathbun, in Chincoteague Bay and adjacent waters." Journal of Marine Research 16(3): 180-191.
Cerco, C. F., C. S. Fang and A. Rosenbaum (1978). Intensive hydrographical and water
quality survey of the Chincoteague/Sinepuxent/Assawoman Bay systems, Volume III. Non-point source pollution studies in the Chincoteague Bay system. Gloucester Point, VA, Virginia Institute of Marine Science.
Clarke, K. R. (1993). "Non-parametric multivariate analyses of changes in community
structure." Australian Journal of Ecology 18: 117-143. Clarke, K. R. and M. Ainsworth (1993). "A method for linking multivariate commuity
structure to environmental variables." Marine Ecology Progress Series 92(3): 205-219.

87
Connell, S. D. (2002). "Effects of a predator and prey on a foraging reef fish: implications for understanding density-dependent growth." Journal of Fish Biology 60: 1551-1561.
Cyrus, D. P. and S. J. M. Blaber (1992). "Turbidity and salinity in a tropical Nothern Australian estuary and their influence on fish distribution." Estuarine, Coastal and Shelf Science 35: 545-563.
Day Jr., J. W. and A. Yanez-Arincibia (1985). Coastal lagoons and estuaries as an
environment for nekton. Fish Community Ecology in Estuaries and Coastal Lagoons: Towards an Ecosystem Integration. A. Yanez-Arincibia (ed). Mexico, UNAM Press: 17-34.
Day Jr., J. W., C. Hall, W. M. Kemp and A. Yanez-Arincibia (1989). Nekton, the free
swimming consumers. Estuarine Ecology(ed). New York, Wiley-Interscience, John Wiley & Sons.
Derickson, W. K. and K. S. Price (1973). "The fishes of the shore zone of Rehoboth and
Indian River Bays, Delaware." Transactions of the American Fisheries Society 102(3): 552-562.
Desmond, J. S., D. H. Deutschman and J. B. Zedler (2002). "Spatial and temporal
variation in estuarine fish and invertebrate assemblages: Analysis of an 11-year data set." Estuaries 25(4A): 552-569.
Eby, L. A. and L. B. Crowder (2004). "Effects of hypoxic disturbances on an estuarine
nekton assemblage across multiple scales." Estuaries 27(2): 342-351. Epifanio, C. E. and R. W. Garvine (2001). "Larval transport on the Atlantic continental
shelf of North America: A review." Estuarine, Coastal and Shelf Science 52: 51-77.
Fairbridge, R. W. (1980). The estuary: its definition and geodynamics cycle. Chemistry
and Biochemistry of Estuaries. E. Olausson and I. Cato (ed). New York, Wiley-Interscience, John Wiley & Sons, Inc.: 1-36.
Fasham, M. J. R. (1977). "A comparison of nonmetric multidimensional scaling,
principal components and reciprocal averaging for the ordination os simulated coenoclines and coenoplanes." Ecology 58: 551-561.

88
Field, J. G., K. R. Clarke and R. M. Warwick (1982). "A practical strategy for analyzing
multispecies distribution patterns." Marine Ecology Progress Series 8: 37-52. Foggo, A., M. J. Attrill, M. T. Frost and A. A. Rowden (2003). "Estimating marine
species richness: an evaluation of six extrapolative techniques." Marine Ecology Progress Series 248: 15-26.
Frank, K. T. and N. L. Shackell (2001). "Area-dependent patterns of finfish diversity in a
large marine ecosystem." Canadian Journal of Fisheries and Aquatic Sciences 58: 1703-1707.
Franzoi, P., R. Maccagnani, R. Rossi and V. U. Ceccherelli (1993). "Life cycles and
feeding habits of Syngnathus taenionotus and S. abaster (Pisces, Syngnathidae) in a brackish bay of the Po River Delta (Adriatic Sea)." Marine Ecology Progress Series 97: 71-81.
Gillanders, B. M., K. W. Able, J. A. Brown, D. B. Eggleston and P. F. Sheridan (2003).
"Evidence of connectivity between juvenile and adult habitats for mobile marine fauna: an important component of nurseries." Marine Ecology Progress Series 247: 281-295.
Hagan, S. M. and K. W. Able (2003). "Seasonal changes of the pelagic fish assemblage
in a temparate estuary." Estuarine, Coastal and Shelf Science 56: 15-29. Heck Jr., K. L., G. Hays and R. J. Orth (2003). "Critical evaluation of the nursery role
hypothesis for seagrass meadows." Marine Ecology Progress Series 253: 123-136. Henderson, P. A. and A. R. Margetts (1988). "Fish in estuaries." Journal of Fish Biology
33: 254 pp. Hill, M. O. (1973). "Diversity and evenness: A unifying notation and its consequences."
Ecology 54(2): 427-432. Hurlbert, S. H. (1971). "The nonconcept of species diversity: a critique and alternative
parameters." Ecology 52(4): 577-586.

89
Ishitobi, Y., J. Hiratsuka, H. Kuwabara and M. Yamamuro (2000). "Comparison of fish
fauna in three areas of adjacent eutrophic estuarine lagoons with different salinities." Journal of Marine Systems 26: 171-181.
Jeppesen, E., J. P. Jensen, M. Sondergaard, T. Lauridsen and F. Landkildehus (2000).
"Trophic structure, species richness and biodiversity in Danish lakes: changes along a phosphorous gradient." Freshwater Biology 45: 201-218.
Jung, S. and E. D. Houde (2003). "Spatial and temporal variabilities of pelagic fish
community structure and distribution in Chesapeake Bay, USA." Estuarine, Coastal and Shelf Science 58: 335-351.
Kupschius, S. and D. Tremain (2001). "Associations between fish assemblages and
environmental factors in nearshore habitats of a subtropical estuary." Journal of Fish Biology 58: 1383-1403.
Lalli, C. M. and T. R. Parsons (1997). Biological Oceanography. Oxford, U.K.,
Butterworth-Heinemann. Lambshead, P. J. D., H. M. Platt and K. M. Shaw (1983). "The detection of differences
among assemblages of marine benthic species based on an assessment of dominance and diversity." Journal of Natural History 17: 859-874.
Lankford, R. R. (1977). Coastal lagoons of Mexico: Their origin and classification.
Estuarine Processes. M. L. Wiley (ed). New York, Academic Press. 2: 182-215. Lee, G. F. and R. A. Jones (1991). "Effects of eutrophication on fisheries." Reviews in
Aquatic Sciences 5(3-4): 287-305. MacArthur, R. H. and E. D. Wilson (1967). The theory of island biogeography.
Princeton, New Jersey, Princeton University Press. Maes, J., S. van Damme, P. Meire and F. Ollevier (2004). "Statistical modeling of
seasonal and environmental influences on the population dynamics of an estuarine fish community." Marine Biology 145: 1033-1042.

90
Magurran, A. E. (1991). Ecological Diversity and its Measurement. London, Chapman
and Hall. Mariani, S. (2001). "Can spatial distribution of ichthyofauna describe marine influence
on coastal lagoons? A central Mediterranean case study." Estuarine, Coastal and Shelf Science 52: 261-267.
Martino, E. J. and K. W. Able (2003). "Fish assemblages across the marine to low
salinity transition zone of a temperate estuary." Estuarine, Coastal and Shelf Science 56: 969-987.
Maxted, J. R., S. B. Weisberg, J. C. Chaillou, R. A. Eskin and F. W. Kutz (1997). "The
ecological condition of dead-end canals of the Delaware and Maryland coastal bays." Estuaries 20(2): 319-327.
May, R. M. (1975). Patterns of species abundance and diversity. Ecology of Evolution of
Communities. M. L. Cody and J. M. Diamond (ed). Harvard, Belnap Press. Menge, B. A. and J. P. Sutherland (1976). "Species diversity gradients: Synthesis of the
roles of predation, competition, and temporal heterogeneity." The American Naturalist 110: 351-169.
Menge, B. A. (1995). "Indirect effects in marine rocky intertidal interaction webs:
patterns and importance." Ecological Monographs 65(1): 21-74. Mouillot, D., S. Gaillard, C. Aliaume, M. Verlaque, T. Belsher, M. Troussellier and T. D.
Chi (2005). "Ability of taxonomic diversity indices to discrimintate coastal lagoon environments based on macrophyte communities." Ecological Indicators 5: 1-17.
Murdy, E. O., R. S. Birdsong and J. A. Musick (1997). Fishes of Chesapeake Bay.
Washington, DC, Smithsonian Institution Press. Nixon, S. (1982). "Nutrient dynamics, primary production and fisheries yields of
lagoons." Oceanologica Acta 4: 357-371.
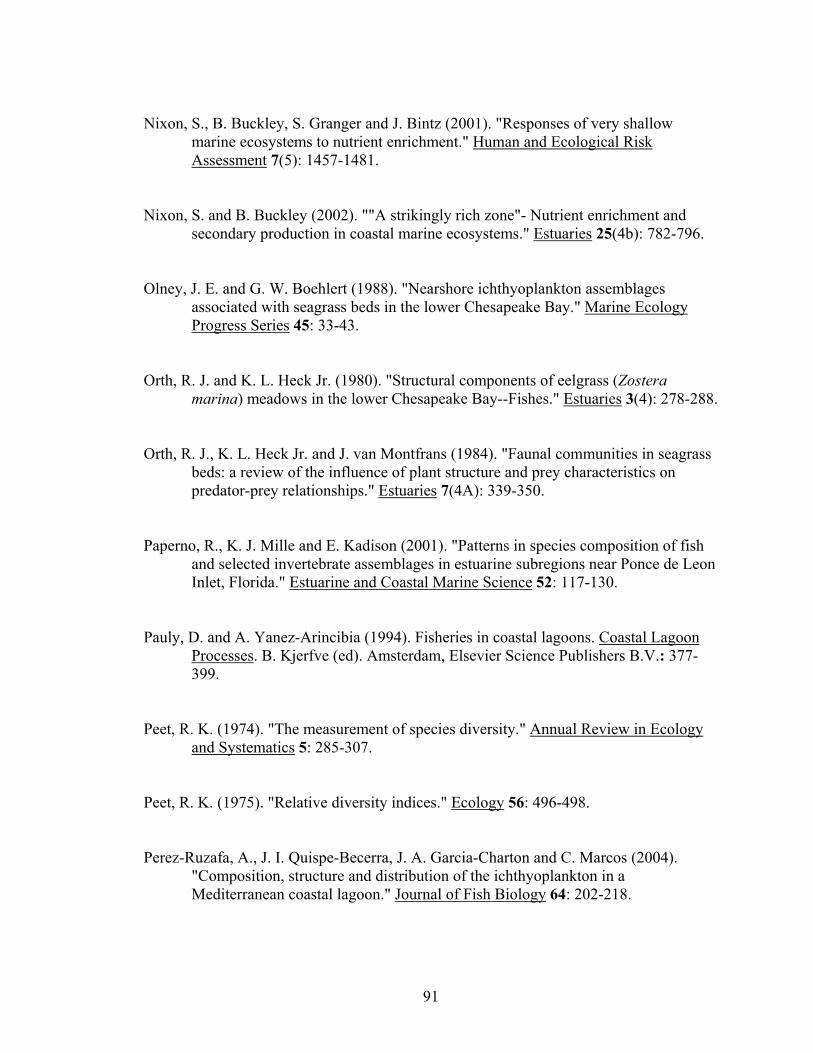
91
Nixon, S., B. Buckley, S. Granger and J. Bintz (2001). "Responses of very shallow
marine ecosystems to nutrient enrichment." Human and Ecological Risk Assessment 7(5): 1457-1481.
Nixon, S. and B. Buckley (2002). ""A strikingly rich zone"- Nutrient enrichment and
secondary production in coastal marine ecosystems." Estuaries 25(4b): 782-796. Olney, J. E. and G. W. Boehlert (1988). "Nearshore ichthyoplankton assemblages
associated with seagrass beds in the lower Chesapeake Bay." Marine Ecology Progress Series 45: 33-43.
Orth, R. J. and K. L. Heck Jr. (1980). "Structural components of eelgrass (Zostera
marina) meadows in the lower Chesapeake Bay--Fishes." Estuaries 3(4): 278-288. Orth, R. J., K. L. Heck Jr. and J. van Montfrans (1984). "Faunal communities in seagrass
beds: a review of the influence of plant structure and prey characteristics on predator-prey relationships." Estuaries 7(4A): 339-350.
Paperno, R., K. J. Mille and E. Kadison (2001). "Patterns in species composition of fish
and selected invertebrate assemblages in estuarine subregions near Ponce de Leon Inlet, Florida." Estuarine and Coastal Marine Science 52: 117-130.
Pauly, D. and A. Yanez-Arincibia (1994). Fisheries in coastal lagoons. Coastal Lagoon
Processes. B. Kjerfve (ed). Amsterdam, Elsevier Science Publishers B.V.: 377-399.
Peet, R. K. (1974). "The measurement of species diversity." Annual Review in Ecology
and Systematics 5: 285-307. Peet, R. K. (1975). "Relative diversity indices." Ecology 56: 496-498. Perez-Ruzafa, A., J. I. Quispe-Becerra, J. A. Garcia-Charton and C. Marcos (2004).
"Composition, structure and distribution of the ichthyoplankton in a Mediterranean coastal lagoon." Journal of Fish Biology 64: 202-218.

92
Poizat, G., E. Rosecchi, P. Chauvelon, P. Contournet and A. J. Crivelli (2004). "Long-term fish and macro-crustacean community variation in a Mediterranean lagoon." Estuarine, Coastal and Shelf Science 59: 615-624.
Pollard, D. A. (1994). "A comparison of fish assemblages and fisheries in intermittently
open and permanently open coastal lagoons on the south coast of New South Wales, South-Eastern Australia." Estuaries 17(3): 631-646.
Pombo, L. and J. E. Rebelo (2002). "Spatial and temporal organization of a coastal
lagoon fish community - Ria de Aveiro, Portugal." Cybium 26(3): 185-196. Price, K. S. (1998). "A framework for a Delaware Inland Bays environmental
classification." Environmental Monitoring and Assessment 51: 285-298. Pritchard, D. W. (1960). "Salt balance and exchange rate for Chincoteague Bay."
Chesapeake Science: 48-57. Rice, J. C. (2000). "Evaluating fishery impacts using metrics of community structure."
ICES Journal of Marine Science 57: 682-688. Ross, S. W. and S. P. Epperly (1985). Utilization of shallow estuarine nursery areas by
fishes in Pamlico Sound and adjacent tributaries. Fish Community Ecology in Estuaries and Coastal Lagoons: Towards an Ecosystem Integration. A. Yanez-Arincibia (ed). Mexico, UNAM Press: 207-232.
Scharf, F. S., J. A. Buckel and F. Juanes (2002). "Size-dependent vulnerability of juvenile
bay anchovy Anchoa mitchilli to bluefish predation: Does large body size always provide refuge?" Marine Ecology Progress Series 233: 241-252.
Schwartz, F. J. (1961). "Fishes of Chincoteague and Sinepuxent bays." The American
Midland Naturalist 65(2): 384-408. Schwartz, F. J. (1964). "Fishes of Isle of Wight and Assawoman bays near Ocean City,
Maryland." Chesapeake Science 5(4): 172-193.

93
Serafy, J. E., R. M. Harrell and J. C. Stevenson (1988). "Quantitative sampling of small fishes in dense vegetation: Design and field testing of portable "pop-nets"." Journal of Applied Ichthyology 4: 149-157.
Sokal, R. R. and F. J. Rohlf (1995). Biometry. New York, W. H. Freeman and Co. Steele, M. A. (1997). "The relative importance of processes affecting recruitment of two
temperate reef fishes." Ecology 78(1): 129-145. Stirling, G. and B. Wilsey (2001). "Empirical relationships between species richness,
evenness, and proportional diversity." The American Naturalist 158(3): 286-298. Szedlmayer, S. T. and K. W. Able (1996). "Patterns of seasonal availability and habitat
use by fishes and decapod crustaceans in a southern New Jersey estuary." Estuaries 19(3): 697-709.
Vega-Cendejas, M. E. and M. Hernandez de Santillana (2004). "Fish community
structure and dynamics in a coastal hypersaline lagoon: Rio Lagartos, Yucatan, Mexico." Estuarine, Coastal and Shelf Science 60: 285-299.
Vernberg, F. J. (1982). "Environmental adaptation to lagoon systems." Oceanologica
Acta 1982: 407-415. Wagner, C. M. (1999). "Expression of the estuarine species minimum in littoral fish
assemblages of the lower Chesapeake Bay tributaries." Estuaries 22(2A): 304-312.
Warburton, K. (1978). "Community structure, abundance and diversity of fish in a
Mexican coastal lagoon system." Estuarine and Coastal Marine Science 7: 497-519.
Warlen, S. M., K. W. Able and L. E. H. (2002). "Recruitment of larval Atlantic
menhaden (Brevoortia tyrannus) to North Carolina and New Jersey estuaries: evidence for larval transport northward along the east coast of the United States." Fishery Bulletin 100(3): 609-623.
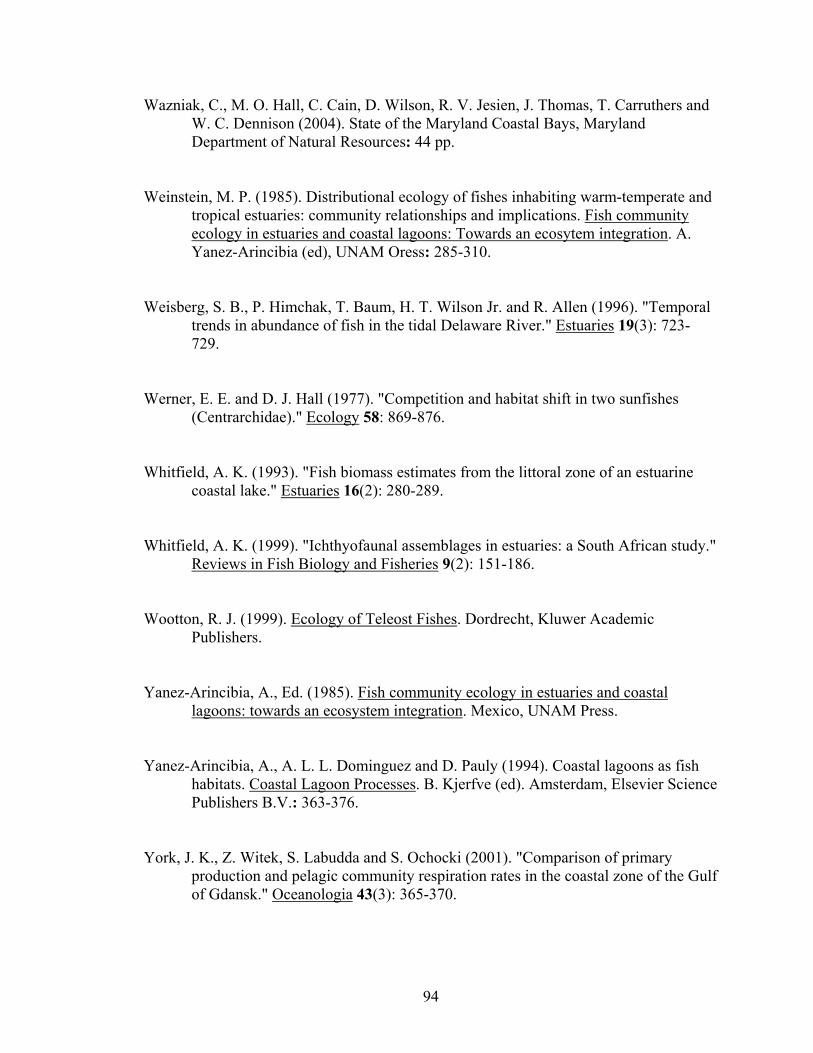
94
Wazniak, C., M. O. Hall, C. Cain, D. Wilson, R. V. Jesien, J. Thomas, T. Carruthers and W. C. Dennison (2004). State of the Maryland Coastal Bays, Maryland Department of Natural Resources: 44 pp.
Weinstein, M. P. (1985). Distributional ecology of fishes inhabiting warm-temperate and
tropical estuaries: community relationships and implications. Fish community ecology in estuaries and coastal lagoons: Towards an ecosytem integration. A. Yanez-Arincibia (ed), UNAM Oress: 285-310.
Weisberg, S. B., P. Himchak, T. Baum, H. T. Wilson Jr. and R. Allen (1996). "Temporal
trends in abundance of fish in the tidal Delaware River." Estuaries 19(3): 723-729.
Werner, E. E. and D. J. Hall (1977). "Competition and habitat shift in two sunfishes
(Centrarchidae)." Ecology 58: 869-876. Whitfield, A. K. (1993). "Fish biomass estimates from the littoral zone of an estuarine
coastal lake." Estuaries 16(2): 280-289. Whitfield, A. K. (1999). "Ichthyofaunal assemblages in estuaries: a South African study."
Reviews in Fish Biology and Fisheries 9(2): 151-186. Wootton, R. J. (1999). Ecology of Teleost Fishes. Dordrecht, Kluwer Academic
Publishers. Yanez-Arincibia, A., Ed. (1985). Fish community ecology in estuaries and coastal
lagoons: towards an ecosystem integration. Mexico, UNAM Press. Yanez-Arincibia, A., A. L. L. Dominguez and D. Pauly (1994). Coastal lagoons as fish
habitats. Coastal Lagoon Processes. B. Kjerfve (ed). Amsterdam, Elsevier Science Publishers B.V.: 363-376.
York, J. K., Z. Witek, S. Labudda and S. Ochocki (2001). "Comparison of primary
production and pelagic community respiration rates in the coastal zone of the Gulf of Gdansk." Oceanologia 43(3): 365-370.

95