Embed Size (px)
Citation preview
ABSTRACT
Title of Dissertation: SCHOOL-RELATED APATHY IN 8th- and 10th- GRADE STUDENTS: A MIXED-METHOD EXPLORATION OF DEFINITIONS, CONSTRUCT INDEPENDENCE, CORRELATES, AND GRADE-LEVEL DIFFERENCES
Michelle M. Riconscente, Doctor of Philosophy, 2007 Dissertation directed by: Professor Patricia A. Alexander Department of Human Development Research-based and folk conceptualizations of school-related apathy were explored in
309 8th- and 10th- grade Catholic school students and their teachers. Definitions, construct
independence, and relation to select individual and group differences including grade
level were examined. Findings indicated that while some independence exists among the
set of five constructs assessed—adolescent apathy, amotivation, apathy syndrome,
disengagement, and work avoidance—substantial overlap is present that can inform
development of a more parsimonious conceptualization of students’ lack of school
motivation centered on perceived relevance and a general attitude of interest. Results also
demonstrated only moderate levels of agreement between research-based and teacher
identification of students low on school-related motivation; however, both approaches
indicate that approximately 1 in 4 students manifests markedly low school-related
motivation. Relations of several individual and group differences to conceptualizations of
school-related apathy were documented in expected directions. Implications of the
findings for educational research and practice are discussed.
SCHOOL-RELATED APATHY IN 8th- and 10th- GRADE STUDENTS: A MIXED-METHOD EXPLORATION OF DEFINITIONS, CONSTRUCT INDEPENDENCE, CORRELATES, AND
GRADE-LEVEL DIFFERENCES
By
Michelle M. Riconscente
Dissertation submitted to the Faculty of the Graduate School of the University of Maryland at College Park in partial fulfillment
of the requirements for the degree of Doctor of Philosophy
2007
Advisory Committee:
Professor Patricia A. Alexander, Chair Associate Professor Robert Croninger Professor Robert J. Mislevy Professor Kathryn Wentzel Professor Allan Wigfield

© Copyright by
Michelle M. Riconscente
2007
ii
DEDICATION
This work is dedicated
to my mother, Sally Haddad Riconscente, Ed.D.,
whose goodness and spirit of determination
are always with me,
and in memory of my grandfather,
Nämey Abraham Haddad,
whose fascination with every detail of reality
continues to fuel my research.
iii
ACKNOWLEDGMENTS
This dissertation marks a major milestone along an unexpected yet rewarding
journey. Neither the discovery of the road nor the distance traveled would have been
possible had I been walking alone. I am indebted to my doctoral advisor and mentor Dr.
Alexander, whose support and expertise have been central to my transformation into an
educational psychologist. Countless thanks to Dr. Mislevy for his patient mentorship and
for passing on his sincere love of learning and assessment. I am deeply thankful to Drs.
Wentzel, Wigfield, and Croninger, whose keen insights and generous guidance during my
graduate studies and on this dissertation have proven invaluable. Heartfelt gratitude goes
to Dr. Donna Boyle, Sharon Sampson, and Dr. George Milot, and the administrators,
teachers, and students who gave of their time to contribute to this study.
I am grateful to Liliana, Annemarie, Luca, Barbara, Jose, Chris, Tere, Nori, Elisa,
Giancarlo, Holly, and Angelo, whose personal engagement with life and perspectives on
education were essential to this accomplishment, and to the many friends in Maryland,
New York, and Italy whose generosity made this pursuit possible. To Monsignor
Albacete, who taught me to recognize the truth in every perspective, and to Giorgio, who
showed me that the beauty of studying is that it can’t be done alone, I am forever
grateful. Thanks to Emily and Kristie for their friendship and solidarity. For hosting me
during data collection, I am grateful to my sister Tara and her family, especially Kiran,
Kaylana and Adam for assembling surveys at breakneck speed. I am most grateful to my
mother Sally for serving as the second coder of interview transcripts in the present
study—one of countless examples of her constant support and encouragement.
Above all, I am grateful to Luigi Giussani, whose vision and life opened my eyes
to the importance and meaning of education and whose educational method has given me
a road to walk with certainty toward knowledge and fulfillment.
iv
TABLE OF CONTENTS
LIST OF TABLES........................................................................................................... viii LIST OF FIGURES .......................................................................................................... xii CHAPTER 1: INTRODUCTION........................................................................................1
Statement of the Problem.................................................................................................2 Purposes of the Study.......................................................................................................4 Research Questions and Hypotheses ...............................................................................5
Definitions of Terms ..................................................................................................12 Potential Significance ................................................................................................14
CHAPTER II: REVIEW OF RELEVANT LITERATURE ..............................................16
Selection Criteria ...........................................................................................................17 Apathy Constructs..........................................................................................................19
Academic Apathy.......................................................................................................20 Adolescent Apathy.....................................................................................................22 Apathy in Flow Theory..............................................................................................26
Flow and Well-Being.............................................................................................29 Flow and Context...................................................................................................30 Flow and Variance Explained................................................................................30 Summary ................................................................................................................31
Apathy in Logotherapy ..............................................................................................32 Apathy Syndrome ......................................................................................................33 Summary of Apathy Constructs.................................................................................36
Apathy-Related Constructs ............................................................................................37 Amotivation ...............................................................................................................38
Measures and Findings ..........................................................................................39 Associations with Other Variables.........................................................................44 Summary ................................................................................................................47
Boredom Proneness ...................................................................................................48 Disengagement...........................................................................................................50 Learned Helplessness.................................................................................................54 Work Avoidance ........................................................................................................58
Measures ................................................................................................................58 Related Findings ....................................................................................................59 Summary ................................................................................................................64
Summary of Apathy-Related Constructs ...................................................................65 Issues for Future Research .............................................................................................67
Defining Apathy.........................................................................................................68 Toward Greater Parsimony ....................................................................................68 Working with a Folk Term: Lessons from the Case of Alienation........................69 Additional Theoretical Considerations ..................................................................70
Individual and Group Differences in Apathy.............................................................74 Developmental Differences in Apathy.......................................................................76 Conclusion .................................................................................................................79
v
CHAPTER III: METHODOLOGY ...................................................................................80 Participants.....................................................................................................................80 Measures ........................................................................................................................83
Demographics ............................................................................................................87 Adolescent Apathy.....................................................................................................87 Apathy Syndrome ......................................................................................................88 Amotivation ...............................................................................................................89 Work Avoidance ........................................................................................................89 Boredom Proneness ...................................................................................................90 Disengagement...........................................................................................................90 Distress and Well-Being ............................................................................................91 Curiosity.....................................................................................................................91 Teacher Checklist for Student Apathy Levels ...........................................................92 Academic Achievement .............................................................................................94 Student Interview Protocol ........................................................................................94
Procedures......................................................................................................................95 CHAPTER IV: QUANTITATIVE RESULTS..................................................................98
Data Preparation.............................................................................................................98 Descriptive Statistics....................................................................................................100
Participation and Interview Consent Comparisons..................................................100 Student Apathy and Individual Differences Data ....................................................101
Research Question 1: Defining School-Related Apathy..............................................110 Statistical Independence of Research-Based Conceptualizations of Apathy...........120
Bivariate Correlations of Apathy Constructs.......................................................120 Test- and Item-Level Factor Analyses of Apathy Constructs..............................121 Cluster Analyses Using a Variate of Apathy Constructs .....................................124
Research-Based and Folk Conceptualizations of Apathy........................................127 Prevalence of School-Related Apathy .....................................................................134
Research-Based Data ...........................................................................................134 Teacher Data ........................................................................................................136 Comparing Research-Based and Teacher Data....................................................136
Research Question 2: Individual and Group Differences ............................................136 School-Related Apathy and Individual Differences ................................................137
Means and Correlations of Apathy and Individual Differences ..........................137 Gender..................................................................................................................137 Religion and Religious Practice...........................................................................138 Multiple Regression of Individual Differences on New Apathy Composites .....139
Patterns in School-Related Apathy and Individual Differences ..............................143 Individual Differences and Teacher Nominations ...............................................143 Factor Correlations...............................................................................................146 Cluster Group Means Comparisons .....................................................................148
Item Analysis of School-Related Apathy and Individual Difference Measures......148 Research Question 3: Grade-Level Differences ..........................................................150
Conceptualization of School-Related Apathy..........................................................150 Research-Based Conceptualizations ....................................................................151
vi
Folk Conceptualizations.......................................................................................163 Comparing Research-Based and Folk Conceptualizations ..................................164
Prevalence of School-Related Apathy .....................................................................169 Associated Individual and Group Differences.........................................................171
CHAPTER V: QUALITATIVE RESULTS ....................................................................180
Interview Procedures ...................................................................................................180 Transcript Analysis Procedures ...................................................................................182 Folk Conceptualizations of School-Related Apathy....................................................184
Making the Grade ....................................................................................................184 Ticket to Ride...........................................................................................................187 Caring Less ..............................................................................................................190 “I Just Don’t Get It”.................................................................................................192 Confused and Overwhelmed....................................................................................193 “Don’t Feel Like It” .................................................................................................196 “Nothing to Do with Me” ........................................................................................198 Goal-Directed...........................................................................................................202 “Not Interested” .......................................................................................................203 Defending Appearances ...........................................................................................206 “It’s Boring”.............................................................................................................207 “Depends Which Subject” .......................................................................................207 Summary of Conceptualizations of School-Related Apathy ...................................207
Prevalence of School-Related Apathy .........................................................................208 Operationalizations of School-Related Apathy ...........................................................210 Individual and Group Differences ...............................................................................212
Gender......................................................................................................................212 Grade-Level .............................................................................................................213 Apathy Classification...............................................................................................214 Summary of Differences ..........................................................................................214
Is Apathy the Right Term?...........................................................................................215 Summary ......................................................................................................................215
CHAPTER VI: SUMMARY, DISCUSSION AND IMPLICATIONS FOR FUTURE RESEARCH.....................................................................................................................217
Summary of Findings...................................................................................................217 Research Question 1: Defining School-Related Apathy..........................................218
Statistical Independence of Research-Based Conceptualizations........................218 Research-Based and Folk Conceptualizations .....................................................221 Prevalence ............................................................................................................224
Research Question 2: Individual and Group Differences ........................................225 Research Question 3: Grade-Level Differences ......................................................227
Limitations ...................................................................................................................228 Implications for Educational Practice..........................................................................230 Implications for Future Research.................................................................................231
vii
Appendix A: Demographics ............................................................................................240
Appendix B: Adolescent Apathy Inventory.....................................................................244
Appendix C: Apathy Evaluation Scale ............................................................................247
Appendix D: Amotivation Scale......................................................................................249
Appendix E: Work Avoidance Scale ...............................................................................251
Appendix F: Boredom Proneness Survey ........................................................................253
Appendix G: Disengagement Survey...............................................................................255
Appendix H: Distress & Well-Being Scales....................................................................257
Appendix I: Curiosity Survey ..........................................................................................259
Appendix J: Apathy-Level Student Checklist..................................................................261
Appendix K: Student Interview Protocol.........................................................................263
Appendix L: Teacher Interview Protocol ........................................................................265
Appendix M: Informed Consent and Assent Forms ........................................................267
Appendix N: Rotated Component Matrix for Hybrid Factor PCA..................................274
References........................................................................................................................275
viii
LIST OF TABLES
Table 1: Summary of Apathy and Apathy-Related Constructs .......................................19
Table 2: Suggested Modified Factor Structure for AAI ..................................................25
Table 3: AMS and SIMS Amotivation Subscale Items...................................................42
Table 4: Student Descriptive Statistics for Categorical Data ..........................................84
Table 5: Teacher Descriptive Statistics for Categorical Data..........................................85
Table 6: Teacher Descriptive Statistics ...........................................................................86
Table 7: Descriptive Statistics for Apathy and Individual Differences.........................102
Table 8: Descriptive Statistics for Disengagement Items..............................................103
Table 9: Zero-Order Pearson Correlations between Apathy Variables .........................104
Table 10: Gender Differences..........................................................................................105
Table 11: Gender Differences for Grade 8 ......................................................................106
Table 12: Gender Differences for Grade 10 ....................................................................107
Table 13: Zero-Order Pearson Correlations between Individual Difference Variables ..108
Table 14: Zero-Order Pearson Correlations between Apathy and Individual Difference Variables..........................................................................................................109
Table 15: Demographics by Apathetic Nominations ......................................................111
Table 16: Demographics by Apathetic Category, Full Sample .......................................112
Table 17: Demographics by Apathetic Category, Grade 8..............................................113
Table 18: Demographics by Apathetic Category, Grade 10............................................114
Table 19: Apathy and Individual Differences by Apathetic Nomination........................115
Table 20: Disengagement Items by Apathetic Nomination Groups................................116
Table 21: Apathy by Apathy Category............................................................................117
Table 22: Disengagement Items by Apathetic Category .................................................118
ix
Table 23: Individual Difference Variables by Apathy Category.....................................119
Table 24: Test-level Exploratory Factor Analysis: PCA Factor Loadings for Rotated Components.....................................................................................................122
Table 25: Test-level Exploratory Factor Analysis: PAF Factor Loadings for Rotated Components.....................................................................................................122
Table 26: Factor Loadings for Exploratory School-Related Apathy Scale .....................125
Table 27: Correlations of New Apathy Factors to Apathy Variables..............................126
Table 28: Merged Grades Cluster Structure ....................................................................126
Table 29: Merged Grades Cluster Structure: Apathy Variables......................................129
Table 30: Merged Grades Cluster Structure: Disengagement .........................................130
Table 31: Merged Grades Cluster Structure: Apathetic Nomination and Apathy Categories........................................................................................................131
Table 32: Discriminant Analysis Classifications: Apathetic Nomination by Apathy Variables..........................................................................................................131
Table 33: Discriminant Analysis Classifications: Apathetic Category by Apathy Variables..........................................................................................................132
Table 34: Discriminant Analysis Classifications: Apathetic Categories 1-3 by Apathy Variables..........................................................................................................132
Table 35: Religion Groups on Apathy and Individual Differences – Merged Sample ...140
Table 36: Practice Religion by Apathy Variables – Merged Sample..............................141
Table 37: Merged Grades Multiple Regressions of Individual Difference Variables on All Apathy Variables.............................................................................................144
Table 38: Merged Grades Multiple Regressions of Individual Difference Variables on All Apathy Variables except Amotivation ............................................................145
Table 39: Correlations of New Apathy Factors to Individual Difference Variables.......147
Table 40: Merged Grades Cluster Structure: Individual Differences Variables..............147
Table 41: Grade 8 4-Cluster Structure.............................................................................153
x
Table 42: Grade 8 4-Cluster Structure: Apathetic Nomination and Apathy Categories .153
Table 43: Grade 8 4-Cluster Structure: Apathy and Individual Differences Descriptive Statistics...........................................................................................................154
Table 44: Grade 10 4-Cluster Structure...........................................................................157
Table 45: Grade 10 Cluster Structure: Apathetic Nomination and Apathy Categories...157
Table 46: Grade 10 Cluster Structure: Apathy and Individual Differences ....................158
Table 47: Comparison of Clusters by Grade Level .........................................................160
Table 48: Grade-Level Discriminant Analysis Classifications: Apathetic Nomination by Apathy Variables.............................................................................................166
Table 49: Grade-Level Discriminant Analysis Classifications: All Apathetic Category by Apathy Variables.............................................................................................167
Table 50: Grade 8 Multiple Regressions of Individual Difference Variables on All Apathy Variables.............................................................................................175
Table 51: Grade 8 Multiple Regressions of Individual Difference Variables on All Apathy Variables except Amotivation ............................................................176
Table 52: Grade 10 Multiple Regressions of Individual Difference Variables on All Apathy Variables.............................................................................................177
Table 53: Grade 10 Multiple Regressions of Individual Difference Variables on All Apathy Variables except Amotivation ............................................................178
Table 54: Individual Differences Comparisons of Clusters by Grade Level...................179
Table 55: Dominant Theme Exemplar Data: Making the Grade.....................................185
Table 56: Dominant Theme Exemplar Data: Ticket to Ride...........................................188
Table 57: Dominant Theme Exemplar Data: Caring Less ..............................................190
Table 58: Dominant Theme Exemplar Data: “I Just Don’t Get It” .................................192
Table 59: Dominant Theme Exemplar Data: Confused and Overwhelmed....................194
Table 60: Dominant Theme Exemplar Data: “Don’t Feel Like It” .................................196
Table 61: Dominant Theme Exemplar Data: “Nothing to Do with Me”.........................199

xi
Table 62: Dominant Theme Exemplar Data: Goal-Directed...........................................202
Table 63: Dominant Theme Exemplar Data: “Not Interested” .......................................204
Table 64: Dominant Theme Exemplar Data: Defending Appearances ...........................206
Table 65: Exemplar Data: Operationalizations of School-Related Apathy:....................210
xii
LIST OF FIGURES
Figure 1: Apathy Constructs Reviewed.............................................................................6
Figure 2: Data Categories..................................................................................................8
Figure 3: Data Sources and Analyses: Research Question 1.............................................9
Figure 4: Data Sources and Analyses: Research Question 2...........................................10
Figure 5: Data Sources and Analyses: Research Question 3...........................................11
Figure 6: Flow Theory Plotted as Eight Ratios of Challenge to Skill .............................27
Figure 7: Criteria for the syndrome of apathy .................................................................34
Figure 8: Self-Determination Continuum........................................................................40
Figure 9: Decision Tree for Assigning Student Participants to Levels of Apathy Category Variable ............................................................................................93
Figure 10: Phases of Data Collection and Analysis ..........................................................97
Figure 11: Cluster Scores on Apathy and Individual Difference Variables....................129
Figure 12: Graphic Representation of Grade 8 Clusters .................................................155
Figure 13: Graphic Representation of Grade 10 Clusters ...............................................159
Figure 14: High Apathy Clusters: Grade 8 and Grade 10 Overlay .................................161
Figure 15: Moderate General Apathy Cluster: Grade 8 and Grade 10 Overlay..............161
Figure 16: Moderate School-Related Apathy Cluster: Grade 8 and Grade 10 Overlay..162
Figure 17: Low Apathy Clusters: Grade 8 and Grade 10 Overlay ..................................162
1
CHAPTER 1
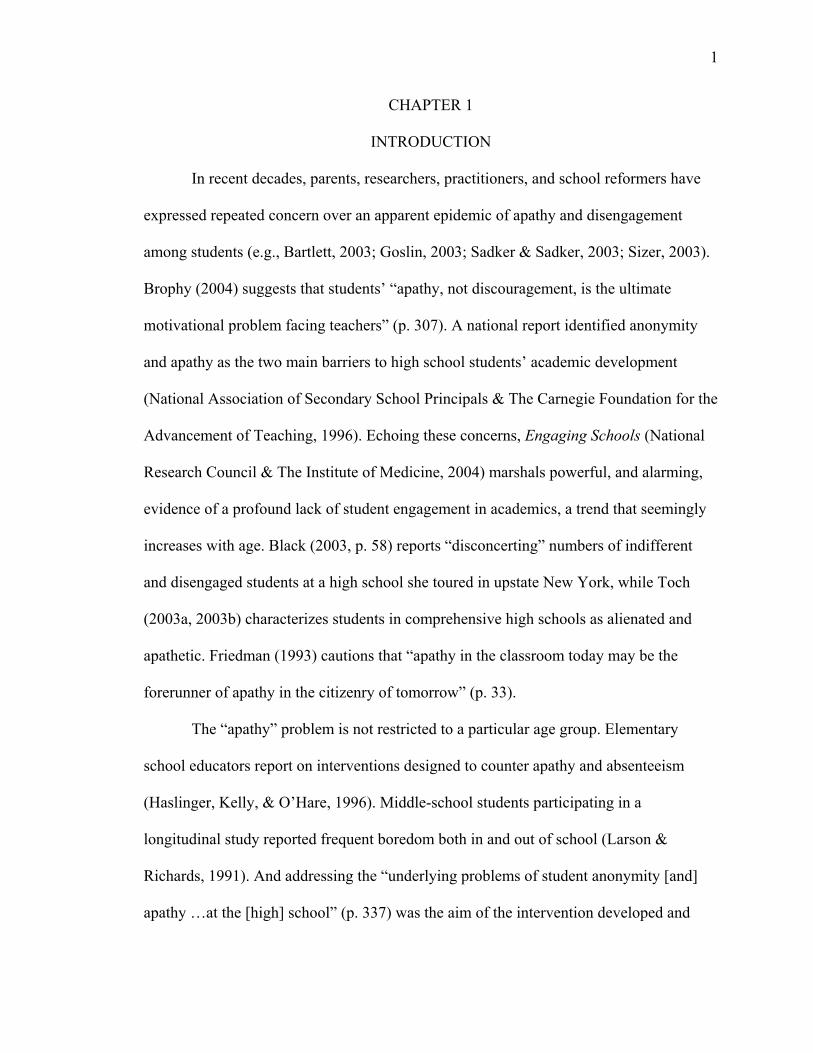
INTRODUCTION
In recent decades, parents, researchers, practitioners, and school reformers have
expressed repeated concern over an apparent epidemic of apathy and disengagement
among students (e.g., Bartlett, 2003; Goslin, 2003; Sadker & Sadker, 2003; Sizer, 2003).
Brophy (2004) suggests that students’ “apathy, not discouragement, is the ultimate
motivational problem facing teachers” (p. 307). A national report identified anonymity
and apathy as the two main barriers to high school students’ academic development
(National Association of Secondary School Principals & The Carnegie Foundation for the
Advancement of Teaching, 1996). Echoing these concerns, Engaging Schools (National
Research Council & The Institute of Medicine, 2004) marshals powerful, and alarming,
evidence of a profound lack of student engagement in academics, a trend that seemingly
increases with age. Black (2003, p. 58) reports “disconcerting” numbers of indifferent
and disengaged students at a high school she toured in upstate New York, while Toch
(2003a, 2003b) characterizes students in comprehensive high schools as alienated and
apathetic. Friedman (1993) cautions that “apathy in the classroom today may be the
forerunner of apathy in the citizenry of tomorrow” (p. 33).
The “apathy” problem is not restricted to a particular age group. Elementary
school educators report on interventions designed to counter apathy and absenteeism
(Haslinger, Kelly, & O’Hare, 1996). Middle-school students participating in a
longitudinal study reported frequent boredom both in and out of school (Larson &
Richards, 1991). And addressing the “underlying problems of student anonymity [and]
apathy …at the [high] school” (p. 337) was the aim of the intervention developed and
2
researched in a year-long case study by McPartland, Balfanz, Jordan, and Legters (1998).
References to apathy appear in multiple disciplines, each with a particular
conceptual definition of the term. Definitional emphases extend from absence of
observable activity to lack of emotion. In the political arena, voter apathy is an area of
concern, as is general political apathy reflected in an absence of activism or engagement
in local or federal government (Jacoby, 1999; Kimberlee, 2002). In the discipline of
philosophy, theoretical explications of apathy tend to be linked to its etymological roots
in the word pathos: being moved or affected (Furtak, 2003). In the medical field, apathy
frequently has been considered in association with injury or illness, particularly as
comorbid with Parkinson’s (Marin, 1991; Marin, Biedrzycki, & Firinciogullari, 1991),
dementia and Alzheimer’s (Cummings, Mega, Gray, Rosenberg-Thompson, Carusi, &
Gornbein, 1994; Starkstein, Ingram, Garau, & Mizrahi, 2005), and traumatic brain injury
(Gouick & Gentleman, 2004). References to apathy can be found in other fields as well,
such as journalism (e.g., with respect to publication readership; Cornog, 2005) or
economics (e.g., consumer behavior; Prewitt, 2005).
Statement of the Problem
Frequent use of the term to describe students, coupled with the broad range of
meanings ascribed to apathy in varied contexts, underscores the importance of adopting a
sharper conception of it for purposes of research in schools. Prior research into the
relation between motivation and learning (e.g., Corno, 1993; Harackiewicz, Barron,
Carter, Lehto, & Elliot, 1997) suggests that, for purposes of education, the display of
apathy poses a challenge to teachers, compromises students’ learning and consequently
represents an important and relevant target of research. A review of empirical literature
3
identified several candidates for this specialized construct, which I term “school-related
apathy.” It may be that one or more of these existing constructs adequately
conceptualizes and operationalizes school-related apathy. Alternatively, a shared
conceptualization and valid measures able to detect school-related apathy have not yet
been developed.
Further, the bulk of developmental research in motivation toward school and
learning has concentrated on the transition from elementary school to middle school,
documenting declines in motivation (Eccles, Wigfield, Midgley, Reuman, MacIver, &
Feldlaufer, 1993; Isakson & Jarvis, 1999; Murdock, Anderman, & Hodge, 2000).
Research suggests that this decline continues through the high-school years (e.g., Barber
& Olsen, 2004; Gillock & Reyes, 1996). However systematic examination of student
motivation spanning the transition into high school is wanting. Contextual factors that
distinguish elementary schools from middle schools have been judged partly responsible
for decreases in motivation among middle-school students (Eccles et al., 1993). Since
contextual changes—such as heightened achievement expectations and larger school
size—also characterize the transition into high school, it is reasonable to suspect that
these may also exert influence on student motivation.
Accordingly, there is a need to determine the degree to which existing research-
based apathy constructs reflect the meanings of apathy toward school intended by
teachers, particularly regarding students on either side of the transition from middle to
high school. Moreover, in the interest of greater parsimony, studies are needed to
empirically gauge the statistical independence of research-based apathy constructs for
middle- and high-school students. In addition to establishing a clear conceptualization
4
and operationalization of school-related apathy, research is necessary to estimate the
proportion of middle- and high-school students in whom it manifests. If the incidence of
school-related apathy is deemed substantial in these populations, it consequently will be
vital to investigate such issues as contextual factors that may play a role in the ontogeny
of school-related apathy, the relation of individual and group differences to school-related
apathy, and the extent to which particular educational practices at the middle- and high-
school levels might effectively counter school-related apathy in students.
It is worth noting that challenges are inherent in investigating a term that carries
strong folk connotations, as evidenced by the troubled history that has plagued the term
“alienation” (e.g., Feuer, 1962; Shepard, 1977). Thus, the viability of assigning more
specificity to this oft-used term—“apathy”—remains to be ascertained.
Purposes of the Study
The purposes of the present study were threefold. The first purpose was to explore
the definitions and prevalence of school-related apathy, comparing research-based
conceptualizations and operationalizations to those of middle- and high-school teachers.
Second, the study sought to identify what relations may exist between various
conceptualizations of apathy and theoretically associated individual characteristics such
as curiosity or academic achievement. The third purpose was to examine whether grade-
level differences between 8th- and 10th-grade students were present with respect to
conceptualizations of school-related apathy and its relation to individual variables.
In order to gather rich data for each of the study’s purposes, a mixed-methods
approach was adopted, applying the principle of complementarity in generating and
analyzing quantitative and qualitative data streams (Green & McClelland, 1999). More
5
specifically, following Bryman’s (2006) taxonomy, the methodology of the present study
was based on a diversity of views rationale, appropriate when the goals of research are to
“[combine] researchers’ and participants’ perspectives through quantitative and
qualitative research respectively, and to [uncover] relationships between variables
through quantitative research while also revealing meanings among research participants
through qualitative research” (pp. 106-107).
Participants in the study were 8th- and 10th-grade students as well as teachers of
these grades in participating students’ schools. Students in participating schools attended
elementary school from 1st through the 8th grade and entered high school in the 9th grade.
Both participating high schools served grades 9 through 12. Consequently, 8th graders in
the study participated approximately one year prior to the transition into high school, and
10th graders participated approximately one year after that transition.
Research Questions and Hypotheses
The purposes of the study translated into three overarching research questions
(see Figures 1 through 5).
1a. To what extent are research-based conceptualizations of apathy toward
school statistically independent?
1b. How do teachers and students conceptualize school-related apathy, and to
what extent are those “folk constructs” consistent with research-based
conceptualizations?
1c. How prevalent is school-related apathy in students, and how do students’
and teachers’ beliefs about its prevalence compare?
6
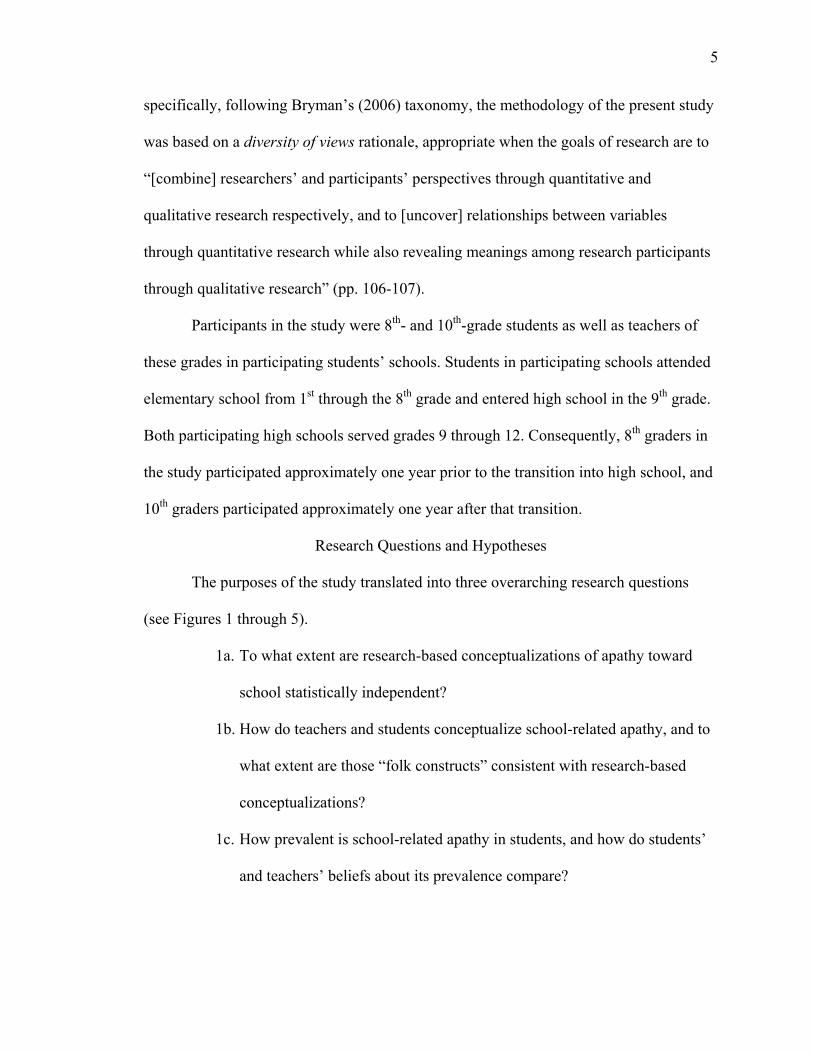
Figure 1
Apathy Constructs Reviewed
Note. This figure indicates the ten constructs reviewed for inclusion in the present study.
In general, it was expected that research-based conceptualizations of school-
related apathy—operationalized as adolescent apathy, amotivation, apathy syndrome,
disengagement, and work avoidance—would emerge as distinct yet moderately correlated
constructs. Groups of students nominated by teachers as either clearly apathetic, clearly
non-apathetic, or middle-of-the-road were expected to differ accordingly and
significantly in mean levels of research-based apathy constructs. It was further expected
that data culled from student and teacher interviews would only partially reflect the
Adolescent Apathy
Apathy Syndrome
Amotivation
Disengagement
Work Avoidance
Academic Apathy
Apathy (Flow)
Apathy (Logotherapy)
Boredom Proneness*
Learned Helplessness
Dropped Retained
* Retained as Individual Difference Variable
7
operationalizations of existing constructs, and that new insights into what school-related
apathy is and how it is perceived by students and teachers would be captured. Given the
paucity of prior research on the prevalence of student apathy toward school, no specific
predictions were made. However, in light of numerous references to this characteristic, it
was expected that a substantial portion of 8th- and 10th-graders would report at least mild
apathy for school-related activities, and that these reports would be corroborated by
teacher-reported data.
2. How is self-reported school-related apathy related to select individual and
group differences variables and what patterns among those variables
characterize groups of students?
The second question addressed correlates of the apathy and apathy-related
constructs theoretically relevant to school motivation. The constructs were expected to
correlate moderately and positively with boredom proneness and distress, and to
demonstrate moderate negative relations with curiosity, well-being and academic
achievement.
Gender was also analyzed, with girls expected to report overall higher school-
related motivation than boys, based on prior research (e.g., Eccles et al.,1993; Meece &
Holt, 1993; Meece & Miller, 2001). Since the sample was drawn from students attending
Catholic schools, relations between religion and level of religious observance to the
apathy constructs were examined for differences that could inform generalizability and
future research.
Based on the research-based constructs, two to three clusters were hypothesized to
emerge and to vary in mean levels on convergent variables (e.g., boredom proneness or
curiosity).
8
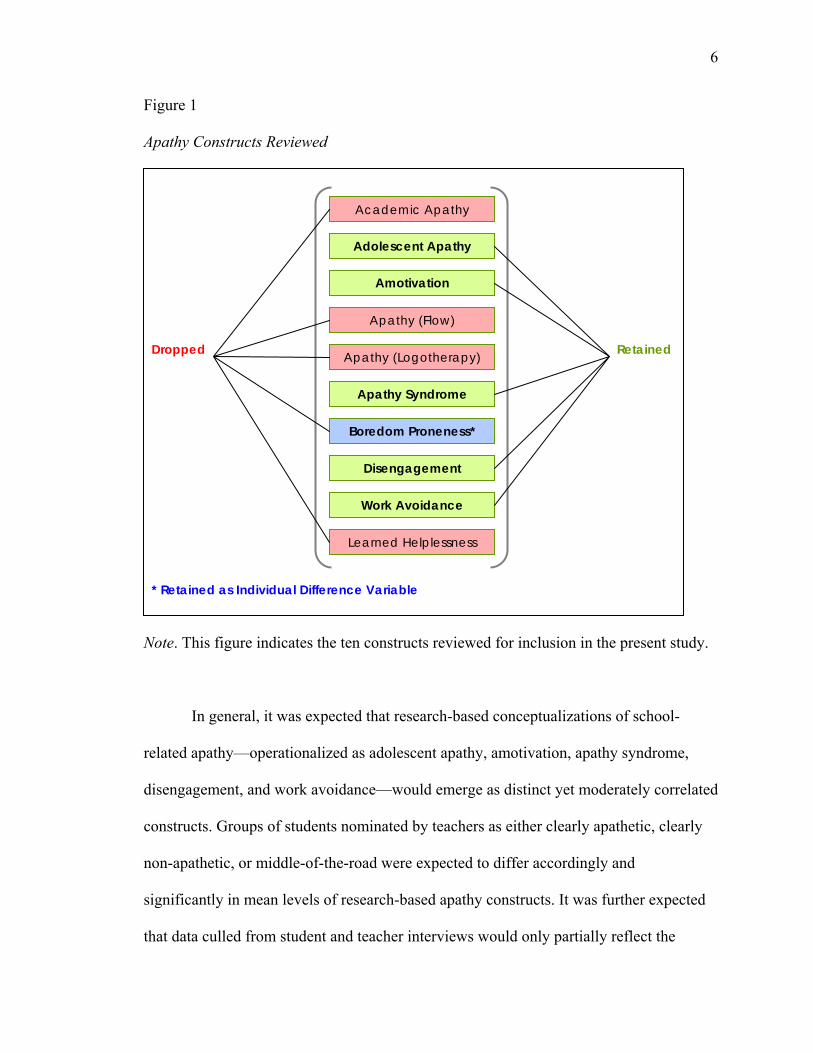
Figure 2
Data Categories
Note. Figure displays data sources used in the present study, organized from top to
bottom by measurement scale.
Achievement
Curiosity
Distress
Well-Being
Boredom Proneness
Adolescent Apathy
Apathy Syndrome
Amotivation
Disengagement
Work Avoidance
Apathy Constructs Individual Differences
Teacher-Nominated Student Groups
Clearly Apathetic
Mid-range
Clearly Not Apathetic
Teacher Interviews Student
Interviews
Grade-Level Groups
8th Graders
10th Graders
Cluster 1
Cluster n
Cluster Membership
9
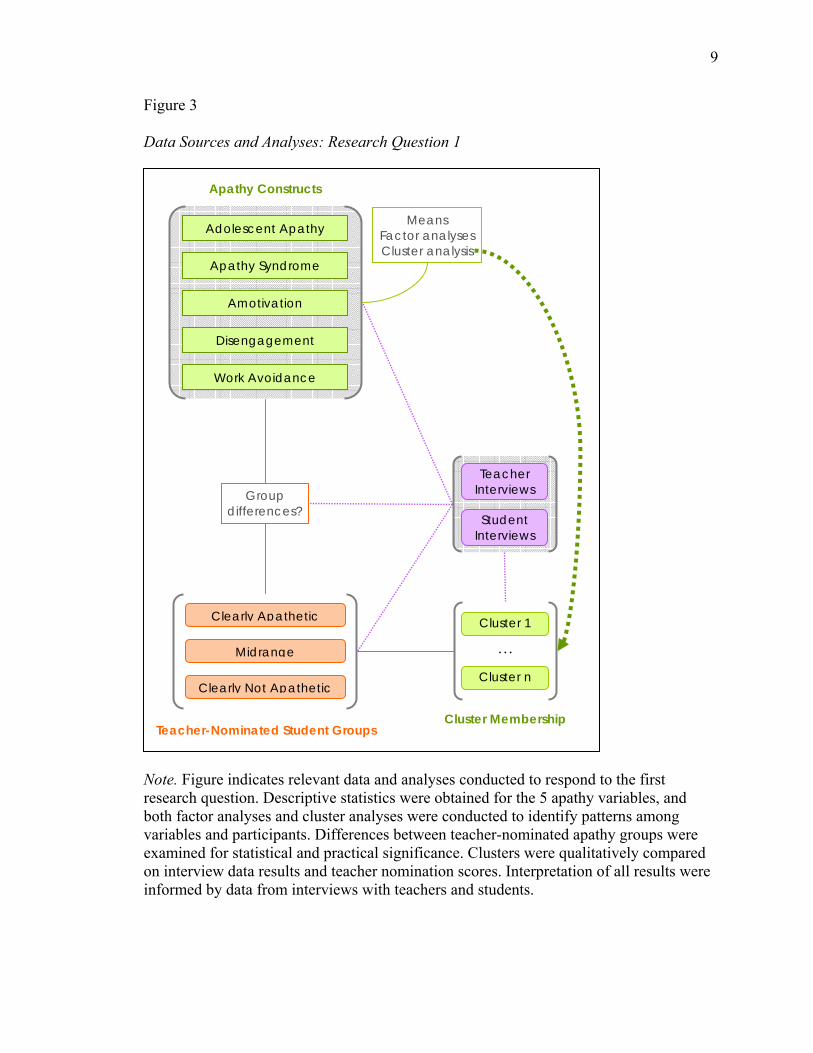
Figure 3
Data Sources and Analyses: Research Question 1
Note. Figure indicates relevant data and analyses conducted to respond to the first research question. Descriptive statistics were obtained for the 5 apathy variables, and both factor analyses and cluster analyses were conducted to identify patterns among variables and participants. Differences between teacher-nominated apathy groups were examined for statistical and practical significance. Clusters were qualitatively compared on interview data results and teacher nomination scores. Interpretation of all results were informed by data from interviews with teachers and students.
Teacher-Nominated Student Groups
Apathy Constructs
Group differences?
Adolescent Apathy
Apathy Syndrome
Amotivation
Disengagement
Work Avoidance
Means Factor analyses Cluster analysis
… Cluster 1
Cluster n
Cluster Membership
Teacher Interviews Student
Interviews
Clearly Apathetic
Midrange
Clearly Not Apathetic
10
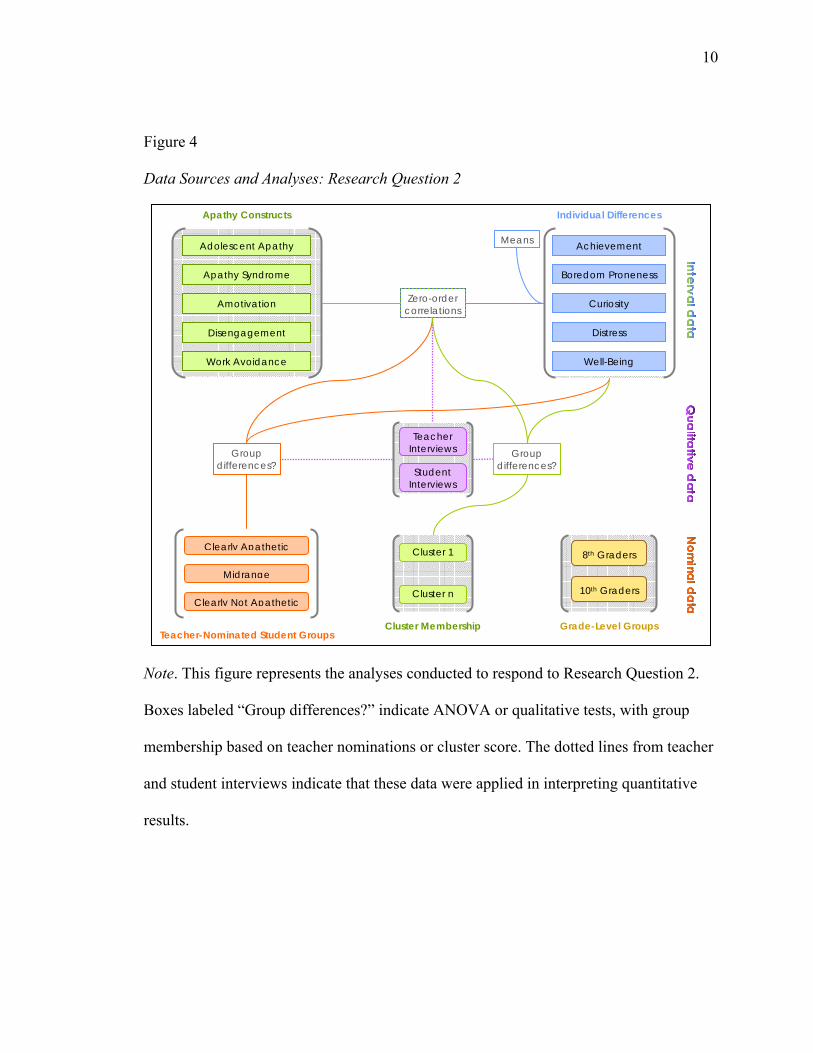
Figure 4
Data Sources and Analyses: Research Question 2
Note. This figure represents the analyses conducted to respond to Research Question 2.
Boxes labeled “Group differences?” indicate ANOVA or qualitative tests, with group
membership based on teacher nominations or cluster score. The dotted lines from teacher
and student interviews indicate that these data were applied in interpreting quantitative
results.
Achievement
Curiosity
Distress
Well-Being
Boredom Proneness
Adolescent Apathy
Apathy Syndrome
Amotivation
Disengagement
Work Avoidance
Apathy Constructs Individual Differences
Teacher-Nominated Student Groups
Zero-order correlations
Means
Group differences?
Clearly Apathetic
Midrange
Clearly Not Apathetic
Teacher Interviews Student
Interviews
Grade-Level Groups
8th Graders
10th Graders
Cluster 1
Cluster n
Cluster Membership
Group differences?
11
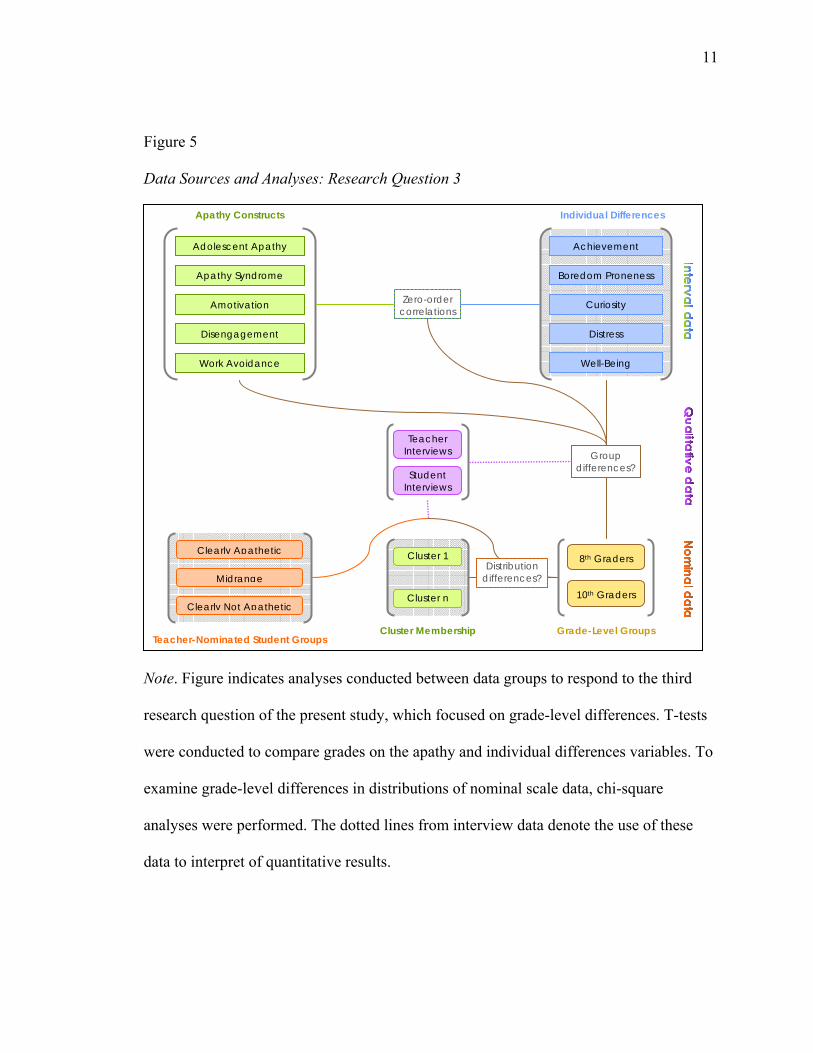
Figure 5
Data Sources and Analyses: Research Question 3
Note. Figure indicates analyses conducted between data groups to respond to the third
research question of the present study, which focused on grade-level differences. T-tests
were conducted to compare grades on the apathy and individual differences variables. To
examine grade-level differences in distributions of nominal scale data, chi-square
analyses were performed. The dotted lines from interview data denote the use of these
data to interpret of quantitative results.
Achievement
Curiosity
Distress
Well-Being
Boredom Proneness
Adolescent Apathy
Apathy Syndrome
Amotivation
Disengagement
Work Avoidance
Apathy Constructs Individual Differences
Teacher-Nominated Student Groups
Zero-order correlations
Clearly Apathetic
Midrange
Clearly Not Apathetic
Group differences?
Teacher Interviews Student
Interviews
Grade-Level Groups
8th Graders
10th Graders
Cluster 1
Cluster n
Cluster Membership
Distribution differences?
12
3. Is there variation between 8th and 10th graders in the conceptualization,
prevalence, and associated individual and group differences of self-reported
school-related apathy?
Based on the extant literature (e.g., Gottfried, Fleming, & Gottfried, 2001; Harter,
1998; Otis, Grouzet, & Pelletier, 2005), the expectation was that apathy would be more
pronounced and reflect increased variance in the later adolescent years, and that older
students would reflect higher differentiation (i.e., form more clusters) than would
students on the threshold of adolescence.
Definitions of Terms
In order to discuss and answer the aforementioned research questions, the
following terms were used:
Students high on academic apathy are uninterested in course work and concerned
primarily with appearing successful rather than with actually learning (Davidson, Beck,
& Silver, 1999).
Adolescent apathy is a multidimensional trait characterized by lack of goal-setting
behaviors, energy, and interest, indifference to changes, and difficulty making decisions
as assessed by self, teachers, parents, and friends (Handelman, 1999).
Amotivation is defined as the lack of intention to act resulting from lack of
valuing or feeling of competence for the activity (Ryan & Deci, 2000b).
Marin and colleagues (1990, 1991, 1997a, 1997b; Marin, Biedrzycki, &
Firinciogullari, 1991), working within a psychiatric disorders framework, defined apathy
as a state of primary motivational impairment that cannot be attributed to diminished
level of consciousness, cognitive impairment, or emotional distress.
13
Boredom proneness is a state of relatively low arousal and dissatisfaction
(Mikulas & Vodanovich, 1993). In addition to a state definition that attributes boredom to
an inadequately stimulating environment, researchers have also examined boredom
proneness as a potential individual trait (Harris, 2000; Vodanovich & Kass, 1990).
Curiosity is defined as a “positive emotional-motivational system associated with
the recognition, pursuit, and self-regulation of novelty and challenge” (Kashdan, Rose, &
Fincham, 2004, p. 291).
Disengagement is consistently defined in terms of low or decreasing participation
in mandatory as well as extracurricular school activities, such that total disengagement
coincides with school dropout (Fredricks, Blumenfeld, & Paris, 2004).
Distress is defined as “individuals' tendencies to feel dissatisfied with themselves
and their ability to achieve desired outcomes. Proneness to anxiety, depression, low self-
esteem, and low well-being are operationally defined as subtypes of distress”
(Weinberger & Schwartz, 1990, p. 382).
Learned helplessness refers to the repeated attribution of stable, internal causes
for failure, such that individuals perceive a noncontingency between their actions and
outcomes (Burhans & Dweck, 1995; Peterson, 1992; Seligman, 1975).
Work avoidance describes students who consistently put forth as little effort as
required to get by academically (Meece, Blumenfeld & Hoyle, 1988; Meece & Holt,
1993; Nicholls, Patashnick, & Nolen, 1985).
14
Potential Significance
This study is expected to contribute to the literature in at least four ways:
1. Establishing a clear conceptual and operational definition of apathy is a key
step to identifying the causes of school-related apathy, which future research
can address. The present study laid the groundwork for the conceptualization,
operationalization, and modeling of school-related apathy and forwarded
recommendations for definitions, measures, and models of school-related
apathy. In addition, by gathering open-ended accounts of school-related
apathy coupled with quantitative responses to survey items, the study
contributed to a body of research that can eventually describe pedagogical
approaches which successfully decrease student apathy and associated
deleterious effects on well-being and achievement.
2. Current research has not systematically determined the prevalence of self-
reported apathy in middle- and high-school students. Consequently, it is not
yet evident whether a true problem exists that should be addressed with
interventions. By estimating the incidence of apathy among 8th- and 10th-grade
students, the study served as a needs assessment.
3. Proliferation of constructs presents a recurring challenge to psychological
research. By gathering quantitative data on several related constructs from the
same sample, the study estimated the degree of construct independence and
informed a more parsimonious operationalization of apathy in middle- and
high-school students.
15
4. Much research into motivation is focused on academic achievement. In
addition to assessing this important variable for decisions related to
instructional practice, the present study addressed the psychological well-
being of students.
16
CHAPTER II
REVIEW OF RELEVANT LITERATURE
The purpose of this review is to construct a foundation for empirically exploring
both research-based and folk perspectives on the definition, prevalence, correlates, and
grade-level differences of apathy toward school. The following three questions guided the
review of literature.
1. How is apathy toward school defined and operationalized in the extant
literature and what indications does the literature offer regarding the
prevalence of apathy toward school among middle- and high-school students?
2. What evidence does the research literature provide regarding both the relation
of apathy toward school to select individual and group differences variables
and the patterns among those variables for middle- and high-school students?
3. Does the research literature suggest that levels and correlates of apathy toward
school differ between students in middle school and high school?
The overarching selection strategy for the review was to search the peer-reviewed
literature for all constructs that may have already defined apathy toward school. Two
possibilities were examined: constructs which refer directly to apathy by using that term
(e.g., adolescent apathy) and apathy-related constructs that do not use the term apathy but
appear to be conceptually close (e.g., amotivation).
The review is arranged in three major sections. In the first two sections, the two
categories (i.e., apathy, apathy-related) provide an organizing frame for presenting each
construct with its conceptual definition, measures, correlates and key findings. The
concluding section lays out directions for further research.
17
The present study, while seeking to understand apathy that may affect students
beyond their school-related experiences, targeted operationalizations, findings, and
correlates with direct relevance to formal education. Certainly, apathy in middle- and
high-school age individuals may be a general state or trait not directly bound to school
settings or, alternatively, exclusively bound to school settings. However, it was theorized
that while apathy may only occur in school, it is unlikely that apathy would be observed
in all contexts of students’ lives except school. Thus, even a general apathy state or trait
would be expected to present in the school context.
Selection Criteria
The challenge inherent in conducting an exploratory study linked closely to the
meaning of a construct is to avoid circular reasoning, wherein an a priori definition is
selected, and only constructs which match that definition are reviewed, thus
compromising both the scope of analysis and the validity of findings. Nevertheless, it was
necessary to apply some criteria in selecting constructs and research articles that would
form the theoretical foundation for the study.
First, a dictionary definition was combined with a search through the research
literature for synonyms and constructs theoretically related to apathy. To ensure that this
process exhausted the extant literature, several histories of motivation (Pintrich &
Schunk, 1996; Stipek, 2002; Thorkildsen, 2002) were consulted, as were professors of
educational psychology, educational policy, and curriculum and instruction. A second
strategy was applied based on the etymology of the word itself. The “a-” prefix indicates
“absence” or “lack,” in contrast to “negative,” and the root “pathy” suggests “being
moved, experiencing.” This consideration resulted in the exclusion of constructs
18
exclusively focused on competence beliefs or self-beliefs (e.g., self-efficacy). Further, in
keeping with the exploratory nature of the study, the review targets what apathy is rather
than what it is not. Consequently, constructs and theories which may represent the
opposite of apathy were not included (e.g., individual interest, expectancy-value theory),
and specific antecedents and consequences of school-related apathy were not pursued.
However, based on findings from the present study, future research may engage
comparative analyses to explore alternative conceptualizations as well as developmental
trajectories of school-related apathy.
Consistent with the assumptions described herein, an additional criterion for
inclusion was that studies be conducted in educational settings. Excluded from
consideration were studies targeting substance abuse contexts, students with learning
disabilities, or physical education as the primary domain, since this review targets
motivation of normally-functioning individuals in mainstream educational settings.
Articles reporting apathy as a psychopathological condition were considered for the
purpose of informing theoretical and operational definitions of the construct; findings
from these studies are presented only as salient to the current review. For each apathy-
related construct, pertinent studies were sampled for this review, so as to represent the
major findings and trends in terminology, measures, methodology, and correlates.
In addition to selected seminal works and theoretical pieces, the empirical
research literature catalogued in PsycInfo and published in English in peer-reviewed
journals between 1990 and 2005 was searched for the terms apathy, amotivation,
boredom, disaffection, disengagement, learned helplessness, work avoidance and lack of
interest. Table 1 presents the list of constructs addressed in the review.
19
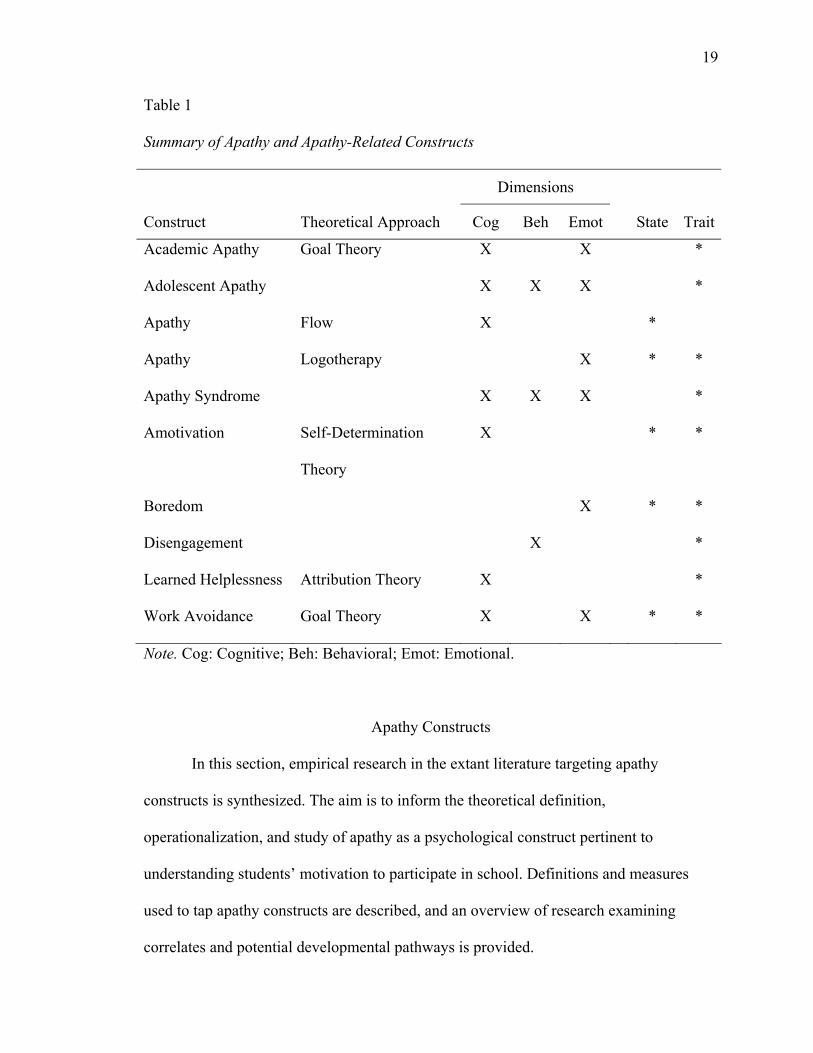
Table 1
Summary of Apathy and Apathy-Related Constructs
Dimensions
Construct Theoretical Approach Cog Beh Emot State Trait
Academic Apathy Goal Theory X X *
Adolescent Apathy X X X *
Apathy Flow X *
Apathy Logotherapy X * *
Apathy Syndrome X X X *
Amotivation Self-Determination
Theory
X * *
Boredom X * *
Disengagement X *
Learned Helplessness Attribution Theory X *
Work Avoidance Goal Theory X X * *
Note. Cog: Cognitive; Beh: Behavioral; Emot: Emotional.
Apathy Constructs
In this section, empirical research in the extant literature targeting apathy
constructs is synthesized. The aim is to inform the theoretical definition,
operationalization, and study of apathy as a psychological construct pertinent to
understanding students’ motivation to participate in school. Definitions and measures
used to tap apathy constructs are described, and an overview of research examining
correlates and potential developmental pathways is provided.
20
In total, a key-word search for peer-reviewed articles in PsycInfo spanning the
years 1990 through 2005 yielded nearly 150 studies with “apathy” in their title or
abstract. However, among these, relatively few developed or elaborated on apathy as a
construct. Only five constructs were identified that explicitly consider apathy in contexts
salient to learners (see Table 1). The variability in definitions ascribed to these five
constructs is reflected both in diverse research methods and in choices of variables
investigated as potential correlates.
It is worth noting that the apathy construct appears as well in the literature on
classroom context. Specifically, apathy is one of twelve dimensions tapped by the
Learning Environments Inventory, or LEI, developed by Fraser and colleagues (Fraser,
1986; Fraser, Anderson, & Walberg, 1982). The LEI defines apathy as “the extent to
which the class feels no affinity with the class activities” (Fraser, 1986, p. 18). However,
the study of classroom contexts using the LEI is not represented here as no further
conceptual or operational definitions were identified in the literature, and no studies were
found that specifically targeted the apathy dimension.
Academic Apathy
One area in which apathy has received explicit mention is the goal orientations
literature, which characterizes individuals’ general disposition toward academic tasks
according to whether their goal is to learn the material well, or to appear successful.
Labels vary across researchers, with the former typically referred to as “mastery” or
“learning” orientation, and the latter as “performance” orientation (Pintrich, 2000;
Schunk, 2000). Among the conceptualizations of student orientations forwarded in goal
orientation studies, the only explicit mention of apathy is found in a study investigating
21
the measurement properties of the Survey of Academic Orientations (SAO; Davidson,
Beck, & Silver, 1999). The creation of items for the academic apathy factor (α = .70, .73;
test-retest coefficient = .68) was informed by the learning orientation-grade orientation
perspective.
Reporting on the measurement characteristics of the SAO, Davidson et al. (1999)
describe students high on academic apathy as uninterested in course work and concerned
primarily with appearing successful rather than with actually learning. Sample items for
the academic apathy dimension are “I try to work just hard enough to get the grade that I
need in a course” and “I might cut class if I think that the lecture material will not be on
the test.” Students with an academic apathy orientation tend to set minimal academic
standards and fail to invest the energy required to attain high grades. In a follow-up
study, the researchers compared student SAO scores to ratings on a series of personality
measures (e.g., intrinsic motivation, extrinsic motivation, openness, independence,
learning orientation, need for structure, self-assurance). Of the personality characteristics
investigated, moderate correlations were found with academic apathy only for the
learning (negative direction) and grade (positive direction) orientations.
However, two concerns arise with respect to the operationalization of academic
apathy. First, the items assessing this dimension emphasize self-regulation and grade-
related goals rather than appearance of success, inconsistent with the conceptual
definition of academic apathy. Moreover, based on item content, academic apathy
appears to closely parallel the work avoidant orientation described earlier in the literature
(e.g., Meece, Blumenfeld, & Hoyle, 1988; Nicholls, Patashnick, & Nolen, 1985). For
22
these reasons, in lieu of further examination of academic apathy, a full description of
work avoidance research is included in the section on apathy-related constructs.
Adolescent Apathy
Having concluded that adequate measures of academic apathy were not
documented in the literature, Handelman (1999) developed and tested the Adolescent
Apathy Inventory (AAI), which yielded high reliability and criterion validity. In his
study, he defined apathy as a multidimensional trait characterized by lack of goal-setting
behaviors, energy and interest, indifference to changes, and difficulty making decisions
as assessed by self, teachers, parents, and friends. Although Handelman summarized the
literature on apathy, he did not operate within a particular theoretical framework in
creating and validating the AAI.
Handelman’s (1999) AAI consists of 81 items organized into three sections. The
first captures levels of agreement with statements regarding goals (e.g., “I want to go to
college”), interests and cares (e.g., “I have school spirit” or “I care about environmental
issues”), and attitudes (e.g., “I like to be the center of attention” or “I feel powerless
around peers”). Behavioral dimensions are tapped by the remaining two sections, with an
activities checklist (e.g., “attended a sporting event” or “gone to the movies”) and
frequency ratings for specific activities, states, or situations (e.g., “I lie around the
house,” “I feel disappointed in myself,” or “I go to school sporting events”). The AAI
yields normally distributed individual scores along a continuum from “not apathetic”
through “highly apathetic,” with low scores indicating high apathy.
Following pilot testing and minor modification of the measure, construct validity
was assessed by comparing adolescents’ AAI scores to their scores on the Reynolds
23
Adolescent Depression Scale (RADS; Reynolds, 1986) as well as to guidance counselor
ratings of their apathy manifestation. A moderate correlation (r=-.51) in the expected
direction was found between the RADS measure of depressive symptoms and the AAI.
This finding indicates that while the construct(s) tapped by the AAI are not isomorphic to
those revealed by the RADS, there is moderate overlap, with implications for a
theoretical definition of apathy, as discussed later.
Over and above student self-reports of age, gender, grade level, ethnicity, and
reported income, AAI scores were also compared to students’ self-identified peer group
categories (populars, athletes, burn-outs, high-achievers, loners, other) and Baumrind’s
(1971) parenting styles (authoritarian, authoritative, permissive). No significant mean
differences were found for ethnicity, reported income, grade level, or age, although small
yet significant correlations were found between age and AAI score (r=-.14) and grade
and AAI score (r=-.17). Females reported significantly lower (more apathetic) scores
than did males, and students who rated their parents as authoritative had significantly
higher scores (less apathetic) than did students reporting permissive or authoritarian
parents. There was no significant gender by parenting style interaction. Significant
differences were found among peer groups, with “populars” and “athletes” combined
reporting higher (less apathetic) scores than “loners” and “burnouts.”
In addition to analyzing overall scores on the AAI, Handelman (1999) ran
exploratory factor analysis on the AAI items to identify potentially distinct dimensions of
adolescent apathy. Using principal components analysis with oblique rotation, he
extracted five factors that ranged in intercorrelations between r=.09 to r=.30. High
correlations were found between RADS scores and the third (“low self”; r=-.72) and fifth
24
(“inactive”; r=-.60) factors, which is unsurprising given the nature of items loading
exclusively on those factors.
However, several aspects of the factor analysis are cause for concern. First, the
resulting factors do not seem to represent distinct issues (e.g., (1) academic pursuits,
caring about what happens to one’s self and others, behaviors; (2) social issues and
friendships; (3) extra-curricular activities; (4) participation and interest in sports,
participation and joining behaviors; (5) depressive symptoms, boredom, and
disappointment in one’s self, goal-setting and goal-directed behaviors, difficulty in
decision-making).
Second, nearly half (34) of the 81 items were retained on multiple factors such
that scores for a given item contributed to more than one composite score; moreover,
several items did not load on any factor but were nevertheless retained in the factor
analysis. Further compromising the strength of the subscale identification was the
inclusion of twelve dichotomous items, which are known to yield multiple factors due to
statistical rather than substantive bias across items (Bernstein & Teng, 1989). The use of
a matrix of tetrachoric inter-item correlations rather than Pearson correlations has been
shown to correct the bias (Panter, Swygert, Dahlstrom, & Tanaka, 1997); however, it
does not appear from the description of methods that such adjustments were made
(Handelman, 1999). Consequently, while overall AAI scores may be valid indicators of
an individual’s apathy, the validity of the dimensions identified via factor analysis are
open to discussion.
Table 2 presents a subset of items drawn from the AAI. Only items loading on a
single factor and having a load weight greater than .300 are displayed. Item numbers
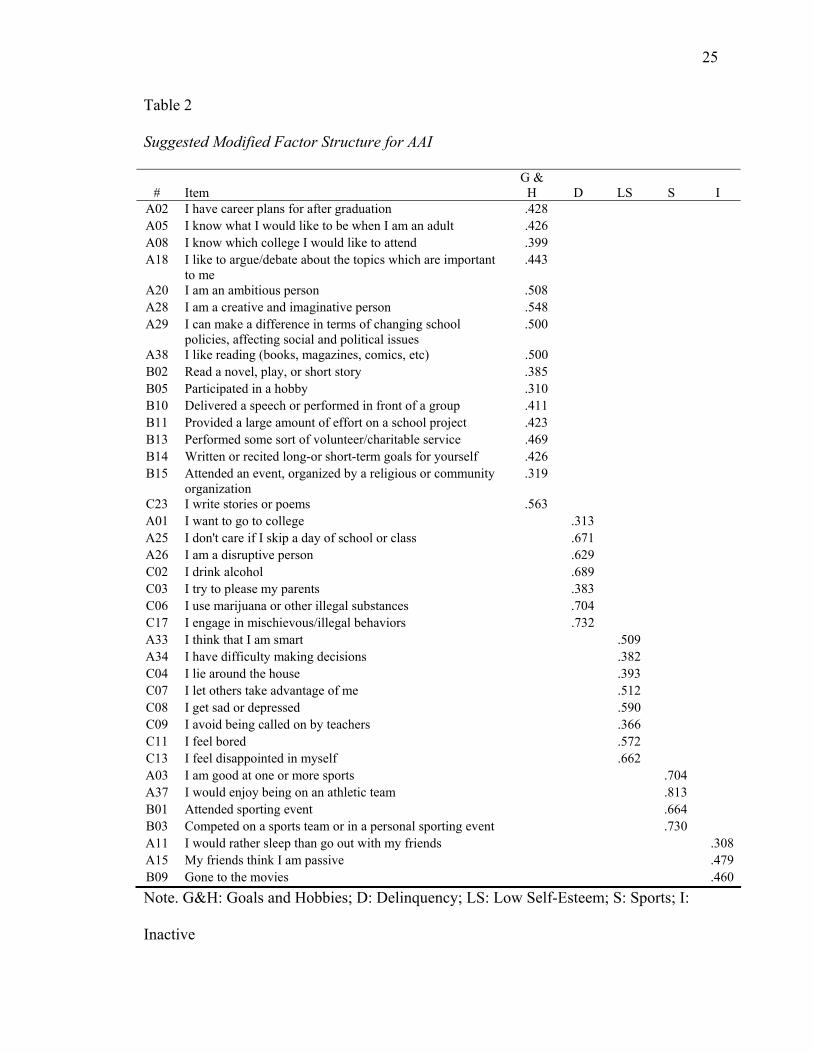
25
Table 2
Suggested Modified Factor Structure for AAI
# Item G &
H D LS S I A02 I have career plans for after graduation .428 A05 I know what I would like to be when I am an adult .426 A08 I know which college I would like to attend .399 A18 I like to argue/debate about the topics which are important
to me .443
A20 I am an ambitious person .508 A28 I am a creative and imaginative person .548 A29 I can make a difference in terms of changing school
policies, affecting social and political issues .500
A38 I like reading (books, magazines, comics, etc) .500 B02 Read a novel, play, or short story .385 B05 Participated in a hobby .310 B10 Delivered a speech or performed in front of a group .411 B11 Provided a large amount of effort on a school project .423 B13 Performed some sort of volunteer/charitable service .469 B14 Written or recited long-or short-term goals for yourself .426 B15 Attended an event, organized by a religious or community
organization .319
C23 I write stories or poems .563 A01 I want to go to college .313 A25 I don't care if I skip a day of school or class .671 A26 I am a disruptive person .629 C02 I drink alcohol .689 C03 I try to please my parents .383 C06 I use marijuana or other illegal substances .704 C17 I engage in mischievous/illegal behaviors .732 A33 I think that I am smart .509 A34 I have difficulty making decisions .382 C04 I lie around the house .393 C07 I let others take advantage of me .512 C08 I get sad or depressed .590 C09 I avoid being called on by teachers .366 C11 I feel bored .572 C13 I feel disappointed in myself .662 A03 I am good at one or more sports .704 A37 I would enjoy being on an athletic team .813 B01 Attended sporting event .664 B03 Competed on a sports team or in a personal sporting event .730 A11 I would rather sleep than go out with my friends .308 A15 My friends think I am passive .479 B09 Gone to the movies .460 Note. G&H: Goals and Hobbies; D: Delinquency; LS: Low Self-Esteem; S: Sports; I:
Inactive
26
prefixed with “B” were scored dichotomously. Note that elimination of
ambiguous items would result in somewhat different loadings.
In sum, work on the Adolescent Apathy Inventory (AAI) represents an
important contribution to our understanding of apathy in young people. Notably,
apathy in this operationalization is not cast as the absence of a positive construct,
but is instead conceptualized as an independent affective construct manifest in a
range of behaviors, emotions, and cognitive perceptions. Examination of the AAI
subscales suggests that apathy as described by Handelman (1999) could be
considered a multivariate construct comprising goal-setting, delinquency, and
prosocial behaviors as well depressive symptoms. The literatures on these
constructs and behaviors (e.g., Ford & Nichols, 1987, Wentzel, 1994) thus
represent important avenues to pursue in sketching a holistic picture of apathetic
students and associated deleterious effects on development, academic
achievement, and well-being. Refinement of the AAI to include only the most
informative items, using statistical analyses appropriate for both continuous and
dichotomous items, represents one important aim of research to clarify apathy. In
addition, further examination of construct validity using both convergent variables
is warranted.
Apathy in Flow Theory
Apathy is one of several states defined by flow theory, which analyzes everyday
experience in terms of the balance between perceived challenge and skill
(Csikszentmihalyi, 1990; Csikszentmihalyi & Nakamura, 1989). Conditions that offer a
high level of challenge well-matched to an individual’s skill or ability are likely to elicit
27
the optimal experience of flow, the experience of “losing oneself” in an activity.
According to Csikszentmihalyi, individuals’ experiences of flow are characterized by
intense concentration, clear and direct task feedback, loss of self-consciousness, sense of
control, and intrinsic reward. Other challenge-skill combinations define additional states,
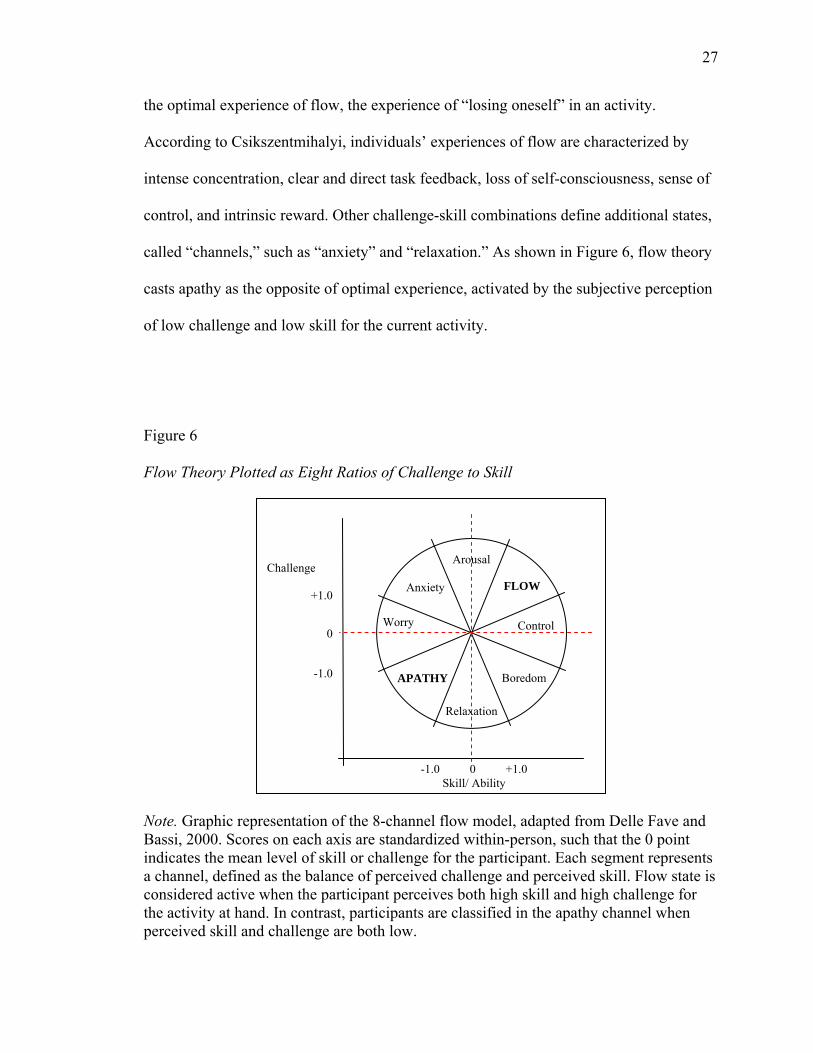
called “channels,” such as “anxiety” and “relaxation.” As shown in Figure 6, flow theory
casts apathy as the opposite of optimal experience, activated by the subjective perception
of low challenge and low skill for the current activity.
Figure 6
Flow Theory Plotted as Eight Ratios of Challenge to Skill
Note. Graphic representation of the 8-channel flow model, adapted from Delle Fave and Bassi, 2000. Scores on each axis are standardized within-person, such that the 0 point indicates the mean level of skill or challenge for the participant. Each segment represents a channel, defined as the balance of perceived challenge and perceived skill. Flow state is considered active when the participant perceives both high skill and high challenge for the activity at hand. In contrast, participants are classified in the apathy channel when perceived skill and challenge are both low.
-1.0 0 +1.0 Skill/ Ability
Challenge
+1.0
0
-1.0 APATHY
Worry
Anxiety
Arousal
FLOW
Control
Boredom
Relaxation
28
The number of challenge-skill states based on within-person standardized scores
varies across studies, ranging from four to nine. Since by definition, all states, or
“channels,” in the model are mutually exclusive, it is not possible to experience multiple
states simultaneously. Thus, apathy from the perspective of flow theory could also be
considered the absence of the positive state of flow, rather than a construct that assumes
values independent of other dimensions of experience. Moreover, state-like definitions
closely associate the various flow channels with a specific activity.
Methods employed in the study of flow focus on momentary experience, using an
innovative data-gathering technique called the Experience Sampling Method (ESM;
Larson & Csikszentmihalyi, 1978, 1983). For a full week, participants carry pagers or
watches programmed to activate daily at several randomly selected times during waking
hours. At each notification, the participant fills out one of the forms provided; all forms
are collected at the end of the participation period. Any forms filled out considerably
after the notification or left mostly unanswered are dropped from analysis. Some
researchers have adopted variations of this method, collecting single or a handful of
samples of experience, and defining states based on sample rather than individual means
(e.g., Konradt, Filip, & Hoffmann, 2003).
A total of 8 studies investigating flow met the criteria for inclusion in the present
review. Three major findings emerge from these studies. First, consistent with
hypotheses, the apathy state is negatively associated with a range of well-being markers
such as happiness, involvement, wish to do activity, and concentration. Second, both
main and interaction effects appear across contexts for the relation between flow state
29
and quality of life indicators. Finally, a large portion of the variance observed in quality
of life variables remains unexplained by flow theory.
Flow and Well-Being
Haworth and colleagues (Clarke & Haworth, 1994; Haworth & Evans, 1995)
examined the relation between flow experiences and enjoyment for samples of
adolescents in England. In both studies, the apathy channel, defined by these researchers as
low challenge that exceeded skills, was associated significantly with negative aspects of
experience, such as low happiness and interest. Konradt and colleagues (2003) investigated
flow experience during hypermedia learning and found that participants who reported balanced
and high levels of challenge and skill following free navigation time also reported higher levels
of contentment.
Similarly, Moneta and Csikzsentmihalyi (1996) studied a sample of talented
United States adolescents to assess the extent to which challenge, skill, and flow state
predicted quality of experience as described by happiness, concentration, involvement,
and wish to do the activity. Quality of daily experience was found to positively associate
with subjectively rated challenge and skill, and a balance between challenge and skill was
observed to further enhance the quality of experience.
Delle Fave and Bassi (2000) examined the relations among daily activities,
dimensions of quality of life (e.g., mood, engagement, confidence, and intrinsic
motivation) and flow state, operationalized according to Moneta and Csikszentmihalyi
(1996, 1999). Focusing their data analyses on the flow and apathy channels, they found
that watching television was related to lack of goals and engagement, and served as a
source of apathy for their sample adolescents in Italy. In contrast, activities such as
30
studying at home and socializing were more strongly associated with flow experiences.
With some exceptions, dimensions of quality of life were significantly associated with
flow and apathy in the expected directions. However, engagement, unself-consciousness,
and goals were significantly and positively associated with the apathy state for studying
at home. Findings from this study thus present a conflicting picture of quality of
experience variables associated with different flow states across activities.
Flow and Context
The second major finding is that context interacts with flow channel membership
to predict well-being. Moneta and Csikszentmihalyi (1996, 1999) found that the
imbalance of challenge and skills was associated with a reduction in concentration and
involvement in the school context, but not in the family or friends contexts. That is,
participants were more likely to report discrepant challenge and skill scores together with
lower scores in the quality dimensions of concentration and involvement in school than
they were with family and friends.
Flow and Variance Explained
Finally, flow researchers note that while informative, the challenge-skill balance
nevertheless does not explain a substantial portion of variance in well-being indicators. In
Moneta and Csikszentmihalyi’s (1996, 1999) study of talented adolescents, the regression
intercepts differed significantly between contexts, indicating that challenge, skill, and
their relative balance do not offer sufficient evidence for explaining variability in quality
of experience between contexts.
31
Summary
In sum, individuals in situations characterized by perceived low challenge and
low skill tend to report lower levels on a range of quality of experience variables such as
enjoyment, concentration, and motivation. However, associations between these
indicators vary across contexts, with the school context emerging as particularly sensitive
to the balance of perceived challenge and skill. Findings indicate that while the perceived
challenge-skill balance used by flow theory to define channels of experience does explain
some of the variance in measured outcomes, considerable variance remains unexplained
and thus indicates that other variables are in play. A related measurement issue concerns
the use of within-person standardized scores to determine flow state, which potentially
masks individual differences in frequency of flow experience.
Since apathy in flow theory is focused on specific tasks and based on multiple
data collection points, it is unlikely that flow state data collected at one point in time
regarding overall school experience would yield meaningful results. However, the work
by Csikszentmihalyi and other flow theorists presents three important considerations for
the present study. First, their work indicates that outcome variables beyond academic
achievement are important to investigate as correlates of motivation. Second, given the
moderating role of context documented by their research, it is necessary to clearly and
consistently delineate the context for the present study. Third, findings from flow theory
argue in favor of employing data generation methods such as interviews that offer the
possibility to probe students’ perceptions of the extent to which low challenge and low
skill consistently characterize their experience in school. This latter component of
32
research methodology would allow evidence of a persistent state of school-related apathy
to emerge even in the absence of experience sampling.
Apathy in Logotherapy
Apathy also emerges within the research on logotherapy, a clinical approach
based on existential philosophy. Logotherapy was pioneered by Frankl, a concentration
camp survivor and clinical psychiatrist, who defined apathy as “the blunting of the
emotions and feeling that one could not care anymore” (1946/1962, p. 21). He observed
an existential vacuum among clients in his clinical practice and hypothesized that in the
absence of a sense of purpose and meaning in life individuals may develop what he
labeled noogenic neurosis, which is manifested in apathy and boredom (Crumbaugh &
Maholick, 1964).
Most logotherapy studies published in the peer-reviewed literature focus on the
relation between meaning in life and psychological well-being. Based on Frankl’s theory,
the Purpose in Life Test (PIL) was developed by Crumbaugh and Maholick (1964) and
subsequently refined by Crumbaugh (1968) to assess the level of an individual’s sense of
purpose in life. Those suffering from noogenic neurosis were expected to obtain low
scores on the measure, with apathy considered a potential consequence of individuals’
low perceptions of meaning.
A search of the literature identified only two studies aimed at assessing levels of
student apathy operationalized as scores on the PIL. Coffield and Buckalew (Coffield,
1981; Coffield & Buckalew, 1986) analyzed data collected at two time points from
independent samples of high school and college students and, contrary to the notion that
apathy has been on the rise, found no significant differences. However, the researchers
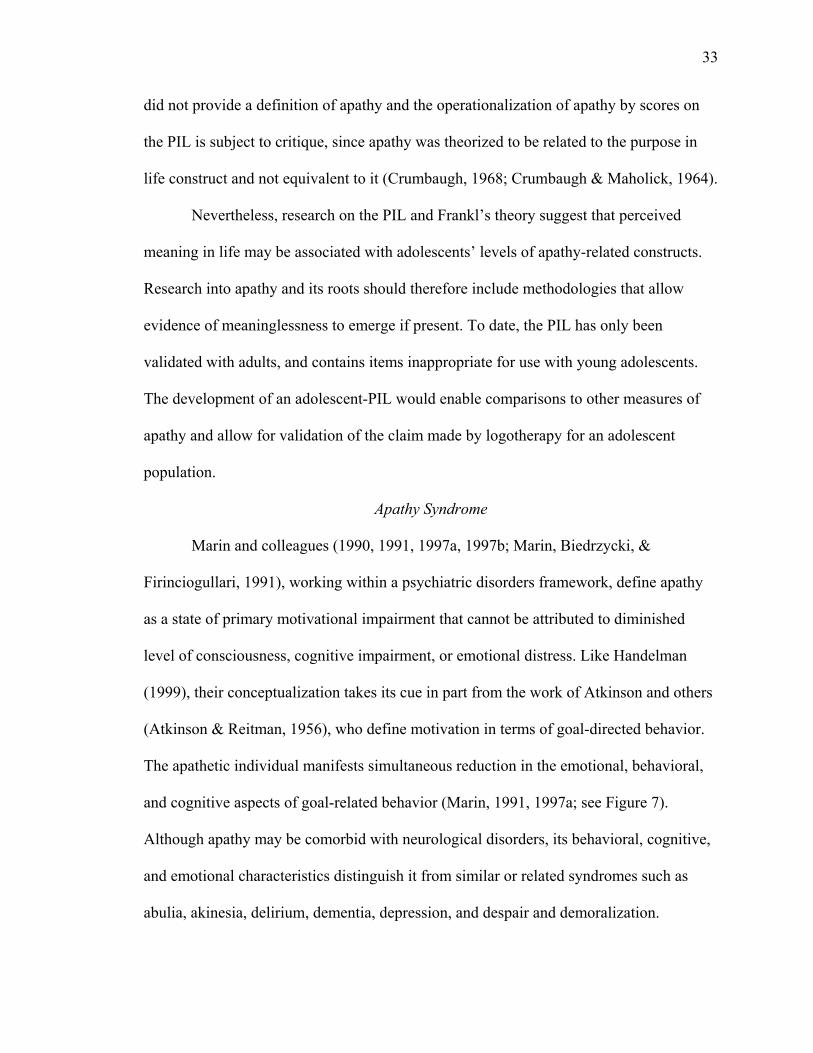
33
did not provide a definition of apathy and the operationalization of apathy by scores on
the PIL is subject to critique, since apathy was theorized to be related to the purpose in
life construct and not equivalent to it (Crumbaugh, 1968; Crumbaugh & Maholick, 1964).
Nevertheless, research on the PIL and Frankl’s theory suggest that perceived
meaning in life may be associated with adolescents’ levels of apathy-related constructs.
Research into apathy and its roots should therefore include methodologies that allow
evidence of meaninglessness to emerge if present. To date, the PIL has only been
validated with adults, and contains items inappropriate for use with young adolescents.
The development of an adolescent-PIL would enable comparisons to other measures of
apathy and allow for validation of the claim made by logotherapy for an adolescent
population.
Apathy Syndrome
Marin and colleagues (1990, 1991, 1997a, 1997b; Marin, Biedrzycki, &
Firinciogullari, 1991), working within a psychiatric disorders framework, define apathy
as a state of primary motivational impairment that cannot be attributed to diminished
level of consciousness, cognitive impairment, or emotional distress. Like Handelman
(1999), their conceptualization takes its cue in part from the work of Atkinson and others
(Atkinson & Reitman, 1956), who define motivation in terms of goal-directed behavior.
The apathetic individual manifests simultaneous reduction in the emotional, behavioral,
and cognitive aspects of goal-related behavior (Marin, 1991, 1997a; see Figure 7).
Although apathy may be comorbid with neurological disorders, its behavioral, cognitive,
and emotional characteristics distinguish it from similar or related syndromes such as
abulia, akinesia, delirium, dementia, depression, and despair and demoralization.
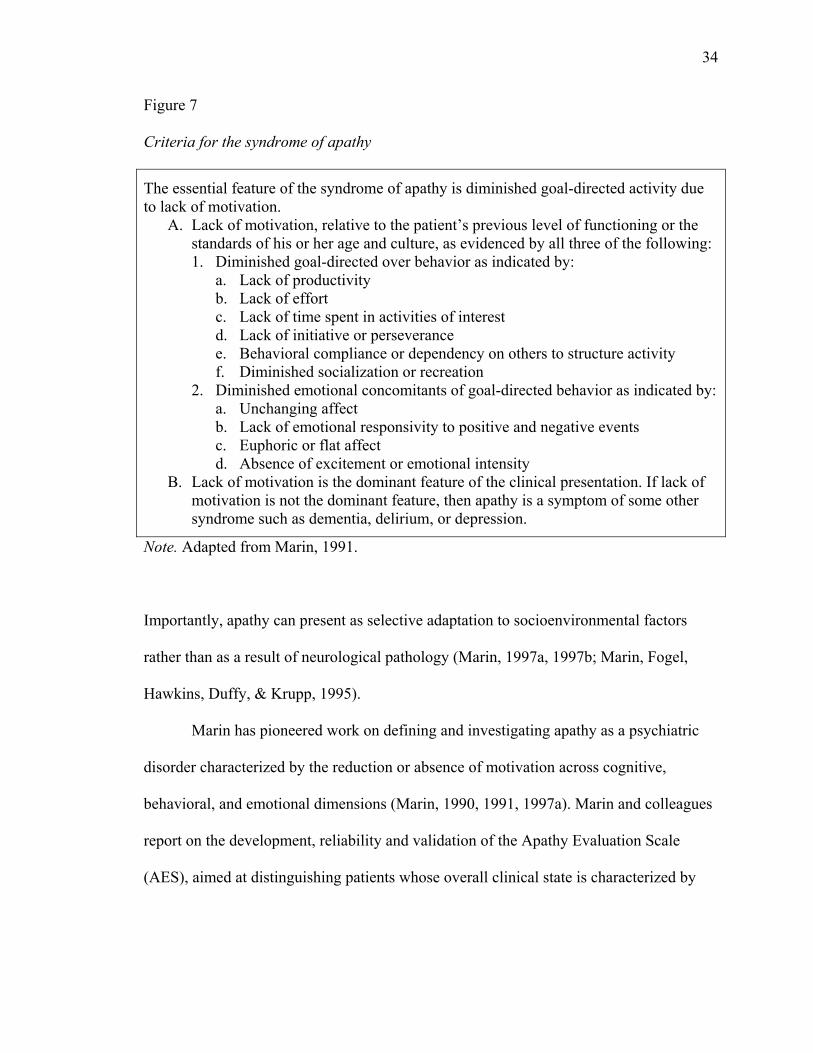
34
Figure 7
Criteria for the syndrome of apathy
The essential feature of the syndrome of apathy is diminished goal-directed activity due to lack of motivation.
A. Lack of motivation, relative to the patient’s previous level of functioning or the standards of his or her age and culture, as evidenced by all three of the following: 1. Diminished goal-directed over behavior as indicated by:
a. Lack of productivity b. Lack of effort c. Lack of time spent in activities of interest d. Lack of initiative or perseverance e. Behavioral compliance or dependency on others to structure activity f. Diminished socialization or recreation
2. Diminished emotional concomitants of goal-directed behavior as indicated by: a. Unchanging affect b. Lack of emotional responsivity to positive and negative events c. Euphoric or flat affect d. Absence of excitement or emotional intensity
B. Lack of motivation is the dominant feature of the clinical presentation. If lack of motivation is not the dominant feature, then apathy is a symptom of some other syndrome such as dementia, delirium, or depression.
Note. Adapted from Marin, 1991.
Importantly, apathy can present as selective adaptation to socioenvironmental factors
rather than as a result of neurological pathology (Marin, 1997a, 1997b; Marin, Fogel,
Hawkins, Duffy, & Krupp, 1995).
Marin has pioneered work on defining and investigating apathy as a psychiatric
disorder characterized by the reduction or absence of motivation across cognitive,
behavioral, and emotional dimensions (Marin, 1990, 1991, 1997a). Marin and colleagues
report on the development, reliability and validation of the Apathy Evaluation Scale
(AES), aimed at distinguishing patients whose overall clinical state is characterized by
35
apathy from those in whom apathy presents as a symptom signaling another syndrome,
such as delirium, dementia, or depression (Marin, 1997b).
Versions of the measure were created for clinician, informant (e.g., family
member, caregiver, or friend), and client, to provide a broad base of data for examining
construct validity. Construct validity was tested using a multitrait-multimethod matrix
procedure (Campbell & Fiske, 1959; Crocker & Algina, 1986), in which apathy,
depression, and anxiety were each evaluated using paper-and-pencil and interview
methods. Resulting convergent validities were within expected ranges (Marin et al.,
1991). However, informant scores tended to produce inadequate levels of convergent
validity.
Although Marin and colleagues have focused their study of apathy within an
elderly population diagnosed with neurological disorders such as Parkinson’s and
Alzheimer’s (Marin et al., 1991), the finding that some individuals evidence apathy due
to psychological and socioenvironmental causes (e.g., Marin, 1997b) such as retirement
has import for understanding apathy in adolescents, whose lives are rife with physical
changes as well as socioenvironmental transitions. Also relevant is the manifestation of
persistent selective apathy for particular activities in otherwise normally functioning
individuals (Marin, 1990). For instance, there may be a milder form of apathy that
presents during development and influences a range of social and academic outcomes.
Thus there is a need for research into this possibility, as well as empirical data to examine
the sensitivity of the AES to selective adaptive apathy in adolescents resulting from
psychosocial and environmental mechanisms.
36
Summary of Apathy Constructs
In sum, five apathy constructs were identified and reviewed for their potential to
reflect school-related apathy. Looking across these constructs, some distinguishing
features are already evident with respect to the purposes of the present review. First,
apathy has been conceptualized either as an enduring individual trait (e.g., adolescent
apathy, academic orientations) or as a state resulting from the interaction between
individual characteristics and perceived contextual factors (e.g., flow theory). Second,
apathy has been identified as a psychiatric disorder distinct from other syndromes (e.g.,
Marin, 1997a). Third, some researchers consider apathy in the context of a larger
conception of psychological health (e.g., logotherapy). Finally, apathy is defined in terms
of subjective cognitive perceptions (e.g., flow theory, academic orientation), emotion
(e.g. logotherapy), or behavioral, cognitive, and emotional symptoms (e.g., apathy
syndrome, adolescent apathy).
The review of research on and operationalization of academic apathy indicated
that this construct closely reflects the work-avoidance goal orientation defined and
studied earlier in the literature. Therefore the present study will draw on the latter,
discussed in the following section, to investigate this conceptualization of apathy in
adolescents.
The work of both Marin and Handelman suggests that apathy plays out across
behavioral, cognitive, and emotional dimensions of adolescents’ lives. Measurement
concerns advocate developing a shorter form of the AAI to more effectively identify
apathetic adolescents and ascertaining whether the AAI offers increased parsimony over
a composite measurement of other variables. Further, the AAI is general rather than
37
focused on the school context. Given findings from flow theory regarding the moderating
role of context, it will be important to explore whether adolescent apathy takes on
variable expressions between school and non-school contexts.
The research of Marin and colleagues on apathy as a syndrome offers an
important complement to understanding the AAI, since the AES, while not yet validated
with adolescents, consists of items appropriate for that age group and is based on rigorous
clinical and theoretical investigations of apathy. An important contribution of the present
study was to ascertain the degree of overlap between these two operationalizations of
apathy, as well as their relation to other apathy-related constructs.
Research on these constructs offers some evidence of conceptual and operational
overlap. However it remains to be understood whether the apathy described by teachers
and even researchers is exhaustively captured by these approaches. Moreover, for some
of these apathy constructs, the question arises as to consistency between conceptual and
operational definitions.
Regarding associated variables, the research on flow theory demonstrates the
importance of extending correlates of apathy beyond academic achievement to
encompass well-being variables, and to investigate the roles of challenge, skill and their
balance in eliciting variations in adolescent motivation in school. Further, logotherapy
suggests that adolescents who do not perceive the meaning of their lives may experience
apathy. Therefore both the development of an adolescent PIL and explorations of its
relation to apathy represent directions for future research.
Apathy-Related Constructs
Beyond constructs labeled apathy, the research literature offers additional insights
38
via constructs bearing alternative labels. Therefore, to capture the full range of
conceptualizations poised to inform a characterization of apathy, a wider net was cast to
include apathy-related constructs. Five apathy-related constructs were identified:
amotivation, boredom, disengagement, learned helplessness, and work avoidance.
Alienation and anomie were excluded since their conceptualizations suggest potential
correlation, rather than equivalence, to apathy. Specifically, alienation has been defined
in terms of sense of powerlessness and self-estrangement. Anomie is descriptive of
society rather than of individuals, and is defined as normlessness, either in terms of
deviation from accepted rules or customs or as a lack of clear rules for behavior (Seeman,
1991).
Amotivation
Amotivation is defined within the literature on self-determination theory (SDT;
Deci & Ryan, 1985b; Ryan & Deci, 2000a), a macrotheory of motivation that posits three
basic innate psychological needs for autonomy, competence, and relatedness common to
all human beings. A central claim of SDT is that psychological health will not be
experienced if any of these three needs is not met in the individual’s sociocultural context
(Deci & Ryan, 2000). Organismic integration theory (OIT), a subtheory of SDT,
describes how individuals internalize the reasons and locus of causality for extrinsically-
motivated behaviors (Deci & Ryan, 2000). SDT distinguishes the content of goals from
the mode of goal pursuit, with OIT describing states of motivation on a continuum—
ranging from amotivation to four forms of extrinsic motivation and intrinsic motivation—
and defined by different regulatory processes and perceived locus of control (see Figure 8).
The state of amotivation is defined as lack of intention to act resulting from lack
39
of valuing or feeling of competence for the activity (Ryan & Deci, 2000b). Individuals
experiencing amotivation lack motivation and self-determination with respect to a target
behavior (Deci & Ryan, 2000). Baldwin and Caldwell (2003) define amotivation in terms
of nonintentional and nonregulated behavior. Alternatively, Cokley (2000) emphasizes
amotivation resulting from the perception that behavior is caused by forces out of one’s
control and will not yield a desired outcome.
Amotivation may also be considered a general orientation or trait. Deci and Ryan
(1985a) define causality orientations as enduring tendencies characterizing the degree to
which behavior is self-determined. The three orientations are autonomy, control, and
impersonal. This latter orientation was labeled amotivation in a study by Lee, Sheldon,
and Turban (2003), who suggested that this term better reflects the meaning of the trait,
defined by Deci and Ryan (1985a) as an enduring tendency to experience behavior as
beyond intentional control. Those with a strong impersonal, or amotivation, orientation
tend to see themselves as incompetent and unable to regulate their behavior to achieve
desired outcomes. Overall, conceptual definitions of amotivation across several studies
reflect consistency and emphasize an individual’s lack of intention to act, perception of
not being in control of behavior and a concomitant lack of behavior regulation.
Measures and Findings
Several measures of regulatory styles have been developed that reflect the SDT
perspective, however only a subset of these includes amotivation (Vallerand, Pelletier,
Blais, Brière, Senécal, & Vallières, 1992). These measures tap from three to six
regulatory styles and range in focus from situational state, to academic orientation over
time, to general orientations akin to personality traits.
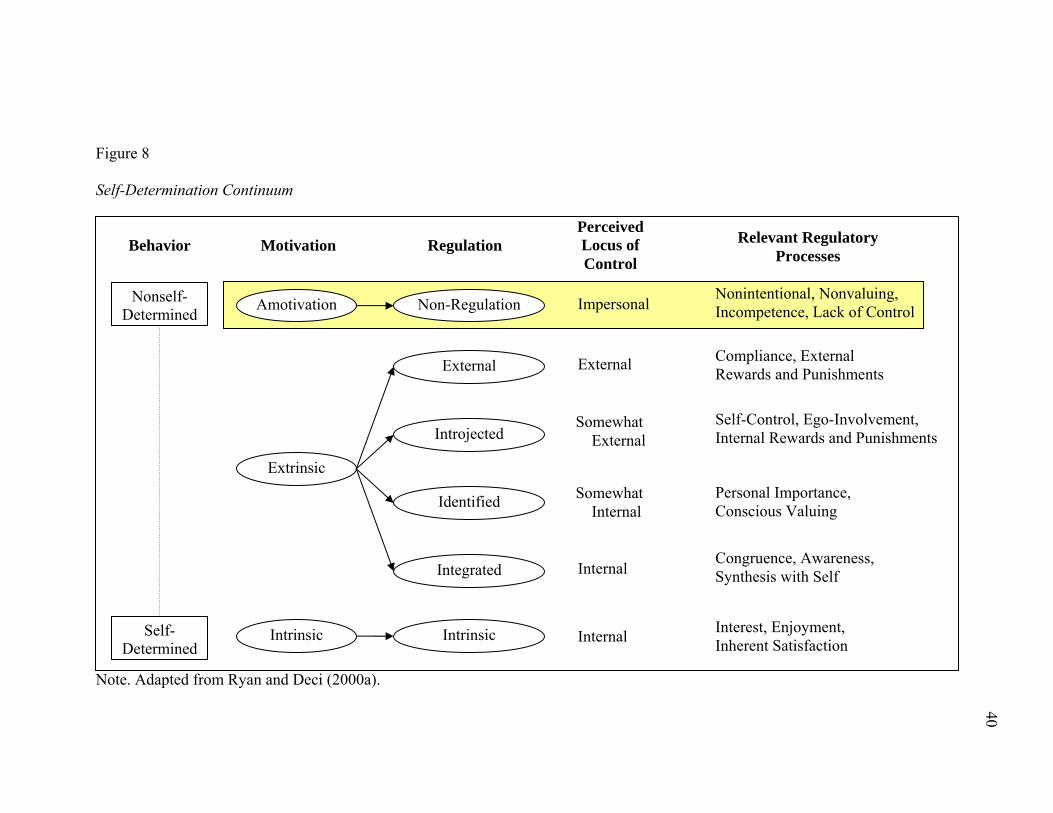
Figure 8
Self-Determination Continuum
Note. Adapted from Ryan and Deci (2000a).
Intrinsic
Amotivation
Extrinsic
Non-Regulation
External
Introjected
Identified
Integrated
Intrinsic
Behavior
Nonself-Determined
Self-Determined
Motivation
Regulation
Perceived Locus of Control
Relevant Regulatory Processes
Impersonal
External
Somewhat External
Somewhat Internal
Internal
Internal
Nonintentional, Nonvaluing, Incompetence, Lack of Control
Compliance, External Rewards and Punishments
Self-Control, Ego-Involvement, Internal Rewards and Punishments
Personal Importance, Conscious Valuing
Congruence, Awareness, Synthesis with Self
Interest, Enjoyment, Inherent Satisfaction
40
41
Targeting a general level of motivation in academic settings, Vallerand et al.
(1992, 1993) developed and tested the Academic Motivation Scale (AMS), translated
from the original French version into English, with several samples of college students.
Four of theoriginal SDT motivation types were tested, with intrinsic motivation (IM)
further differentiated into three factors: IM-accomplishment, IM-knowledge, and IM-
stimulation. Four Likert-scale items, shown in Table 3, constitute the amotivation
subscale. Confirmatory factor analysis of the 7-factor model yielded acceptable fit
indices.
This measure was subsequently used with a sample of American college students
by Cokley (2000), who tested for construct validity by examining the correlation patterns
among factors in light of SDT. According to the theory, motivation orientations adjacent
on the continuum should be more highly correlated, with magnitude and valence of
correlations reflecting distance on the continuum. Although the types of extrinsic
motivation were found to be positively and significantly intercorrelated, introjected
regulation correlated more highly with intrinsic motivation than did identified regulation,
suggesting that introjected regulation may be more self-determined than had been
conceptualized (See Figure 8).
Building on the work by Vallerand and colleagues (1992, 1993), Guay, Vallerand,
and Blanchard (2000) developed the Situational Motivation Scale (SIMS) to tap
motivation for a specific activity according to four levels—intrinsic, identified, external,
and amotivated—of the self-determination continuum. Table 3 shows the four items that
make up the amotivation subscale. In exploratory factor analysis all four dimensions
emerged, explaining 65% of the variance. However, the amotivation factor had an

42
Table 3
AMS and SIMS Amotivation Subscale Items
Academic Motivation Scale (AMS; Vallerand et al., 1992; α = .85)
Why do you go to school?
1. Honestly, I don't know; I really feel that I am wasting my time in school.
2. I once had good reasons for going to school; however, now I wonder whether I
should continue.
3. I can't see why I go to school and frankly, I couldn't care less.
4. I don't know; I can't understand what I am doing in school.
The Situational Motivation Scale (SIMS; Guay et al., 2000; α = .77)
Why are you currently engaged in this activity?
1. I do this activity but I am not sure if it is worth it.
2. There may be good reasons for engaging in this activity, but personally I don’t see
any.
3. I don’t know; I don’t see what this activity brings me.
4. I do this activity, but I am not sure it is a good thing to pursue it.
43
eigenvalue well below 1 (.73) and only explained 4.5% of the overall variance.
Confirmatory factor analysis with a different sample of college students yielded
acceptable fit of the 4-factor model. Focusing instead on the application of SDT to
understanding adolescents’ motivation outside school, Baldwin and Caldwell (2003)
developed a free time motivation measure. Though they found support for the simplex
structure among the five motivational dimensions (the integrated dimension was not
assessed in their study), the authors characterize the model fit as minimally acceptable.
Given the emphasis in self-determination on individuals’ reasons for engaging in
activities, it is not surprising that the content of the amotivation subscale items revolves
around whether respondents see reasons for going to school or engaging in specific
academic tasks. However, it is not clear whether a construct thus operationalized is
appropriately labeled amotivation. Although amotivation is defined as unwillingness or
lack of intention to act (Ryan & Deci, 2000a), two of the four SIMS items indicate that
the person is doing the activity. Further, the amotivation items on the SIMS and AMS
confound caring with purpose. Amotivation operationalized with these items may not
necessarily be accompanied by lack of control over the situation or lack of competence to
succeed at the activity. Perhaps this construct is better understood in terms of the
meaning individuals perceive for engaging in school or academic tasks, while a separate
construct would capture other salient aspects such as sense of competence, behaviors, and
valuing (Wigfield & Eccles, 2000).
Focusing on aspects of the individual rather than on particular activities or
contexts, Deci and Ryan (1985a) developed the General Causality Orientations Scale
(GCOS) to identify enduring tendencies to perceive events as either controlling,
44
informational, or amotivating. Items on this measure tap three orientations: autonomous,
controlling, and impersonal, with labels reflecting type of self-determination. Twelve
vignettes reflecting a diverse set of scenarios (e.g., exam performance, parenting, work,
socializing) each with three associated questions, make up the measure; respondents
indicate level of agreement for all items, resulting in a composite score for each
orientation. In studies with undergraduates and working adults, internal consistency and
temporal stability were both found to be satisfactory. Correlations between orientations
ranged from .02 to .15, whereas inter-item correlations within each orientation ranged
from .34 to .60. Further support for construct validity was found in significant
correlations with other personality measures in the theorized directions.
Associations with Other Variables
Several studies include the motivation orientations or levels of SDT in their
analyses, ranging from the three basic dimensions of intrinsic motivation, extrinsic
motivation, and amotivation to a model that includes all six variations, shown in Figure 8.
For example, Guay et al. (2000) examined the relation between situation-based
motivational state, the determinants of perceived competence and autonomy support, and
the consequences of emotions and task interest. In path model analyses, support was
found for the theory that perceived competence and autonomy support was indirectly
related to task interest and emotion through motivation state. However, as noted earlier,
the amotivation factor on the situational measure did not account for substantial variance.
Moreover, in replication studies reported in the same article, this factor was found to be
fairly unstable over measurement times.
Vallerand et al. (1992) examined associations between motivational orientation
45
and antecedents and consequences consistent with SDT and reported that amotivation
was significantly and negatively correlated with concentration in class, positive emotions
in class, academic satisfaction, reported grades, and schooling intentions. Although no
gender differences were found for amotivation composite scores, females reported
significantly higher mean composite scores within the orientations closer to intrinsic
motivation. Similarly, females reported higher motivation than did males in a study of
college students enrolled in a compulsory course (Vallerand & Bissonnette, 1992).
Motivation levels as reported on the AMS at the start of the semester predicted course
persistence, with females having higher persistence than males. Vallerand et al. (1993)
found moderate support for relations between amotivation and motivational antecedents
such as perceived competence and optimism in education. Low correlations between
aspects of classroom climate and the AMS subscales were also observed.
Noels, Pelletier, Clement, and Vallerand (2003) compared second language
learning orientations in Canadian college students to scores on the self-determination
motivation continuum, and additionally examined antecedents and consequences of self-
determination. Composite scores on the amotivation factor were significantly correlated
with the freedom of choice (r=–0.49) and perceived competence (r=–0.23) antecedents,
as well as with the intention to continue (r=–0.57) and anxiety (r=0.17) consequences.
Senécal, Koestner, and Vallerand (1995) compared students’ scores on the self-
determination motivation continuum to procrastination levels among junior college
students in Canada and found a significant negative correlation between intrinsic
motivation and procrastination.
Linking the family and school contexts, Leung, Kwan, and Kim (1998) explored
46
motivational orientations as mediating the relation between parenting styles and
perceived academic competence. Among the sample of 8th and 9thgrade students in Hong
Kong, they found support for three hypothesized pathways of parenting to motivation:
authoritarian to extrinsic, authoritative to intrinsic, and neglectful to amotivation;
motivational orientations were in turn associated with perceived academic competence in
the hypothesized directions. The data also revealed evidence of a pathway between
authoritarian and amotivation.
Only two studies were found that explored Deci and Ryan’s work on causality
orientations in educational settings. Lee et al. (2003) tested a model linking general
causality orientations to enjoyment and performance outcomes through an intervening
goal-striving process defined in terms of achievement goal patterns, goal level, and
mental focus. The impersonal, or amotivation, orientation positively related to
performance-avoiding goals, which in turn were negatively associated with both goal
level and mental focus. The observed positive relation between mental focus and both
enjoyment and performance completed the path from amotivation to outcomes in the
model, in which all paths were significant and model fit indices were satisfactory.
This work followed earlier investigations by Koestner and Zuckerman (1994) who
explored similarities between Deci and Ryan’s causality orientations theory and Dweck
and Leggett’s (1988) social-cognitive theory of achievement, and found support for
substantial overlap between learning- and performance-orientations and regulatory styles.
Specifically, moderate support was found in a college student sample for the hypothesis
that performance goals coupled with low confidence represent a special case of the
impersonal (amotivation) orientation. In a second study of college students, the predicted
47
interaction between orientation and response to positive and negative task feedback was
found. Whereas autonomous individuals’ mean levels of motivation did not vary in
response to success or failure, controlled individuals demonstrated significantly higher
motivation in the failure condition over the success condition. In contrast, individuals
with an impersonal orientation reported somewhat higher mean task motivation in the
success condition. That is, individuals manifesting impersonal orientations responded to
negative feedback similarly to helpless individuals in the conceptualization of Dweck and
Leggett.
Summary
As these studies suggest, while amotivation can assume a state manifestation, as
well as selective or general trait appearance, most studies in educational settings focus on
motivation orientations for academic tasks and represent substantial consistency in
conceptual and operational definitions. Empirically and conceptually, this strain of
motivation has been closely bound to perceived lack of control and lack of competence as
antecedents which yield a lack of intention to engage in a given task. Regarding the
potential of amotivation to inform an understanding of apathy, in light of
operationalization concerns, further research should distinguish between lack of meaning
or reasons for engaging in an activity and lack of valuing or care for that activity. The
fact that minimal variance in motivation is explained by the amotivation factor relative to
the other SDT factors suggests that measurement and conceptual problems may also need
addressing.
Amotivation is associated with several variables salient to academic tasks.
However, the majority of studies have been conducted with college students. Thus among
48
directions for further research are studies that target students in younger grades. This
extension of the research may necessitate refinement of measures for use with younger
participants. Evidence of antecedents and consequences suggests that longitudinal studies
are appropriate to better understand the development of an amotivation orientation. Given
that some support was found for the relation of context to motivation, additional research
linking motivation to classroom environment is warranted. Findings from these studies
suggest similarity to other constructs such as learned helplessness or low self-efficacy.
Thus, future investigations into the overlap and unique contributions of constructs in
service of a more parsimonious and practically informative understanding of apathy in
adolescents are also necessary.
Boredom Proneness
Focused on affective state rather than on observable behavior, boredom has been
defined as a state of relatively low arousal and dissatisfaction (Mikulas & Vodanovich,
1993). In addition to a state definition that attributes boredom to an inadequately
stimulating environment, researchers have examined boredom proneness as a individual
trait (Harris, 2000; Vodanovich & Kass, 1990). Early work on boredom led to the
development of the 28-item Boredom Proneness Scale (BPS; Farmer & Sundberg, 1986).
Subsequently, Vodanovich and Kass (1990) examined the factor structure of the BPS
and, consistent with prior research, found evidence of a five-dimensional construct. The
first two factors reflect state-trait dimensions, with External Stimulation (state)
representing the influence of environment or situational characteristics on boredom, and
Internal Stimulation (trait) capturing an individual’s ability to stay interested and
entertained. The five factors extracted in exploratory factor analysis accounted for 43%
49
of the variance, with the first two alone explaining 29%, suggesting that additional
dimensions are not strong aspects of boredom proneness.
Using the BPS, Shaw and colleagues (Shaw, Caldwell, & Kleiber, 1996; Shaw,
Kleiber, & Caldwell, 1995) found that adolescent boys in a working class Ontario school
who reported boredom at school were also more likely to report it at home. They also
found that boredom differed by subject matter as well as teaching style. Taken together,
these findings tell a complex story, in which individual and group differences play out
across contexts, while context, defined by subject matter and teaching style, also exerts
influence on individuals’ boredom levels. Moreover, these researchers also found that
boys reporting more boredom also reported higher levels of stress.
In the context of a broader study of adolescent experience, Sax, Lindholm, Astin,
Korn, and Mahoney (2001) found that over 40% of a national college freshman sample
reported frequently feeling bored in class during their senior year of high school. This
trend appears to follow students into college. Harris (2000), investigating correlates of
boredom and boredom proneness, reported that in an open-response question format, over
a third of college students surveyed identified classes/lecture as a cause of boredom.
Harris also examined the relation between boredom proneness and tendency to
experience flow, finding support for the hypothesized negative relation between the two.
Examining relations between psychosocial development and boredom proneness using
BPS scores among college students, Watt and Vodanovich (1999) found support for their
hypothesis that boredom proneness was significantly and negatively correlated with four
measures of psychosocial development adapted from Chickering’s vectors: establishing
50
and clarifying purpose; developing autonomy; mature interpersonal relationships; and
salubrious lifestyle (Chickering, McDowell, & Campagna, 1969).
Overall, theoretical and empirical articles conceptualize boredom as an unpleasant
state associated with dissatisfaction. From an optimal arousal perspective, it is assumed
that individuals attempt to increase levels of stimulation in order to escape the state of
boredom (Harris, 2000; Mikulas & Vodanovich, 1993). Given the associated experience
of negative affect and increased activity in response to boredom, it is fair to conclude that
this construct does not represent a close synonym to apathy, which on the contrary would
be characterized by a lack of affect.
Nevertheless, data indicating high levels of boredom reported for class time
suggest that there is room for enhancing features of classroom context that foster positive
affect. Research that teases apart the differences in student and teacher characterizations
of boredom in comparison to apathy would shed light on the conceptualizations of each
construct and allow for research into their temporal relation. For instance, boredom may
precede apathy, particularly when elicited by environmental rather than individual
characteristics, in which the individual decides to reduce the discomfort of low
stimulation by toning down the value of stimulation. Thus longitudinal and carefully
designed experimental studies may reveal whether extended exposure to non-stimulating
environments fosters apathy.
Disengagement
Across multiple studies, disengagement is consistently defined in terms of low or
decreasing participation in mandatory as well as extracurricular school activities, such
that total disengagement coincides with school dropout (Fredricks et al., 2004). Although
51
much diversity exists among dropouts, common manifestations include truancy, course
failure, and credit deficiency toward graduation prior to dropping out. Concern over
dropout rates has prompted investigations into antecedent behaviors collectively labeled
disengagement.
Rather than designing specific measures of disengagement, sets of variables
theoretically justified to indicate disengagement are typically used in this area of
research. To capture the complexities inherent in explaining and predicting
disengagement, some researchers adopt a person-context-process perspective.
Failure for most students is better seen as a process of mutual rejection by
the student and the school. This mutual rejection develops from an
interaction of a number of conditions, some of which are characteristics of
the students, but others are institutional characteristics. Disengagement
from school should be seen as an interactive process rather than as some
fundamental mental inability or social flaw in the backgrounds of students.
(Wehlage, 1989, p. 58)
Wehlage (1989) categorizes the problems of engagement in modern schools
according to achievement and reward disjuncture, a narrow conception of school
learning, and vast content coverage in a superficial, trivial curriculum. However, the
research necessary to document such claims is daunting, and the literature reflects this in
that most studies are simpler investigations of particular elements of these processes and
interactions. For example, Verkuyten and Brug (2003) investigated disengagement in
terms of educational performance, perceived discrimination by teachers, and
diagnosticity of feedback. Although levels of disengagement were comparable across
52
their sample of Dutch adolescents, the processes differed, with perceived discrimination
playing a larger role for ethnic minorities than for majority students.
The transition to high school was found to engender increased disengagement
among students in a low-income urban population in the United States (Seidman, Aber,
Allen, & French, 1996), as evidenced by reports of decreased extracurricular
involvement, decline in perception of social support from school personnel, and slight
increase in perceived academic demands and hassles encountered in school. Interestingly,
no gender or ethnicity interactions were found in this study, although other studies have
found gender differences in changes accompanying school transition (Stipek, 1996;
Wigfield & Eccles, 2002).
Roderick and Camburn (1999) found a strong relation between 9th grade course
failure and school dropout, concluding that many students do not recover, particularly
given the declines in student school performance, involvement and perceptions of quality
of school environment over the transition to high school. Repeating a grade has also been
found to increase the likelihood of dropping out, even after differences in background,
grades following retention, and attendance were taken into account (Roderick, 1994). The
researcher attributed this finding to the over-age of students held back a grade.
Citing the substantial research base indicating that premature entry into adult roles
can result in problem behaviors in adolescents, one study examined interrelations among
students’ educational engagement, desired and actual school-year employment, substance
abuse, and other problem behaviors in a sample of 300,000 8th-, 10th-, and 12th-grade US
students from 1992 to 1998 (Bachman, Safron, Sy, & Schulenberg, 2003). Their analysis
revealed that the number of hours students preferred to work each week related more
53
strongly to educational disengagement than did actual work hours, providing another
window into understanding the relation between student employment commitments and
negative behaviors such as school disengagement.
A number of studies have investigated the degree to which characteristics that
emerge early in individuals’ development, such as cutting class and disruptiveness, might
serve as warning signals for future dropout and disengagement. In a qualitative study of
urban high schools (Fallis & Opotow, 2003), students reported cutting class to “avoid
classes they dislike, see as too hard or too easy, or for which they are unprepared; to
avoid particular peers or teachers with whom they are engaged in conflict; to attend to
personal matters; as well as for a variety of other reasons” (p. 104). Fallis and Opotow
argued that cutting class is an antecedent to dropping out of school, through a progression
in which test days are skipped, leading to a decline in grades, course failure, and slowing
of academic progress.
Similarly, Vitaro, Larocque, Janosz, and Tremblay (2001) found that early
disruptiveness and early academic performance predicted dropping out for a sample of
low-SES males followed longitudinally from age 6 to 17. They considered a range of
peer-related variables such as unpopularity/friendlessness and deviant friends within a
developmental model integrating personal (behavioral & academic) and socio-family
(demographic and family practices) variables. On all variables except parental support,
significant differences between dropout and non-dropout students were found. Alexander,
Entwistle, and Kabbani (2001) also found that early predictors were nearly as strong as
late predictors of dropping out, which they perceived as the end point of a long process of
disengagement from school.
54
In sum, research in disengagement reflects considerable consistency in a
behavioral operationalization comprising a set of antecedents, and findings suggest that
once a disengaged individual is identified, it is possible to trace the warning signs back to
the early years. Documentation of these warnings signs would allow for early
interventions that avert deleterious outcomes. However, prediction remains more elusive,
as antecedents are more properly characterized as risk factors. A process approach is
advocated by several researchers to take into consideration the wide range of nested
influences that may interact to produce varying levels of disengagement.
Regarding the potential link to apathy, disengagement may be the consequence of
a process that initiates with emotional and cognitive features of apathy bound to both
individual and socioenvironmental factors and develops into a behavioral manifestation
which in extreme forms leads to dropping out of school. Longitudinal research is
necessary to establish a temporal sequence linking apathy and disengagement, however
cross-sectional investigations represent an initial step in this direction by identifying
whether relations are present between disengagement and apathy. The work of
researchers such as Finn and colleagues (e.g., Finn & Owings, 1994; Finn & Rock, 1997)
on relations between family and social variables and engagement serves to inform this
research goal.
Learned Helplessness
The large body of literature describing the motivation orientation “learned
helplessness” reflects considerable consistency across conceptual definitions. Linked to
reasons students give for failure at academic tasks, learned helplessness refers to the
repeated attribution of stable, internal causes for failure, such that individuals perceive a
55
noncontingency between their actions and outcomes (Burhans & Dweck, 1995; Peterson,
1992). Learned-helpless individuals display reluctance to attempt work, do not engage in
opportunities to improve cognitive abilities, such as practicing, and often experience
affective problems as well such as depression, anxiety, and listlessness (Alloy &
Seligman, 1979).
Learned helplessness has received much attention in the literature, possibly
because it is a target of interventions such as attribution training and has also been shown
to relate to a set of affective, cognitive, and motivational deficits. Peterson (1992) linked
learned helplessness to underachievement and absenteeism. Boggiano et al. (1992)
integrated intrinsic motivation, as described by self-determination theory, with learned
helpless research to propose a model in which “frequent and repeated exposure to
controlling techniques would have dramatic and far-reaching effects on the formation of
maladaptive achievement patterns in students” (p. 274). Support was found for this
model, even after covarying out prior achievement scores. Further, support was also
found for the hypothesis that the performance of students with an extrinsic motivation
orientation declines when they are repeatedly exposed to failure coupled with teachers’
controlling strategies. In contrast, students with an intrinsic motivation orientation are
likely to thrive when faced with teachers’ evaluative or controlling feedback in a failure
situation.
Drawing on Dweck’s research into the relation between motivational orientation,
ability beliefs (e.g., fixed, malleable), and performance situation behavior patterns, Dresel
(2001) longitudinally studied 6th-to 9th-grade college preparatory students in Germany
over an academic year. Start-of-year measures of academic self-concept (ASC),
56
performance orientation interaction with ASC, learning orientation, and the learning
orientation interaction with ASC accounted for over half the variance in start-of-year
internal stable failure attributions. In contrast, end-of-year measures were able to account
for slightly more than a quarter of the variance in internal stable failure attributions.
Further, in data pooled from all three years, students who started the year with an
incremental view of talent tended to change to an entity view, whereas those starting with
entity view tended to remain stable.
In a two-year longitudinal study of Midwestern United States (rural) students in
grades 3 to 5, Fincham, Hokoda, and Sanders (1989) examined the relation between
learned helplessness, test anxiety, and academic achievement. Based on student data on
test anxiety and helplessness measures in 3rd and 5th grades, as well as on teacher reports
of learned helplessness and mastery orientation in both years, these researchers found that
both self-report and teacher-report measures of helplessness were stable over the two
years. Further, helplessness in 3rd grade significantly predicted academic test scores in 5th
grade.
Based on 14- and 15-year olds’ self-report measures of failure expectations, active
task avoidance, passive task avoidance, lack of self-protecting attribute and bias, Määttä,
Stattin, and Nurmi (2002) identified six student clusters (i.e., optimistic, defensive
pessimist, slightly functional, slightly dysfunctional, self-handicapping, and learned
helplessness). The researchers performed MANOVAs to test for evidence of theorized
differences across clusters in well-being and outcome measures (i.e., self-reports of
depression, self-esteem, norm-breaking behavior, school adaptation, teacher relations and
teacher-reported school achievement). Notably, on the school adjustment variables, the
57
learned helplessness and self-handicapping groups reported lower levels of teacher
relations than any other group. This could be a function of a process in which the student
does not respond to teacher interactions, resulting in increased teacher frustration and a
concomitant diminution in attention to the student which is then perceived in terms of
low teacher-relationship quality. Gender differences emerged as well, with girls in the
learned helplessness and self-handicapping groups reporting higher depression than girls
in any of the other groups. Overall, the girls’ level of depression was higher than that of
boys, and their level of self-esteem was lower than that of boys.
Across these studies, learned helplessness is seen as a persistent trait resulting
from repeated failure and the perception of non-contingency of behavior on academic
outcomes. As noted, learned helplessness appears to be conceptually close to
amotivation. Regarding the potential for this construct to inform an understanding of
apathy, Brophy (2004) suggests a distinction between learned helpless and apathetic
learners in terms of the value they place on learning. Whereas learned helpless students
typically consider learning important and would like to be academically successful,
apathetic learners are simply uninterested and possibly alienated from the learning that
takes place in schools.
This interpretation echoes the work of Eccles, Wigfield, and colleagues on
expectancy-value theory (e.g., Meece, Wigfield, & Eccles, 1990; Wigfield & Eccles,
2000), according to which motivation to act results from the product of an individual’s
expectancy for success in an activity and his or her value for that activity and success in
it. If either is zero, the product, motivation, also assumes a zero value. Thus low
motivation due to learned helplessness would be akin to zero expectancy whereas apathy
58
may be more closely bound to value. This raises the theoretical issue—taken up in the
conclusion—of the relation between apathy and lack of value.
Work Avoidance
Goal orientations, particularly the work avoidant orientation first identified by
Nicholls and colleagues (1985), also have potential to inform an understanding of apathy.
Extending achievement goal theory, which posits that learners engaged in similar
academic tasks may be pursuing dissimilar goals associated with qualitatively different
strategy use and persistence, goal orientations categorize individuals’ enduring academic
goal pursuit tendencies (Dweck & Leggett, 1988). Early research identified two primary
goal orientations distinguishing between students seeking mastery of content, labeled a
“task,” “mastery,” or “learning” orientation, and students aiming to appear competent,
referred to as “ego” or “performance” orientation (Ames & Archer, 1988; Nolen, 1988).
Subsequent investigations suggested that among those with performance goals,
some students may be aspiring to appear successful (performance-approach orientation)
whereas others may simply attempt to avoid looking unsuccessful or unable
(performance-avoid orientation; Elliot & Church, 1997; Elliot & Harackiewicz, 1996;
Middleton & Midgley, 1997). The work avoidance orientation was identified to describe
students who consistently put forth as little effort as required to get by academically
(Meece et al., 1988; Meece & Holt, 1993; Nicholls et al., 1985).
Measures
Multiple measures have been developed to tap a set of goal orientations
comprising work avoidance. Meece and colleagues (1988) assessed work avoidance with
items such as “I wanted to do as little as possible” and “I wanted to do things as easily as
59
possible so I wouldn’t have to work very hard.” Several studies have based work
avoidance composite scores on the Nicholls et al. (1985) measure, which tapped work
avoidance with three items asking participants when they feel most successful (e.g.,
“[when] I get out of work;” “[when] work was easy;” or “[when] I score high without
studying”). Similarly, work avoidance items on Skaalvik’s (1997) measure include “I like
school best when there is no hard work” and “At school I like to do as little as possible.”
Smith, Duda, Allen, and Hall (2002) made minor modifications to the Nicholls et
al. measure for use with university students (e.g., “In my university classes I like to do as
little as possible”). Items tapping work avoidance on a personal goals measure used by
Cobb et al. (1991) closely parallel those on other measures (e.g., “I feel really pleased in
math when I don’t have to work hard”). As these sample items illustrate, the
operationalization of work avoidance remains quite consistent and thus allows for
comparisons across findings.
Related Findings
The present review identified 13 goal-orientation studies focused on work
avoidance. Most frequent statistical approaches were either exploratory or confirmatory
factor analyses, run on a set of items representing multiple goal orientations, to support
the existence of distinct and mostly independent dimensions. Notably, evidence of similar
goal-orientation patterns has been found among samples in several countries (e.g.,
Albaili, 1998; Riconscente & Maggioni, 2004). Cluster analyses have also been
performed based on a multivariate goal orientation composite, to allow patterns to
emerge from the data rather than restricting participants to one primary orientation
(Meece & Holt, 1993; Seifert & O’Keefe, 2001). Beyond investigating the presence of
60
independent goal orientations in students, many studies explored associations between
goal orientation composite scores and other variables germane to the learning process.
Strategy use. Variables related to learning strategies have been investigated in
relation to goal orientations. Based on self-report data gathered from a sample of 5th and
6th graders, Nolen (1988) tapped both general and task-specific motivational orientations,
and found significant negative correlations between both general and task-level work
avoidance and task-specific use of deep processing strategies. General work avoidance
was also negatively associated with students’ general value of deep processing strategies,
whereas task-level work avoidance negatively related both to task-specific valuing of
deep processing strategies and to task-specific use of surface-level strategies. In
particular, although a task orientation was associated both directly and indirectly with
deep-processing strategy use, neither perceived strategy value nor perceived ability
strongly predicted deep-processing strategy use.
A related finding was reported by Meece and Miller (2001) in analyses of
longitudinal data from elementary school students, whose changes in task-mastery scores
explained additional variance in reported active learning strategy ratings and superficial
learning scores beyond that associated with achievement level and prior strategy rating
assessments. Meece and Holt’s (1993) cluster analysis of data from 5th and 6th graders
identified three clusters, with highest work-avoidance scores found in the same cluster
posting the highest use of effort-minimizing strategies and lowest use of active-learning
strategies.
Among older students, Smith et al. (2002) found a significant negative correlation
between work avoidance and effort regulation ratings (r=-.44) reported by college
61
students. Similarly, Somuncuoglu and Yildirim (1999) found that the work-avoidant
orientation was negatively correlated with deep cognitive and metacognitive strategy use
in a sample of Turkish undergraduates. However, in analyses of data from gifted
elementary and high school students, Neber and Schommer-Aikins (2002) reported no
significant correlations between goal orientations and reported strategy use.
Intrinsic motivation and interest. Multiple studies have found negative relations
between work avoidance and intrinsic motivation or interest. Thorkildsen and Nicholls
(1998) found that work avoidance associated negatively with interest and effort beliefs
and positively with extrinsic elements as sources of success. Mathematics-specific
measures of goal orientations found work avoidance strongly and negatively correlated
with intrinsic motivation (Skaalvik, 1997). Examining relations between work avoidance
and the SDT regulatory styles, Smith et al. (2002) found moderate correlations with
dimensions of intrinsic motivation (Vallerand et al., 1992, 1993), as well as with the
extrinsic motivation dimensions “identified” and “introjected.” Not surprisingly, work
avoidance was significantly and positively correlated with amotivation. A significant
though weak correlation was also found between work avoidance and interest by
Harackiewicz et al. (1997). In a related finding, Thorkildsen and Nicholls found a strong
negative relation between undergraduates’ satisfaction with learning and work avoidance.
Individual differences and beliefs. Harackiewicz et al. (1997) tested a model of
personality influence on final grades mediated by goal orientation and found that while
work avoidance and performance goals were endorsed by highly competitive students,
individuals high on work mastery were less likely to adopt work avoidance goals.
Skaalvik (1997), reporting on two regression studies examining associations between
62
composites from a four-factor goal orientation structure and several self-beliefs (e.g.,
self-concept, self-esteem, self-efficacy), found work-avoidance related negatively to
academic self-concept and positively to anxiety in native language class. Similarly, Smith
et al. (2002) found support for a weak but significant positive relation between test
anxiety and work avoidance.
Ability. Empirical evidence suggests that individuals high on work avoidance
either perform more poorly than their peers or perceive themselves as having low ability.
In a longitudinal study by Meece and Miller (2001), elementary school students with
below average achievement scores in language arts and reading reported the highest work
avoidance and performance goals for classroom literacy activities. Thorkildsen and
Nicholls (1998) reported a negative correlation between work avoidance and perceived
ability. Similarly, in a sample of college students, Smith et al. (2002) found a significant
and moderate negative correlation between work avoidance and perceived ability. Using
cluster analysis on data obtained from college students, Seifert and O’Keefe (2001) found
that lack of confidence and control, as well as lack of perceived meaning, was associated
with work avoidance. However, this study did not include measures of performance or
ego orientations, which may have artificially boosted the amount of unique variance
explained in this relation.
Longitudinal and intervention trends. Findings regarding variations in work
avoidance over time paint a conflicting picture. Although Meece and Miller (1999) found
changes in literacy-related work avoidant goals in a longitudinal study of students from
3rd to 5th grade, the direction of change was not consistent across grade levels. In a
sample of gifted students from elementary and high school grades, Neber and Schommer-
63
Aikins (2002) found significantly stronger work avoidance in older students. In a related
finding, Cobb et al. (1991) reported no differences between experimental and control
groups on work avoidance or task orientations; however, the experimental group reported
significantly less ego orientation than did the control group following the intervention.
Meece and Miller (1999) tracked student data over a one-year intervention study
targeting instructional practices and found that the work avoidance of low achievers in
high implementation classrooms declined significantly.
Gender differences. Evidence from a number of studies suggests that boys
experience higher levels of work avoidance than do girls. In one cohort of a longitudinal
study following students from third to fifth grade, boys reported significantly higher work
avoidance than did girls (Meece & Miller, 2001). In cluster analysis of data from middle
school students, boys were disproportionately represented (61%) in the cluster with
highest work avoidance (Meece & Holt, 1993). On the contrary, Neber and Schommer-
Aikins (2002) found science-related ego orientation higher for females than for males but
no gender differences for work avoidance or task orientation.
Contextual factors. Some studies suggest that contextual factors play an important
role in fostering the adoption of different goal orientations. A statistically significant
disproportionate number of cases in the high work avoidance cluster were associated with
two particular teachers in one study (Meece & Holt, 1993). Harackiewicz and colleagues
(1997) found an instructor interaction effect on level of reported interest following a
semester-long college course, although there were no significant differences by instructor
with respect to goals or individual differences measures. Further, a multinational study
found that while a four-factor structure emerged in independent analyses of data from
64
college students in France, Italy, Taiwan, and the United States, significant differences
were found in between-country average work avoidant ratings, suggesting that cultural
context may play an important role in fostering variations in goal orientations
(Riconscente & Maggioni, 2004).
Summary
In conclusion, a large body of research on work avoidance consistently
operationalizes this construct by self-reports of minimizing effort for academic tasks,
lending support to the theory that some students have set the academic goal of getting by
with as little effort as possible. This general orientation to academic tasks, manifested in
students from elementary school through college, is related to maladaptive beliefs and
behaviors such as low perceived ability, minimal use of effective strategies, and low
levels of intrinsic motivation. Some findings indicate that contextual factors may exert
influence on the goals students tend to adopt, and that boys are more likely to adopt work
avoidant goals than are girls.
The distinction between performance-avoidance and work avoidance may be due
to different underlying processes, with low perceived ability leading to performance-
avoidance and low value for academic tasks giving rise to work avoidance (Seifert &
O’Keefe, 2001). However, the interplay of perceived ability and task value makes this a
difficult relation to tease apart. The finding that amotivation relates strongly to work
avoidance suggests that perceived lack of control and competence may contribute to
students’ orientation to eschew hard work in academic settings. These results are
consistent with SDT hypotheses that controlling teacher-communication styles are
important in understanding motivational outcomes in students.
65
With respect to apathy, students who care about their performance, even if not
about the content, are not operating in the absence of emotion or cognition. In a
qualitative inductive investigation, Dowson and McInerney (2001) found behavioral,
affective, and cognitive dimensions of middle-school students’ work avoidant goals.
Although the construct operationalization and research findings, taken together, suggest
that work avoidant students behaviorally exert little effort, cognitively set non-goals, and
appear emotionally removed from the learning process, it is not clear whether they lack
value or hold negative value for school work. Salient to clarifying an apathy construct,
degree of perceived meaning in academic tasks also appears to foster work avoidance and
may relate to apathy for academic tasks (Seifert & O’Keefe, 2001). Finally, although
work avoidance emerges as a dimension distinct from mastery in factor analyses, the high
correlations between these factors suggests that work avoidance may be the absence of a
mastery orientation (Skaalvik, 1997; Thorkildsen & Nicholls, 1998).
Summary of Apathy-Related Constructs
This section reviewed five constructs—amotivation, boredom proneness,
disengagement, learned helplessness, and work avoidance—with potential to inform an
understanding of apathy. Several salient considerations emerge from the theoretical and
empirical work conducted with these constructs. Importantly, research suggests that
boredom, amotivation, or disengagement may arise in part from the absence of a key
motivation ingredient other than student valuing or feeling for an activity or topic, such
as sense of competence or control. That is, individuals may value, and thus not be
apathetic, about learning, but may adopt maladaptive orientations such as learned
helplessness or work avoidance as consequences of contextual aspects or self-beliefs.
66
In examining amotivation, it became evident that further research is needed to
distinguish between lack of purpose or meaning and lack of value, perceived competence,
and contingency of behavior. Further, although amotivation has been found to correlate
with learned helplessness and work avoidance orientation, distinctions remain. Whereas
learned helplessness is bound to a sense of noncontingency, amotivation may result from
lack of intention to act due to lack of purpose. Empirical findings indicate a weak to
moderate relation between work avoidance and amotivation, supporting the relative
independence of these constructs. Moreover, additional research is necessary to
understand how work avoidance emerges in students, particularly given some evidence of
increased work avoidance over time.
One key to understanding the relation between these constructs is the fact that
amotivation deals with how individuals pursue goals, not the content of the goals
themselves. Work-avoidance, in contrast, focuses on the content of goals theorized to
exert influence on their pursuit. The role of goal content in energizing and directing
human behavior has long been the focus of research and theory (Ford & Nichols, 1987).
Wentzel is among those who have investigated the role of goal content both empirically
and theoretically. Her work has documented that the pursuit of multiple goals in the
classroom contribute positively to students’ academic performance (Wentzel, 1993). This
study and others underscores the importance of examining goal content as well as the
contextual and social variables that may interact in complex ways with students’ goals to
elicit a range of observable outcomes (e.g., Wentzel, 1989, 1993, 2000; Wentzel,
Weinberger, Ford, & Feldman,1990).
As discussed, boredom involves negative affect rather than lack of affect and
67
therefore does not appear to be synonymous with apathy. However, long-term boredom
may herald impending apathy. Similarly, disengagement has been operationalized in
primarily behavioral terms, suggesting that it may be a consequence or symptom, rather
than synonym, of apathy.
Evidence from studies addressing a range of apathy-related constructs suggests
that contextual factors elicit variations in motivation states and may also play a role in the
adoption of persistent orientations or traits. Student relationships with parents and
teachers offer promising avenues for potential interactions between individual and
contextual variables and motivation.
Issues for Future Research
The present review provides a foundation for investigations that further define
and document apathy in educational settings. Five apathy constructs were identified, and
from these several issues emerged, including the state-trait distinction and
operationalizations spanning behavioral, cognitive, or emotional dimensions. A range of
contextual factors, including teacher communication style and school setting, were
repeatedly found to relate differentially with apathy constructs. Additionally, the
literature reflected substantial (although not unanimous) agreement that apathy is
maladaptive and associated with a host of negative consequences for learning and
development, as in the case of adolescent apathy, amotivation and work avoidance.
Extending the review to five apathy-related constructs illuminated potential
conceptualizations of apathy and its correlates in the academic realm, with emphases
again varying along behavioral, cognitive, and emotional lines.
68
Defining Apathy
Results of the present review suggest that additional research is necessary to
confirm whether apathy toward school has been adequately conceptualized as an existing
construct or is still at large. In the case of the former, bringing all the contestants
simultaneously onto the playing field will afford the possibility to examine the degree of
independence of each construct. For both alternatives, methodologies that gather
descriptions of apathy from teachers and students will allow for comparison of
operationalizations as well as for the emergence of additional conceptualizations.
Toward Greater Parsimony
Specifically, five of the constructs reviewed demonstrated strong potential for
denoting apathy, namely adolescent apathy, amotivation, disengagement, apathy
syndrome, and work avoidance. Therefore an essential issue to resolve with additional
research is the independence and validity of these conceptualizations. Construct
independence can be determined via statistical analysis of quantitative data generated by
measures of each construct, whereas construct validity should be assessed by tapping
theoretically similar and dissimilar variables to establish criterion validity. Moreover,
qualitative research unconstrained by a priori assumptions is in order to either confirm
existing operationalizations or offer additional theoretical definitions of apathy (Dowson
& McInerney, 2001).
Among the issues to address in establishing a definition of apathy is its
manifestation as state or trait, or, alternatively, in terms of processes. It is conceivable
that both expressions are in play, with a trait-like dimension evolving from repeated
instantiations of an apathy state. It is also critical to ascertain the incidence of apathy.
69
That is, notwithstanding the frequent references to apathy noted in the present review,
what proportion of individuals can be considered apathetic? Related definitional
questions include whether apathy is a general condition or bound to specific domains,
tasks, or contexts.
Working with a Folk Term: Lessons from the Case of Alienation
Work with a term that often appears in common parlance poses a particular
challenge to researchers, as illustrated by the case of alienation. The last few decades
witnessed the attempts of sociologists and psychologists to free the term alienation from
the many folk definitions which thwarted efforts to assign it a precise meaning and
operationalization (Seeman, 1959; Wegner, 1975). Although some abandoned the fight
(consider Lee’s 1972 article, “An Obituary for ‘Alienation’”), others have attempted to
resurrect the construct, even applying it to education (Lacourse, Villeneuve, & Claes,
2003; Mau, 1992; Williamson & Cullingford, 1997). Nevertheless, a pervasive lack of
semantic clarity has prevented the term alienation from making a substantial contribution,
as underscored by Williamson and Cullingford (1997): “Despite (or perhaps due to) its
widespread usage across a number of disciplines, there has been a failure to reach a
consensus on even its most basic aspects” (p. 263). Given the small number of peer-
reviewed articles and lack of clear conceptual definitions used in those studies, alienation
was not included as an apathy-related construct in the present review.
The present study stood to gain from the life history of alienation. First,
specifying the construct as school-related apathy rather than apathy writ large constrained
the problem space and increased the likelihood of crafting a common conceptualization.
Second, incorporating teacher and student perspectives and verbiage into the
70
operationalization of school-related apathy bolstered consistency between folk and
research-based definitions. Finally, including concise definitions, both conceptual and
operational, when writing about school-related apathy contributed to clarity and a shared
understanding of the term.
Additional Theoretical Considerations
Theoretical analysis can inform research designs capable of detecting alternative
conceptualizations of apathy. One candidate for a definition of apathy that can be drawn
from this review is absence of value. Lack of value is comprised in the conceptualization
of amotivation forwarded by self-determination theory, and Brophy (2004) identified
value as distinguishing learned helplessness from apathy. The role of value in motivation
is also highlighted in expectancy-value theory (Wigfield & Eccles, 2000), which casts
motivation as the product of the expectation one has for success and the value placed on
success in that activity. Both knowledge and value of a specific subject are considered
central to the construct of individual interest, with the personal meaning attributed to a
particular subject reflected in the stored-value aspect of individual interest (Boekaerts &
Boscolo, 2002; Renninger, Ewen, & Lasher, 2002).
In weighing the potential of value (or the lack thereof) to delineate apathy, an
additional question arises: For what are individuals motivated? Most approaches to
motivation in educational settings, including the constructs described herein, reflect an
emphasis on learning or achieving (Brophy, 1983; Eccles, Wigfield, & Schiefele, 1998;
Stipek, 1996, 2002). In this case, apathy could take the form of lack of value for learning
or achievement. An alternative conceptualization casts learning as a means to relationship
with specific aspects of an individual’s reality (Hunter & Csikszentmihalyi, 2003). This
71
distinction is particularly salient in school contexts, where the emphasis tends to be on
the activity of learning rather than on interest in a particular object or activity
To experience interest, by definition, implies that one is interested in
something. Interest does not occur without a referent, whether it might be
the attractive person standing across the room from me, or the fascinating
book on the bestseller list. This necessarily means that to facilitate
experiencing interest I must grapple with my reality in a way that
somehow affects it....Interest requires action. (p. 33)
In other words, action is integral, but not (necessarily) prior, to interest.
Consistent with this perspective, apathy would entail lack of valuing of some object or
content, with learning valued not per se but rather as the process by which a valued
object is grasped, or internalized. The first “action” of interest indicated by Hunter and
Csikszentmihalyi may thus consist in being moved, allowing one’s awareness to conform
to an aspect of reality.
In this vein, Wolters (2003) posed the distinction between motivational products
(i.e., a state of being interested or having a goal) and processes (i.e., the means by which
the motivation product is instantiated). Similarly, Corno (1993, 2004) individuates
motivation and volition, with motivational processes leading to goals, needs, or desires,
and volition describing the implementation of intention. Moreover, self-determination
theorists as well as goal theorists differentiate the content of goals from how they are
pursued (Deci & Ryan, 2000; Dweck & Leggett, 1988; Martin & Ford, 1987; Wentzel,
2000).
72
Further reflection on the process-product heuristic suggests another formulation
of apathy as catalyst, situated at the pre-motivation stage and involved in triggering
processes by which individuals choose or establish goals and subsequently assume
regulatory or goal pursuit styles. Examination of the etymology of apathy proves useful
here, as the prefix “a” indicates “without” and the root “pathy,” from pathos, denotes
“feeling,” “suffering,” or “experiencing”. Similarly, the etymology of “affect” harkens
back to affectus, meaning “touched or influenced by.” Implicit in this approach is an
assumption that being moved is indicative of psychologically healthy adaptation. As
Furtak (2003) notes, “The attainment of complete apathy is fundamentally at odds with
our distinctively human tendency to form attachments to the world: such involvement
with mundane reality disposes us toward pathos, that is, toward being moved or affected”
(p. 123). Apathy may thus be conceptualized as absence of being moved, which would
locate the construct in the emotional dimension.
Another, related, possibility is that apathy constitutes a refusal or resistance to be
influenced or touched by external events. Since this conceptualization involves a
decision, it would therefore draw on cognitive as well as emotional aspects of experience.
That is, rather than merely a blunting of emotional responses, apathy may be the
suppression of the evaluative acceptance of being moved that people, events and objects
elicit in individuals (Giussani, 2000, 2001). Curiously, this definition potentially responds
to calls in both the psychological research and philosophical literatures to link the
cognitive and affective dimensions of experience (Arendt, 1981; Zembylas, 2005).
Spanish philosopher Maria Zambrano used razón poética [poetic reason] to describe
affective consciousness (Johnson, 1996; Perez, 1999). Similarly, Stein (1969) wrote that
73
“feeling, understood as mood, and perceiving, in which the model is seeing, are co-
primordial in conceiving of man’s relation to the world… if one did not see or perceive,
the world would not appear, and, if one did not feel at least alive, he himself would not
appear as the subject of experience” (p. 748). Giussani (1997) engages a compelling
metaphor to describe the integrated roles of cognition and emotion in the knowledge
construction process.
Let us imagine for a moment that we are on vacation in a valley high in the Alps.
…It is a splendid day. I take out a pair of binoculars and try to look around, but I
cannot see a thing. Everything is dark and opaque. Then I focus the lens and am
presented with an exceptional panorama, so clear that I can even make out some
people skiing on the highest mountain around. The lenses of the binoculars are not
made to block my view or make it more difficult to see, but to make it easier. So
how do they do this? By, so to speak, carrying the mountain closer to the pupil of
my eye, so that the “seeing energy” of my eye, if you will, grasps it more easily.
…it is as if the lens brought the objects closer so that the visual energy of my eye
can “seize” them.
This can serve as an analogy for the problem that concerns us here.
Let us imagine f, or feeling, as a kind of lens; the object is carried closer to
a person’s cognitive energy by this lens so that reason can know it more
easily and securely. The f is, therefore, an important condition for
knowledge. Feeling is an essential factor for seeing—not in the sense that
it itself sees, but in the sense that it represents the condition by which the
eye, or our reason, sees in accordance with its nature. (p. 28)
74
Within this framework, apathy as a decision not to be moved would constitute a
derailing of reason by disconnecting affect and cognition, thus impeding the individual’s
ongoing relationship with reality, with maladaptive consequences for motivation products
and processes. That is, by refusing to be moved by an object or issue, an individual’s
level of awareness remains fixed, closed to incorporating knowledge of that object. In
contrast, learning something new requires allowing one’s awareness, or knowledge-base,
to be affected by the newly encountered aspect of reality (Giussani, 2000).
Individual and Group Differences in Apathy
The present review identified a number of individual differences shown to
associate with apathy and apathy-related constructs. These include well-being, distress,
academic achievement, classroom context, quality of teacher-student relationship, and
instructional style. Thus research that brings clarity to the definition of apathy should also
seek to assess its relation to a number of individual difference variables. Clearly, an
important variable tied to school-related motivation is academic achievement. Gender
also represents an important correlate, in terms of incidence and form of expression. In
addition, aspects of psychological health related to school and to conceptualizations of
apathy represent worthy correlates to examine. Such variables include curiosity and
interest, boredom proneness, contentment, life satisfaction, and purpose in life.
In the present study, individual differences in boredom proneness, curiosity,
distress, and well-being were examined in relation to the five school-related apathy
constructs retained for analysis. These variables were selected based on prior research
documenting their associations to school-related outcomes. Moreover, inclusion of these
indicators was grounded in a theoretical rationale, shared by several of the studies
75
presented herein, that important outcomes of formal education entail much more than
academic achievement as tapped by GPA or standardized testing. Rather, the
development of positive attitudes toward both learning and the content of schooling
constitute essential elements of a quality education.
Research on curiosity and learning dates back several decades. Berlyne (1954)
was among the first to scientifically study curiosity in humans. Day (1968) found that
students’ specific curiosity was weakly related to academic achievement of students in
grades 7 to 9. Dimensions of curiosity (e.g., manipulatory, conceptual) have been
associated with first graders’ probability-learning strategies (Kreitler, Zigler, & Kreitler,
1984). More recently, curiosity has been studied in relation to interpersonal closeness
(Kashdan & Roberts, 2004 ), the pleasure of learning (Litman, 2005), and job
performance (Reio & Wiswell, 2000).
Distress has been associated with a range of characteristics with relevance to
students’ school experiences. Erikson and Steiner (2003) found that higher levels of
distress were related to lower overall adjustment in a sample of non-clinical high school
students. A study of undergraduates’ narrative memory found that memory content and
affect predicted perceived distress (Blagov & Singer, 2005). Those reporting higher
distress also tended to remember events consistent with their negative mood. Wentzel and
colleagues (Wentzel, Weinberger, Ford, & Feldman, 1990) found that distress contributes
negatively to academic achievement via intrapersonal processes. They also traced the
relation of distress to academic achievement through behavioral manifestations of student
efforts to achieve. Weinberger (1998) found that the interaction of high distress and
levels of restraint is associated with negative personality traits and attachment style,
76
DSM-IV disorders, and neurotic or immature primary defenses. Distress has also been
shown to relate to participation levels in research, with high distress relating to lower
participation rates and lower family interview consent (Weinberger, Tublin, Ford, &
Feldman, 1990).
Studies have also related student well-being to school experiences. Obradovic and
colleagues (Obradovic, Dulmen, Yates, Carlson, & Egeland, 2007) called for research on
well-being as a dimension of competence. Valkenburg, Peter and Schouten (2006)
targeted adolescents’ well-being in a study of friend networking Internet sites. In a study
of perfectionism in 9th graders, Stoeber and Rambow (2007) found that well-being was
negatively related to students’ negative reactions to imperfections and suggested that
excessive self-criticism may contribute to lower well-being in students.
Developmental Differences in Apathy
Future research should also identify developmental differences in apathy
with respect to its level of incidence, expression, and correlates. Prior research evidences
marked declines in student motivation across the transition from elementary to middle
school (Wigfield, 1994). However, little research has examined differences between
middle- and high-school students’ motivation (Isakson & Jarvis, 1999; Murdock,
Anderman, & Hodge, 2000). Moreover, much research has been conducted with college
students, with relatively small amounts of data drawn from high school populations.
Several characteristics—such as structure, social and academic norms, and school size—
set high schools apart from middle schools, and may be associated with changes in
student motivation levels (Tomback, 2006). Thus a focus on high school students and
77
differences between high school and middle school levels of motivation both represent
important directions for future research.
The literature suggests declines in GPA and attendance following the transition to
high school (e.g., Gillock & Reyes, 1996; Isakson & Jarvis, 1999). Alterations in
students’ perceptions of self and of the school environment following this changeover
have also been reported. Barber and Olsen (2004) conducted a 5-year longitudinal study
that spanned students’ transition into high school. They found that, compared to their last
year of middle school, freshman high-school students reported that they liked school less,
perceived less teacher monitoring and reduced support from teachers and administrators,
and experienced lower levels of classroom autonomy. Students in their study also
reported less school-activity involvement, lower self-esteem, and higher depression.
Similarly, Gillock and Reyes (1996) reported lower student evaluations of teacher
instruction following this transition. Newman, Lohman, Newman, Meyers and Smith
(2000) reported that students perceived their high school teachers as less supportive and
as setting high standards and demands compared to their eighth grade teachers. However,
a longitudinal study by Murdock and colleagues (2000) yielded differing results, with
freshman high school students reporting more positive evaluations of their 9th grade
teachers’ communication of expectations and values over those of 7th grade teachers. The
ninth graders in their study reported feeling more respected and cared for by teachers than
they did in middle school.
Given findings that students’ perceptions of teacher support are positively
associated with students’ perceptions of school meaningfulness and negatively related to
students’ problem behaviors (e.g., Brewster & Bowen, 2004), the repeated reports of
78
declines in student perceptions of teacher support are cause for concern. For instance,
Roeser, Eccles, and Sameroff (1998) reported positive and supportive teacher-student
relations were found to increase students’ academic values.
There is also evidence to suggest that the relationships between variables undergo
transformations in the passage from middle to high school. Gillock and Reyes (1996)
reported significant changes in the association between teacher authority and GPA and
between students’ perceived teacher relationship and sense of scholastic competence.
Further, the literature on self-concept and other individual variables documents that
differentiation increases with age (e.g., Harter, 1998; Marsh, Craven, & Debus, 1998). On
the basis of this research, it is possible that apathy does not emerge as a distinct
characteristic until older ages, and that domain- or task-specific manifestations become
evident at older ages.
In sum, the extant research suggests that students’ school-related apathy will be
more pronounced in the older grades, and that contextual factors, particularly those
related to the teacher, may be related to this change. One task for future research is to
distinguish developmental changes that operate independently of the school experience,
and those changes in students that are influenced by aspects of school. For instance,
findings in grade-level differences may be due to maturity rather than contextual
difference, as Newman et al. (2000) have suggested. As greater clarity is gained from
research into the meaning of apathy both conceptually and operationally, it will become
possible to examine more carefully the nature of differences that emerge between grade
levels, and particularly across institutional transition points.
79
Conclusion
While the issues raised by the present review were too numerous to be explored in
the present study, several questions were addressed that resolve some issues and establish
a firm basis for additional research. Specifically, the present study clarified the theoretical
and operational definition of school-related apathy in adolescents via a multi-method
approach that compared existing apathy and apathy-related constructs using both
quantitative and qualitative data to establish construct independence and validity and to
identify perspectives not represented in the extant literature. Individual differences on
select variables based on prior research and theoretical considerations afforded analysis
of apathy correlates and potential influence on important educational outcomes. Finally,
by recruiting participants from two grades on either side of the middle- to high-school
transition, the present study captured a snapshot of apathy at different developmental
states that can inform both future research and educational practice.
80
CHAPTER III
METHODOLOGY
Participants
Student participants were 165 8th graders (59.9% female) and 141 10th graders
(58.0% female) enrolled in 16 middle schools and 2 high schools in a geographically
intact segment of a Roman Catholic school district in the northeastern United States. The
target sample size of 160 students per grade level was based on power analysis for
detecting a medium effect size for the statistical methods for means comparisons
employed in this study (Cohen, 1992). Twenty-three 8th-grade teachers and 15 10th-grade
teachers participated in interviews. Data were collected from October to early December
of 2006. It was expected that this timing would yield survey and interview data reflective
of the school year as a whole.
Students
Assent forms and parental consent forms for all students willing to participate
were distributed and collected prior to any data collection. The student forms indicated
two options for participating: survey only or survey and interview. A total of 516 students
received the consent and assent form packets. Of those students, 306 (59.3%) returned the
forms indicating both student and parental permission to participate in the study. Males
represented 41.0%, and females 59.0%, of participants. Seven participating students were
absent on the day of data collection, resulting in 299 full participants, of whom 213
(71.2%) had obtained parental permission, and were also personally willing, to be
audiotaped if selected for an interview. The average age of 8th-grade student participants
81
was 13 years and 2.9 months; 10th graders were 15 years and 2.2 months old on average.
European American ethnicity was reported by 86.1% of student participants.
Since the sample for the present study was drawn from students attending
Catholic schools, it was judged necessary to consider religion and levels of religious
practice to inform the generalizability of results. The majority (89.5%) of participating
students reported being Catholic. This percentage was higher for 8th-grade students than
for 10th-grade students, potentially reflective of older students’ (and their parents’)
decisions to attend Catholic school for academic rather than faith motives. Less than two-
thirds (64.8%) of participating students reported practicing their religion regularly.
Grade-level differences were observed for practice of religion, with just over half
(55.5%) of 10th-grade students and 72.7% of 8th-grade students reporting regular
observance of their religion. All student demographics data are displayed in Table 4.
Student participation rates were compared to school district data for gender,
ethnicity and religion to ascertain whether these variables related to willingness to
participate in the study. In participating schools overall, females (52.8%) outnumbered
males (47.2%). A comparison to study data suggests that females may have been more
likely to participate than were males. Although large differences were not present with
respect to ethnic representation, a higher percentage of minority students participated in
the study than the percentage of minority students reported in official school district data.
This may be due to students’ reporting an ethnicity other than that maintained in official
records and thus may not be a valid indication that participants’ ethnicity differed from
that of students at participating schools overall.
82
Year 1999 and 2000 United States Census data were also consulted for the small
cities and towns from which participants were drawn. These data indicate that the
majority of participating schools were located in small cities with populations less than
100,000 in which Caucasians made up between 75 and 90 percent of population. The
median per capita annual income for these locales was approximately $16,000, roughly
two-thirds that of the county and state. Between 25% and 29% of individuals less than 18
years old in these cities lived below the poverty line. Over one-third of the population in
these cities speak a language other than English at home, and 58% of adults over age 25
have completed high school.
Teachers
Teachers of 8th and 10th-grade students at participating schools were recruited to
be interviewed about student motivation. As an incentive to participate, teachers were
informed that they could receive in-service credit for participating in a workshop at the
conclusion of the study in which results would be shared and discussed. Since students in
participating middle and high schools attended classes taught by different teachers, and
since the present study investigated school-related apathy rather than domain-specific
apathy, no attempt was made to match specific teachers with specific students. Consent
forms were secured from all teachers willing to have their audiotaped and transcribed
responses about student motivation included in the analysis. At one of the two
participating high schools, the principal personally recruited teachers (n=9) to participate,
presumably selecting those believed to be good teachers. Teacher interview data from the
two high schools were examined for differences that might have resulted from this
selection bias. Since the results of this comparison did not suggest systematic between-
83
school differences, analyses were carried out as planned. At all other schools,
participation was open to all teachers who were responsible in some way for instruction
of the relevant grade level.
Of the 38 participating teachers, roughly one-third (28.9%) were male and two-
thirds (71.1%) were female. The majority of teachers (91.9%) reported European
American ethnicity, with more minority representation present at the 10th- than at the 8th-
grade level. Average age of teachers was 40 years and 5 months. Grade 8 teachers had
taught 8th grade for an average of 6.2 years (SD= 8.8); 10th-grade teachers had taught 10th
grade for 6.8 years (SD = 6.8) on average. Sixty-one percent of 8th grade teachers were in
their 5th year or less of teaching at the time of data collection; the same was true for
exactly half of participating 10th-grade teachers. Tables 5 and 6 present teacher
demographic and teaching experience data. As can be seen by comparing these data with
those presented in Table 4, demographics patterns were similar for students and teachers.
All consent and assent forms are included in Appendix M.
Measures
Most of the measures administered in the present study were drawn from prior
research on the constructs described in Chapter II. For these measures, brief descriptions
follow, along with sample items and reliability data obtained in the present study. For
each measure, reliability scores for grade 8 and grade 10 are indicated respectively in
parentheses following the reliability score for the full sample. Fuller explanations are
provided for measures not already reviewed in the previous chapter. All measures were
labeled simply with a form reference letter (e.g., Form A) so that participants’ responses
would not be influenced by form titles. Packets of surveys administered to students were
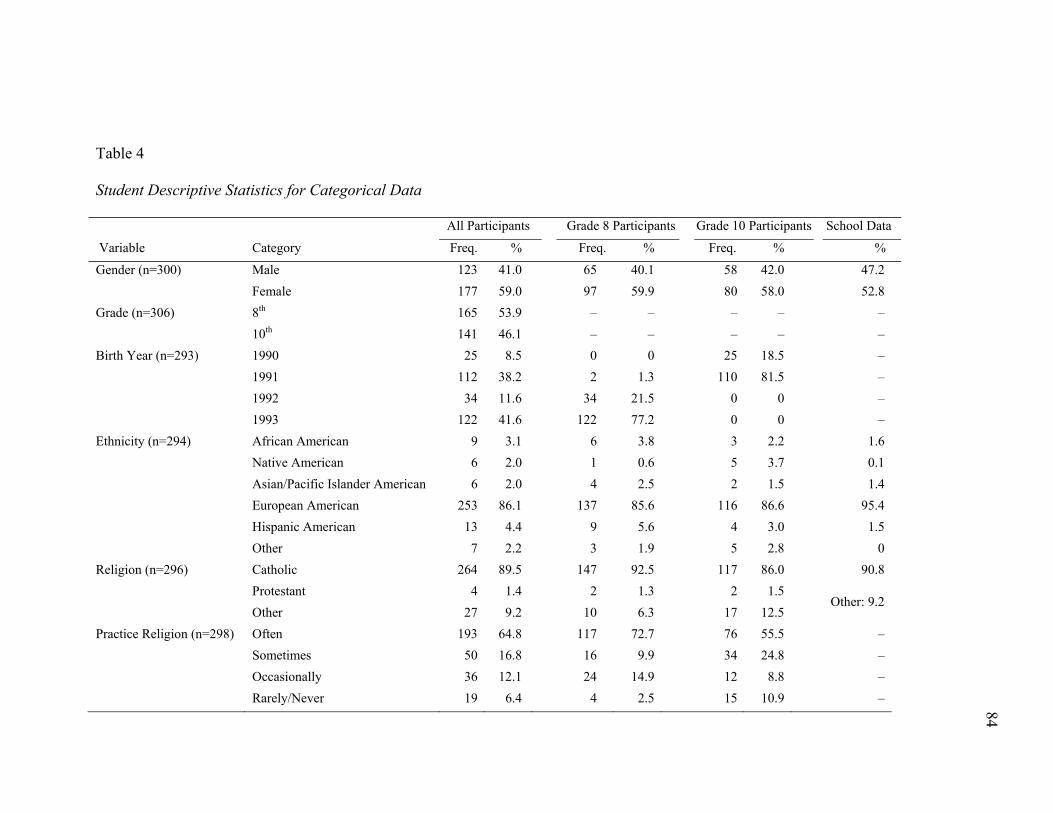
Table 4
Student Descriptive Statistics for Categorical Data
All Participants Grade 8 Participants Grade 10 Participants School Data
Variable Category Freq. % Freq. % Freq. % %
Male 123 41.0 65 40.1 58 42.0 47.2 Gender (n=300) Female 177 59.0 97 59.9 80 58.0 52.8 8th 165 53.9 – – – – – Grade (n=306) 10th 141 46.1 – – – – – 1990 25 8.5 0 0 25 18.5 – 1991 112 38.2 2 1.3 110 81.5 –
Birth Year (n=293)
1992 34 11.6 34 21.5 0 0 – 1993 122 41.6 122 77.2 0 0 –
African American 9 3.1 6 3.8 3 2.2 1.6 Ethnicity (n=294) Native American 6 2.0 1 0.6 5 3.7 0.1
Asian/Pacific Islander American 6 2.0 4 2.5 2 1.5 1.4 European American 253 86.1 137 85.6 116 86.6 95.4 Hispanic American 13 4.4 9 5.6 4 3.0 1.5 Other 7 2.2 3 1.9 5 2.8 0
Catholic 264 89.5 147 92.5 117 86.0 90.8 Religion (n=296) Protestant 4 1.4 2 1.3 2 1.5
Other 27 9.2 10 6.3 17 12.5 Other: 9.2
Often 193 64.8 117 72.7 76 55.5 – Sometimes 50 16.8 16 9.9 34 24.8 –
Practice Religion (n=298)
Occasionally 36 12.1 24 14.9 12 8.8 – Rarely/Never 19 6.4 4 2.5 15 10.9 – 84
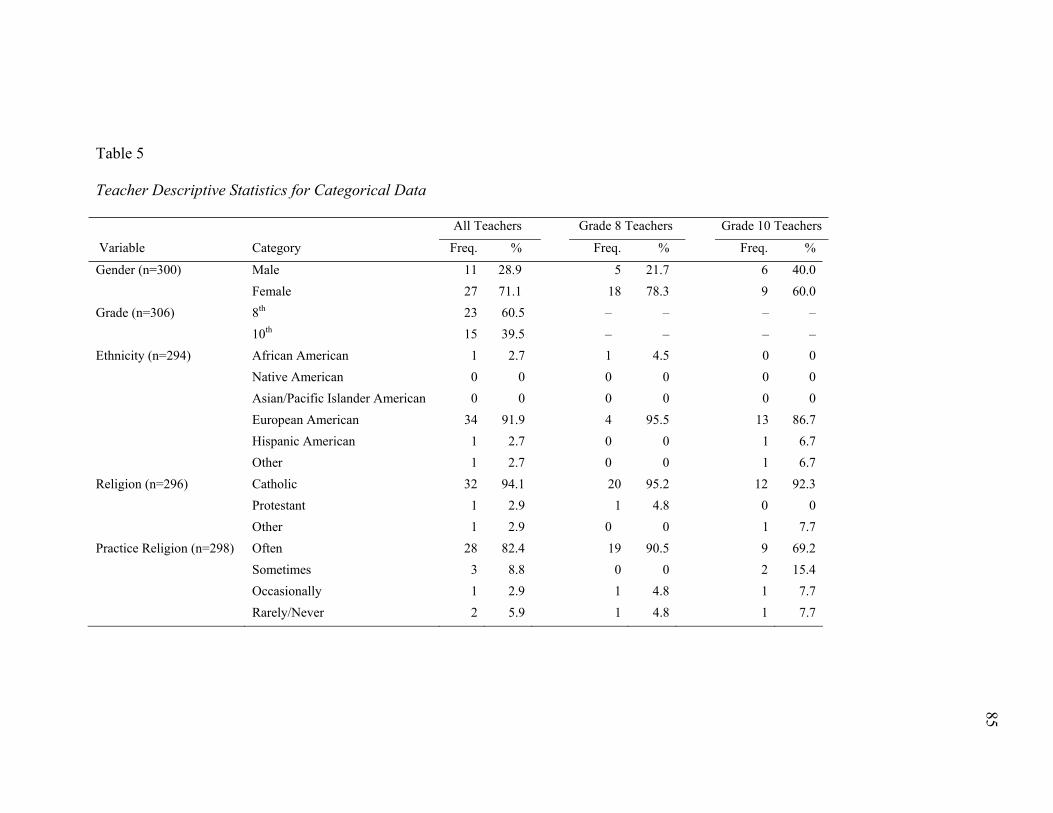
Table 5
Teacher Descriptive Statistics for Categorical Data
All Teachers Grade 8 Teachers Grade 10 Teachers
Variable Category Freq. % Freq. % Freq. %
Male 11 28.9 5 21.7 6 40.0 Gender (n=300) Female 27 71.1 18 78.3 9 60.0 8th 23 60.5 – – – – Grade (n=306) 10th 15 39.5 – – – – African American 1 2.7 1 4.5 0 0 Ethnicity (n=294) Native American 0 0 0 0 0 0
Asian/Pacific Islander American 0 0 0 0 0 0 European American 34 91.9 4 95.5 13 86.7 Hispanic American 1 2.7 0 0 1 6.7 Other 1 2.7 0 0 1 6.7
Catholic 32 94.1 20 95.2 12 92.3 Religion (n=296) Protestant 1 2.9 1 4.8 0 0
Other 1 2.9 0 0 1 7.7 Often 28 82.4 19 90.5 9 69.2 Sometimes 3 8.8 0 0 2 15.4
Practice Religion (n=298)
Occasionally 1 2.9 1 4.8 1 7.7 Rarely/Never 2 5.9 1 4.8 1 7.7
85
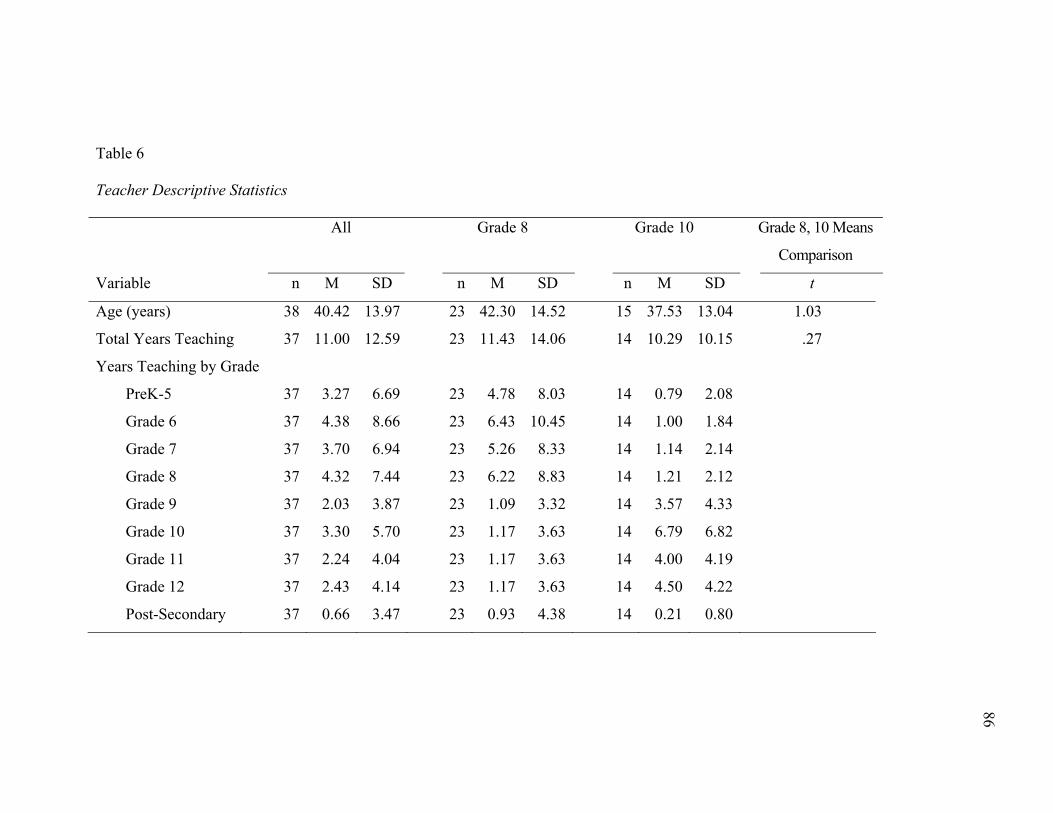
Table 6
Teacher Descriptive Statistics
All Grade 8 Grade 10 Grade 8, 10 Means
Comparison
Variable n M SD n M SD n M SD t
Age (years) 38 40.42 13.97 23 42.30 14.52 15 37.53 13.04 1.03
Total Years Teaching 37 11.00 12.59 23 11.43 14.06 14 10.29 10.15 .27
Years Teaching by Grade
PreK-5 37 3.27 6.69 23 4.78 8.03 14 0.79 2.08
Grade 6 37 4.38 8.66 23 6.43 10.45 14 1.00 1.84
Grade 7 37 3.70 6.94 23 5.26 8.33 14 1.14 2.14
Grade 8 37 4.32 7.44 23 6.22 8.83 14 1.21 2.12
Grade 9 37 2.03 3.87 23 1.09 3.32 14 3.57 4.33
Grade 10 37 3.30 5.70 23 1.17 3.63 14 6.79 6.82
Grade 11 37 2.24 4.04 23 1.17 3.63 14 4.00 4.19
Grade 12 37 2.43 4.14 23 1.17 3.63 14 4.50 4.22
Post-Secondary 37 0.66 3.47 23 0.93 4.38 14 0.21 0.80
86
87
assembled such that each measure remained distinct (i.e., each existing measure started
on a new page) and the order of measures was shuffled to minimize order effects.
Composites were calculated based on responses to multiple items. When participants
failed to respond to all items on a given measure, a missing value was assigned for the
corresponding composite.
Demographics
The present study gathered self-reported data regarding student participants’ age,
grade, race, gender, religious affiliation, and level of observance of religious affiliation
by means of a demographics instrument. Teacher participants were administered a
demographics instrument to gather self-reported data on years teaching, grade(s) taught,
race, gender, religious affiliation, and level of observance of religious affiliation (see
Appendix A).
Adolescent Apathy
Adolescent apathy was measured with a short form of Handelman’s (1999)
Adolescent Apathy Inventory (AAI) created for the present study by the researcher. The
adapted AAI retained the first two sections and only comprised items that loaded above
.300 on a single factor in Handelman’s study (see Appendix B). Items from the original
AAI asking students sensitive questions regarding illegal activity were dropped for the
present study in order to increase score reliability. On the adapted AAI used in the
present study, the first section consisted of 17 statements pertaining to self-concept (e.g.,
“I am a disruptive person;” “I am an ambitious person”), goals (e.g., “I know what I
would like to be when I am an adult”) and interests (e.g., “I like to argue/debate about the
88
topics which are important to me;” “I like reading”) which participants rated on a 5-point
scale ranging from “strongly disagree” to “strongly agree.”
The second section consisted of a list of 10 activities (e.g., “went to the movies;”
“performed some sort of volunteer/charitable service”). Participants indicated whether
they had taken part in each activity sometime in the last two months. For this section, the
original AAI used a simple checklist, however to better distinguish “no” responses from
missing responses, the form adapted for the present study asked participants to circle
either “yes” or “no” for each item.
In light of concerns raised in Chapter 2 regarding the factor structure of the AAI ,
only AAI total scores for students were used in the present study. First, all items
requiring reverse-coding were recoded. For section 2, a single score weighted as one item
was created by dividing the number of all “yes” responses by 5. The AAI composite was
obtained by summing scores on sections 1 and 2 and taking the average. In order to
facilitate interpretation, scores were reflected so that a high score indicated high
adolescent apathy. Cronbach’s α for this measure was 0.66 (Grade 8: 0.66, Grade 10:
0.65).
Apathy Syndrome
Apathy syndrome was assessed with Marin’s 18-item Apathy Evaluation Scale
(AES) shown in Appendix C. Participants rated items on a 4-point scale ranging from
“not at all true” to “very true.” Sample items included, “I put little effort into
anything”[reverse-coded] and “I am interested in having new experiences.” Scores for the
AES were obtained by summing all item scores, after reverse-coding indicated items. A
high AES score indicated low evidence of apathy syndrome. For a sample of 55- to 85-
89
year-olds, internal consistency as calculated by Cronbach’s α was 0.86, and test-retest
reliability was 0.76 (Marin, Biedrzycki, & Firinciogullari, 1991). In order to facilitate
interpretation, scores were reflected so that a high score indicated high apathy syndrome.
Cronbach’s α for this measure in the present study was 0.72 (Grade 8: 0.69, Grade 10:
0.75).
Amotivation
To assess amotivation, the 4-item subscale of the Academic Motivation Scale
(AMS; Vallerand, Pelletier, Blais, Brière, Senécal, & Vallières, 1992; α = .85) was
administered (see Appendix D). Participants rated items pertaining to whether or not they
have reasons for going to school using a 5-point scale ranging from “strongly disagree” to
“strongly agree” (e.g., “Honestly, I don’t know; I really feel that I am wasting my time in
school”). Amotivation scores were obtained by summing respondents’ scores on all items
and dividing by the number of items. Cronbach’s α for this measure was 0.85 (Grade 8:
0.84, Grade 10: 0.86).
Work Avoidance
Participants’ work avoidance was operationalized by the fourth subscale from a
goal orientations measure used in several studies and shown to have acceptable reliability
in undergraduate students from four countries (Cronbach’s α= .75; Riconscente &
Maggioni, 2004). The 5-item subscale asked students to rate their level of agreement
ranging from strongly disagree (1) to strongly agree (5) for items such as, “At school, I
want to get others to do the work for me” (see Appendix E). Participants’ work avoidance
scores were calculated by first reverse-coding appropriate items, summing responses

90
across all items, and dividing by the number of items. In the present study, Cronbach’s α
for this measure was 0.84 (Grade 8: 0.83, Grade 10: 0.84).
Boredom Proneness
Farmer and Sundberg’s (1992) Boredom Proneness Scale (BPS) was used to
assess participants’ level of boredom proneness (see Appendix F). This 28-item scale
asked respondents to indicate whether each statement was generally true or false for
them. Sample items included “I am good at waiting patiently” [reverse-coded] and
“Much of the time I just sit around doing nothing.” The BPS has been used with a
gender-balanced sample of college students and yielded acceptable reliabilities (KR-20:
α = 0.79; test-retest: r = 0.83). Scoring was conducted by reverse-coding appropriate
items, summing each participant’s responses across all items, and dividing by the number
of items. Cronbach’s α for the measure in the present study was 0.78 (Grade 8: 0.74,
Grade 10: 0.80).
Disengagement
A short 7-item set of questions to tap disengagement was created for the present
study based on Pellerin (2005a, 2005b). Items address frequency of truant behaviors and
unpreparedness such as missing a day of school for reasons other than illness and going
to class without having done the homework (see Appendix G). Participants rate each item
on a 4-point scale based on their activities during the prior month. Total disengagement
scores for each participant are calculated by summing all items with the exclusion of item
6, which is included in the measure to help obtain more valid data regarding number of
school days missed for a reason other than illness. Cronbach’s α for this measure was
0.51 (Grade 8: 0.52, Grade 10: 0.53). In light of the low reliability obtained on this
91
measure, scores were interpreted with caution. In addition, data generated by individual
items were examined for insights germane to the purposes of the study.
Distress and Well-Being
The Weinberger Adjustment Inventory (WAI) shown in Appendix H includes a
12-item distress scale composed of 4 subscales: well-being (reversed), self-esteem
(reversed), depression, and anxiety. The scale has been validated, yields high reliability,
and can be used with middle-school and high-school students without modification to
items (Weinberger, 1997). For the purposes of the present study, the WAI distress scale
served two aims. First, the well-being and self-esteem subscales could be correlated with
apathy measures and were expected to yield moderate to high negative correlation
coefficients. Second, taken together, the four subscales form a composite for distress
which was expected to correlate moderately and positively with apathy scores variously
conceived. Both values thus offered the opportunity to assess the convergent validity of
apathy measures. Cronbach’s α for this measure was 0.79 (Grade 8: 0.78, Grade 10:
0.79).
Curiosity
To assess curiosity, Kashdan, Rose, and Fincham’s (2004) 7-item Likert-scale
measure was used on which participants indicated their level of agreement, ranging from
“strongly disagree” to “strongly agree,” with statements describing themselves (e.g.,
“When I am participating in an activity, I tend to get so involved that I lose track of
time”). In four samples of undergraduates, reliability ranged from α = 0.75 to 0.80
(Kashdan et al., 2004). This measure is included in Appendix I. Cronbach’s α for this
measure was 0.67 (Grade 8: 0.67, Grade 10: 0.67).
92
Teacher Checklist for Student Apathy Levels
The present study used teacher nominations of students’ apathy levels to examine
the overlap between research-based and teacher definitions of school-related apathy.
Customized lists of either 8th-or 10th-grade students taught by each participating teacher
were compiled. Participating teachers were asked to place each student into one of three
categories: definitely apathetic toward school; definitely not apathetic toward school; or
in the middle. Teacher nominations were gathered as a way to capture folk
conceptualizations of school-related apathy. Hence, to avoid influencing the meanings
teachers assigned to the term “apathetic”, no further instructions were provided regarding
category definitions. All participating students were categorized by at least one teacher
and by as many as nine teachers. This was due to the participation of varying numbers of
teachers at each school. Limitations of this decision are addressed in Chapter 6.
Two variables were calculated based on teacher nomination data. Scores on the
dichotomous variable, Apathetic Nomination, were assigned to each student according to
whether any teacher had nominated him or her as apathetic. All students receiving at least
one nomination as “highly apathetic” were assigned to one group; students who received
no “highly apathetic” nominations composed the second group. These groups were
labeled “≥1” and “0,” respectively.
A second, polytomous, variable, Apathy Category, was created from teacher
nomination data based on a set of decision rules designed to yield four groups of students.
Three of these four groups reflected the categories teachers used in the nomination
process (i.e., apathetic, middle, non-apathetic). A fourth category was created to denote
students who had received both apathetic and non-apathetic nominations. Figure 9
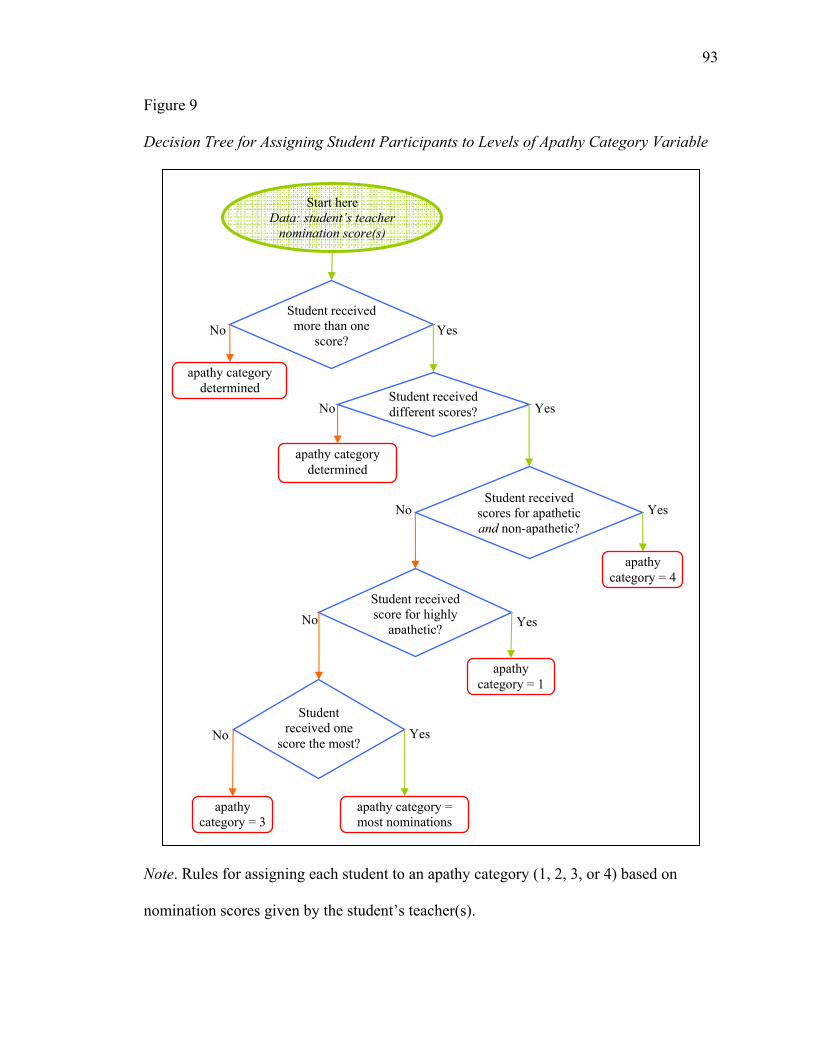
93
Figure 9
Decision Tree for Assigning Student Participants to Levels of Apathy Category Variable
Note. Rules for assigning each student to an apathy category (1, 2, 3, or 4) based on
nomination scores given by the student’s teacher(s).
Student received more than one
score?
Student received different scores?
apathy category determined
Yes No
apathy category determined
Yes No
Student received scores for apathetic and non-apathetic?
Yes
apathy category = 4
No
Student received score for highly
apathetic? Yes
apathy category = 1
No
Student received one
score the most?Yes
apathy category = most nominations
No
apathy category = 3
Start here Data: student’s teacher
nomination score(s)
94
displays the decision rules by which students were assigned to levels of the “apathy
category” variable. (See Appendix J).
Academic Achievement
Academic achievement was operationalized by grade-point averages from the
preceding academic year. Middle-school participants’ grade-point averages were
calculated by averaging grades for English, mathematics, science, and social studies
based on data from school records. High-school participants’ grade-point averages were
obtained from school records.
Student Interview Protocol
In order to obtain thick descriptions of apathy from the perspective of students, 58
individual interviews were conducted. Random stratified sampling was employed to
ensure that interviewees represented a range of teacher-perceived school-related apathy
levels. Interviewees were drawn from each cell of a 2 x 3 sampling frame based on grade
level (8th or 10th) and apathy level as determined by teacher nominations. The research
design specified that ten interviewees be drawn per cell. However since there were not
ten students per grade in the midrange apathy category who had also agreed to be
interviewed, additional students were drawn from the other apathy categories who had
also received at least one nomination in the midrange group. In order to privilege the
voices of those more likely to appear in the high- or low- apathy categories, gender was
not included as a selection variable.
The semi-structured interview consisted of 6 questions and allowed for probing of
responses (see Appendix K). Interviews were audiotaped and transcribed. Interview
transcripts were examined for data related to the conceptualization and operationalization
95
of school-related apathy, individual and group differences in school-related apathy, and
prevalence of school-related apathy. The process for analyzing these data is further
detailed in Chapter 5.
Teacher Interview Protocol
In order to capture rich conceptualizations of apathy from the perspective of
teachers, interviews were conducted with participants across 8th- and 10th-grade teachers
drawn from the same schools as student participants. The semi-structured interview
consisted of 6 questions and allowed for probing of responses (see Appendix L).
Interviews were audiotaped and transcribed. Interview transcripts were examined for data
pertaining to the conceptualization and operationalization of apathy, the prevalence of
apathy, and individual and group differences in apathy. The process for analyzing these
data is further detailed in Chapter 5.
Procedures
The present study used a mixed-methods approach to data collection and analysis,
as represented graphically in Figure 10. Parental consent and student informed assent
forms were distributed in October and November of 2006. In most schools, the researcher
administered the surveys during a class with the teacher present. Only students with
permission filled out the surveys. At two schools where only a few students participated,
the students were called out of class to fill out the survey in the presence of the researcher
in the school library or office. All participating students completed the packet of surveys
in one sitting. The presence of the researcher at all survey administrations ensured
consistency of instructions to students. Students were also encouraged to ask questions
about words they did not know, and told not to complete items they did not understand.
96
The entire survey administration process took between 25 and 35 minutes. Student GPA
data were obtained by the researcher from official school records.
Teacher sessions were conducted within three weeks of the survey administration.
Following completion of a demographics sheet, participating teachers were individually
interviewed. They then completed the customized student apathy-level checklist. All
interviews were audiotaped and transcribed.
Student interviews were conducted approximately six weeks after survey
administration. Both the researcher and the interviewee were blind to apathy category and
apathetic nomination status of the interviewee. The timing of student interviews was
selected so that participants’ memories of survey items would not influence their
responses to interview questions. Based on teacher interview data, minor modifications
were made to the student interview protocol to enable confirmation of emerging patterns
with respect to school-related apathy descriptions, conceptualizations, and correlates.
Specifically, questions were added to probe for students’ motivations for earning high
grades and for the subject matter.
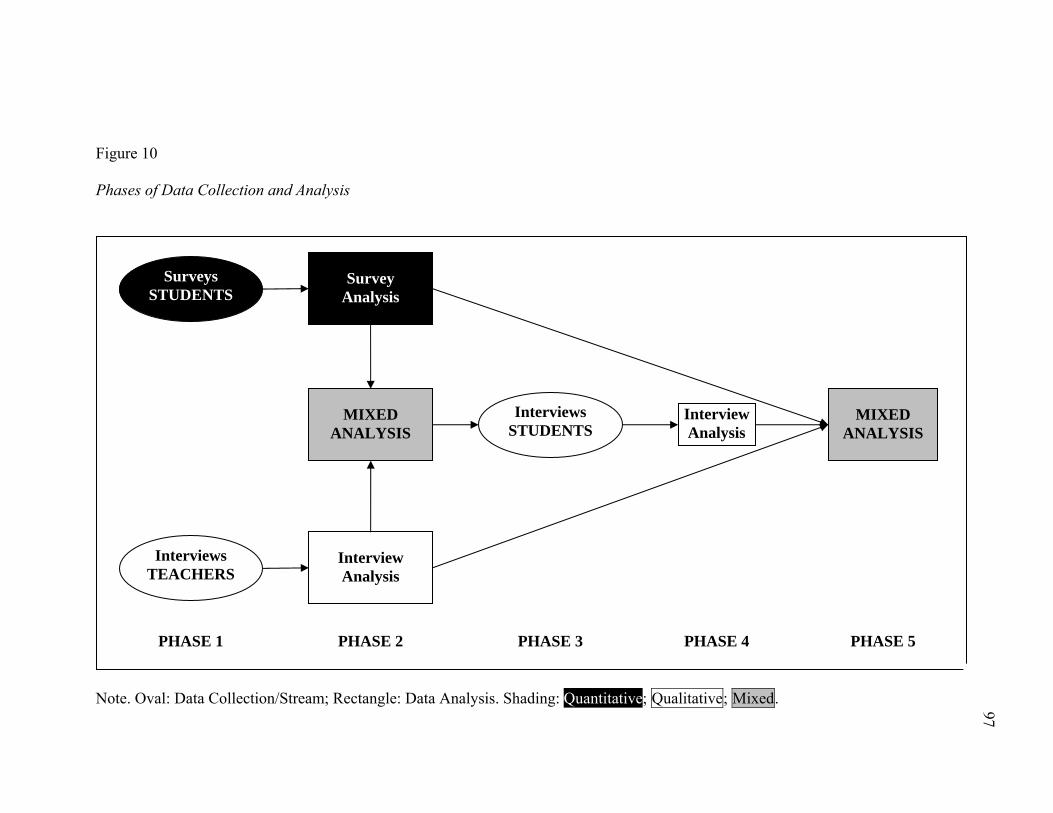
Figure 10
Phases of Data Collection and Analysis
Note. Oval: Data Collection/Stream; Rectangle: Data Analysis. Shading: Quantitative; Qualitative; Mixed.
MIXED ANALYSIS
PHASE 5
Survey Analysis
PHASE 2
Interview Analysis
MIXED ANALYSIS
Interview Analysis
PHASE 4
PHASE 1
Interviews TEACHERS
Surveys STUDENTS
PHASE 3
Interviews STUDENTS
97
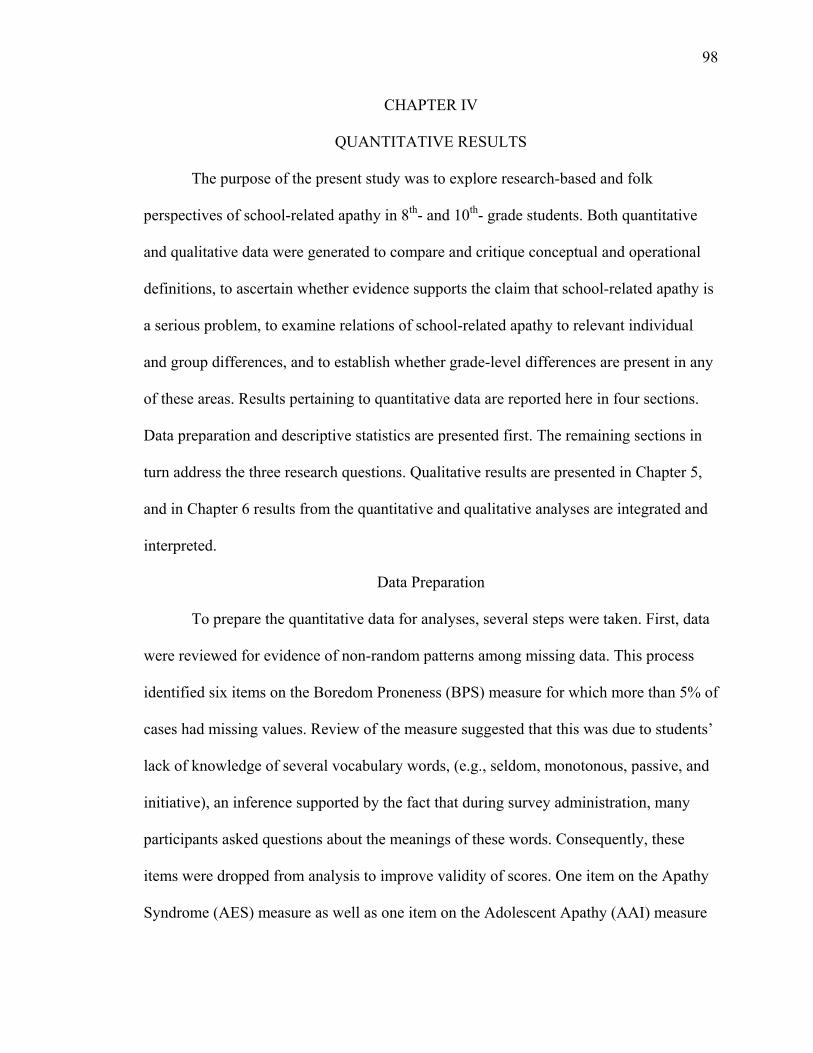
98
CHAPTER IV
QUANTITATIVE RESULTS
The purpose of the present study was to explore research-based and folk
perspectives of school-related apathy in 8th- and 10th- grade students. Both quantitative
and qualitative data were generated to compare and critique conceptual and operational
definitions, to ascertain whether evidence supports the claim that school-related apathy is
a serious problem, to examine relations of school-related apathy to relevant individual
and group differences, and to establish whether grade-level differences are present in any
of these areas. Results pertaining to quantitative data are reported here in four sections.
Data preparation and descriptive statistics are presented first. The remaining sections in
turn address the three research questions. Qualitative results are presented in Chapter 5,
and in Chapter 6 results from the quantitative and qualitative analyses are integrated and
interpreted.
Data Preparation
To prepare the quantitative data for analyses, several steps were taken. First, data
were reviewed for evidence of non-random patterns among missing data. This process
identified six items on the Boredom Proneness (BPS) measure for which more than 5% of
cases had missing values. Review of the measure suggested that this was due to students’
lack of knowledge of several vocabulary words, (e.g., seldom, monotonous, passive, and
initiative), an inference supported by the fact that during survey administration, many
participants asked questions about the meanings of these words. Consequently, these
items were dropped from analysis to improve validity of scores. One item on the Apathy
Syndrome (AES) measure as well as one item on the Adolescent Apathy (AAI) measure
99
evidenced the same problem. For both composite scores, dependent-sample t-tests
indicated no significant difference between means computed with and without that item;
each pair of composites computed with and without the problematic item were nearly
perfectly correlated, r = .99. However, correlations with other composite scores varied
slightly, suggesting non-randomness of missing values. Therefore, the problematic item
on each measure was dropped from further analysis. In addition, since middle schools
used percentages for final grades, and high schools used a typical GPA score, GPA scores
were standardized within grade to create equal scales for between-grade comparisons.
Tests of normality were conducted on all interval-scale variables using the
Shapiro-Wilk’s W statistic. Only adolescent apathy and curiosity scores were normally
distributed, with skew and/or kurtosis present in the remaining variables. Each composite
was also examined for outliers, however no extreme values were evident for any of the
composite scores. The central limit theorem demonstrates that even for data that are not
normally distributed, the sampling distribution of the mean for sample sizes greater than
30 will nevertheless approximate the normal distribution (King & Minium, 2003).
Therefore, planned t-tests were performed using composites based on the original
variable scores. Regarding planned analyses of variance (ANOVA), since the assumption
of homogeneity of variance across groups was not met for several variables, general
linear model univariate analysis of variance using Type II and Type III sums of squares
methods were run and compared to results from a one-way ANOVA. As all three
approaches yielded the same results, results from the one-way ANOVA were retained for
interpretation. Cohen’s (1992) definitions of small (η2 = .10), medium (η2 =.25), and
large effect sizes (η2 = .40) were used to interpret all ANOVA results.
100
Similarly, for planned correlation analyses, given the non-normality of several
variables of interest, both Pearson and Spearman correlation coefficients were calculated
for pairs of apathy and individual difference variables. Since only minor differences were
obtained via different procedures, results from the Pearson method were retained for
reporting and interpretation. Normalizing transformations were applied to all composites
prior to conducting the multiple regression analyses.
Two-tailed tests and an alpha level of .05 were used for all statistical tests in the
study. Where appropriate, effect sizes are displayed for each statistical test.
Descriptive Statistics
Participation and Interview Consent Comparisons
Gathering teacher nominations of students’ school-related apathy allowed for
comparisons of perceived apathy levels of participating and non-participating students. A
chi-square analysis indicated that the decision to participate was independent of receiving
one or more apathetic nominations from teachers. Likewise, apathy category scores were
independent of participation status based on a chi-square analysis.
Data from participants were compared to determine whether differences germane
to the present study distinguished those who did and did not agree to be interviewed.
Eighth graders were significantly less likely to agree to be interviewed than were 10th
graders, χ2(1, N = 304) = 7.6228, p = .006. This was likely reflective of parents’ greater
protectiveness towards younger students. Within grades, no significant differences were
obtained for 8th graders for all demographic, apathy and individual difference variables.
Tenth-grade interview participants reported significantly lower work avoidance, t(135) =
-2.412, p = .017, d = 0.51, and significantly higher curiosity, t(134) = 2.728, p = .007, d =
101
0.61, than did non-interview participants; no significant differences were obtained for any
other demographic, apathy or individual difference variables for 10th graders. For both
grades, both apathy category and apathetic nomination category were independent of
interview status. In order to draw conclusions about students representing all levels of
school-related apathy, it was important to establish that neither apathy variable was
dependent on participation or interview status.
Student Apathy and Individual Differences Data
Several sets of descriptive statistics were prerequisite to informing the research
questions of the present study. In this section, tables of these descriptives are briefly
presented; subsequent sections treating each research question refer back to them in
greater detail.
To answer the first research question, means and standard deviations were
calculated for all apathy composites using the full sample. These data were also
disaggregated by grade in order to respond to the third research question. Table 7
presents these data. In view of the low reliability of the disengagement measure,
individual items were analyzed in addition to the composite. Means and standard
deviations for these items are presented in Table 8. Pearson correlations were also
computed between apathy composites with the full sample and within grade level (see
Table 9).
The second research question added individual differences to the analysis. Means and
standard deviations for these five composites (boredom proneness, curiosity, distress, well-
being, and GPA) are shown in Table 7, with data disaggregated by gender in Tables 10
through 12. Zero-order Pearson correlation coefficients are displayed in Tables 13 and 14.
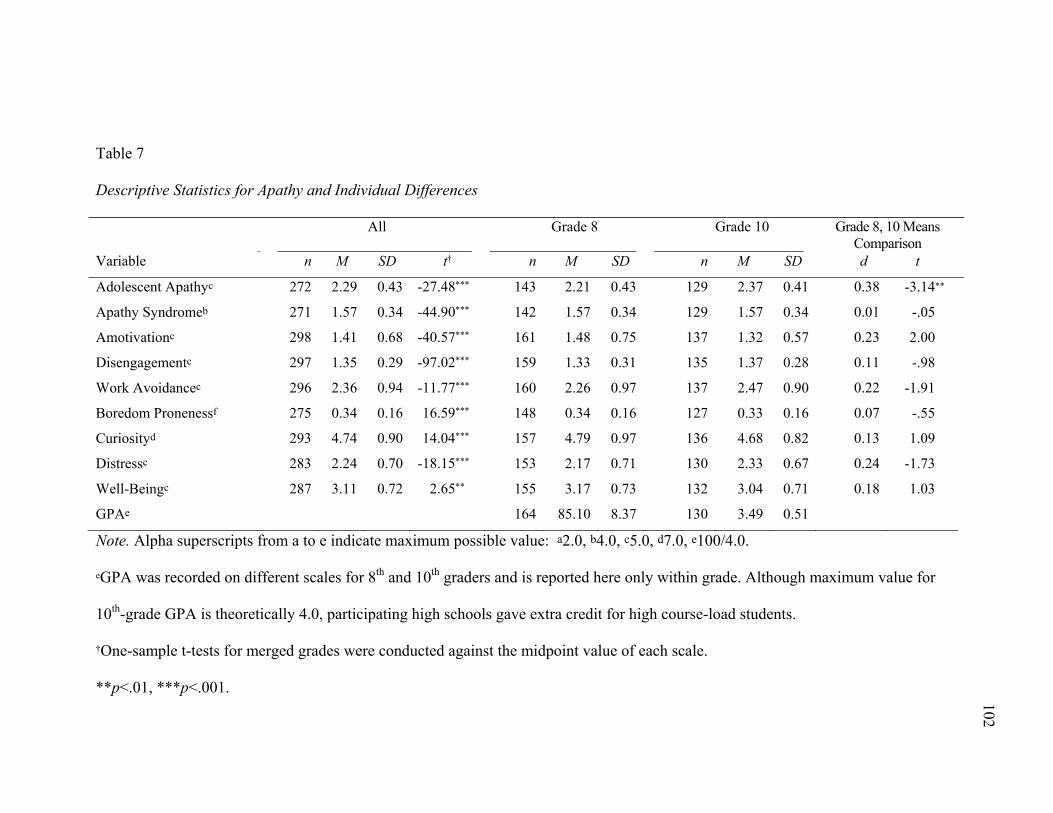
Table 7
Descriptive Statistics for Apathy and Individual Differences
All Grade 8 Grade 10 Grade 8, 10 Means Comparison
Variable n M SD t† n M SD n M SD d t
Adolescent Apathyc 272 2.29 0.43 -27.48*** 143 2.21 0.43 129 2.37 0.41 0.38 -3.14**
Apathy Syndromeb 271 1.57 0.34 -44.90*** 142 1.57 0.34 129 1.57 0.34 0.01 -.05
Amotivationc 298 1.41 0.68 -40.57*** 161 1.48 0.75 137 1.32 0.57 0.23 2.00
Disengagementc 297 1.35 0.29 -97.02*** 159 1.33 0.31 135 1.37 0.28 0.11 -.98
Work Avoidancec 296 2.36 0.94 -11.77*** 160 2.26 0.97 137 2.47 0.90 0.22 -1.91
Boredom Pronenessf 275 0.34 0.16 16.59*** 148 0.34 0.16 127 0.33 0.16 0.07 -.55
Curiosityd 293 4.74 0.90 14.04*** 157 4.79 0.97 136 4.68 0.82 0.13 1.09
Distressc 283 2.24 0.70 -18.15*** 153 2.17 0.71 130 2.33 0.67 0.24 -1.73
Well-Beingc 287 3.11 0.72 2.65** 155 3.17 0.73 132 3.04 0.71 0.18 1.03
GPAe 164 85.10 8.37 130 3.49 0.51
Note. Alpha superscripts from a to e indicate maximum possible value: a2.0, b4.0, c5.0, d7.0, e100/4.0.
eGPA was recorded on different scales for 8th and 10th graders and is reported here only within grade. Although maximum value for
10th-grade GPA is theoretically 4.0, participating high schools gave extra credit for high course-load students.
†One-sample t-tests for merged grades were conducted against the midpoint value of each scale.
**p<.01, ***p<.001.
102
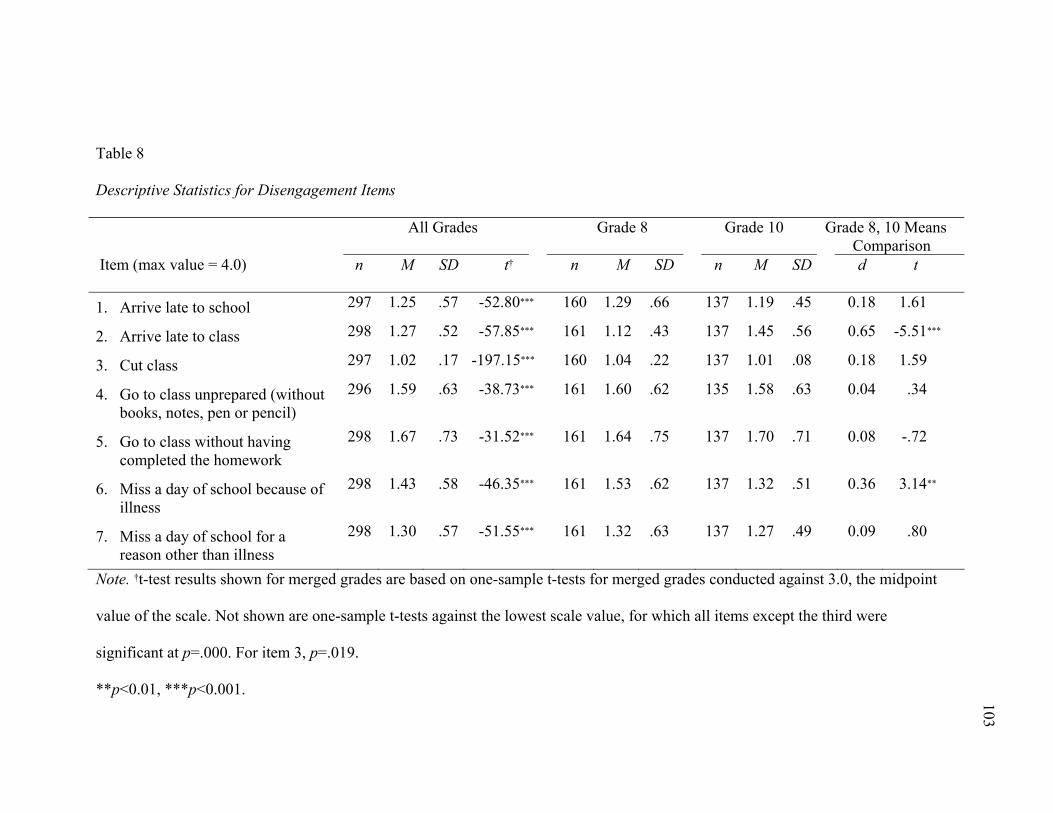
Table 8
Descriptive Statistics for Disengagement Items
All Grades Grade 8 Grade 10 Grade 8, 10 Means Comparison
Item (max value = 4.0) n M SD t† n M SD n M SD d t
1. Arrive late to school 297 1.25 .57 -52.80*** 160 1.29 .66 137 1.19 .45 0.18 1.61
2. Arrive late to class 298 1.27 .52 -57.85*** 161 1.12 .43 137 1.45 .56 0.65 -5.51***
3. Cut class 297 1.02 .17 -197.15*** 160 1.04 .22 137 1.01 .08 0.18 1.59
4. Go to class unprepared (without books, notes, pen or pencil)
296 1.59 .63 -38.73*** 161 1.60 .62 135 1.58 .63 0.04 .34
5. Go to class without having completed the homework
298 1.67 .73 -31.52*** 161 1.64 .75 137 1.70 .71 0.08 -.72
6. Miss a day of school because of illness
298 1.43 .58 -46.35*** 161 1.53 .62 137 1.32 .51 0.36 3.14**
7. Miss a day of school for a reason other than illness
298 1.30 .57 -51.55*** 161 1.32 .63 137 1.27 .49 0.09 .80
Note. †t-test results shown for merged grades are based on one-sample t-tests for merged grades conducted against 3.0, the midpoint
value of the scale. Not shown are one-sample t-tests against the lowest scale value, for which all items except the third were
significant at p=.000. For item 3, p=.019.
**p<0.01, ***p<0.001. 103
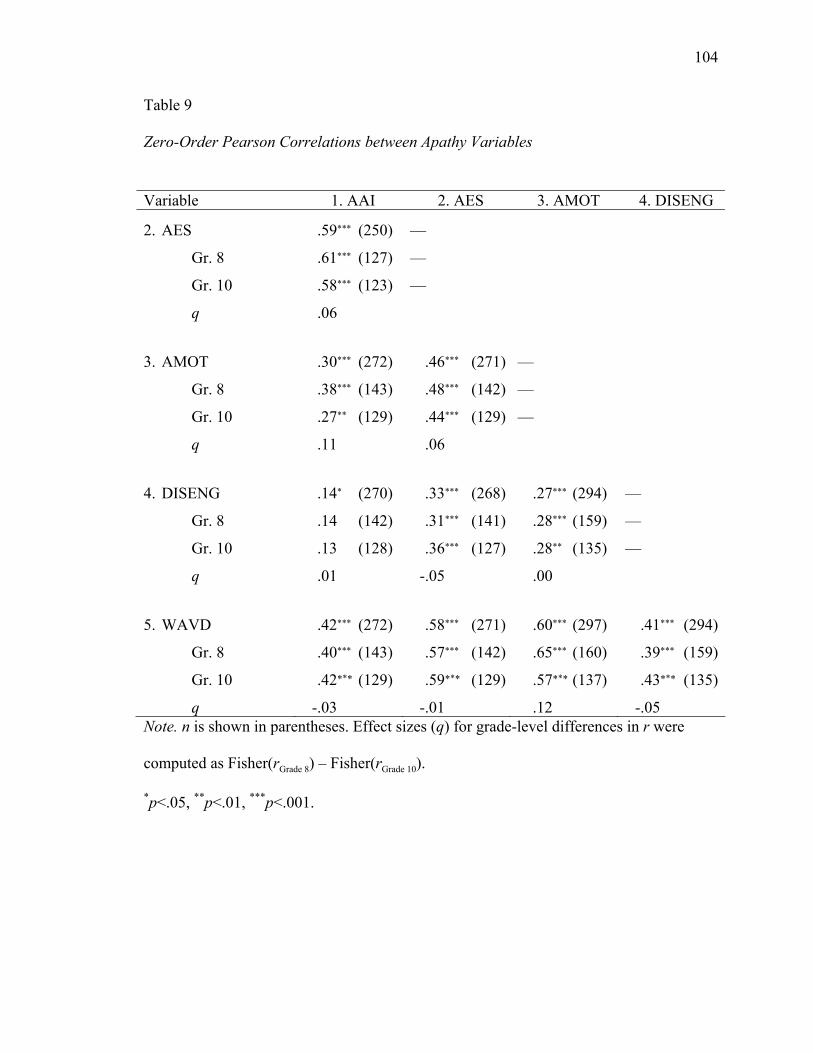
104
Table 9
Zero-Order Pearson Correlations between Apathy Variables
Variable 1. AAI 2. AES 3. AMOT 4. DISENG 1. AAI —
2. AES .59*** (250)
Gr. 8 .61*** (127)
Gr. 10 .58*** (123)
—
—
—
q .06
3. AMOT .30*** (272) .46*** (271) —
Gr. 8 .38*** (143) .48*** (142) —
Gr. 10 .27** (129) .44*** (129) —
q .11 .06
4. DISENG .14* (270) .33*** (268) .27*** (294) — Gr. 8 .14 (142) .31*** (141) .28*** (159) — Gr. 10 .13 (128) .36*** (127) .28** (135) — q .01 -.05 .00
5. WAVD .42*** (272) .58*** (271) .60*** (297) .41*** (294)
Gr. 8 .40*** (143) .57*** (142) .65*** (160) .39*** (159)
Gr. 10 .42*** (129) .59*** (129) .57*** (137) .43*** (135)
q -.03 -.01 .12 -.05 Note. n is shown in parentheses. Effect sizes (q) for grade-level differences in r were
computed as Fisher(rGrade 8) – Fisher(rGrade 10).
*p<.05, **p<.01, ***p<.001.
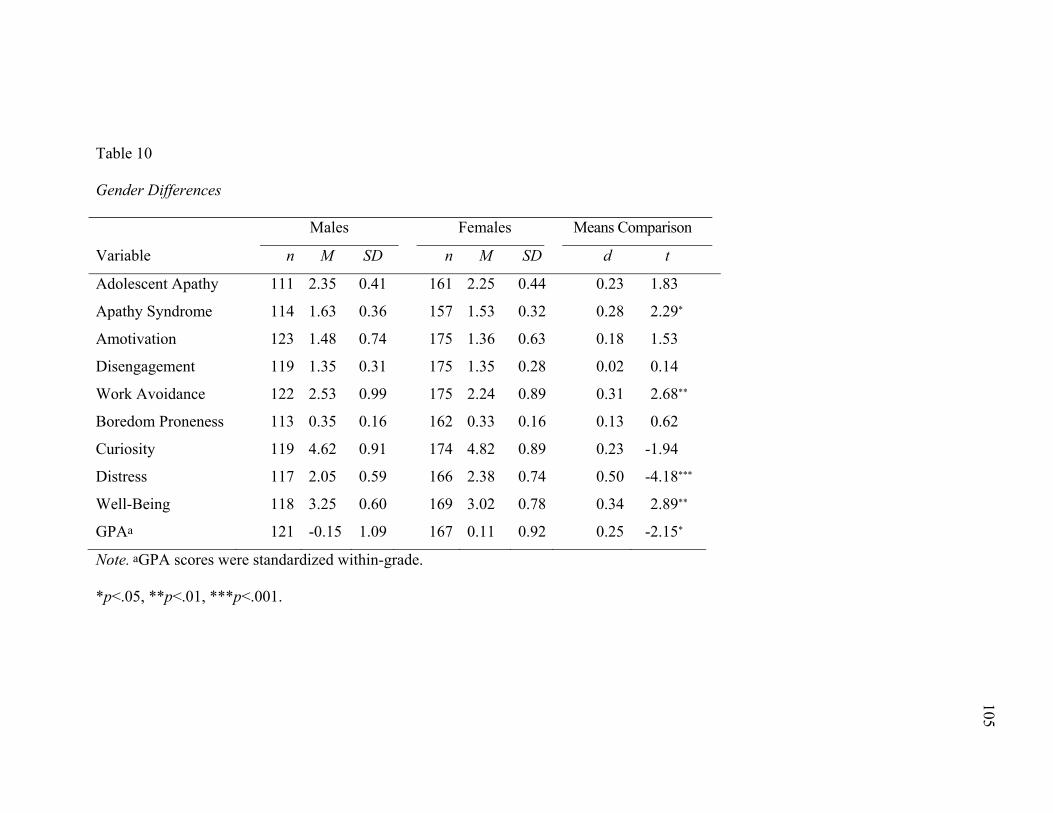
Table 10
Gender Differences
Males Females Means Comparison
Variable n M SD n M SD d t
Adolescent Apathy 111 2.35 0.41 161 2.25 0.44 0.23 1.83
Apathy Syndrome 114 1.63 0.36 157 1.53 0.32 0.28 2.29*
Amotivation 123 1.48 0.74 175 1.36 0.63 0.18 1.53
Disengagement 119 1.35 0.31 175 1.35 0.28 0.02 0.14
Work Avoidance 122 2.53 0.99 175 2.24 0.89 0.31 2.68**
Boredom Proneness 113 0.35 0.16 162 0.33 0.16 0.13 0.62
Curiosity 119 4.62 0.91 174 4.82 0.89 0.23 -1.94
Distress 117 2.05 0.59 166 2.38 0.74 0.50 -4.18***
Well-Being 118 3.25 0.60 169 3.02 0.78 0.34 2.89**
GPAa 121 -0.15 1.09 167 0.11 0.92 0.25 -2.15*
Note. aGPA scores were standardized within-grade.
*p<.05, **p<.01, ***p<.001.
105
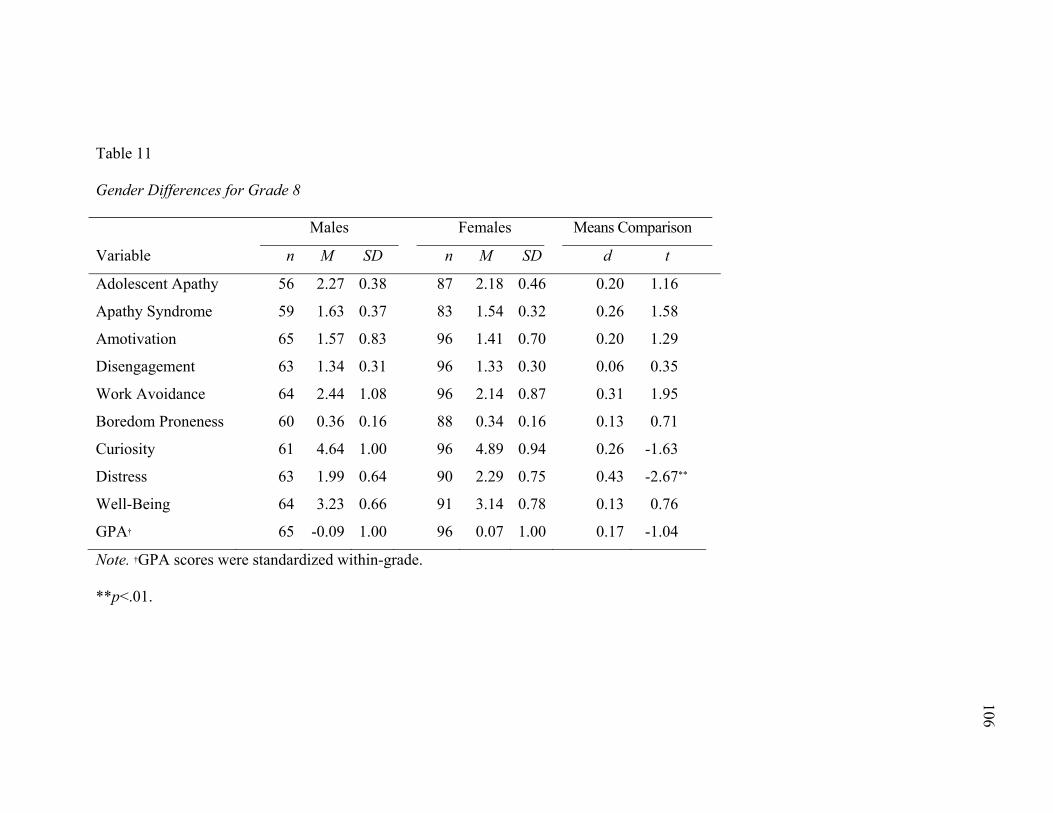
Table 11
Gender Differences for Grade 8
Males Females Means Comparison
Variable n M SD n M SD d t
Adolescent Apathy 56 2.27 0.38 87 2.18 0.46 0.20 1.16
Apathy Syndrome 59 1.63 0.37 83 1.54 0.32 0.26 1.58
Amotivation 65 1.57 0.83 96 1.41 0.70 0.20 1.29
Disengagement 63 1.34 0.31 96 1.33 0.30 0.06 0.35
Work Avoidance 64 2.44 1.08 96 2.14 0.87 0.31 1.95
Boredom Proneness 60 0.36 0.16 88 0.34 0.16 0.13 0.71
Curiosity 61 4.64 1.00 96 4.89 0.94 0.26 -1.63
Distress 63 1.99 0.64 90 2.29 0.75 0.43 -2.67**
Well-Being 64 3.23 0.66 91 3.14 0.78 0.13 0.76
GPA† 65 -0.09 1.00 96 0.07 1.00 0.17 -1.04
Note. †GPA scores were standardized within-grade.
**p<.01.
106106
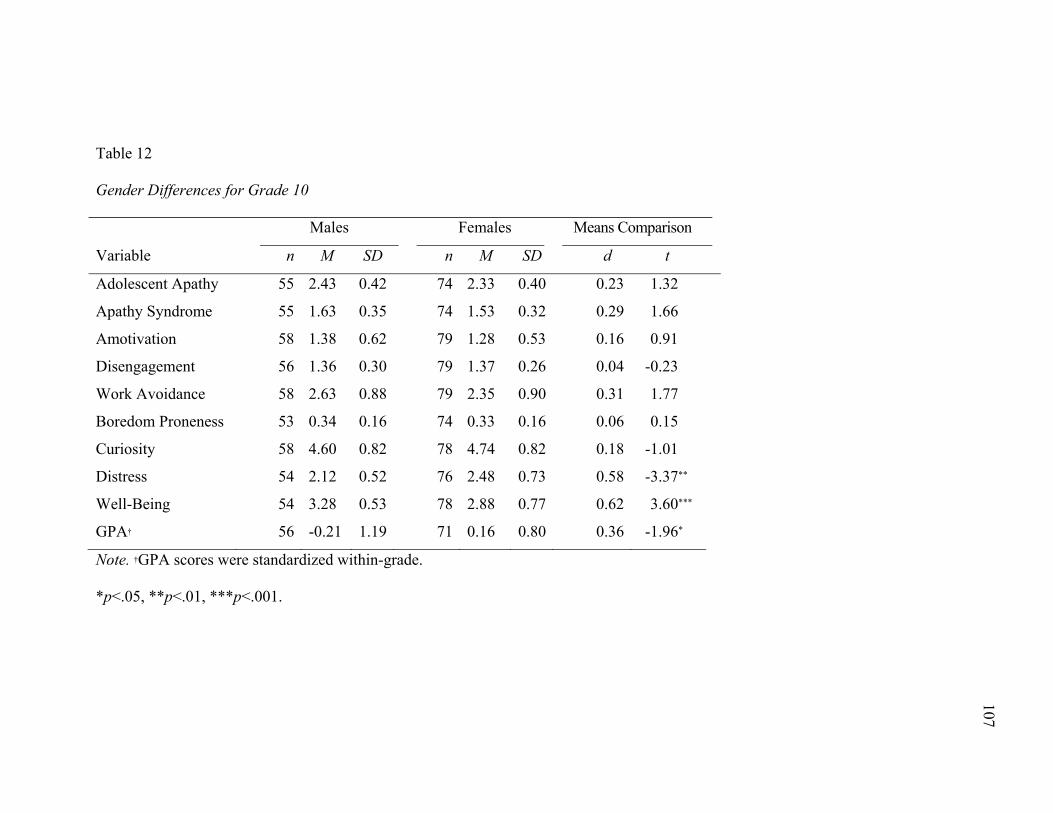
Table 12
Gender Differences for Grade 10
Males Females Means Comparison
Variable n M SD n M SD d t
Adolescent Apathy 55 2.43 0.42 74 2.33 0.40 0.23 1.32
Apathy Syndrome 55 1.63 0.35 74 1.53 0.32 0.29 1.66
Amotivation 58 1.38 0.62 79 1.28 0.53 0.16 0.91
Disengagement 56 1.36 0.30 79 1.37 0.26 0.04 -0.23
Work Avoidance 58 2.63 0.88 79 2.35 0.90 0.31 1.77
Boredom Proneness 53 0.34 0.16 74 0.33 0.16 0.06 0.15
Curiosity 58 4.60 0.82 78 4.74 0.82 0.18 -1.01
Distress 54 2.12 0.52 76 2.48 0.73 0.58 -3.37**
Well-Being 54 3.28 0.53 78 2.88 0.77 0.62 3.60***
GPA† 56 -0.21 1.19 71 0.16 0.80 0.36 -1.96*
Note. †GPA scores were standardized within-grade.
*p<.05, **p<.01, ***p<.001.
107
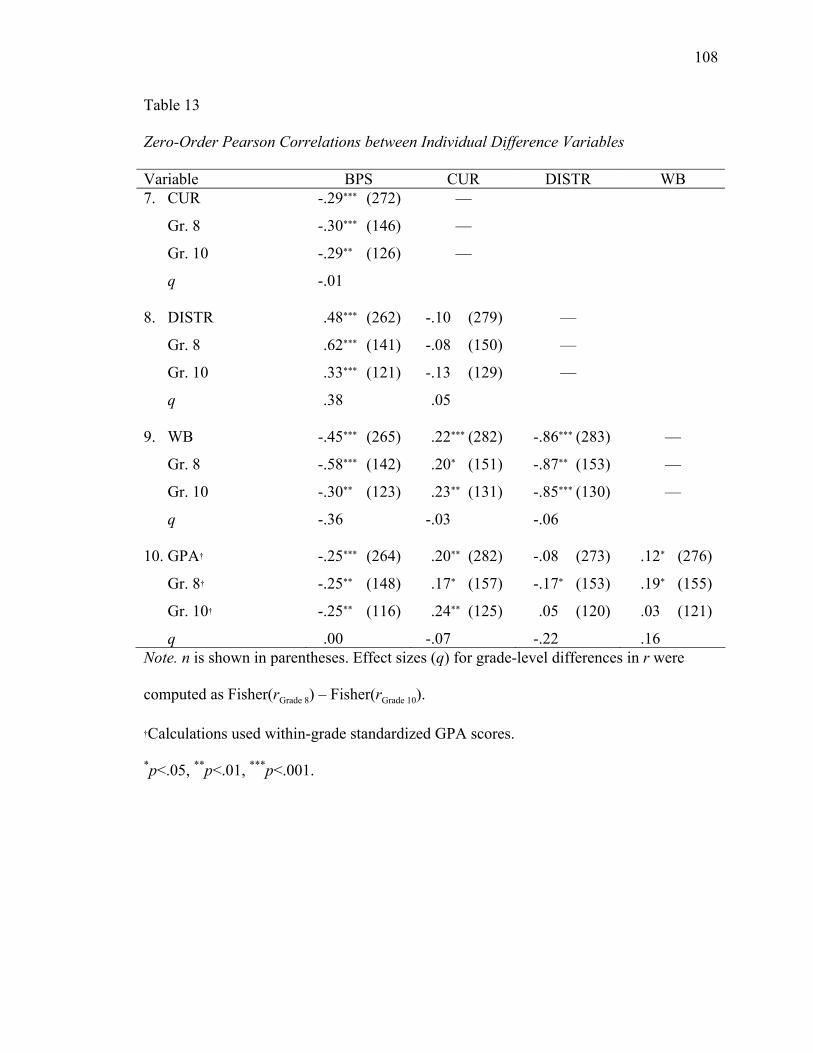
108
Table 13
Zero-Order Pearson Correlations between Individual Difference Variables
Variable BPS CUR DISTR WB 7. CUR -.29*** (272) —
Gr. 8 -.30*** (146) —
Gr. 10 -.29** (126) —
q -.01
8. DISTR .48*** (262) -.10 (279) —
Gr. 8 .62*** (141) -.08 (150) —
Gr. 10 .33*** (121) -.13 (129) —
q .38 .05
9. WB -.45*** (265) .22*** (282) -.86*** (283) —
Gr. 8 -.58*** (142) .20* (151) -.87** (153) —
Gr. 10 -.30** (123) .23** (131) -.85*** (130) —
q -.36 -.03 -.06
10. GPA† -.25*** (264) .20** (282) -.08 (273) .12* (276)
Gr. 8† -.25** (148) .17* (157) -.17* (153) .19* (155)
Gr. 10† -.25** (116) .24** (125) .05 (120) .03 (121)
q .00 -.07 -.22 .16 Note. n is shown in parentheses. Effect sizes (q) for grade-level differences in r were
computed as Fisher(rGrade 8) – Fisher(rGrade 10).
†Calculations used within-grade standardized GPA scores.
*p<.05, **p<.01, ***p<.001.
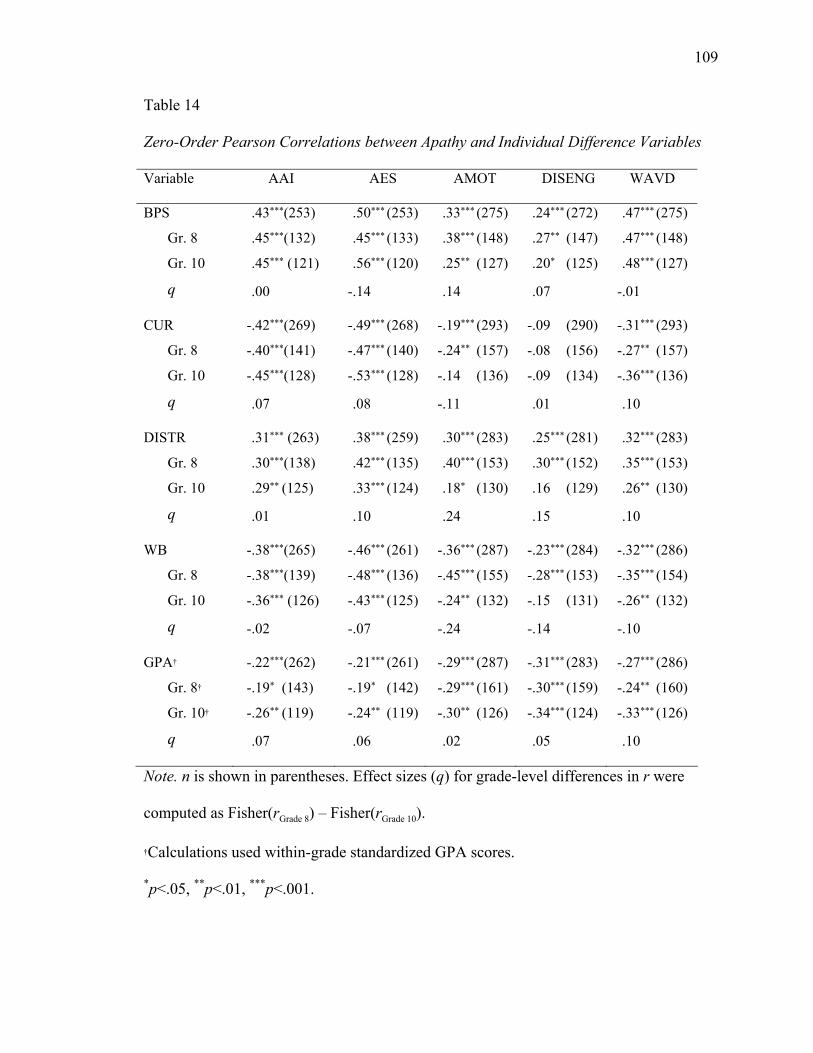
109
Table 14
Zero-Order Pearson Correlations between Apathy and Individual Difference Variables
Variable AAI AES AMOT DISENG WAVD
BPS .43***(253) .50*** (253) .33*** (275) .24*** (272) .47*** (275)
Gr. 8 .45***(132) .45*** (133) .38*** (148) .27** (147) .47*** (148)
Gr. 10 .45*** (121) .56*** (120) .25** (127) .20* (125) .48*** (127)
q .00 -.14 .14 .07 -.01
CUR -.42***(269) -.49*** (268) -.19*** (293) -.09 (290) -.31*** (293)
Gr. 8 -.40***(141) -.47*** (140) -.24** (157) -.08 (156) -.27** (157)
Gr. 10 -.45***(128) -.53*** (128) -.14 (136) -.09 (134) -.36*** (136)
q .07 .08 -.11 .01 .10
DISTR .31*** (263) .38*** (259) .30*** (283) .25*** (281) .32*** (283)
Gr. 8 .30***(138) .42*** (135) .40*** (153) .30*** (152) .35*** (153)
Gr. 10 .29** (125) .33*** (124) .18* (130) .16 (129) .26** (130)
q .01 .10 .24 .15 .10
WB -.38***(265) -.46*** (261) -.36*** (287) -.23*** (284) -.32*** (286)
Gr. 8 -.38***(139) -.48*** (136) -.45*** (155) -.28*** (153) -.35*** (154)
Gr. 10 -.36*** (126) -.43*** (125) -.24** (132) -.15 (131) -.26** (132)
q -.02 -.07 -.24 -.14 -.10
GPA† -.22***(262) -.21*** (261) -.29*** (287) -.31*** (283) -.27*** (286)
Gr. 8† -.19* (143) -.19* (142) -.29*** (161) -.30*** (159) -.24** (160)
Gr. 10† -.26** (119) -.24** (119) -.30** (126) -.34*** (124) -.33*** (126)
q .07 .06 .02 .05 .10
Note. n is shown in parentheses. Effect sizes (q) for grade-level differences in r were
computed as Fisher(rGrade 8) – Fisher(rGrade 10).
†Calculations used within-grade standardized GPA scores.
*p<.05, **p<.01, ***p<.001.
110
The first research question also explored the relation between folk and research-
based conceptions of apathy, and the third research question examined grade-level
differences in these relations. Several statistical analyses were conducted to respond to
these questions. Table 15 displays student demographics for the two apathetic nomination
groups. As stated earlier, students receiving at least one apathetic nomination were
assigned to the “≥1” group; students receiving no apathetic nominations were assigned to
the “0” group. The same analysis was also performed by apathy category, assigned
according to the rules defined in Figure 9. These data appear in Table 16 for the full
sample, and in Tables 17 and 18 for the 8th and 10th grades, respectively. To enable
comparisons of apathy and individual differences according to teacher nominations of
students’ apathy, means and standard deviations of apathy and individual differences
were calculated for each apathetic nomination group and for each apathy category.
Tables 19 through 23 present these results.
Research Question 1: Defining School-Related Apathy
The first research question posed in this study regarded the conceptualization and
prevalence of school-related apathy. These issues were addressed via three distinct
questions: To what extent are research-based conceptualizations of apathy toward school
statistically independent? How do teachers and students conceptualize school-related
apathy, and to what extent are those “folk constructs” consistent with research-based
conceptualizations? How prevalent is school-related apathy in students, and how do
students’ and teachers’ beliefs about its prevalence compare? Quantitative results for
each question are presented sequentially.
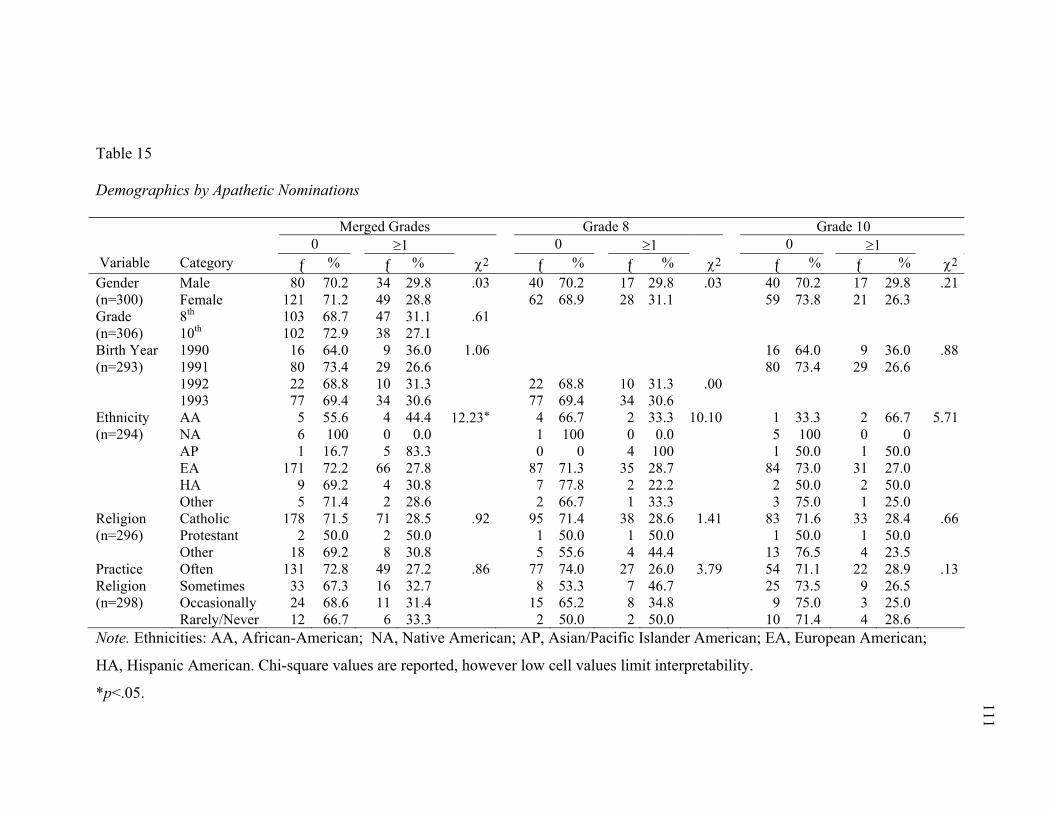
Table 15
Demographics by Apathetic Nominations
Merged Grades Grade 8 Grade 10 0 ≥1 0 ≥1 0 ≥1 Variable Category ƒ % ƒ % χ2 ƒ % ƒ % χ2 ƒ % ƒ % χ2
Male 80 70.2 34 29.8 .03 40 70.2 17 29.8 .03 40 70.2 17 29.8 .21Gender (n=300) Female 121 71.2 49 28.8 62 68.9 28 31.1 59 73.8 21 26.3
8th 103 68.7 47 31.1 .61 Grade (n=306) 10th 102 72.9 38 27.1
1990 16 64.0 9 36.0 1.06 16 64.0 9 36.0 .881991 80 73.4 29 26.6 80 73.4 29 26.6
Birth Year (n=293)
1992 22 68.8 10 31.3 22 68.8 10 31.3 .00 1993 77 69.4 34 30.6 77 69.4 34 30.6
AA 5 55.6 4 44.4 12.23* 4 66.7 2 33.3 10.10 1 33.3 2 66.7 5.71Ethnicity (n=294) NA 6 100 0 0.0 1 100 0 0.0 5 100 0 0 AP 1 16.7 5 83.3 0 0 4 100 1 50.0 1 50.0 EA 171 72.2 66 27.8 87 71.3 35 28.7 84 73.0 31 27.0 HA 9 69.2 4 30.8 7 77.8 2 22.2 2 50.0 2 50.0 Other 5 71.4 2 28.6 2 66.7 1 33.3 3 75.0 1 25.0
Catholic 178 71.5 71 28.5 .92 95 71.4 38 28.6 1.41 83 71.6 33 28.4 .66Religion (n=296) Protestant 2 50.0 2 50.0 1 50.0 1 50.0 1 50.0 1 50.0 Other 18 69.2 8 30.8 5 55.6 4 44.4 13 76.5 4 23.5
Often 131 72.8 49 27.2 .86 77 74.0 27 26.0 3.79 54 71.1 22 28.9 .13Sometimes 33 67.3 16 32.7 8 53.3 7 46.7 25 73.5 9 26.5
Practice Religion (n=298) Occasionally 24 68.6 11 31.4 15 65.2 8 34.8 9 75.0 3 25.0 Rarely/Never 12 66.7 6 33.3 2 50.0 2 50.0 10 71.4 4 28.6 Note. Ethnicities: AA, African-American; NA, Native American; AP, Asian/Pacific Islander American; EA, European American;
HA, Hispanic American. Chi-square values are reported, however low cell values limit interpretability.
*p<.05. 111
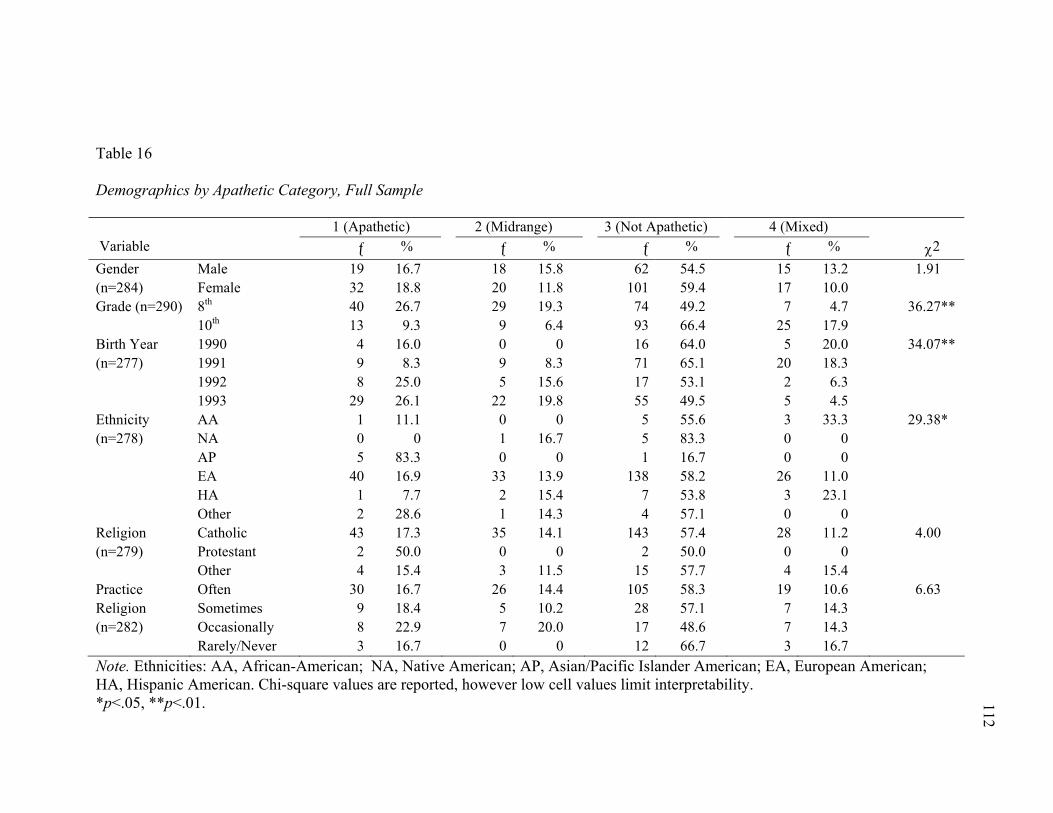
Table 16
Demographics by Apathetic Category, Full Sample
1 (Apathetic) 2 (Midrange) 3 (Not Apathetic) 4 (Mixed) Variable ƒ % ƒ % ƒ % ƒ % χ2
Male 19 16.7 18 15.8 62 54.5 15 13.2 1.91 Gender (n=284) Female 32 18.8 20 11.8 101 59.4 17 10.0
8th 40 26.7 29 19.3 74 49.2 7 4.7 36.27** Grade (n=290) 10th 13 9.3 9 6.4 93 66.4 25 17.9 1990 4 16.0 0 0 16 64.0 5 20.0 34.07** 1991 9 8.3 9 8.3 71 65.1 20 18.3
Birth Year (n=277)
1992 8 25.0 5 15.6 17 53.1 2 6.3 1993 29 26.1 22 19.8 55 49.5 5 4.5
AA 1 11.1 0 0 5 55.6 3 33.3 29.38* NA 0 0 1 16.7 5 83.3 0 0 AP 5 83.3 0 0 1 16.7 0 0
Ethnicity (n=278)
EA 40 16.9 33 13.9 138 58.2 26 11.0 HA 1 7.7 2 15.4 7 53.8 3 23.1 Other 2 28.6 1 14.3 4 57.1 0 0
Catholic 43 17.3 35 14.1 143 57.4 28 11.2 4.00 Religion (n=279) Protestant 2 50.0 0 0 2 50.0 0 0 Other 4 15.4 3 11.5 15 57.7 4 15.4
Often 30 16.7 26 14.4 105 58.3 19 10.6 6.63 Sometimes 9 18.4 5 10.2 28 57.1 7 14.3
Practice Religion (n=282) Occasionally 8 22.9 7 20.0 17 48.6 7 14.3 Rarely/Never 3 16.7 0 0 12 66.7 3 16.7 Note. Ethnicities: AA, African-American; NA, Native American; AP, Asian/Pacific Islander American; EA, European American; HA, Hispanic American. Chi-square values are reported, however low cell values limit interpretability. *p<.05, **p<.01. 112
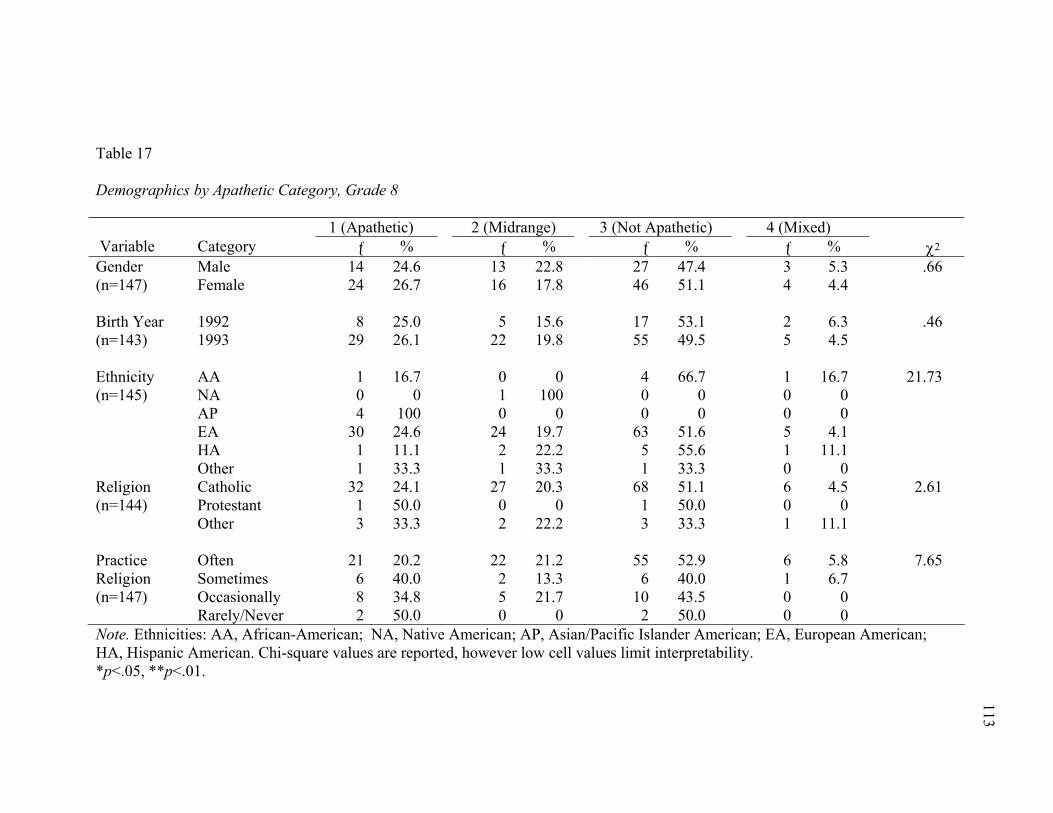
Table 17
Demographics by Apathetic Category, Grade 8
1 (Apathetic) 2 (Midrange) 3 (Not Apathetic) 4 (Mixed) Variable Category ƒ % ƒ % ƒ % ƒ % χ2
Male 14 24.6 13 22.8 27 47.4 3 5.3 .66 Gender (n=147)
Female 24 26.7 16 17.8 46 51.1 4 4.4
1992 8 25.0 5 15.6 17 53.1 2 6.3 .46 Birth Year (n=143)
1993 29 26.1 22 19.8 55 49.5 5 4.5
AA 1 16.7 0 0 4 66.7 1 16.7 21.73 NA 0 0 1 100 0 0 0 0 AP 4 100 0 0 0 0 0 0
Ethnicity (n=145)
EA 30 24.6 24 19.7 63 51.6 5 4.1 HA 1 11.1 2 22.2 5 55.6 1 11.1 Other 1 33.3 1 33.3 1 33.3 0 0
Catholic 32 24.1 27 20.3 68 51.1 6 4.5 2.61 Religion (n=144) Protestant 1 50.0 0 0 1 50.0 0 0
Other 3 33.3 2 22.2 3 33.3 1 11.1
Often 21 20.2 22 21.2 55 52.9 6 5.8 7.65 Sometimes 6 40.0 2 13.3 6 40.0 1 6.7
Practice Religion (n=147) Occasionally 8 34.8 5 21.7 10 43.5 0 0 Rarely/Never 2 50.0 0 0 2 50.0 0 0 Note. Ethnicities: AA, African-American; NA, Native American; AP, Asian/Pacific Islander American; EA, European American; HA, Hispanic American. Chi-square values are reported, however low cell values limit interpretability. *p<.05, **p<.01.
113
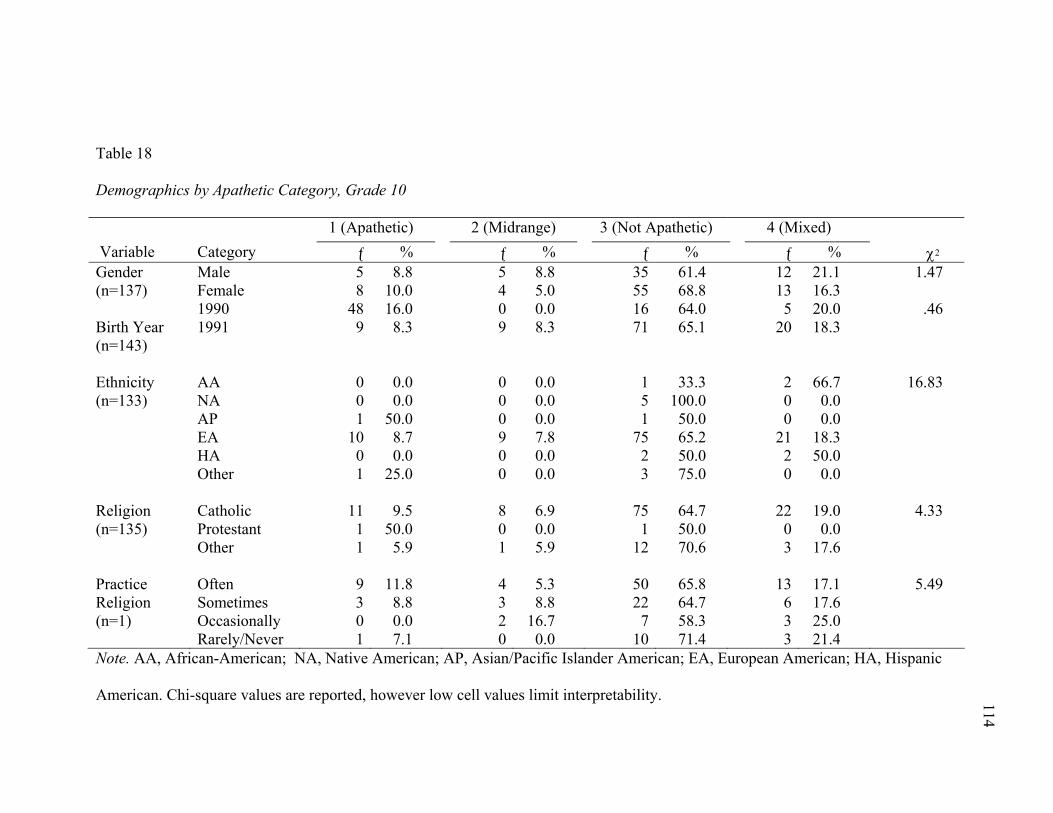
Table 18
Demographics by Apathetic Category, Grade 10
1 (Apathetic) 2 (Midrange) 3 (Not Apathetic) 4 (Mixed) Variable Category ƒ % ƒ % ƒ % ƒ % χ2
Male 5 8.8 5 8.8 35 61.4 12 21.1 1.47 Gender (n=137) Female 8 10.0 4 5.0 55 68.8 13 16.3
1990 48 16.0 0 0.0 16 64.0 5 20.0 .46 Birth Year (n=143)
1991 9 8.3 9 8.3 71 65.1 20 18.3
AA 0 0.0 0 0.0 1 33.3 2 66.7 16.83 NA 0 0.0 0 0.0 5 100.0 0 0.0 AP 1 50.0 0 0.0 1 50.0 0 0.0
Ethnicity (n=133)
EA 10 8.7 9 7.8 75 65.2 21 18.3 HA 0 0.0 0 0.0 2 50.0 2 50.0
Other 1 25.0 0 0.0 3 75.0 0 0.0
Catholic 11 9.5 8 6.9 75 64.7 22 19.0 4.33 Religion (n=135) Protestant 1 50.0 0 0.0 1 50.0 0 0.0
Other 1 5.9 1 5.9 12 70.6 3 17.6
Often 9 11.8 4 5.3 50 65.8 13 17.1 5.49 Sometimes 3 8.8 3 8.8 22 64.7 6 17.6
Practice Religion (n=1) Occasionally 0 0.0 2 16.7 7 58.3 3 25.0 Rarely/Never 1 7.1 0 0.0 10 71.4 3 21.4 Note. AA, African-American; NA, Native American; AP, Asian/Pacific Islander American; EA, European American; HA, Hispanic
American. Chi-square values are reported, however low cell values limit interpretability. 114
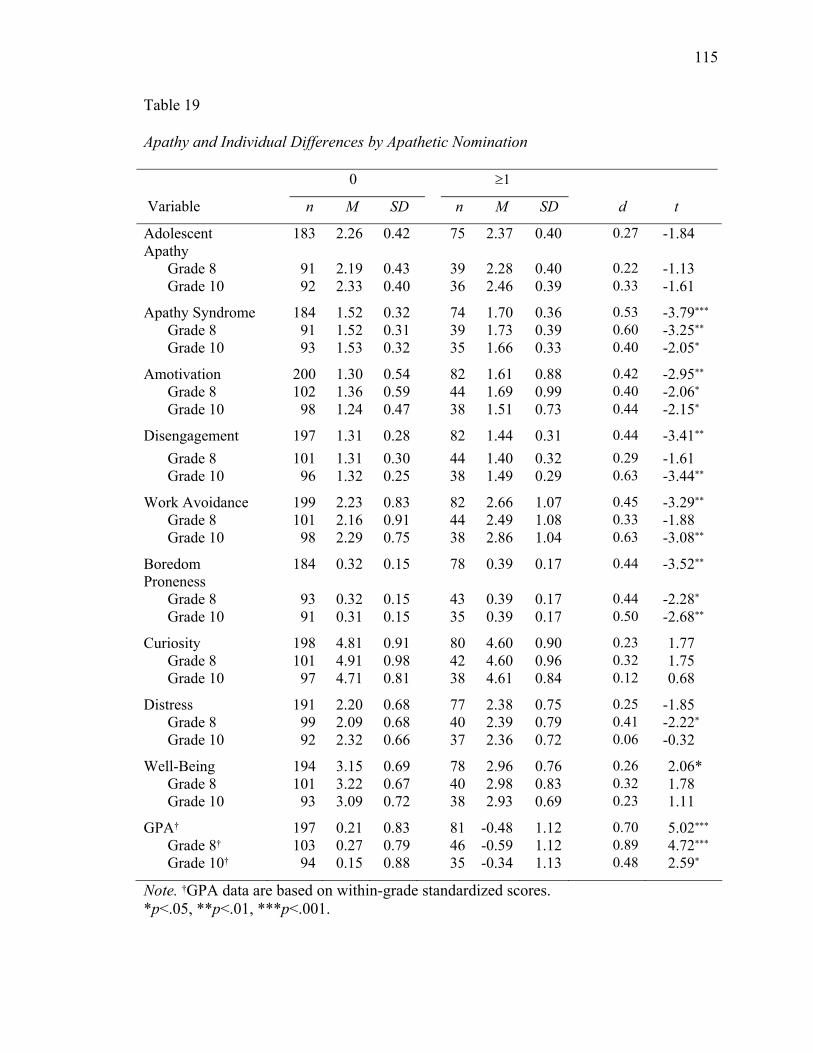
115
Table 19
Apathy and Individual Differences by Apathetic Nomination
0 ≥1
Variable n M SD n M SD d t
Adolescent Apathy
183 2.26 0.42 75 2.37 0.40 0.27 -1.84
Grade 8 91 2.19 0.43 39 2.28 0.40 0.22 -1.13 Grade 10 92 2.33 0.40 36 2.46 0.39 0.33 -1.61
Apathy Syndrome 184 1.52 0.32 74 1.70 0.36 0.53 -3.79*** Grade 8 91 1.52 0.31 39 1.73 0.39 0.60 -3.25** Grade 10 93 1.53 0.32 35 1.66 0.33 0.40 -2.05*
Amotivation 200 1.30 0.54 82 1.61 0.88 0.42 -2.95** Grade 8 102 1.36 0.59 44 1.69 0.99 0.40 -2.06* Grade 10 98 1.24 0.47 38 1.51 0.73 0.44 -2.15*
Disengagement 197 1.31 0.28 82 1.44 0.31 0.44 -3.41** Grade 8 101 1.31 0.30 44 1.40 0.32 0.29 -1.61 Grade 10 96 1.32 0.25 38 1.49 0.29 0.63 -3.44**
Work Avoidance 199 2.23 0.83 82 2.66 1.07 0.45 -3.29** Grade 8 101 2.16 0.91 44 2.49 1.08 0.33 -1.88 Grade 10 98 2.29 0.75 38 2.86 1.04 0.63 -3.08**
Boredom Proneness
184 0.32 0.15 78 0.39 0.17 0.44 -3.52**
Grade 8 93 0.32 0.15 43 0.39 0.17 0.44 -2.28* Grade 10 91 0.31 0.15 35 0.39 0.17 0.50 -2.68**
Curiosity 198 4.81 0.91 80 4.60 0.90 0.23 1.77 Grade 8 101 4.91 0.98 42 4.60 0.96 0.32 1.75 Grade 10 97 4.71 0.81 38 4.61 0.84 0.12 0.68
Distress 191 2.20 0.68 77 2.38 0.75 0.25 -1.85 Grade 8 99 2.09 0.68 40 2.39 0.79 0.41 -2.22* Grade 10 92 2.32 0.66 37 2.36 0.72 0.06 -0.32
Well-Being 194 3.15 0.69 78 2.96 0.76 0.26 2.06* Grade 8 101 3.22 0.67 40 2.98 0.83 0.32 1.78 Grade 10 93 3.09 0.72 38 2.93 0.69 0.23 1.11
GPA† 197 0.21 0.83 81 -0.48 1.12 0.70 5.02*** Grade 8† 103 0.27 0.79 46 -0.59 1.12 0.89 4.72*** Grade 10† 94 0.15 0.88 35 -0.34 1.13 0.48 2.59*
Note. †GPA data are based on within-grade standardized scores. *p<.05, **p<.01, ***p<.001.
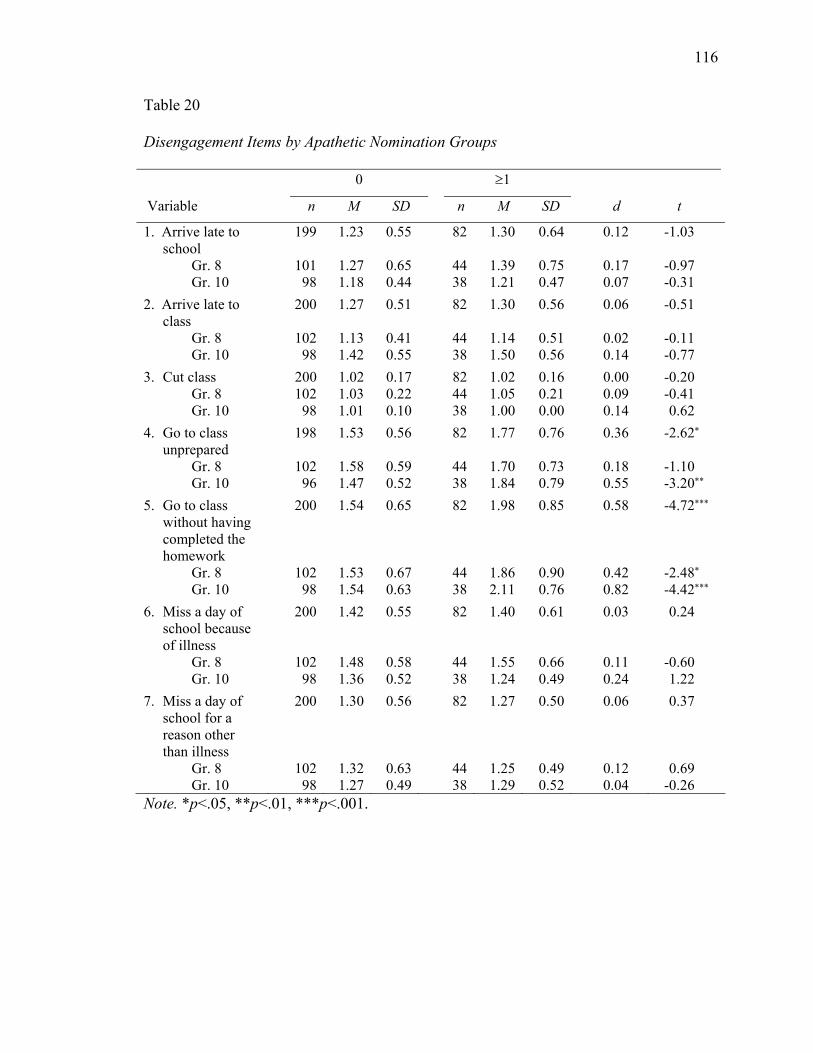
116
Table 20
Disengagement Items by Apathetic Nomination Groups
0 ≥1
Variable n M SD n M SD d t
1. Arrive late to school
199 1.23 0.55 82 1.30 0.64 0.12 -1.03
Gr. 8 101 1.27 0.65 44 1.39 0.75 0.17 -0.97 Gr. 10 98 1.18 0.44 38 1.21 0.47 0.07 -0.31 2. Arrive late to
class 200 1.27 0.51 82 1.30 0.56 0.06 -0.51
Gr. 8 102 1.13 0.41 44 1.14 0.51 0.02 -0.11 Gr. 10 98 1.42 0.55 38 1.50 0.56 0.14 -0.77 3. Cut class 200 1.02 0.17 82 1.02 0.16 0.00 -0.20 Gr. 8 102 1.03 0.22 44 1.05 0.21 0.09 -0.41 Gr. 10 98 1.01 0.10 38 1.00 0.00 0.14 0.62 4. Go to class
unprepared 198 1.53 0.56 82 1.77 0.76 0.36 -2.62*
Gr. 8 102 1.58 0.59 44 1.70 0.73 0.18 -1.10 Gr. 10 96 1.47 0.52 38 1.84 0.79 0.55 -3.20** 5. Go to class
without having completed the homework
200 1.54 0.65 82 1.98 0.85 0.58 -4.72***
Gr. 8 102 1.53 0.67 44 1.86 0.90 0.42 -2.48* Gr. 10 98 1.54 0.63 38 2.11 0.76 0.82 -4.42*** 6. Miss a day of
school because of illness
200 1.42 0.55 82 1.40 0.61 0.03 0.24
Gr. 8 102 1.48 0.58 44 1.55 0.66 0.11 -0.60 Gr. 10 98 1.36 0.52 38 1.24 0.49 0.24 1.22 7. Miss a day of
school for a reason other than illness
200 1.30 0.56 82 1.27 0.50 0.06 0.37
Gr. 8 102 1.32 0.63 44 1.25 0.49 0.12 0.69 Gr. 10 98 1.27 0.49 38 1.29 0.52 0.04 -0.26 Note. *p<.05, **p<.01, ***p<.001.
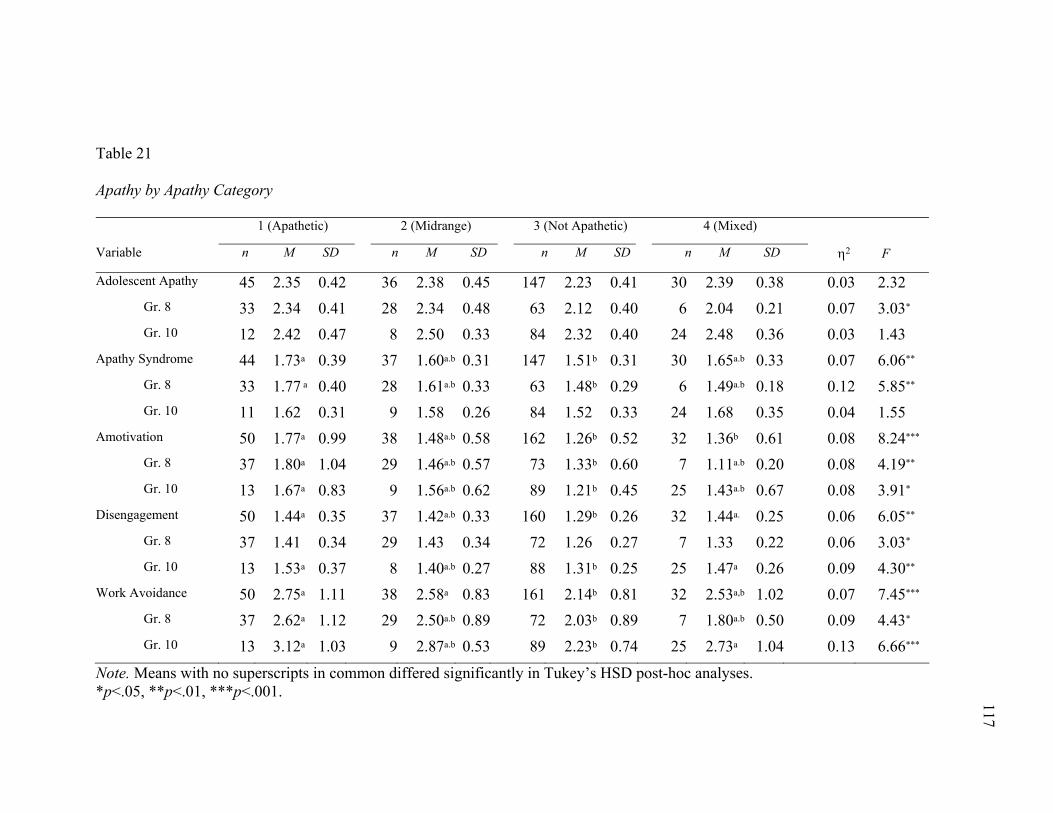
Table 21
Apathy by Apathy Category
1 (Apathetic) 2 (Midrange) 3 (Not Apathetic) 4 (Mixed)
Variable n M SD n M SD n M SD n M SD η2 F
Adolescent Apathy 45 2.35 0.42 36 2.38 0.45 147 2.23 0.41 30 2.39 0.38 0.03 2.32 Gr. 8 33 2.34 0.41 28 2.34 0.48 63 2.12 0.40 6 2.04 0.21 0.07 3.03* Gr. 10 12 2.42 0.47 8 2.50 0.33 84 2.32 0.40 24 2.48 0.36 0.03 1.43 Apathy Syndrome 44 1.73a 0.39 37 1.60a.b 0.31 147 1.51b 0.31 30 1.65a.b 0.33 0.07 6.06** Gr. 8 33 1.77 a 0.40 28 1.61a.b 0.33 63 1.48b 0.29 6 1.49a.b 0.18 0.12 5.85** Gr. 10 11 1.62 0.31 9 1.58 0.26 84 1.52 0.33 24 1.68 0.35 0.04 1.55 Amotivation 50 1.77a 0.99 38 1.48a.b 0.58 162 1.26b 0.52 32 1.36b 0.61 0.08 8.24*** Gr. 8 37 1.80a 1.04 29 1.46a.b 0.57 73 1.33b 0.60 7 1.11a.b 0.20 0.08 4.19** Gr. 10 13 1.67a 0.83 9 1.56a.b 0.62 89 1.21b 0.45 25 1.43a.b 0.67 0.08 3.91* Disengagement 50 1.44a 0.35 37 1.42a.b 0.33 160 1.29b 0.26 32 1.44a. 0.25 0.06 6.05** Gr. 8 37 1.41 0.34 29 1.43 0.34 72 1.26 0.27 7 1.33 0.22 0.06 3.03* Gr. 10 13 1.53a 0.37 8 1.40a.b 0.27 88 1.31b 0.25 25 1.47a 0.26 0.09 4.30** Work Avoidance 50 2.75a 1.11 38 2.58a 0.83 161 2.14b 0.81 32 2.53a,b 1.02 0.07 7.45*** Gr. 8 37 2.62a 1.12 29 2.50a.b 0.89 72 2.03b 0.89 7 1.80a.b 0.50 0.09 4.43* Gr. 10 13 3.12a 1.03 9 2.87a.b 0.53 89 2.23b 0.74 25 2.73a 1.04 0.13 6.66***
Note. Means with no superscripts in common differed significantly in Tukey’s HSD post-hoc analyses. *p<.05, **p<.01, ***p<.001. 117
117
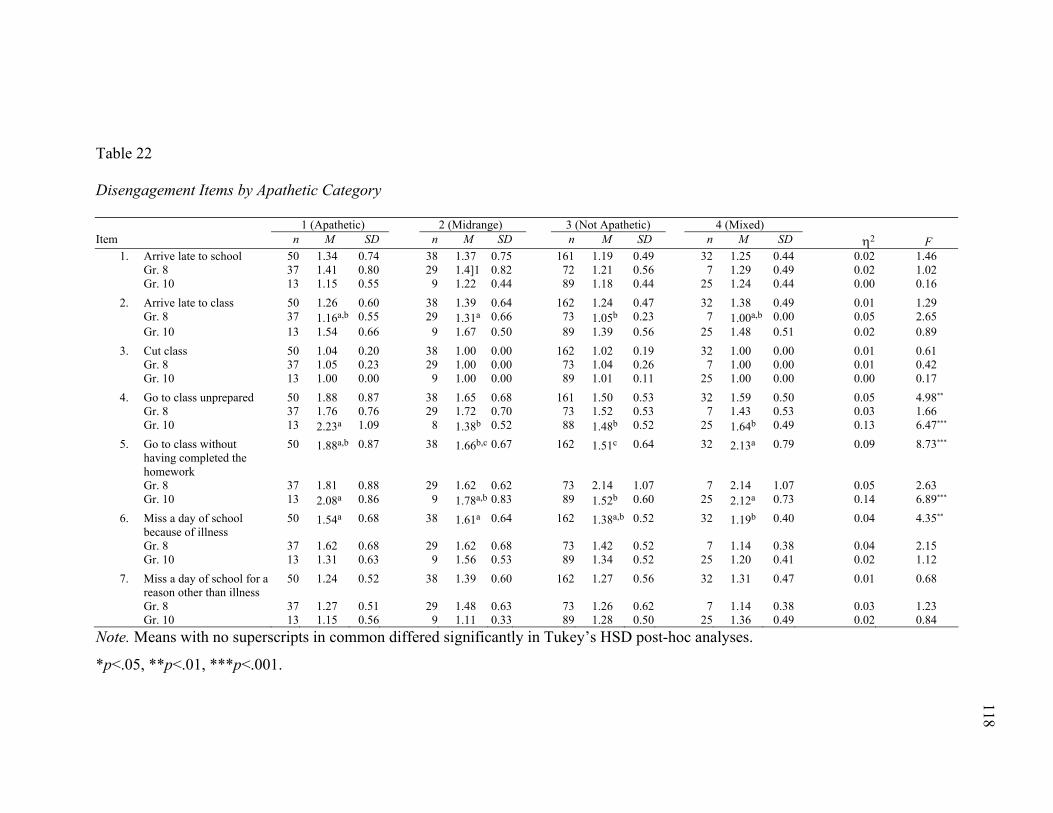
Table 22
Disengagement Items by Apathetic Category
1 (Apathetic) 2 (Midrange) 3 (Not Apathetic) 4 (Mixed) Item n M SD n M SD n M SD n M SD η2 F
1. Arrive late to school 50 1.34 0.74 38 1.37 0.75 161 1.19 0.49 32 1.25 0.44 0.02 1.46 Gr. 8 37 1.41 0.80 29 1.4]1 0.82 72 1.21 0.56 7 1.29 0.49 0.02 1.02 Gr. 10 13 1.15 0.55 9 1.22 0.44 89 1.18 0.44 25 1.24 0.44 0.00 0.16
2. Arrive late to class 50 1.26 0.60 38 1.39 0.64 162 1.24 0.47 32 1.38 0.49 0.01 1.29 Gr. 8 37 1.16a,b 0.55 29 1.31a 0.66 73 1.05b 0.23 7 1.00a,b 0.00 0.05 2.65 Gr. 10 13 1.54 0.66 9 1.67 0.50 89 1.39 0.56 25 1.48 0.51 0.02 0.89
3. Cut class 50 1.04 0.20 38 1.00 0.00 162 1.02 0.19 32 1.00 0.00 0.01 0.61 Gr. 8 37 1.05 0.23 29 1.00 0.00 73 1.04 0.26 7 1.00 0.00 0.01 0.42 Gr. 10 13 1.00 0.00 9 1.00 0.00 89 1.01 0.11 25 1.00 0.00 0.00 0.17
4. Go to class unprepared 50 1.88 0.87 38 1.65 0.68 161 1.50 0.53 32 1.59 0.50 0.05 4.98** Gr. 8 37 1.76 0.76 29 1.72 0.70 73 1.52 0.53 7 1.43 0.53 0.03 1.66 Gr. 10 13 2.23a 1.09 8 1.38b 0.52 88 1.48b 0.52 25 1.64b 0.49 0.13 6.47***
5. Go to class without having completed the homework
50 1.88a,b 0.87 38 1.66b,c 0.67 162 1.51c 0.64 32 2.13a 0.79 0.09 8.73***
Gr. 8 37 1.81 0.88 29 1.62 0.62 73 2.14 1.07 7 2.14 1.07 0.05 2.63 Gr. 10 13 2.08a 0.86 9 1.78a,b 0.83 89 1.52b 0.60 25 2.12a 0.73 0.14 6.89***
6. Miss a day of school because of illness
50 1.54a 0.68 38 1.61a 0.64 162 1.38a,b 0.52 32 1.19b 0.40 0.04 4.35**
Gr. 8 37 1.62 0.68 29 1.62 0.68 73 1.42 0.52 7 1.14 0.38 0.04 2.15 Gr. 10 13 1.31 0.63 9 1.56 0.53 89 1.34 0.52 25 1.20 0.41 0.02 1.12
7. Miss a day of school for a reason other than illness
50 1.24 0.52 38 1.39 0.60 162 1.27 0.56 32 1.31 0.47 0.01 0.68
Gr. 8 37 1.27 0.51 29 1.48 0.63 73 1.26 0.62 7 1.14 0.38 0.03 1.23 Gr. 10 13 1.15 0.56 9 1.11 0.33 89 1.28 0.50 25 1.36 0.49 0.02 0.84 Note. Means with no superscripts in common differed significantly in Tukey’s HSD post-hoc analyses.
*p<.05, **p<.01, ***p<.001.
118
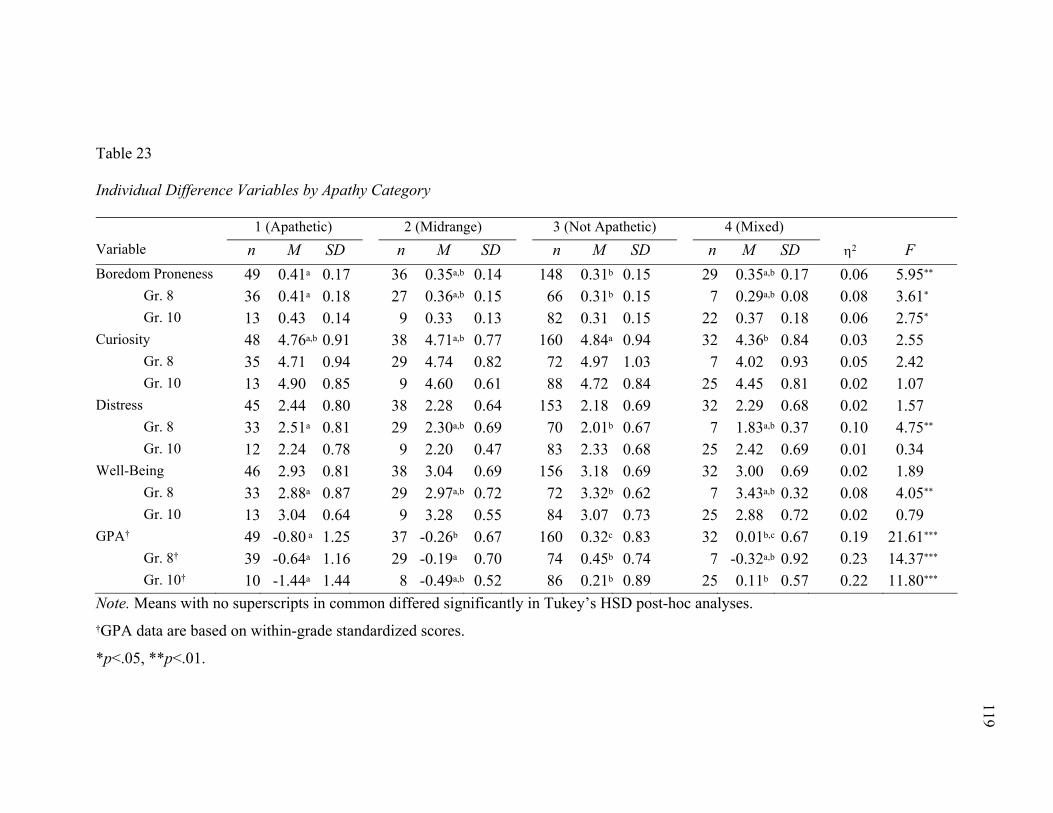
Table 23
Individual Difference Variables by Apathy Category
1 (Apathetic) 2 (Midrange) 3 (Not Apathetic) 4 (Mixed) Variable n M SD n M SD n M SD n M SD η2 F Boredom Proneness 49 0.41a 0.17 36 0.35a,b 0.14 148 0.31b 0.15 29 0.35a,b 0.17 0.06 5.95** Gr. 8 36 0.41a 0.18 27 0.36a,b 0.15 66 0.31b 0.15 7 0.29a,b 0.08 0.08 3.61* Gr. 10 13 0.43 0.14 9 0.33 0.13 82 0.31 0.15 22 0.37 0.18 0.06 2.75* Curiosity 48 4.76a,b 0.91 38 4.71a,b 0.77 160 4.84a 0.94 32 4.36b 0.84 0.03 2.55 Gr. 8 35 4.71 0.94 29 4.74 0.82 72 4.97 1.03 7 4.02 0.93 0.05 2.42 Gr. 10 13 4.90 0.85 9 4.60 0.61 88 4.72 0.84 25 4.45 0.81 0.02 1.07 Distress 45 2.44 0.80 38 2.28 0.64 153 2.18 0.69 32 2.29 0.68 0.02 1.57 Gr. 8 33 2.51a 0.81 29 2.30a,b 0.69 70 2.01b 0.67 7 1.83a,b 0.37 0.10 4.75** Gr. 10 12 2.24 0.78 9 2.20 0.47 83 2.33 0.68 25 2.42 0.69 0.01 0.34 Well-Being 46 2.93 0.81 38 3.04 0.69 156 3.18 0.69 32 3.00 0.69 0.02 1.89 Gr. 8 33 2.88a 0.87 29 2.97a,b 0.72 72 3.32b 0.62 7 3.43a,b 0.32 0.08 4.05** Gr. 10 13 3.04 0.64 9 3.28 0.55 84 3.07 0.73 25 2.88 0.72 0.02 0.79 GPA† 49 -0.80 a 1.25 37 -0.26b 0.67 160 0.32c 0.83 32 0.01b,c 0.67 0.19 21.61*** Gr. 8† 39 -0.64a 1.16 29 -0.19a 0.70 74 0.45b 0.74 7 -0.32a,b 0.92 0.23 14.37*** Gr. 10† 10 -1.44a 1.44 8 -0.49a,b 0.52 86 0.21b 0.89 25 0.11b 0.57 0.22 11.80*** Note. Means with no superscripts in common differed significantly in Tukey’s HSD post-hoc analyses. †GPA data are based on within-grade standardized scores.
*p<.05, **p<.01.
119
120
Statistical Independence of Research-Based Conceptualizations of Apathy
Bivariate Correlations of Apathy Constructs
Multiple statistical analyses were undertaken to assess the degree of independence
of research-based apathy variables. First, zero-order correlations were computed to assess
the relations between all bivariate combinations of apathy constructs, as shown in Table
9. Cohen (1992) defined small, medium, and large effect sizes for bivariate correlations
as .10, .30, and .50, respectively. In the full sample all relations were positive as expected
and, with the exception of disengagement, yielded moderate to strong effect sizes. Strong
relations, all at p<.000, were found between adolescent apathy and apathy syndrome
(r=.59); work avoidance was strongly correlated to both apathy syndrome (r=.58) and
amotivation (r=.60). Disengagement was moderately correlated with apathy syndrome
(r=.33) and work avoidance (r=.41).
These results suggest that notwithstanding some degree of independence among
these variables, a great deal of variance is shared by the operationalization of these
research-based constructs. This may be due to a direct relationship, or, alternatively, to an
additional variable or variables. Of interest in light of prior research is the strong relation
found in the present study between amotivation and work avoidance. Using highly
similar operationalizations of both constructs in a sample of undergraduates, Smith and
colleagues (2002) reported a bivariate correlation of .32. The lower correlation obtained
in the older sample could be due to a differentiation of these constructs over time, such
that they diminish in covariance. Additional research would be required to confirm this
seedling hypothesis.
121
Test- and Item-Level Factor Analyses of Apathy Constructs
A second set of analyses entailed conducting factor analyses on the research-
based apathy variables, first at the test level and then at the item level. For the test-level
factor analysis, 5 factors were extracted using principal components analysis (PCA) with
varimax rotation, using .400 as the cut point for factor loadings (Guadanogli & Velicer,
1988). Results are displayed in Table 24. Consistent with preliminary correlational
analyses, each composite variable was the only item loading on a single factor, indicating
independence among constructs. However, it bears noting that apathy syndrome loaded
rather high on the adolescent apathy scale.
Given that PCA attempts to explain score variance and an aim of the present study
was to determine the nature of relations among existing apathy constructs, principal axis
factoring (PAF)—which seeks to relations, rather than variance, among variables—was
also performed at the test-score level. Any PAF test will yield a maximum of k-1 factors,
where k is the number of variables entered. The test-level PAF yielded three factors. As
shown in Table 25, PAF results reinforce the interpretation of the bivariate correlations,
suggesting that as operationalized in the present study, adolescent apathy and apathy
syndrome are closely related, as are amotivation and work avoidance, and disengagement
and work avoidance.
As anticipated in the study hypotheses, results from the PAF analysis suggested
that greater parsimony could be obtained by a reconceptualization of the set of five
constructs into a reduced set of variables. To explore this hypothesis, hybrid constructs
were created. First, to determine the number of factors to extract, principal components
analysis was performed at the item-level using all 61 items from the five apathy
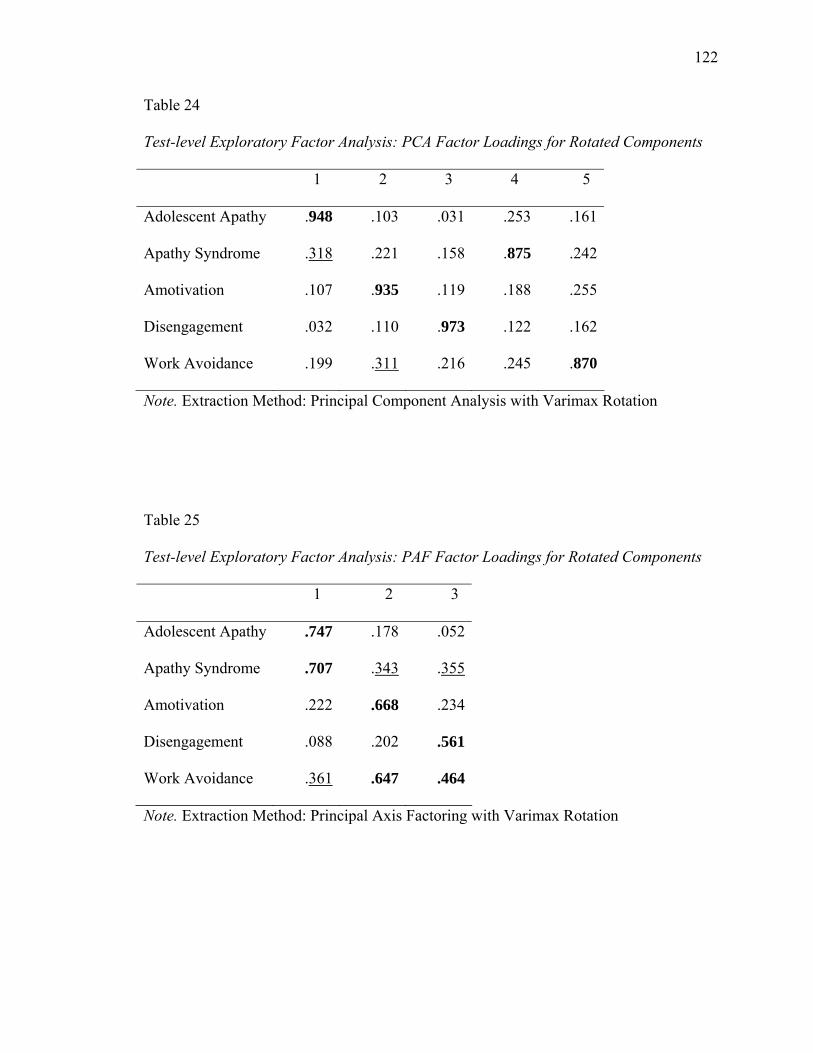
122
Table 24
Test-level Exploratory Factor Analysis: PCA Factor Loadings for Rotated Components
1 2 3 4 5
Adolescent Apathy .948 .103 .031 .253 .161
Apathy Syndrome .318 .221 .158 .875 .242
Amotivation .107 .935 .119 .188 .255
Disengagement .032 .110 .973 .122 .162
Work Avoidance .199 .311 .216 .245 .870
Note. Extraction Method: Principal Component Analysis with Varimax Rotation
Table 25
Test-level Exploratory Factor Analysis: PAF Factor Loadings for Rotated Components
1 2 3
Adolescent Apathy .747 .178 .052
Apathy Syndrome .707 .343 .355
Amotivation .222 .668 .234
Disengagement .088 .202 .561
Work Avoidance .361 .647 .464
Note. Extraction Method: Principal Axis Factoring with Varimax Rotation
123
measures. Examination of the scree plot and factor eigenvalues indicated that two factors
should be extracted. A second PCA was performed, extracting two factors and applying
varimax rotation to increase factor clarity. Resultant factor loadings are displayed in
Appendix N. Loadings of each item on the two factors were reviewed, and those not
loading above .400 on a single factor were dropped from further analyses. The threshold
of .400 was selected in light of Guadagnoli and Velicer’s (1988) findings regarding the
relation of sample size to component pattern stability.
Twenty-one items remained after this process. These items were again analyzed
using PCA with varimax rotation, specifying extraction of two factors. These items and
their resultant factor loadings are shown in Table 26; Table 27 displays factor
correlations with each apathy variable. Examination of items for each factor suggested
that Factor 1 pertained to school’s irrelevance (Cronbach’s α = .87), and Factor 2 to
participants’ positive life interest (Cronbach’s α = .76). These hybrid factors were thus
labeled School Irrelevant and Positive Life Interest, respectively. Together, they
explained 42.7% of the total variance for this set of items. Participants’ scores for each
factor were generated using the regression method. Relations of the hybrid apathy factors
to individual differences, as well as grade-level comparisons of factor structure, are taken
up in the presentation of results for research questions two and three.
It must be emphasized that the creation of hybrid factors from a set of items
developed for different constructs built upon different theoretical rationales is a highly
exploratory affair and should be interpreted with great caution. Nevertheless, there are at
least two reasons why the outcome of this analysis has important implications for future
research. First, if independence existed in the operationalizations of the five constructs
124
assessed, then the exploratory item-level factor analysis with oblimin rotation should
have resulted in items associated with each construct loading together on distinct factors.
However, this result did not obtain.
The second observation worthy of attention is reinforced by the qualitative data
presented in Chapter 5 and addressed in more detail in Chapter 6. It regards the
theoretical coherence of the items that fell into the two hybrid factors. The first factor
(School Irrelevant) indicates a conceptualization of school-related apathy, or of lack of
motivation, in terms of perceived lack of reasons for being in school and a concomitant
lack of volition to engage in school-related activities. A general attitude of interest toward
life links the items on the second hybrid factor. As the data presented in Chapter 5 reveal,
the concept of interest emerged strongly in folk conceptualizations of motivation, with
“uninteresting” and “not being interested” arising frequently in students’ descriptions of
their lack of motivation. Reasons, volition, and interest thus represent promising avenues
to pursue towards greater insight into students’ lack of school-related motivation.
Cluster Analyses Using a Variate of Apathy Constructs
Whereas factor analyses examine the structure of a set of variables, cluster
analyses offer insight into the structure of participants. Although cluster analysis is a non-
statistical test and thus inappropriate for making population inferences, the structures
which emerge provide a useful way to objectively measure distances between
participants’ multivariate responses and to group those who are closest to one another in
the response space. For purposes of the present study, cluster analyses offered a useful
way both to identify apathy indicator patterns common to groups of students, as well as to
obtain a sense of proportions of students in distinct apathy-level groupings.
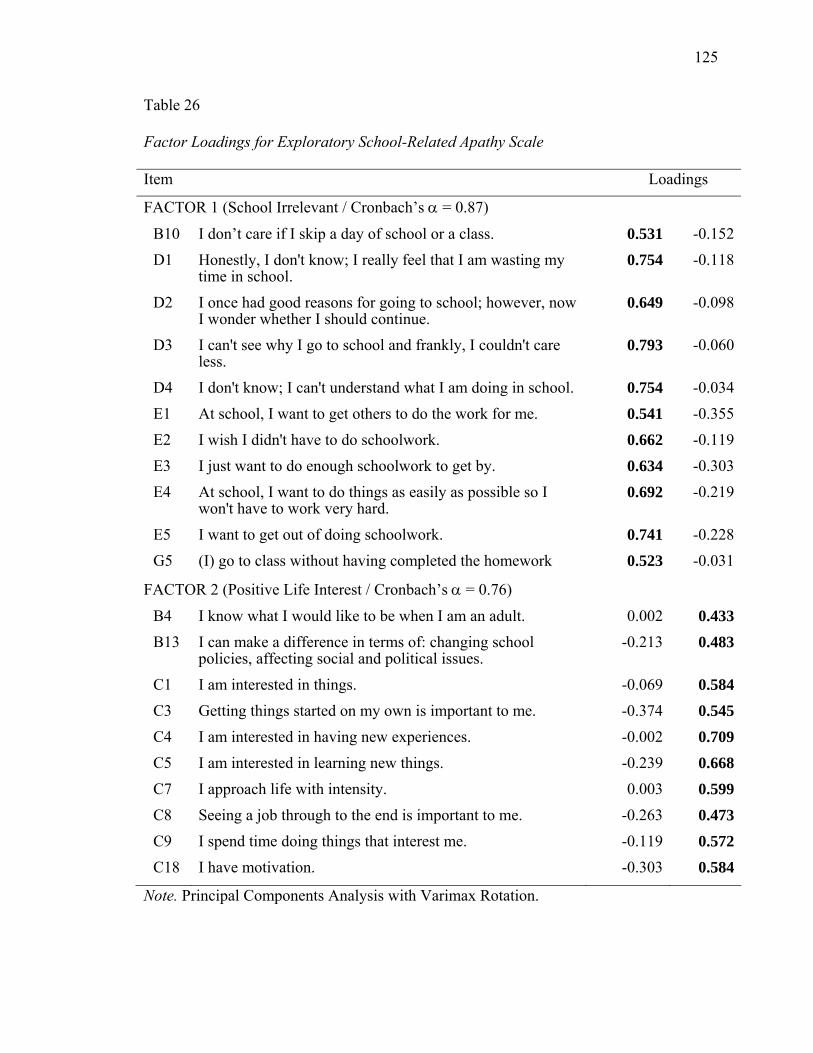
125
Table 26
Factor Loadings for Exploratory School-Related Apathy Scale
Item Loadings
FACTOR 1 (School Irrelevant / Cronbach’s α = 0.87)
B10 I don’t care if I skip a day of school or a class. 0.531 -0.152D1 Honestly, I don't know; I really feel that I am wasting my
time in school. 0.754 -0.118
D2 I once had good reasons for going to school; however, now I wonder whether I should continue.
0.649 -0.098
D3 I can't see why I go to school and frankly, I couldn't care less.
0.793 -0.060
D4 I don't know; I can't understand what I am doing in school. 0.754 -0.034E1 At school, I want to get others to do the work for me. 0.541 -0.355E2 I wish I didn't have to do schoolwork. 0.662 -0.119E3 I just want to do enough schoolwork to get by. 0.634 -0.303E4 At school, I want to do things as easily as possible so I
won't have to work very hard. 0.692 -0.219
E5 I want to get out of doing schoolwork. 0.741 -0.228G5 (I) go to class without having completed the homework 0.523 -0.031
FACTOR 2 (Positive Life Interest / Cronbach’s α = 0.76)
B4 I know what I would like to be when I am an adult. 0.002 0.433B13 I can make a difference in terms of: changing school
policies, affecting social and political issues. -0.213 0.483
C1 I am interested in things. -0.069 0.584C3 Getting things started on my own is important to me. -0.374 0.545C4 I am interested in having new experiences. -0.002 0.709C5 I am interested in learning new things. -0.239 0.668C7 I approach life with intensity. 0.003 0.599C8 Seeing a job through to the end is important to me. -0.263 0.473C9 I spend time doing things that interest me. -0.119 0.572C18 I have motivation. -0.303 0.584
Note. Principal Components Analysis with Varimax Rotation.
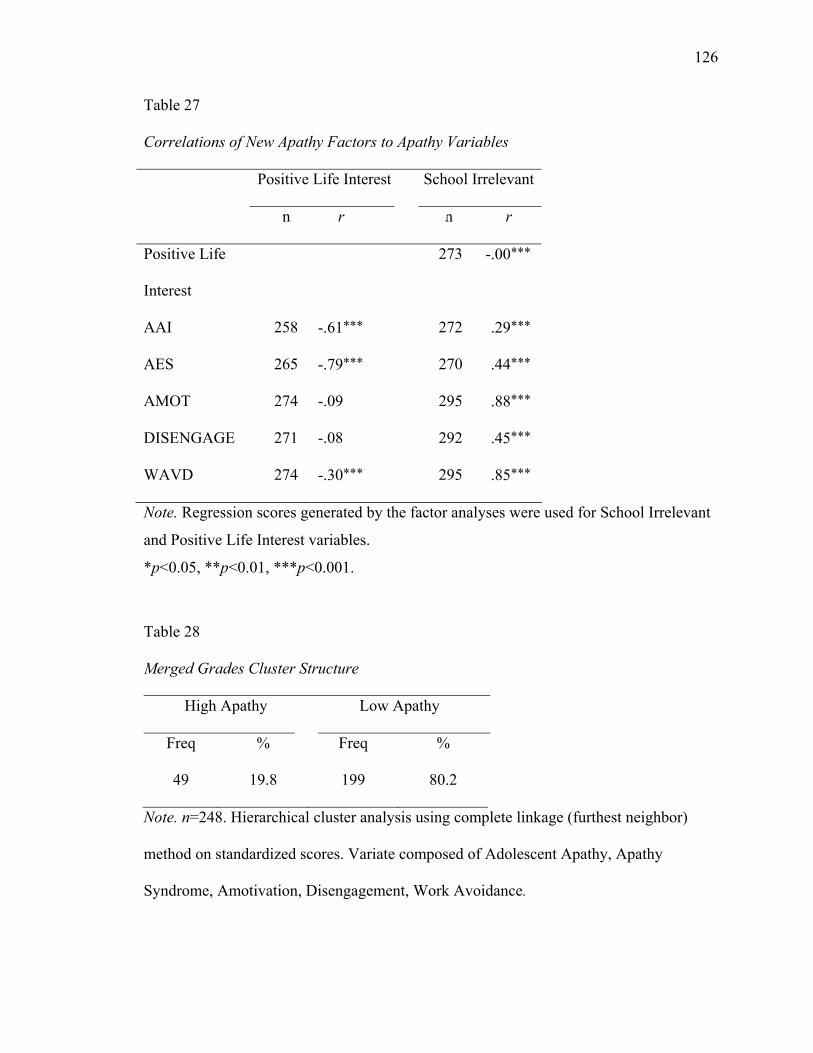
126
Table 27
Correlations of New Apathy Factors to Apathy Variables
Positive Life Interest School Irrelevant
n r n r
Positive Life
Interest
273 -.00***
AAI 258 -.61*** 272 .29***
AES 265 -.79*** 270 .44***
AMOT 274 -.09 295 .88***
DISENGAGE 271 -.08 292 .45***
WAVD 274 -.30*** 295 .85***
Note. Regression scores generated by the factor analyses were used for School Irrelevant
and Positive Life Interest variables.
*p<0.05, **p<0.01, ***p<0.001.
Table 28
Merged Grades Cluster Structure
High Apathy Low Apathy
Freq % Freq %
49 19.8 199 80.2
Note. n=248. Hierarchical cluster analysis using complete linkage (furthest neighbor)
method on standardized scores. Variate composed of Adolescent Apathy, Apathy
Syndrome, Amotivation, Disengagement, Work Avoidance.
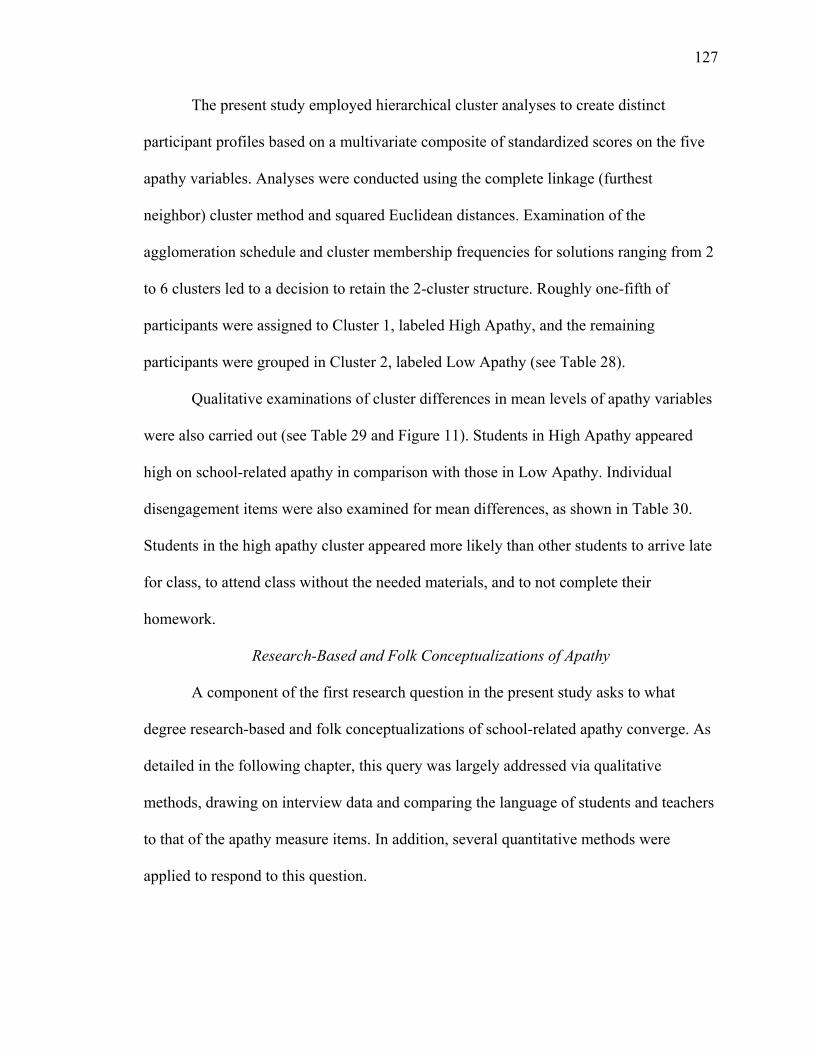
127
The present study employed hierarchical cluster analyses to create distinct
participant profiles based on a multivariate composite of standardized scores on the five
apathy variables. Analyses were conducted using the complete linkage (furthest
neighbor) cluster method and squared Euclidean distances. Examination of the
agglomeration schedule and cluster membership frequencies for solutions ranging from 2
to 6 clusters led to a decision to retain the 2-cluster structure. Roughly one-fifth of
participants were assigned to Cluster 1, labeled High Apathy, and the remaining
participants were grouped in Cluster 2, labeled Low Apathy (see Table 28).
Qualitative examinations of cluster differences in mean levels of apathy variables
were also carried out (see Table 29 and Figure 11). Students in High Apathy appeared
high on school-related apathy in comparison with those in Low Apathy. Individual
disengagement items were also examined for mean differences, as shown in Table 30.
Students in the high apathy cluster appeared more likely than other students to arrive late
for class, to attend class without the needed materials, and to not complete their
homework.
Research-Based and Folk Conceptualizations of Apathy
A component of the first research question in the present study asks to what
degree research-based and folk conceptualizations of school-related apathy converge. As
detailed in the following chapter, this query was largely addressed via qualitative
methods, drawing on interview data and comparing the language of students and teachers
to that of the apathy measure items. In addition, several quantitative methods were
applied to respond to this question.
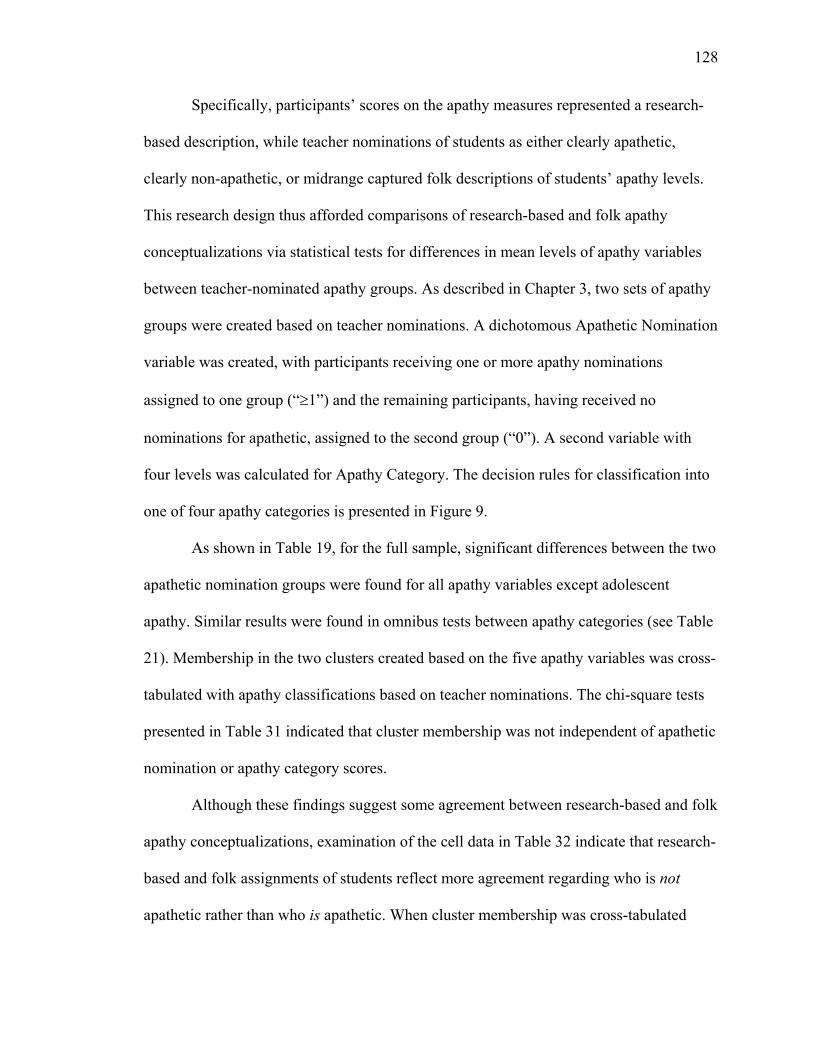
128
Specifically, participants’ scores on the apathy measures represented a research-
based description, while teacher nominations of students as either clearly apathetic,
clearly non-apathetic, or midrange captured folk descriptions of students’ apathy levels.
This research design thus afforded comparisons of research-based and folk apathy
conceptualizations via statistical tests for differences in mean levels of apathy variables
between teacher-nominated apathy groups. As described in Chapter 3, two sets of apathy
groups were created based on teacher nominations. A dichotomous Apathetic Nomination
variable was created, with participants receiving one or more apathy nominations
assigned to one group (“≥1”) and the remaining participants, having received no
nominations for apathetic, assigned to the second group (“0”). A second variable with
four levels was calculated for Apathy Category. The decision rules for classification into
one of four apathy categories is presented in Figure 9.
As shown in Table 19, for the full sample, significant differences between the two
apathetic nomination groups were found for all apathy variables except adolescent
apathy. Similar results were found in omnibus tests between apathy categories (see Table
21). Membership in the two clusters created based on the five apathy variables was cross-
tabulated with apathy classifications based on teacher nominations. The chi-square tests
presented in Table 31 indicated that cluster membership was not independent of apathetic
nomination or apathy category scores.
Although these findings suggest some agreement between research-based and folk
apathy conceptualizations, examination of the cell data in Table 32 indicate that research-
based and folk assignments of students reflect more agreement regarding who is not
apathetic rather than who is apathetic. When cluster membership was cross-tabulated
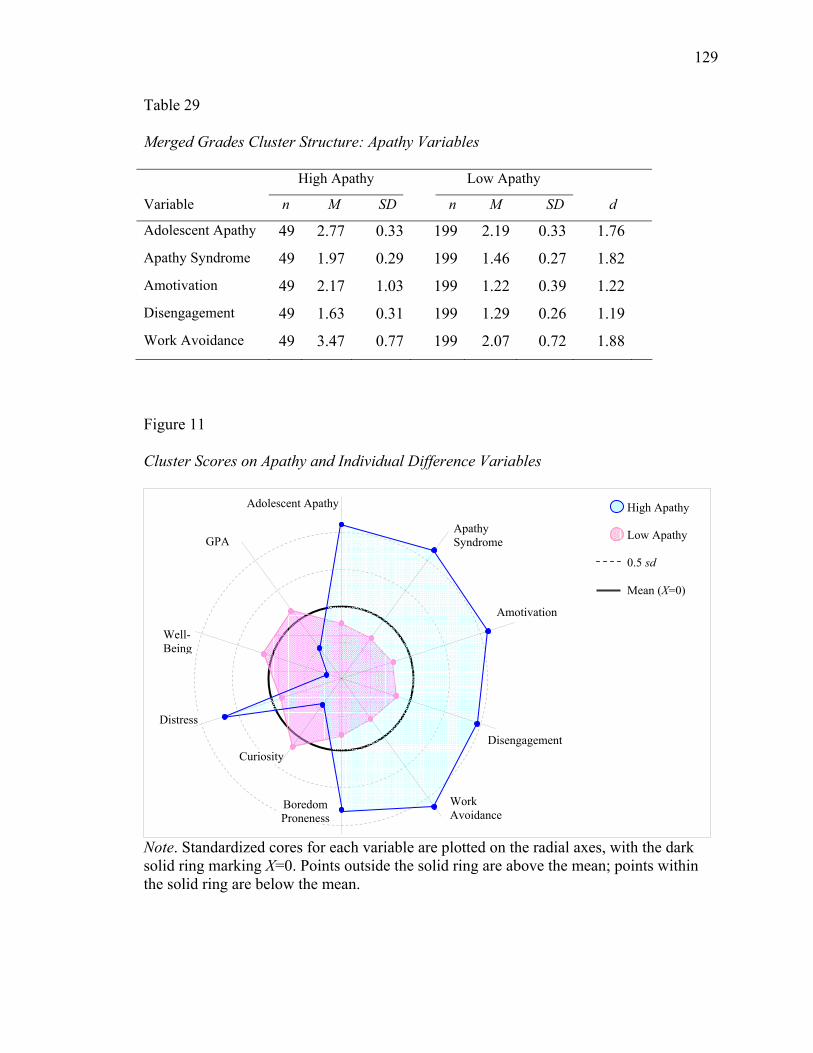
129
Table 29
Merged Grades Cluster Structure: Apathy Variables
High Apathy Low Apathy
Variable n M SD n M SD d
Adolescent Apathy 49 2.77 0.33 199 2.19 0.33 1.76
Apathy Syndrome 49 1.97 0.29 199 1.46 0.27 1.82
Amotivation 49 2.17 1.03 199 1.22 0.39 1.22
Disengagement 49 1.63 0.31 199 1.29 0.26 1.19
Work Avoidance 49 3.47 0.77 199 2.07 0.72 1.88
Figure 11
Cluster Scores on Apathy and Individual Difference Variables
Note. Standardized cores for each variable are plotted on the radial axes, with the dark solid ring marking X=0. Points outside the solid ring are above the mean; points within the solid ring are below the mean.
Adolescent Apathy
Apathy Syndrome
Amotivation
Disengagement
Work Avoidance
Boredom Proneness
Curiosity
Distress
Well-Being
GPA
High Apathy Low Apathy 0.5 sd Mean (X=0)
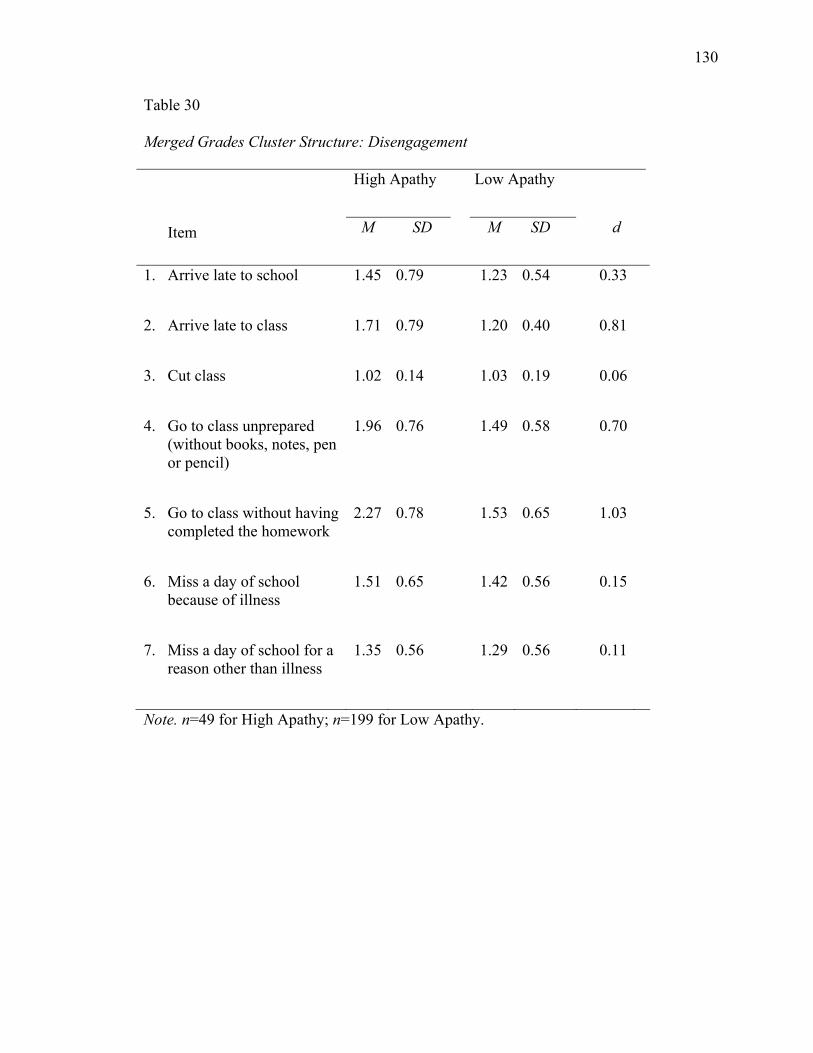
130
Table 30
Merged Grades Cluster Structure: Disengagement
High Apathy Low Apathy
Item M SD M SD d
1. Arrive late to school 1.45 0.79 1.23 0.54 0.33
2. Arrive late to class 1.71 0.79 1.20 0.40 0.81
3. Cut class 1.02 0.14 1.03 0.19 0.06
4. Go to class unprepared (without books, notes, pen or pencil)
1.96 0.76 1.49 0.58 0.70
5. Go to class without having completed the homework
2.27 0.78 1.53 0.65 1.03
6. Miss a day of school because of illness
1.51 0.65 1.42 0.56 0.15
7. Miss a day of school for a reason other than illness
1.35 0.56 1.29 0.56 0.11
Note. n=49 for High Apathy; n=199 for Low Apathy.
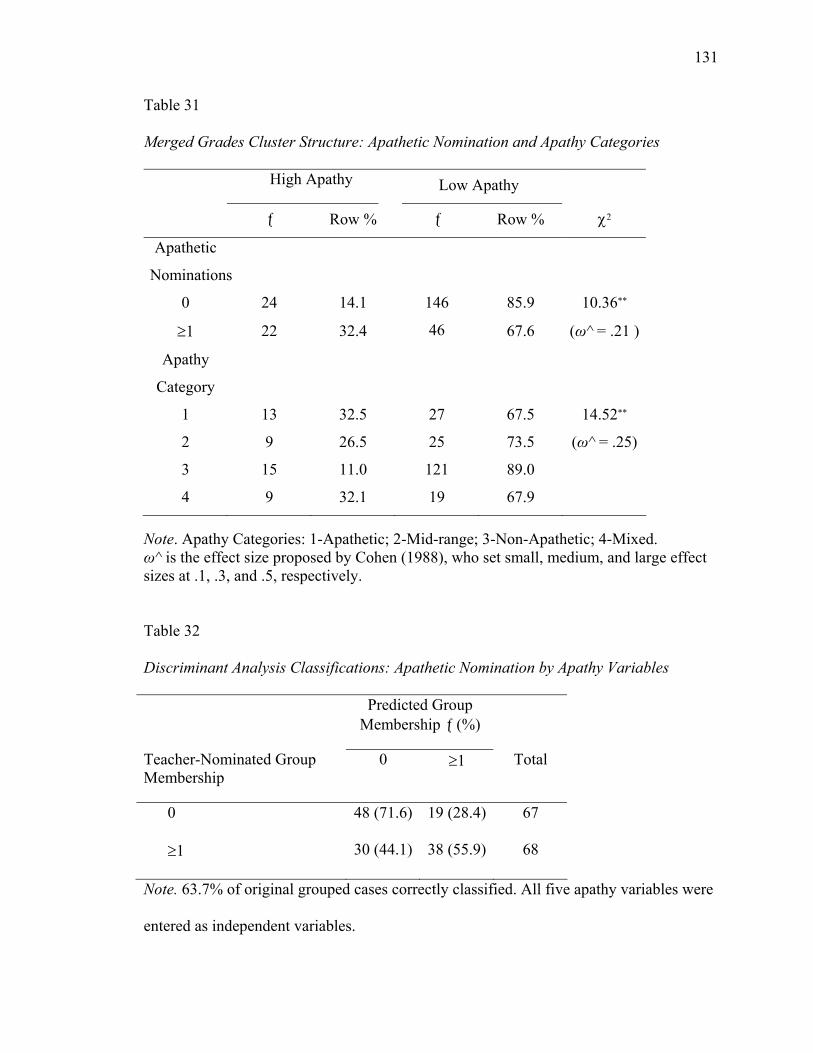
131
Table 31
Merged Grades Cluster Structure: Apathetic Nomination and Apathy Categories
High Apathy Low Apathy
ƒ Row % ƒ Row % χ2
Apathetic
Nominations
0 24 14.1 146 85.9 10.36**
≥1 22 32.4 46 67.6 (ω^ = .21 )
Apathy
Category
1 13 32.5 27 67.5 14.52**
2 9 26.5 25 73.5 (ω^ = .25)
3 15 11.0 121 89.0
4 9 32.1 19 67.9 Note. Apathy Categories: 1-Apathetic; 2-Mid-range; 3-Non-Apathetic; 4-Mixed. ω^ is the effect size proposed by Cohen (1988), who set small, medium, and large effect sizes at .1, .3, and .5, respectively. Table 32
Discriminant Analysis Classifications: Apathetic Nomination by Apathy Variables
Predicted Group Membership ƒ (%)
Teacher-Nominated Group Membership
0 ≥1 Total
0 48 (71.6) 19 (28.4) 67
≥1 30 (44.1) 38 (55.9) 68
Note. 63.7% of original grouped cases correctly classified. All five apathy variables were
entered as independent variables.
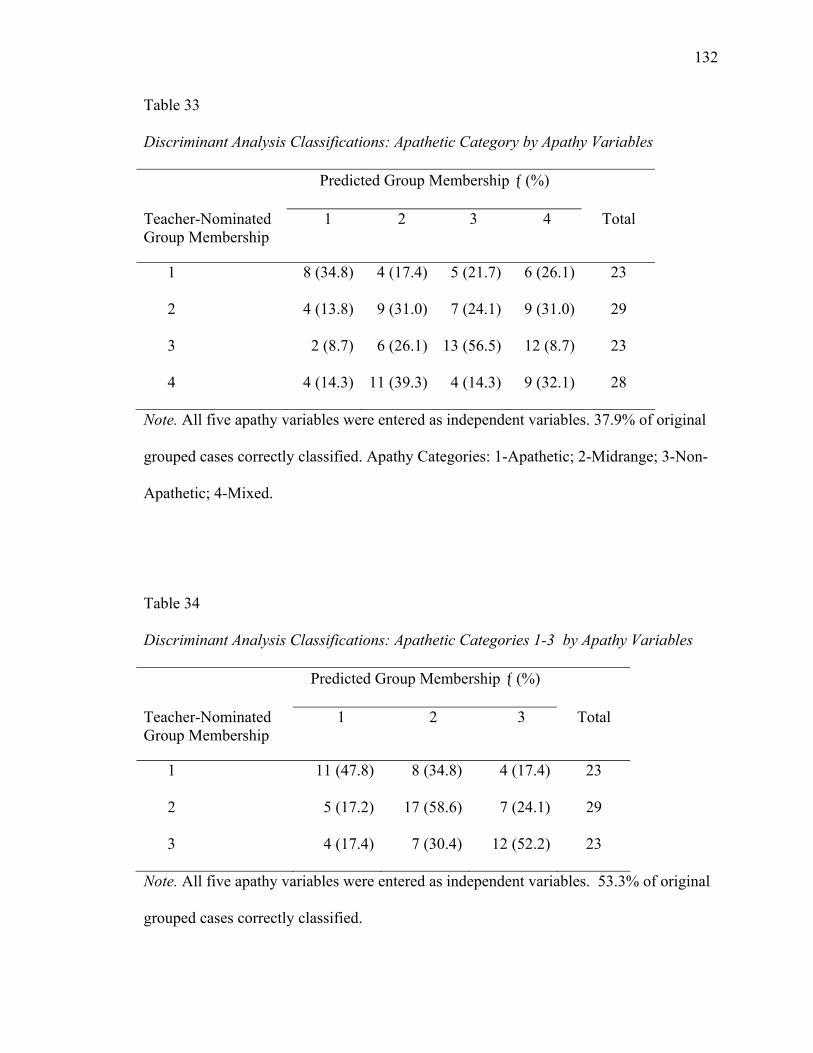
132
Table 33
Discriminant Analysis Classifications: Apathetic Category by Apathy Variables
Predicted Group Membership ƒ (%)
Teacher-Nominated Group Membership
1 2 3 4 Total
1 8 (34.8) 4 (17.4) 5 (21.7) 6 (26.1) 23
2 4 (13.8) 9 (31.0) 7 (24.1) 9 (31.0) 29
3 2 (8.7) 6 (26.1) 13 (56.5) 12 (8.7) 23
4 4 (14.3) 11 (39.3) 4 (14.3) 9 (32.1) 28
Note. All five apathy variables were entered as independent variables. 37.9% of original
grouped cases correctly classified. Apathy Categories: 1-Apathetic; 2-Midrange; 3-Non-
Apathetic; 4-Mixed.
Table 34
Discriminant Analysis Classifications: Apathetic Categories 1-3 by Apathy Variables
Predicted Group Membership ƒ (%)
Teacher-Nominated Group Membership
1 2 3 Total
1 11 (47.8) 8 (34.8) 4 (17.4) 23
2 5 (17.2) 17 (58.6) 7 (24.1) 29
3 4 (17.4) 7 (30.4) 12 (52.2) 23
Note. All five apathy variables were entered as independent variables. 53.3% of original
grouped cases correctly classified.
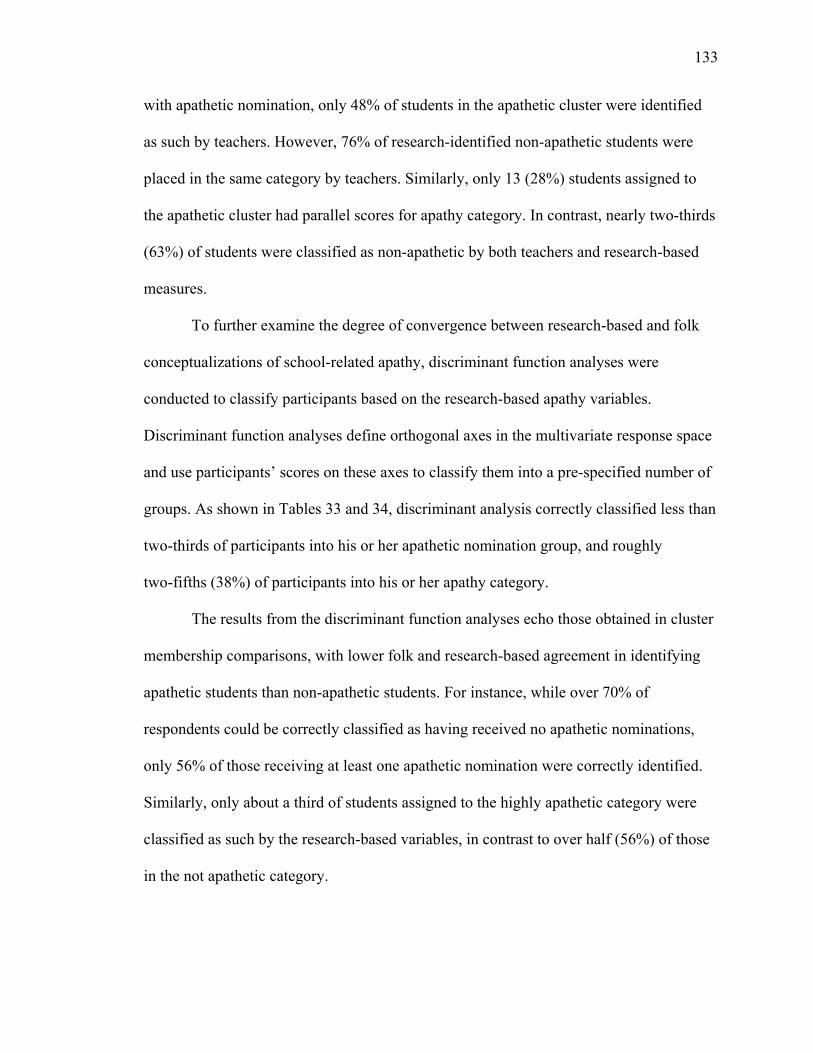
133
with apathetic nomination, only 48% of students in the apathetic cluster were identified
as such by teachers. However, 76% of research-identified non-apathetic students were
placed in the same category by teachers. Similarly, only 13 (28%) students assigned to
the apathetic cluster had parallel scores for apathy category. In contrast, nearly two-thirds
(63%) of students were classified as non-apathetic by both teachers and research-based
measures.
To further examine the degree of convergence between research-based and folk
conceptualizations of school-related apathy, discriminant function analyses were
conducted to classify participants based on the research-based apathy variables.
Discriminant function analyses define orthogonal axes in the multivariate response space
and use participants’ scores on these axes to classify them into a pre-specified number of
groups. As shown in Tables 33 and 34, discriminant analysis correctly classified less than
two-thirds of participants into his or her apathetic nomination group, and roughly
two-fifths (38%) of participants into his or her apathy category.
The results from the discriminant function analyses echo those obtained in cluster
membership comparisons, with lower folk and research-based agreement in identifying
apathetic students than non-apathetic students. For instance, while over 70% of
respondents could be correctly classified as having received no apathetic nominations,
only 56% of those receiving at least one apathetic nomination were correctly identified.
Similarly, only about a third of students assigned to the highly apathetic category were
classified as such by the research-based variables, in contrast to over half (56%) of those
in the not apathetic category.
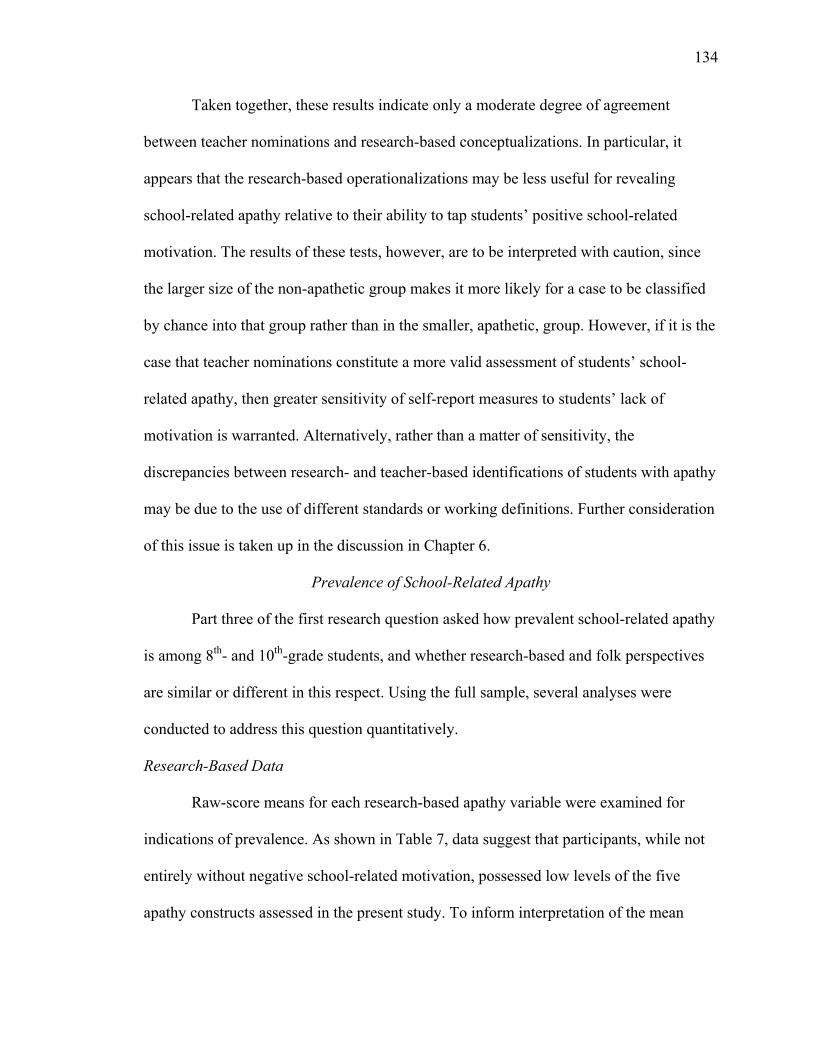
134
Taken together, these results indicate only a moderate degree of agreement
between teacher nominations and research-based conceptualizations. In particular, it
appears that the research-based operationalizations may be less useful for revealing
school-related apathy relative to their ability to tap students’ positive school-related
motivation. The results of these tests, however, are to be interpreted with caution, since
the larger size of the non-apathetic group makes it more likely for a case to be classified
by chance into that group rather than in the smaller, apathetic, group. However, if it is the
case that teacher nominations constitute a more valid assessment of students’ school-
related apathy, then greater sensitivity of self-report measures to students’ lack of
motivation is warranted. Alternatively, rather than a matter of sensitivity, the
discrepancies between research- and teacher-based identifications of students with apathy
may be due to the use of different standards or working definitions. Further consideration
of this issue is taken up in the discussion in Chapter 6.
Prevalence of School-Related Apathy
Part three of the first research question asked how prevalent school-related apathy
is among 8th- and 10th-grade students, and whether research-based and folk perspectives
are similar or different in this respect. Using the full sample, several analyses were
conducted to address this question quantitatively.
Research-Based Data
Raw-score means for each research-based apathy variable were examined for
indications of prevalence. As shown in Table 7, data suggest that participants, while not
entirely without negative school-related motivation, possessed low levels of the five
apathy constructs assessed in the present study. To inform interpretation of the mean
135
scores, one-sample t-tests were performed for each variable except GPA, using the
midpoint of the response scale as the test value.
Responses for amotivation were particularly low and highly right-skewed. It
would thus appear that students in the present study perceived reasons for going to
school. Disengagement was also very low, both as a composite and in terms of individual
items (see Table 8). For instance, only 6 students, or 2% of the sample, indicated having
cut class in the past two months. However, the data do indicate that overall participants
somewhat frequently attend class without the necessary materials or without having
completed the homework. It is worth noting that the disengagement composite yielded
low reliability and therefore should be interpreted with caution. Data also indicate some
work avoidance across the board, with average scores still significantly below the half-
way point on the scale. Reported levels of both adolescent apathy and apathy syndrome
were also low, though not entirely absent.
Frequencies of students in groups generated by cluster analyses were also
examined. As displayed in Table 28, results from the present study suggested that
roughly one in five participants could be described as reflecting school-related apathy. In
weighing the ability of these results to inform research and practice, it is important to
recall that the sample in the present study was drawn from students attending Catholic
schools. In interviews, several teacher participants volunteered comparisons between
their experiences in public and Catholic schools, stating that they perceived relatively
greater prevalence of apathy in students at the public schools where they had worked.
136
Teacher Data
To assess teachers’ perceptions of the prevalence of school-related apathy,
proportions of students nominated as “clearly apathetic” were inspected. Nearly one-third
(31.4%) of participants received at least one apathetic teacher nomination, and about one
in five students (18.6%) were assigned to the apathetic category.
Comparing Research-Based and Teacher Data
These three data streams—raw-score means, cluster analyses, and teacher-
nomination derived apathy classifications—were subsequently examined for
convergence. As discussed earlier in this chapter, while there appeared to be some
agreement in the proportions of students who were apathetic toward school, the data
suggested that research-based and teacher assessments identified different students for
this characterization. For instance, membership in the high school-apathy cluster included
many students with no apathetic nominations, and many students were predicted into the
low school-apathy cluster who had received apathetic nominations (see Table 31). The
discriminant function analyses presented earlier support this interpretation, as only one
half to two-thirds of participants could be correctly assigned to teacher-derived apathy
categories based on quantitative apathy variables.
Research Question 2: Individual and Group Differences
The second research question asked: How is self-reported school-related apathy
related to select individual and group differences variables and what patterns among
those variables characterize groups of students? Apathy variables were expected to
correlate moderately and positively with boredom proneness and distress, and to
demonstrate moderate negative relations with curiosity, well-being and academic
137
achievement. This research question examined results for the full sample. Grade-level
comparisons with respect to these analyses are presented in the following section which
presents findings regarding the third research question.
School-Related Apathy and Individual Differences
Means and Correlations of Apathy and Individual Differences
Mean levels of individual difference variables are shown in Table 7. Overall,
participants in the study reported moderately high levels of well-being (M=3.11,
SD=0.72) and curiosity (M=4.74, SD=0.90). Low levels of boredom proneness (M=0.34,
SD=0.16) and distress (M=2.24, SD=0.70) were detected for the full sample.
Bivariate correlations were calculated between pairs of individual differences
variables and between individual differences and apathy variables, as shown in Tables 13
and 14. Curiosity and well-being were positively related (r = .22, p = .000). Since well-
being was operationalized as a subset of items from the distress measure, the strong
negative correlations between these variables was expected. For distress scores, small and
non-significant relations were observed between curiosity (r = -.10, p = .086) and GPA (r
= -.08, p = .189 ). As expected, boredom proneness was significantly and negatively
correlated to curiosity (r = -.29, p = .000), GPA (r = -.25, p = .000), and well-being ( r =
-.45, p = .000), and significantly and positively related to distress (r =.48, p = .000).
Gender
Data for apathy and individual difference variables were also examined for gender
differences. As presented in Table 10, for the full sample, males reported greater apathy
syndrome, work avoidance, and well-being, and lower distress, than did females. On
average, females had earned statistically higher GPAs in the previous academic year than
138
had males. This finding is consistent with prior research, which suggested that females
report overall higher school-related motivation than do males (e.g., Eccles et al.,1993;
Meece & Miller, 2001; Stoeber & Rambow, 2007; Wentzel, Weinberger, Ford, &
Feldman, 1990). The outcomes for distress and well-being are reflective of research on
self-concept and self-esteem (e.g., Määttä et al., 2002), with females faring worse on
these variables, particularly in the early teen years, than do males.
Religion and Religious Practice
Since the sample was drawn from students attending Catholic schools, religion
and the frequency with which students reported practicing their religion were included in
analyses of individual differences in order to inform generalizability and future research.
Table 35 presents comparisons of mean levels of apathy and individual difference
variables by religion. Since the majority of students were Catholic, those reporting other
religions were grouped into a second category (non-Catholic). Data indicate that Catholic
students reported lower apathy syndrome, lower work avoidance, and less boredom
proneness than did non-Catholics.
Mean levels of apathy and individual difference variables were also compared to
reported level of religious practice. As shown in Table 36, participants who reported
often practicing their religion also reported lower adolescent apathy, apathy syndrome,
work avoidance, and boredom proneness, and higher GPA, than did participants who
indicated they rarely or never practice their religion. Though these differences were
significant in omnibus tests, the effect sizes were quite small, with η2 ranging from .02 to
.05.
139
There are several alternative explanations for these religion-related findings, which
additional research could target. One possibility is that parents of non-Catholic students
encountering difficulty in public schools opted to send their child to the Catholic school
for the benefits of a private-school education. If this were the case, a sampling bias would
have been present and potentially responsible for the observed differences. It is also
important to keep in mind that the non-Catholic group included those professing
Protestant, Jewish, or Orthodox faiths as well as those not adhering to any religion.
Therefore these results are appropriately interpreted with great caution. Regarding the
findings for religious practice, it bears stating that these data do not support a causal
conclusion, i.e., that practice of religion is responsible for lower levels of apathy
syndrome or lower levels of boredom proneness. The role that religion and extent of
religious practice play in students’ motivation for school, and vice versa, remains to be
investigated in future research. Clearly, however, the generalizability of findings from the
present study should be limited to Catholic school students in light of these differences,
and future research is in order to explore these issues among public school students.
Multiple Regression of Individual Differences on New Apathy Composites
One aim of the present study was to explore the potential for a conceptualization
of school-related apathy that would offer greater parsimony than existing sets of
variables. Exploratory factor analyses performed in the present study identified two
theoretically consistent factors with high reliability. To establish whether these hybrid
factors offered comparable explanatory power relative to the five apathy composites,
step-wise multiple regression analyses (MRA) were conducted to predict each of the five
interval scale individual differences variables. Theoretically, if the hybrid factors were
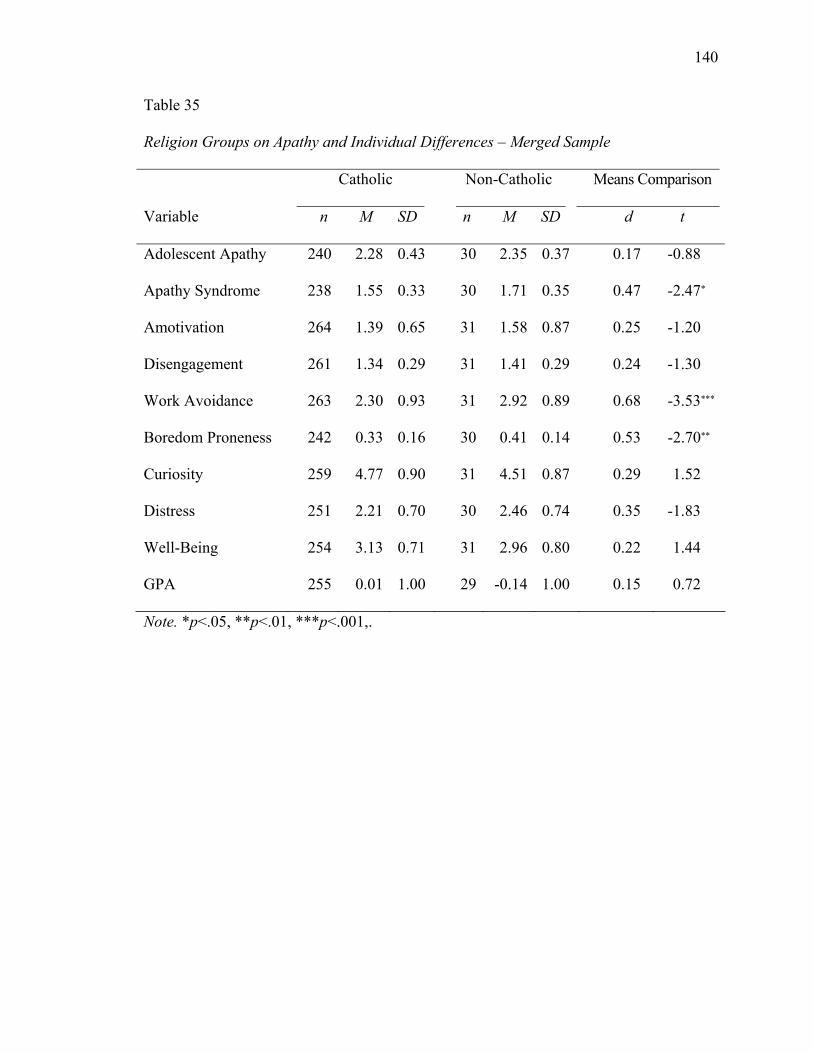
140
Table 35
Religion Groups on Apathy and Individual Differences – Merged Sample
Catholic Non-Catholic Means Comparison
Variable n M SD n M SD d t
Adolescent Apathy 240 2.28 0.43 30 2.35 0.37 0.17 -0.88
Apathy Syndrome 238 1.55 0.33 30 1.71 0.35 0.47 -2.47*
Amotivation 264 1.39 0.65 31 1.58 0.87 0.25 -1.20
Disengagement 261 1.34 0.29 31 1.41 0.29 0.24 -1.30
Work Avoidance 263 2.30 0.93 31 2.92 0.89 0.68 -3.53***
Boredom Proneness 242 0.33 0.16 30 0.41 0.14 0.53 -2.70**
Curiosity 259 4.77 0.90 31 4.51 0.87 0.29 1.52
Distress 251 2.21 0.70 30 2.46 0.74 0.35 -1.83
Well-Being 254 3.13 0.71 31 2.96 0.80 0.22 1.44
GPA 255 0.01 1.00 29 -0.14 1.00 0.15 0.72
Note. *p<.05, **p<.01, ***p<.001,.
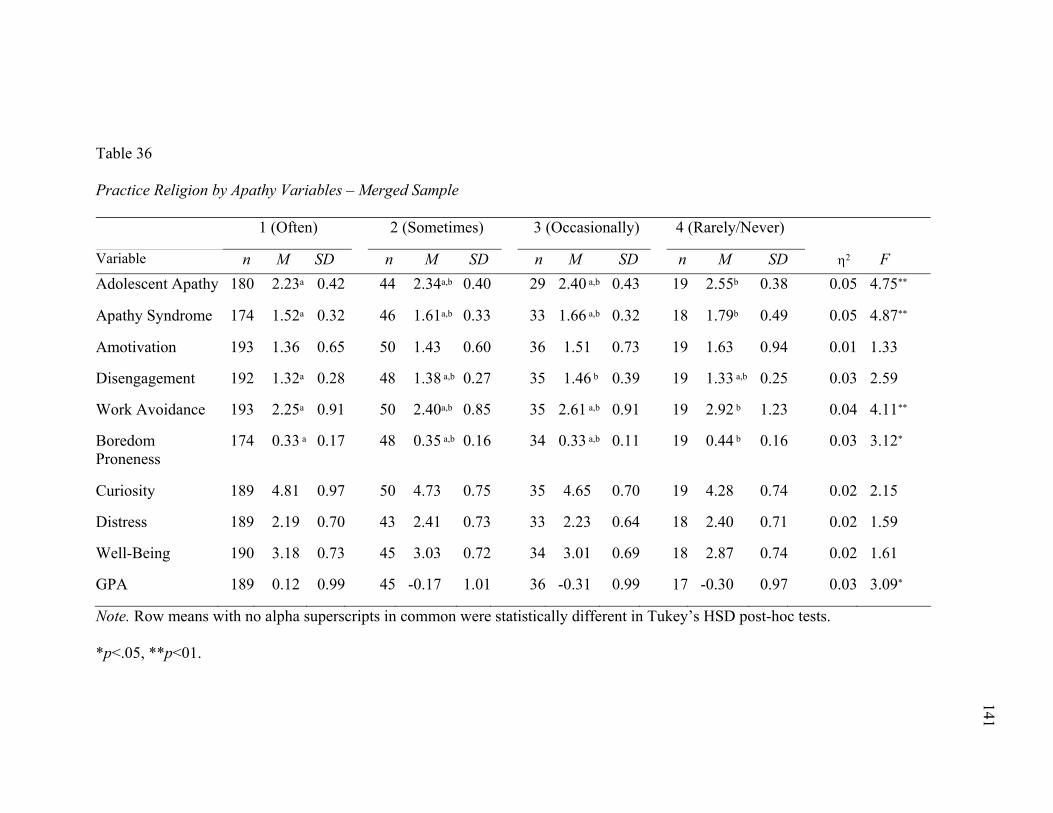
Table 36
Practice Religion by Apathy Variables – Merged Sample
1 (Often) 2 (Sometimes) 3 (Occasionally) 4 (Rarely/Never)
Variable n M SD n M SD n M SD n M SD η2 F Adolescent Apathy 180 2.23a 0.42 44 2.34a,b 0.40 29 2.40 a,b 0.43 19 2.55b 0.38 0.05 4.75**
Apathy Syndrome 174 1.52a 0.32 46 1.61a,b 0.33 33 1.66 a,b 0.32 18 1.79b 0.49 0.05 4.87**
Amotivation 193 1.36 0.65 50 1.43 0.60 36 1.51 0.73 19 1.63 0.94 0.01 1.33
Disengagement 192 1.32a 0.28 48 1.38 a,b 0.27 35 1.46 b 0.39 19 1.33 a,b 0.25 0.03 2.59
Work Avoidance 193 2.25a 0.91 50 2.40a,b 0.85 35 2.61 a,b 0.91 19 2.92 b 1.23 0.04 4.11**
Boredom Proneness
174 0.33 a 0.17 48 0.35 a,b 0.16 34 0.33 a,b 0.11 19 0.44 b 0.16 0.03 3.12*
Curiosity 189 4.81 0.97 50 4.73 0.75 35 4.65 0.70 19 4.28 0.74 0.02 2.15
Distress 189 2.19 0.70 43 2.41 0.73 33 2.23 0.64 18 2.40 0.71 0.02 1.59
Well-Being 190 3.18 0.73 45 3.03 0.72 34 3.01 0.69 18 2.87 0.74 0.02 1.61
GPA 189 0.12 0.99 45 -0.17 1.01 36 -0.31 0.99 17 -0.30 0.97 0.03 3.09*
Note. Row means with no alpha superscripts in common were statistically different in Tukey’s HSD post-hoc tests.
*p<.05, **p<01.
141
142
comparably efficient to the set of five apathy variables in terms of predicting the
individual differences variables tapped in this study, large and significant changes in R2
would be observed in the first step using only these two predictors. Further, entering the
original five composites in the second step would not result in substantially greater
explanation of variance in the dependent variables.
Accordingly, in the first step, the two new apathy factors (Positive Life Interest
and School Irrelevant) were entered; the five original apathy variables were entered in the
second step. Since many of these variables were not normally distributed, normalizing
transformations were applied first to each variable to maximize approximation to the
normal distribution. Amotivation was so severely skewed that transformations did little to
correct the problem. In light of this fact, tests were run with and without the amotivation
variable. Results are presented in Tables 37 and 38 for the full sample.
The new factors significantly increased the R2 for all individual differences and
for nearly all dependent variables, either one or both hybrid factors contributed
significantly to the regression equation. Notably, adding the five research-based apathy
variables did not significantly improve on explanation of variance for boredom
proneness, curiosity, distress, or well-being when amotivation was excluded from
analyses. With amotivation, the change in R2 after step 2 was significant for well-being.
Moreover, the effect sizes obtained for R2 after step 1 were high, in light of Cohen’s
(1992) definitions of .02, .15, .35 for small, medium, and large effect sizes, respectively.
These results support the hypothesis that school-related apathy could be tapped by a
subset of items based on prior research into students’ lack of motivation, offering greater
simplicity with strong explanatory power.
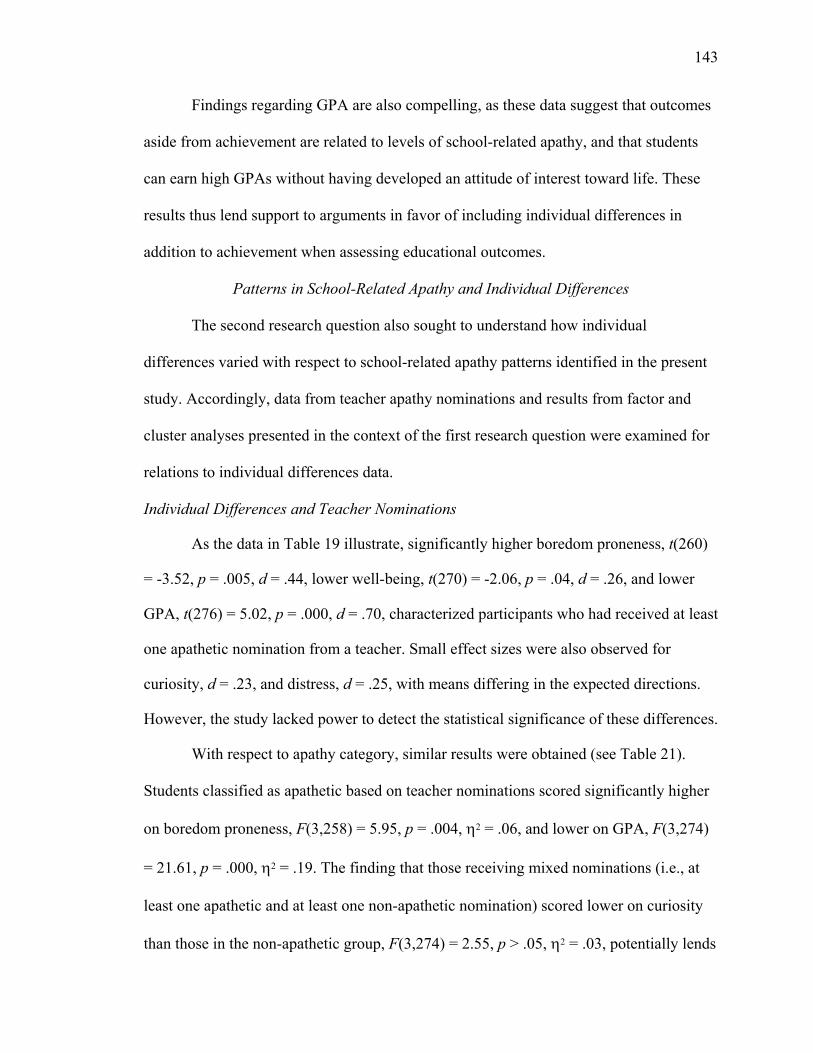
143
Findings regarding GPA are also compelling, as these data suggest that outcomes
aside from achievement are related to levels of school-related apathy, and that students
can earn high GPAs without having developed an attitude of interest toward life. These
results thus lend support to arguments in favor of including individual differences in
addition to achievement when assessing educational outcomes.
Patterns in School-Related Apathy and Individual Differences
The second research question also sought to understand how individual
differences varied with respect to school-related apathy patterns identified in the present
study. Accordingly, data from teacher apathy nominations and results from factor and
cluster analyses presented in the context of the first research question were examined for
relations to individual differences data.
Individual Differences and Teacher Nominations
As the data in Table 19 illustrate, significantly higher boredom proneness, t(260)
= -3.52, p = .005, d = .44, lower well-being, t(270) = -2.06, p = .04, d = .26, and lower
GPA, t(276) = 5.02, p = .000, d = .70, characterized participants who had received at least
one apathetic nomination from a teacher. Small effect sizes were also observed for
curiosity, d = .23, and distress, d = .25, with means differing in the expected directions.
However, the study lacked power to detect the statistical significance of these differences.
With respect to apathy category, similar results were obtained (see Table 21).
Students classified as apathetic based on teacher nominations scored significantly higher
on boredom proneness, F(3,258) = 5.95, p = .004, η2 = .06, and lower on GPA, F(3,274)
= 21.61, p = .000, η2 = .19. The finding that those receiving mixed nominations (i.e., at
least one apathetic and at least one non-apathetic nomination) scored lower on curiosity
than those in the non-apathetic group, F(3,274) = 2.55, p > .05, η2 = .03, potentially lends
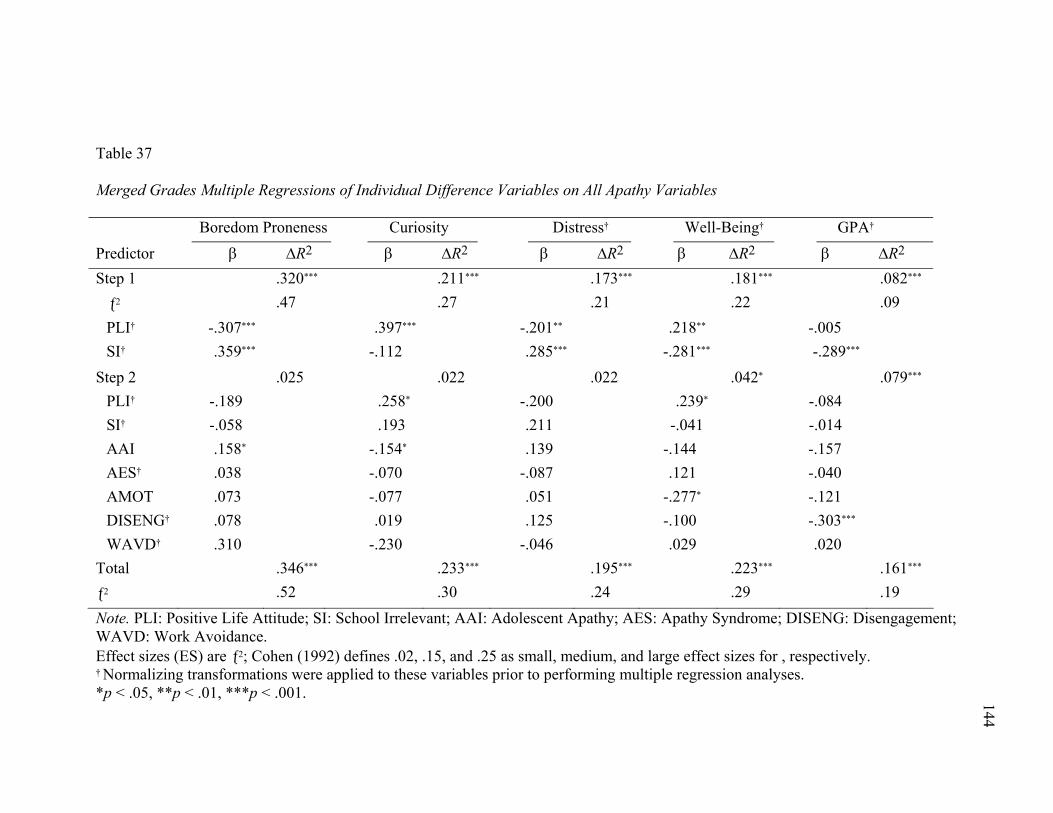
Table 37
Merged Grades Multiple Regressions of Individual Difference Variables on All Apathy Variables
Boredom Proneness Curiosity Distress† Well-Being† GPA†
Predictor β ΔR2 β ΔR2 β ΔR2 β ΔR2 β ΔR2
Step 1 .320*** .211*** .173*** .181*** .082***
ƒ2 .47 .27 .21 .22 .09
PLI† -.307*** .397*** -.201** .218** -.005
SI† .359*** -.112 .285*** -.281*** -.289***
Step 2 .025 .022 .022 .042* .079***
PLI† -.189 .258* -.200 .239* -.084
SI† -.058 .193 .211 -.041 -.014
AAI .158* -.154* .139 -.144 -.157
AES† .038 -.070 -.087 .121 -.040
AMOT .073 -.077 .051 -.277* -.121
DISENG† .078 .019 .125 -.100 -.303***
WAVD† .310 -.230 -.046 .029 .020
Total .346*** .233*** .195*** .223*** .161*** ƒ2 .52 .30 .24 .29 .19 Note. PLI: Positive Life Attitude; SI: School Irrelevant; AAI: Adolescent Apathy; AES: Apathy Syndrome; DISENG: Disengagement; WAVD: Work Avoidance. Effect sizes (ES) are ƒ2; Cohen (1992) defines .02, .15, and .25 as small, medium, and large effect sizes for , respectively. † Normalizing transformations were applied to these variables prior to performing multiple regression analyses. *p < .05, **p < .01, ***p < .001. 144
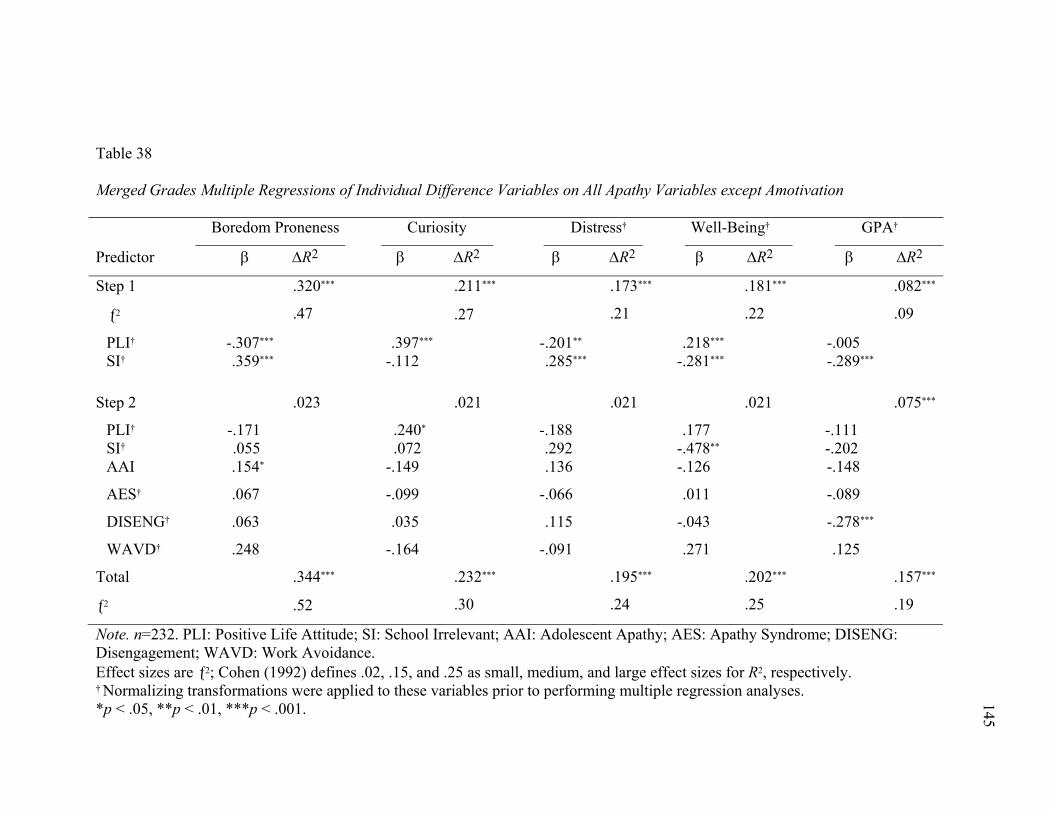
Table 38
Merged Grades Multiple Regressions of Individual Difference Variables on All Apathy Variables except Amotivation
Boredom Proneness Curiosity Distress† Well-Being† GPA†
Predictor β ΔR2 β ΔR2 β ΔR2 β ΔR2 β ΔR2
Step 1 .320*** .211*** .173*** .181*** .082***
ƒ2 .47 .27 .21 .22 .09
PLI† -.307*** .397*** -.201** .218*** -.005 SI† .359*** -.112 .285*** -.281*** -.289***
Step 2 .023 .021 .021 .021 .075***
PLI† -.171 .240* -.188 .177 -.111 SI† .055 .072 .292 -.478** -.202 AAI .154* -.149 .136 -.126 -.148
AES† .067 -.099 -.066 .011 -.089
DISENG† .063 .035 .115 -.043 -.278***
WAVD† .248 -.164 -.091 .271 .125
Total .344*** .232*** .195*** .202*** .157***
ƒ2 .52 .30 .24 .25 .19
Note. n=232. PLI: Positive Life Attitude; SI: School Irrelevant; AAI: Adolescent Apathy; AES: Apathy Syndrome; DISENG: Disengagement; WAVD: Work Avoidance. Effect sizes are ƒ2; Cohen (1992) defines .02, .15, and .25 as small, medium, and large effect sizes for R2, respectively. † Normalizing transformations were applied to these variables prior to performing multiple regression analyses. *p < .05, **p < .01, ***p < .001. 145
146
some credence to the validity of the teacher nomination process. It is possible that
students receiving mixed reviews may have narrower interests, perhaps associated with
fewer domains, and consequently teachers of some subjects would be exposed to these
students’ curiosity while teachers of other subjects of less interest to these students would
appropriately construct a perception of them as apathetic. These students would also be
expected to report less curiosity than students who find all their class subjects motivating
and thus induce teachers’ perceptions that they are non-apathetic toward school.
Factor Correlations
In responding to the first research question in the present study, two school-
related apathy factors were created from a subset of items used to tap the five apathy
constructs assessed. To address the second research question, relations between these
new factors and individual differences were analyzed. Results are presented in Table 39.
Consistent with other findings in this study, moderate to strong positive relations were
observed between the positive life interest factor and curiosity (r = .48, p = .000 ) and
well-being (r = .31, p = .000). Positive Life Interest was significantly negatively related
to boredom proneness (r = -.36, p = .000). A small but non-significant effect size was
detected between Positive Life Interest and GPA (r = .09, p = .143). As would be
expected, distress was negatively correlated with positive life interest (r = -.24, p = .000).
Scores on the school irrelevant factor also yielded significant relations with
individual differences, correlating moderately strongly with boredom proneness (r = 0.41,
p = .000) and moderately with curiosity (r = -.20, p = .001), distress (r = .31, p = .000),
well-being (r = -.33, p = .000), and GPA (r = -.32, p = .000) in the expected directions.
Notably, these results suggest that while indicators that students perceive school as
irrelevant are negatively associated with GPA, positive life interest is not related to GPA,
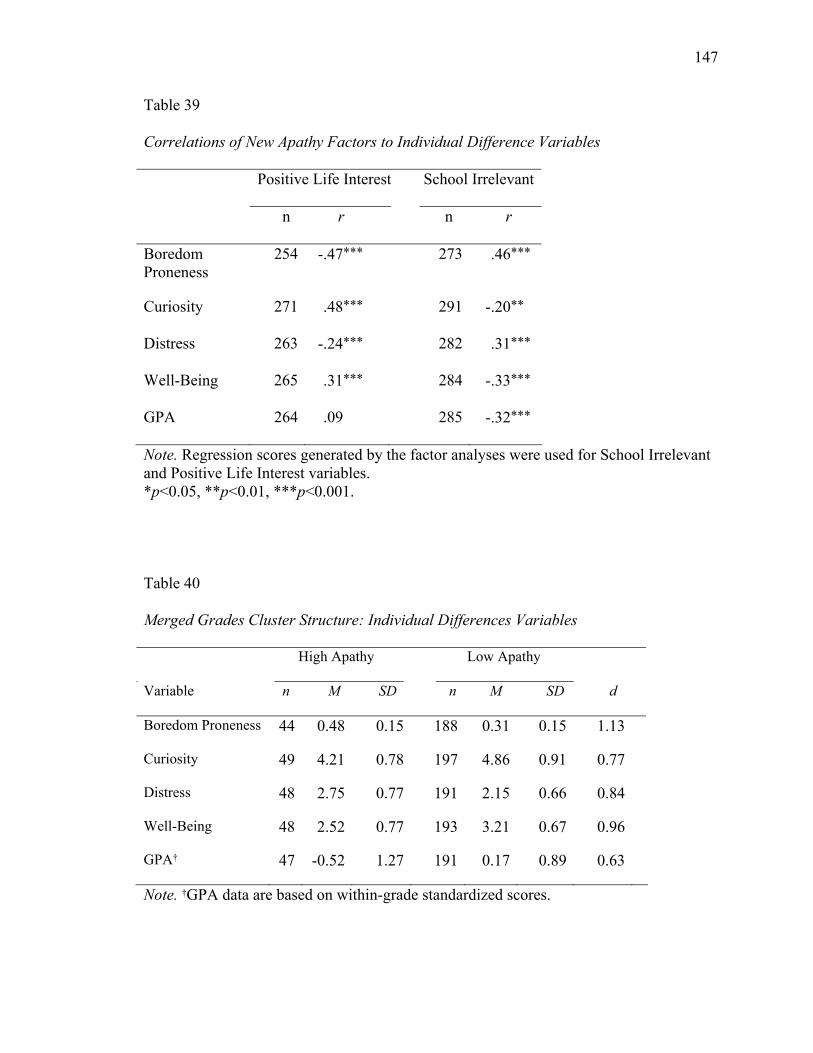
147
Table 39
Correlations of New Apathy Factors to Individual Difference Variables
Positive Life Interest School Irrelevant
n r n r
Boredom Proneness
254 -.47*** 273 .46***
Curiosity 271 .48*** 291 -.20**
Distress 263 -.24*** 282 .31***
Well-Being 265 .31*** 284 -.33***
GPA 264 .09 285 -.32***
Note. Regression scores generated by the factor analyses were used for School Irrelevant and Positive Life Interest variables. *p<0.05, **p<0.01, ***p<0.001. Table 40
Merged Grades Cluster Structure: Individual Differences Variables
High Apathy Low Apathy
Variable n M SD n M SD d
Boredom Proneness 44 0.48 0.15 188 0.31 0.15 1.13
Curiosity 49 4.21 0.78 197 4.86 0.91 0.77
Distress 48 2.75 0.77 191 2.15 0.66 0.84
Well-Being 48 2.52 0.77 193 3.21 0.67 0.96
GPA† 47 -0.52 1.27 191 0.17 0.89 0.63
Note. †GPA data are based on within-grade standardized scores.
148
a finding with interesting implications for how educational outcomes are socially valued
and psychometrically assessed.
Cluster Group Means Comparisons
In cluster analyses of all participants’ research-based apathy scores, two groups
emerged. These groups were expected to vary in mean levels on criterion variables. As
shown in Table 40, clusters differed on all five individual difference variables, with large
effect sizes observed for boredom proneness, distress, and well-being, and moderate
effect sizes observed for curiosity and GPA. It would also appear that members of Cluster
1 evidenced less curiosity, well-being, and GPAs, and higher levels of distress and
boredom proneness, than did participants assigned to Cluster 2.
Item Analysis of School-Related Apathy and Individual Difference Measures
When examining associations between variables, it is important to consider the
extent to which operational similarities rather than conceptual relations are responsible
for large effects. With regard to the present study, items used to assess each construct
were carefully reviewed for overlap in item content that could account for strong
correlations. The complete set of 97 items for the 5 apathy constructs and 4 individual
difference variables were examined for redundancy. Seven pairs of items from different
measures were found to be highly comparable. Specifically, three item pairs were
observed between the apathy syndrome and curiosity measures. Item pairs were also
detected between the boredom proneness measure and the measures for adolescent
apathy, amotivation, and distress.
1. Apathy Syndrome: I am interested in learning new things.
Curiosity: I would describe myself as someone who actively seeks as much
information as I can in a new situation
149
2. Apathy Syndrome: I approach life with intensity.
Curiosity: My friends would describe me as someone who is “extremely intense”
when in the middle of doing something.
3. Apathy Syndrome: I am interested in having new experiences
Curiosity: Everywhere I go, I am out looking for new things or experiences.
4. Boredom Proneness: Many people would say that I am a creative or imaginative
person.
Adolescent Apathy: I am a creative, imaginative person.
5. Boredom Proneness: I am often trapped in situations where I have to do
meaningless things.
Amotivation: Honestly, I don’t know; I really feel that I am wasting my time in
school.
6. Boredom Proneness: Much of the time I just sit around doing nothing.
Distress: I get into such a bad mood that I feel like just sitting around and doing
nothing.
7. Boredom Proneness: I get a kick out of most of the things I do.
Distress: I’m the kind of person who has a lot of fun.
Although these item pairs would have contributed to the observed relations between
variables, the analysis of all 97 items suggests that substantive semantic differences
individuated measures used to tap these variables. The only exception to this conclusion
regards the relation observed between apathy syndrome and curiosity, which should be
interpreted with caution given that these measures had three items in common.
150
Research Question 3: Grade-Level Differences
The third and final research question asked: Is there variation between 8th and 10th
graders in the conceptualization, prevalence, and associated individual differences of self-
reported school-related apathy? To respond to this question using quantitative data,
essentially all analyses conducted for research questions 1 and 2 were also performed
individually by grade level. Within-grade patterns were examined, as were results
between grades, for significant differences and noteworthy trends. In this section, results
related to each aspect of the research question—conceptualization, prevalence, and
individual differences—are addressed in turn.
Conceptualization of School-Related Apathy
Based on the extant literature (e.g., Gottfried, Fleming, & Gottfried, 2001; Harter,
1998; Otis, Grouzet, & Pelletier, 2005), the present study hypothesized that older students
would reflect higher differentiation than would students on the threshold of adolescence.
Differentiation was operationalized in several ways, and the two sources of quantitative
data in the present study enabled examination of grade-level differences in research-
based and folk conceptualizations of school-related apathy. Specifically, tests were
conducted to detect significant differences and meaningful effect sizes between grades
with respect to variance on apathy variables, bivariate correlations between apathy
variables, and frequency distributions of teacher nominations for school-related apathy.
In addition, results from factor and cluster analyses were compared between grades to
identify structural differences. Further, these analyses allowed for grade-level
comparisons between research-based and folk conceptualizations.
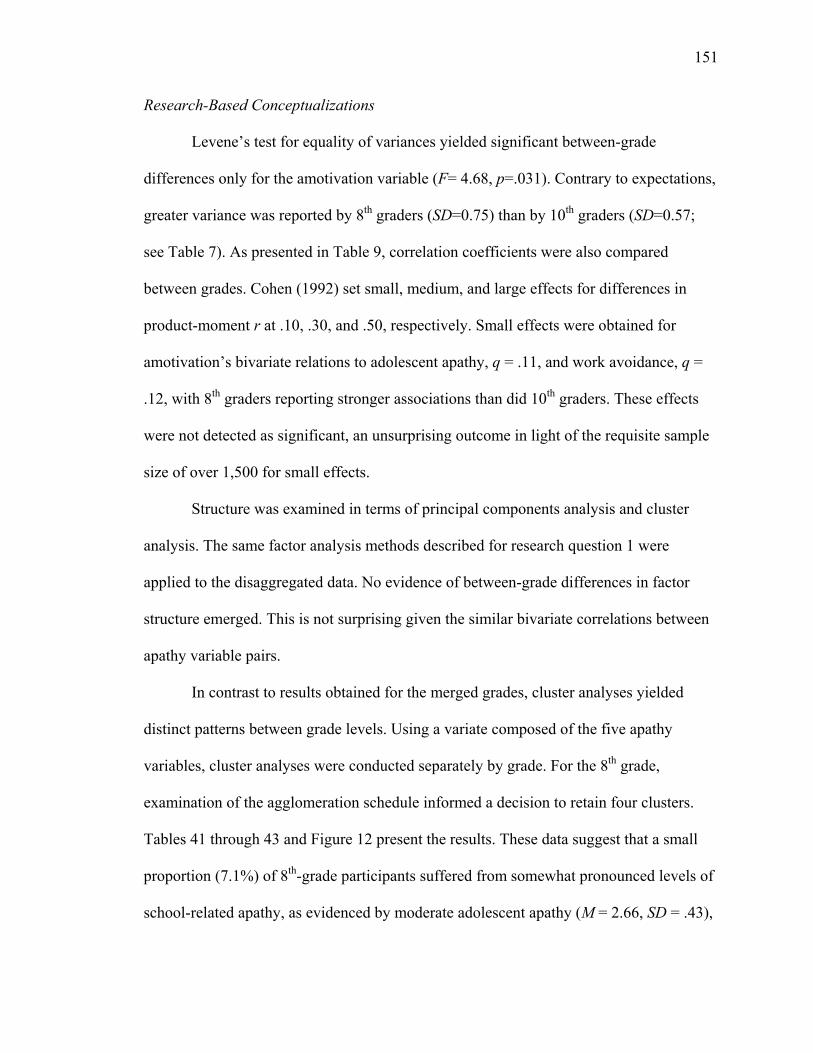
151
Research-Based Conceptualizations
Levene’s test for equality of variances yielded significant between-grade
differences only for the amotivation variable (F= 4.68, p=.031). Contrary to expectations,
greater variance was reported by 8th graders (SD=0.75) than by 10th graders (SD=0.57;
see Table 7). As presented in Table 9, correlation coefficients were also compared
between grades. Cohen (1992) set small, medium, and large effects for differences in
product-moment r at .10, .30, and .50, respectively. Small effects were obtained for
amotivation’s bivariate relations to adolescent apathy, q = .11, and work avoidance, q =
.12, with 8th graders reporting stronger associations than did 10th graders. These effects
were not detected as significant, an unsurprising outcome in light of the requisite sample
size of over 1,500 for small effects.
Structure was examined in terms of principal components analysis and cluster
analysis. The same factor analysis methods described for research question 1 were
applied to the disaggregated data. No evidence of between-grade differences in factor
structure emerged. This is not surprising given the similar bivariate correlations between
apathy variable pairs.
In contrast to results obtained for the merged grades, cluster analyses yielded
distinct patterns between grade levels. Using a variate composed of the five apathy
variables, cluster analyses were conducted separately by grade. For the 8th grade,
examination of the agglomeration schedule informed a decision to retain four clusters.
Tables 41 through 43 and Figure 12 present the results. These data suggest that a small
proportion (7.1%) of 8th-grade participants suffered from somewhat pronounced levels of
school-related apathy, as evidenced by moderate adolescent apathy (M = 2.66, SD = .43),
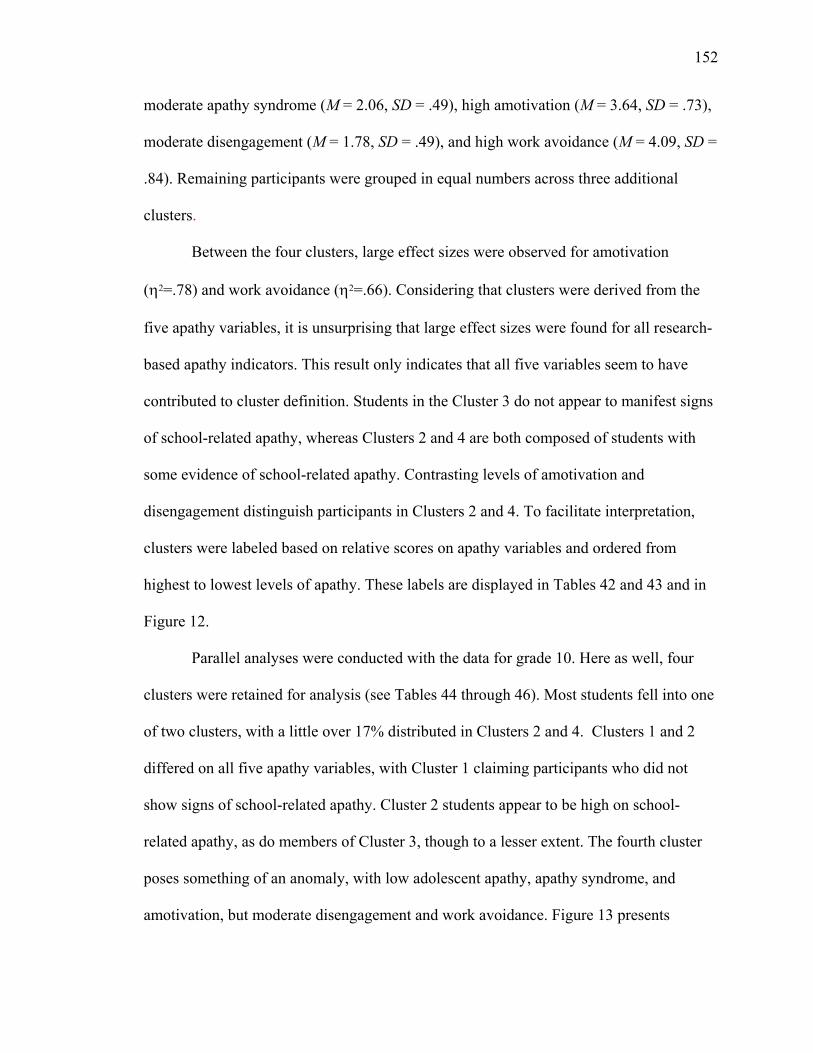
152
moderate apathy syndrome (M = 2.06, SD = .49), high amotivation (M = 3.64, SD = .73),
moderate disengagement (M = 1.78, SD = .49), and high work avoidance (M = 4.09, SD =
.84). Remaining participants were grouped in equal numbers across three additional
clusters.
Between the four clusters, large effect sizes were observed for amotivation
(η2=.78) and work avoidance (η2=.66). Considering that clusters were derived from the
five apathy variables, it is unsurprising that large effect sizes were found for all research-
based apathy indicators. This result only indicates that all five variables seem to have
contributed to cluster definition. Students in the Cluster 3 do not appear to manifest signs
of school-related apathy, whereas Clusters 2 and 4 are both composed of students with
some evidence of school-related apathy. Contrasting levels of amotivation and
disengagement distinguish participants in Clusters 2 and 4. To facilitate interpretation,
clusters were labeled based on relative scores on apathy variables and ordered from
highest to lowest levels of apathy. These labels are displayed in Tables 42 and 43 and in
Figure 12.
Parallel analyses were conducted with the data for grade 10. Here as well, four
clusters were retained for analysis (see Tables 44 through 46). Most students fell into one
of two clusters, with a little over 17% distributed in Clusters 2 and 4. Clusters 1 and 2
differed on all five apathy variables, with Cluster 1 claiming participants who did not
show signs of school-related apathy. Cluster 2 students appear to be high on school-
related apathy, as do members of Cluster 3, though to a lesser extent. The fourth cluster
poses something of an anomaly, with low adolescent apathy, apathy syndrome, and
amotivation, but moderate disengagement and work avoidance. Figure 13 presents
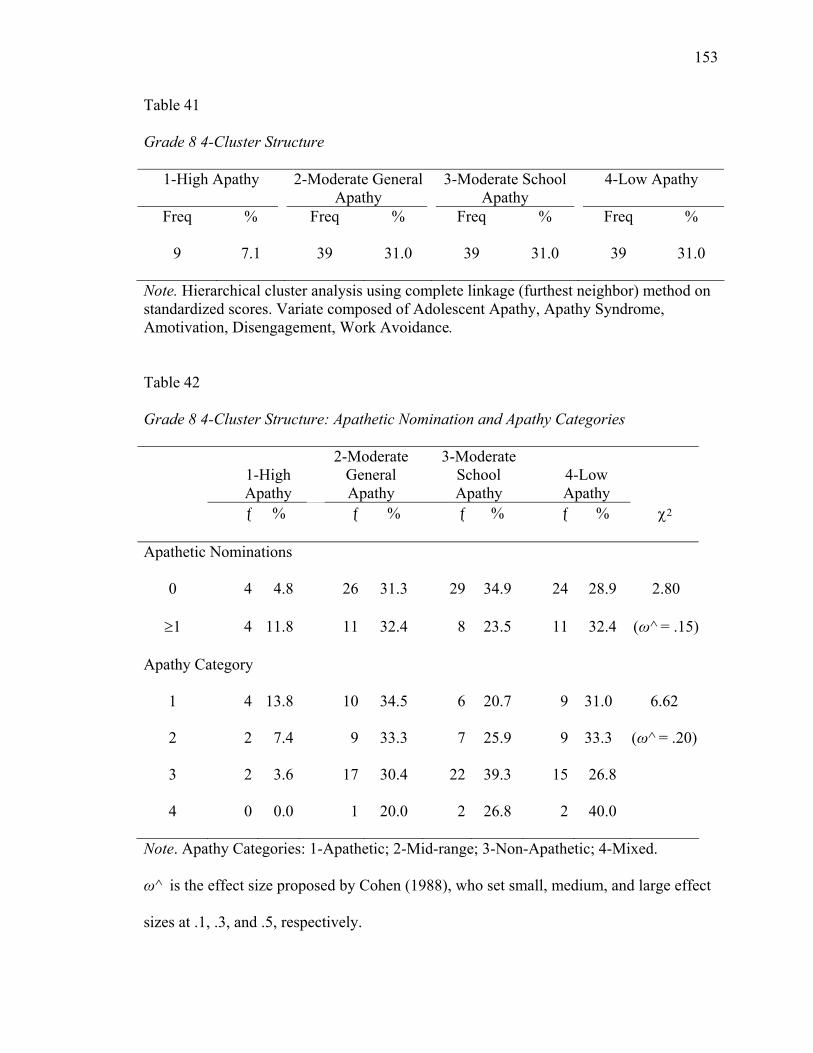
153
Table 41
Grade 8 4-Cluster Structure
1-High Apathy 2-Moderate General Apathy
3-Moderate School Apathy
4-Low Apathy
Freq % Freq % Freq % Freq %
9 7.1 39 31.0 39 31.0 39 31.0
Note. Hierarchical cluster analysis using complete linkage (furthest neighbor) method on standardized scores. Variate composed of Adolescent Apathy, Apathy Syndrome, Amotivation, Disengagement, Work Avoidance.
Table 42
Grade 8 4-Cluster Structure: Apathetic Nomination and Apathy Categories
2-Moderate 3-Moderate 1-High General School 4-Low Apathy Apathy Apathy Apathy
ƒ % ƒ % ƒ % ƒ % χ2
Apathetic Nominations
0 4 4.8 26 31.3 29 34.9 24 28.9 2.80
≥1 4 11.8 11 32.4 8 23.5 11 32.4 (ω^ = .15)
Apathy Category
1 4 13.8 10 34.5 6 20.7 9 31.0 6.62
2 2 7.4 9 33.3 7 25.9 9 33.3 (ω^ = .20)
3 2 3.6 17 30.4 22 39.3 15 26.8
4 0 0.0 1 20.0 2 26.8 2 40.0
Note. Apathy Categories: 1-Apathetic; 2-Mid-range; 3-Non-Apathetic; 4-Mixed.
ω^ is the effect size proposed by Cohen (1988), who set small, medium, and large effect
sizes at .1, .3, and .5, respectively.
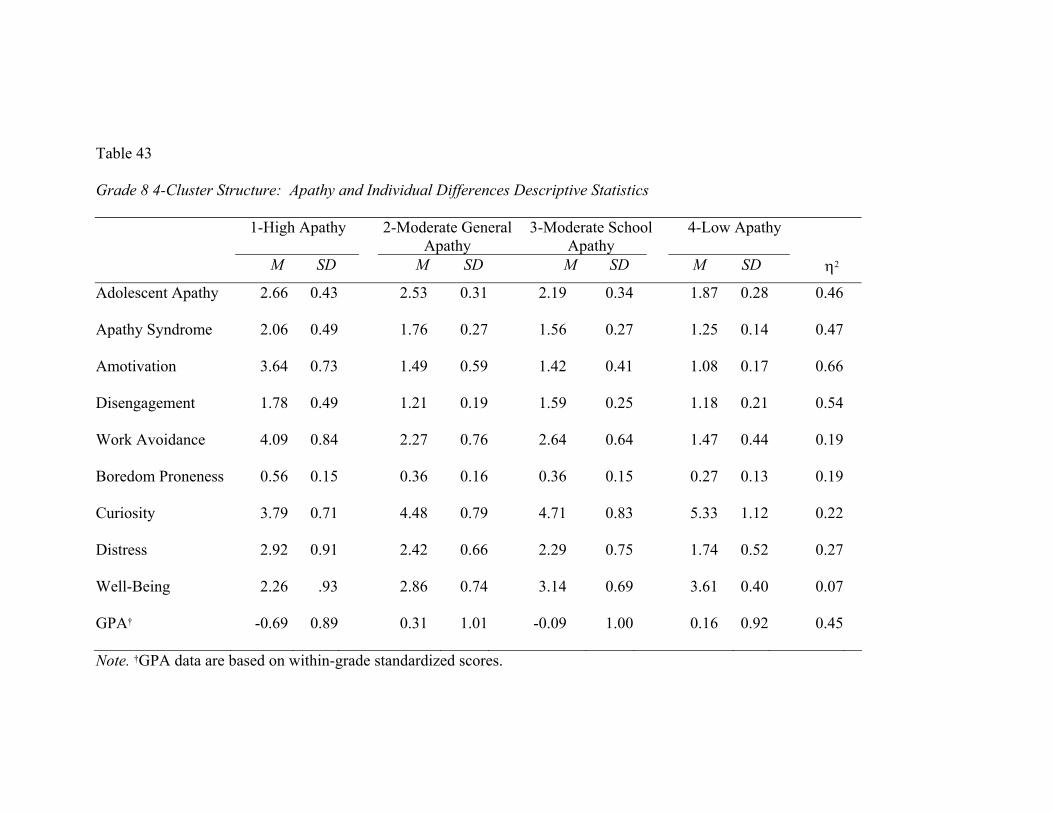
Table 43
Grade 8 4-Cluster Structure: Apathy and Individual Differences Descriptive Statistics
1-High Apathy 2-Moderate General 3-Moderate School 4-Low Apathy Apathy Apathy
M SD M SD M SD M SD η2
Adolescent Apathy 2.66 0.43 2.53 0.31 2.19 0.34 1.87 0.28 0.46
Apathy Syndrome 2.06 0.49 1.76 0.27 1.56 0.27 1.25 0.14 0.47
Amotivation 3.64 0.73 1.49 0.59 1.42 0.41 1.08 0.17 0.66
Disengagement 1.78 0.49 1.21 0.19 1.59 0.25 1.18 0.21 0.54
Work Avoidance 4.09 0.84 2.27 0.76 2.64 0.64 1.47 0.44 0.19
Boredom Proneness 0.56 0.15 0.36 0.16 0.36 0.15 0.27 0.13 0.19
Curiosity 3.79 0.71 4.48 0.79 4.71 0.83 5.33 1.12 0.22
Distress 2.92 0.91 2.42 0.66 2.29 0.75 1.74 0.52 0.27
Well-Being 2.26 .93 2.86 0.74 3.14 0.69 3.61 0.40 0.07
GPA† -0.69 0.89 0.31 1.01 -0.09 1.00 0.16 0.92 0.45
Note. †GPA data are based on within-grade standardized scores.
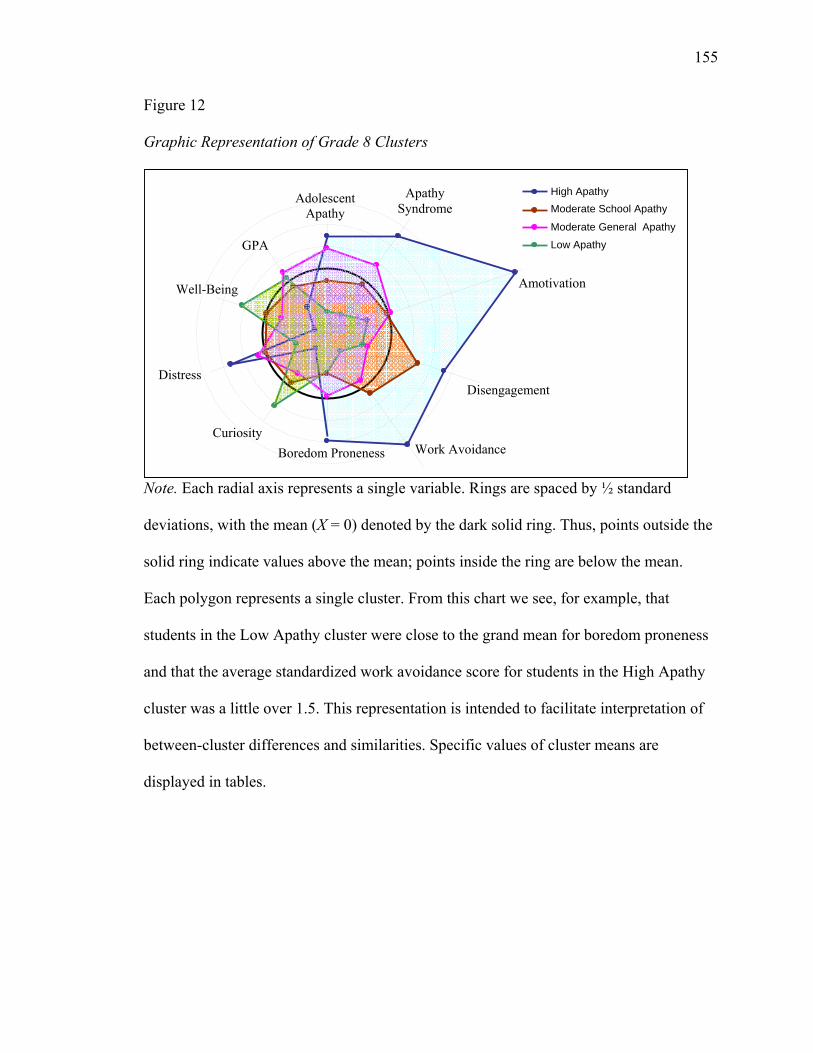
155
Figure 12
Graphic Representation of Grade 8 Clusters
Note. Each radial axis represents a single variable. Rings are spaced by ½ standard
deviations, with the mean (X = 0) denoted by the dark solid ring. Thus, points outside the
solid ring indicate values above the mean; points inside the ring are below the mean.
Each polygon represents a single cluster. From this chart we see, for example, that
students in the Low Apathy cluster were close to the grand mean for boredom proneness
and that the average standardized work avoidance score for students in the High Apathy
cluster was a little over 1.5. This representation is intended to facilitate interpretation of
between-cluster differences and similarities. Specific values of cluster means are
displayed in tables.
Adolescent Apathy
Apathy Syndrome
Amotivation
Disengagement
Work AvoidanceBoredom PronenessCuriosity
Distress
Well-Being
GPA
High Apathy
Moderate General Apathy
Low Apathy
Moderate School Apathy
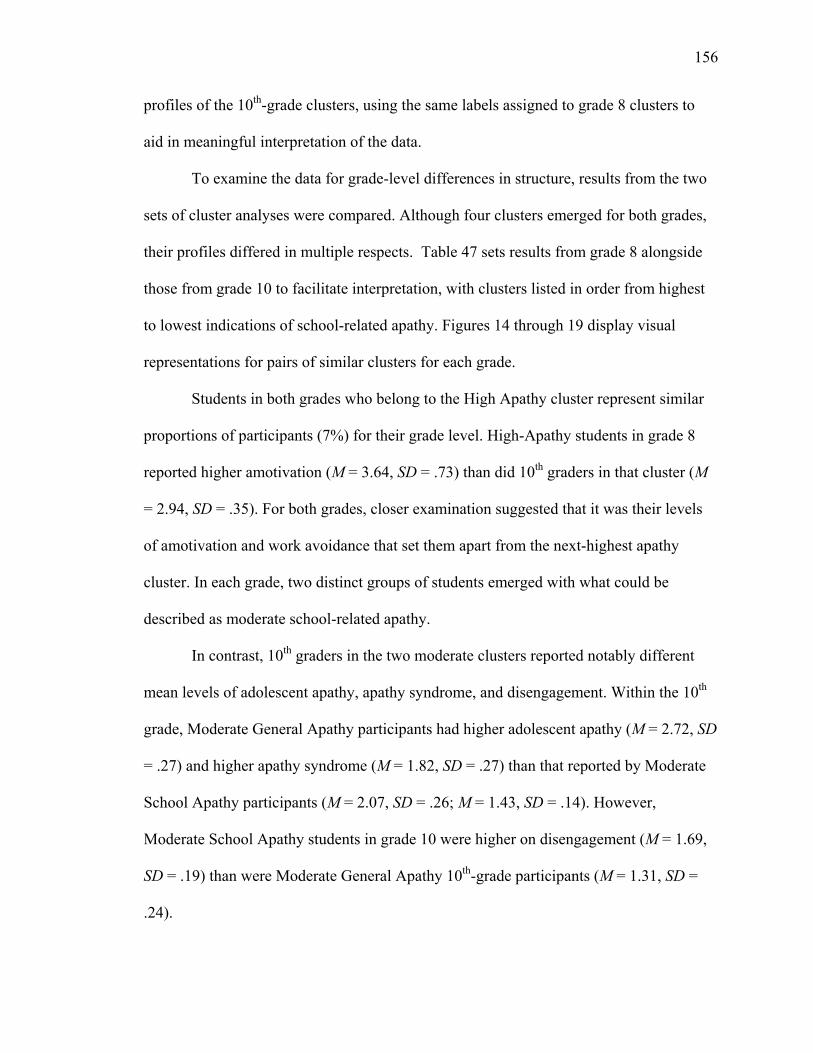
156
profiles of the 10th-grade clusters, using the same labels assigned to grade 8 clusters to
aid in meaningful interpretation of the data.
To examine the data for grade-level differences in structure, results from the two
sets of cluster analyses were compared. Although four clusters emerged for both grades,
their profiles differed in multiple respects. Table 47 sets results from grade 8 alongside
those from grade 10 to facilitate interpretation, with clusters listed in order from highest
to lowest indications of school-related apathy. Figures 14 through 19 display visual
representations for pairs of similar clusters for each grade.
Students in both grades who belong to the High Apathy cluster represent similar
proportions of participants (7%) for their grade level. High-Apathy students in grade 8
reported higher amotivation (M = 3.64, SD = .73) than did 10th graders in that cluster (M
= 2.94, SD = .35). For both grades, closer examination suggested that it was their levels
of amotivation and work avoidance that set them apart from the next-highest apathy
cluster. In each grade, two distinct groups of students emerged with what could be
described as moderate school-related apathy.
In contrast, 10th graders in the two moderate clusters reported notably different
mean levels of adolescent apathy, apathy syndrome, and disengagement. Within the 10th
grade, Moderate General Apathy participants had higher adolescent apathy (M = 2.72, SD
= .27) and higher apathy syndrome (M = 1.82, SD = .27) than that reported by Moderate
School Apathy participants (M = 2.07, SD = .26; M = 1.43, SD = .14). However,
Moderate School Apathy students in grade 10 were higher on disengagement (M = 1.69,
SD = .19) than were Moderate General Apathy 10th-grade participants (M = 1.31, SD =
.24).
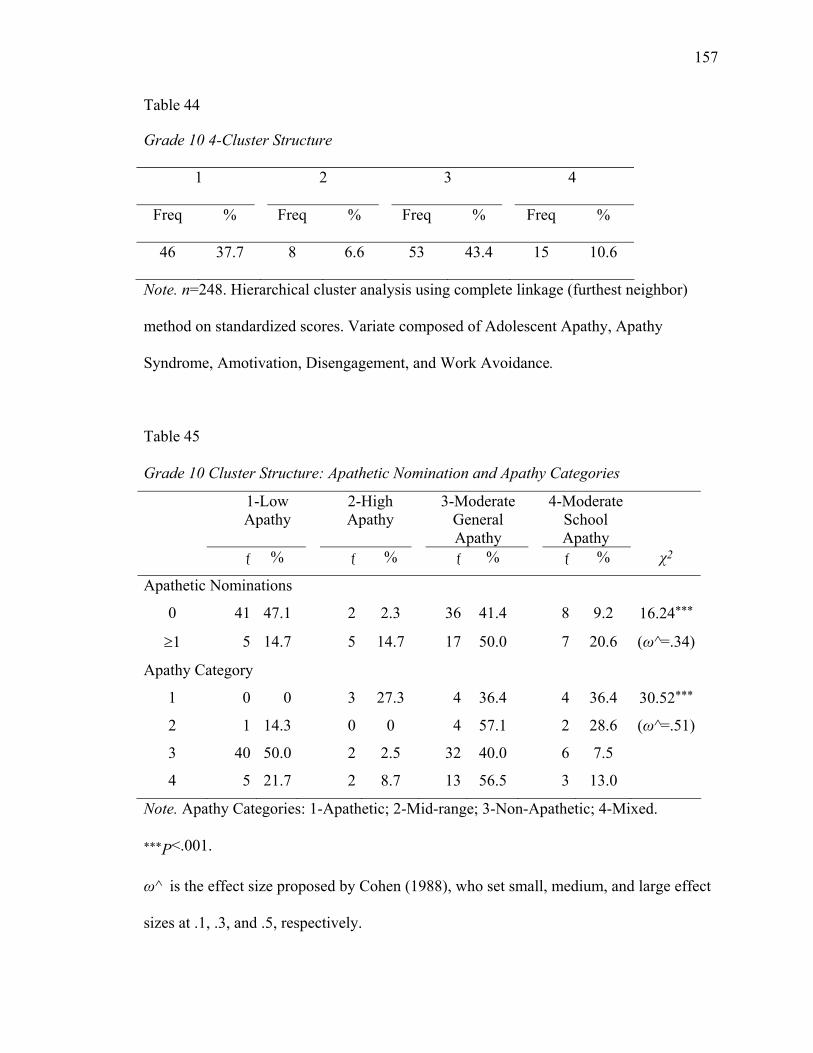
157
Table 44
Grade 10 4-Cluster Structure
1 2 3 4
Freq % Freq % Freq % Freq %
46 37.7 8 6.6 53 43.4 15 10.6
Note. n=248. Hierarchical cluster analysis using complete linkage (furthest neighbor)
method on standardized scores. Variate composed of Adolescent Apathy, Apathy
Syndrome, Amotivation, Disengagement, and Work Avoidance.
Table 45
Grade 10 Cluster Structure: Apathetic Nomination and Apathy Categories
1-Low 2-High 3-Moderate 4-Moderate Apathy Apathy General School Apathy Apathy
ƒ % ƒ % ƒ % ƒ % χ2
Apathetic Nominations
0 41 47.1 2 2.3 36 41.4 8 9.2 16.24***
≥1 5 14.7 5 14.7 17 50.0 7 20.6 (ω^=.34)
Apathy Category
1 0 0 3 27.3 4 36.4 4 36.4 30.52***
2 1 14.3 0 0 4 57.1 2 28.6 (ω^=.51)
3 40 50.0 2 2.5 32 40.0 6 7.5
4 5 21.7 2 8.7 13 56.5 3 13.0
Note. Apathy Categories: 1-Apathetic; 2-Mid-range; 3-Non-Apathetic; 4-Mixed.
***P<.001.
ω^ is the effect size proposed by Cohen (1988), who set small, medium, and large effect
sizes at .1, .3, and .5, respectively.
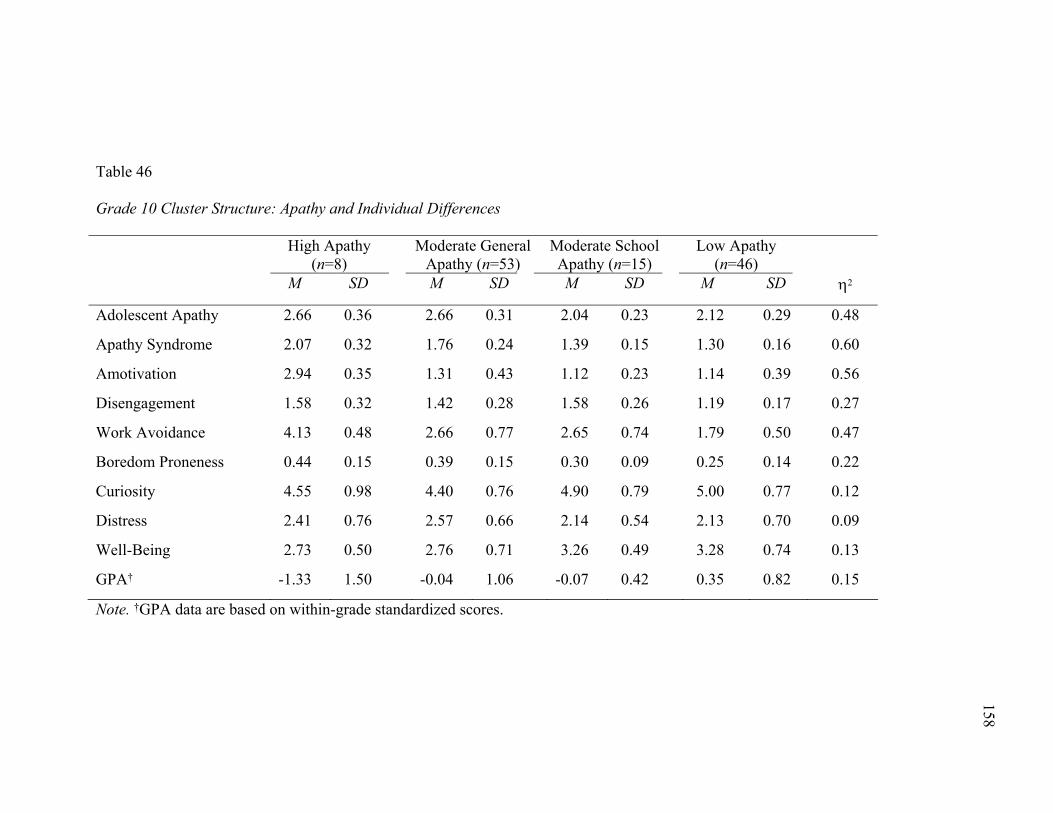
Table 46
Grade 10 Cluster Structure: Apathy and Individual Differences
High Apathy Moderate General Moderate School Low Apathy (n=8) Apathy (n=53) Apathy (n=15) (n=46)
M SD M SD M SD M SD η2
Adolescent Apathy 2.66 0.36 2.66 0.31 2.04 0.23 2.12 0.29 0.48
Apathy Syndrome 2.07 0.32 1.76 0.24 1.39 0.15 1.30 0.16 0.60
Amotivation 2.94 0.35 1.31 0.43 1.12 0.23 1.14 0.39 0.56
Disengagement 1.58 0.32 1.42 0.28 1.58 0.26 1.19 0.17 0.27
Work Avoidance 4.13 0.48 2.66 0.77 2.65 0.74 1.79 0.50 0.47
Boredom Proneness 0.44 0.15 0.39 0.15 0.30 0.09 0.25 0.14 0.22
Curiosity 4.55 0.98 4.40 0.76 4.90 0.79 5.00 0.77 0.12
Distress 2.41 0.76 2.57 0.66 2.14 0.54 2.13 0.70 0.09
Well-Being 2.73 0.50 2.76 0.71 3.26 0.49 3.28 0.74 0.13
GPA† -1.33 1.50 -0.04 1.06 -0.07 0.42 0.35 0.82 0.15
Note. †GPA data are based on within-grade standardized scores.
158
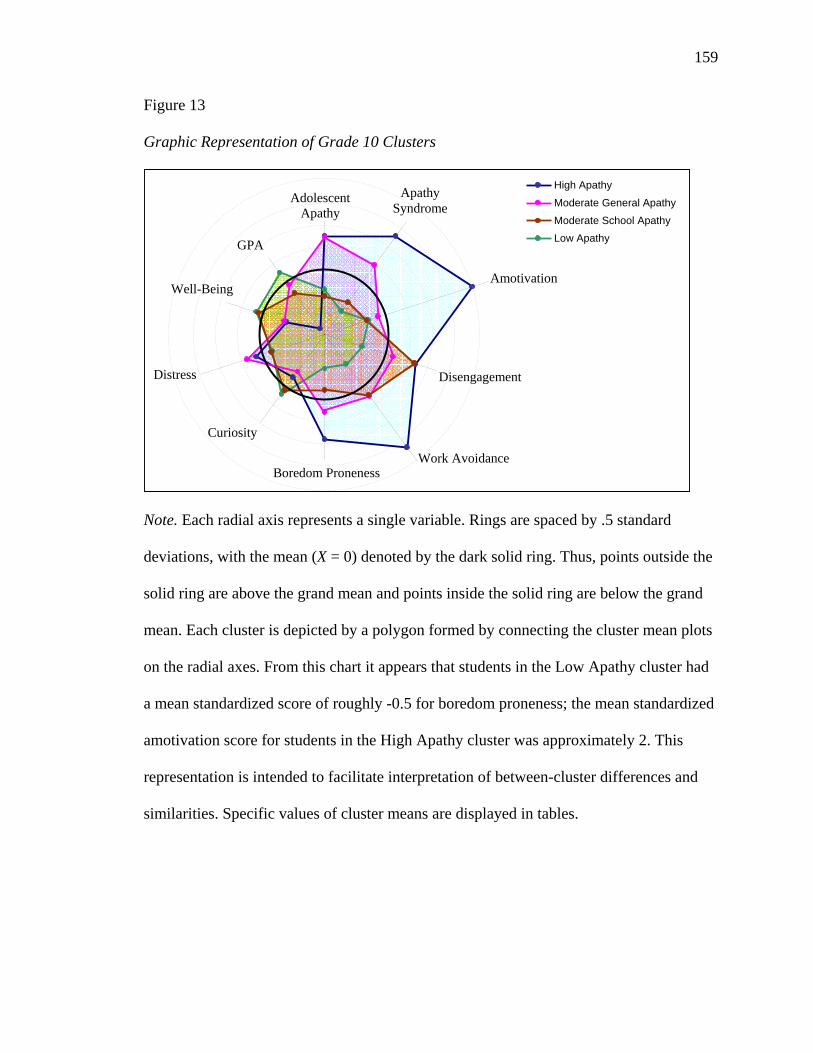
159
Figure 13
Graphic Representation of Grade 10 Clusters
Note. Each radial axis represents a single variable. Rings are spaced by .5 standard
deviations, with the mean (X = 0) denoted by the dark solid ring. Thus, points outside the
solid ring are above the grand mean and points inside the solid ring are below the grand
mean. Each cluster is depicted by a polygon formed by connecting the cluster mean plots
on the radial axes. From this chart it appears that students in the Low Apathy cluster had
a mean standardized score of roughly -0.5 for boredom proneness; the mean standardized
amotivation score for students in the High Apathy cluster was approximately 2. This
representation is intended to facilitate interpretation of between-cluster differences and
similarities. Specific values of cluster means are displayed in tables.
Low Apathy
High Apathy Moderate General Apathy
Moderate School Apathy
Adolescent Apathy
Apathy Syndrome
Amotivation
Disengagement
Work Avoidance
Curiosity
Distress
Well-Being
GPA
Boredom Proneness
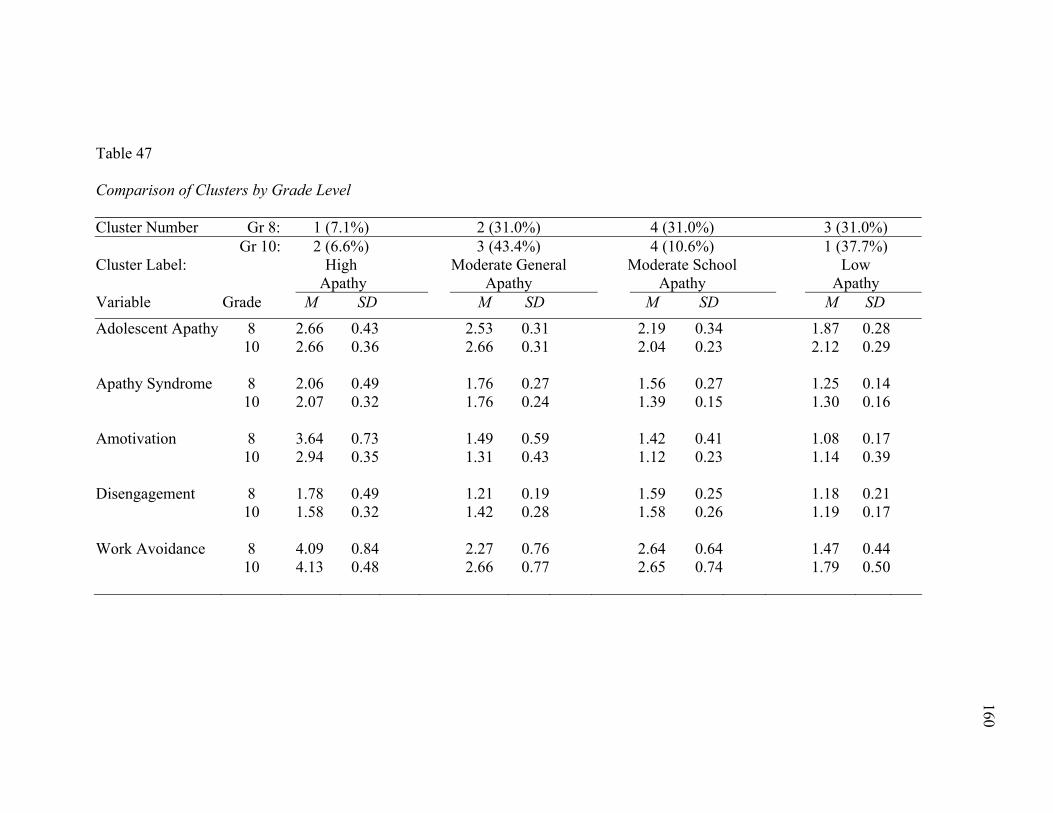
Table 47
Comparison of Clusters by Grade Level
Cluster Number Gr 8: 1 (7.1%) 2 (31.0%) 4 (31.0%) 3 (31.0%) Gr 10: 2 (6.6%) 3 (43.4%) 4 (10.6%) 1 (37.7%)
Cluster Label: High Moderate General Moderate School Low Apathy Apathy Apathy Apathy Variable Grade M SD M SD M SD M SD
Adolescent Apathy 8 2.66 0.43 2.53 0.31 2.19 0.34 1.87 0.28 10 2.66 0.36 2.66 0.31 2.04 0.23 2.12 0.29
Apathy Syndrome 8 2.06 0.49 1.76 0.27 1.56 0.27 1.25 0.14 10 2.07 0.32 1.76 0.24 1.39 0.15 1.30 0.16
Amotivation 8 3.64 0.73 1.49 0.59 1.42 0.41 1.08 0.17 10 2.94 0.35 1.31 0.43 1.12 0.23 1.14 0.39
Disengagement 8 1.78 0.49 1.21 0.19 1.59 0.25 1.18 0.21 10 1.58 0.32 1.42 0.28 1.58 0.26 1.19 0.17
Work Avoidance 8 4.09 0.84 2.27 0.76 2.64 0.64 1.47 0.44 10 4.13 0.48 2.66 0.77 2.65 0.74 1.79 0.50
160
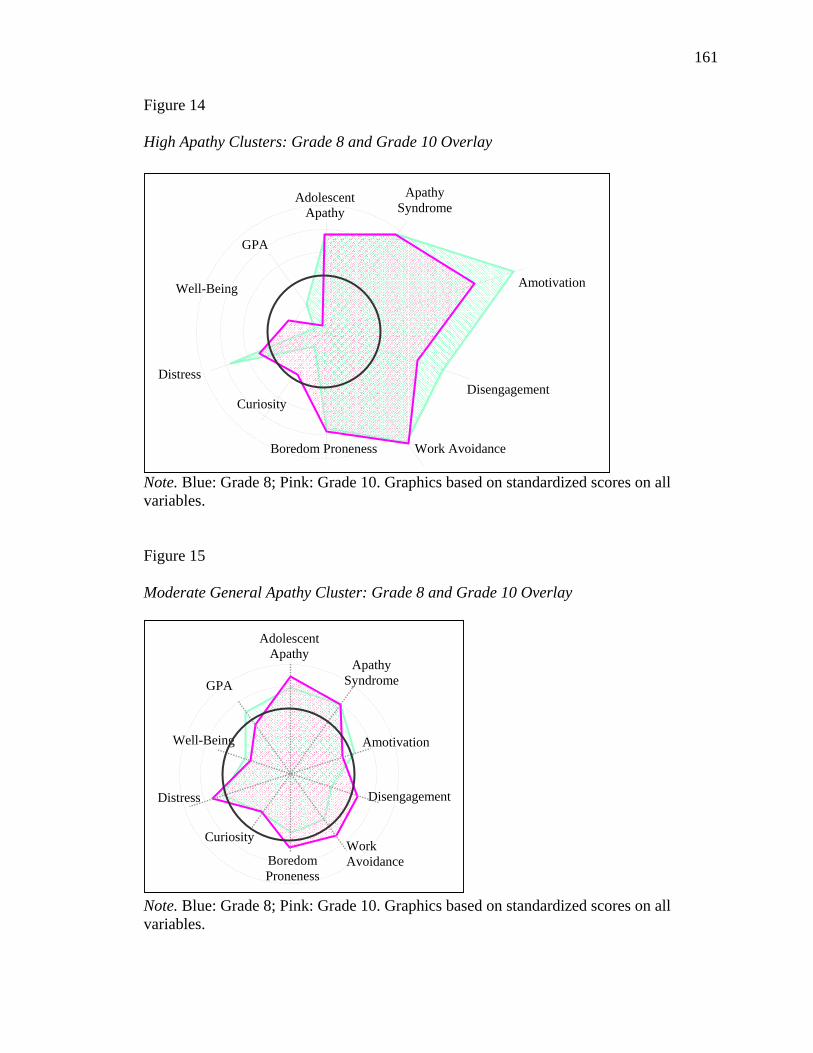
161
Figure 14
High Apathy Clusters: Grade 8 and Grade 10 Overlay
Note. Blue: Grade 8; Pink: Grade 10. Graphics based on standardized scores on all variables.
Figure 15
Moderate General Apathy Cluster: Grade 8 and Grade 10 Overlay
Note. Blue: Grade 8; Pink: Grade 10. Graphics based on standardized scores on all variables.
Adolescent Apathy
Apathy Syndrome
Amotivation
Disengagement
Work Avoidance Boredom
Proneness
Curiosity
Distress
Well-Being
GPA
Adolescent Apathy
Apathy Syndrome
Amotivation
Disengagement
Work AvoidanceBoredom Proneness
Curiosity
Distress
Well-Being
GPA
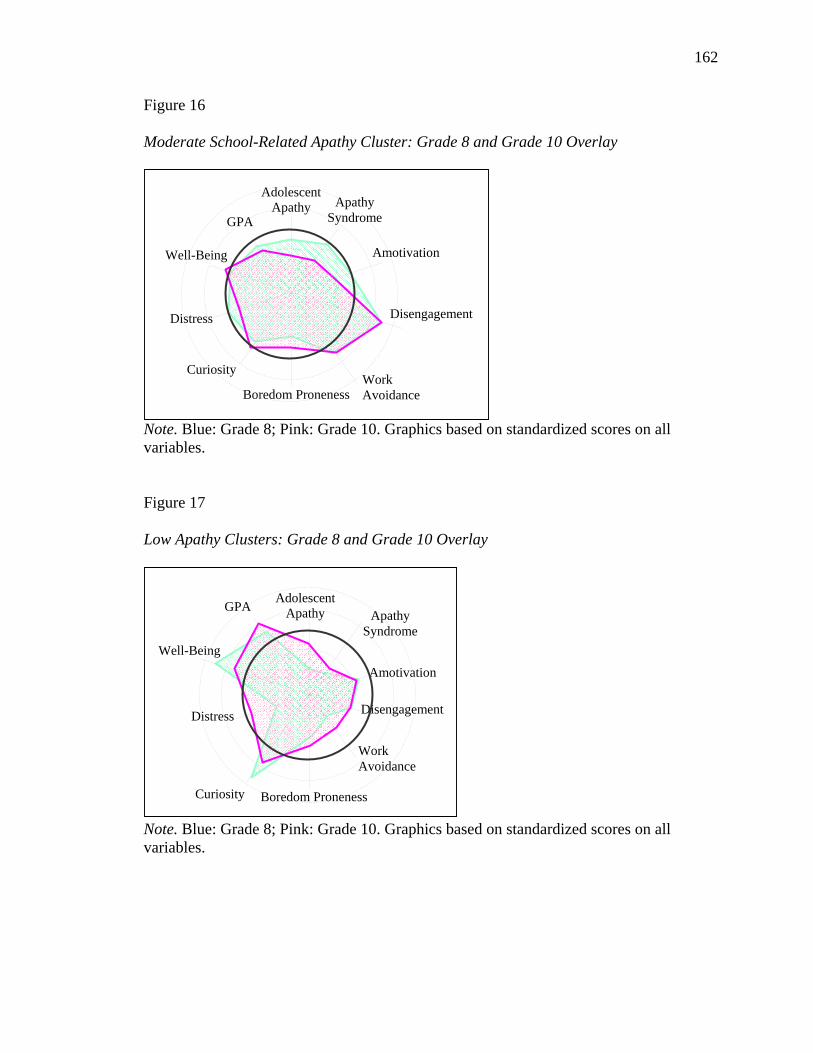
162
Figure 16
Moderate School-Related Apathy Cluster: Grade 8 and Grade 10 Overlay
Note. Blue: Grade 8; Pink: Grade 10. Graphics based on standardized scores on all variables.
Figure 17
Low Apathy Clusters: Grade 8 and Grade 10 Overlay
Note. Blue: Grade 8; Pink: Grade 10. Graphics based on standardized scores on all variables.
Adolescent Apathy Apathy
Syndrome
Amotivation
Disengagement
Work Avoidance Boredom Proneness
Curiosity
Distress
Well-Being
GPA
Adolescent Apathy Apathy
Syndrome
Amotivation
Disengagement
Work Avoidance
Boredom PronenessCuriosity
Distress
Well-Being
GPA
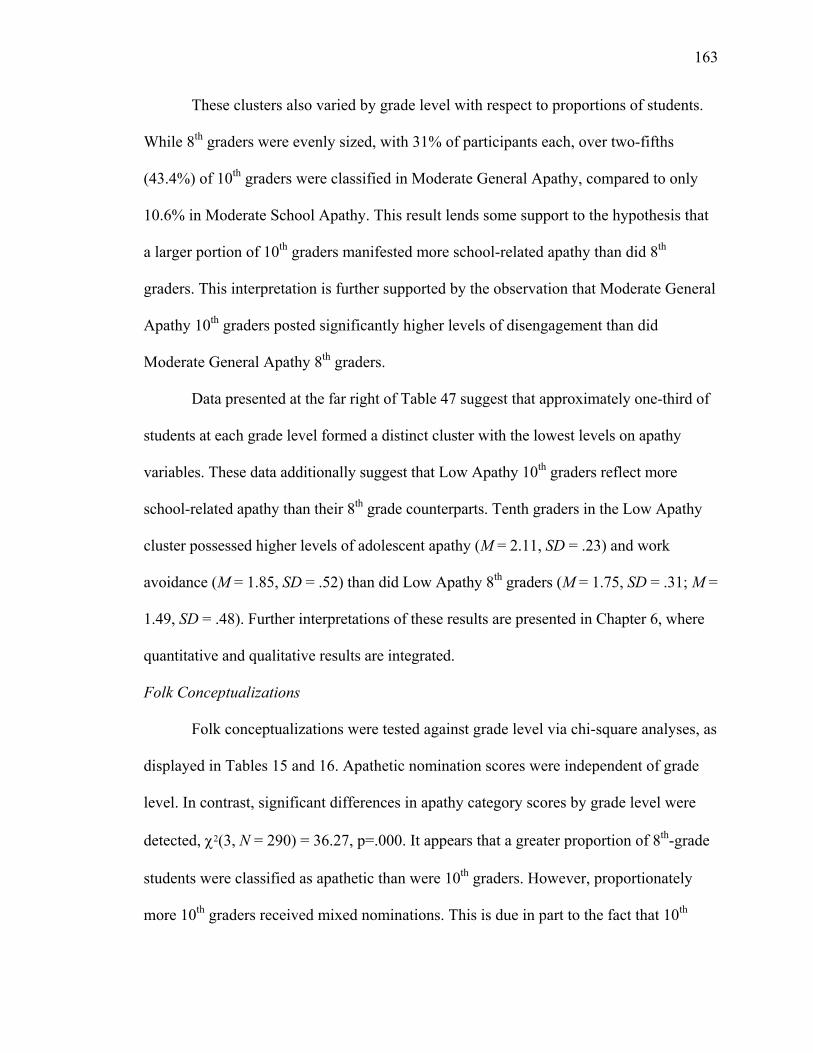
163
These clusters also varied by grade level with respect to proportions of students.
While 8th graders were evenly sized, with 31% of participants each, over two-fifths
(43.4%) of 10th graders were classified in Moderate General Apathy, compared to only
10.6% in Moderate School Apathy. This result lends some support to the hypothesis that
a larger portion of 10th graders manifested more school-related apathy than did 8th
graders. This interpretation is further supported by the observation that Moderate General
Apathy 10th graders posted significantly higher levels of disengagement than did
Moderate General Apathy 8th graders.
Data presented at the far right of Table 47 suggest that approximately one-third of
students at each grade level formed a distinct cluster with the lowest levels on apathy
variables. These data additionally suggest that Low Apathy 10th graders reflect more
school-related apathy than their 8th grade counterparts. Tenth graders in the Low Apathy
cluster possessed higher levels of adolescent apathy (M = 2.11, SD = .23) and work
avoidance (M = 1.85, SD = .52) than did Low Apathy 8th graders (M = 1.75, SD = .31; M =
1.49, SD = .48). Further interpretations of these results are presented in Chapter 6, where
quantitative and qualitative results are integrated.
Folk Conceptualizations
Folk conceptualizations were tested against grade level via chi-square analyses, as
displayed in Tables 15 and 16. Apathetic nomination scores were independent of grade
level. In contrast, significant differences in apathy category scores by grade level were
detected, χ2(3, N = 290) = 36.27, p=.000. It appears that a greater proportion of 8th-grade
students were classified as apathetic than were 10th graders. However, proportionately
more 10th graders received mixed nominations. This is due in part to the fact that 10th
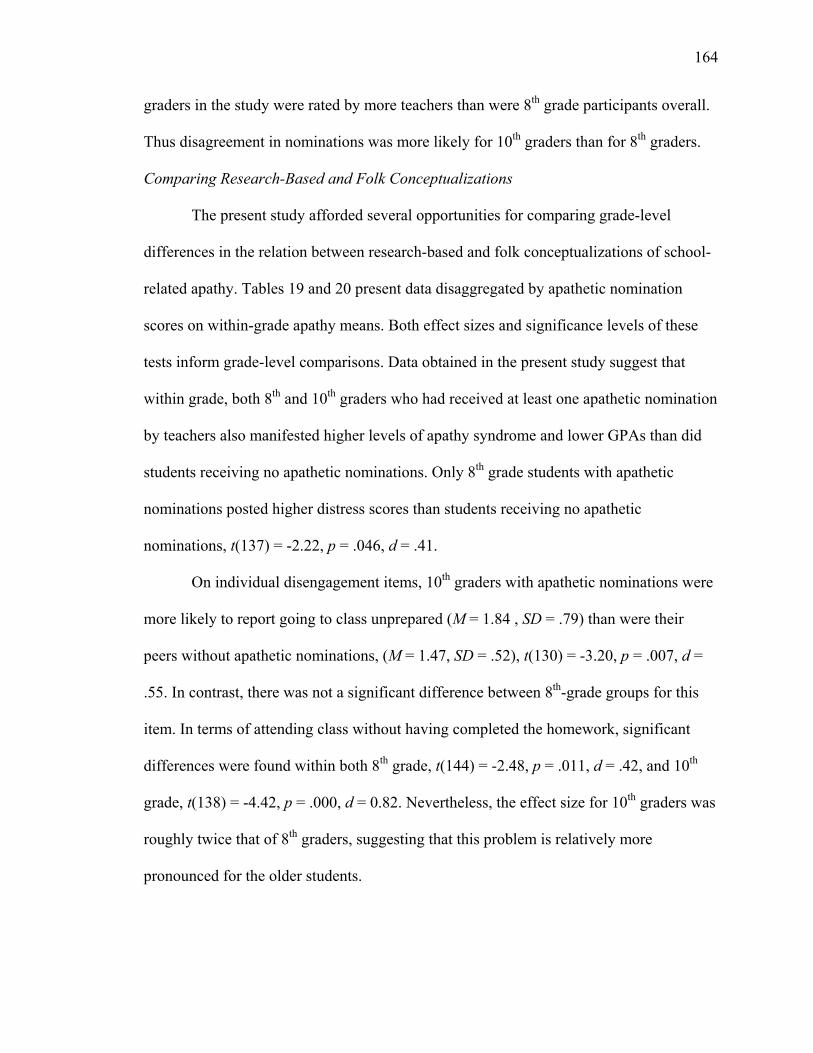
164
graders in the study were rated by more teachers than were 8th grade participants overall.
Thus disagreement in nominations was more likely for 10th graders than for 8th graders.
Comparing Research-Based and Folk Conceptualizations
The present study afforded several opportunities for comparing grade-level
differences in the relation between research-based and folk conceptualizations of school-
related apathy. Tables 19 and 20 present data disaggregated by apathetic nomination
scores on within-grade apathy means. Both effect sizes and significance levels of these
tests inform grade-level comparisons. Data obtained in the present study suggest that
within grade, both 8th and 10th graders who had received at least one apathetic nomination
by teachers also manifested higher levels of apathy syndrome and lower GPAs than did
students receiving no apathetic nominations. Only 8th grade students with apathetic
nominations posted higher distress scores than students receiving no apathetic
nominations, t(137) = -2.22, p = .046, d = .41.
On individual disengagement items, 10th graders with apathetic nominations were
more likely to report going to class unprepared (M = 1.84 , SD = .79) than were their
peers without apathetic nominations, (M = 1.47, SD = .52), t(130) = -3.20, p = .007, d =
.55. In contrast, there was not a significant difference between 8th-grade groups for this
item. In terms of attending class without having completed the homework, significant
differences were found within both 8th grade, t(144) = -2.48, p = .011, d = .42, and 10th
grade, t(138) = -4.42, p = .000, d = 0.82. Nevertheless, the effect size for 10th graders was
roughly twice that of 8th graders, suggesting that this problem is relatively more
pronounced for the older students.
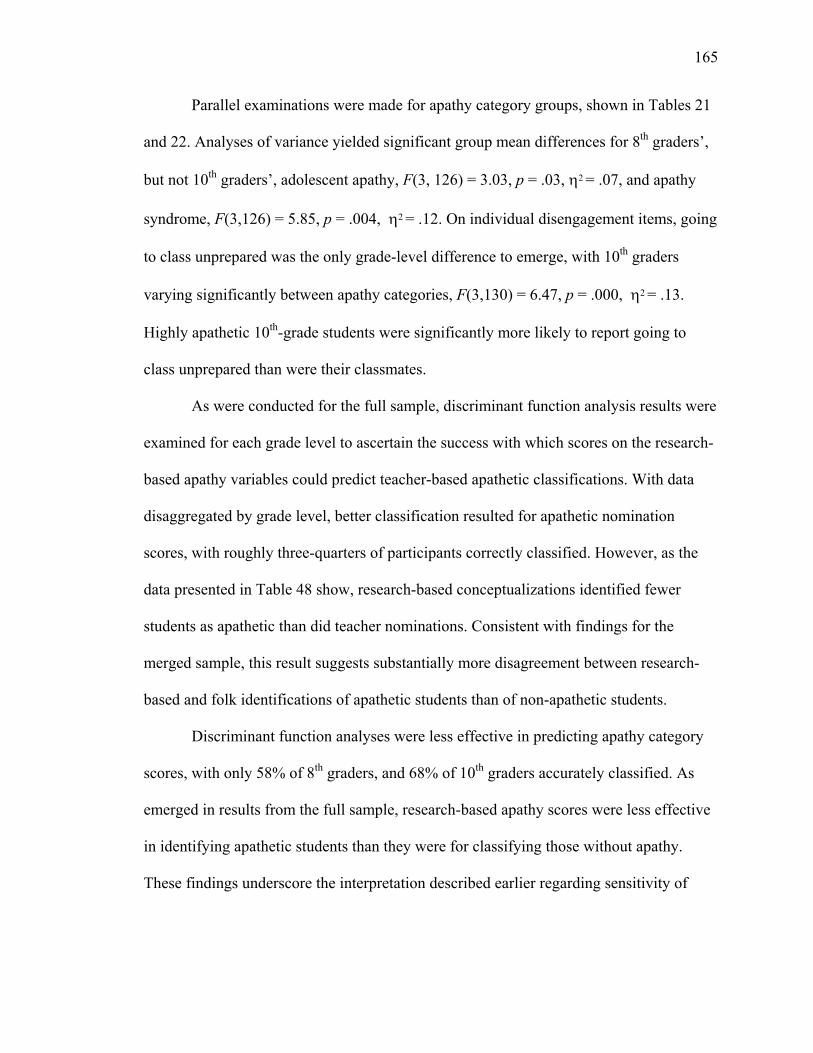
165
Parallel examinations were made for apathy category groups, shown in Tables 21
and 22. Analyses of variance yielded significant group mean differences for 8th graders’,
but not 10th graders’, adolescent apathy, F(3, 126) = 3.03, p = .03, η2 = .07, and apathy
syndrome, F(3,126) = 5.85, p = .004, η2 = .12. On individual disengagement items, going
to class unprepared was the only grade-level difference to emerge, with 10th graders
varying significantly between apathy categories, F(3,130) = 6.47, p = .000, η2 = .13.
Highly apathetic 10th-grade students were significantly more likely to report going to
class unprepared than were their classmates.
As were conducted for the full sample, discriminant function analysis results were
examined for each grade level to ascertain the success with which scores on the research-
based apathy variables could predict teacher-based apathetic classifications. With data
disaggregated by grade level, better classification resulted for apathetic nomination
scores, with roughly three-quarters of participants correctly classified. However, as the
data presented in Table 48 show, research-based conceptualizations identified fewer
students as apathetic than did teacher nominations. Consistent with findings for the
merged sample, this result suggests substantially more disagreement between research-
based and folk identifications of apathetic students than of non-apathetic students.
Discriminant function analyses were less effective in predicting apathy category
scores, with only 58% of 8th graders, and 68% of 10th graders accurately classified. As
emerged in results from the full sample, research-based apathy scores were less effective
in identifying apathetic students than they were for classifying those without apathy.
These findings underscore the interpretation described earlier regarding sensitivity of
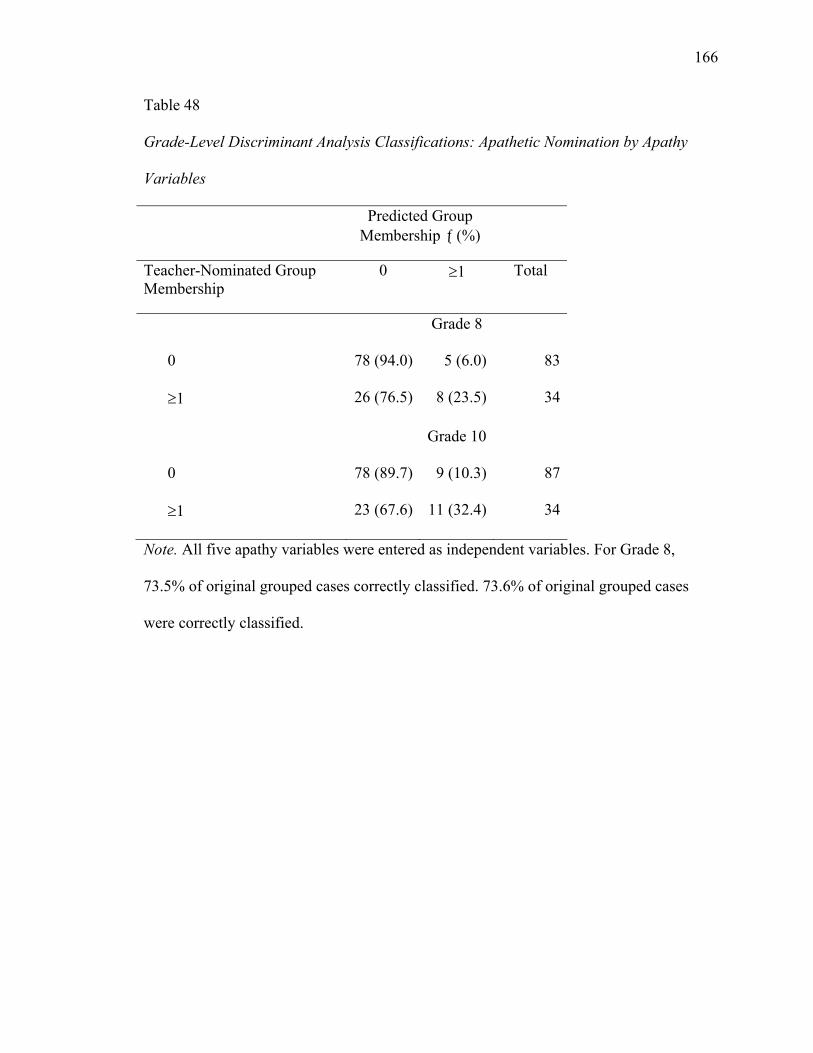
166
Table 48
Grade-Level Discriminant Analysis Classifications: Apathetic Nomination by Apathy
Variables
Predicted Group Membership ƒ (%)
Teacher-Nominated Group Membership
0 ≥1 Total
Grade 8
0 78 (94.0) 5 (6.0) 83
≥1 26 (76.5) 8 (23.5) 34
Grade 10
0 78 (89.7) 9 (10.3) 87
≥1 23 (67.6) 11 (32.4) 34
Note. All five apathy variables were entered as independent variables. For Grade 8,
73.5% of original grouped cases correctly classified. 73.6% of original grouped cases
were correctly classified.
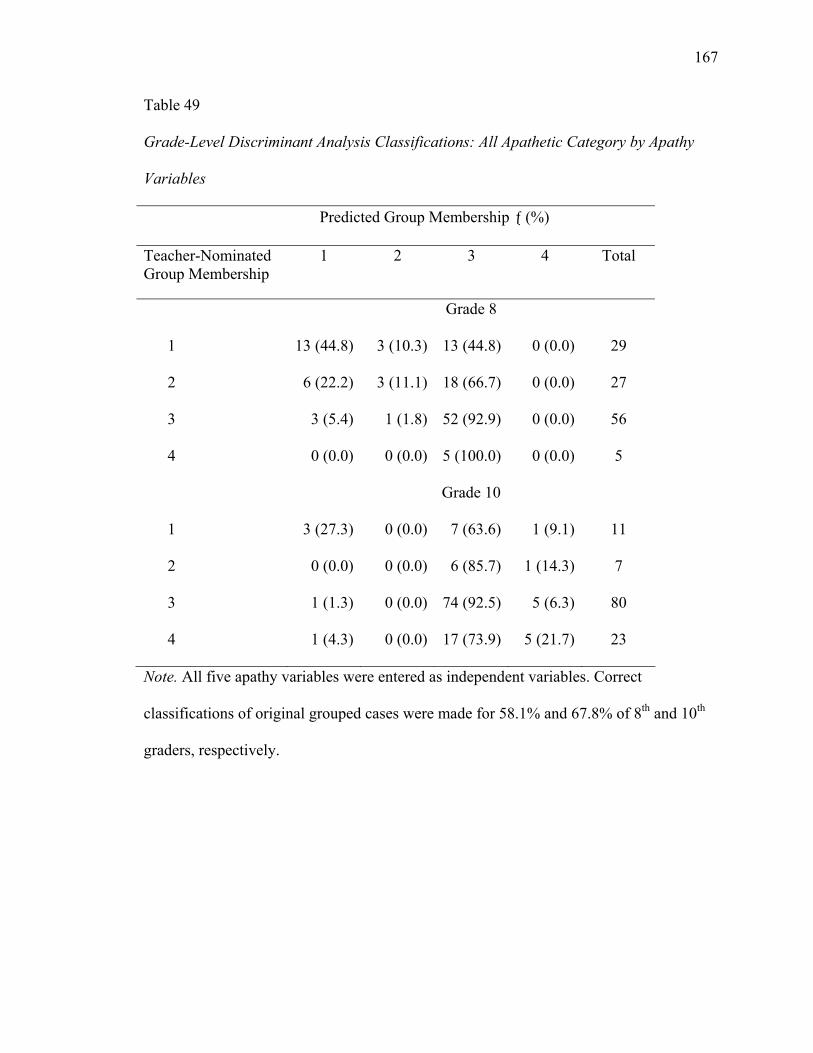
167
Table 49
Grade-Level Discriminant Analysis Classifications: All Apathetic Category by Apathy
Variables
Predicted Group Membership ƒ (%)
Teacher-Nominated Group Membership
1 2 3 4 Total
Grade 8
1 13 (44.8) 3 (10.3) 13 (44.8) 0 (0.0) 29
2 6 (22.2) 3 (11.1) 18 (66.7) 0 (0.0) 27
3 3 (5.4) 1 (1.8) 52 (92.9) 0 (0.0) 56
4 0 (0.0) 0 (0.0) 5 (100.0) 0 (0.0) 5
Grade 10
1 3 (27.3) 0 (0.0) 7 (63.6) 1 (9.1) 11
2 0 (0.0) 0 (0.0) 6 (85.7) 1 (14.3) 7
3 1 (1.3) 0 (0.0) 74 (92.5) 5 (6.3) 80
4 1 (4.3) 0 (0.0) 17 (73.9) 5 (21.7) 23
Note. All five apathy variables were entered as independent variables. Correct
classifications of original grouped cases were made for 58.1% and 67.8% of 8th and 10th
graders, respectively.
168
research-based apathy operationalizations to students who, from teachers’ perspectives,
lack motivation for school (see Table 49).
In addition, little success obtained in predicting which students would receive
mixed reviews from teachers. This is potentially due to the domain-specific character of
school-related apathy, which the research-based measures were not configured to detect.
The content-specific nature of teachers’ roles would have reflected students’ domain-
specific apathy as manifested in specific subject-matter classes. The data presented in
Chapter 5 support this interpretation.
Data from cluster analyses at each grade level were also compared against apathetic
nomination and apathy category scores, as shown in Tables 42 and 45. For 8th graders, no
significant differences were detected in either frequency distribution. In other words,
these data did not offer evidence that apathetic nomination or apathy category scores are
dependent with respect to cluster membership. Although non-significant results do not
offer support for specific hypotheses, this finding suggests that research-based and folk
perceptions of student apathy do differ. If on the other hand they were similar, then
cluster nomination and apathetic nominations should not be independent.
In contrast, the significant results obtained for 10th graders indicates their cluster
membership was dependent with respect to both forms of teacher-derived apathy scores.
Thus, in contrast to 8th graders, evidence was observed that research-based and folk
perceptions of school-related apathy in students are related.
The data presented in this section offer several insights into potential differences
between research-based and folk conceptualizations of school-related apathy. First, the
finding that 8th-grade—but not 10th-grade—students receiving apathetic nominations
169
differed significantly on levels of apathy syndrome, distress, and GPA from those not
receiving apathetic nominations suggests that 8th-grade teachers may have been more in
tune with student levels of apathy. All 8th grade participants came from small schools and
in many cases teachers had known the students since they were in kindergarten.
Another possibility is that 8th-grade teachers’ conceptualizations of school-related
apathy bore closer resemblance to the operationalizations of these constructs than did
those of 10th-grade teachers. With respect to the GPA differences, middle school data
reflected substantial negative skew, with some schools reporting all “A” averages for all
students. Eighth-grade students with low GPAs were rare, and thus perhaps stood out
clearly as candidates for classification as apathetic toward school.
In contrast, 10th-grade teachers appeared more sensitive than 8th-grade teachers to
aspects of disengagement, specifically to going to class unprepared and without having
completed homework. This finding suggests that 10th grade teachers may have been more
in tune with markers of achievement than were 8th-grade teachers. Cast in alternative
terms, teachers of these grade levels may hold different priorities for students’ motivation
for school.
Prevalence of School-Related Apathy
Data from each grade level were examined to address the hypothesis of the
present study that apathy would be more pronounced and reflect increased variance in the
later adolescent years. First, proportions of students classified as apathetic by teacher
nominations and by research-based variables were reviewed. Second, within-grade mean
levels of apathy variables were compared to their possible score ranges. Third, t-tests
were performed to detect between-grade differences in mean levels of apathy variables.
170
Proportions of students classified in cluster analyses as highly to moderately
apathetic were examined. These data are presented in Tables 41, 44, and 47. Cluster data
indicate similar proportions of 8th and 10th graders manifest strong school-related apathy.
However, proportions for other groups varied between grades, with a higher percentage
(43%) of 10th graders in the moderate general apathy group, in contrast to 31% of 8th
graders. More 8th graders fell into a moderate school apathy cluster than did 10th graders,
and posted higher mean levels of apathy syndrome and amotivation. Similar proportions
of students fell into the low apathy clusters for grades 8 (31%) and 10 (38%). However,
10th graders in this cluster reported higher adolescent apathy and work avoidance than did
8th graders classified by cluster analyses as low on school-related apathy. Consistent with
hypotheses, these data suggest that 10th graders with the fewest signs of school-related
apathy nevertheless manifest higher adolescent apathy and work avoidance than do
similarly classified 8th graders.
Scores on all apathy variables were tested against the midpoint and lowest point
of their response scales. Results indicated that mean levels of apathy reported by students
in each grade were significantly less than the scale midpoint and significantly higher than
the lowest score possible. All tests yielded p = .000. For both 8th- and 10th-grade
participants, mean levels of each apathy variable were significantly greater than the
lowest point on the scale, at p=.000. These results are consistent with those reported for
the full sample. In between-grade comparisons of average levels of apathy, only
adolescent apathy scores were observed to differ significantly, with 8th graders (M = 2.21,
SD = .43) reporting lower adolescent apathy than did 10th graders (M = 2.37, SD = .41),
t(270) = -3.14, p = .002, d = .38.
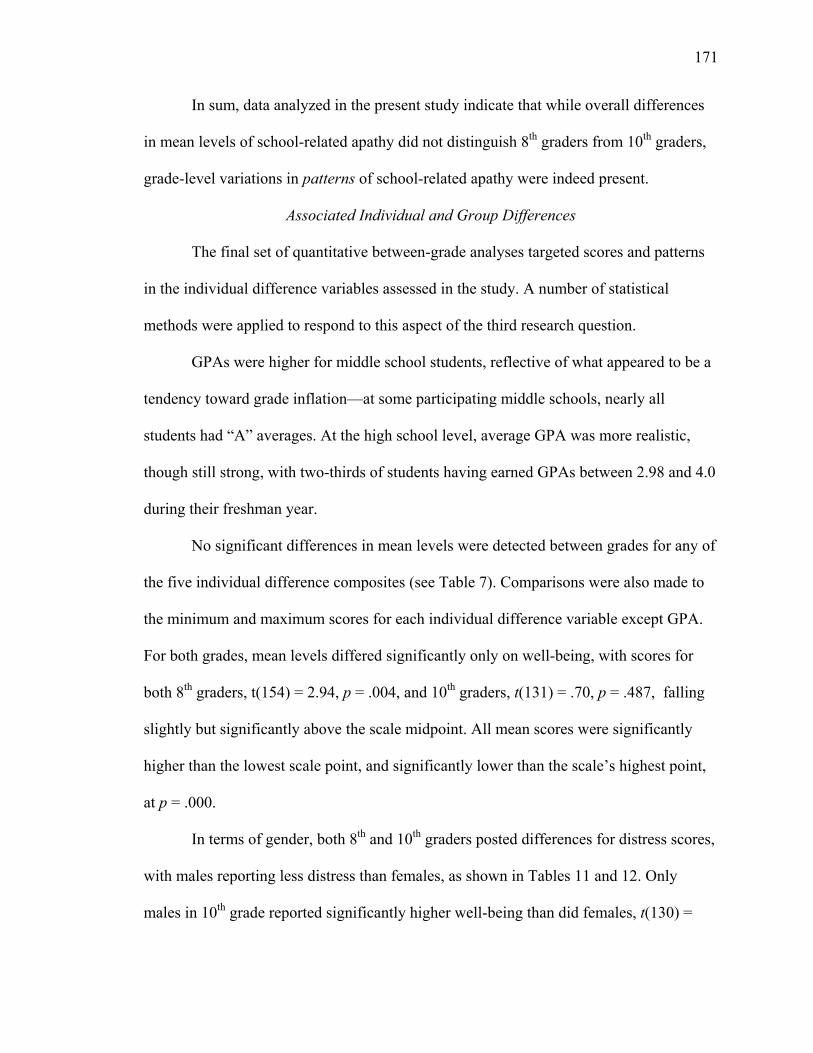
171
In sum, data analyzed in the present study indicate that while overall differences
in mean levels of school-related apathy did not distinguish 8th graders from 10th graders,
grade-level variations in patterns of school-related apathy were indeed present.
Associated Individual and Group Differences
The final set of quantitative between-grade analyses targeted scores and patterns
in the individual difference variables assessed in the study. A number of statistical
methods were applied to respond to this aspect of the third research question.
GPAs were higher for middle school students, reflective of what appeared to be a
tendency toward grade inflation—at some participating middle schools, nearly all
students had “A” averages. At the high school level, average GPA was more realistic,
though still strong, with two-thirds of students having earned GPAs between 2.98 and 4.0
during their freshman year.
No significant differences in mean levels were detected between grades for any of
the five individual difference composites (see Table 7). Comparisons were also made to
the minimum and maximum scores for each individual difference variable except GPA.
For both grades, mean levels differed significantly only on well-being, with scores for
both 8th graders, t(154) = 2.94, p = .004, and 10th graders, t(131) = .70, p = .487, falling
slightly but significantly above the scale midpoint. All mean scores were significantly
higher than the lowest scale point, and significantly lower than the scale’s highest point,
at p = .000.
In terms of gender, both 8th and 10th graders posted differences for distress scores,
with males reporting less distress than females, as shown in Tables 11 and 12. Only
males in 10th grade reported significantly higher well-being than did females, t(130) =
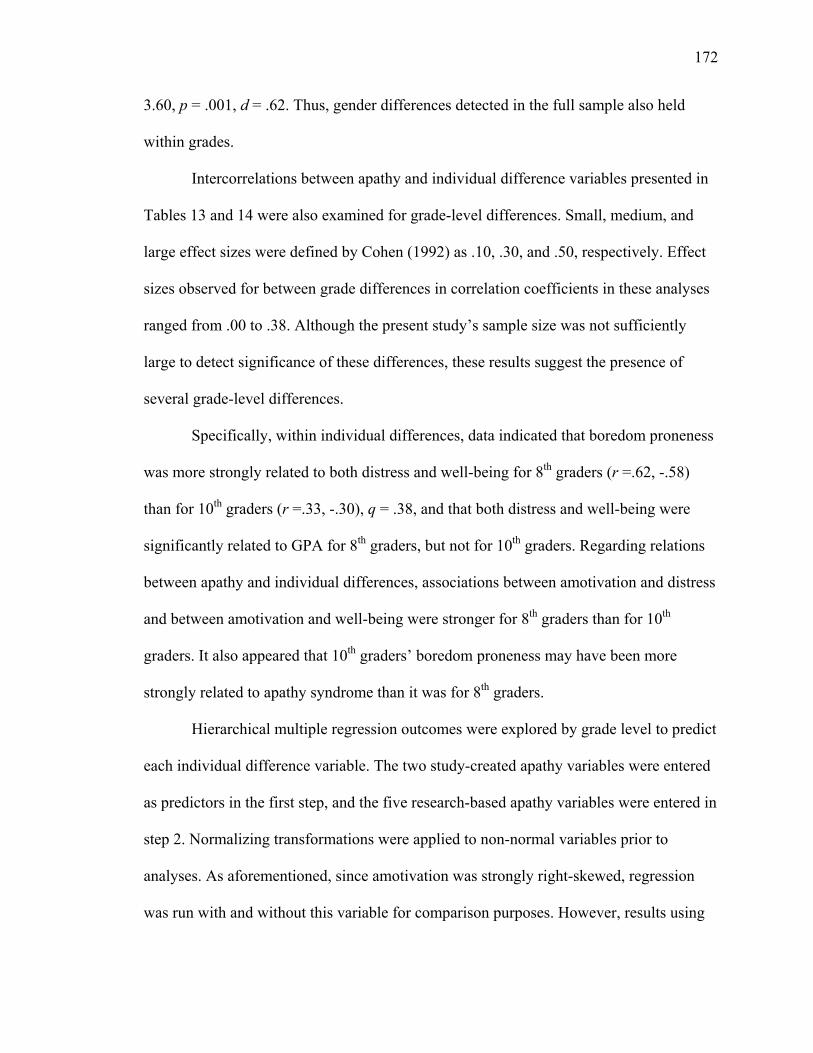
172
3.60, p = .001, d = .62. Thus, gender differences detected in the full sample also held
within grades.
Intercorrelations between apathy and individual difference variables presented in
Tables 13 and 14 were also examined for grade-level differences. Small, medium, and
large effect sizes were defined by Cohen (1992) as .10, .30, and .50, respectively. Effect
sizes observed for between grade differences in correlation coefficients in these analyses
ranged from .00 to .38. Although the present study’s sample size was not sufficiently
large to detect significance of these differences, these results suggest the presence of
several grade-level differences.
Specifically, within individual differences, data indicated that boredom proneness
was more strongly related to both distress and well-being for 8th graders (r =.62, -.58)
than for 10th graders (r =.33, -.30), q = .38, and that both distress and well-being were
significantly related to GPA for 8th graders, but not for 10th graders. Regarding relations
between apathy and individual differences, associations between amotivation and distress
and between amotivation and well-being were stronger for 8th graders than for 10th
graders. It also appeared that 10th graders’ boredom proneness may have been more
strongly related to apathy syndrome than it was for 8th graders.
Hierarchical multiple regression outcomes were explored by grade level to predict
each individual difference variable. The two study-created apathy variables were entered
as predictors in the first step, and the five research-based apathy variables were entered in
step 2. Normalizing transformations were applied to non-normal variables prior to
analyses. As aforementioned, since amotivation was strongly right-skewed, regression
was run with and without this variable for comparison purposes. However, results using
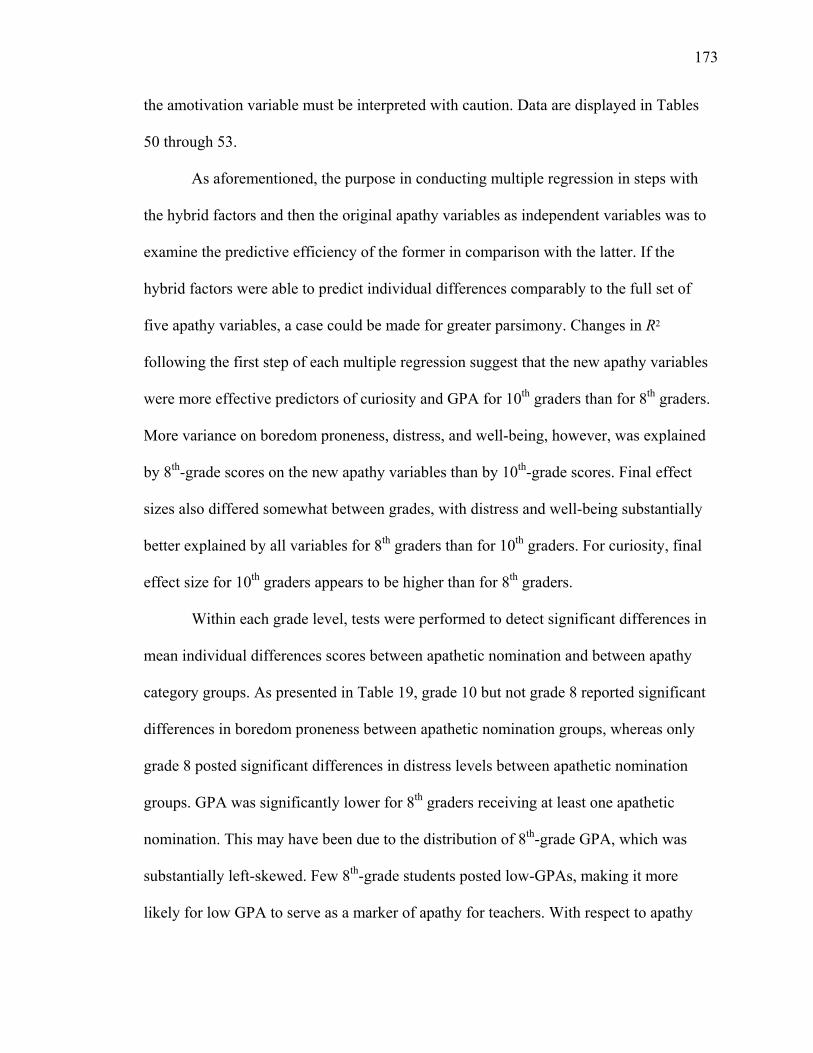
173
the amotivation variable must be interpreted with caution. Data are displayed in Tables
50 through 53.
As aforementioned, the purpose in conducting multiple regression in steps with
the hybrid factors and then the original apathy variables as independent variables was to
examine the predictive efficiency of the former in comparison with the latter. If the
hybrid factors were able to predict individual differences comparably to the full set of
five apathy variables, a case could be made for greater parsimony. Changes in R2
following the first step of each multiple regression suggest that the new apathy variables
were more effective predictors of curiosity and GPA for 10th graders than for 8th graders.
More variance on boredom proneness, distress, and well-being, however, was explained
by 8th-grade scores on the new apathy variables than by 10th-grade scores. Final effect
sizes also differed somewhat between grades, with distress and well-being substantially
better explained by all variables for 8th graders than for 10th graders. For curiosity, final
effect size for 10th graders appears to be higher than for 8th graders.
Within each grade level, tests were performed to detect significant differences in
mean individual differences scores between apathetic nomination and between apathy
category groups. As presented in Table 19, grade 10 but not grade 8 reported significant
differences in boredom proneness between apathetic nomination groups, whereas only
grade 8 posted significant differences in distress levels between apathetic nomination
groups. GPA was significantly lower for 8th graders receiving at least one apathetic
nomination. This may have been due to the distribution of 8th-grade GPA, which was
substantially left-skewed. Few 8th-grade students posted low-GPAs, making it more
likely for low GPA to serve as a marker of apathy for teachers. With respect to apathy
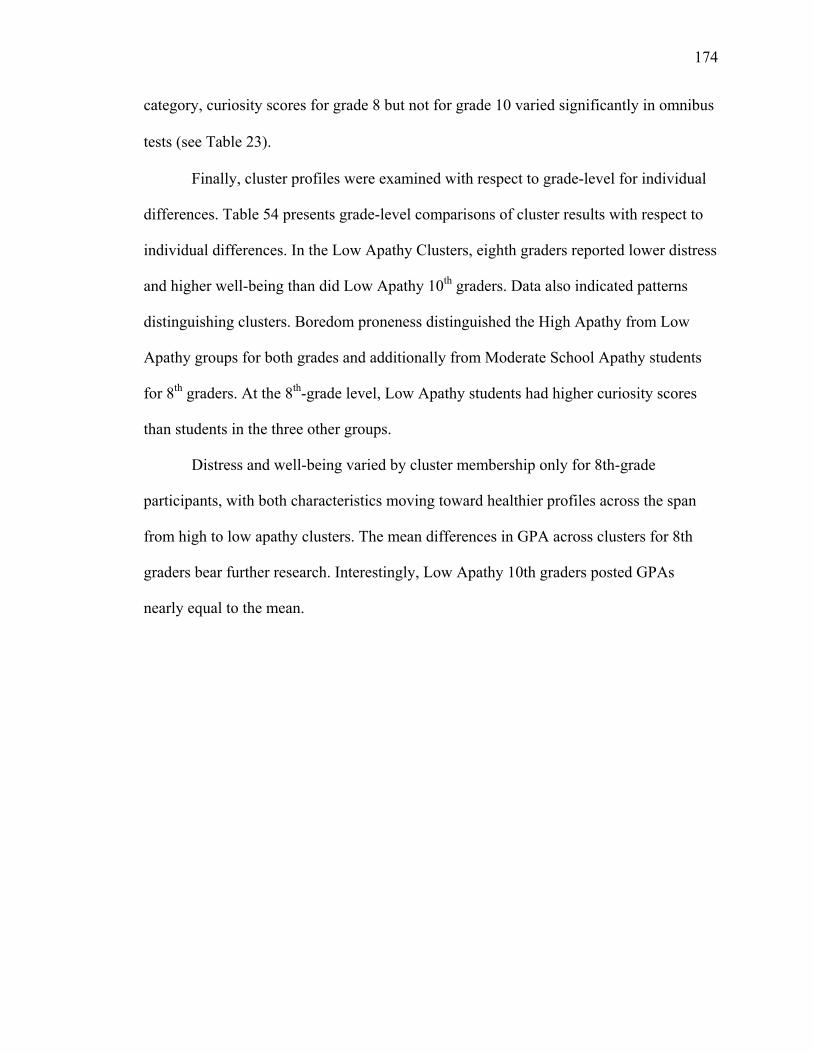
174
category, curiosity scores for grade 8 but not for grade 10 varied significantly in omnibus
tests (see Table 23).
Finally, cluster profiles were examined with respect to grade-level for individual
differences. Table 54 presents grade-level comparisons of cluster results with respect to
individual differences. In the Low Apathy Clusters, eighth graders reported lower distress
and higher well-being than did Low Apathy 10th graders. Data also indicated patterns
distinguishing clusters. Boredom proneness distinguished the High Apathy from Low
Apathy groups for both grades and additionally from Moderate School Apathy students
for 8th graders. At the 8th-grade level, Low Apathy students had higher curiosity scores
than students in the three other groups.
Distress and well-being varied by cluster membership only for 8th-grade
participants, with both characteristics moving toward healthier profiles across the span
from high to low apathy clusters. The mean differences in GPA across clusters for 8th
graders bear further research. Interestingly, Low Apathy 10th graders posted GPAs
nearly equal to the mean.
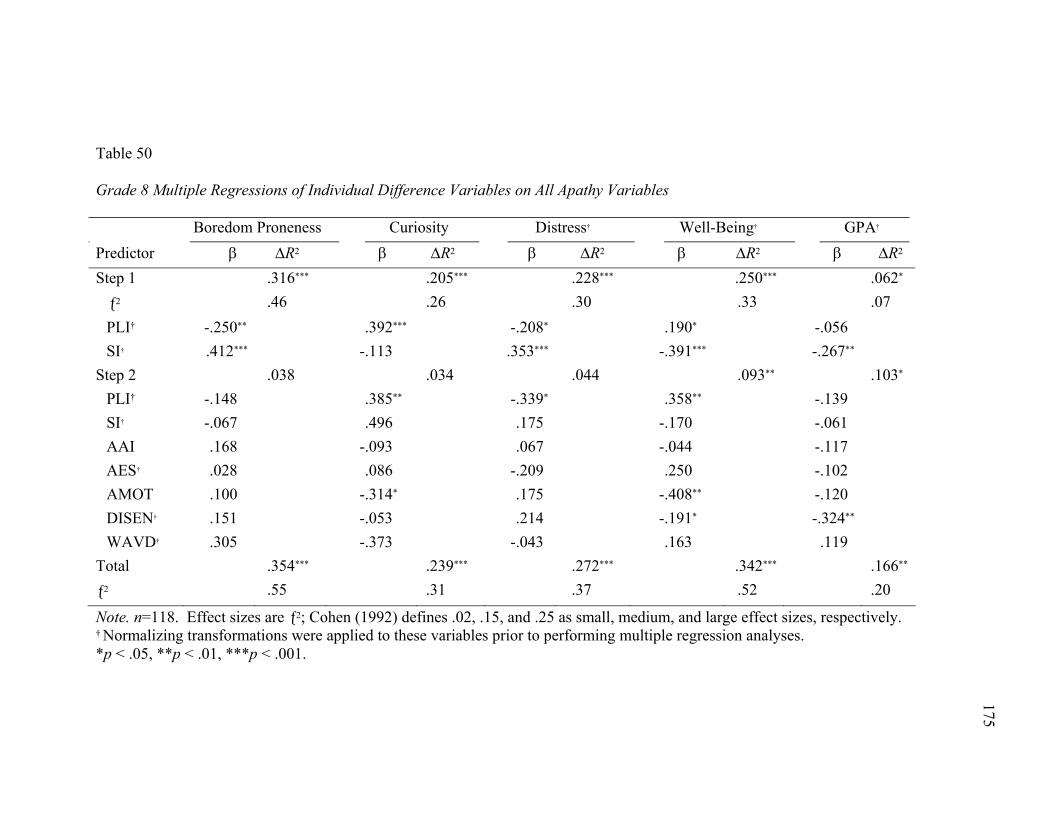
Table 50
Grade 8 Multiple Regressions of Individual Difference Variables on All Apathy Variables
Boredom Proneness Curiosity Distress† Well-Being† GPA† Predictor β ΔR2 β ΔR2 β ΔR2 β ΔR2 β ΔR2
Step 1 .316*** .205*** .228*** .250*** .062* ƒ2 .46 .26 .30 .33 .07 PLI† -.250** .392*** -.208* .190* -.056 SI† .412*** -.113 .353*** -.391*** -.267**
Step 2 .038 .034 .044 .093** .103* PLI† -.148 .385** -.339* .358** -.139 SI† -.067 .496 .175 -.170 -.061 AAI .168 -.093 .067 -.044 -.117 AES† .028 .086 -.209 .250 -.102 AMOT .100 -.314* .175 -.408** -.120 DISEN† .151 -.053 .214 -.191* -.324** WAVD† .305 -.373 -.043 .163 .119
Total .354*** .239*** .272*** .342*** .166**
ƒ2 .55 .31 .37 .52 .20
Note. n=118. Effect sizes are ƒ2; Cohen (1992) defines .02, .15, and .25 as small, medium, and large effect sizes, respectively. † Normalizing transformations were applied to these variables prior to performing multiple regression analyses. *p < .05, **p < .01, ***p < .001.
175
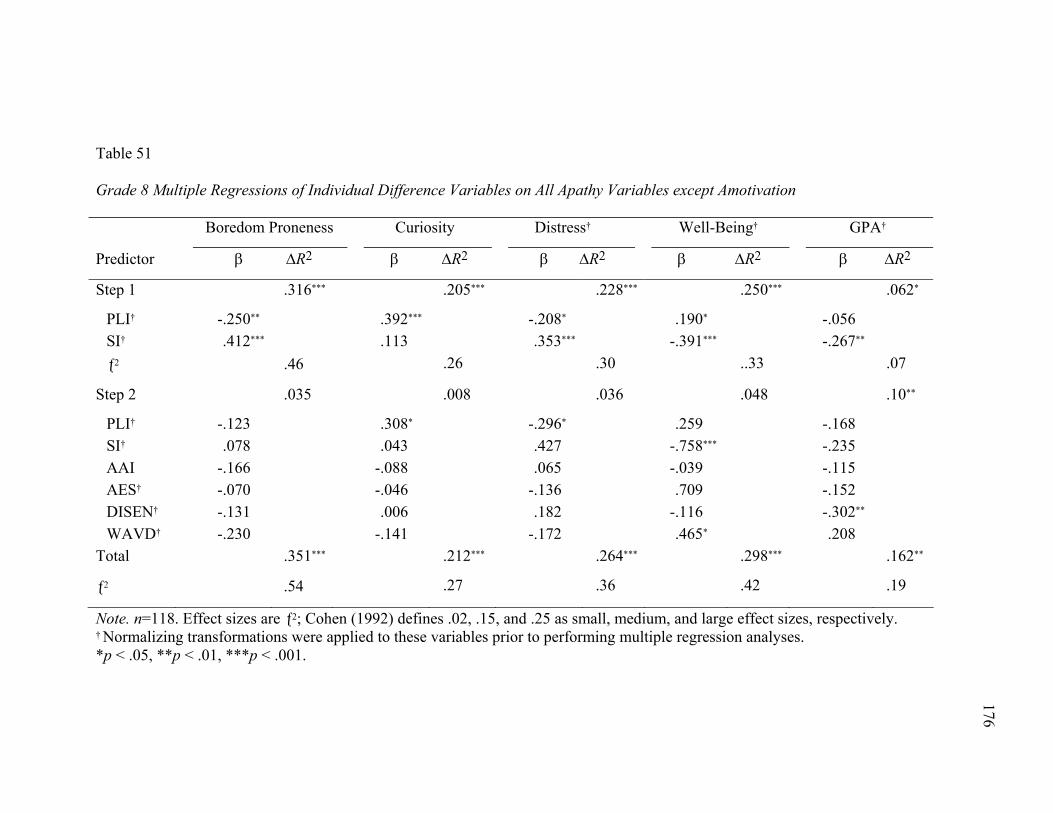
Table 51
Grade 8 Multiple Regressions of Individual Difference Variables on All Apathy Variables except Amotivation
Boredom Proneness Curiosity Distress† Well-Being† GPA†
Predictor β ΔR2 β ΔR2 β ΔR2 β ΔR2 β ΔR2
Step 1 .316*** .205*** .228*** .250*** .062*
PLI† -.250** .392*** -.208* .190* -.056 SI† .412*** .113 .353*** -.391*** -.267** ƒ2 .46 .26 .30 ..33 .07
Step 2 .035 .008 .036 .048 .10**
PLI† -.123 .308* -.296* .259 -.168 SI† .078 .043 .427 -.758*** -.235 AAI -.166 -.088 .065 -.039 -.115 AES† -.070 -.046 -.136 .709 -.152 DISEN† -.131 .006 .182 -.116 -.302** WAVD† -.230 -.141 -.172 .465* .208
Total .351*** .212*** .264*** .298*** .162**
ƒ2 .54 .27 .36 .42 .19
Note. n=118. Effect sizes are ƒ2; Cohen (1992) defines .02, .15, and .25 as small, medium, and large effect sizes, respectively. † Normalizing transformations were applied to these variables prior to performing multiple regression analyses. *p < .05, **p < .01, ***p < .001.
176
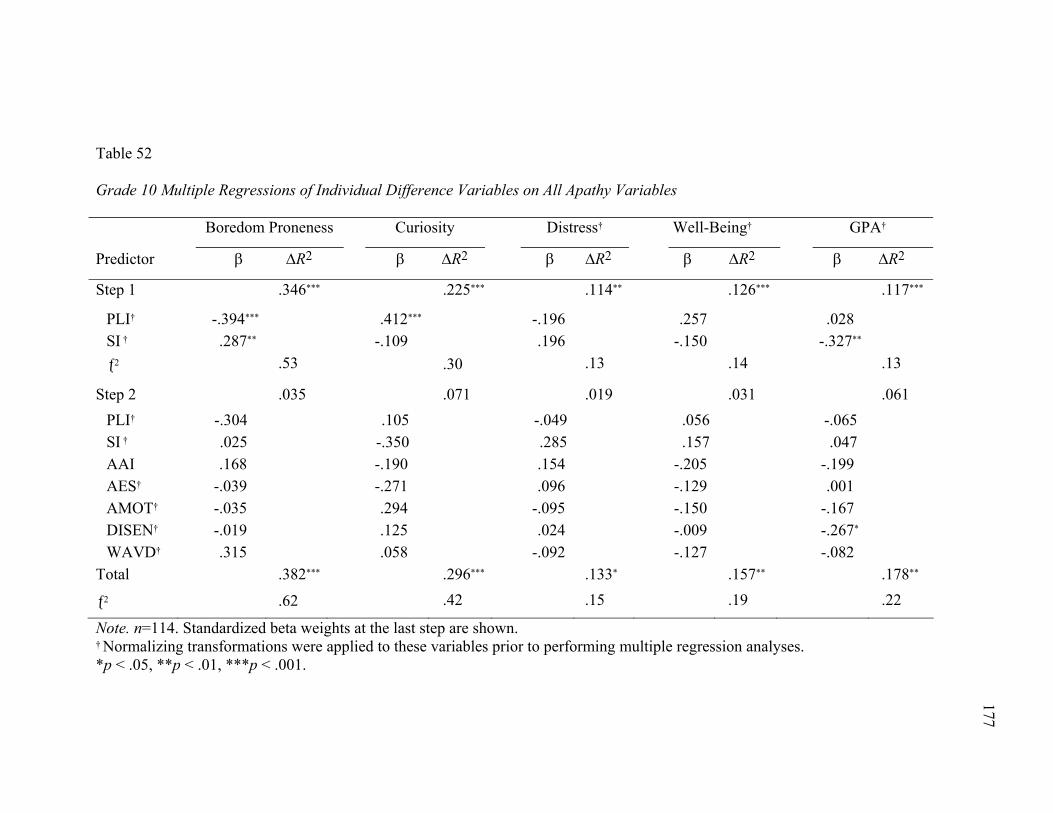
Table 52
Grade 10 Multiple Regressions of Individual Difference Variables on All Apathy Variables
Boredom Proneness Curiosity Distress† Well-Being† GPA†
Predictor β ΔR2 β ΔR2 β ΔR2 β ΔR2 β ΔR2
Step 1 .346*** .225*** .114** .126*** .117***
PLI† -.394*** .412*** -.196 .257 .028
SI † .287** -.109 .196 -.150 -.327**
ƒ2 .53 .30 .13 .14 .13
Step 2 .035 .071 .019 .031 .061
PLI† -.304 .105 -.049 .056 -.065
SI † .025 -.350 .285 .157 .047
AAI .168 -.190 .154 -.205 -.199
AES† -.039 -.271 .096 -.129 .001
AMOT† -.035 .294 -.095 -.150 -.167
DISEN† -.019 .125 .024 -.009 -.267*
WAVD† .315 .058 -.092 -.127 -.082
Total .382*** .296*** .133* .157** .178**
ƒ2 .62 .42 .15 .19 .22
Note. n=114. Standardized beta weights at the last step are shown. † Normalizing transformations were applied to these variables prior to performing multiple regression analyses. *p < .05, **p < .01, ***p < .001.
177
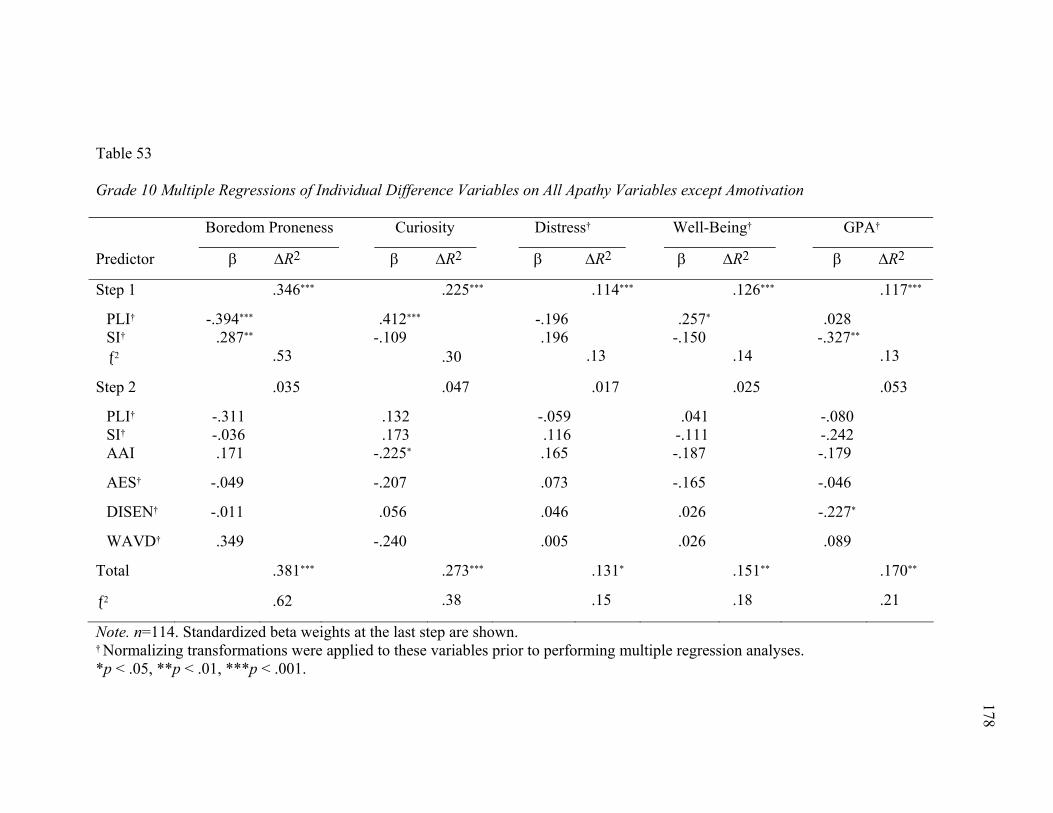
Table 53
Grade 10 Multiple Regressions of Individual Difference Variables on All Apathy Variables except Amotivation
Boredom Proneness Curiosity Distress† Well-Being† GPA†
Predictor β ΔR2 β ΔR2 β ΔR2 β ΔR2 β ΔR2
Step 1 .346*** .225*** .114*** .126*** .117***
PLI† -.394*** .412*** -.196 .257* .028 SI† .287** -.109 .196 -.150 -.327**
ƒ2 .53 .30 .13 .14 .13
Step 2 .035 .047 .017 .025 .053
PLI† -.311 .132 -.059 .041 -.080 SI† -.036 .173 .116 -.111 -.242 AAI .171 -.225* .165 -.187 -.179
AES† -.049 -.207 .073 -.165 -.046
DISEN† -.011 .056 .046 .026 -.227*
WAVD† .349 -.240 .005 .026 .089
Total .381*** .273*** .131* .151** .170**
ƒ2 .62 .38 .15 .18 .21
Note. n=114. Standardized beta weights at the last step are shown. † Normalizing transformations were applied to these variables prior to performing multiple regression analyses. *p < .05, **p < .01, ***p < .001.
178
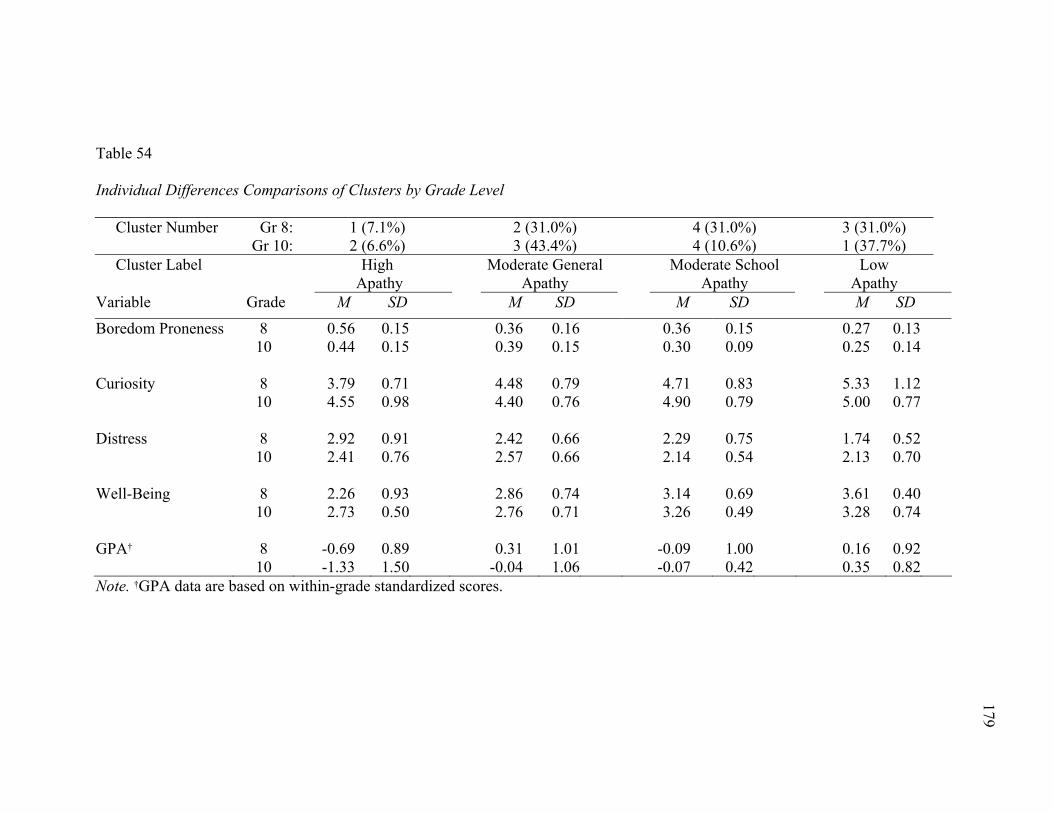
Table 54
Individual Differences Comparisons of Clusters by Grade Level
Cluster Number Gr 8: 1 (7.1%) 2 (31.0%) 4 (31.0%) 3 (31.0%) Gr 10: 2 (6.6%) 3 (43.4%) 4 (10.6%) 1 (37.7%)
Cluster Label High Moderate General Moderate School Low Apathy Apathy Apathy Apathy Variable Grade M SD M SD M SD M SD
Boredom Proneness 8 0.56 0.15 0.36 0.16 0.36 0.15 0.27 0.13 10 0.44 0.15 0.39 0.15 0.30 0.09 0.25 0.14
Curiosity 8 3.79 0.71 4.48 0.79 4.71 0.83 5.33 1.12 10 4.55 0.98 4.40 0.76 4.90 0.79 5.00 0.77
Distress 8 2.92 0.91 2.42 0.66 2.29 0.75 1.74 0.52 10 2.41 0.76 2.57 0.66 2.14 0.54 2.13 0.70
Well-Being 8 2.26 0.93 2.86 0.74 3.14 0.69 3.61 0.40 10 2.73 0.50 2.76 0.71 3.26 0.49 3.28 0.74
GPA† 8 -0.69 0.89 0.31 1.01 -0.09 1.00 0.16 0.92 10 -1.33 1.50 -0.04 1.06 -0.07 0.42 0.35 0.82 Note. †GPA data are based on within-grade standardized scores.
179
180
CHAPTER V
QUALITATIVE RESULTS
In keeping with a “diversity of views” rationale, interviews were conducted with
teachers and students to identify a range of folk perspectives associated with the first and
third research questions of the present study. This approach afforded documentation of
participants’ insights into school-related apathy in order to both validate and enhance
existing research-based conceptualizations (Bryman, 2006).
Specifically, the interview data were consulted to reveal how teachers and
students conceptualize school-related apathy, and to what extent those “folk constructs”
are consistent with research-based conceptualizations. Responses were also examined for
perceptions of the prevalence of school-related apathy in students and for agreement
between teacher and student participants regarding prevalence estimates. As detailed in
the following section, the process adopted for extracting themes yielded a set of codes
which were assigned to responses and subsequently aggregated at the participant level.
Grouping codes at the participant unit of analysis allowed code distributions to be
compared by grade, gender, and apathy category to ascertain whether participants’
conceptualizations of school-related apathy differed with respect to these individual
differences.
Interview Procedures
A total of 96 interviews of teachers (38) and students (58) were conducted by the
researcher at participants’ schools. All teachers who agreed to participate in the study
were interviewed, resulting in data from 23 8th-grade teachers and 15 10th-grade teachers.
As outlined in Chapter 3, a random stratified sample of student interviewees was drawn
181
based on apathy category and grade level. Exactly 50% of students came from each grade
level; this process also ensured comparable representation across teacher-nominated
levels of students’ apathy toward school. The selection process for student interviewees
did not include gender in order to allow for naturally-occurring gender representation
within the apathy categories. Of the 58 students interviewed, 21 (36%) were male and 37
(64%) were female.
During interviews both the researcher and interviewee were blind to
classifications assigned in the present study regarding apathy category and apathetic
nomination. Student interviews were conducted during the school day and took place out
of earshot of others so that students would feel free to express their views. Teacher
interviews were conducted in private either before or after school, or during the teacher’s
free period. Each interview was digitally audio-recorded and subsequently transcribed by
the researcher. Verbatim statements by the researcher and participant were recorded in
the transcripts without indication of tone of voice. The only non-verbal information
recorded were pauses greater than 4 seconds and exclamation points to denote marked
enthusiasm or surprise.
Teacher interviews lasted an average of 13 minutes and 43 seconds; average word
count per interview, including researcher questions, was 1,860. The shortest interview
lasted 4 minutes 36 seconds; the longest took 20 minutes and 45 seconds. Student
interviews lasted 7 minutes and 45 seconds on average, and included an average of 1,250
total words from student and researcher. The shortest student interview lasted 5 minutes
and 7 seconds; the longest was 12 minutes and 44 seconds. The smaller variance on
182
student interview length was due to tighter scheduling constraints, as students were
pulled from class to be interviewed.
Transcript Analysis Procedures
A coding process was employed for extracting and condensing a set of themes
germane to the goals of the present study (Miles & Huberman, 1994). During transcript
analysis, both the researcher and second rater were blind to grade level and, in the case of
students, apathetic category classification. Following the procedures described in this
section, teacher transcripts were analyzed first, followed by student transcripts. Codes
generated for student transcripts were aligned when possible to teacher codes, with
careful attention paid to avoid artificially imposing interpretations solely for the sake of
alignment. As described below, the identification of 17 new student codes for students
and the non-use of 22 teacher codes suggest that this process successfully allowed for
unique insights to emerge from student transcripts.
Teacher transcripts were analyzed first. In the first phase of analysis the
researcher read through all teacher transcripts multiple times to become familiar with the
responses. Based on this initial reading, a preliminary set of codes was generated to
represent key emergent themes. In the second phase, the researcher reread the transcripts
to extend the set of themes and assign relevant codes to each response. Each response
evidencing an existing code was marked accordingly; no minimum or maximum was
imposed on the number of codes that could be assigned to each response. When a
response evidenced a theme not yet on the list, a new code was created and used to mark
relevant responses. This phase of analysis yielded a set of 129 codes. In the third phase,
the researcher reviewed the set of codes for redundancy and clarity and retained 74 codes,
183
grouped into 11 categories. The entire set of teacher responses was then reviewed
individually and recoded using the condensed set of codes.
A second rater with a doctorate in education applied the condensed set of codes to
25% of the teacher transcripts. Eighty percent reliability was obtained, based on
agreement at the participant level. Subsequently, in order to achieve maximum reliability
for code assignment, the researcher and the second rater worked collaboratively to review
the full set of transcripts, adding or removing codes at the participant level based on
consensus. This process included a review of all responses associated with each code to
improve coherence of statements assigned to each code. The final set of codes and code
assignments for each participant represents 100% agreement between the two raters.
Student transcripts were reviewed in similar fashion. A set of 70 final codes was
generated and applied at the response level. All responses assigned to each code were
then reviewed for collective coherence and refined as necessary. An interrater reliability
of 85% was obtained based on a random sample of 25% of transcripts. All responses and
codes were then reviewed collaboratively by the researcher and second rater to attain
100% agreement at the participant level.
The final phase of analysis consisted of synthesizing the perspectives captured by
the interviews and coding procedure into a form suitable for presentation of results.
Codes were grouped into dominant themes according to the research questions under
consideration. First, codes pertaining to teacher and student conceptualizations of school-
related apathy were grouped, as were codes related to the prevalence and
operationalization of school-related apathy. Second, individual and group differences
with respect to gender, grade level, and apathy category were examined via between-
184
group code frequencies. Taken together, the multiple steps of analysis described herein
allowed for iterative refinement and tightening of core themes.
The following sections present the dominant themes illustrated by several
verbatim quotations. To ensure that statements presented for each theme represent the full
sample, no more than two quotations were included from any participant. Participants’
study identification numbers appear in the table alongside each quotation, with a “t-”
prefix indicating teachers and an “s-” denoting students. This information is provided to
show that comments were drawn from many participants and thus represent shared or
common perspectives. Interviewer questions, shown in italics, are included to
contextualize the meaning of participants’ comments, as well as to exhibit the interview
style used to probe participants’ viewpoints. For each dominant theme, quotations are
displayed from approximately 20% of participants who gave evidence of the theme.
Folk Conceptualizations of School-Related Apathy
A broad range of conceptualizations of school-related apathy and lack of
motivation were captured in interviews with teachers and students. Analysis of relevant
codes yielded twelve dominant conceptual threads, each of which is briefly described
below and compared to the research-based conceptualizations assessed in the present
study. In addition, congruence and divergence between teacher and student perspectives
are identified. A table of exemplary quotations from teachers and students follows the
description of each thread.
Making the Grade
Nearly all participants spoke about motivation for school in terms of students’
motivation to get good grades. Both teacher and student responses evidenced a strong
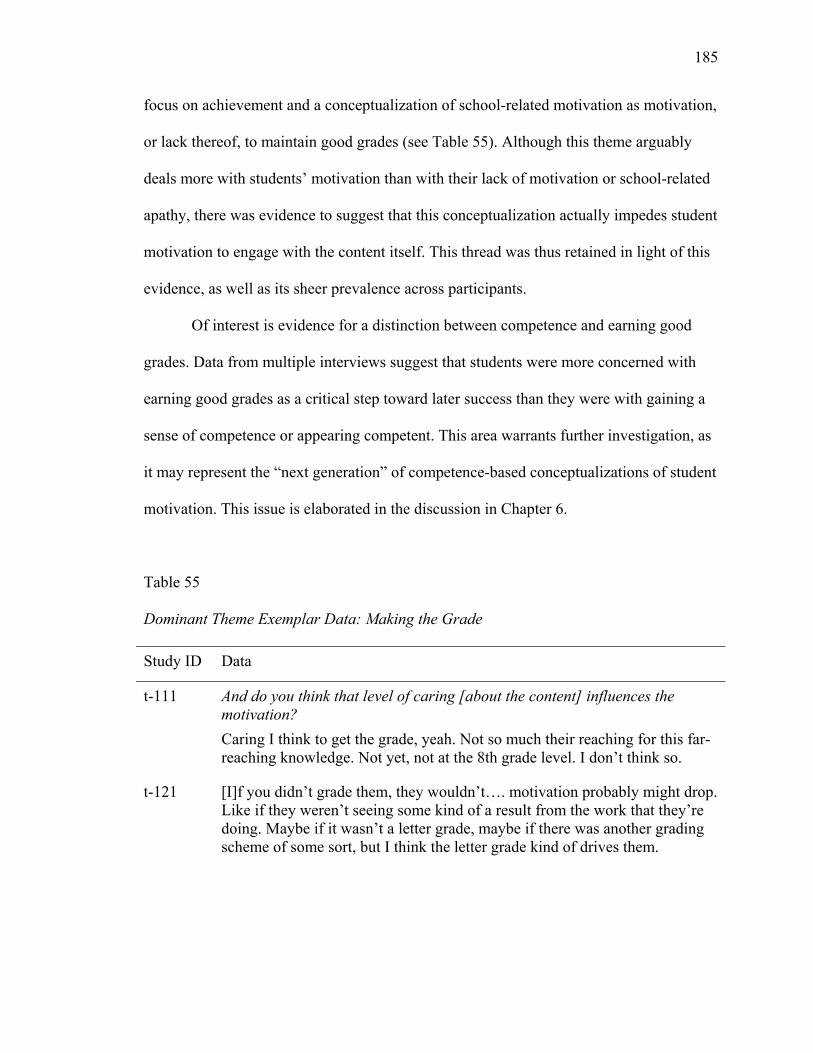
185
focus on achievement and a conceptualization of school-related motivation as motivation,
or lack thereof, to maintain good grades (see Table 55). Although this theme arguably
deals more with students’ motivation than with their lack of motivation or school-related
apathy, there was evidence to suggest that this conceptualization actually impedes student
motivation to engage with the content itself. This thread was thus retained in light of this
evidence, as well as its sheer prevalence across participants.
Of interest is evidence for a distinction between competence and earning good
grades. Data from multiple interviews suggest that students were more concerned with
earning good grades as a critical step toward later success than they were with gaining a
sense of competence or appearing competent. This area warrants further investigation, as
it may represent the “next generation” of competence-based conceptualizations of student
motivation. This issue is elaborated in the discussion in Chapter 6.
Table 55
Dominant Theme Exemplar Data: Making the Grade
Study ID Data
t-111 And do you think that level of caring [about the content] influences the motivation? Caring I think to get the grade, yeah. Not so much their reaching for this far-reaching knowledge. Not yet, not at the 8th grade level. I don’t think so.
t-121 [I]f you didn’t grade them, they wouldn’t…. motivation probably might drop. Like if they weren’t seeing some kind of a result from the work that they’re doing. Maybe if it wasn’t a letter grade, maybe if there was another grading scheme of some sort, but I think the letter grade kind of drives them.
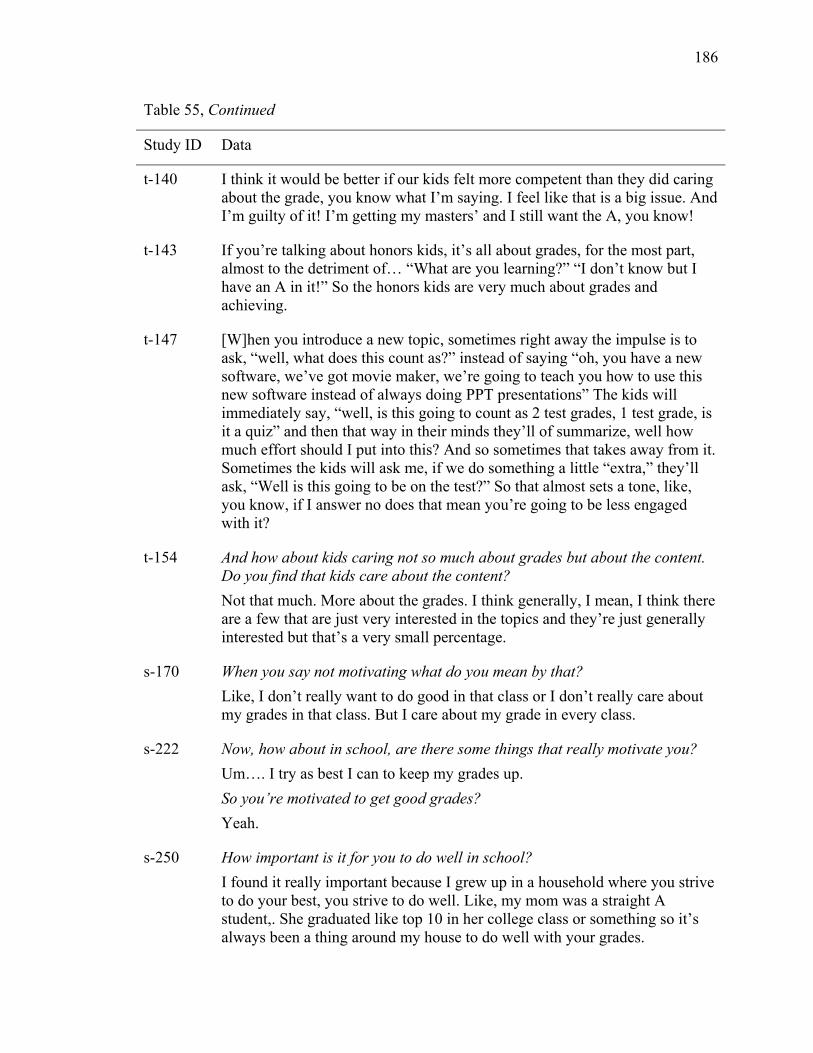
186
Table 55, Continued
Study ID Data
t-140 I think it would be better if our kids felt more competent than they did caring about the grade, you know what I’m saying. I feel like that is a big issue. And I’m guilty of it! I’m getting my masters’ and I still want the A, you know!
t-143 If you’re talking about honors kids, it’s all about grades, for the most part, almost to the detriment of… “What are you learning?” “I don’t know but I have an A in it!” So the honors kids are very much about grades and achieving.
t-147 [W]hen you introduce a new topic, sometimes right away the impulse is to ask, “well, what does this count as?” instead of saying “oh, you have a new software, we’ve got movie maker, we’re going to teach you how to use this new software instead of always doing PPT presentations” The kids will immediately say, “well, is this going to count as 2 test grades, 1 test grade, is it a quiz” and then that way in their minds they’ll of summarize, well how much effort should I put into this? And so sometimes that takes away from it. Sometimes the kids will ask me, if we do something a little “extra,” they’ll ask, “Well is this going to be on the test?” So that almost sets a tone, like, you know, if I answer no does that mean you’re going to be less engaged with it?
t-154 And how about kids caring not so much about grades but about the content. Do you find that kids care about the content? Not that much. More about the grades. I think generally, I mean, I think there are a few that are just very interested in the topics and they’re just generally interested but that’s a very small percentage.
s-170 When you say not motivating what do you mean by that? Like, I don’t really want to do good in that class or I don’t really care about my grades in that class. But I care about my grade in every class.
s-222 Now, how about in school, are there some things that really motivate you? Um…. I try as best I can to keep my grades up. So you’re motivated to get good grades? Yeah.
s-250 How important is it for you to do well in school? I found it really important because I grew up in a household where you strive to do your best, you strive to do well. Like, my mom was a straight A student,. She graduated like top 10 in her college class or something so it’s always been a thing around my house to do well with your grades.
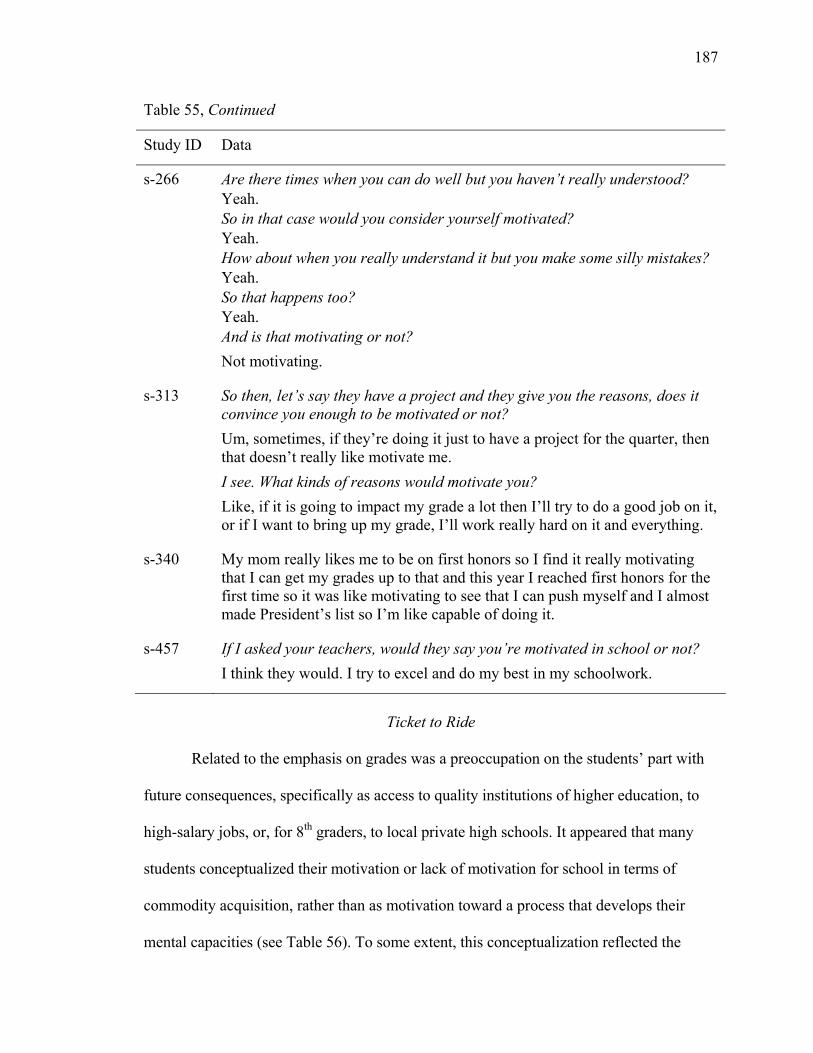
187
Table 55, Continued
Study ID Data
s-266 Are there times when you can do well but you haven’t really understood? Yeah. So in that case would you consider yourself motivated? Yeah. How about when you really understand it but you make some silly mistakes? Yeah. So that happens too? Yeah. And is that motivating or not? Not motivating.
s-313 So then, let’s say they have a project and they give you the reasons, does it convince you enough to be motivated or not? Um, sometimes, if they’re doing it just to have a project for the quarter, then that doesn’t really like motivate me. I see. What kinds of reasons would motivate you? Like, if it is going to impact my grade a lot then I’ll try to do a good job on it, or if I want to bring up my grade, I’ll work really hard on it and everything.
s-340 My mom really likes me to be on first honors so I find it really motivating that I can get my grades up to that and this year I reached first honors for the first time so it was like motivating to see that I can push myself and I almost made President’s list so I’m like capable of doing it.
s-457 If I asked your teachers, would they say you’re motivated in school or not? I think they would. I try to excel and do my best in my schoolwork.
Ticket to Ride
Related to the emphasis on grades was a preoccupation on the students’ part with
future consequences, specifically as access to quality institutions of higher education, to
high-salary jobs, or, for 8th graders, to local private high schools. It appeared that many
students conceptualized their motivation or lack of motivation for school in terms of
commodity acquisition, rather than as motivation toward a process that develops their
mental capacities (see Table 56). To some extent, this conceptualization reflected the
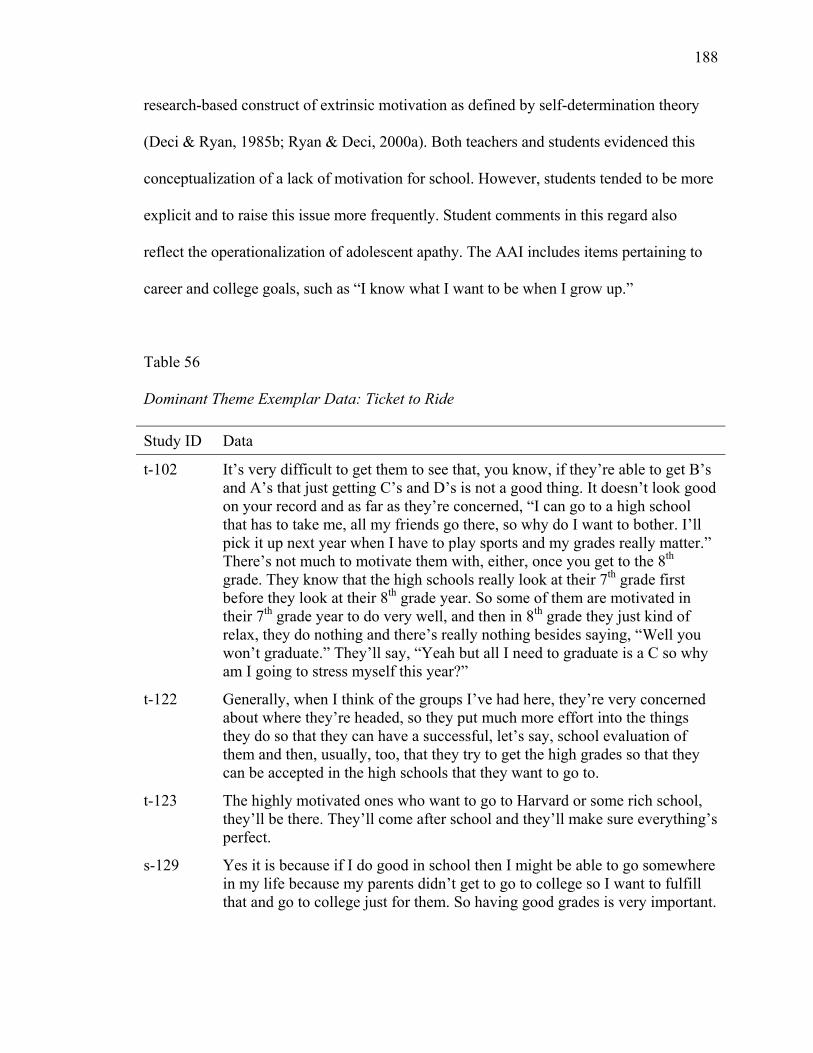
188
research-based construct of extrinsic motivation as defined by self-determination theory
(Deci & Ryan, 1985b; Ryan & Deci, 2000a). Both teachers and students evidenced this
conceptualization of a lack of motivation for school. However, students tended to be more
explicit and to raise this issue more frequently. Student comments in this regard also
reflect the operationalization of adolescent apathy. The AAI includes items pertaining to
career and college goals, such as “I know what I want to be when I grow up.”
Table 56
Dominant Theme Exemplar Data: Ticket to Ride
Study ID Data
t-102 It’s very difficult to get them to see that, you know, if they’re able to get B’s and A’s that just getting C’s and D’s is not a good thing. It doesn’t look good on your record and as far as they’re concerned, “I can go to a high school that has to take me, all my friends go there, so why do I want to bother. I’ll pick it up next year when I have to play sports and my grades really matter.” There’s not much to motivate them with, either, once you get to the 8th grade. They know that the high schools really look at their 7th grade first before they look at their 8th grade year. So some of them are motivated in their 7th grade year to do very well, and then in 8th grade they just kind of relax, they do nothing and there’s really nothing besides saying, “Well you won’t graduate.” They’ll say, “Yeah but all I need to graduate is a C so why am I going to stress myself this year?”
t-122 Generally, when I think of the groups I’ve had here, they’re very concerned about where they’re headed, so they put much more effort into the things they do so that they can have a successful, let’s say, school evaluation of them and then, usually, too, that they try to get the high grades so that they can be accepted in the high schools that they want to go to.
t-123 The highly motivated ones who want to go to Harvard or some rich school, they’ll be there. They’ll come after school and they’ll make sure everything’s perfect.
s-129 Yes it is because if I do good in school then I might be able to go somewhere in my life because my parents didn’t get to go to college so I want to fulfill that and go to college just for them. So having good grades is very important.
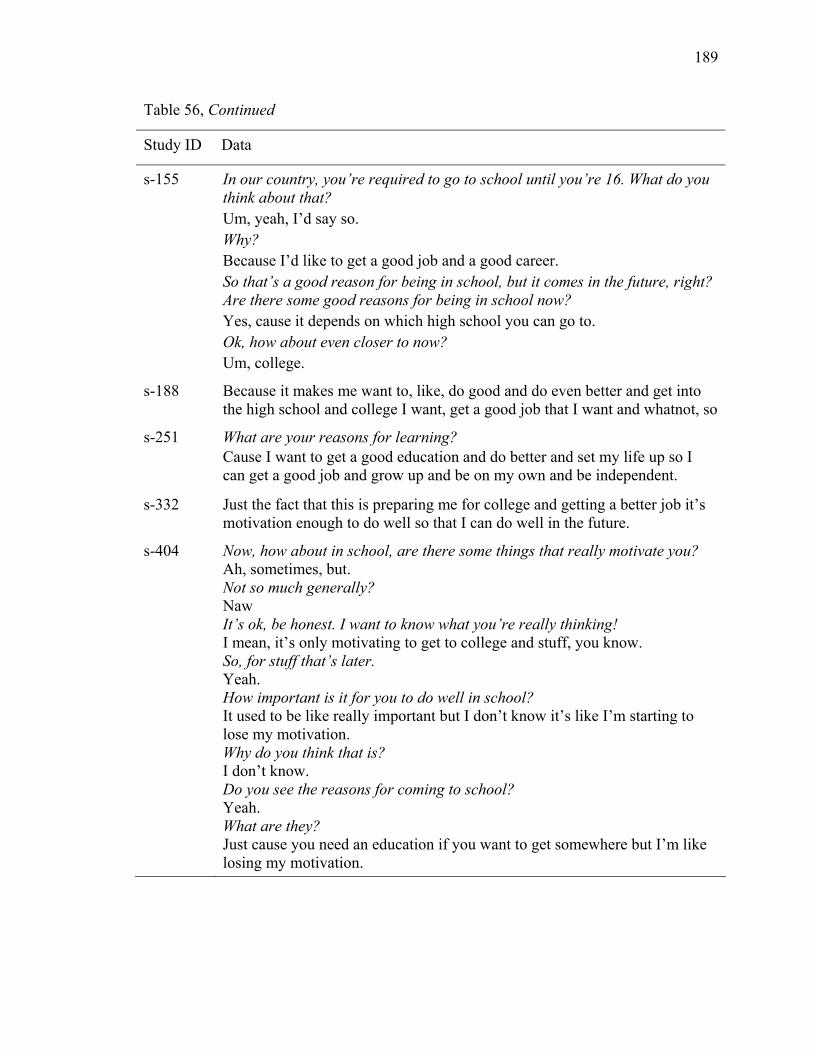
189
Table 56, Continued
Study ID Data
s-155 In our country, you’re required to go to school until you’re 16. What do you think about that? Um, yeah, I’d say so. Why? Because I’d like to get a good job and a good career. So that’s a good reason for being in school, but it comes in the future, right? Are there some good reasons for being in school now? Yes, cause it depends on which high school you can go to. Ok, how about even closer to now? Um, college.
s-188 Because it makes me want to, like, do good and do even better and get into the high school and college I want, get a good job that I want and whatnot, so
s-251 What are your reasons for learning? Cause I want to get a good education and do better and set my life up so I can get a good job and grow up and be on my own and be independent.
s-332 Just the fact that this is preparing me for college and getting a better job it’s motivation enough to do well so that I can do well in the future.
s-404 Now, how about in school, are there some things that really motivate you? Ah, sometimes, but. Not so much generally? Naw It’s ok, be honest. I want to know what you’re really thinking! I mean, it’s only motivating to get to college and stuff, you know. So, for stuff that’s later. Yeah. How important is it for you to do well in school? It used to be like really important but I don’t know it’s like I’m starting to lose my motivation. Why do you think that is? I don’t know. Do you see the reasons for coming to school? Yeah. What are they? Just cause you need an education if you want to get somewhere but I’m like losing my motivation.
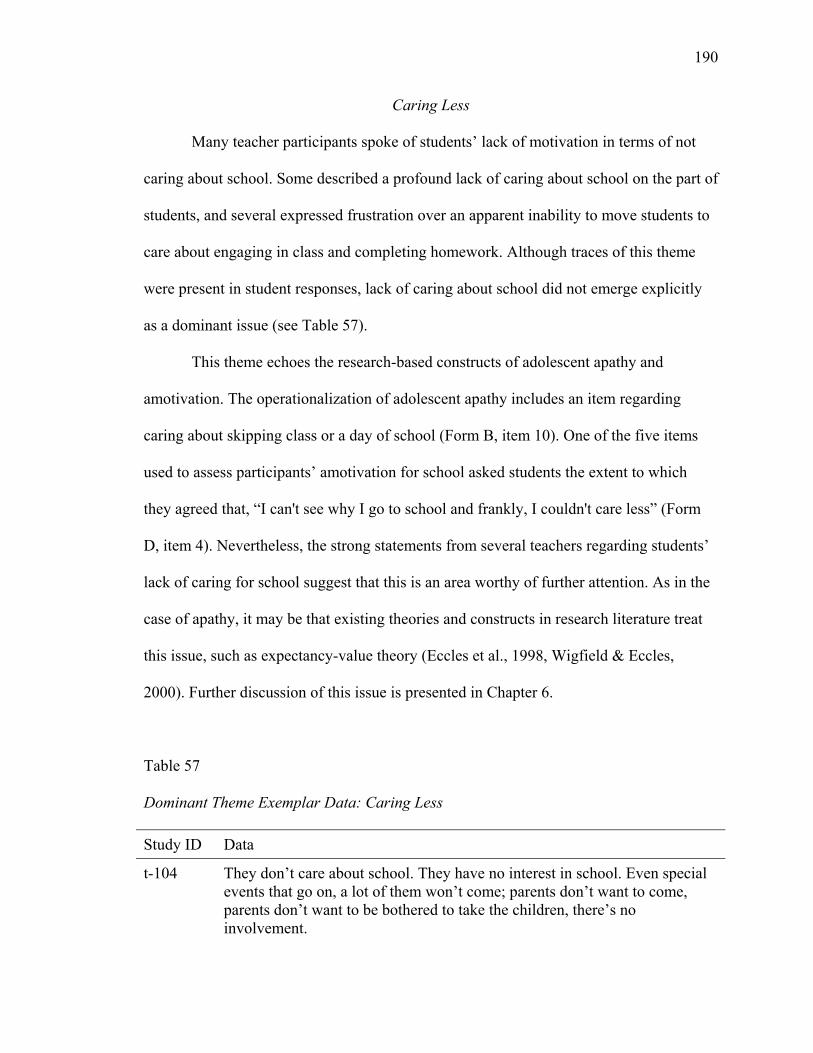
190
Caring Less
Many teacher participants spoke of students’ lack of motivation in terms of not
caring about school. Some described a profound lack of caring about school on the part of
students, and several expressed frustration over an apparent inability to move students to
care about engaging in class and completing homework. Although traces of this theme
were present in student responses, lack of caring about school did not emerge explicitly
as a dominant issue (see Table 57).
This theme echoes the research-based constructs of adolescent apathy and
amotivation. The operationalization of adolescent apathy includes an item regarding
caring about skipping class or a day of school (Form B, item 10). One of the five items
used to assess participants’ amotivation for school asked students the extent to which
they agreed that, “I can't see why I go to school and frankly, I couldn't care less” (Form
D, item 4). Nevertheless, the strong statements from several teachers regarding students’
lack of caring for school suggest that this is an area worthy of further attention. As in the
case of apathy, it may be that existing theories and constructs in research literature treat
this issue, such as expectancy-value theory (Eccles et al., 1998, Wigfield & Eccles,
2000). Further discussion of this issue is presented in Chapter 6.
Table 57
Dominant Theme Exemplar Data: Caring Less
Study ID Data
t-104 They don’t care about school. They have no interest in school. Even special events that go on, a lot of them won’t come; parents don’t want to come, parents don’t want to be bothered to take the children, there’s no involvement.
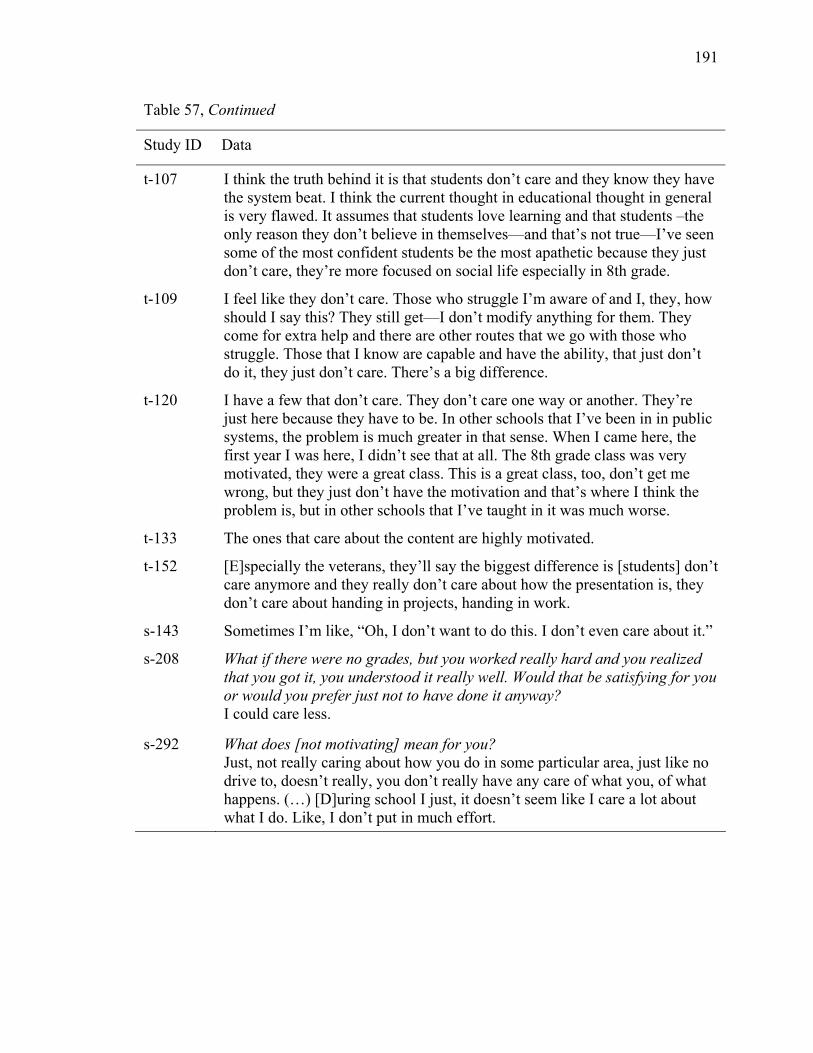
191
Table 57, Continued
Study ID Data
t-107 I think the truth behind it is that students don’t care and they know they have the system beat. I think the current thought in educational thought in general is very flawed. It assumes that students love learning and that students –the only reason they don’t believe in themselves—and that’s not true—I’ve seen some of the most confident students be the most apathetic because they just don’t care, they’re more focused on social life especially in 8th grade.
t-109 I feel like they don’t care. Those who struggle I’m aware of and I, they, how should I say this? They still get—I don’t modify anything for them. They come for extra help and there are other routes that we go with those who struggle. Those that I know are capable and have the ability, that just don’t do it, they just don’t care. There’s a big difference.
t-120 I have a few that don’t care. They don’t care one way or another. They’re just here because they have to be. In other schools that I’ve been in in public systems, the problem is much greater in that sense. When I came here, the first year I was here, I didn’t see that at all. The 8th grade class was very motivated, they were a great class. This is a great class, too, don’t get me wrong, but they just don’t have the motivation and that’s where I think the problem is, but in other schools that I’ve taught in it was much worse.
t-133 The ones that care about the content are highly motivated.
t-152 [E]specially the veterans, they’ll say the biggest difference is [students] don’t care anymore and they really don’t care about how the presentation is, they don’t care about handing in projects, handing in work.
s-143 Sometimes I’m like, “Oh, I don’t want to do this. I don’t even care about it.”
s-208 What if there were no grades, but you worked really hard and you realized that you got it, you understood it really well. Would that be satisfying for you or would you prefer just not to have done it anyway? I could care less.
s-292 What does [not motivating] mean for you? Just, not really caring about how you do in some particular area, just like no drive to, doesn’t really, you don’t really have any care of what you, of what happens. (…) [D]uring school I just, it doesn’t seem like I care a lot about what I do. Like, I don’t put in much effort.
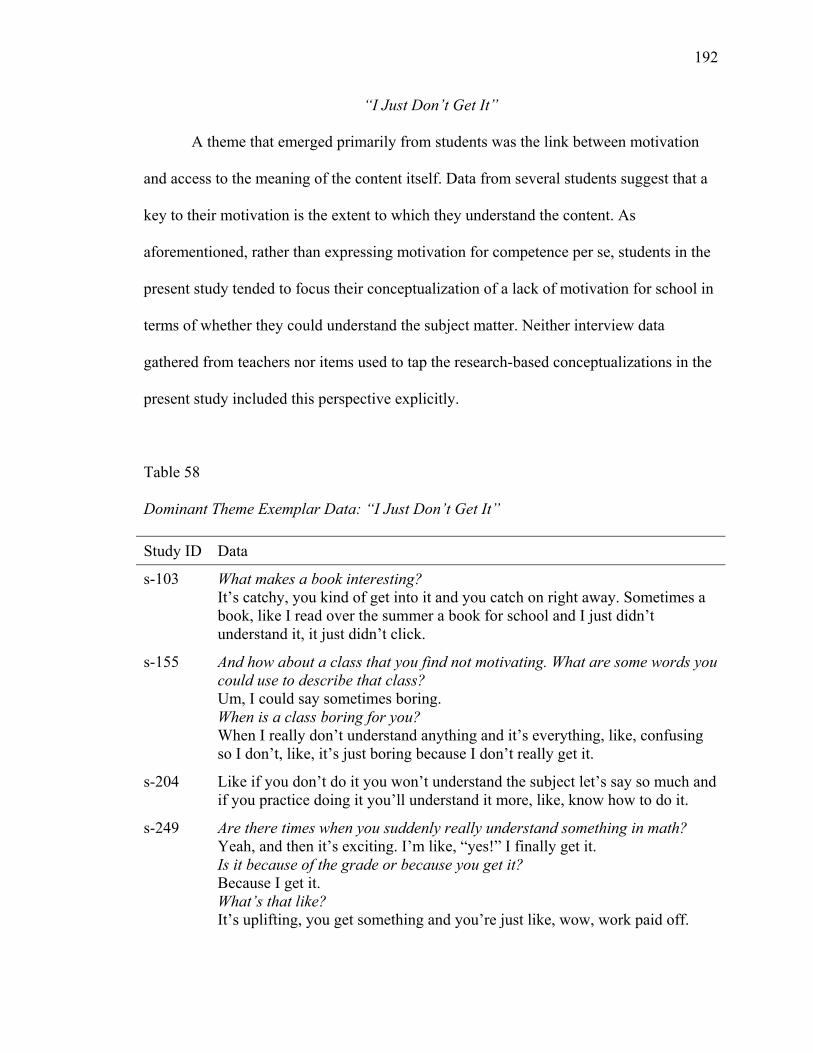
192
“I Just Don’t Get It”
A theme that emerged primarily from students was the link between motivation
and access to the meaning of the content itself. Data from several students suggest that a
key to their motivation is the extent to which they understand the content. As
aforementioned, rather than expressing motivation for competence per se, students in the
present study tended to focus their conceptualization of a lack of motivation for school in
terms of whether they could understand the subject matter. Neither interview data
gathered from teachers nor items used to tap the research-based conceptualizations in the
present study included this perspective explicitly.
Table 58
Dominant Theme Exemplar Data: “I Just Don’t Get It”
Study ID Data
s-103 What makes a book interesting? It’s catchy, you kind of get into it and you catch on right away. Sometimes a book, like I read over the summer a book for school and I just didn’t understand it, it just didn’t click.
s-155 And how about a class that you find not motivating. What are some words you could use to describe that class? Um, I could say sometimes boring. When is a class boring for you? When I really don’t understand anything and it’s everything, like, confusing so I don’t, like, it’s just boring because I don’t really get it.
s-204 Like if you don’t do it you won’t understand the subject let’s say so much and if you practice doing it you’ll understand it more, like, know how to do it.
s-249 Are there times when you suddenly really understand something in math? Yeah, and then it’s exciting. I’m like, “yes!” I finally get it. Is it because of the grade or because you get it? Because I get it. What’s that like? It’s uplifting, you get something and you’re just like, wow, work paid off.
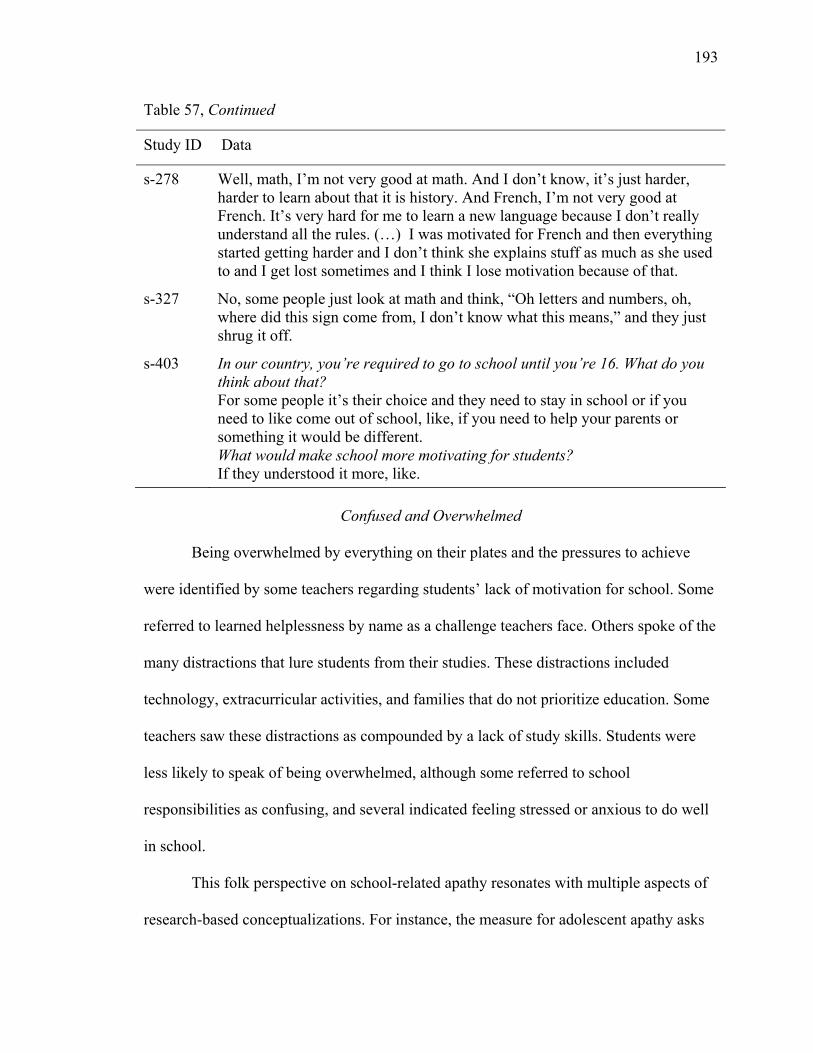
193
Table 57, Continued
Study ID Data
s-278 Well, math, I’m not very good at math. And I don’t know, it’s just harder, harder to learn about that it is history. And French, I’m not very good at French. It’s very hard for me to learn a new language because I don’t really understand all the rules. (…) I was motivated for French and then everything started getting harder and I don’t think she explains stuff as much as she used to and I get lost sometimes and I think I lose motivation because of that.
s-327 No, some people just look at math and think, “Oh letters and numbers, oh, where did this sign come from, I don’t know what this means,” and they just shrug it off.
s-403 In our country, you’re required to go to school until you’re 16. What do you think about that? For some people it’s their choice and they need to stay in school or if you need to like come out of school, like, if you need to help your parents or something it would be different. What would make school more motivating for students? If they understood it more, like.
Confused and Overwhelmed
Being overwhelmed by everything on their plates and the pressures to achieve
were identified by some teachers regarding students’ lack of motivation for school. Some
referred to learned helplessness by name as a challenge teachers face. Others spoke of the
many distractions that lure students from their studies. These distractions included
technology, extracurricular activities, and families that do not prioritize education. Some
teachers saw these distractions as compounded by a lack of study skills. Students were
less likely to speak of being overwhelmed, although some referred to school
responsibilities as confusing, and several indicated feeling stressed or anxious to do well
in school.
This folk perspective on school-related apathy resonates with multiple aspects of
research-based conceptualizations. For instance, the measure for adolescent apathy asks
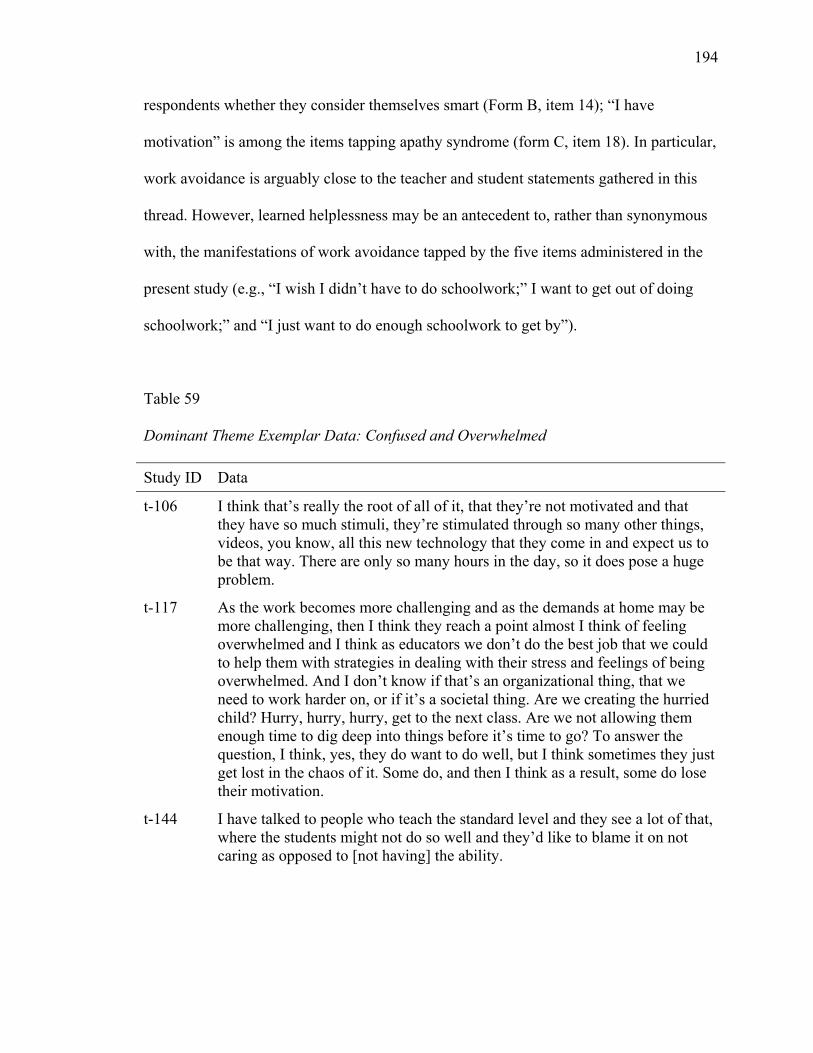
194
respondents whether they consider themselves smart (Form B, item 14); “I have
motivation” is among the items tapping apathy syndrome (form C, item 18). In particular,
work avoidance is arguably close to the teacher and student statements gathered in this
thread. However, learned helplessness may be an antecedent to, rather than synonymous
with, the manifestations of work avoidance tapped by the five items administered in the
present study (e.g., “I wish I didn’t have to do schoolwork;” I want to get out of doing
schoolwork;” and “I just want to do enough schoolwork to get by”).
Table 59
Dominant Theme Exemplar Data: Confused and Overwhelmed
Study ID Data
t-106 I think that’s really the root of all of it, that they’re not motivated and that they have so much stimuli, they’re stimulated through so many other things, videos, you know, all this new technology that they come in and expect us to be that way. There are only so many hours in the day, so it does pose a huge problem.
t-117 As the work becomes more challenging and as the demands at home may be more challenging, then I think they reach a point almost I think of feeling overwhelmed and I think as educators we don’t do the best job that we could to help them with strategies in dealing with their stress and feelings of being overwhelmed. And I don’t know if that’s an organizational thing, that we need to work harder on, or if it’s a societal thing. Are we creating the hurried child? Hurry, hurry, hurry, get to the next class. Are we not allowing them enough time to dig deep into things before it’s time to go? To answer the question, I think, yes, they do want to do well, but I think sometimes they just get lost in the chaos of it. Some do, and then I think as a result, some do lose their motivation.
t-144 I have talked to people who teach the standard level and they see a lot of that, where the students might not do so well and they’d like to blame it on not caring as opposed to [not having] the ability.
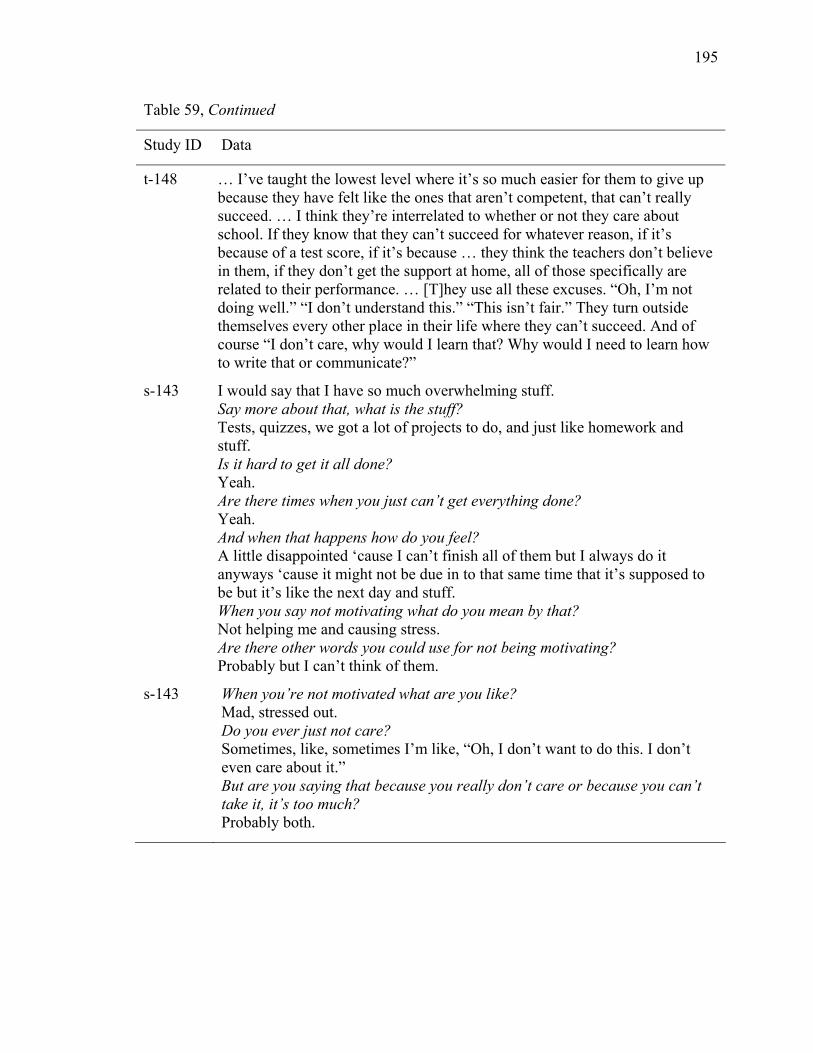
195
Table 59, Continued
Study ID Data
t-148 … I’ve taught the lowest level where it’s so much easier for them to give up because they have felt like the ones that aren’t competent, that can’t really succeed. … I think they’re interrelated to whether or not they care about school. If they know that they can’t succeed for whatever reason, if it’s because of a test score, if it’s because … they think the teachers don’t believe in them, if they don’t get the support at home, all of those specifically are related to their performance. … [T]hey use all these excuses. “Oh, I’m not doing well.” “I don’t understand this.” “This isn’t fair.” They turn outside themselves every other place in their life where they can’t succeed. And of course “I don’t care, why would I learn that? Why would I need to learn how to write that or communicate?”
s-143 I would say that I have so much overwhelming stuff. Say more about that, what is the stuff? Tests, quizzes, we got a lot of projects to do, and just like homework and stuff. Is it hard to get it all done? Yeah. Are there times when you just can’t get everything done? Yeah. And when that happens how do you feel? A little disappointed ‘cause I can’t finish all of them but I always do it anyways ‘cause it might not be due in to that same time that it’s supposed to be but it’s like the next day and stuff. When you say not motivating what do you mean by that? Not helping me and causing stress. Are there other words you could use for not being motivating? Probably but I can’t think of them.
s-143 When you’re not motivated what are you like? Mad, stressed out. Do you ever just not care? Sometimes, like, sometimes I’m like, “Oh, I don’t want to do this. I don’t even care about it.” But are you saying that because you really don’t care or because you can’t take it, it’s too much? Probably both.
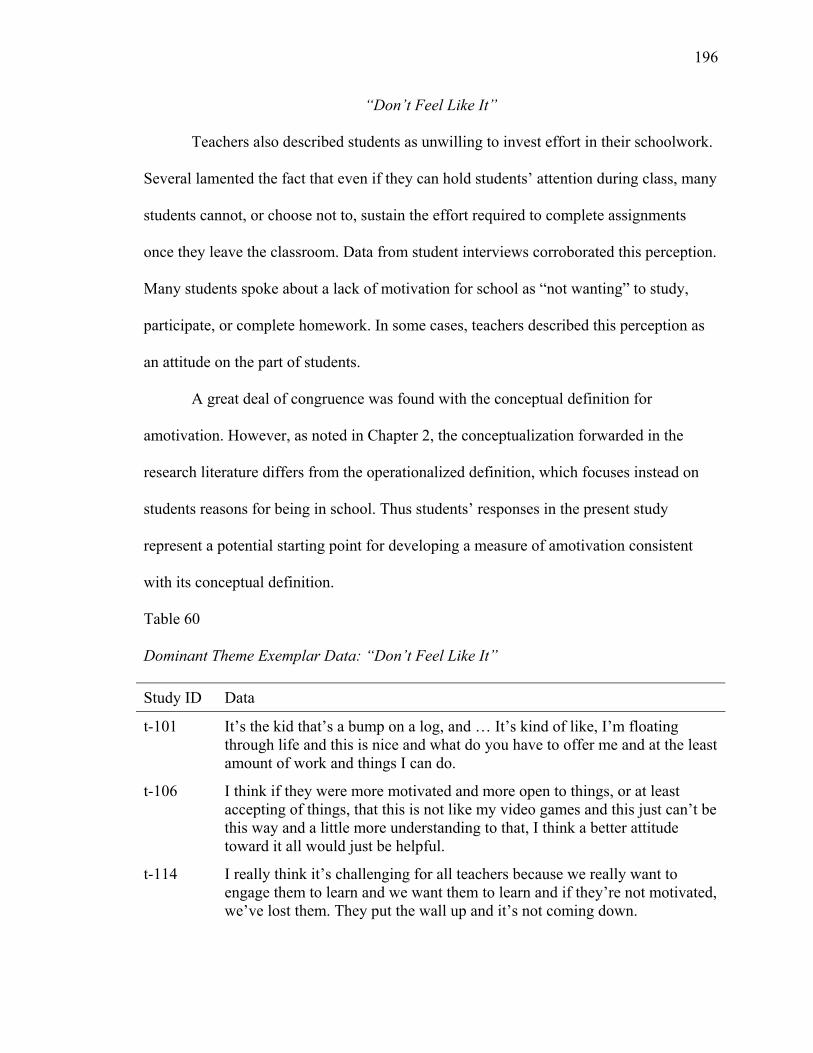
196
“Don’t Feel Like It”
Teachers also described students as unwilling to invest effort in their schoolwork.
Several lamented the fact that even if they can hold students’ attention during class, many
students cannot, or choose not to, sustain the effort required to complete assignments
once they leave the classroom. Data from student interviews corroborated this perception.
Many students spoke about a lack of motivation for school as “not wanting” to study,
participate, or complete homework. In some cases, teachers described this perception as
an attitude on the part of students.
A great deal of congruence was found with the conceptual definition for
amotivation. However, as noted in Chapter 2, the conceptualization forwarded in the
research literature differs from the operationalized definition, which focuses instead on
students reasons for being in school. Thus students’ responses in the present study
represent a potential starting point for developing a measure of amotivation consistent
with its conceptual definition.
Table 60
Dominant Theme Exemplar Data: “Don’t Feel Like It”
Study ID Data
t-101 It’s the kid that’s a bump on a log, and … It’s kind of like, I’m floating through life and this is nice and what do you have to offer me and at the least amount of work and things I can do.
t-106 I think if they were more motivated and more open to things, or at least accepting of things, that this is not like my video games and this just can’t be this way and a little more understanding to that, I think a better attitude toward it all would just be helpful.
t-114 I really think it’s challenging for all teachers because we really want to engage them to learn and we want them to learn and if they’re not motivated, we’ve lost them. They put the wall up and it’s not coming down.
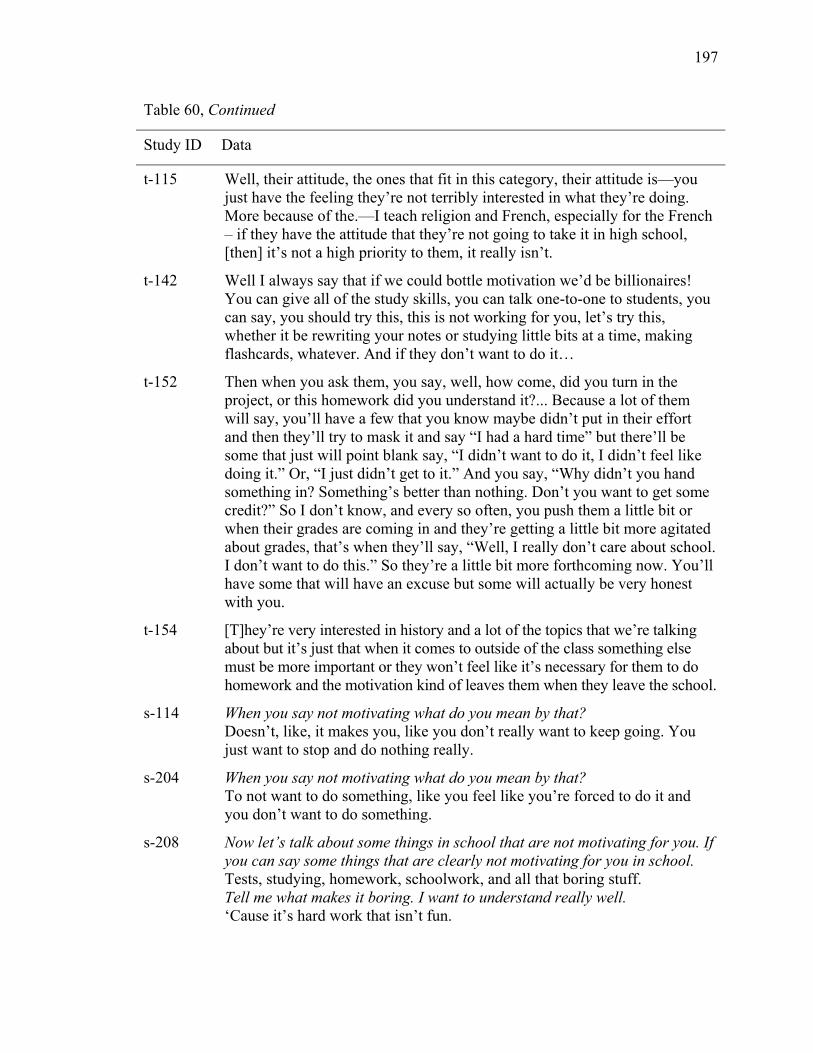
197
Table 60, Continued
Study ID Data
t-115 Well, their attitude, the ones that fit in this category, their attitude is—you just have the feeling they’re not terribly interested in what they’re doing. More because of the.—I teach religion and French, especially for the French – if they have the attitude that they’re not going to take it in high school, [then] it’s not a high priority to them, it really isn’t.
t-142 Well I always say that if we could bottle motivation we’d be billionaires! You can give all of the study skills, you can talk one-to-one to students, you can say, you should try this, this is not working for you, let’s try this, whether it be rewriting your notes or studying little bits at a time, making flashcards, whatever. And if they don’t want to do it…
t-152 Then when you ask them, you say, well, how come, did you turn in the project, or this homework did you understand it?... Because a lot of them will say, you’ll have a few that you know maybe didn’t put in their effort and then they’ll try to mask it and say “I had a hard time” but there’ll be some that just will point blank say, “I didn’t want to do it, I didn’t feel like doing it.” Or, “I just didn’t get to it.” And you say, “Why didn’t you hand something in? Something’s better than nothing. Don’t you want to get some credit?” So I don’t know, and every so often, you push them a little bit or when their grades are coming in and they’re getting a little bit more agitated about grades, that’s when they’ll say, “Well, I really don’t care about school. I don’t want to do this.” So they’re a little bit more forthcoming now. You’ll have some that will have an excuse but some will actually be very honest with you.
t-154 [T]hey’re very interested in history and a lot of the topics that we’re talking about but it’s just that when it comes to outside of the class something else must be more important or they won’t feel like it’s necessary for them to do homework and the motivation kind of leaves them when they leave the school.
s-114 When you say not motivating what do you mean by that? Doesn’t, like, it makes you, like you don’t really want to keep going. You just want to stop and do nothing really.
s-204 When you say not motivating what do you mean by that? To not want to do something, like you feel like you’re forced to do it and you don’t want to do something.
s-208 Now let’s talk about some things in school that are not motivating for you. If you can say some things that are clearly not motivating for you in school. Tests, studying, homework, schoolwork, and all that boring stuff. Tell me what makes it boring. I want to understand really well. ‘Cause it’s hard work that isn’t fun.
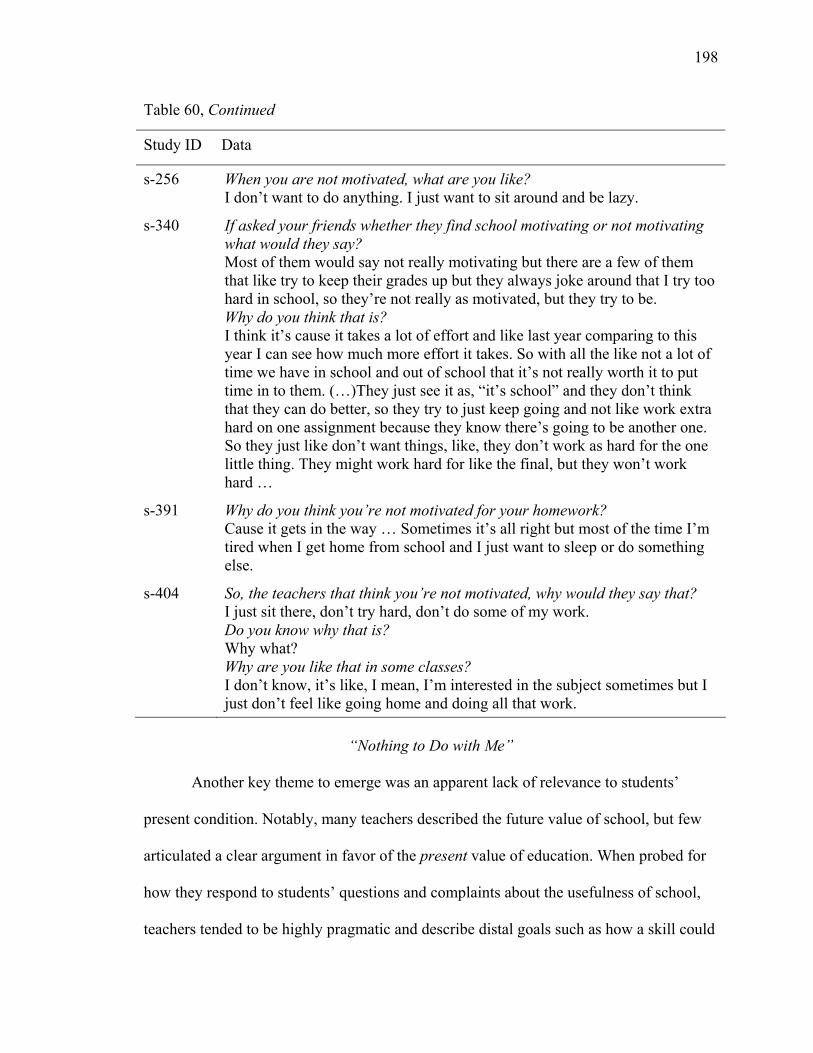
198
Table 60, Continued
Study ID Data
s-256 When you are not motivated, what are you like? I don’t want to do anything. I just want to sit around and be lazy.
s-340 If asked your friends whether they find school motivating or not motivating what would they say? Most of them would say not really motivating but there are a few of them that like try to keep their grades up but they always joke around that I try too hard in school, so they’re not really as motivated, but they try to be. Why do you think that is? I think it’s cause it takes a lot of effort and like last year comparing to this year I can see how much more effort it takes. So with all the like not a lot of time we have in school and out of school that it’s not really worth it to put time in to them. (…)They just see it as, “it’s school” and they don’t think that they can do better, so they try to just keep going and not like work extra hard on one assignment because they know there’s going to be another one. So they just like don’t want things, like, they don’t work as hard for the one little thing. They might work hard for like the final, but they won’t work hard …
s-391 Why do you think you’re not motivated for your homework? Cause it gets in the way … Sometimes it’s all right but most of the time I’m tired when I get home from school and I just want to sleep or do something else.
s-404 So, the teachers that think you’re not motivated, why would they say that? I just sit there, don’t try hard, don’t do some of my work. Do you know why that is? Why what? Why are you like that in some classes? I don’t know, it’s like, I mean, I’m interested in the subject sometimes but I just don’t feel like going home and doing all that work.
“Nothing to Do with Me”
Another key theme to emerge was an apparent lack of relevance to students’
present condition. Notably, many teachers described the future value of school, but few
articulated a clear argument in favor of the present value of education. When probed for
how they respond to students’ questions and complaints about the usefulness of school,
teachers tended to be highly pragmatic and describe distal goals such as how a skill could
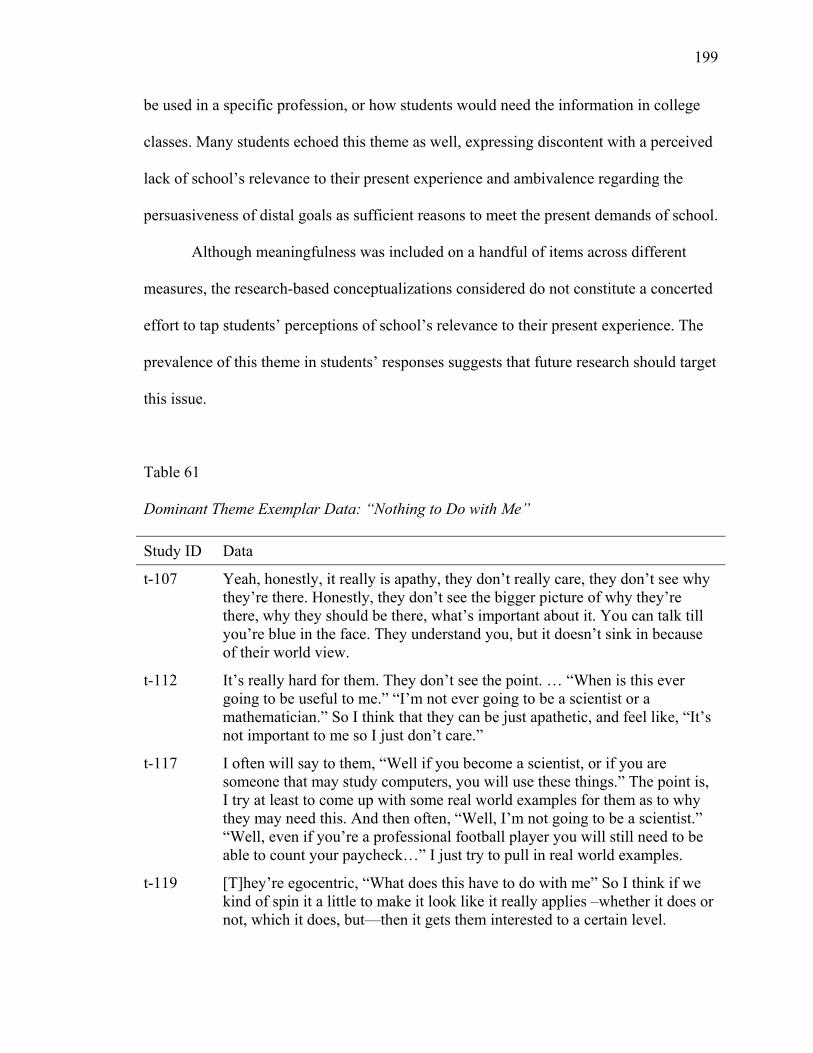
199
be used in a specific profession, or how students would need the information in college
classes. Many students echoed this theme as well, expressing discontent with a perceived
lack of school’s relevance to their present experience and ambivalence regarding the
persuasiveness of distal goals as sufficient reasons to meet the present demands of school.
Although meaningfulness was included on a handful of items across different
measures, the research-based conceptualizations considered do not constitute a concerted
effort to tap students’ perceptions of school’s relevance to their present experience. The
prevalence of this theme in students’ responses suggests that future research should target
this issue.
Table 61
Dominant Theme Exemplar Data: “Nothing to Do with Me”
Study ID Data
t-107 Yeah, honestly, it really is apathy, they don’t really care, they don’t see why they’re there. Honestly, they don’t see the bigger picture of why they’re there, why they should be there, what’s important about it. You can talk till you’re blue in the face. They understand you, but it doesn’t sink in because of their world view.
t-112 It’s really hard for them. They don’t see the point. … “When is this ever going to be useful to me.” “I’m not ever going to be a scientist or a mathematician.” So I think that they can be just apathetic, and feel like, “It’s not important to me so I just don’t care.”
t-117 I often will say to them, “Well if you become a scientist, or if you are someone that may study computers, you will use these things.” The point is, I try at least to come up with some real world examples for them as to why they may need this. And then often, “Well, I’m not going to be a scientist.” “Well, even if you’re a professional football player you will still need to be able to count your paycheck…” I just try to pull in real world examples.
t-119 [T]hey’re egocentric, “What does this have to do with me” So I think if we kind of spin it a little to make it look like it really applies –whether it does or not, which it does, but—then it gets them interested to a certain level.
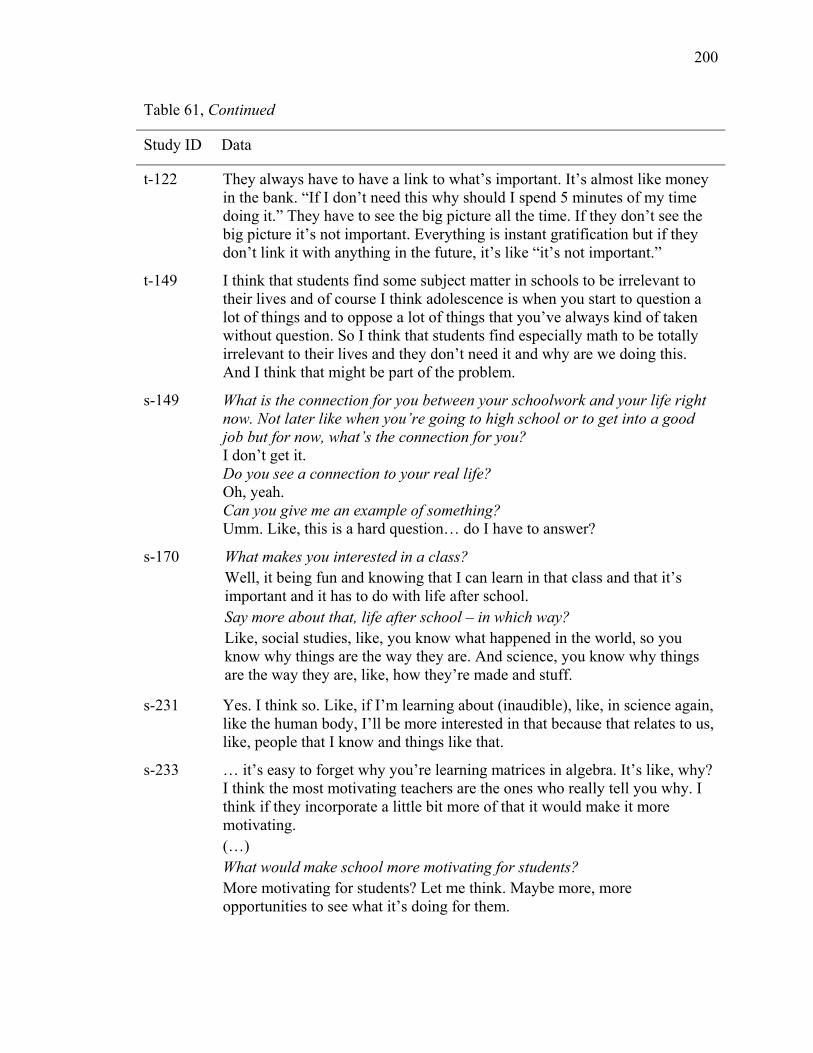
200
Table 61, Continued
Study ID Data
t-122 They always have to have a link to what’s important. It’s almost like money in the bank. “If I don’t need this why should I spend 5 minutes of my time doing it.” They have to see the big picture all the time. If they don’t see the big picture it’s not important. Everything is instant gratification but if they don’t link it with anything in the future, it’s like “it’s not important.”
t-149 I think that students find some subject matter in schools to be irrelevant to their lives and of course I think adolescence is when you start to question a lot of things and to oppose a lot of things that you’ve always kind of taken without question. So I think that students find especially math to be totally irrelevant to their lives and they don’t need it and why are we doing this. And I think that might be part of the problem.
s-149 What is the connection for you between your schoolwork and your life right now. Not later like when you’re going to high school or to get into a good job but for now, what’s the connection for you? I don’t get it. Do you see a connection to your real life? Oh, yeah. Can you give me an example of something? Umm. Like, this is a hard question… do I have to answer?
s-170 What makes you interested in a class? Well, it being fun and knowing that I can learn in that class and that it’s important and it has to do with life after school. Say more about that, life after school – in which way? Like, social studies, like, you know what happened in the world, so you know why things are the way they are. And science, you know why things are the way they are, like, how they’re made and stuff.
s-231 Yes. I think so. Like, if I’m learning about (inaudible), like, in science again, like the human body, I’ll be more interested in that because that relates to us, like, people that I know and things like that.
s-233 … it’s easy to forget why you’re learning matrices in algebra. It’s like, why? I think the most motivating teachers are the ones who really tell you why. I think if they incorporate a little bit more of that it would make it more motivating. (…) What would make school more motivating for students? More motivating for students? Let me think. Maybe more, more opportunities to see what it’s doing for them.
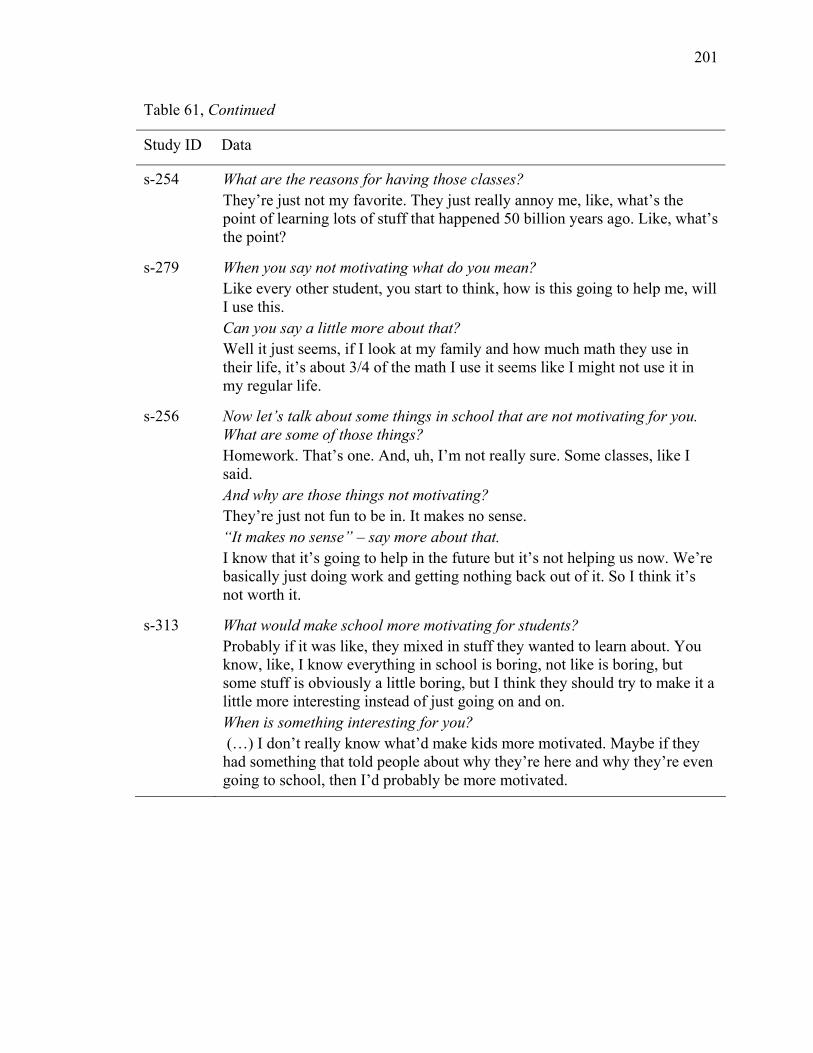
201
Table 61, Continued
Study ID Data
s-254 What are the reasons for having those classes? They’re just not my favorite. They just really annoy me, like, what’s the point of learning lots of stuff that happened 50 billion years ago. Like, what’s the point?
s-279 When you say not motivating what do you mean? Like every other student, you start to think, how is this going to help me, will I use this. Can you say a little more about that? Well it just seems, if I look at my family and how much math they use in their life, it’s about 3/4 of the math I use it seems like I might not use it in my regular life.
s-256 Now let’s talk about some things in school that are not motivating for you. What are some of those things? Homework. That’s one. And, uh, I’m not really sure. Some classes, like I said. And why are those things not motivating? They’re just not fun to be in. It makes no sense. “It makes no sense” – say more about that. I know that it’s going to help in the future but it’s not helping us now. We’re basically just doing work and getting nothing back out of it. So I think it’s not worth it.
s-313 What would make school more motivating for students? Probably if it was like, they mixed in stuff they wanted to learn about. You know, like, I know everything in school is boring, not like is boring, but some stuff is obviously a little boring, but I think they should try to make it a little more interesting instead of just going on and on. When is something interesting for you? (…) I don’t really know what’d make kids more motivated. Maybe if they had something that told people about why they’re here and why they’re even going to school, then I’d probably be more motivated.
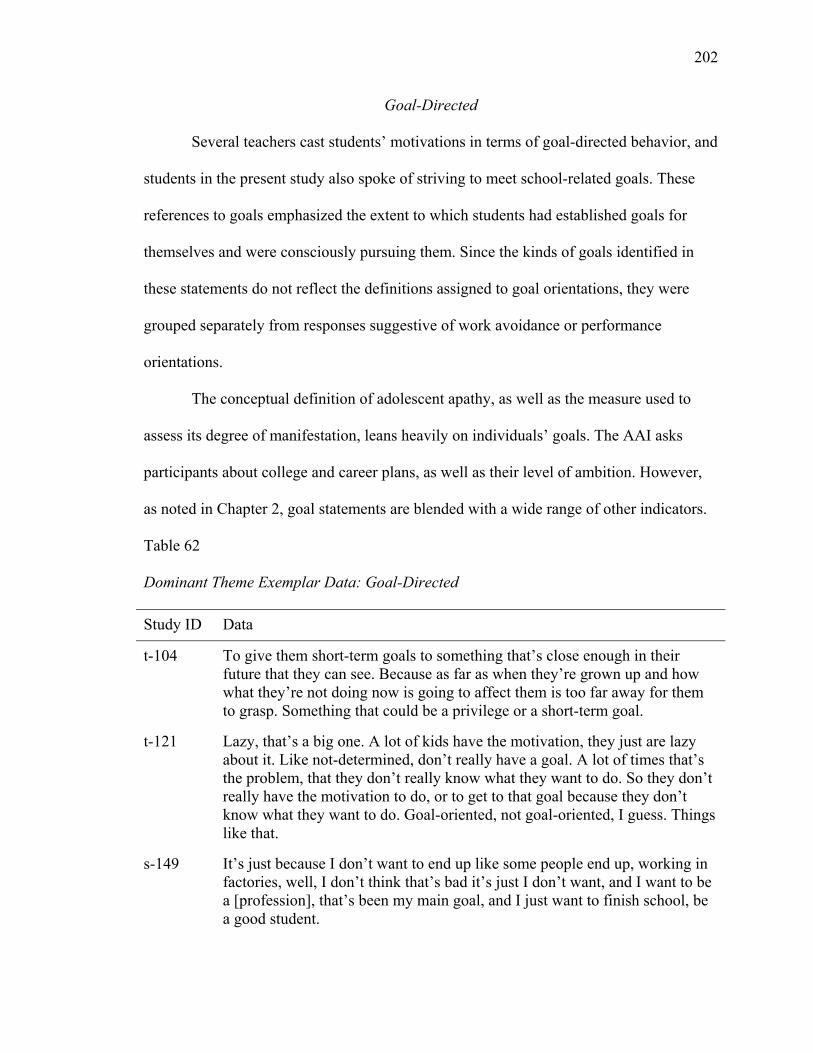
202
Goal-Directed
Several teachers cast students’ motivations in terms of goal-directed behavior, and
students in the present study also spoke of striving to meet school-related goals. These
references to goals emphasized the extent to which students had established goals for
themselves and were consciously pursuing them. Since the kinds of goals identified in
these statements do not reflect the definitions assigned to goal orientations, they were
grouped separately from responses suggestive of work avoidance or performance
orientations.
The conceptual definition of adolescent apathy, as well as the measure used to
assess its degree of manifestation, leans heavily on individuals’ goals. The AAI asks
participants about college and career plans, as well as their level of ambition. However,
as noted in Chapter 2, goal statements are blended with a wide range of other indicators.
Table 62
Dominant Theme Exemplar Data: Goal-Directed
Study ID Data
t-104 To give them short-term goals to something that’s close enough in their future that they can see. Because as far as when they’re grown up and how what they’re not doing now is going to affect them is too far away for them to grasp. Something that could be a privilege or a short-term goal.
t-121 Lazy, that’s a big one. A lot of kids have the motivation, they just are lazy about it. Like not-determined, don’t really have a goal. A lot of times that’s the problem, that they don’t really know what they want to do. So they don’t really have the motivation to do, or to get to that goal because they don’t know what they want to do. Goal-oriented, not goal-oriented, I guess. Things like that.
s-149 It’s just because I don’t want to end up like some people end up, working in factories, well, I don’t think that’s bad it’s just I don’t want, and I want to be a [profession], that’s been my main goal, and I just want to finish school, be a good student.
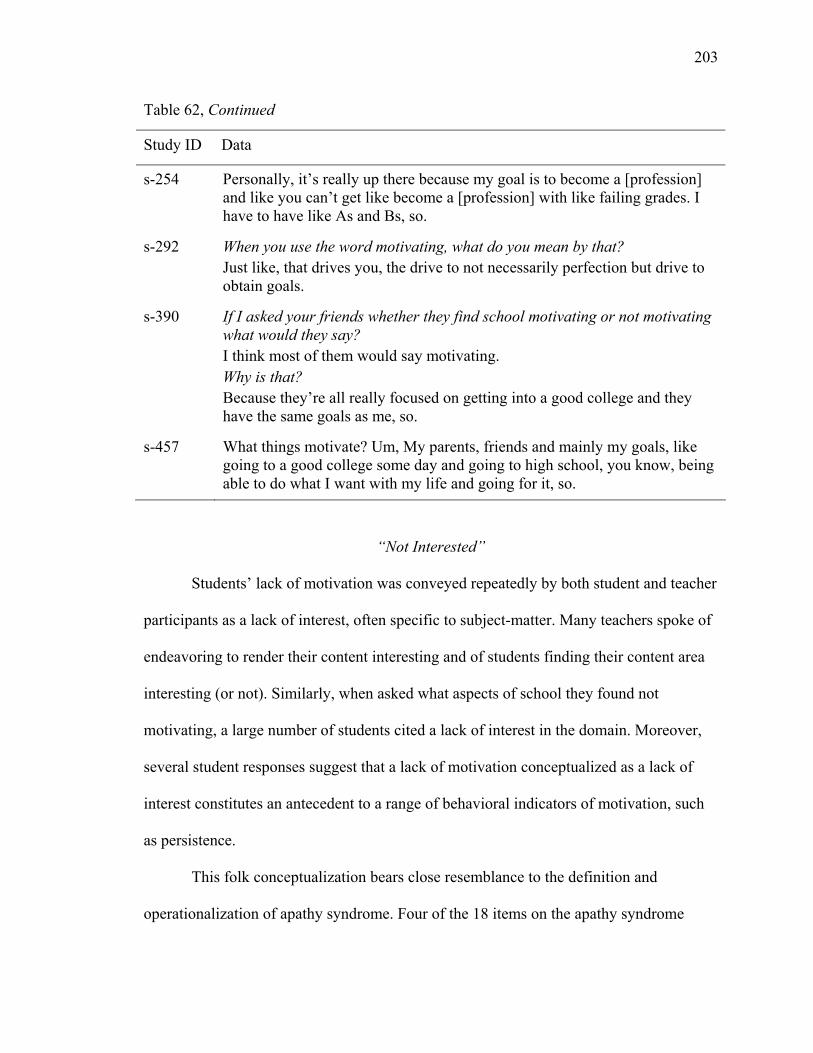
203
Table 62, Continued
Study ID Data
s-254 Personally, it’s really up there because my goal is to become a [profession] and like you can’t get like become a [profession] with like failing grades. I have to have like As and Bs, so.
s-292 When you use the word motivating, what do you mean by that? Just like, that drives you, the drive to not necessarily perfection but drive to obtain goals.
s-390 If I asked your friends whether they find school motivating or not motivating what would they say? I think most of them would say motivating. Why is that? Because they’re all really focused on getting into a good college and they have the same goals as me, so.
s-457 What things motivate? Um, My parents, friends and mainly my goals, like going to a good college some day and going to high school, you know, being able to do what I want with my life and going for it, so.
“Not Interested”
Students’ lack of motivation was conveyed repeatedly by both student and teacher
participants as a lack of interest, often specific to subject-matter. Many teachers spoke of
endeavoring to render their content interesting and of students finding their content area
interesting (or not). Similarly, when asked what aspects of school they found not
motivating, a large number of students cited a lack of interest in the domain. Moreover,
several student responses suggest that a lack of motivation conceptualized as a lack of
interest constitutes an antecedent to a range of behavioral indicators of motivation, such
as persistence.
This folk conceptualization bears close resemblance to the definition and
operationalization of apathy syndrome. Four of the 18 items on the apathy syndrome
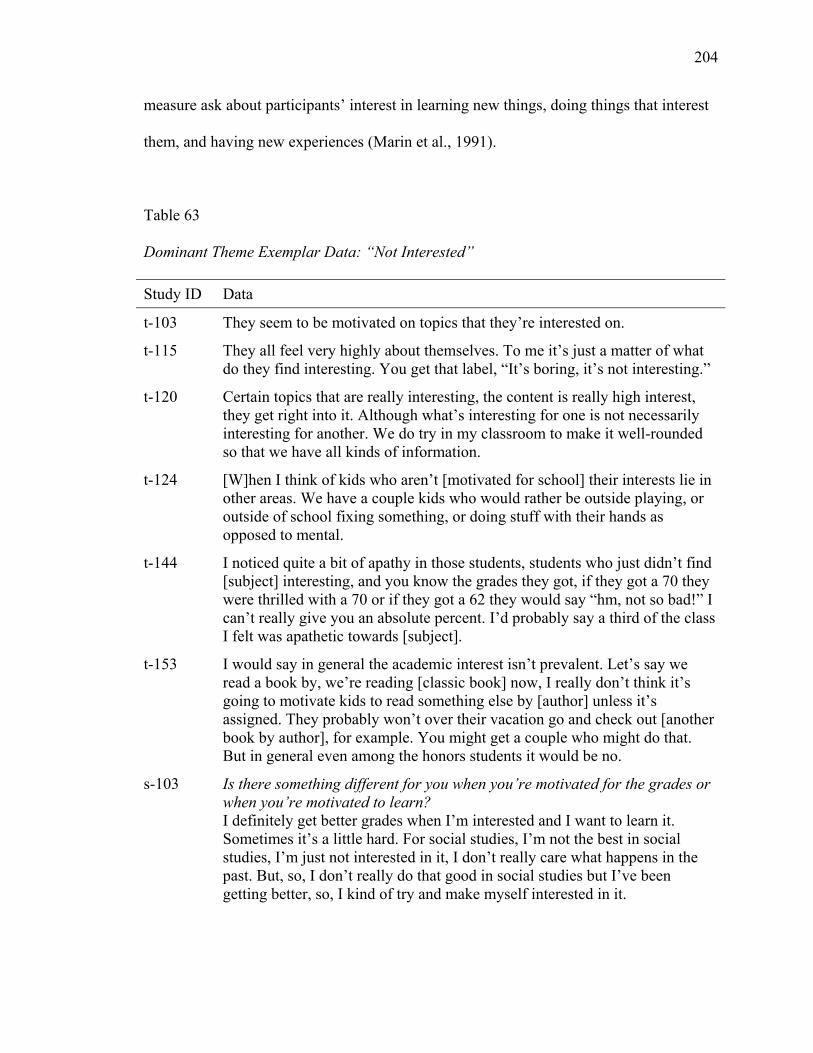
204
measure ask about participants’ interest in learning new things, doing things that interest
them, and having new experiences (Marin et al., 1991).
Table 63
Dominant Theme Exemplar Data: “Not Interested”
Study ID Data
t-103 They seem to be motivated on topics that they’re interested on.
t-115 They all feel very highly about themselves. To me it’s just a matter of what do they find interesting. You get that label, “It’s boring, it’s not interesting.”
t-120 Certain topics that are really interesting, the content is really high interest, they get right into it. Although what’s interesting for one is not necessarily interesting for another. We do try in my classroom to make it well-rounded so that we have all kinds of information.
t-124 [W]hen I think of kids who aren’t [motivated for school] their interests lie in other areas. We have a couple kids who would rather be outside playing, or outside of school fixing something, or doing stuff with their hands as opposed to mental.
t-144 I noticed quite a bit of apathy in those students, students who just didn’t find [subject] interesting, and you know the grades they got, if they got a 70 they were thrilled with a 70 or if they got a 62 they would say “hm, not so bad!” I can’t really give you an absolute percent. I’d probably say a third of the class I felt was apathetic towards [subject].
t-153 I would say in general the academic interest isn’t prevalent. Let’s say we read a book by, we’re reading [classic book] now, I really don’t think it’s going to motivate kids to read something else by [author] unless it’s assigned. They probably won’t over their vacation go and check out [another book by author], for example. You might get a couple who might do that. But in general even among the honors students it would be no.
s-103 Is there something different for you when you’re motivated for the grades or when you’re motivated to learn? I definitely get better grades when I’m interested and I want to learn it. Sometimes it’s a little hard. For social studies, I’m not the best in social studies, I’m just not interested in it, I don’t really care what happens in the past. But, so, I don’t really do that good in social studies but I’ve been getting better, so, I kind of try and make myself interested in it.
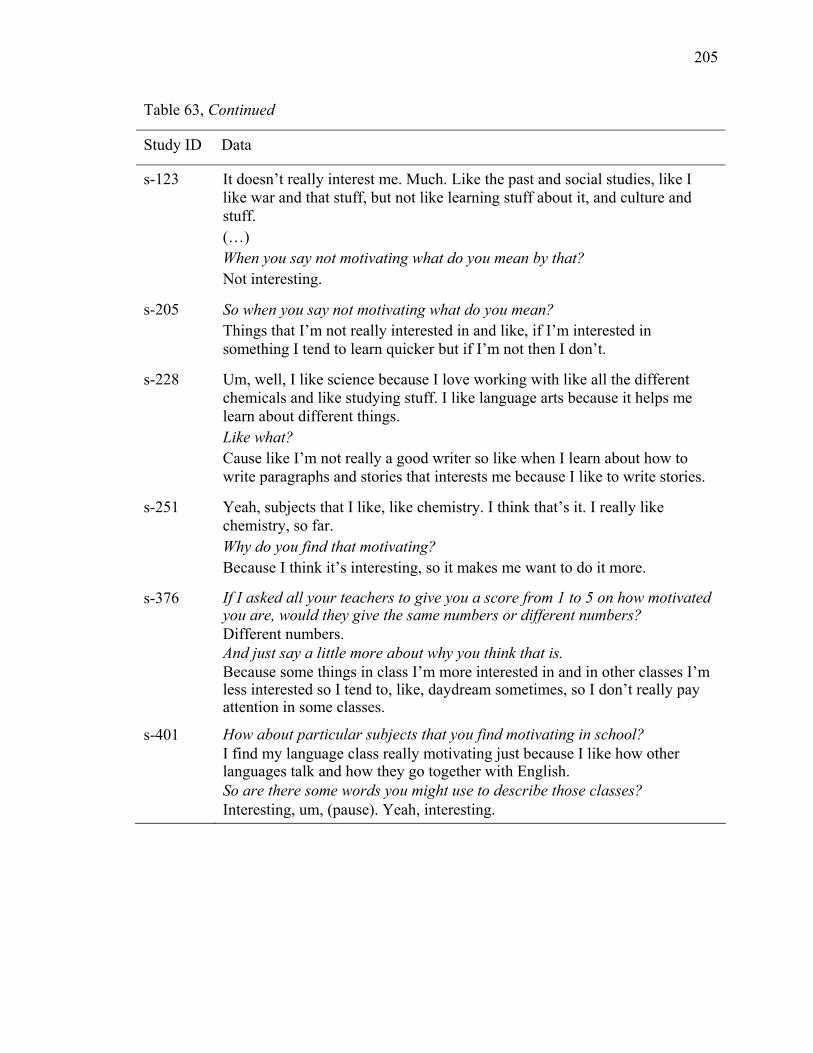
205
Table 63, Continued
Study ID Data
s-123 It doesn’t really interest me. Much. Like the past and social studies, like I like war and that stuff, but not like learning stuff about it, and culture and stuff. (…) When you say not motivating what do you mean by that? Not interesting.
s-205 So when you say not motivating what do you mean? Things that I’m not really interested in and like, if I’m interested in something I tend to learn quicker but if I’m not then I don’t.
s-228 Um, well, I like science because I love working with like all the different chemicals and like studying stuff. I like language arts because it helps me learn about different things. Like what? Cause like I’m not really a good writer so like when I learn about how to write paragraphs and stories that interests me because I like to write stories.
s-251 Yeah, subjects that I like, like chemistry. I think that’s it. I really like chemistry, so far. Why do you find that motivating? Because I think it’s interesting, so it makes me want to do it more.
s-376 If I asked all your teachers to give you a score from 1 to 5 on how motivated you are, would they give the same numbers or different numbers? Different numbers. And just say a little more about why you think that is. Because some things in class I’m more interested in and in other classes I’m less interested so I tend to, like, daydream sometimes, so I don’t really pay attention in some classes.
s-401 How about particular subjects that you find motivating in school? I find my language class really motivating just because I like how other languages talk and how they go together with English. So are there some words you might use to describe those classes? Interesting, um, (pause). Yeah, interesting.
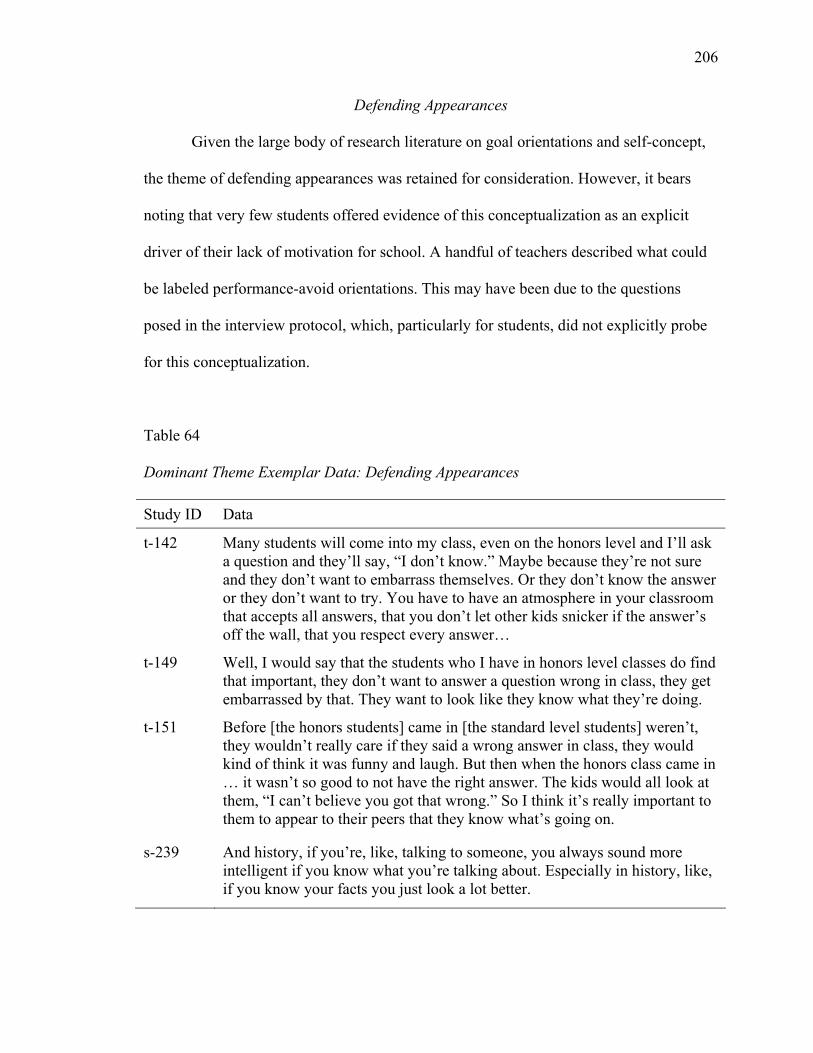
206
Defending Appearances
Given the large body of research literature on goal orientations and self-concept,
the theme of defending appearances was retained for consideration. However, it bears
noting that very few students offered evidence of this conceptualization as an explicit
driver of their lack of motivation for school. A handful of teachers described what could
be labeled performance-avoid orientations. This may have been due to the questions
posed in the interview protocol, which, particularly for students, did not explicitly probe
for this conceptualization.
Table 64
Dominant Theme Exemplar Data: Defending Appearances
Study ID Data
t-142 Many students will come into my class, even on the honors level and I’ll ask a question and they’ll say, “I don’t know.” Maybe because they’re not sure and they don’t want to embarrass themselves. Or they don’t know the answer or they don’t want to try. You have to have an atmosphere in your classroom that accepts all answers, that you don’t let other kids snicker if the answer’s off the wall, that you respect every answer…
t-149 Well, I would say that the students who I have in honors level classes do find that important, they don’t want to answer a question wrong in class, they get embarrassed by that. They want to look like they know what they’re doing.
t-151 Before [the honors students] came in [the standard level students] weren’t, they wouldn’t really care if they said a wrong answer in class, they would kind of think it was funny and laugh. But then when the honors class came in … it wasn’t so good to not have the right answer. The kids would all look at them, “I can’t believe you got that wrong.” So I think it’s really important to them to appear to their peers that they know what’s going on.
s-239 And history, if you’re, like, talking to someone, you always sound more intelligent if you know what you’re talking about. Especially in history, like, if you know your facts you just look a lot better.
207
“It’s Boring”
Among student participants, the term “boring” surfaced with great frequency
when asked for synonyms for “not motivating.” Thirty-nine of the 59 students
interviewed volunteered this term, many of them repeatedly during their interview. The
term boring or bored was used nearly 120 times across all student interviews. In contrast,
these terms were recorded over all teacher interviews a total of only 14 times. This result
replicates findings from Sax and colleagues (2001) who found that over 2 in 5 college
freshmen nationally reported frequently feeling bored in class during their senior year in
high school.
“Depends Which Subject”
Interview data also offered a great deal of support for a conceptualization of
domain-specific school-related apathy. Forty-two of the 58 student participants offered
evidence of domain-specific motivation or lack of motivation. A conceptualization of
school-related apathy as bound to subject matter was described by over one-third of
teacher participants. This result thus suggests that future research should examine the
domain-specificity of students’ lack of motivation.
Summary of Conceptualizations of School-Related Apathy
In sum, twelve overarching conceptualizations were identified from teacher and
students interviews about students’ motivation and lack of motivation for school. Both
students and teachers described aspects of motivation in terms of getting good grades,
securing a future good, lack of volition, lack of interest, and goal-directedness.
Statements from teachers suggest that they perceive students’ lack of motivation in terms
of being overwhelmed and confused with the demands of school. Some teachers also
208
suggested that students’ need to defend their appearance in front of peers is central to
their motivation, or that students simply don’t care about school. For their part, students
spoke of frustration or demoralization at not understanding subject matter, and at a
perceived lack of relevance of school to their present situations. There was some
evidence to suggest that teachers (and others) need to do more to communicate to
students the present value of an education and to assist students in personally verifying
that claim (Giussani, 1997).
While counterparts to many of these folk themes were identified in the research-
based literature on school-related apathy, student and teacher responses brought to light
some additional directions worthy of pursuit. Specifically, qualitative data in the present
study suggest that students’ access to meaning, both in terms of understanding the content
and as regards meaning for their present experience, are closely bound to their lack of
motivation for school. In addition, data culled from student and teacher interviews
indicate that an emphasis on earning high grades for admission to high schools and
colleges may be undermining the development of students’ motivation for the content
itself.
Prevalence of School-Related Apathy
The introduction to the present study presented a series of statements by
researchers and educators regarding the much-discussed but little-documented problem of
students’ lack of motivation for school. To address this gap in the literature, the interview
protocol was designed to gather teacher and student perceptions of the prevalence of
students’ school-related apathy.
209
Four aspects of the interview data were generated to inform this estimate. First,
the teacher interview protocol included a highly open-ended question regarding students’
motivation for school. Second, teachers were asked whether motivation posed a challenge
to teachers, and if so, where it ranked among the other challenges they face. Third,
teachers responded to interview questions specifically about the proportions of their
current students they would characterize as apathetic toward school. Finally, the student
interview protocol asked what aspects of school students found motivating and not
motivating, and whether their friends considered school motivating or not.
The open-ended questions revealed that rather than perceiving students’
motivation levels as a continuous range, many teachers sketch 2 to 3 distinct groups of
students. Several spoke of motivation as a “mixed bag,” or of a “disappearing middle.”
Nearly two-thirds found motivation to be a prominent challenge facing teachers, and only
5% placed student motivation low on the list of teacher difficulties. Teacher estimates of
the proportion of students exhibiting low motivation ranged from 10% to 90% and
averaged roughly 25%. Moreover, data from student interviews also suggested that lack
of motivation for school represents a key problem to be addressed. Many student
participants volunteered characterizations of two groups of friends, describing some
students as motivated for school and others as not interested.
In sum, data from teacher and student interviews analyzed in the present study
empirically document anecdotal statements that lack of motivation for school is indeed a
problem. These data place estimates of school-related apathy at about 1 in every 4
students.
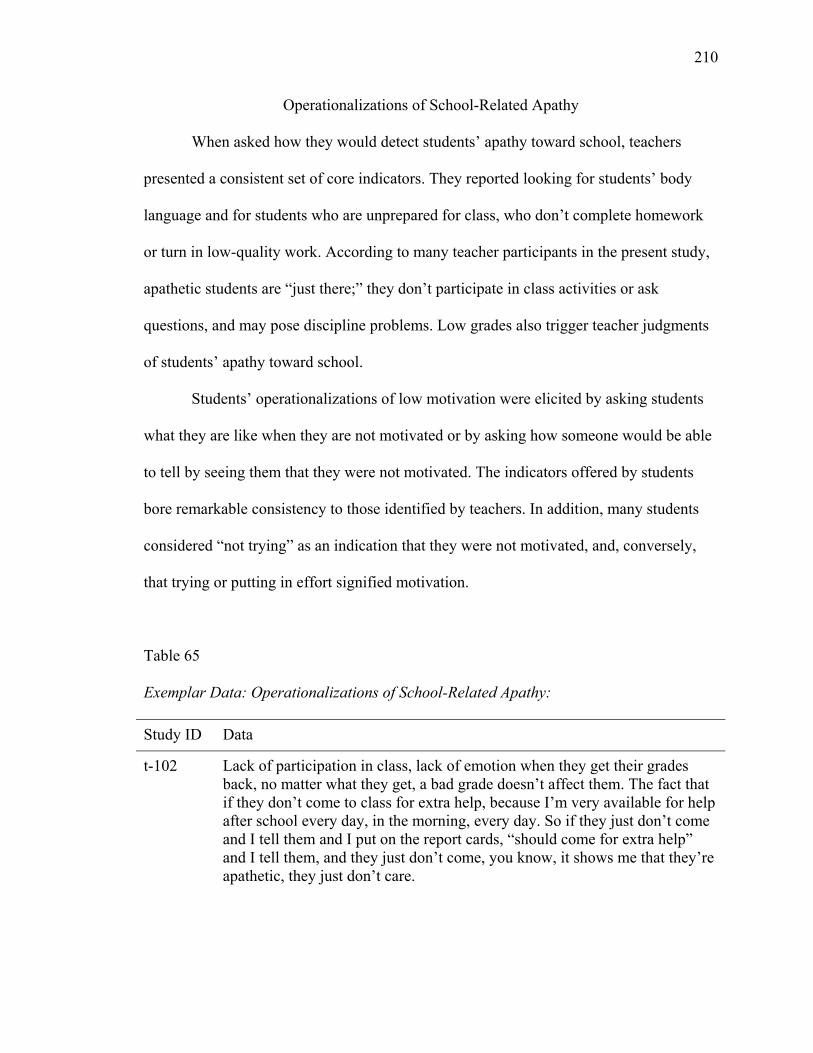
210
Operationalizations of School-Related Apathy
When asked how they would detect students’ apathy toward school, teachers
presented a consistent set of core indicators. They reported looking for students’ body
language and for students who are unprepared for class, who don’t complete homework
or turn in low-quality work. According to many teacher participants in the present study,
apathetic students are “just there;” they don’t participate in class activities or ask
questions, and may pose discipline problems. Low grades also trigger teacher judgments
of students’ apathy toward school.
Students’ operationalizations of low motivation were elicited by asking students
what they are like when they are not motivated or by asking how someone would be able
to tell by seeing them that they were not motivated. The indicators offered by students
bore remarkable consistency to those identified by teachers. In addition, many students
considered “not trying” as an indication that they were not motivated, and, conversely,
that trying or putting in effort signified motivation.
Table 65
Exemplar Data: Operationalizations of School-Related Apathy:
Study ID Data
t-102 Lack of participation in class, lack of emotion when they get their grades back, no matter what they get, a bad grade doesn’t affect them. The fact that if they don’t come to class for extra help, because I’m very available for help after school every day, in the morning, every day. So if they just don’t come and I tell them and I put on the report cards, “should come for extra help” and I tell them, and they just don’t come, you know, it shows me that they’re apathetic, they just don’t care.
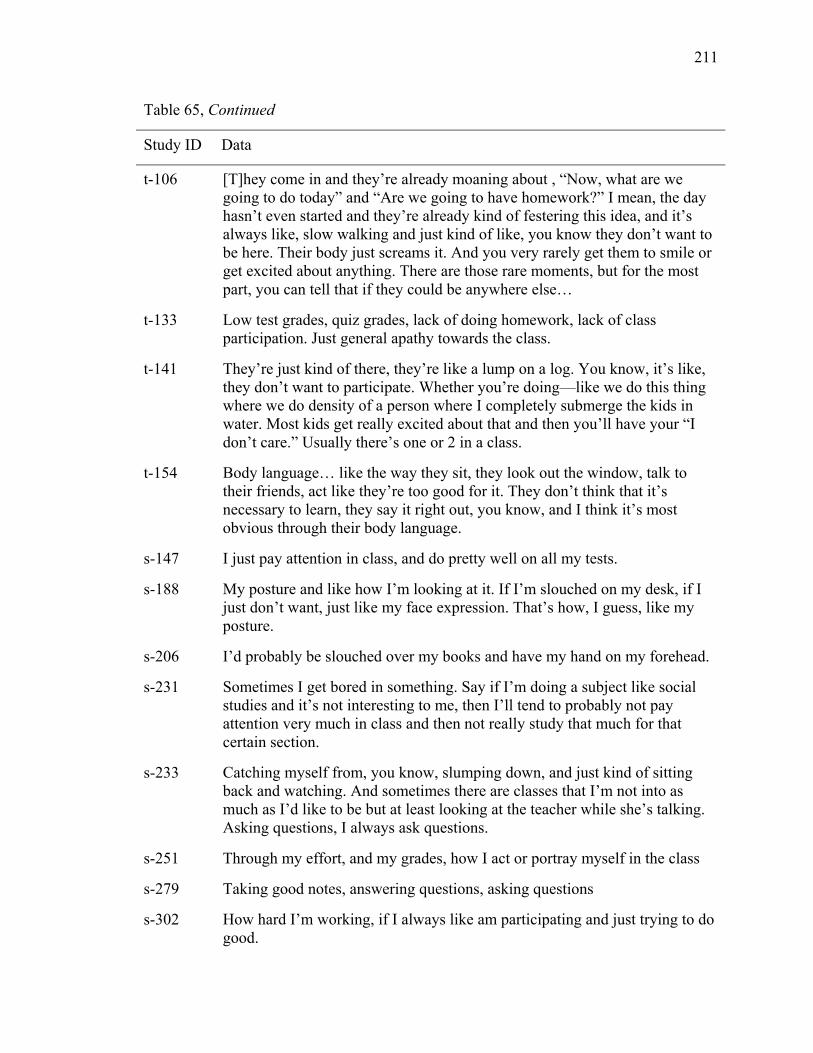
211
Table 65, Continued
Study ID Data
t-106 [T]hey come in and they’re already moaning about , “Now, what are we going to do today” and “Are we going to have homework?” I mean, the day hasn’t even started and they’re already kind of festering this idea, and it’s always like, slow walking and just kind of like, you know they don’t want to be here. Their body just screams it. And you very rarely get them to smile or get excited about anything. There are those rare moments, but for the most part, you can tell that if they could be anywhere else…
t-133 Low test grades, quiz grades, lack of doing homework, lack of class participation. Just general apathy towards the class.
t-141 They’re just kind of there, they’re like a lump on a log. You know, it’s like, they don’t want to participate. Whether you’re doing—like we do this thing where we do density of a person where I completely submerge the kids in water. Most kids get really excited about that and then you’ll have your “I don’t care.” Usually there’s one or 2 in a class.
t-154 Body language… like the way they sit, they look out the window, talk to their friends, act like they’re too good for it. They don’t think that it’s necessary to learn, they say it right out, you know, and I think it’s most obvious through their body language.
s-147 I just pay attention in class, and do pretty well on all my tests.
s-188 My posture and like how I’m looking at it. If I’m slouched on my desk, if I just don’t want, just like my face expression. That’s how, I guess, like my posture.
s-206 I’d probably be slouched over my books and have my hand on my forehead.
s-231 Sometimes I get bored in something. Say if I’m doing a subject like social studies and it’s not interesting to me, then I’ll tend to probably not pay attention very much in class and then not really study that much for that certain section.
s-233 Catching myself from, you know, slumping down, and just kind of sitting back and watching. And sometimes there are classes that I’m not into as much as I’d like to be but at least looking at the teacher while she’s talking. Asking questions, I always ask questions.
s-251 Through my effort, and my grades, how I act or portray myself in the class
s-279 Taking good notes, answering questions, asking questions
s-302 How hard I’m working, if I always like am participating and just trying to do good.
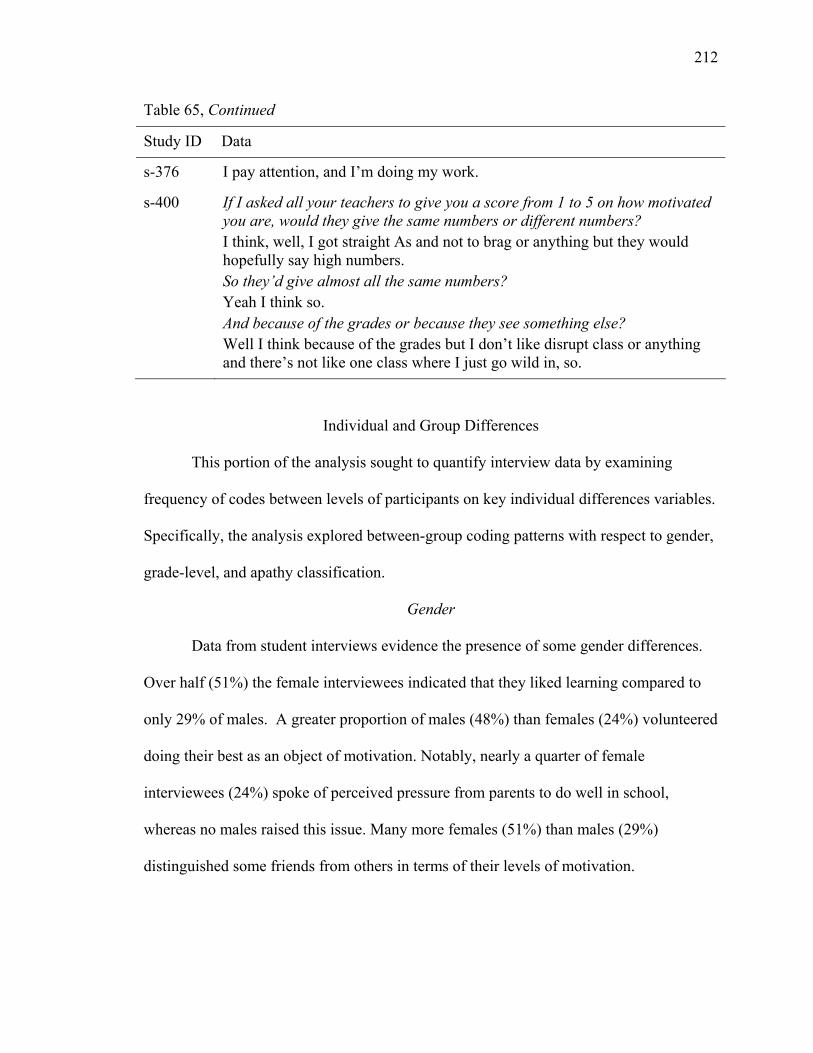
212
Table 65, Continued
Study ID Data
s-376 I pay attention, and I’m doing my work.
s-400 If I asked all your teachers to give you a score from 1 to 5 on how motivated you are, would they give the same numbers or different numbers? I think, well, I got straight As and not to brag or anything but they would hopefully say high numbers. So they’d give almost all the same numbers? Yeah I think so. And because of the grades or because they see something else? Well I think because of the grades but I don’t like disrupt class or anything and there’s not like one class where I just go wild in, so.
Individual and Group Differences
This portion of the analysis sought to quantify interview data by examining
frequency of codes between levels of participants on key individual differences variables.
Specifically, the analysis explored between-group coding patterns with respect to gender,
grade-level, and apathy classification.
Gender
Data from student interviews evidence the presence of some gender differences.
Over half (51%) the female interviewees indicated that they liked learning compared to
only 29% of males. A greater proportion of males (48%) than females (24%) volunteered
doing their best as an object of motivation. Notably, nearly a quarter of female
interviewees (24%) spoke of perceived pressure from parents to do well in school,
whereas no males raised this issue. Many more females (51%) than males (29%)
distinguished some friends from others in terms of their levels of motivation.
213
Grade-Level
Interview data also suggested some grade-level differences in teacher and student
conceptualizations of school-related apathy. More teachers of 10th graders (80%) than of
8th graders (43%) spoke about students’ motivation for school in terms of goals or a drive
to succeed. Tenth-grade teachers (87%) were also more likely to identify the role that
tracking plays in students’ motivation for school than were 8th-grade teachers (4%). This
however is likely due to the absence of tracking in the schools that enrolled the 8th-grade
participants. In addition, 10th-grade teachers (53%) spoke of involving students in class as
a pedagogical tool to improve motivation more often than did 8th grade teachers (13%).
Interestingly, an operationalization of students’ school-related apathy as acting like they
don’t want to be there was cited by over 2 in 5 8th-grade teachers (43%), whereas no 10th-
grade teachers mentioned this indicator. Finally, more 10th-grade teachers (87%) than 8th-
grade teachers (52%) spoke about taking specific actions in response to low student
motivation.
Student participants also presented grade-level differences in the themes they
raised in response to interview questions. More older students (79%) than younger
students (45%) spoke about motivation in terms of interest, and more 10th-grade students
(45%) conceptualized motivation as doing well than did 8th-graders (26%). More older
students (26%) than younger students (3%) indicated they would rather be engaged in
other activities than school. Finally, not trying hard was offered more often as an
operationalization of apathy by 10th-graders (66%) than by 8th-graders (38%).
214
Apathy Classification
Prevalence of themes between student groups based on teacher apathy
nominations were also examined. Seventy-three percent of students with no apathetic
nominations spoke of liking school, in contrast to 57% of students receiving at least one
apathetic nomination. There was some evidence to suggest that students assigned to the
highest motivation category based on teacher nominations were more attuned to
achievement as a goal of schooling than were those in the lower apathy categories.
More students receiving at least one nomination for apathetic (82%) expressed a
view of motivation in terms of doing well than did students with no apathetic
nominations (57%). Students with apathetic nominations also defined lack of motivation
for school as laziness or not putting in effort (93%) than did their peers without apathetic
nominations (67%). When asked what would make school more motivating, more
students with apathetic nominations (39%) than without (10%) suggested increasing
student involvement during class.
Summary of Differences
The comparisons described in this section are not intended to bear the burden of
generalizability, as they are based on a small sample of students and on general themes
culled from open-ended interviews. Nevertheless, these findings suggest that 10th-grade
students and their teachers are more concerned with achievement than are students and
teachers at the 8th-grade level. While not surprising given the fact that older students are
approaching important life decisions, this represents an important consideration for future
research and intervention.
215
Data distinguishing teacher-identified apathetic students from non-apathetic
students also offer insights into responding to school-related apathy. Specifically,
research and intervention could explore strategies for assisting students to overcome self-
diagnosed laziness, and for shifting students’ focus from earning high grades to
discovering an interest in the subject matter. Similarly, teacher practice serves to benefit
from the indications that emerged here and from additional research into the perceptions
of apathetic students.
Is Apathy the Right Term?
One aim of the present study was to explore the viability of the term “apathy” as a
descriptor of students’ lack of motivation for school. Seventy percent of teachers
confirmed in interviews that they had heard other teachers describe students as apathetic,
suggesting that, at least to some extent, this term is being applied to describe students’
lack of motivation for school. When asked whether they would characterize any of their
current students as apathetic, 87% responded in the positive. In addition, several teachers
commented that although they had not used the term before, “apathy” did indeed capture
the malaise of low motivation they observed in students.
Summary
In sum, the findings presented in this chapter support the hypothesis that folk
perspectives drawn from open-ended interviews serve to both validate and enhance
research-based conceptualizations of school-related apathy. These data suggest that lack
of motivation is a substantial challenge currently facing teachers and students. Future
research is in order to explore the interconnections between emergent themes, and to
216
develop measures based on the conceptualizations documented here that have yet to be
taken up in systematic studies of students’ apathy toward school.
Among the avenues for future research is the resolution of the tension students
perceive between buying in to the importance of education for the future, but not seeing a
present value. Thus they feel a tug between what defines their life in the present, their
interests, and so on, and the demands of the life that awaits them, sometimes many years
down the road. There is some evidence that this tension is exacerbated by teachers’
emphasis on the challenges that await students as they move on to high school, college,
or the work force rather than on the “clear and present value” of education.
217
CHAPTER VI
SUMMARY, DISCUSSION AND IMPLICATIONS FOR FUTURE RESEARCH
This study was undertaken to explore research-based and folk conceptualizations
of school-related apathy with respect to definitions, construct independence, and relation
to select individual and group differences including grade level. In this chapter, the
quantitative and qualitative results described in prior chapters are summarized and
integrated leading to conclusions. Following a summary of findings, limitations of the
study are considered. A general discussion and recommendations for future educational
practice and research bring the chapter to a close.
Summary of Findings
The aims of the present study translated into three research questions. This section
summarizes findings for each question in turn by presenting and integrating key results
obtained via quantitative and qualitative methods. Specifically, these questions were:
1a. To what extent are research-based conceptualizations of apathy toward school
statistically independent?
1b. How do teachers and students conceptualize school-related apathy, and to what
extent are those “folk constructs” consistent with research-based
conceptualizations?
1c. How prevalent is school-related apathy in students, and how do students’ and
teachers’ beliefs about its prevalence compare?
2. How is self-reported school-related apathy related to select individual and group
differences variables and what patterns among those variables characterize groups
of students?
218
3. Is there variation between 8th and 10th graders in the conceptualization,
prevalence, and associated individual and group differences of self-reported
school-related apathy?
Research Question 1: Defining School-Related Apathy
Statistical Independence of Research-Based Conceptualizations
The first research question comprised three segments, the first of which asked to
what extent research-based conceptualizations of apathy toward school are statistically
independent. Analyses performed on student responses to self-report measures of
adolescent apathy, amotivation, apathy syndrome, disengagement, and work avoidance
confirmed the hypothesis of the present study that although these constructs reflect some
independence, there is substantial overlap among them. In particular, adolescent apathy
and apathy syndrome were strongly associated, as were work avoidance and amotivation.
Apathy syndrome and work avoidance were also strongly related.
One potential reason why strong relations were observed among apathy variables
is similarity in items used to assess each variable. In light of this concern, the items
constituting each measure were analyzed for overlap. For the most part, sets of items
represented distinct, albeit subtly so, conceptual definitions. In several cases, an argument
could be made that one measure accessed an emotional characteristic that was tapped
behaviorally or cognitively by another. For instance, on the adolescent apathy measure,
students rate their level of agreement with the statement, “I’d rather sleep than go out
with my friends.” This item taps a preference. On the apathy syndrome measure, the item
“I have friends” is closer to a directly and externally observable fact.
219
Another explanation for the emergence of the pairs of strongly related constructs
is their level of generality. Operationalizations of apathy syndrome and adolescent apathy
targeted respondents’ general experiences, whereas amotivation and work avoidance
pertained specifically to school. The strong relation between work avoidance and
amotivation is consistent with prior research documenting a moderate relation between
these constructs among undergraduate students (Smith et al., 2002). However the
substantially greater strength of relation among participants in the present study suggests
that younger students may possess less differentiated perceptions of work avoidance and
amotivation than do older students. Based on an examination of the items used to assess
these two constructs, students scoring high on both measures could be interpreted as
expressing, “I do not see what I am doing in school, so why should I do the work?”
However, purely correlational data cannot inform a causal relationship. The temporal
relation between these constructs thus warrants investigation.
Apathy syndrome in particular was strongly related to the other variables. One
interpretation of this result is consistent with the conceptual definition of apathy
syndrome as a simultaneous diminution along emotional, cognitive, and behavioral
dimensions (Marin, 1990). Adolescent apathy items tended to tap indicators of a general
lack of affect and activity. Work avoidance and amotivation, which pertain to school
contexts, may represent school-specific indicators of what the measure of apathy
syndrome taps on a more general level.
Cluster and factor analyses shed further light on relations among the research-
based apathy conceptualizations. For the full sample, the formation of two distinct
clusters differing significantly on all five apathy variables argued that substantial
220
variance is indeed shared among these variables. Of note was the observation that
students in the high apathy cluster scored comparably above the average on all five
apathy measures. One possibility is that these conceptualizations are each tuned in to
distinct yet related issues that taken collectively assess a condition that could be referred
to as school-related apathy. Another possibility is that the relations between variables
indicate conceptual overlap.
Exploratory factor analyses performed at the item level lent support to the
hypothesis that a more stream-lined conceptualization and measure of school-related
apathy could be achieved. Items associated with each of the 5 apathy measures did not
load together, as would have been expected had the sets of items tapped theoretically
independent constructs. An examination of factor loadings and subsequent dropping of
roughly half the original items yielded two hybrid factors—School Irrelevant and
Positive Life Interest—with theoretical consistency and high reliability. The strongest
contributors of items to these factors were amotivation, work avoidance, and apathy
syndrome.
The two hybrid factors showed themselves to be strong predictors of the
individual and group differences assessed in this study. The fact that the hybrid factors
were comparably efficient in predicting individual differences suggests that these items
could be used in place of the larger set of items to tap the complex of indicators of
students’ apathy toward school. The theoretical consistency of the items forming the two
hybrid factors also points to the importance of pursuing the role of relevance and an
attitude of interest as they pertain to student motivation and performance in school.
221
Research-Based and Folk Conceptualizations
The first research question also inquired into teachers’ and students’
conceptualizations of school-related apathy, and the extent to which “folk constructs” are
consistent with research-based conceptualizations. A number of noteworthy findings
emerged in this portion of the analysis. First, classifications of students as apathetic or
non-apathetic by research-based measures and by teacher nominations reflected only
moderate agreement. In particular, many of the students receiving teacher nominations
for school-related apathy were not identified as such by the research-based constructs.
Greater agreement between perspectives held for those classified as non-apathetic.
A second key finding can be drawn from comparing results on the amotivation
scale to the dominant themes that emerged in teacher and student interviews. The items
used to operationalize amotivation focused on students’ reasons for going to school.
Students rated their level of agreement on items such as, “I once had good reasons for
going to school; however, now I wonder whether I should continue.” Scores on this
measure were extremely low and skewed positive, denoting that across the board,
students had reasons for being in school. However, when asked in interviews what their
reasons were for being in school, students overwhelmingly identified future
consequences such as gaining admission to college or securing a high-paying job. Many
students were at a loss to identify reasons for being in school in relation to their present
experience.
Related to this finding was the observation that items tapping amotivation did not
closely reflect its conceptual definition, which focuses on lack of intention to act resulting
from lack of valuing or lack of competence for an activity (Ryan & Deci, 2000b).
222
Interestingly, however, lack of intention to act did surface as a dominant theme in
interview data (i.e., “Don’t Feel Like It”). Moreover, although competence and valuing
were not explicitly tapped by the amotivation measure, these themes also emerged as
dominant in interview data. The role of value was reflected in teachers’ comments
regarding students not caring about school (i.e., “Caring Less”). In a conceptualization
that could be interpreted as running parallel to competence, many students spoke of
demoralization at not understanding the material, as evidenced in the dominant theme “I
Just Don’t Get It.”
A large body of prior research has explored the roles that value, perceived
competence, caring, and goals play in student motivation and academic achievement.
Although the present study sought to examine a focused conceptualization of apathy
toward school, it is important to set the findings reported here in the context of these
broader literatures. However, even though a few items from the 97 apathy and individual
difference measures either hinted at or addressed these extended themes (e.g.,
competence: “I think I am smart;” value: “Spending time with friends is important to
me;” goals: “I know what I want to be when I grow up;” caring: “I can’t see why I come
to school and frankly, I couldn’t care less.”), the majority of items did not directly tap
these areas.
Consequently future research should examine the relation between school-related
apathy to these prior findings and existing theoretical perspectives. For instance, students
high on school-related apathy may fail to set goals, or may not see the value in school.
Students may also feign apathy as a maladaptive response to perceived lack of
competence. Research on the relation of school-related apathy to goal content (e.g., Ford
223
& Nichols, 1987; Sheldon, Ryan, Deci, Kasser, 2004; Wentzel, 2000), value (e.g.,
Wigfield & Eccles, 2000), and competence (Ryan & Deci, 2000a) all represent important
avenues for continued research.
Also noteworthy was the finding that teacher-nominated apathy groups differed
significantly on all individual apathy variables except apathy syndrome, suggesting that
teachers either did not register students’ differences in apathy syndrome characteristics,
or did not consider characteristics associated with apathy syndrome to be salient to their
conceptualization of school-related apathy. Alternatively, the measure of apathy
syndrome may have been too general and thus insensitive to students’ school-related
apathy. Interview data support the latter interpretation, as interest played prominent roles
both in the delineation of a dominant theme based on teacher and student comments (i.e.,
“Not Interested”), as well as in the operationalization of apathy syndrome, which
included several statements about interest.
Another outcome of the comparison between research-based and folk
conceptualizations was the identification of the theme of personal meaning and relevance
from teacher and student comments. Amotivation reflects this theme to some extent.
Moreover, the hybrid factor “School Irrelevant” drew together a set of items that speaks
to the role of personal meaning and relevance, themes that emerged strongly in interview
data.
Regarding operationalizations of school-related apathy, striking agreement was
observed between teachers and students. Key markers included body language such as
staring blankly, not paying attention during class, being unprepared for class, and not
completing assignments. There was some evidence that teachers and especially students
224
based motivation judgments on grades. Teachers also spoke of students appearing like
they preferred to be anywhere but in class. Of the research-based operationalizations,
work avoidance reflected the greatest agreement with those obtained in interviews.
Finally, the importance of conceptualizing school-related apathy as domain-
specific came to light in interview data, as many students indicated different levels of
motivation for different subjects. However, it was not clear whether these differences
were attributable to the subject matter itself or to the teachers of those subjects.
Prevalence
The last part of the first research question asked how prevalent school-related
apathy is in students, and compared students’ and teachers’ beliefs in this regard.
Research-based estimates, hovering at 20%, were more conservative than those of
teachers, who set the proportion between 25% and 31%. One interpretation of this finding
is that the research-based conceptualizations were less sensitive to students’ apathy than
were teachers. Another is that teachers were overly sensitive in classifying students as
apathetic. The former interpretation seems more reasonable, as teachers based their
nominations on a long-term knowledge of students, whereas research-based measures
only had one-time access to a thin slice of student characteristics. Regardless, both
research-based and teacher perspectives indicate that a disconcerting portion of students
in these grades lacks school-related motivation.
Here the question arises as to the nature of the apathy problem. Cluster results by
grade as well as distributions of teacher apathetic nominations by grade paint a somewhat
different picture compared to results from the full sample. At each grade level, roughly
8% of students were identified as markedly high on indicators of apathy. Yet another half
225
to two-thirds also fell into moderate clusters. Integrating indicators of prevalence with
mean scores on the apathy measures suggests that the high apathy students are
appropriated labeled as “apathetic” toward school. Their high scores across all negative
measures of apathy as well as distress point to a serious problem being faced by such
students. In contrast, it might be said that the students in the moderate groups reflected
“low motivation” for school.
Research Question 2: Individual and Group Differences
The second research question focused on how self-reported school-related apathy
relates to select individual and group differences variables and what patterns among those
variables characterize groups of students. The hypotheses of the study for the research-
based conceptualizations held. In the full sample, each research-based measure of school-
related apathy significantly related positively to boredom proneness and distress, and
negatively to well-being, curiosity, and achievement. The only exception was the non-
significant relation between curiosity and disengagement. Thus the present study found
mixed support for the validity of these apathy constructs. Further bolstering this
conclusion was the finding that clusters created from research-based variables differed
significantly on all five individual difference variables.
In addition, gender differences were detected for some research-based apathy and
individual differences. Consistent with prior research documenting higher motivation for
females than for males, the present study found that across the full sample, apathy
syndrome and work avoidance were significantly lower for females than for males
(Vallerand & Bissonnette, 1992). Results from earlier studies suggesting that females
manifest more depression and lower self-esteem than males were also replicated in the
226
present study (Maatta et al., 2002). Within both 8th and 10th grade, females reported
significantly greater distress than did males. Tenth-grade females additionally scored
significantly lower than their male counterparts on well-being, but earned significantly
higher GPAs. Taken together, these results indicate that females are performing better
than males, albeit at a higher psychological price.
Expectations for individual and group differences were borne out to some extent
with respect to teacher nominations of apathy. Across the full sample, boredom proneness
and GPA differed significantly between the high and low apathy nomination groups, and
omnibus tests on the apathy category groups yielded significant differences for boredom
proneness, curiosity, and GPA. However no dependence was detected between gender
and apathy nomination or apathy category group membership.
Also of note was the observation of significant between-group differences by
religion, with Catholic students reporting lower apathy syndrome and work avoidance
and lower boredom proneness than non-Catholics. The small numbers of non-Catholics
prevented finer-grained comparisons. In addition, students reporting frequent practice of
their religion reported significantly lower adolescent apathy and lower boredom
proneness than did students who rarely or never observed a religion.
As noted earlier, several explanations can be forwarded to explain these results.
For example, it is possible that non-Catholic students were in attendance at schools in the
present study due to difficulties encountered in the public school system causing parents
to opt for a private school environment for their children. This would have resulted in a
sampling bias for non-Catholic students. Moreover, the non-Catholic group included
those professing Protestant, Jewish, or Orthodox faiths, as well as those not adhering to
227
any religion, which limits the interpretability of this finding. Neither should it be inferred
that practice of religion causes the observed outcomes. Regardless of the underlying
reasons for these differences, results from the present study should not be generalized
beyond Catholic-school students.
Research Question 3: Grade-Level Differences
The last research question inquired into variations between 8th and 10th graders in
the conceptualization, prevalence, and associated individual and group differences of
self-reported school-related apathy. A number of differences were detected in terms of
mean levels of apathy variables and individual differences variables. Patterns traced by
cluster analyses and teacher nominations also yielded valuable insights.
The older students in the study showed some signs of manifesting greater school-
related apathy. Specifically, 10th graders reported higher adolescent apathy and were
more likely to show up late for class than did 8th graders. Consistent with this finding,
10th-grade students in the high apathy category based on teacher nominations reported
attending class unprepared, a finding that did not emerge for 8th graders. Unlike older
students, 8th graders with nominations for apathy reported higher apathy syndrome and
distress and lower GPAs. Minor differences were detected for gender as well, with males
in the 10th grade but not 8th grade scoring higher on well-being than females. Data also
indicated that relations between distress and some apathy and individual differences may
decline with age. For 8th graders, distress was more closely (although not significantly)
associated with boredom proneness, GPA, and amotivation than it was for 10th graders.
The cluster analyses performed by grade level offered interesting insights into
patterns unique to grade level. For both grades, a highly apathetic cluster of similar
228
proportions emerged. These two clusters differed on amotivation, with 8th graders scoring
higher than 10th graders. Both grades also evidenced two “midrange” clusters and one
non-apathetic cluster. At the 8th-grade level, no noteworthy differences distinguished the
two midrange clusters, although one group appeared higher on general apathy and the
other on school-related apathy. The 10th-grade midrange clusters differed from the 8th
grade pattern in two respects. First, four times as many 10th graders fell into the general
apathy cluster as in the school-specific apathy cluster, whereas 8th graders were evenly
split across these two clusters. Second, work avoidance was higher in the general apathy
cluster for 10th graders.
These data are cross-sectional, and consequently causal or developmental
conclusions cannot be drawn. However, these data are consistent with the possibility that
over time some students “migrate” from the school-specific apathy cluster into either the
general apathy cluster or the non-apathetic cluster. If this were the case, the shift of some
students into the general apathy cluster could be attributed to an overall decline in
motivation, whereas those transitioning into non-apathetic status may be motivated by the
achievement aspects of school as college and other distal goals appear closer on the
horizon. Longitudinal studies are needed to further explore and test this interpretation.
Limitations
Several limitations should be considered in weighing the validity and
generalizability of findings from the present study. One limitation is that the sampling
frame comprised only students enrolled in Catholic schools. Certain variables may have
influenced both the decision of particular students to attend these schools as well as their
levels and conceptualizations of apathy. This potential confounding limits the extent to
229
which findings can be generalized to students attending public or non-Catholic private
schools. The aforementioned findings regarding religion and extent of religious practice
underscore this concern.
In addition, the present study was cross-sectional rather than longitudinal.
Although the sample was drawn from middle schools and high schools that serve the
same students, causal claims should not be made regarding the role of schooling or
development in relation to any observed differences between grades.
A further limitation of the present study regards the focus on lack of motivation,
which resulted in the exclusion of constructs that may represent the opposite of apathy,
such as intrinsic motivation (e.g., Ryan & Deci, 2000a). However, the findings regarding
the low success of research-based measures in identifying teacher-nominated apathetic
students argues against the use of applying pro-motivation constructs to detect students
with low motivation for school. That is, although high scores on measures of interest are
posted by students with interest, the converse may not be the case: low scores may not
individuate students without motivation. Related to this concern is the non-specific set of
items used to tap adolescent apathy and apathy syndrome, particularly in light of the
results from interviews regarding domain-specific motivation. Future research is in order
to better distinguish domain-specific lack of motivation from a general lack of
motivation.
Finally, the teacher nomination process, while offering great potential for
capturing teacher perspectives on student apathy, presented some challenges, with
implications for interpretation of results. Specifically, variable numbers of teachers
provided nominations for student participants, such that opportunities for disagreement
230
between nomination scores varied across students. Second, a different algorithm for
assigning students to an apathy category would have yielded different results. Apathetic
nomination groups may be more valid in this respect, since this variable identified
students who were perceived as apathetic toward school by at least one of their teachers.
In addition, this process potentially masked subject-matter differences which emerged in
interviews as a salient consideration.
Implications for Educational Practice
A number of implications for educational practice are suggested by the results of
the present study. The great majority of students with apathetic nominations from
teachers spoke of having difficulty in putting in the effort required by school. The
moderate to high levels of boredom proneness coupled with the frequent mention of
boredom in student interviews may also signal a lack of capacity to remain focused on
the task at hand. Many teachers commented on the hurried character of students’ lives
and on the high levels of stimulation inflicted by television, cell phones, video games, the
Internet and the like. Thus instructional strategies that scaffold student work, targeting
proximal goals that provide students with a sense of accomplishment, are recommended.
The results presented herein also indicate that instructional environments that
foster student involvement could also contribute to inspiring students who are in short
supply of motivation for school. The importance of interest to students for making school
motivating reinforces prior research on the importance of linking to students’ interests. In
addition, it appears that students would benefit from a clearer communication of the
relevance of the content and tasks of education not only to their future goals but to their
present situations.
231
The repeated discussion of achievement across both teacher and student
interviews suggests that an emphasis on earning grades may be overshadowing the
emphasis on learning and students’ relation to the content itself. Considered in light of
the findings regarding lack of relevance of school to students’ lives, instruction that
emphasizes both personal relevance and the satisfaction that comes from learning also
holds promise for increasing students’ motivation.
The fact that teachers voiced folk descriptions of many existing psychological
constructs suggests that school effectiveness would benefit from equipping teachers with
schema for recognizing and addressing patterns in student motivation. Effective
approaches to addressing students’ learned helplessness and work avoidance have been
documented in the research literature (e.g., Meece & Miller, 1999). Conduits for
translating these research findings into easily digestible information for school
practitioners are recommended.
Teachers may also benefit from proactive assessments of students’ motivations
for school. Such explorations could be facilitated by researchers. For instance, as a
follow-up to the present study, participating teachers and administrators will gather with
the researcher to review results and consider implications for their teaching practice. This
approach to professional development holds promise as a realistic and personally
beneficial way for teachers to apply data on their students to their classroom instruction.
Implications for Future Research
In exploring the viability of the term school-related apathy, the present study
sought to document whether a lack of motivation for school currently presents a problem
faced by students and their teachers, and, if so, to sketch its contours. A great deal of data
232
were presented and analyzed in the preceding pages. From these data and interpretations,
an array of implications for future research have come into view. These areas for
continued research include focused and systematic examinations of students’ lack of
motivation for school, the use of innovative methodological approaches for researching
students’ motivation, the integration of researcher and teacher perspectives on students’
motivation, and the delineation of developmental pathways that may conduce individuals
to a lack of school-related motivation.
Based on teacher and student operationalizations articulated in interviews, school-
related apathy could be identified with a lack of emotional (e.g., lack of volition, lack of
affect), cognitive (e.g., resistance to critical thinking; lack of attention to class activities
and lecture), and behavioral (e.g., doing minimal work; physically disconnecting in
classroom setting) engagement with school-related activities. However, identification—
or detection—is not the same as conceptualization. In weighing the results of the present
study, it is necessary to distinguish between what school-related apathy is, how it can be
detected, and what causes it.
Returning in light of the quantitative and qualitative data gathered to the
theoretical and conceptual considerations forwarded in the second chapter, I suggest that,
at its core, school-related apathy is a lack of caring about the substance and activity of
school and formal education that manifests in an array of cognitive and behavioral
expressions and indicators. The data also provide hints at antecedents or causes of such
apathy, including relations to perceived purpose of school, access to meaning, and
personal relevance. Future research is necessary to develop measures that can accurately
distinguish students’ lack of caring from these other indicators. Subsequent research
233
could then apply results of prior investigations into perceived purpose of education (e.g.,
Lau, Thorkildsen, Nicholls, & Patashnick, 2000; Thorkildsen & Nicholls, 1991) and
perceived meaning (e.g., Seifert & O’Keefe, 2001) to develop research designs that
reveal developmental relations between school-related apathy and these issues.
Data on the research-based constructs corroborated a multifaceted diagnosis of
school-related apathy, with constellations of variables individuating patterns of students’
school-related motivations. Such a broad collection of indicators highlights the tension
researchers face between gaining conceptual clarity (i.e., “what is school-related apathy”)
and identifying sets of powerful predictors of valued outcomes (i.e., “what does school-
related apathy predict?”).
Fredricks et al. (2004) acknowledged this tension in their literature review
examining the potential of the multidimensional concept “engagement” for researching
students’ school-related motivation. They suggest that constructs with broad definitions
reflect the complexity of students’ motivation and may offer more practical applications
than the finer-grained conceptual definitions that are often the focus of empirical
research. The present study illustrates the promise of iterative processes of research
drawing on both approaches. Findings reported here inform the tuning of quantitative
measures to detect specific conceptual dimensions of students’ motivation (e.g., school
relevance and positive life interest), and indicate that further explorations are necessary to
describe the domain-specificity of students’ lack of motivation for school as well as the
processes by which students either lose or gain school-related motivation. At the same
time, the open-ended responses from interviews yielded thick descriptions conducive to
detecting multifaceted conditions with practical applications for instructional strategies.
234
For many teachers, participation in the present study likely constituted the first
time they had been asked to consciously think through and articulate the nature of their
students’ motivation for school. Although many accepted the term “apathetic” as
appropriate, the suggestion of another term, such as “discouraged” or “demoralized,” may
also have met with broad acceptance.
Perhaps more compelling than merely offering a new label to the field is the
effectiveness of a research strategy driven by an exploration of labels to illuminate areas
of convergence in existing conceptualizations and open alternative inroads to educational
research and practice. In the case of the present study, the selection of the term “school-
related apathy” served as a pivot point for selecting and comparing a set of research-
based constructs and eliciting responses from teachers and students that yielded valuable
insights. Albeit rather bold, one interpretation of the confluence of these insights is the
need for a reconceptualization of students’ lack of motivation toward the experiences that
constitute formal education.
Specifically, the results reported here suggest a perspective on students’ lack of
school-related motivation that integrates an apparent contradiction between students’
expressed need to see the relevance of education to their present situations and an
unwillingness to invest the effort required to reach a summit from which this relevance
can be grasped. Students high on research-based indicators of school-related apathy
reported elevated levels of boredom proneness and distress. Interview data suggested that
students are often bored in the classroom and even refuse to complete many tasks
assigned by teachers. A pattern of student frustration at “not getting it,” and subsequently
“tuning out” was apparent.
235
Paradoxically, a pedagogical emphasis on “real-world” applications (a.k.a.
“authentic tasks”) may have served to distance the activities of school from students’
actual lives. Results from this study overwhelmingly suggested that students and even
many teachers conceptualize formal education as job training rather than as a process that
fosters an individual to a greater engagement with reality that has value both for living in
the present as well as future demands. Consequently, future research is needed to
document student and teacher perceptions of the purpose of formal schooling, and
relations of those perceptions to pedagogical strategies as well as student achievement
and affective outcomes.
The present study also suggests that a long-term trend may be in place, whereby
the attention of students has slowly shifted from gaining an understanding of subject
matter, to aspiring to competence per se, to simply procuring the token that enables
entrée into prestigious or high-paying jobs. Consequently, research is in order that
examines students’ goals for passing through the hoops of schooling primarily as
prerequisites for moving to the next step toward employment.
Findings related to the amotivation construct also bear several implications for
future research. Students in the present study overwhelmingly scored low on amotivation,
which was operationalized largely in terms of lack of reasons for going to school. In other
words, the survey data suggest that the majority of students have reasons for being in
school. Interview data, however, told another story: students did have reasons, but very
few saw reasons in the present for being in school. At the same time, many students
articulated a lack of intention to act. This conceptualization closely parallels the
conceptual definition of amotivation. Thus, future work should be conducted to revise the
236
amotivation measure based on its conceptual definition and informed by the student and
teacher comments captured in the present study. Research using a revised amotivation
measure could explore the relation between lack of intention to act and personal
relevance, as discussed earlier. This research may stand to gain from a revival of the
volition construct targeted by earlier scholars (e.g., Corno, 1993).
The amotivation construct also claims to address both students’ value for and
sense of competence toward an activity. As demonstrated by the body of research on
expectancy-value theory, collapsing these two aspects of students’ motivation blurs
important distinctions. Specifically, amotivation as lack of intention to act may result
from lack of value, or lack of perceived competence, or lack of perceived reasons for
investing energy in a task. Future research that disentangles the relations among these
issues is warranted.
The success of the hybrid factors in predicting individual differences suggests that
potential exists for improved parsimony. Statistical examination of the research-based
indicators of school-related apathy pointed to the importance of the relevance of school
and a general attitude or interest in life. Similarly, cluster patterns suggested that groups
of students manifest general apathy and apathy more narrowly linked to school contexts.
Further, interviews with students suggest frustration when they don’t understand, yet
‘inability’ to do the work required to get there. Accordingly, research into context-
specific and general manifestations of apathy are called for. Research is also needed on
the relation between students’ understanding of subject matter and effective strategies for
scaffolding students’ investment in learning.
237
With respect to prevalence, the streams of data in the present study converged to
document roughly 8% of 8th- and 10th-grade students with manifestations of what could
be called school-related apathy. Another, larger, group at each grade level was identified
as exhibiting low motivation for school. This group was evident not only in proportions
of cluster membership, but also in teacher responses regarding the extent to which
motivation poses a problem and proportion of students nominated as apathetic toward
school. More research is needed to improve identification of students with school-related
apathy and low motivation for school. The findings reported here regarding disparities
between research and teacher identifications of such individuals underscores the
importance of marshalling evidence from a variety of sources to detect this condition in
students.
The use of multiple informants also poses specific challenges to the interpretation
of results. The benefit of drawing on a range of players is the opportunity to integrate
perspectives and to identify issues that may not be apparent to one or another group of
stakeholders. However, there is great potential for mismatch in the assumptions on which
responses are based. For instance, teachers may have been operating from a sense of their
own expectations for students in terms of engagement, assignments, and school
involvement. In contrast, students may be more likely to see school as one among many
aspects of their lives. The difference in perspectives thus constitutes one explanation for
differences observed between teachers and students as well as between teachers and
research measures.
Exploration of the questions addressed in the present study among public school
students and teachers reflecting diverse populations is in order. In light of the findings
238
reported here, research should also target the relation between religious background and
religious practice to students’ motivation for school. The importance of investigating the
subject-matter nature of motivation also bears exploration, as this theme clearly emerged
in interviews.
The development of students’ motivation represents another area for further
research. The cross-sectional design of the investigation reported here suggest that
students’ general lack of motivation increases over time. Results also suggest that some
students transition from moderate apathy to low apathy. Thus identification of pivotal
factors in that transition represents an important focus for research. Though logistically
challenging, longitudinal studies that follow students from elementary school through
college offer great potential for tracing constellations of contextual and individual
characteristics that contribute positively to students’ motivation for engaging with content
as well as preparing themselves for rewarding careers.
The present study also holds implications for research into effective approaches to
preservice and inservice programs that equip teachers with tools for identifying and
responding to students who lack motivation for school. Development and research of
interventions designed to help students critique their own experience represent an
important endeavor. Such research could identify strategies that foster students’
awareness of the present value of education. This suggestion is akin to affective
metacognition: thinking about affect rather than merely living through it.
Finally, a number of methodological implications arise from the present study.
Explorations integrating interviews and quantitative data collection methods enable
comparisons among similar constructs and refinement of conceptual definitions, and offer
239
opportunities for new and unforeseen meanings to surface. Nomination methods applied
in concert with self-report methods also offer wonderful possibilities for comparing
research-based and practitioner understandings of constructs, be they cognitive,
motivational, or otherwise. Since nomination patterns can be quantified via multiple
algorithms, research into reliable approaches to capturing nominations should be pursued.
The present study yielded insights into the state of students’ school-related
apathy, and opened new doors through which future research can pass to document and
successfully respond to challenges in fostering students’ motivation for school. It is
hoped that the results and interpretations presented herein may contribute to efforts to
increase students’ experiences of the rewards—both present and future—that formal
schooling offers.
240
Appendix A
Demographics Measures Form A-S: Student Form A-T: Teacher

241
FORM A-S ID:
Directions: Please check off or fill in the appropriate response. Gender: Male Female Birth Year: 19____ Ethnicity (check all that apply):
African American
American Indian
Asian/Pacific Islander American
European American
Hispanic American
Other (please specify): ________________________________
What is your religion?
Roman Catholic
Episcopalian
Presbyterian
Jewish
Buddhist
Hindu
Muslim
Other________________________________
How often do you observe your religion?
often (e.g., weekly)
sometimes (e.g., about monthly)
occasionally (e.g., major holidays)
rarely/never
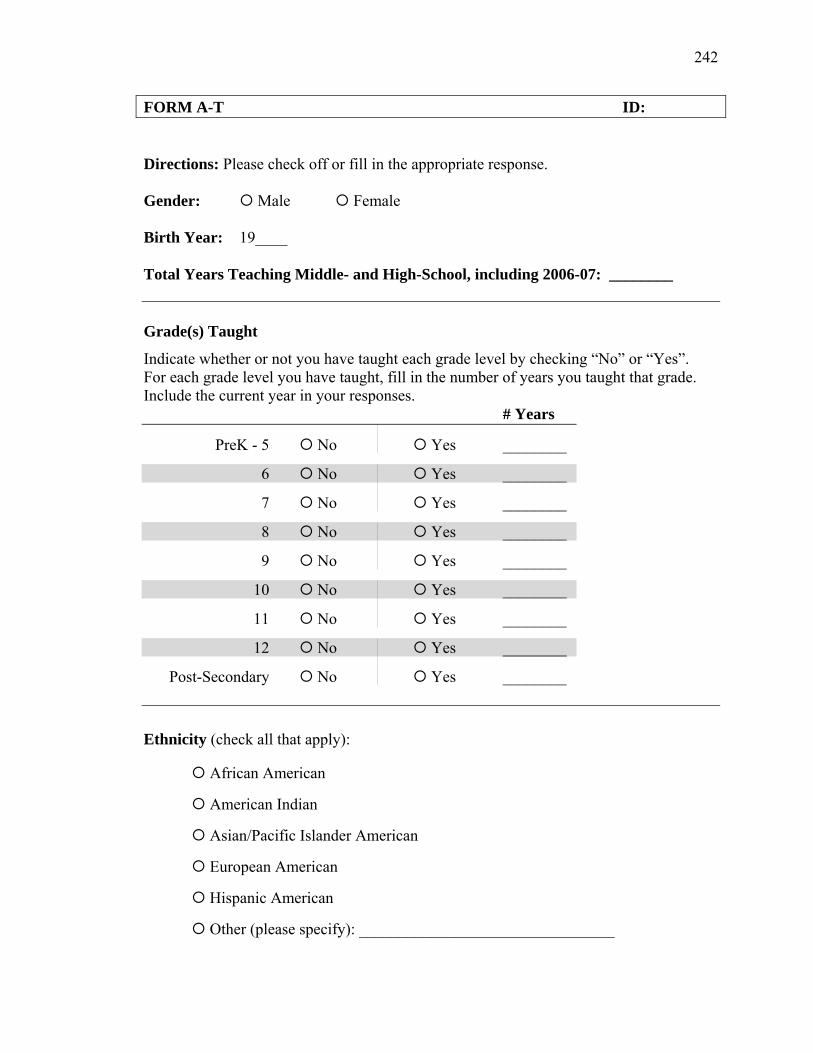
242
FORM A-T ID: Directions: Please check off or fill in the appropriate response. Gender: Male Female Birth Year: 19____ Total Years Teaching Middle- and High-School, including 2006-07: ________ Grade(s) Taught
Indicate whether or not you have taught each grade level by checking “No” or “Yes”. For each grade level you have taught, fill in the number of years you taught that grade. Include the current year in your responses. # Years
PreK - 5 No Yes ________
6 No Yes ________
7 No Yes ________
8 No Yes ________
9 No Yes ________
10 No Yes ________
11 No Yes ________
12 No Yes ________
Post-Secondary No Yes ________ Ethnicity (check all that apply):
African American
American Indian
Asian/Pacific Islander American
European American
Hispanic American
Other (please specify): ________________________________
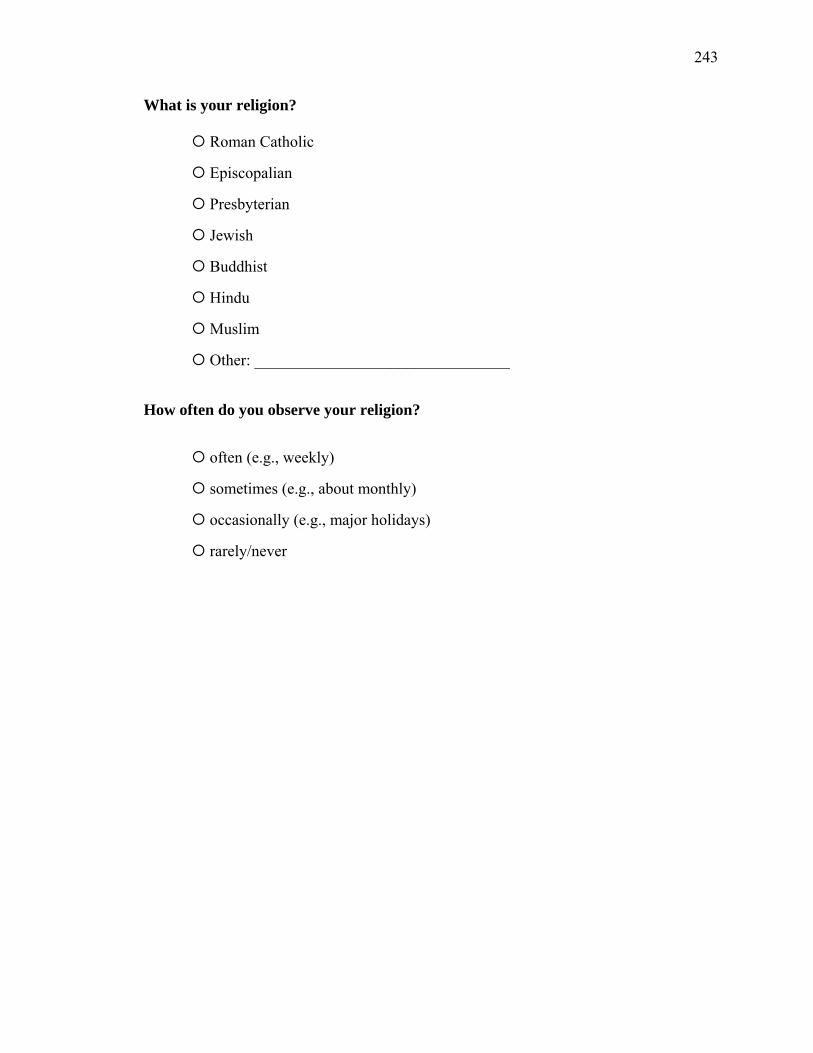
243
What is your religion?
Roman Catholic
Episcopalian
Presbyterian
Jewish
Buddhist
Hindu
Muslim
Other: ________________________________
How often do you observe your religion?
often (e.g., weekly)
sometimes (e.g., about monthly)
occasionally (e.g., major holidays)
rarely/never

244
Appendix B
Adolescent Apathy
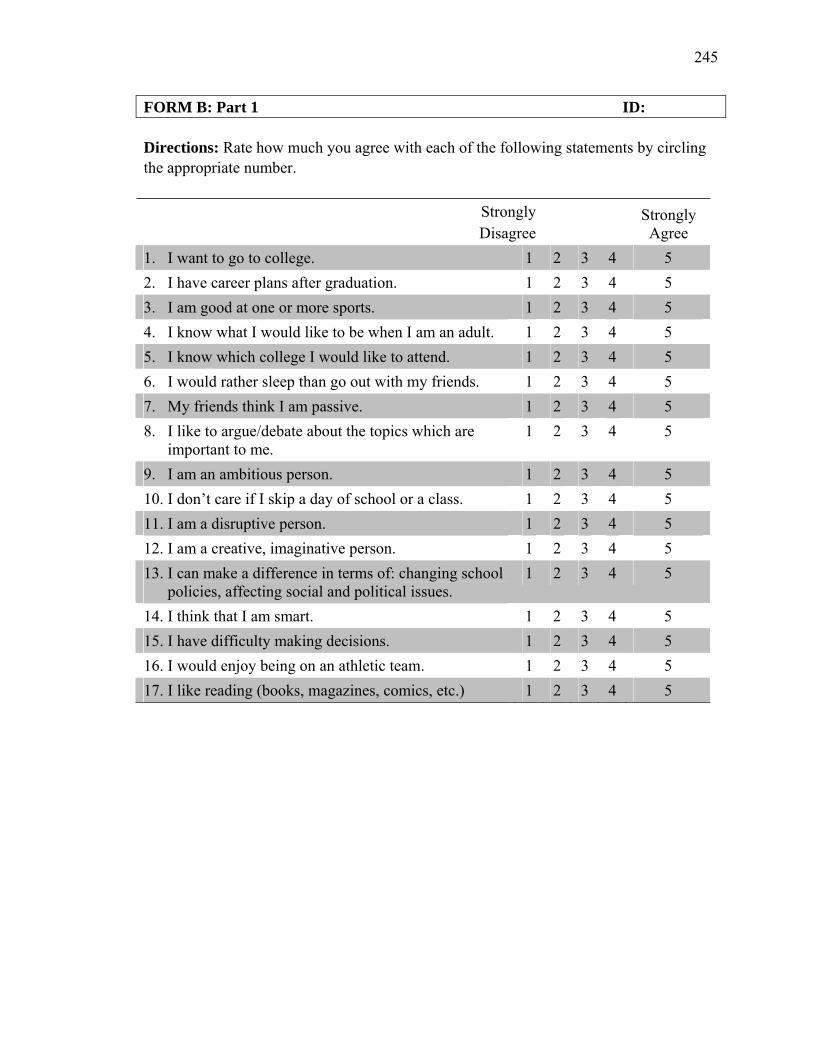
245
FORM B: Part 1 ID: Directions: Rate how much you agree with each of the following statements by circling the appropriate number.
Strongly Disagree
Strongly Agree
1. I want to go to college. 1 2 3 4 5 2. I have career plans after graduation. 1 2 3 4 5 3. I am good at one or more sports. 1 2 3 4 5 4. I know what I would like to be when I am an adult. 1 2 3 4 5 5. I know which college I would like to attend. 1 2 3 4 5 6. I would rather sleep than go out with my friends. 1 2 3 4 5 7. My friends think I am passive. 1 2 3 4 5 8. I like to argue/debate about the topics which are
important to me. 1 2 3 4 5
9. I am an ambitious person. 1 2 3 4 5 10. I don’t care if I skip a day of school or a class. 1 2 3 4 5 11. I am a disruptive person. 1 2 3 4 5 12. I am a creative, imaginative person. 1 2 3 4 5 13. I can make a difference in terms of: changing school
policies, affecting social and political issues. 1 2 3 4 5
14. I think that I am smart. 1 2 3 4 5 15. I have difficulty making decisions. 1 2 3 4 5 16. I would enjoy being on an athletic team. 1 2 3 4 5 17. I like reading (books, magazines, comics, etc.) 1 2 3 4 5
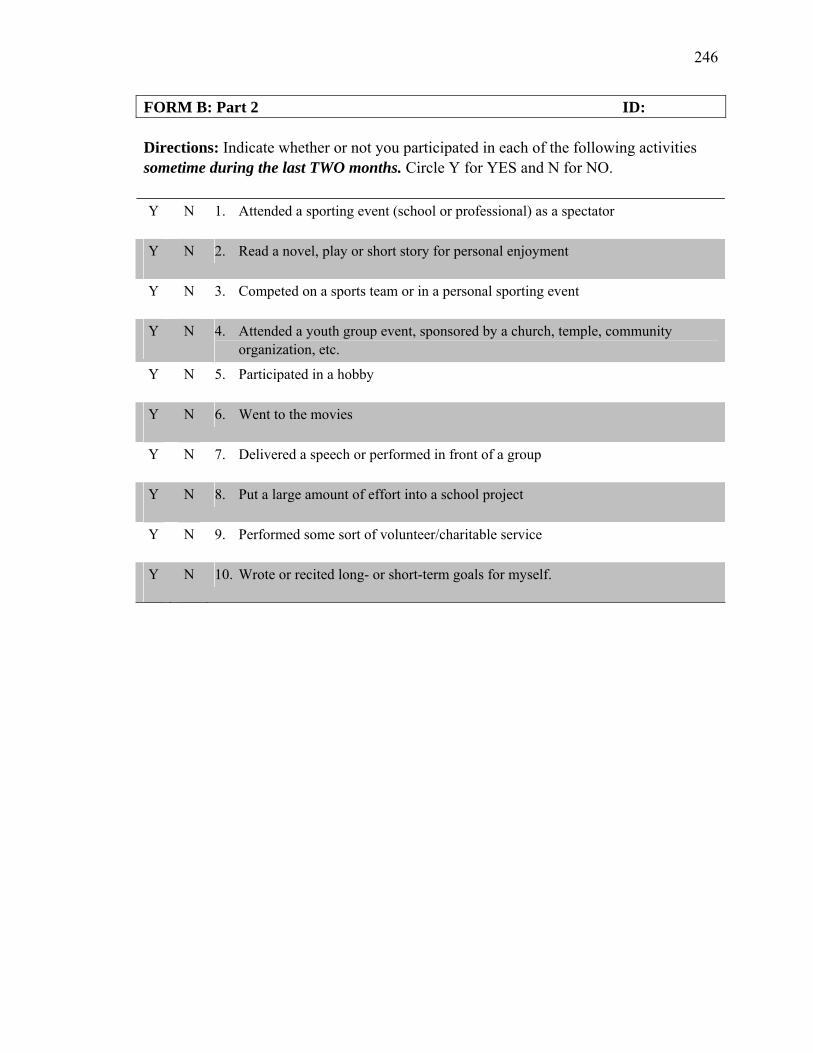
246
FORM B: Part 2 ID: Directions: Indicate whether or not you participated in each of the following activities sometime during the last TWO months. Circle Y for YES and N for NO. Y N 1. Attended a sporting event (school or professional) as a spectator
Y N 2. Read a novel, play or short story for personal enjoyment
Y N 3. Competed on a sports team or in a personal sporting event
Y N 4. Attended a youth group event, sponsored by a church, temple, community organization, etc.
Y N 5. Participated in a hobby
Y N 6. Went to the movies
Y N 7. Delivered a speech or performed in front of a group
Y N 8. Put a large amount of effort into a school project
Y N 9. Performed some sort of volunteer/charitable service
Y N 10. Wrote or recited long- or short-term goals for myself.

247
Appendix C
Apathy Evaluation Scale
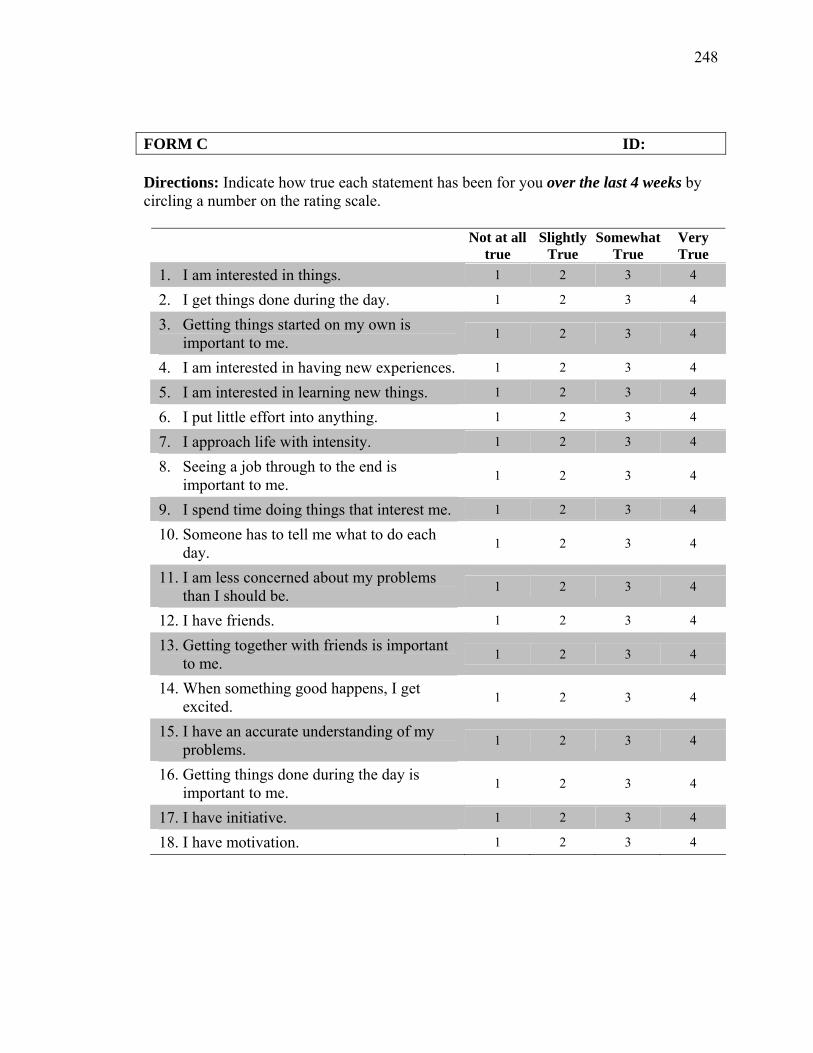
248
FORM C ID: Directions: Indicate how true each statement has been for you over the last 4 weeks by circling a number on the rating scale.
Not at all true
Slightly True
Somewhat True
Very True
1. I am interested in things. 1 2 3 4
2. I get things done during the day. 1 2 3 4
3. Getting things started on my own is important to me. 1 2 3 4
4. I am interested in having new experiences. 1 2 3 4
5. I am interested in learning new things. 1 2 3 4
6. I put little effort into anything. 1 2 3 4
7. I approach life with intensity. 1 2 3 4
8. Seeing a job through to the end is important to me. 1 2 3 4
9. I spend time doing things that interest me. 1 2 3 4
10. Someone has to tell me what to do each day. 1 2 3 4
11. I am less concerned about my problems than I should be. 1 2 3 4
12. I have friends. 1 2 3 4
13. Getting together with friends is important to me. 1 2 3 4
14. When something good happens, I get excited. 1 2 3 4
15. I have an accurate understanding of my problems. 1 2 3 4
16. Getting things done during the day is important to me. 1 2 3 4
17. I have initiative. 1 2 3 4
18. I have motivation. 1 2 3 4

249
Appendix D
Amotivation
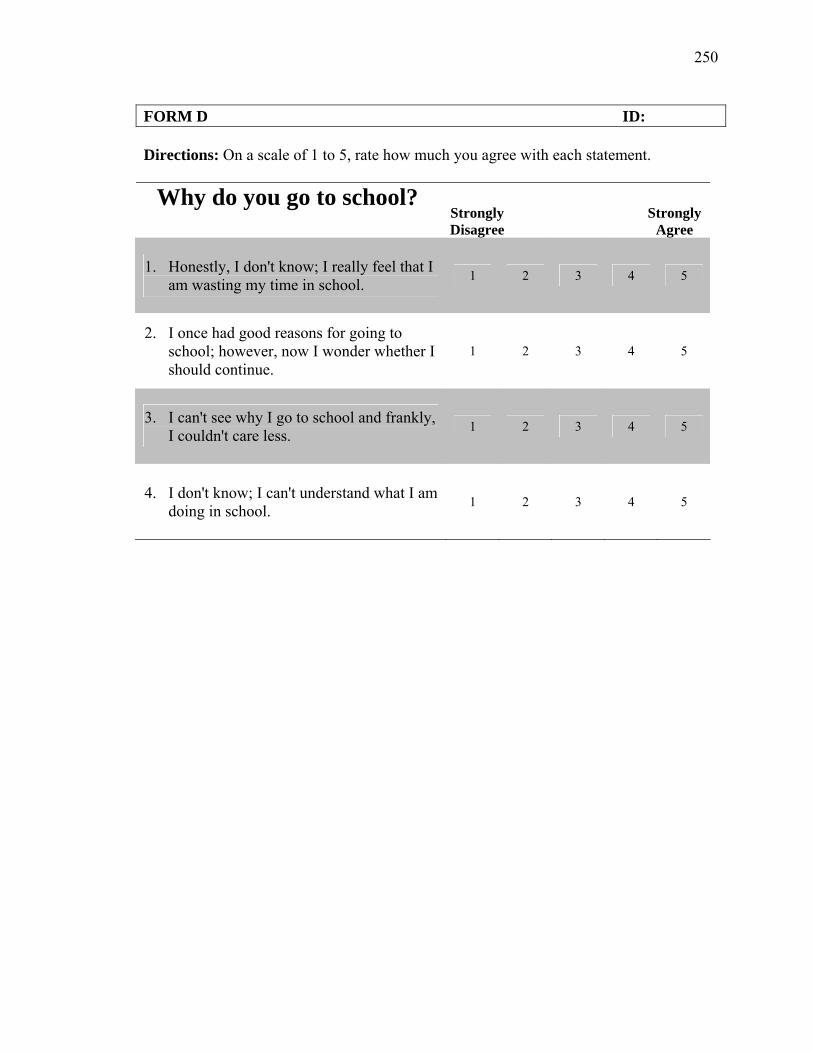
250
FORM D ID: Directions: On a scale of 1 to 5, rate how much you agree with each statement.
Why do you go to school? Strongly Disagree
Strongly Agree
1. Honestly, I don't know; I really feel that I am wasting my time in school. 1 2 3 4 5
2. I once had good reasons for going to school; however, now I wonder whether I should continue.
1 2 3 4 5
3. I can't see why I go to school and frankly, I couldn't care less. 1 2 3 4 5
4. I don't know; I can't understand what I am doing in school. 1 2 3 4 5

251
Appendix E
Work Avoidance
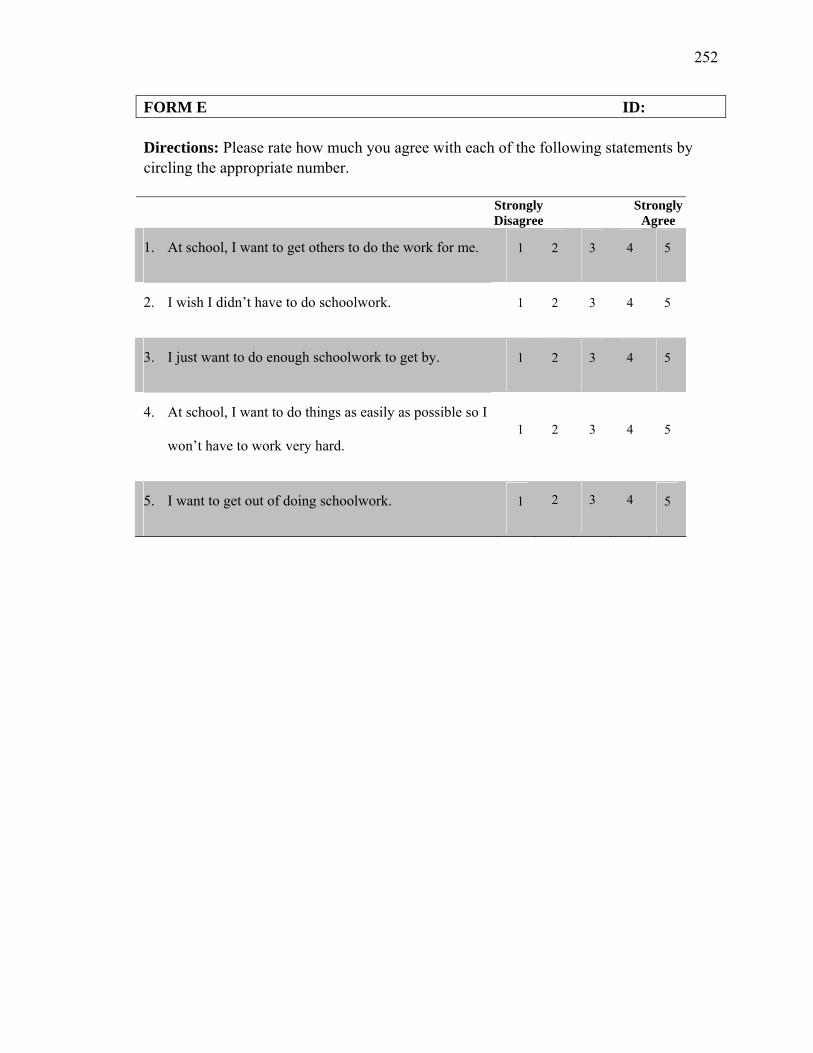
252
FORM E ID: Directions: Please rate how much you agree with each of the following statements by circling the appropriate number.
Strongly Disagree
Strongly Agree
1. At school, I want to get others to do the work for me. 1 2 3 4 5
2. I wish I didn’t have to do schoolwork. 1 2 3 4 5
3. I just want to do enough schoolwork to get by. 1 2 3 4 5
4. At school, I want to do things as easily as possible so I
won’t have to work very hard. 1 2 3 4 5
5. I want to get out of doing schoolwork. 1 2 3 4 5

253
Appendix F
Boredom Proneness Survey
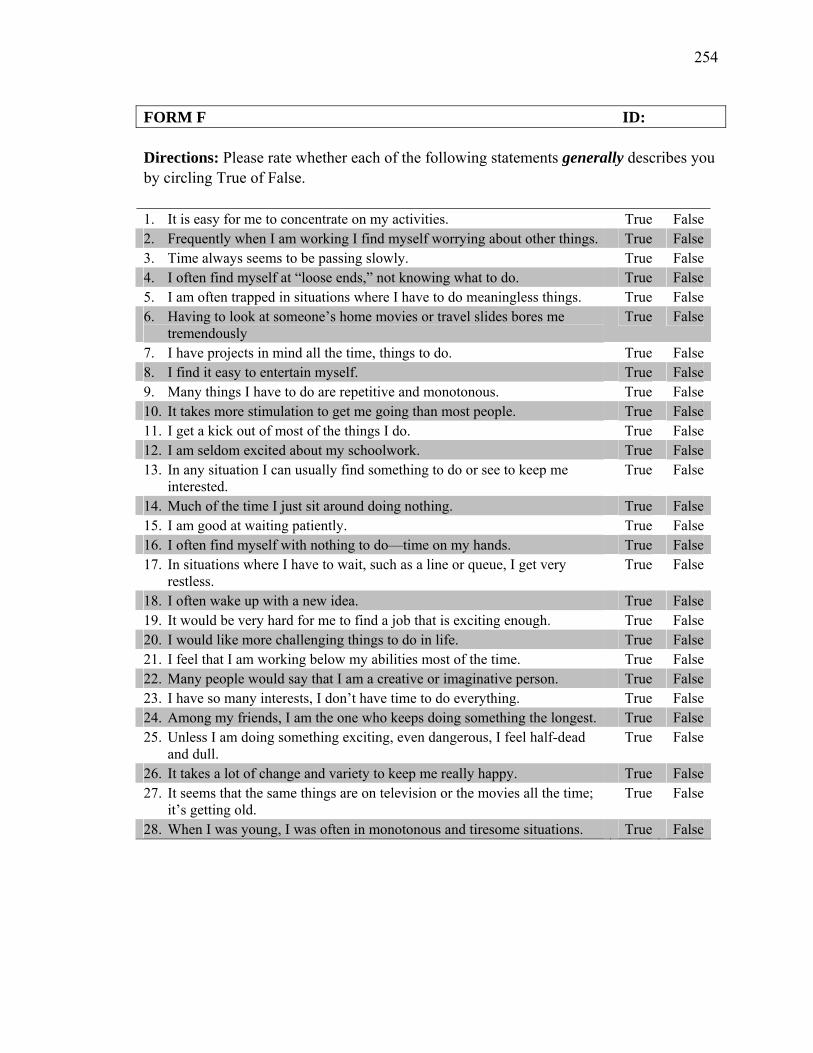
254
FORM F ID: Directions: Please rate whether each of the following statements generally describes you by circling True of False. 1. It is easy for me to concentrate on my activities. True False2. Frequently when I am working I find myself worrying about other things. True False3. Time always seems to be passing slowly. True False4. I often find myself at “loose ends,” not knowing what to do. True False5. I am often trapped in situations where I have to do meaningless things. True False6. Having to look at someone’s home movies or travel slides bores me
tremendously True False
7. I have projects in mind all the time, things to do. True False8. I find it easy to entertain myself. True False9. Many things I have to do are repetitive and monotonous. True False10. It takes more stimulation to get me going than most people. True False11. I get a kick out of most of the things I do. True False12. I am seldom excited about my schoolwork. True False13. In any situation I can usually find something to do or see to keep me
interested. True False
14. Much of the time I just sit around doing nothing. True False15. I am good at waiting patiently. True False16. I often find myself with nothing to do—time on my hands. True False17. In situations where I have to wait, such as a line or queue, I get very
restless. True False
18. I often wake up with a new idea. True False19. It would be very hard for me to find a job that is exciting enough. True False20. I would like more challenging things to do in life. True False21. I feel that I am working below my abilities most of the time. True False22. Many people would say that I am a creative or imaginative person. True False23. I have so many interests, I don’t have time to do everything. True False24. Among my friends, I am the one who keeps doing something the longest. True False25. Unless I am doing something exciting, even dangerous, I feel half-dead
and dull. True False
26. It takes a lot of change and variety to keep me really happy. True False27. It seems that the same things are on television or the movies all the time;
it’s getting old. True False
28. When I was young, I was often in monotonous and tiresome situations. True False

255
Appendix G
Disengagement
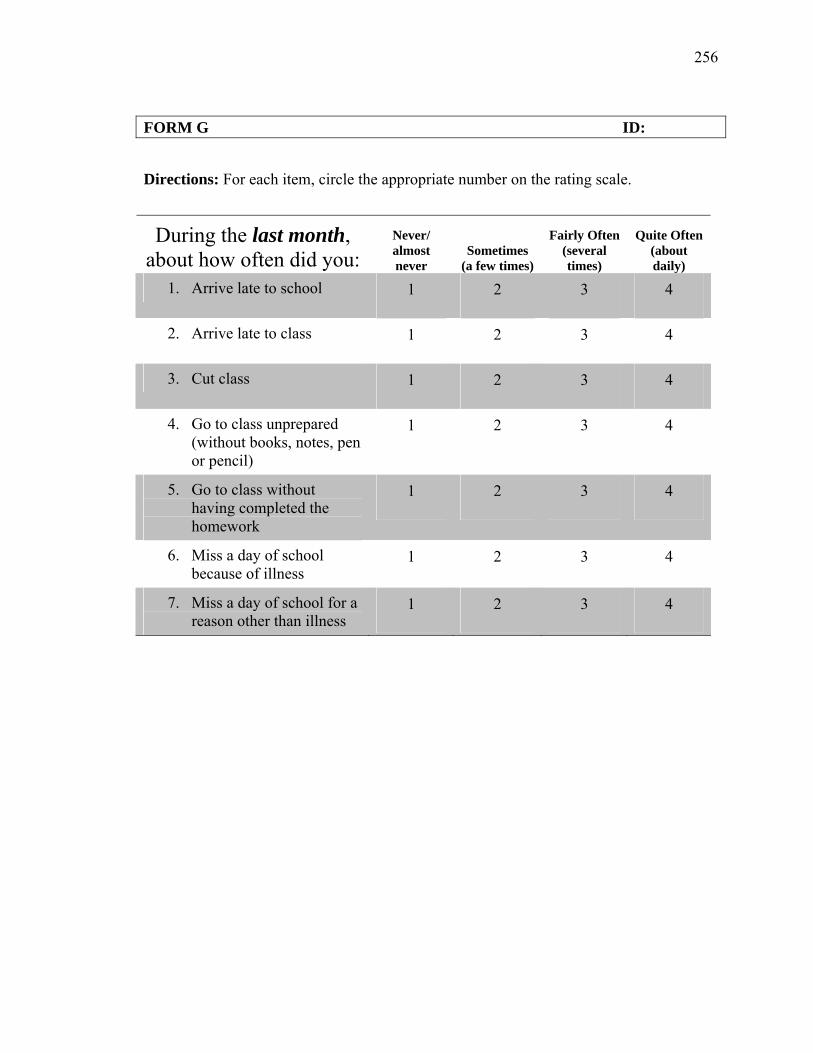
256
FORM G ID:
Directions: For each item, circle the appropriate number on the rating scale.
During the last month, about how often did you:
Never/ almost never
Sometimes (a few times)
Fairly Often (several times)
Quite Often (about daily)
1. Arrive late to school 1 2 3 4
2. Arrive late to class 1 2 3 4
3. Cut class 1 2 3 4
4. Go to class unprepared (without books, notes, pen or pencil)
1 2 3 4
5. Go to class without having completed the homework
1 2 3 4
6. Miss a day of school because of illness
1 2 3 4
7. Miss a day of school for a reason other than illness
1 2 3 4

257
Appendix H
Distress & Well-Being
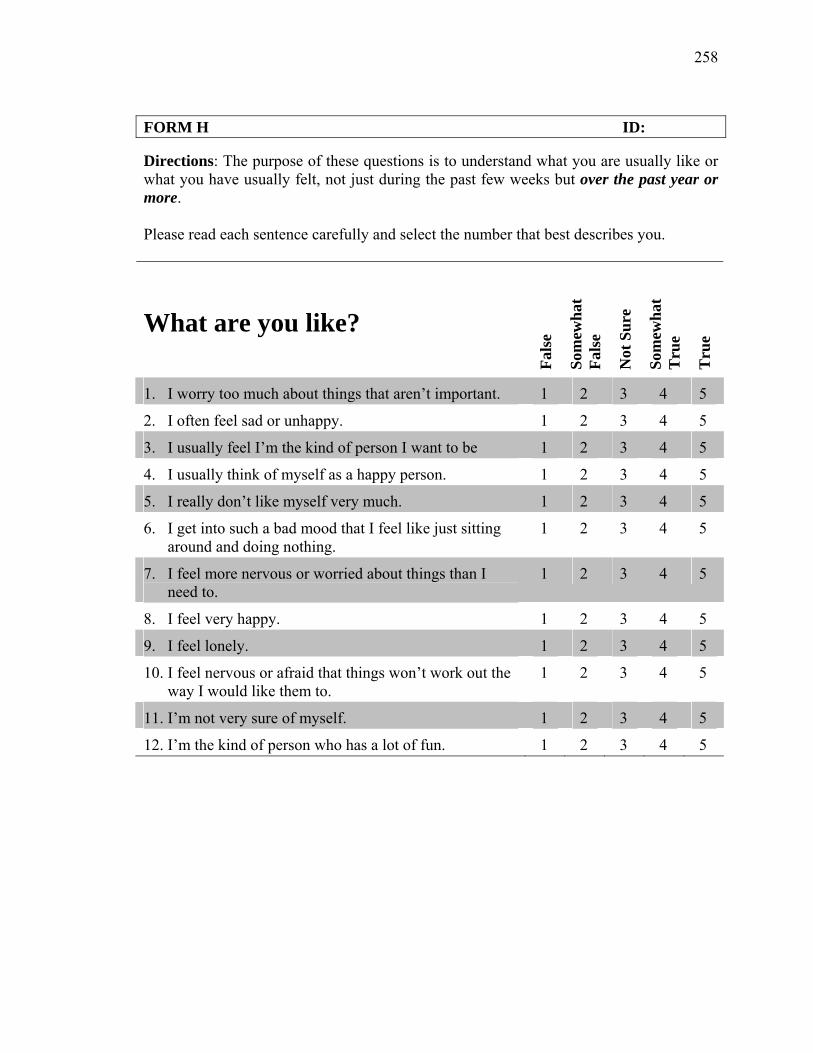
258
FORM H ID:
Directions: The purpose of these questions is to understand what you are usually like or what you have usually felt, not just during the past few weeks but over the past year or more. Please read each sentence carefully and select the number that best describes you.
What are you like?
Fals
e
Som
ewha
t Fa
lse
Not
Sur
e
Som
ewha
t T
rue
Tru
e
1. I worry too much about things that aren’t important. 1 2 3 4 5
2. I often feel sad or unhappy. 1 2 3 4 5
3. I usually feel I’m the kind of person I want to be 1 2 3 4 5
4. I usually think of myself as a happy person. 1 2 3 4 5
5. I really don’t like myself very much. 1 2 3 4 5
6. I get into such a bad mood that I feel like just sitting around and doing nothing.
1 2 3 4 5
7. I feel more nervous or worried about things than I need to.
1 2 3 4 5
8. I feel very happy. 1 2 3 4 5
9. I feel lonely. 1 2 3 4 5
10. I feel nervous or afraid that things won’t work out the way I would like them to.
1 2 3 4 5
11. I’m not very sure of myself. 1 2 3 4 5
12. I’m the kind of person who has a lot of fun. 1 2 3 4 5

259
Appendix I
Curiosity
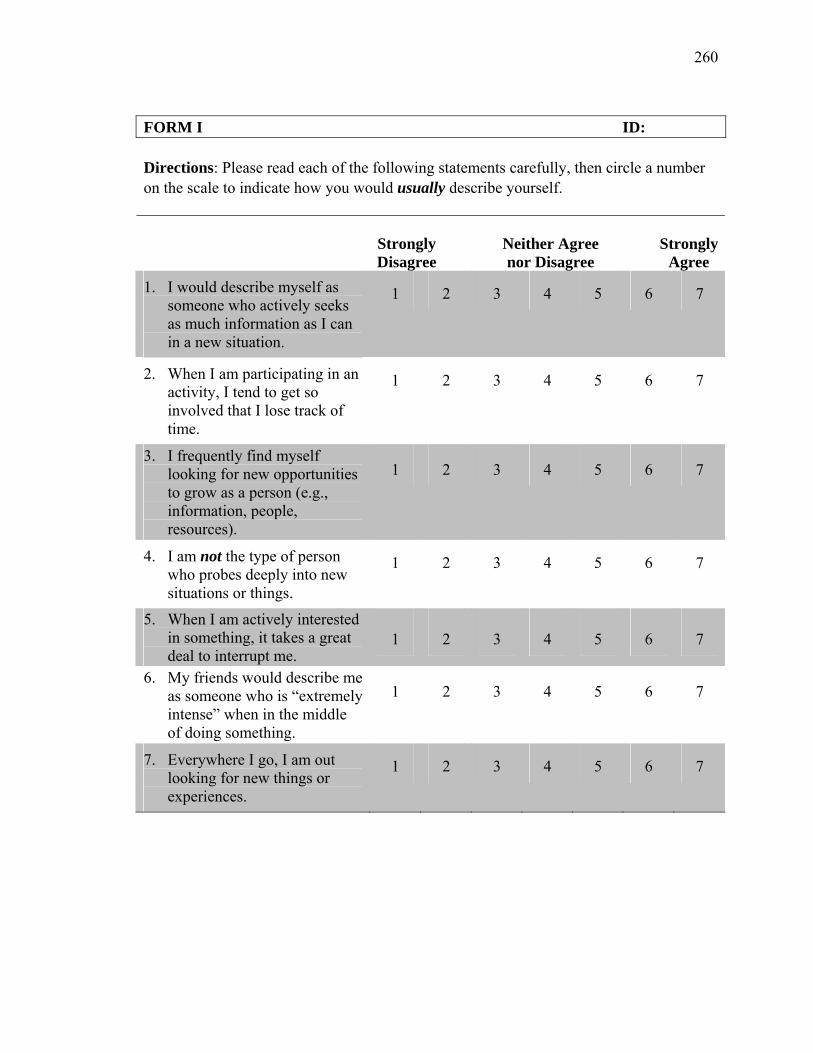
260
FORM I ID: Directions: Please read each of the following statements carefully, then circle a number on the scale to indicate how you would usually describe yourself.
StronglyDisagree
Neither Agree nor Disagree
StronglyAgree
1. I would describe myself as someone who actively seeks as much information as I can in a new situation.
1 2 3 4 5 6 7
2. When I am participating in an activity, I tend to get so involved that I lose track of time.
1 2 3 4 5 6 7
3. I frequently find myself looking for new opportunities to grow as a person (e.g., information, people, resources).
1 2 3 4 5 6 7
4. I am not the type of person who probes deeply into new situations or things.
1 2 3 4 5 6 7
5. When I am actively interested in something, it takes a great deal to interrupt me.
1 2 3 4 5 6 7
6. My friends would describe me as someone who is “extremely intense” when in the middle of doing something.
1 2 3 4 5 6 7
7. Everywhere I go, I am out looking for new things or experiences.
1 2 3 4 5 6 7

261
Appendix J
Apathy-Level Student Checklist
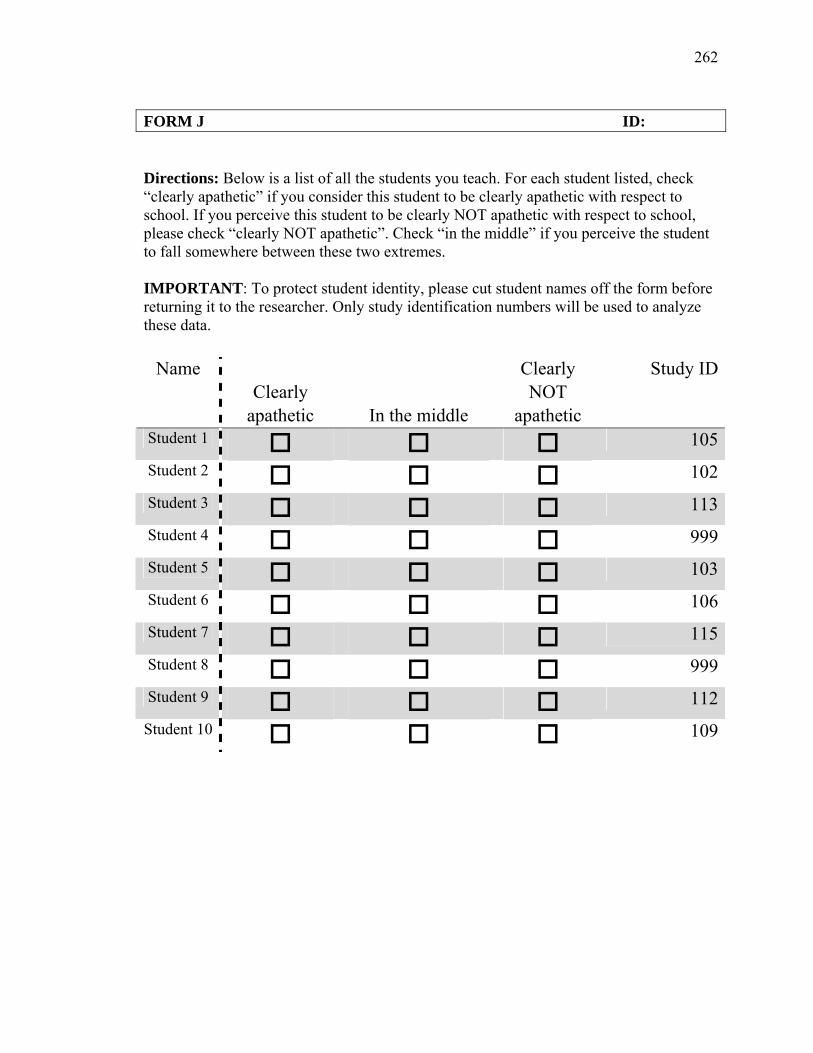
262
FORM J ID: Directions: Below is a list of all the students you teach. For each student listed, check “clearly apathetic” if you consider this student to be clearly apathetic with respect to school. If you perceive this student to be clearly NOT apathetic with respect to school, please check “clearly NOT apathetic”. Check “in the middle” if you perceive the student to fall somewhere between these two extremes. IMPORTANT: To protect student identity, please cut student names off the form before returning it to the researcher. Only study identification numbers will be used to analyze these data.
Name Clearly
apathetic In the middle
Clearly NOT
apathetic
Study ID
Student 1 105Student 2 102Student 3 113Student 4 999Student 5 103Student 6 106Student 7 115Student 8 999Student 9 112Student 10 109

263
Appendix K
Student Interview Protocol
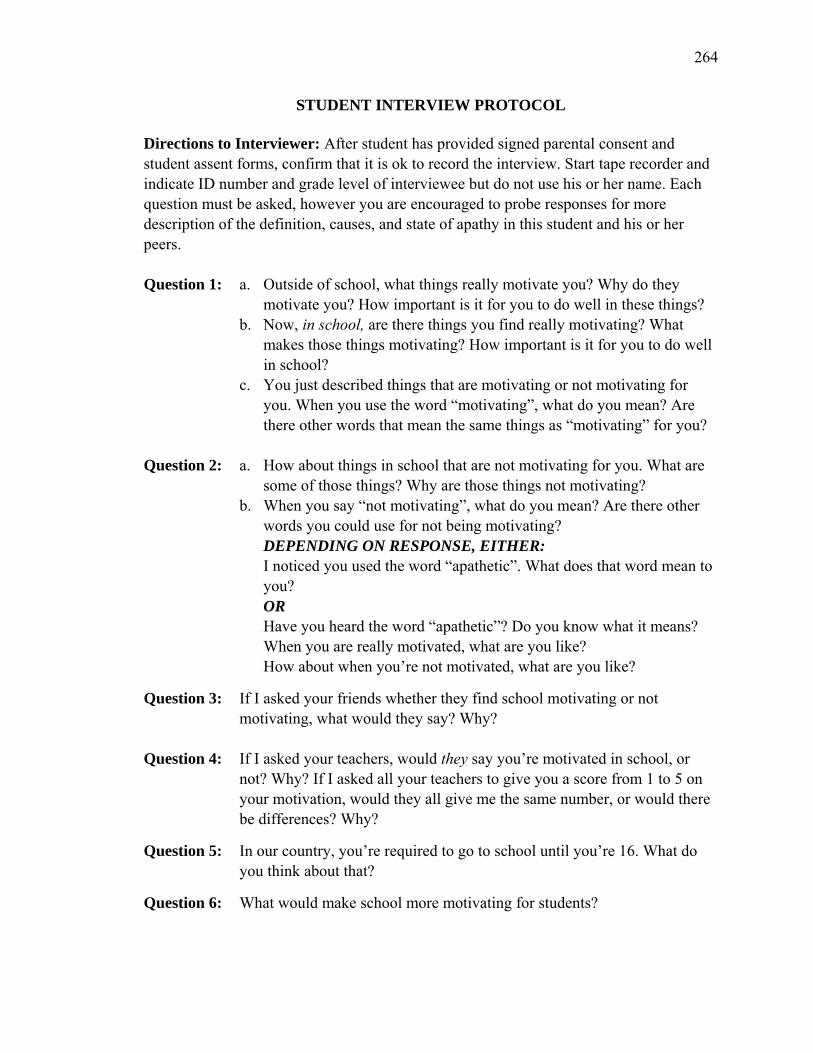
264
STUDENT INTERVIEW PROTOCOL
Directions to Interviewer: After student has provided signed parental consent and student assent forms, confirm that it is ok to record the interview. Start tape recorder and indicate ID number and grade level of interviewee but do not use his or her name. Each question must be asked, however you are encouraged to probe responses for more description of the definition, causes, and state of apathy in this student and his or her peers. Question 1: a. Outside of school, what things really motivate you? Why do they
motivate you? How important is it for you to do well in these things? b. Now, in school, are there things you find really motivating? What
makes those things motivating? How important is it for you to do well in school?
c. You just described things that are motivating or not motivating for you. When you use the word “motivating”, what do you mean? Are there other words that mean the same things as “motivating” for you?
Question 2: a. How about things in school that are not motivating for you. What are
some of those things? Why are those things not motivating? b. When you say “not motivating”, what do you mean? Are there other
words you could use for not being motivating? DEPENDING ON RESPONSE, EITHER: I noticed you used the word “apathetic”. What does that word mean to you? OR Have you heard the word “apathetic”? Do you know what it means? When you are really motivated, what are you like? How about when you’re not motivated, what are you like?
Question 3: If I asked your friends whether they find school motivating or not motivating, what would they say? Why?
Question 4: If I asked your teachers, would they say you’re motivated in school, or
not? Why? If I asked all your teachers to give you a score from 1 to 5 on your motivation, would they all give me the same number, or would there be differences? Why?
Question 5: In our country, you’re required to go to school until you’re 16. What do you think about that?
Question 6: What would make school more motivating for students?

265
Appendix L
Teacher Interview Protocol
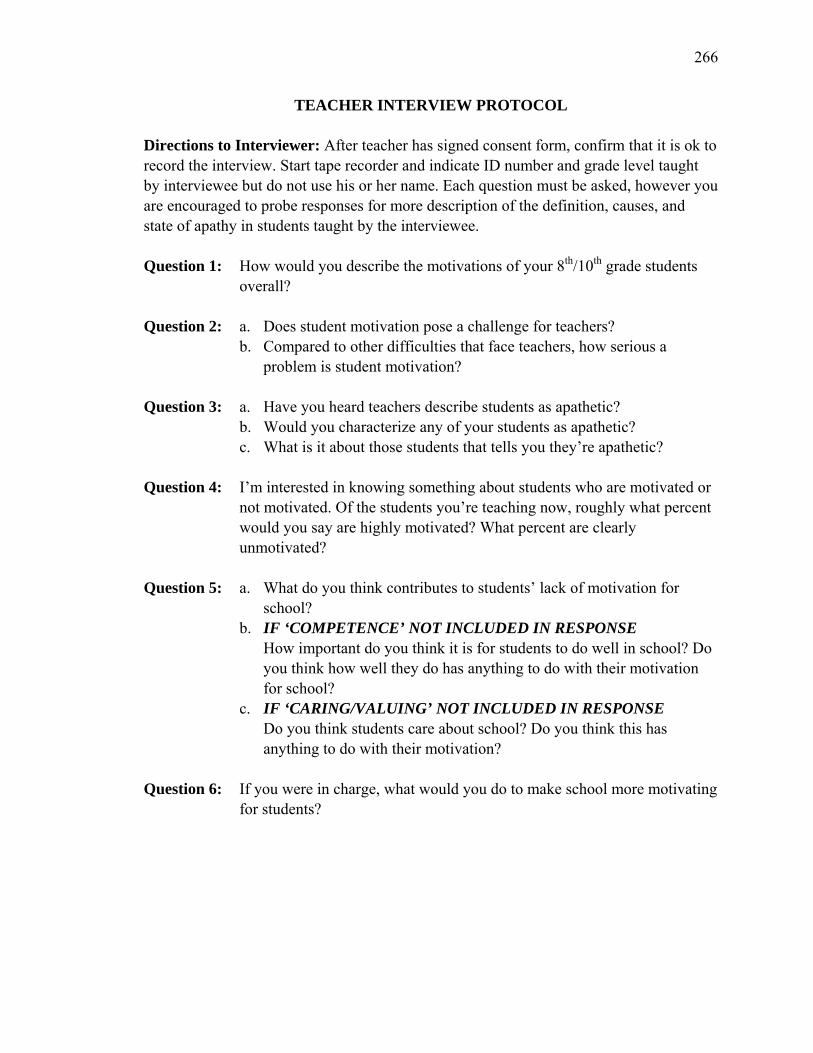
266
TEACHER INTERVIEW PROTOCOL
Directions to Interviewer: After teacher has signed consent form, confirm that it is ok to record the interview. Start tape recorder and indicate ID number and grade level taught by interviewee but do not use his or her name. Each question must be asked, however you are encouraged to probe responses for more description of the definition, causes, and state of apathy in students taught by the interviewee.
Question 1: How would you describe the motivations of your 8th/10th grade students
overall? Question 2: a. Does student motivation pose a challenge for teachers? b. Compared to other difficulties that face teachers, how serious a
problem is student motivation? Question 3: a. Have you heard teachers describe students as apathetic? b. Would you characterize any of your students as apathetic? c. What is it about those students that tells you they’re apathetic? Question 4: I’m interested in knowing something about students who are motivated or
not motivated. Of the students you’re teaching now, roughly what percent would you say are highly motivated? What percent are clearly unmotivated?
Question 5: a. What do you think contributes to students’ lack of motivation for
school? b. IF ‘COMPETENCE’ NOT INCLUDED IN RESPONSE How important do you think it is for students to do well in school? Do
you think how well they do has anything to do with their motivation for school?
c. IF ‘CARING/VALUING’ NOT INCLUDED IN RESPONSE Do you think students care about school? Do you think this has
anything to do with their motivation? Question 6: If you were in charge, what would you do to make school more motivating
for students?

267
Appendix M
Informed Consent and Assent Forms
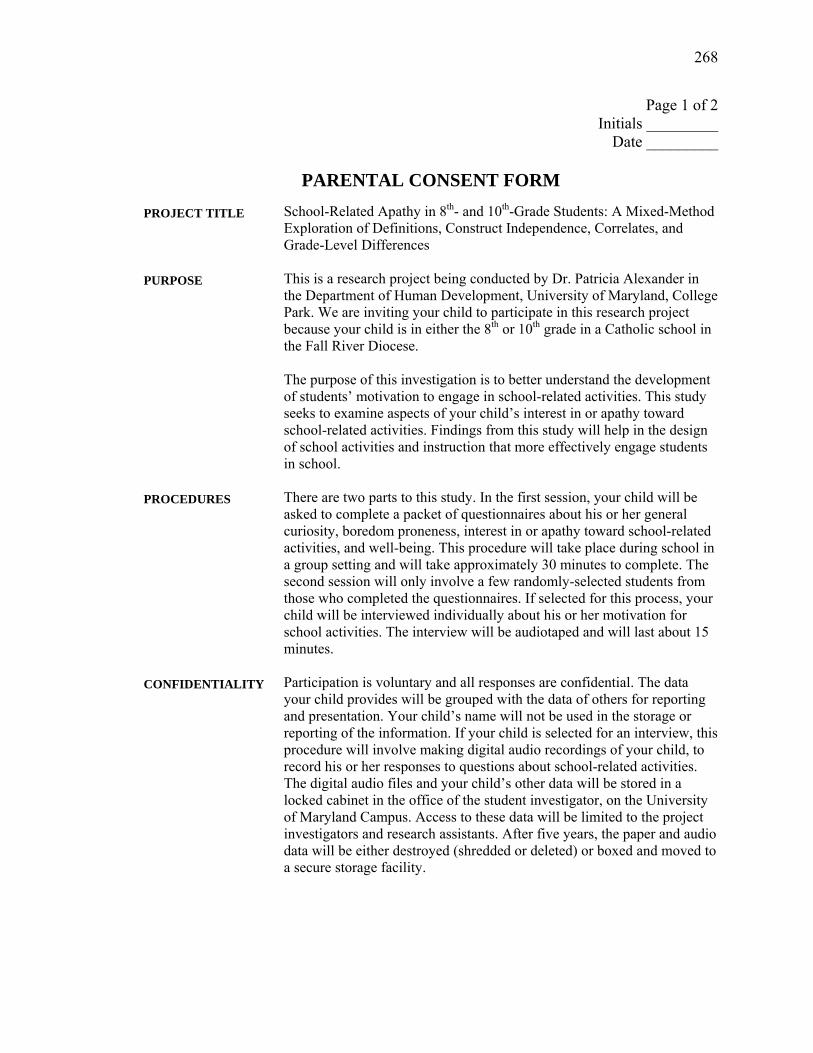
268
Page 1 of 2 Initials _________
Date _________
PARENTAL CONSENT FORM
PROJECT TITLE School-Related Apathy in 8th- and 10th-Grade Students: A Mixed-Method Exploration of Definitions, Construct Independence, Correlates, and Grade-Level Differences
PURPOSE This is a research project being conducted by Dr. Patricia Alexander in the Department of Human Development, University of Maryland, College Park. We are inviting your child to participate in this research project because your child is in either the 8th or 10th grade in a Catholic school in the Fall River Diocese. The purpose of this investigation is to better understand the development of students’ motivation to engage in school-related activities. This study seeks to examine aspects of your child’s interest in or apathy toward school-related activities. Findings from this study will help in the design of school activities and instruction that more effectively engage students in school.
PROCEDURES There are two parts to this study. In the first session, your child will be asked to complete a packet of questionnaires about his or her general curiosity, boredom proneness, interest in or apathy toward school-related activities, and well-being. This procedure will take place during school in a group setting and will take approximately 30 minutes to complete. The second session will only involve a few randomly-selected students from those who completed the questionnaires. If selected for this process, your child will be interviewed individually about his or her motivation for school activities. The interview will be audiotaped and will last about 15 minutes.
CONFIDENTIALITY
Participation is voluntary and all responses are confidential. The data your child provides will be grouped with the data of others for reporting and presentation. Your child’s name will not be used in the storage or reporting of the information. If your child is selected for an interview, this procedure will involve making digital audio recordings of your child, to record his or her responses to questions about school-related activities. The digital audio files and your child’s other data will be stored in a locked cabinet in the office of the student investigator, on the University of Maryland Campus. Access to these data will be limited to the project investigators and research assistants. After five years, the paper and audio data will be either destroyed (shredded or deleted) or boxed and moved to a secure storage facility.
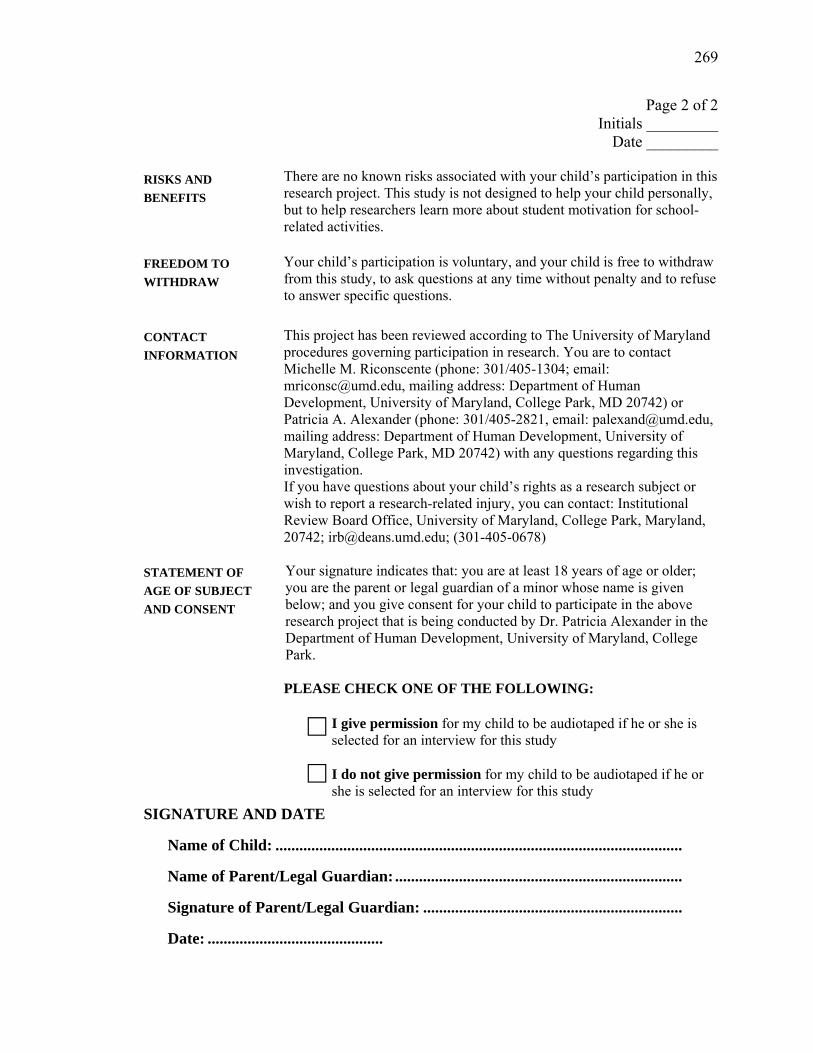
269
RISKS AND BENEFITS
Page 2 of 2 Initials _________
Date _________
There are no known risks associated with your child’s participation in this research project. This study is not designed to help your child personally, but to help researchers learn more about student motivation for school-related activities.
FREEDOM TO WITHDRAW
Your child’s participation is voluntary, and your child is free to withdraw from this study, to ask questions at any time without penalty and to refuse to answer specific questions.
CONTACT INFORMATION
This project has been reviewed according to The University of Maryland procedures governing participation in research. You are to contact Michelle M. Riconscente (phone: 301/405-1304; email: [email protected], mailing address: Department of Human Development, University of Maryland, College Park, MD 20742) or Patricia A. Alexander (phone: 301/405-2821, email: [email protected], mailing address: Department of Human Development, University of Maryland, College Park, MD 20742) with any questions regarding this investigation. If you have questions about your child’s rights as a research subject or wish to report a research-related injury, you can contact: Institutional Review Board Office, University of Maryland, College Park, Maryland, 20742; [email protected]; (301-405-0678)
STATEMENT OF AGE OF SUBJECT AND CONSENT
Your signature indicates that: you are at least 18 years of age or older; you are the parent or legal guardian of a minor whose name is given below; and you give consent for your child to participate in the above research project that is being conducted by Dr. Patricia Alexander in the Department of Human Development, University of Maryland, College Park. PLEASE CHECK ONE OF THE FOLLOWING:
I give permission for my child to be audiotaped if he or she is selected for an interview for this study
I do not give permission for my child to be audiotaped if he or she is selected for an interview for this study
SIGNATURE AND DATE
Name of Child: ......................................................................................................
Name of Parent/Legal Guardian: ........................................................................
Signature of Parent/Legal Guardian: .................................................................
Date: ............................................
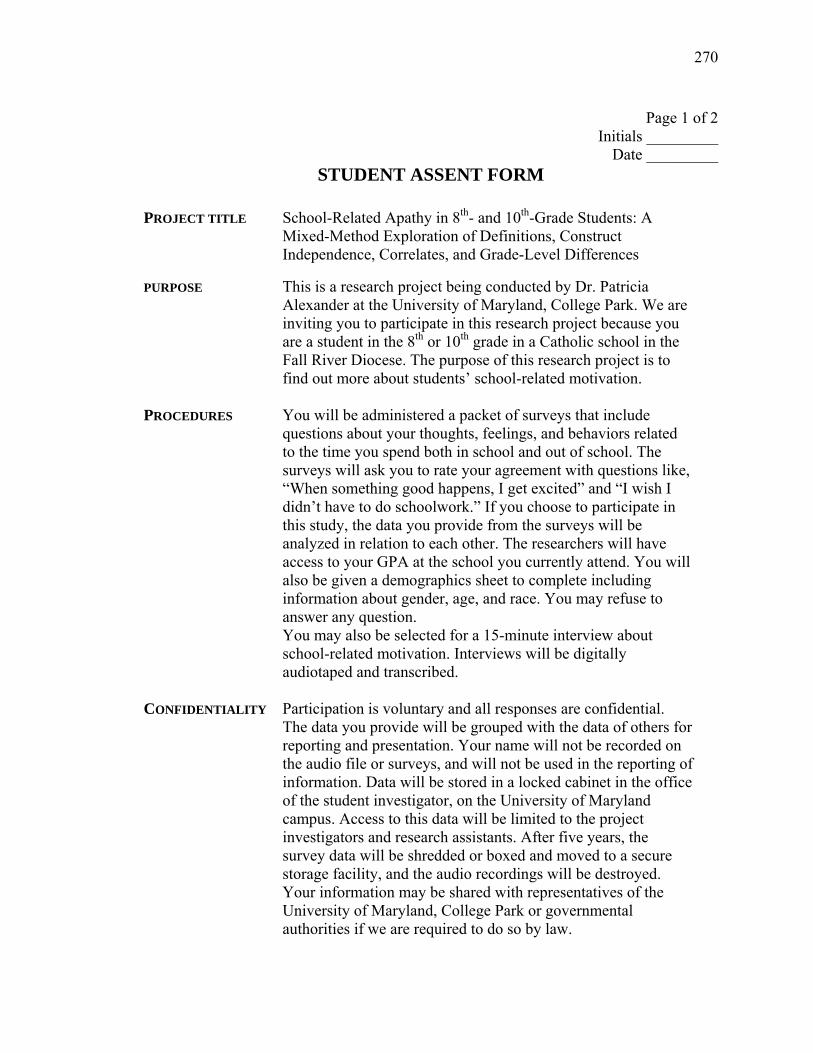
270
Page 1 of 2 Initials _________
Date _________ STUDENT ASSENT FORM
PROJECT TITLE School-Related Apathy in 8th- and 10th-Grade Students: A
Mixed-Method Exploration of Definitions, Construct Independence, Correlates, and Grade-Level Differences
PURPOSE This is a research project being conducted by Dr. Patricia Alexander at the University of Maryland, College Park. We are inviting you to participate in this research project because you are a student in the 8th or 10th grade in a Catholic school in the Fall River Diocese. The purpose of this research project is to find out more about students’ school-related motivation.
PROCEDURES You will be administered a packet of surveys that include questions about your thoughts, feelings, and behaviors related to the time you spend both in school and out of school. The surveys will ask you to rate your agreement with questions like, “When something good happens, I get excited” and “I wish I didn’t have to do schoolwork.” If you choose to participate in this study, the data you provide from the surveys will be analyzed in relation to each other. The researchers will have access to your GPA at the school you currently attend. You will also be given a demographics sheet to complete including information about gender, age, and race. You may refuse to answer any question. You may also be selected for a 15-minute interview about school-related motivation. Interviews will be digitally audiotaped and transcribed.
CONFIDENTIALITY
Participation is voluntary and all responses are confidential. The data you provide will be grouped with the data of others for reporting and presentation. Your name will not be recorded on the audio file or surveys, and will not be used in the reporting of information. Data will be stored in a locked cabinet in the office of the student investigator, on the University of Maryland campus. Access to this data will be limited to the project investigators and research assistants. After five years, the survey data will be shredded or boxed and moved to a secure storage facility, and the audio recordings will be destroyed. Your information may be shared with representatives of the University of Maryland, College Park or governmental authorities if we are required to do so by law.
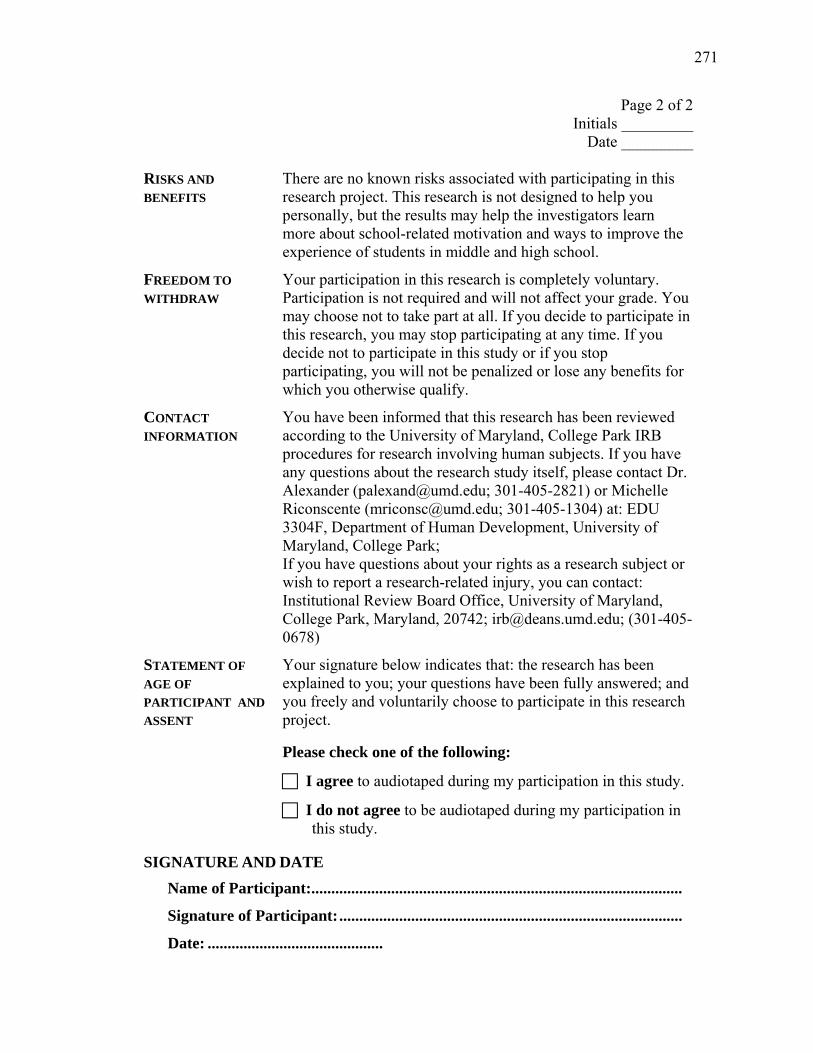
271
Page 2 of 2 Initials _________
Date _________
RISKS AND BENEFITS
There are no known risks associated with participating in this research project. This research is not designed to help you personally, but the results may help the investigators learn more about school-related motivation and ways to improve the experience of students in middle and high school.
FREEDOM TO WITHDRAW
Your participation in this research is completely voluntary. Participation is not required and will not affect your grade. You may choose not to take part at all. If you decide to participate in this research, you may stop participating at any time. If you decide not to participate in this study or if you stop participating, you will not be penalized or lose any benefits for which you otherwise qualify.
CONTACT INFORMATION
You have been informed that this research has been reviewed according to the University of Maryland, College Park IRB procedures for research involving human subjects. If you have any questions about the research study itself, please contact Dr. Alexander ([email protected]; 301-405-2821) or Michelle Riconscente ([email protected]; 301-405-1304) at: EDU 3304F, Department of Human Development, University of Maryland, College Park; If you have questions about your rights as a research subject or wish to report a research-related injury, you can contact: Institutional Review Board Office, University of Maryland, College Park, Maryland, 20742; [email protected]; (301-405-0678)
STATEMENT OF AGE OF PARTICIPANT AND ASSENT
Your signature below indicates that: the research has been explained to you; your questions have been fully answered; and you freely and voluntarily choose to participate in this research project. Please check one of the following:
I agree to audiotaped during my participation in this study.
I do not agree to be audiotaped during my participation in this study.
SIGNATURE AND DATE
Name of Participant:.............................................................................................
Signature of Participant:......................................................................................
Date: ............................................
272
Page 1 of 2 Initials _________
Date _________
TEACHERS’ INFORMED CONSENT FORM
PROJECT TITLE School-Related Apathy in 8th- and 10th-Grade Students: A Mixed-Method Exploration of Definitions, Construct Independence, Correlates, and Grade-Level Differences
PURPOSE This is a research project being conducted by Dr. Patricia Alexander at the University of Maryland, College Park. We are inviting you to participate in this research project because you teach students in the 8th or 10th grade in a Catholic school in the Fall River Diocese. The purpose of this research project is to find out more about students’ school-related motivation.
PROCEDURES You will complete a short demographics form and a student apathetic/non-apathetic checklist. You will then be individually interviewed for 30 minutes at your school. The interview includes questions like, “Would you characterize some of your students as apathetic?” and “What do you think can be done to improve student motivation for school?” Your interview will be digitally audiotaped and transcribed.
CONFIDENTIALITY
Participation is voluntary and all responses are confidential. The data you provide will be grouped with the data of others for reporting and presentation. Your name will not be used in the storage or reporting of information. Data will be stored in a locked cabinet in the office of the student investigator, on the University of Maryland campus. Access to this data will be limited to the project investigators and research assistants. After five years, the data will be shredded or boxed and moved to a secure storage facility. Your information may be shared with representatives of the University of Maryland, College Park or governmental authorities if we are required to do so by law.
RISKS AND BENEFITS
There are no known risks associated with participating in this research project. The results from this study may help the investigators learn more about school-related motivation and ways to improve the experience of students in middle and high school. So that you may personally benefit from participation in this study, you will be invited to a round-table discussion at the conclusion of the study in which the results are presented and your feedback is sought to better understand these results. In addition, recommendations for classroom practice based on the study results will be shared and discussed.
273
Page 2 of 2
Initials _________ Date _________
FREEDOM TO WITHDRAW
Your participation in this research is completely voluntary. If you decide to participate in this research, you may stop participating at any time. If you decide not to participate in this study or if you stop participating at any time, you will not be penalized or lose any benefits for which you otherwise qualify.
CONTACT INFORMATION
You have been informed that this research has been reviewed according to the University of Maryland, College Park IRB procedures for research involving human subjects. If you have any questions about the research study itself, you can contact Dr. Alexander ([email protected]; 301-405-2821) or Michelle Riconscente ([email protected]; 301-405-1304) at: EDU 3304F, Department of Human Development, University of Maryland, College Park; If you have questions about your rights as a research subject or wish to report a research-related injury, you can contact: Institutional Review Board Office, University of Maryland, College Park, Maryland, 20742; [email protected]; (301-405-0678)
Statement of Age of Subject and Consent
Your signature below indicates that: You are at least 18 years of age; the research has been explained to you; your questions have been fully answered; and you freely and voluntarily choose to participate in this research project.
Please check one of the following:
I agree to audiotaped during my participation in this study.
I do not agree to be audiotaped during my participation in this study.
SIGNATURE AND DATE
Name of Participant:.............................................................................................
Signature of Participant:......................................................................................
Date: ............................................
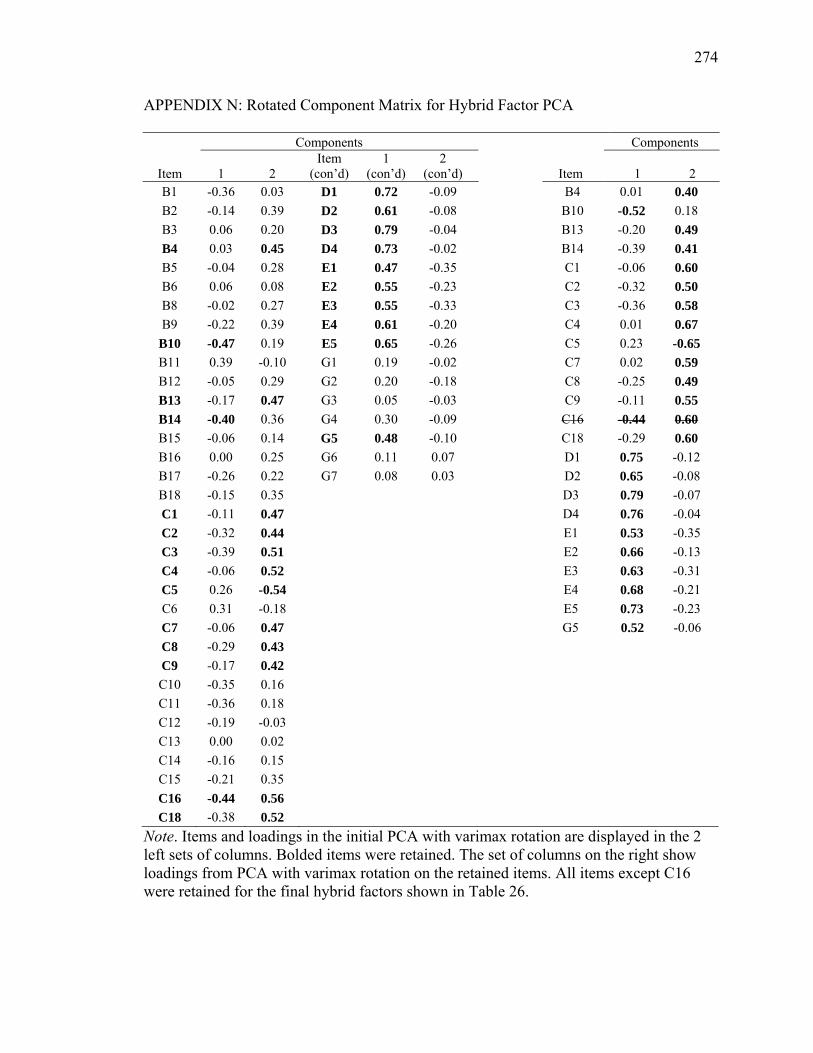
274
APPENDIX N: Rotated Component Matrix for Hybrid Factor PCA
Components Components
Item 1 2 Item
(con’d) 1
(con’d) 2
(con’d) Item 1 2 B1 -0.36 0.03 D1 0.72 -0.09 B4 0.01 0.40 B2 -0.14 0.39 D2 0.61 -0.08 B10 -0.52 0.18 B3 0.06 0.20 D3 0.79 -0.04 B13 -0.20 0.49 B4 0.03 0.45 D4 0.73 -0.02 B14 -0.39 0.41 B5 -0.04 0.28 E1 0.47 -0.35 C1 -0.06 0.60 B6 0.06 0.08 E2 0.55 -0.23 C2 -0.32 0.50 B8 -0.02 0.27 E3 0.55 -0.33 C3 -0.36 0.58 B9 -0.22 0.39 E4 0.61 -0.20 C4 0.01 0.67
B10 -0.47 0.19 E5 0.65 -0.26 C5 0.23 -0.65 B11 0.39 -0.10 G1 0.19 -0.02 C7 0.02 0.59 B12 -0.05 0.29 G2 0.20 -0.18 C8 -0.25 0.49 B13 -0.17 0.47 G3 0.05 -0.03 C9 -0.11 0.55 B14 -0.40 0.36 G4 0.30 -0.09 C16 -0.44 0.60 B15 -0.06 0.14 G5 0.48 -0.10 C18 -0.29 0.60 B16 0.00 0.25 G6 0.11 0.07 D1 0.75 -0.12 B17 -0.26 0.22 G7 0.08 0.03 D2 0.65 -0.08 B18 -0.15 0.35 D3 0.79 -0.07 C1 -0.11 0.47 D4 0.76 -0.04 C2 -0.32 0.44 E1 0.53 -0.35 C3 -0.39 0.51 E2 0.66 -0.13 C4 -0.06 0.52 E3 0.63 -0.31 C5 0.26 -0.54 E4 0.68 -0.21 C6 0.31 -0.18 E5 0.73 -0.23 C7 -0.06 0.47 G5 0.52 -0.06 C8 -0.29 0.43 C9 -0.17 0.42 C10 -0.35 0.16 C11 -0.36 0.18 C12 -0.19 -0.03 C13 0.00 0.02 C14 -0.16 0.15 C15 -0.21 0.35 C16 -0.44 0.56 C18 -0.38 0.52
Note. Items and loadings in the initial PCA with varimax rotation are displayed in the 2 left sets of columns. Bolded items were retained. The set of columns on the right show loadings from PCA with varimax rotation on the retained items. All items except C16 were retained for the final hybrid factors shown in Table 26.
275
References
Albaili, Mohamed A. (1998). Goal orientations, cognitive strategies, and academic
achievement among United Arab Emirates college students. Educational
Psychology, 18(2), 195-203.
Alexander, K. L., Entwisle, D. R., & Kabbani, N. S. (2001). The dropout process
in life course perspective: Early risk factors at home and school. Teachers
College Record, 103, 760-822.
Alloy, L. B., & Seligman, M. E. P. (1979). On the cognitive component of learned
helplessness and depression. The Journal of Learning and Motivation, 13,
219-276.
Ames, C., & Archer, J. (1988). Achievement goals in the classroom: Students'
learning strategies and motivation processes. Journal of Educational
Psychology, 80(3), 260-267.
Arendt, H. (1981). The life of the mind. New York: Harcourt Brace & Company.
Arendt, H. (1958). The human condition. Chicago: University of Chicago Press.
Atkinson, J. W., & Reitman, W. R. (1956). Performance as a function of motive
strength and expectancy of goal-attainment. Journal of Abnormal and
Social Psychology, 53, 361-366.
Bachman, J. G., Safron, D. J., & Sy, S. R., & Schulenberg, J. E. (2003). Wishing
to work: New perspectives on how adolescents' part-time work intensity is
linked to educational disengagement, substance use, and other problem
behaviours. International Journal of Behavioral Development, 27, 301-
315.
276
Baldwin, C. K., & Caldwell, L. L. (2003). Development of the Free Time
Motivation Scale for Adolescents. Journal of Leisure Research, 35, 129-
151.
Barber, B. K. & Olsen, J. A. (2004). Assessing the transitions to middle and high
school. Journal of Adolescent Research, 19(1), 3-30.
Bartlett, R. C. (2003). Souls without longing. The Public Interest, 150, 101-114.
Baumrind, D. (1971). Current patterns of parental authority. Developmental
Psychology Monograph, 4(1, Part 2), 1-103.
Berlyne, D. (1954). An experimental study of human curiosity. British Journal of
Psychology, 45, 256-265.
Bernstein, I. H., Teng, G. (1989). Factoring items and factoring scales are
different: Spurious evidence for multidimensionality due to item
categorization. Psychological Bulletin, 105, 467-477.
Black, S. (2003). Engaging the disengaged. American School Board Journal,
190(12), 58-60, 71.
Boekaerts, M., & Boscolo, P. (2002). Interest in learning, learning to be
interested. Learning and Instruction, 12(4), 375-382.
Boggiano, A. K., Shields, A., Barrett, M., Kellam, T., Thompson, E., Simons, J.,
et al. (1992). Helplessness deficits in students: The role of motivational
orientation. Motivation & Emotion, 16, 271-296.
Brewster, A. B. & Bowen, G. L. (2004). Teacher support and the school
engagement of Latino middle and high school students at risk of school
failure. Child and Adolescent Social Work Journal, 21(1), 47-67.
277
Brophy, J. (1983). Conceptualizing student motivation. Educational Psychologist,
18, 200-215.
Brophy, J. E. (2004). Motivating students to learn. New York: McGraw-Hill.
Bryman, A. (2006). Integrating quantitative and qualitative research. Qualitative
Research, 6(1), 97-113.
Burhans, K. K., & Dweck, C. S. (1995). Helplessness in early childhood: The role
of contingent worth. Child Development, 66, 1719-1738.
Campbell, D. T., & Fiske, D. W. (1959). Convergent and discriminant validation
by the multitrait-multimethod matrix. Psychological Bulletin, 56(2), 81-
105.
Chickering, A. W., McDowell, J., & Campagna, D. (1969). Institutional
differences and student development. Journal of Educational Psychology,
60(4), 315-326.
Clarke, S. G., & Haworth, J. T. (1994). ‘Flow’ experience in the daily lives of
sixth-form college students. British Journal of Psychology, 85, 511-523.
Cobb, P., Wood, T., Yackel, E., Nicholls, J. G., Wheatley, G., Trigatti, B., et
al.(1991). Assessment of a problem-centered second-grade mathematics
project. Journal of Research in Mathematics Education, 22, 3-29.
Coffield, K. E. (1981). Student apathy: A comparative study. Teaching of
Psychology, 8(1), 26-28.
Coffield, K. E., & Buckalew, L. W. (1986). Student apathy: An analysis of
relevant variables. College Student Journal, 20(2), 211-214.
Cohen, J. (1992). A power primer. Psychological Bulletin, 112(1), 155-159.
278
Cohen, J. (1988). Statistical power analysis for the behavioral sciences (2nd ed.).
Hillsdale, NJ: Lawrence Erlbaum.
Cokley, K. O. (2000). Examining the validity of the Academic Motivation Scale
by comparing scale construction to self-determination theory.
Psychological Reports, 86(2), 560-564.
Corno, L. (1993). The best-laid plans: Modern conceptions of volition and
educational research. Educational Researcher, 22(2), 14-22.
Corno, L. (2004). Work habits and work styles: Volition in education. Teachers
College Record, 106, 1669-1694.
Cornog, L. (2005, January/February). Let’s blame the readers. Columbia
Journalism Review, 43(5), 43-49.
Crocker, L., & Algina, J. (1986). Introduction to classical and modern test theory. New
York: Harcourt Brace Jovanovich.
Crumbaugh, J. C. (1968). Cross-validation of Purpose in Life Test based on
Frankl's concepts. Journal of Individual Psychology, 24(1), 74-81.
Crumbaugh, J. C., & Maholick, L. T. (1964). An experimental study in
existsentialism: The psychometric approach to Frankl's concept of
onogenic neurosis. Journal of Clinical Psychology, 20, 200-207.
Csikszentmihalyi, M. (1990). Flow. New York: HarperPerennial.
Csikszentmihalyi, M., & Nakamura, J. (1989). The dynamics of intrinsic
motivation: A study of adolescents. In C. Ames & R. Ames (Eds.),
Research on motivation in education: Vol. 3. Goals and cognitions (pp.
45-72). New York: Academic Press.
279
Cummings, J. L., Mega, M., Gray, K., Rosenberg-Thompson, S., Carusi, D. A., &
Gornbein, J. (1994). The Neuropsychiatric Inventory: Comprehensive
assessment of psychopathology in dementia. Neurology, 44, 2308-2314.
Davidson, W. B., Beck, H. P., & Silver, N. C. (1999). Development and
validation of scores on a measure of six academic orientations in college
students. Educational & Psychological Measurement, 59(4), 678-693.
Day, H. (1968). Role of specific curiosity in school achievement. Journal of
Educational Psychology, 59(1), 37-43.
Deci, E. L., & Ryan, R. M. (1985a). The general causality orientations scale: Self-
determination in personality. Journal of Research in Personality, 19, 109-
134.
Deci, E. L., & Ryan, R. M. (1985b). Intrinsic motivation and self-determination in
human behavior. New York: Plenum.
Deci, E. L., & Ryan, R. M. (2000). The “what” and “why” of goal pursuits:
Human needs and the self-determination of behavior. Psychological
Inquiry, 11, 227-268.
Delle Fave, A., & Bassi, M. (2000). The quality of experience in adolescents'
daily lives: Developmental perspectives. Genetic, Social, & General
Psychology Monographs, 126(3), 347-367.
Dowson, M., & McInerney, D. M. (2001). Psychological parameters of students' social
and work avoidance goals: A qualitative investigation. Journal of Educational
Psychology, 93(1), 35-42.
280
Dresel, M. (2001). A longitudinal analysis of Dweck's Motivation-Process-Model in the
classroom. Psychologische Beitrage, 43(1), 129-152.
DuRant, R. H., Getts, A., Cadenhead, C., Emans, S. J., & Woods, E. R. (1995). Exposure
to violence and victimization and depression, hopelessness, and purpose in life
among adolescents living in and around public housing. Developmental and
Behavioral Pediatrics, 16(4), 233-237.
Dweck, C. S., & Leggett, E. L. (1988). A social-cognitive approach to motivation
and personality. Psychological Review, 95, 256-273.
Eccles, J. S., Wigfield, A., Midgley, C, Reuman, D., MacIver, D., &. Feldlaufer, J.
(1993). Negative effects of traditional middle schools on students' motivation. The
Elementary School Journal, 93, 553-574.
Eccles, J. S., Wigfield, A., & Schiefele, U. (1998). Motivation to succeed. In W.
Damon (Series Ed.) & N. Eisenberg (Vol. Ed.), Handbook of child
psychology: Vol. 3 (5th ed., pp. 1017-1095). New York: Wiley.
Elliot, A. J., & Church, M. A. (1997). A hierarchical model of approach and
avoidance achievement motivation. Journal of Personality and Social
Psychology, 72(1), 218-232.
Elliot, A. J., & Harackiewicz, J. M. (1996). Approach and avoidance achievement goals
and intrinsic motivation: A mediational analysis. Journal of Personality and
Social Psychology, 70, 461-475.
Fallis, R. K., & Opotow, S. (2003). Are students failing school or are schools
failing students? Class cutting in high school. Journal of Social Issues, 59,
103-119.
281
Farmer, R., & Sundberg, N. D. (1986). Boredom proneness—The development
and correlates of a new scale. Journal of Personality Assessment, 50(1), 4-
17.
Feuer, L. S. (1962). What is alienation? The career of a concept. New Politics,
1(3).
Fincham, F. D., Hokoda, A., & Sanders, R. (1989). Learned helplessness, test
anxiety, and academic achievement: A longitudinal analysis. Child
Development, 60, 138-145.
Finn, J. D., & Owings, M. F. (1994). Family structure and school performance in
eighth grade. Journal of Research & Development in Education, 27(3),
176-187.
Finn, J. D. & Rock, D. A. (1997). Academic success among students at risk for
school failure. Journal of Applied Psychology, 82(2), 221-234.
Ford, M. E., & Nichols, C. W. (1987). A taxonomy of human goals and some
possible applications. In M. E. Ford, & D. H. Ford (Eds.), Humans as self-
constructing living systems: Putting the framework to work (pp. 289-311).
Hillsdale, NJ: Lawrence Erlbaum.
Frankl, V. E. (1962). Man’s search for meaning: An introduction to logotherapy
(I. Lasch, Trans.) (Rev. Ed.). Boston: Beacon Press. (Original work
published 1946)
Fraser, B. J. (1986). Classroom environment. Dover, New Hampshire: Croom
Helm.
Fraser, B. J., Anderson, G. J., & Walberg, H. J. (1982). Learning Environment
282
Inventory.
Fredricks, J. A., Blumenfeld, P. C., & Paris, A. H. (2004). School engagement:
Potential of the concept, state of the evidence. Review of Educational
Research, 74, 59-109.
Friedman, M. (1993). Replacing academic apathy with joy of learning through an
intrinsic, integrated language approach for middle school students. (Report
No. CS-508091). Ed.D. Practicum; Florida, USA Nova University. (ERIC
Document Reproduction Service No. ED 355 564)
Furtak, R. A. (2003). Thoreau’s emotional stoicism. The Journal of Speculative
Philosophy, 17(2), 122-132.
Gillock, K. L. & Reyes, O. (1996). High school transition-related changes in urban
minority students’ academic performance and perceptions of self and school
environment. Journal of Community Psychology, 24(3), 245-261.
Giussani, L. (1997). The religious sense (J. Zucchi, Trans.). Montreal, Canada: McGill-
Queens University Press. (Original work published 1998)
Giussani, L. (2000). L’autocoscienza del cosmo [The self-awareness of the cosmos].
Milan, Italy: Biblioteca Universale Rizzoli.
Giussani, L. (2001). The risk of education (R. M. G. Frongia, Trans.). New York:
Crossroad. (Original work published 1995)
Goslin, D. A. (2003). Engaging minds: Motivation and learning in America’s
schools. Lanham, MD: The Scarecrow Press.
283
Gottfried, A. E., Fleming, J. S., & Gottfried, A. W. (2001). Continuity of academic intrinsic
motivation from childhood through late adolescence: A longitudinal study. Journal of
Educational Psychology, 93, 3-13.
Gouick, J., & Gentleman, D. (2004). The emotional and behavioural
consequences of traumatic brain injury. Trauma, 6, 285-292.
Green, J. L. & McClelland, M. (1999). What difference does the difference make?
Understanding difference across perspectives. Discourse Processes, 27(2),
219-230.
Guadagnoli, E., & Velicer, W. F. (1988). Relation of sample size to the stability
of component patterns. Psychological Bulletin, 103(2), 265-275.
Guay, F., Vallerand, R. J., & Blanchard, C. (2000). On the assessment of
situational intrinsic and extrinsic motivation: The Situational Motivation
Scale (SIMS). Motivation & Emotion, 24, 175-213.
Handelman, R. (1999). Defining and assessing adolescent apathy. Dissertation
Abstracts International, 60(1), 407B. (UMI No. 9917660)
Harackiewicz, J. M., Barron, K. E., Carter, S. M., Lehto, A. T., & Elliot, A. J.
(1997). Predictors and consequences of achievement goals in the college
classroom: Maintaining interest and making the grade. Journal of
Personality and Social Psychology, 73, 1284-1295.
Harris, M. B. (2000). Correlates and characteristics of boredom proneness and
boredom. Journal of Applied Social Psychology, 30, 576-598.
Harter, S. (1998). The development of self-representations. In W. Damon (Series
Ed.) & N. Eisenberg (Vol. Ed.), Handbook of child psychology: Vol 3.
284
Social, emotional, and personality development (5th ed., pp. 553-617).
New York: Wiley.
Haslinger, J., Kelly, P., & O’Hare, L. (1996, September). Countering
absenteeism, anonymity, and apathy. Educational Leadership, 47-49.
Haworth, J. T., & Evans, S. (1995). Challenge, skill, and positive subjective states
in the daily life of YTS students. Journal of Occupational and
Organizational Psychology, 68, 109-121.
Hunter, J. P., & Csikszentmihalyi, M. (2003). The positive psychology of
interested adolescents. Journal of Youth and Adolescence, 32(1), 27-35.
Isakson, K. & Jarvis, P. (1999). The adjustment of adolescents during the
transition into high school: A short-term longitudinal study. Journal of
Youth and Adolescence, 28(1), 1-26.
Jacoby, R. (1999). The end of utopia: Politics and culture in an age of apathy.
New York: Basic Books.
Johnson, R. (1996). Maria Zambrano’s theory of literature as knowledge and
contingency. Hispania, 79(2), 215-221.
Kashdan, T. B., & Roberts, J. E. (2004). Trait and state curiosity in the genesis of
intimacy: Diffentiation from related constructs. Journal of Social & Clinical
Psychology, 23(6), 792-816.
Kashdan, T., Rose, P., & Fincham, F. D. (2004). Curiosity and exploration: Facilitating
positive subjective experiences and personal growth opportunities. Journal of
Personality Assessment, 82(3), 291-305.
285
Kennon, M., Sheldon, K. M., Ryan, R. M., Deci, E. L., & Kasser, T. (2004). The
independent effects of goal contents and motives on well-being: It’s both what
you pursue and why you pursue it. Personality and Social Psychology Bulletin,
30(4), 475-486.
Kimberlee, R. H. (2002). Why don’t British young people vote at general
elections. Journal of Youth Studies, 5(1), 85-98.
King, B. M., & Minium, E. M. (2003). Statistical reasoning in psychology and
education (4th ed.). Hoboken, NJ: John Wiley & Sons.
Koestner, R., & Zuckerman, M. (1994). Causality orientations, failure, and
achievement. Journal of Personality, 62, 321-346.
Konradt, U., Filip, R., & Hoffmann, S. (2003). Flow experience and positive
affect during hypermedia learning. British Journal of Educational
Technology, 34(3), 309-327.
Kreitler, S., Zigler, D., & Kreitler, H. (1984). Curiosity and demographic factors
as determinants of children's probability-learning strategies. Journal of
Genetic Psychology, 145(1), 61-75.
Lacourse, E., Villeneuve, M., & Claes, M. (2003). Theoretical structure of
adolescent alienation: A multigroup confirmatory factor analysis.
Adolescence, 38(152), 639-650.
Larson, R., & Csikszentmihalyi, M. (1978). Experiential correlates of time alone
in adolescents. Journal of Adolescence, 46(4), 677-693.
Larson, R. W., & Csikszentmihalyi, M. (1983). The experience sampling method.
San Francisco: Jossey-Bass.
286
Larson, R. W., & Richards, M. H. (1991). Boredom in the middle school years:
Blaming schools versus blaming students. American Journal of Education,
99, 418-443.
Lau, S., Thorkildsen, T. A., Nicholls, J. G., & Patashnick, M. (2000). Chinese and
American adolescents’ perceptions of the purposes of education and
beliefs about the world of work. Social Behavior and Personality, 28(1),
73-90.
Lee, F. K., Sheldon, K. M., & Turban, D. B. (2003). Personality and the goal-
striving process: The influence of achievement goal patterns, goal level
and mental focus on performance and enjoyment. Journal of Applied
Psychology, 88(2), 256-265.
Leung, P. W. L., Kwan, K. S. F., & Kim, S. F. (1998). Parenting styles,
motivational orientations, and self-perceived academic competence: A
mediational model. Merrill-Palmer Quarterly, 44(1), 1-19.
Litman, J. A. (2005). Curiosity and the pleasures of learning: Wanting and liking
new information. Cognition & Emotion, 19(6), 793-814.
Määttä, S., Stattin, H., & Nurmi, J. (2002). Achievement strategies at school:
Types and correlates. Journal of Adolescence, 25(1), 31-46.
Marin, R. S. (1990). Differential diagnosis and classification of apathy. American
Journal of Psychiatry, 147(1), 22-30.
Marin, R. S., (1991). Apathy: A neuropsychiatric syndrome. Journal of
Neuropsychiatry, 3(3), 243-254.
Marin, R. S. (1997a). Apathy—who cares? An introduction to apathy and related
287
disorders of diminished motivation. Psychiatric Annals, 27(1), 18-23.
Marin, R. S. (1997b). Differential diagnosis of apathy and related disorders of
diminished motivation. Psychiatric Annals, 27(1), 30-33.
Marin, R. S., Biedrzycki, R. C., & Firinciogullari, S. (1991). Reliability and
validity of the Apathy Evaluation Scale. Psychiatry Research, 38(2), 143-
162.
Marin, R. C., Fogel, B. S., Hawkins, J., Duffy, J., & Krupp, B. (1995). Apathy: A
treatable syndrome. Journal of Neuropsychiatry, 7(1), 23-30.
Marsh, H. W., Craven, R., & Debus, R. (1998). Structure, stability, and
development of young children’s self-concepts: A multicohort-
multioccasion study. Child Development, 69, 1030-1053.
Mau, R. Y., (1992). The validity and devolution of a concept: Student alienation.
Adolescence, 27, 731-741.
McPartland, J., Balfanz, R., Jordan, W., & Legters, N. (1998). Improving climate
and achievement in a troubled urban high school through the Talent
Development Model. Journal of Education for Students Placed at Risk,
3(4), 337-361.
Meece, J. L., Blumenfeld, P. C., & Hoyle, R. (1988). Students' goal orientations
and cognitive engagement in classroom activities. Journal of Educational
Psychology, 80, 514-523.
Meece, J. L., & Holt, K. (1993). A pattern analysis of students’ achievement
goals. Journal of Educational Psychology, 85, 582-590.
288
Meece, J. L., & Miller, S. D. (1999). Changes in elementary school children’s
achievement goals for reading and writing: Results of a longitudinal and an
intervention study. Scientific Studies of Reading, 3(3), 207-229.
Meece, J. L., & Miller, S. D. (2001). A longitudinal analysis of elementary school
students’ achievement goals in literacy activities. Contemporary Educational
Psychology, 26, 454-480.
Meece, J. L., Wigfield, A., & Eccles, J. S. (1990). Predictors of math anxiety and its
consequences for young adolescents' course enrollment intentions and performances in
mathematics. Journal of Educational Psychology, 82, 60-70.
Middleton, M. J.. & Midgley, C. (1997). Avoiding demonstration of lack of
ability: An underexplored aspect of goal theory. Journal of Educational
Psychology, 89, 710-718.
Mikulas, W. L., & Vodanovich, S. J. (1993). The essence of boredom.
Psychological Record, 43(1), 3-12.
Miles, M. B., & Huberman, A. M. (1994). Qualitative data analysis. Thousand
Oaks, CA: Sage.
Moneta, G. B., & Csikszentmihalyi, M. (1996). The effect of perceived challenges
and skills on the quality of subjective experience. Journal of Personality,
64(2), 275-310.
Moneta, G. B., & Csikszentmihalyi, M. (1999). Models of concentration in
natural environments: A comparative approach based on streams of
experiential data. Social Behavior and Personality, 27(6), 603-638.
Murdock. T. B., Anderman, L. H., & Hodge, S. A. (2000). Middle-grade
289
predictors of students’ motivation and behavior in high school. Journal of
Adolescent Research, 15(3), 327-351.
National Association of Secondary School Principals & The Carnegie Foundation
for the Advancement of Teaching. (1996). Breaking ranks: Changing an
American institution. Reston, VA: Author.
National Research Council and the Institute of Medicine. (2004). Engaging
schools: Fostering high school students’ motivation to learn. Committee
on Increasing High School Students’ Engagement and Motivation to
Learn. Board on Children, Youth, and Families, Division of Behavioral
and Social Sciences and Education. Washington, DC: The National
Academies Press.
Neber, H., & Schommer-Aikins, M. (2002). Self-regulated science learning with highly
gifted students: The role of cognitive, motivational, epistemological, and
environmental variables. High Ability Studies, 13(1), 59-74.
Newman, B. M., Lohman, B. J., Newman, P. R., Myers, M. C., & Smith, V. L. (2000).
Experiences of urban youth navigating the transition to ninth grade. Youth &
Society, 31(4), 387 - 416.
Nicholls, J. G., Patashnick, M., & Nolen, S. B. (1985). Adolescents’ theories of
education. Journal of Educational Psychology, 77, 683-692.
Noels, K. A., Pelletier, L. G., Clement, R., & Vallerand, R. J. (2003). Why are
you learning a second language? Motivational orientations and self-
determination theory. Language Learning, 53, 33-64.
Nolen, S. B. (1988). Reasons for studying: Motivational orientations and study
290
strategies. Cognition and Instruction, 5, 269-287.
Obradovic, J., van Dulmen, M. H., Yates, T. M., Carlson, E. A., & Egeland, B. (2006).
Developmental assessment of competence from early childhood to middle
adolescence. Journal of Adolescence, 29(6), 857-889.
Otis, N., Grouzet, F. M. E., & Pelletier, L. G. (2005). Latent motivational change in an
academic setting: A 3-year longitudinal study. Journal of Educational
Psychology, 97(2), 170-183.
Panter, A. T., Swygert, K. A., Dahlstrom, W. G., & Tanaka, J. S. (1997). Factor
analytic approaches to personality item-level data. Journal of Personality
Assessment, 68, 561-589.
Pellerin, L. A. (2005a). Applying Baumrind’s parenting typology to high schools: toward
a middle-range theory of authoritative socialization. Social Science Research, 34,
283-303.
Pellerin, L. A. (2005b). Student disengagement and the socialization styles of
high schools. Social Forces, 84(2), 1159-1179.
Perez, J. (1999). La razon de la sin razon: Unamuno, Machado, and Ortega in the
thought of Maria Zambrano. Hispania, 82(1), 56-67.
Peterson, C. (1992). Learned helplessness and school problems. In F. J. Medway,
& T. Cafferty (Eds.), School psychology: A social psychological
perspective (pp. 359-376). Hillsdale, NJ: Lawrence Erlbaum.
Pintrich, P. R. (2000). Multiple goals, multiple pathways: The role of goal orientation in
learning and achievement. Journal of Educational Psychology, 92, 544-555.
Pintrich, P. R., & Schunk, D. H. (1996). Motivation in education: Theory,
291
research, and applications. Englewood Cliffs, NJ: Prentice Hall.
Prewitt, M. (2005). Operators see pros, cons in online-reservations boom.
Nation’s Restaurant News, 39(9), 1, 6.
Reio, Jr., T. G., & Wiswell, A. (2000). Field investigation of the relationship
among adult curiosity, workplace learning, and job performance. Human
Resource Development Quarterly, 11(1), 5-30.
Renninger, K. A., Ewen, E., & Lasher, A. K. (2002). Individual interest as context
in expository text and mathematical word problems. Learning and
Instruction, 12, 467-491.
Reynolds, W. M. (1986). The Reynolds Adolescent Depression Scale. Odessa: FL:
Psychological Assessment Services, Inc.
Riconscente, M. M., & Maggioni, L. (2004, April). Goal orientations of students in four
countries: An international comparison. Paper presented at the annual meeting of
the American Educational Research Association, San Diego, CA.
Roderick, M. (1994). Grade retention and school dropout: Investigating the
association. American Educational Research Journal, 31, 729-759.
Roderick, M., & Camburn, E. (1999). Risk and recovery from course failure in
the early years of high school. American Educational Research Journal,
36(2), 303-343.
Roeser, R. W., Eccles, J. S., & Sameroff, A. J. (1998). Academic and emotional
functioning in early adolescence: Longitudinal relations, patterns, and
prediction by experience in middle school. Development and
Psychopathology, 10, 321–352.
292
Ryan, R. M., & Deci, E. L. (2000a). Intrinsic and extrinsic motivations: Classic
definitions and new directions. Contemporary Educational Psychology,
25, 54-67.
Ryan, R. M., & Deci, E. L. (2000b). Self-determination theory and the facilitation
of intrinsic motivation, social development, and well-being. American
Psychologist, 55(1), 68-78.
Sadker, M. P., & Sadker, D. M. (2003). Teachers, schools, and society. New
York: McGraw-Hill.
Sax, L.J., Lindholm, J. A., Astin, A.W., Korn, W.S., & Mahoney, K.M. (2001).
The American Freshman: National Norms for Fall 2001. Higher
Education Research Institute, UCLA Graduate School of Education &
Information Studies.
Schunk, D. H., (2000). Coming to terms with motivation constructs. Contemporary
Educational Psychology, 25, 116–119.
Seeman, M. (1959). On the meaning of alienation. American Sociological Review, 24(6),
783-791.
Seeman, M. (1991). Alienation and anomie. In J. P. Robinson, P. R. Shaver, & L.
S. Wrightsman (Eds.), Measures of personality and social psychological
attitudes: Vol. 1 (pp. 291-371). New York: Academic Press.
Seidman, E., Aber, J. L., Allen, L., & French, S. E. (1996). The impact of the
transition to high school on the self-esteem and perceived social context of
poor urban youth. American Journal of Community Psychology, 24(4),
489-515.
293
Seifert, T. L., O'Keefe, B. A. (2001). The relationship of work avoidance and
learning goals to perceived competence, externality and meaning. British
Journal of Educational Psychology, 71, 81-92.
Seligman, M. E. P. (1975). Helplessness: On depression, development and death.
San Francisco: Freeman.
Senécal, C., Koestner, R., & Vallerand, R. J. (1995). Self-regulation and academic
procrastination. Journal of Social Psychology, 135(5), 607-619.
Shaw, S. M., Caldwell, L. L., & Kleiber, D. A. (1996). Boredom, stress, and
social control in the daily life of adolescents. Journal of Leisure Research,
28, 274-292.
Shaw, S. M., Kleiber, D. A., & Caldwell, L. L. (1995). Leisure and identity
formation in male and female adolescents: A preliminary examination.
Journal of Leisure Research, 27, 245-263.
Sheldon, K. M., Ryan, R. M., Deci, E. L., & Kasser, T. (2004). The independent
effects of goal contents and motives on well-being: It’s both what you
pursue and why you pursue it. Personality and Social Psychology Bulletin,
30(4), 475-486.
Shepard, J. M. (1977). Technology, alienation, and job satisfaction. Annual
Review of Sociology, 3(1-21).
Sizer, N. F. (2003). Reclaiming senior year. Independent School, 62(2), 24-28.
Skaalvik, E. M. (1997). Self-enhancing and self-defeating ego orientation:
Relations with task and avoidance orientation, achievement, self-
perceptions, and anxiety. Journal of Educational Psychology, 89(1), 71-

294
81.
Smith, M., Duda, J., Allen, M., & Hall, H. (2002). Contemporary measures of
approach and avoidance goal orientations: Similarities and differences.
British Journal of Educational Psychology, 72, 155-190.
Somuncuoglu, Y., & Yildirim, A. (1999). Relationship between achievement goal
orientations and use of learning strategies. The Journal of Educational
Research, 92, 267-277.
Starkstein, S. E., Ingram, L., Garau, M. L., & Mizrahi, R. (2005). On the overlap between
apathy and depression in dementia. Journal of Neurology, Neurosurgery, and
Psychiatry, 76, 1070-1074.
Stein, W. J. (1969). Exploiting existential tension in the classroom. Teachers
College Record, 70(8), 747-753.
Stipek, D. J. (1996). Motivation and instruction. In R. C. Calfee & D. C. Berliner
(Eds.), Handbook of educational psychology (pp. 85-113). New York:
Macmillan.
Stipek, D. J. (2002). Motivation to learn: Integrating theory and practice. Boston,
MA: Allyn and Bacon.
Stoeber, J. & Rambow, A. (2007). Perfectionism in adolescent school students:
Relations with motivation, achievement, and well-being. Personality and
Individual Differences, 42, 1379-1389.
Thorkildsen, T. A. (2002). Motivation and the struggle to learn: Responding to
fractured experience. Boston, MA: Allyn and Bacon.
Thorkildsen, T. A., & Nicholls, J. G. (1998). Fifth graders’ achievement
295
orientations and beliefs: Individual and classroom differences. Journal of
Educational Psychology, 90(2), 179-201.
Thorkildsen, T. A., & Nicholls, J. G. (1991). Students’ critiques as motivation.
Educational Psychologist, 26(3 & 4), 347-368.
Toch, T. (2003a). High schools on a human scale. Beacon Press.
Toch, T. (2003b). Small schools, big ideas. Education Week, 23(14), 44, 32.
Tomback, R. (2006). Classroom contexts, self-processes, engagement, and
achievement across the transition from middle school to high school.
Unpublished doctoral dissertation, University of Maryland, College Park.
Vallerand, R. J., & Bissonnette, R. (1992). Intrinsic, extrinsic, and amotivational
styles as predictors of behavior: A prospective study. Journal of
Personality, 60(3), 599-620.
Vallerand, R. J., Pelletier, L. G., Blais, M. R., Brière, N. M., Senécal, C., &
Vallières, E. F. (1992). The Academic Motivation Scale: A measure of
intrinsic, extrinsic, and amotivation in education. Educational and
Psychological Measurement, 52, 1003-1017.
Vallerand, R. J., Pelletier, L. G., Blais, M. R., Brière, N. M., Senécal, C., &
Vallières, E. F. (1993). On the assessment of intrinsic, extrinsic, and
amotivation in education: Evidence on the concurrent and construct
validity of the Academic Motivation Scale. Educational and
Psychological Measurement, 53, 159-172.
Valkenburg, P. M., Peter, J., & Schouten, A. P. (2006). Friend networking sites
and their relationship to adolescents’ well-being and social self-esteem.
296
Cyberpsychology & Behavior, 9(5), 584-490.
Verkuyten, M., & Brug, P. (2003). Educational performance and psychological
disengagement among ethnic-minority and Dutch adolescents. Journal of
Genetic Psychology, 164(2), 189-200.
Vitaro, F., Larocque, D., Janosz, M., & Tremblay, R. E. (2001). Negative social
experiences and dropping out of school. Educational Psychology, 21(4),
401-415.
Vodanovich, S. J., & Kass, S. J. (1990). A factor analytic study of the Boredom
Proneness Scale. Journal of Personality Assessment, 55(1&2), 115-123.
Watt, J. D., & Vodanovich, S. J. (1999). Boredom proneness and psychosocial
development. Journal of Psychology: Interdisciplinary and Applied,
133(3), 303-314.
Wegner, E. L., (1975). The concept of alienation: A critique and some
suggestions for a context specific approach. Pacific Sociological Review,
18(2), 171-193.
Wehlage, G. (1989). Engagement, not remediation or higher standards. In J.
Lakebrink (Ed.), Children at risk (pp. 57-73). Springfield, IL: Charles C.
Thomas.
Weinberger, D. A. (1997). Distress and self-restraint as measures of adjustment across
the life span: Confirmatory factor analyses in clinical and nonclinical samples.
Psychological Assessment, 9(2), 132-135.
297
Weinberger, D. A. (1998). Defenses, personality structure, and development: Integrating
psychodynamic theory into a typological approach to personality. Journal of
Personality, 66, 1061-1080.
Weinberger, D. A., & Schwartz, G. E. (1990). Distress and restraint as superordinate
dimensions of self-reported adjustment: A typological perspective. Journal of
Personality, 58, 381-417.
Weinberger, D. A., Tublin, S. K., Ford, M. E., & Feldman, S. S. (1990). Preadolescents’
social-emotional adjustment and selective attrition in family research. Child
Development, 61, 1374-1386.
Wentzel, K. R. (1989). Adolescent classroom goals, standards for performance, and
academic achievement: An interactionist perspective. Journal of Educational
Psychology, 81(2), 131-142.
Wentzel, K. R. (1993). Motivation and achievement in early adolescence: The role of
multiple classroom goals. Journal of Early Adolescence, 13(1), 4-20.
Wentzel, K. R. (1994). Relations of social goal pursuit to social acceptance, classroom
behavior, and perceived social support. Journal of Educational Psychology, 86(2),
173-182.
Wentzel, K. R. (2000). What is it that I’m trying to achieve? Classroom goals from a
content perspective. Contemporary Educational Psychology, 25, 105-115.
Wentzel, K. R., Weinberger, D. A., Ford, M. E., & Feldman, S. S. (1990). Academic
achievement in preadolescence: The role of motivational, affective, and self-
regulatory processes. Journal of Applied Developmental Psychology, 11, 179-193.
298
Wigfield, A. (1994). Expectancy-value theory of achievement motivation: A
developmental perspective. Educational Psychology Review, 6(1), 49-78.
Wigfield, A., & Eccles, J. S. (2000). Expectancy-value theory of achievement
motivation. Contemporary Educational Psychology, 25, 68-81.
Wigfield, A., & Eccles, J. S. (2002). Students' motivation during the middle
school years. In J. Aronson & D. Cordova (Eds.), Improving academic
achievement: Contributions of social psychology (pp. 160-184). San
Diego, CA: Academic Press.
Williamson, I., & Cullingford, C. (1997). The uses and misuses of ‘alienation’ in
the social sciences and education. British Journal of Educational Studies,
45(3). 263-273.
Wolters, C. A. (2003). Regulation of motivation: Evaluating an underemphasized
aspect of self-regulated learning. Educational Psychology, 38(4), 189-205.
Zembylas, M. (2005, April). Three perspectives of linking the cognitive and the
emotional: Conceptual change, socio-constructivism and
poststructuralism. Paper presented at the annual meeting of the American
Educational Research Association, Montreal, Canada.


![Multidimensional Apathy: Evidence from Neurodegenerative … · 2018. 2. 12. · separate subtypes within neurodegenerative diseases: Dimensional Apathy Scale (DAS) [30]. These dimensions](https://img.pdfslide.us/doc/110x75/600fdcbf504842681322c1ba/multidimensional-apathy-evidence-from-neurodegenerative-2018-2-12-separate.jpg)