Embed Size (px)
Citation preview
ABSTRACT
Title of Dissertation: IT’S 3 P.M. DO YOU KNOW WHERE YOUR
CHILD IS OR WHAT HE/SHE IS DOING? AN
EXPLORATORY STUDY ON THE TIMING OF
JUVENILE VICTIMIZATION AND DELINQUENCY
David Alan Soulé, Doctor of Philosophy, 2003
Dissertation directed by: Professor Charles Wellford
Department of Criminology and Criminal Justice
In recent years, after-school programs have received considerable public and
policymaker support for their potential to reduce juvenile delinquency and
victimization. In large part, this support stems from a series of recent reports, which
indicated juvenile crime and victimization peaks during the after-school hours
(Snyder et al., 1996; Snyder and Sickmund, 1999). However, much of the existing
research suffers from a few key limitations.
Utilizing self-report data collected from a sample of juveniles participating in
an evaluation of after-school programs in Maryland, this study was designed to more
clearly determine the timing of juvenile victimization, delinquency, and substance use
by addressing some of the key limitations of previous research. In general, the results
of the current study present a somewhat different picture of the timing of juvenile
offending behavior. The examination of the aggregated measures indicated juvenile
victimization and delinquent was most prominent during the school hours, while
substance was elevated during the weekend.
Notably, an examination of the individual offenses revealed more variation in
the timing of juvenile victimization and delinquency. The more serious violent
offenses for both victimization (e.g. victim of an aggravated assault) and delinquency
(e.g. involvement in gang fights) were elevated during the after school hours, while
simple assaults offenses (for both victims and delinquents) were overwhelming most
prominent during school hours. This finding suggests that one undesirable side effect
of grouping youths together for schooling is an increase in simple assault crimes.
In addition, the current study revealed the greatest percentage of substance
users reported using cigarettes, smokeless tobacco, alcohol, and marijuana during the
weekend hours. However after controlling for the actual amount of time available to
use these substances in each time period, cigarette and smokeless tobacco use was
slightly more elevated during the after-school hours than during the weekend hours,
while alcohol and marijuana use were most prominent during the weekend hours. In
sum, earlier studies that either examined a single offense or aggregated crime
measures were misleading because the timing of crime varies considerably by type of
crime. Implications for policy and future research are discussed.
IT’S 3 P.M. DO YOU KNOW WHERE YOUR CHILD IS OR WHAT HE/SHEIS DOING? AN EXPLORATORY STUDY ON THE TIMING OF
JUVENILE VICTIMIZATION AND DELINQUENCY
by
David Alan Soulé
Dissertation submitted to the Faculty of the Graduate School of theUniversity of Maryland, College Park in partial fulfillment
of the requirements for the degree ofDoctor of Philosophy
2003
Advisory Committee:
Professor Charles F. Wellford, ChairProfessor Denise C. GottfredsonProfessor Gary LaFreeProfessor John LaubProfessor Peter E. Leone

ii
DEDICATION
This is dedicated to my future wife, Jenny, for her constant support and love.
Your confidence in me has never wavered and I am truly lucky to have found
someone so special.

iii
ACKNOWLEDGEMENTS
I would like to thank the members of my committee, Drs. Gary LaFree, John
Laub, and Peter Leone for their constructive critiques and generous assistance. I
would especially like to thank my chair, Dr. Charles Wellford, for his invaluable
insight, advice, and guidance. Additionally, I am grateful to Dr. Denise Gottfredson
for her generous contribution of time and guidance. Her feedback and willingness to
share research opportunities were instrumental to the completion of this dissertation.
I would also like to thank my Mom and Dad for all their support and
encouragement and I am especially thankful to my Dad and Jenny for their careful
proofreading.
iv
TABLE OF CONTENTS
LIST OF TABLES....................................................................................................... vi
LIST OF FIGURES ..................................................................................................... ix
LIST OF APPENDICES............................................................................................... x
CHAPTER 1: INTRODUCTION.................................................................................1
CHAPTER 2: REVIEW OF PREVIOUS RESEARCH ...............................................7
Patterns of Juvenile Delinquency............................................................................ 7
Patterns of Juvenile Victimization........................................................................ 10
Patterns of Juvenile Substance Use....................................................................... 13
Timing of Juvenile Delinquency, Victimization, and Substance Use .................. 15
Limitations of Previous Research ......................................................................... 25
Research Questions............................................................................................... 31
CHAPTER 3: RESEARCH METHODOLOGY ........................................................39
Data ....................................................................................................................... 39
Identification and Operationalization of Constructs ............................................. 50
Victimization................................................................................................... 50
Delinquency .................................................................................................... 52
Substance Use ................................................................................................. 54
Repeat Offenses .............................................................................................. 55
Timing of Victimization, Delinquency, and Substance Use........................... 56
v
Validity of Measures............................................................................................. 58
Plan for Analysis................................................................................................... 60
CHAPTER 4: RESULTS............................................................................................66
Timing of the Aggregate Victimization Measure ................................................. 66
Timing of the Aggregate Delinquency Measure................................................... 69
Timing of the Aggregate Substance Use Measure................................................ 71
Timing of Violent and Property Offenses............................................................. 74
Timing of Individual Offenses.............................................................................. 79
Timing of Repeat Offenses ................................................................................... 88
CHAPTER 5: DISCUSSION......................................................................................95
Summary and Discussion of Findings .................................................................. 95
Limitations of the Study...................................................................................... 102
Future Research .................................................................................................. 106
Conclusions......................................................................................................... 108
REFERENCES ..........................................................................................................142
vi
LIST OF TABLES
Table 1: Survey Response Rate for Final Sample ................................................... 112
Table 2: Demographic Characteristics, Victimization, Delinquency,
and Substance Use of MASOFP Participants and Comparison Group.............. 113
Table 3: Descriptive Statistics for Total Sample ..................................................... 114
Table 4: Descriptive Statistics of Victimization, Delinquency,
and Substance Use Aggregate Measures............................................................ 115
Table 5: Number and Percentage of Juveniles Reporting Victimization
at Any Time, by Type of Victimization ............................................................. 116
Table 6: Number and Percentage of Juveniles Reporting Delinquent Acts
at Any Time, by Type of Delinquent Act........................................................... 117
Table 7: Number and Percentage of Juveniles Reporting Substance Use
at Any Time, by Type of Substance................................................................... 118
Table 8: Number and Percentage of Juveniles Reporting Any Repeat Incident,
by Type of Offense............................................................................................. 119
Table 9: Number and Percentage of Juveniles Reporting Any Victimization,
Delinquency, or Substance Use, by Type of Offense and Time Period............. 120
Table 10: Observed Percentage Distribution of Each Type of Victimization,
by Time Period ................................................................................................... 121
Table 11: Observed Percentage Distribution of Each Type of Delinquency,
by Time Period ................................................................................................... 122
vii
Table 12: Observed Percentage Distribution of Any Substance Use,
by Time Period ................................................................................................... 123
Table 13: Percentage Incidents of Individual Violent Victimization Offenses,
by Type of Victimization and Time Period........................................................ 124
Table 14: Percentage Incidents of Individual Property Victimization Offenses,
by Type of Victimization and Time Period........................................................ 125
Table 15: Percentage Incidents of Individual Violent Delinquent Offenses,
by Type of Crime and Time Period.................................................................... 126
Table 16: Percentage Incidents of Individual Property Delinquent Offenses,
by Type of Crime and Time Period.................................................................... 127
Table 17: Percentage Incidents of Substance Use, by Type of Substance
and Time Period ................................................................................................. 128
Table 18: Number and Percentage of Juveniles Reporting Any Repeat
Victimization, Delinquency, or Substance Use, by Type of Offense
and Time Period ................................................................................................. 129
Table 19: Observed Percentage Distribution for Each Type of Repeat Offense
Category, by Time Period .................................................................................. 130
Table 20: Percentage Incidents of Individual Repeat Victimization,
by Type of Victimization and Time Period........................................................ 131
Table 21: Percentage Incidents of Individual Repeat Delinquency,
by Type of Crime and Time Period.................................................................... 132
Table 22: Percentage Incidents of Individual Repeat Substance Use,
by Type of Substance Use and Time Period ...................................................... 133
viii
Table 23: Juveniles’ Perceptions of the Timing of Minor and More Serious
Fights as Reported in Focus Group Interviews .................................................. 134
ix
LIST OF FIGURES
Figure 1: Timing of Any Victimization Standardized by Hours in Period.............. 135
Figure 2: Timing of Any Delinquency Standardized by Hours in Period ............... 136
Figure 3: Timing of Any Substance Use Standardized by Hours in Period ............ 137
x
LIST OF APPENDICES
Appendix A: Proportional Sampling Selection for MASOFP Evaluation............... 138
Appendix B: Mean Delinquency and Substance Use Scale Scores in
Two Samples, by Race, Gender, and Grade Level............................................. 139
Appendix C: Proportion of Juveniles Reporting Any Substance Use
in Past Year, by Sample and Age....................................................................... 140
Appendix D: Correlations for the Aggregate Victimization, Delinquency, and
Substance Use Measures .................................................................................... 141
1
CHAPTER 1: INTRODUCTION
Juvenile crime has been at the forefront of national public interest for several
decades. However, recent official arrest statistics from the Federal Bureau of
Investigations (FBI) Uniform Crime Reports (UCR) suggest juvenile crime has
generally declined since 1994 (Cook and Laub, 2002; Snyder, 2002). At the same
time, data from the 2001 National Crime Victimization Survey (NCVS) suggests
juvenile victimization rates experienced similar declines since 1994 (Rennison,
2002).
Despite the recent evidence of declining offending and victimization rates
for juveniles obtained from the two major U.S. crime sources (the UCR and the
NCVS), the fact remains that as a group, juveniles still have disproportionately high
rates of offending and victimization in comparison to adults. An examination of the
FBI’s UCR 2000 data reveals that relative to their composition in the general
population, juveniles were disproportionately arrested for many crimes including
burglary, robbery, vandalism, motor vehicle theft, larceny-theft, arson, disorderly
conduct, weapons offenses, and stolen property (Snyder, 2002).
A closer examination of self-report surveys reveals that juveniles are also
disproportionately involved in criminal victimizations. In 1999, NCVS data
indicated that juveniles made up approximately 14 percent of the population ages 12
and older, yet they represented about 25 percent of all persons who reported a
violent victimization in this age group (Bureau of Justice Statistics, 2001). In their
2
analysis of NCVS data from 1995 and 1996, Snyder and Sickmund (1999) reported
that rates of serious violent victimization were twice as high for juveniles, ages 12
to 17, as for adults 18 or older and rates of simple assault victimization were three
times greater for the younger age group. Additionally, the property crime
victimization rate for juveniles was greater than the adult victimization rate,
although the difference in property victimization rates was not as large as the
difference in violent victimization rates.
The evidence that juveniles as a group are disproportionately involved in
both criminal offenses and victimization relative to their composition of the total
population provides a solid rationale for a closer examination of the characteristics
related to juvenile delinquency and victimization experiences. More specifically,
there appears to be a growing concern among juvenile crime prevention advocacy
groups and researchers that juvenile involvement in delinquent activities and
victimization experiences may be related to the fact that today’s youth have
considerable amounts of unsupervised time in which they can potentially associate
with delinquent peers (Newman, Fox, Flynn, and Christeson, 2000; Wordes and
Nunez, 2002). Today’s youth may be more likely to experience longer periods
without adult supervision as more and more families require both parents or the
custodial parent in single parent families to work (National Research Council and
Institute of Medicine, 2002). Accordingly, youth who are not supervised by an
adult for extended periods of time may have an especially elevated risk for engaging
in problem behaviors. For example, Richardson and colleagues (1989) found that
eighth grade students who cared for themselves without an adult for 11 or more
3
hours per week were twice as likely to use drugs as those who were always
supervised by an adult. This finding is consistent with the previous literature on
family risk and protective factors, which has repeatedly shown that parental
supervision decreases association with delinquent peers. Considering association
with delinquent peers is one of the largest predictor of subsequent problem behavior
(Dishion, Patterson, Stoolmiller, and Skinner, 1991), the link between levels of
supervision and juvenile involvement in offending behavior appears plausible.
In order to further examine the relationship between unsupervised time and
juvenile offending and victimization patterns, researchers have begun to more
carefully examine the time of day when juveniles are likely to offend as well as the
time when they are most likely to be victimized themselves. Many juvenile crime
prevention researchers and practitioners have suggested that schools are relatively
safe domains, and therefore policy initiatives, such as after-school programs which
may provide the same supervision benefits of schools, have received considerable
public support. The intuition behind such juvenile programs is that the extension of
adult supervision beyond what is assumed during the school day, will limit
juveniles’ exposure to delinquent peers as well as the opportunities youths have to
engage in problem behaviors or become the victim of crime themselves.
A series of recent reports explored this issue further by hypothesizing that
the time many youths spend without adequate levels of adult supervision may lead
to increased levels of juvenile victimizations and crime (e.g. Snyder and Sickmund,
1999; Sickmund, Snyder, and Poe-Yamagata, 1997; Snyder, Sickmund, and Poe-
Yamagata, 1996). In partial support of this suggestion, these reports highlighted the
4
fact that official arrest records suggest juveniles commit crimes and are the victims
of crimes at different times than adults. Analyses of official crime data reported in
the FBI’s National Incident-Based Reporting System (NIBRS) indicated that
juvenile serious violent crime peaks between 2 p.m. and 6 p.m. on school days, the
hours just after school is dismissed while adult serious violent crime peaks at 11
p.m. (Snyder and Sickmund, 1999; Sickmund et al., 1997). Snyder and Sickmund
(1999) also compared the timing of juvenile violent crimes from the NIBRS data to
victimization reports from the 1996 NCVS data (Snyder and Sickmund, 1999). The
NCVS data illustrated the fact that juveniles were at the highest risk of being a
victim of a violent crime between noon and 6 p.m.
This research, which highlighted an apparent peak in juvenile crime during
the after-school hours, was widely accepted and was instrumental in solidifying
policy-maker support for prevention initiatives such as after-school programs.
However, the majority of existing research on the timing of juvenile victimizations
and delinquency is either flawed or limited. The first limitation of existing research
exploring this topic is that it mostly relies on official police data and therefore fails
to rule out the possibility that elevated levels of crime rates were due to police
behavior rather than youth behavior. Accordingly, the observed peak in juvenile
victimizations and delinquency during the after-school hours reported by previous
research may not accurately reflect the time when juveniles are most likely to offend
or become the victims of crime themselves.
The second major limitation of the existing research is that police data such
as the UCR and NIBRS are likely to underestimate the true proportion of offending
5
and victimization rates in general since many crimes are never reported to the
police. Additionally, these data are likely to minimize the amount of crime
observed during the school hours since many school crimes are handled directly by
school officials who may not report these incidents to the police (Snyder and
Sickmund, 1999).
Third, the major source of victimization reports, the NCVS, collapses all
crimes into one of four time periods. These four time periods range from 6 a.m. to
noon, noon to 6 p.m., 6 p.m. to midnight, and finally from midnight to 6 a.m.
Because the first and second time periods both include school hours, the NCVS is
unable to provide precise timing measures that differentiate between school and
non-school hours and therefore the NCVS can not provide an accurate analysis of in
school versus out of school crime. A fourth weakness of previous research includes
the lack of adequate examination of the frequency of juvenile victimization,
delinquency, and substance use behaviors relative to the time these events occur.
Finally, previous research has been limited by its focus on aggregate (mostly
violent) crimes types and therefore potentially excludes important differences
between specific crimes, such as property and substance use offenses. While
previous research has been beneficial for drawing attention to the importance of
examining the timing of juvenile victimization and crime, the limitations of this
research suggest the peak observed for these behaviors during the after-school hours
may not be entirely accurate and therefore a more detailed exploration of the timing
of specific juvenile victimization, delinquency, and substance use experiences is
warranted.
6
This study will advance our understanding of the timing of juvenile
victimization, delinquency, and substance use by carefully examining the self-
reported behaviors of a sample of 817 youth participating in the evaluation of the
Maryland After School Opportunity Fund Program (MASOFP) initiative. This
study will address the limitations of previous research discussed above by asking
juveniles specific questions about their own delinquent behavior and victimization
experiences, as well as asking youths to estimate the time of day when these
behaviors usually occurred. Furthermore, this study will expand on previous
research by including analyses on the timing of juvenile substance use experiences
and by providing a disaggregated investigation of specific crime types, which to
date have not been adequately examined. Chapter Two presents a review of the
existing literature relevant to this topic while Chapter Three details the methodology
used in this study, including a description of the data set, measures and plan for
analysis. Chapter Four presents the results of the analyses and Chapter Five
provides a discussion of the results and implications of these findings.
7
CHAPTER 2: REVIEW OF PREVIOUS RESEARCH
The following chapter reviews the literature relevant to this study. First, the
research exploring the patterns of offending by and against juveniles is discussed to
provide a background for the importance of examining juvenile problem behavior in
general. Next, a review of existing research regarding the timing of juvenile
victimization, delinquency, and substance using behaviors is provided as a point of
emphasis for the current study, followed by a discussion of the limitations of prior
research. Finally, the weaknesses of prior research are utilized to provide a
rationale for each of the individual research questions to be examined in the current
study.
Patterns of Juvenile Delinquency
Perhaps influenced by high profile cases involving juveniles who commit
violent crime against other youths, public concerns regarding juvenile delinquents
appear to have escalated. For example, a recent public interest poll indicated 62
percent of survey respondents believed juvenile crime increased in 2000 (Brooks,
Schiraldi, and Zidenberg, 2000). However, the FBI’s UCR data suggests juvenile
crime has been declining for several years. Since the peak year of juvenile arrest for
violent crimes in 1994, violent crime arrest rates have steadily decreased (Cook and
Laub, 2002) as evidenced by the 41 percent reduction in this rate from 1994 to 2000
(Snyder 2002). Arrest rates for juvenile property crime have experienced similar
8
declines (Cook and Laub, 2002). Between 1994 and 2000, the juvenile property
crime arrest rate dropped 37 percent to its’ lowest level since at least the 1960s
(Snyder, 2002).
While much of what is reported on juvenile offending is based on data
obtained from official arrest statistics such as the UCR, self-report surveys do not
always indicate the same general decline in juvenile offending as reported in the
previously discussed official arrest rate statistics. In fact, some self-report data
sources suggest higher incidence rates than those reported in official arrest statistics
such as the UCR. As stated in the 2001Report of the Surgeon General (United
States Department of Health and Human Services, 2001), an examination of
juvenile self-report data suggests violent behavior is nearly as prevalent today as it
was during the earlier violence epidemic prior to 1994. After increasing
approximately 50 percent from 1983 to 1993, the incident rate of self reported
serious assault and robbery remained essentially level through 1998 (United States
Department of Health and Human Services, 2001). The authors of the 2001
Surgeon General Report concluded that despite the observed recent decline in
juvenile lethal violence, the self-reported proportion of young people involved in
nonfatal violence has not dropped from the peak years in the mid 1990s, nor has the
proportion of students injured with a weapon at school declined significantly
(United States Department of Health and Human Services, 2001).
Another major source for juvenile crime data is the Youth Risk Behavior
Surveillance System (YRBSS). The YRBSS began in 1990 and is a national school-
based survey conducted every two years by the Centers for Diseases Control and
9
Prevention in collaboration with Federal, state, and local partners. The YRBSS is
representative of students in grades 9 through 12. Data from the 2001YRBSS
indicated that 17.4 percent of students reported carrying a weapon in the past 30
days and 33 percent reported being in at least one physical fight in the last year
(Grunbaum et al., 2002). However, YRBSS data indicate the percentage of
juveniles who reported carrying a weapon and engaging in a physical fight has
steadily decreased every two years from 1991 through 2001 (Centers for Diseases
Control and Prevention, 2002).
One final data source, the National Longitudinal Study of Adolescent Health
(known as the Add Health Study) suggests juveniles may offend at higher rates than
those reported in the YRBSS data. Data from surveys administered to a nationally
representative sample of juveniles in grades 7 through 12 indicate that 40 percent of
the sample reported committing a violent crime (defined as getting into a serious
physical fight, hurting someone badly enough to need medical treatment, using or
threatening to use a weapon to get something from someone, shooting or stabbing
someone, or pulling a knife or gun on someone) in the first year of data collection
(1995) and 23 percent reported committing a violent crime in the second year
(1996) of data collection (Shaffer and Ruback, 2002).
Despite mixed evidence of offending rates for juveniles obtained from
official arrest statistics and self-report data, the fact remains that statistical evidence
consistently suggests disproportionately high rates of offending by juveniles. This
evidence is provided both from official arrest records as well as from self-report
surveys that ask about offending experiences.
10
In their examination of the FBI’s UCR data, Snyder and Sickmund (1999)
noted that juveniles accounted for a disproportionately large amount of arrests for
many crimes relative to their composition in the population. Specifically, Snyder
and Sickmund (1999:116) concluded that based on their representation in this
population, juveniles were disproportionately involved in arrests for arson, burglary,
larceny-theft, robbery, vandalism, motor-vehicle thefts, and weapons law violations.
In addition, UCR data indicates that arrest rates for murder, forcible rape, robbery,
and aggravated assault are higher for teens’ ages 17 to 19 than for any other age
group (Federal Bureau of Investigation, 2000).
Furthermore, surveys of self-reported behaviors of adolescents and young
adults indicate high rates of offending among these age groups (Lauritsen, Sampson,
and Laub, 1991; Shaffer and Ruback, 2002), while surveys of victims’ perceptions
of offender characteristics indicate the most common age group for offenders
committing violent crime is young adults ages 18 through 20, followed by juveniles
ages 15 through 17 (Hindelang, 1981). In sum, it is apparent that all sources for
measuring crime statistics agree that young persons in general, and adolescents in
particular, have a greater likelihood of involvement in criminal activity.
Patterns of Juvenile Victimization
The pattern of decreasing juvenile crime rates observed in the UCR data is
mirrored by similar declines in juvenile victimizations rates. In 2001, the NCVS
indicated that violent and property crime victimization rates for all age groups
decreased respectively from the previous year and furthered a downward trend in
11
criminal victimizations that began in 1994 (Rennison, 2002). The decline in
juvenile violent victimizations has been particularly sharp for juveniles, ages 12-19,
as the violent victimization rate decreased approximately 50 percent from 1994 to
2001 (Bureau of Justice Statistics, 2002). In general, the victimization rates for
serious violent crime at school and away from school have declined from 1992 to
2000 (DeVoe et al., 2002).
While the NCVS data present a clear picture of declining victimization rates
in recent years, research continues to indicate that younger persons remain the most
susceptible to victimizations. In general populations, age has been found to have a
distinct relationship with victimization, but contrary to the popular perception, the
elderly have a low likelihood of victimization (Esbensen and Huizinga, 1991).
Rather, survey samples have found young people tend to have the highest likelihood
of becoming the victims of crime (Gottfredson, 1986). Hashima and Finkelhor
(1999) examined the NCVS data from 1994 in order to compare violent
victimization for youth (12 to 17 years old) versus adults (18 years and older).
Their analysis found that the overall violent crime victimization rate for youth ages
12 to 17 in 1994 was 2.7 times higher than the rate for adults. Furthermore, the
authors concluded that youth were almost three times more likely than adults to
have a crime related injury (Hashima and Finkelhor, 1999:806).
In a separate analysis, the examination of age patterns in non-fatal violent
victimizations (rape, robbery, sexual assault, and assault) from the NCVS data from
1976 through 2000 indicated that juveniles (persons aged 12 through 17 in the
NCVS data) were generally victimized at rates greater than those 18 and older since
12
1985 (Klaus and Rennison, 2002). In their re-examination of the NCVS data from
1995 and 1996, Snyder and Sickmund (1999:26) reached similar conclusions and
noted that juveniles were twice as likely as adults to be victims of serious violent
crimes and three times as likely to be victims of simple assault. Additionally, the
property crime victimization rate for juveniles (149 victimizations per 1,000
persons, ages 12 to 17) was greater than the adult victimization rate (129
victimizations per 1,000 persons ages 18 and older), although the differences in
property victimization rates was not as large as the difference in the violent
victimization rates (Snyder and Sickmund, 1999).
One additional data source, the Add Health Study, indicated juveniles were
violently victimized at rates about three times greater than the rates reported by
NCVS data (Wordes and Nunez, 2002). Respondents in this nationally
representative sample indicated that 19 percent of the sample reported being the
victim of a violent crime (defined as having a knife/gun pulled on them, being shot,
stabbed, or jumped) in 1995 (Shaffer and Ruback, 2002). If the Add Health
estimates are accurate, then the disproportionate risk for victimization of juveniles
may be even greater than suggested by the NCVS data. As noted regarding their
involvement in criminal activity, the evidence is clear that juveniles are also at a
greater risk for being the victim of a crime than their adult counterparts. Therefore,
the continued examination regarding the circumstance related to their victimization
experiences is warranted.
13
Patterns of Juvenile Substance Use
One reason for including the examination of juvenile substance use in this
study is because research consistently suggests that substance use by juveniles is a
substantial predictor of subsequent problem behaviors. For example, one recent
longitudinal study examined whether youth who began drinking alcohol at an early
age (grade seven) exhibited a greater propensity to report substance use and criminal
activity as young adults (age 23) (Ellickson, Tucker and Klein, 2003). The study
found that seventh grade drinkers were approximately four times more likely to
become weekly marijuana users at age 23 (18 percent) than seventh grade non-
drinkers (4 percent). Additionally, seventh grade drinkers were twice as likely (13
percent) to have committed a felony in the past year at age 23 compared to seventh
grade non-drinkers (6 percent) at age 23 (Ellickson et al., 2003).
While most sources of juvenile crime data indicate both juvenile crime and
victimization have decreased recently, juvenile drug and alcohol use has generally
remained steady or increased slightly in recent years. For example, the 2001
National Household Survey on Drug Abuse (NHSDA), an annual survey sponsored
by the Substance Abuse and Mental Health Services Administration (SAMHSA)
indicated that 10.8 percent of youth ages 12 to 17 were current users in 2001,
meaning they report using an illicit drug at least once in the month before being
interviewed (Substance Abuse and Mental Health Services Administration, 2002).
This percentage is a slight increase from 2000 when 9.7 percent of youths surveyed
by NHSDA reported using at least one drug in the past month (SAMHSA, 2002).
The Monitoring the Future survey also collects data on past year and past month
14
drug use. In 2002, 17.7 percent of eighth graders, 34.8 percent of tenth graders, and
41 percent of twelfth graders reported using an illegal drug in the one-year period
before being surveyed. Approximately 10.4 percent of eighth graders, 20.8 percent
of tenth graders, and 25.4 percent of twelfth graders reported using an illicit drug
during the past month (Office of National Drug Control Policy, 2003).
Alcohol use among juveniles is also a concern as estimates from the
NHSDA data suggest an estimated 17.3 percent of youths aged 12 to 17 report using
alcohol in the month prior to the survey interview (SAMHSA, 2002). Concerns for
alcohol use are further exacerbated considering the possible effect on teen driving
behaviors. Estimates from the 1999 YRBSS suggest approximately one-third of
high school students rode with a driver who had been drinking alcohol one or more
times in the 30 days preceding the survey and 13.1 percent had driven a car
themselves one or more times after drinking alcohol in the 30 days preceding the
survey (Kann et al., 2000).
At the same time, use of tobacco products by juveniles is important to
examine considering previous research suggests students who use cigarettes and
other tobacco products reported engaging in a significantly greater number of health
risk behaviors compared to children who had never smoked cigarettes. Farrell,
Danish and Howard (1992) noted that ninth graders in a longitudinal urban sample
from a large southeastern city who had smoked cigarettes in the past 30 days were
significantly more likely to engage in other problem behaviors such as using
marijuana, shoplifting, threatening someone with a weapon, and selling drugs.
According to NHSDA data, past month tobacco use (defined as use of several
15
tobacco products including cigarettes, chewing tobacco, cigars, and pipes) among
youths ages 12 to 17 decreased slightly from 17.3 percent in 1999 to 15.1 percent in
2001 (SAMHSA, 2002). In sum, the propensity of juveniles to experiment with
substances, including marijuana, alcohol, and tobacco, coupled with the likelihood
that these substance-using behaviors will lead to subsequent problem behaviors,
suggests that a further examination of the patterns of these behaviors is necessary.
Timing of Juvenile Delinquency, Victimization, and Substance Use
The patterns of juvenile delinquency, victimization, and substance use were
reviewed above to provide a background for the relevance of a more specific review
regarding the timing of these behaviors. Given the recent national headlines such as
the tragic shootings in Columbine, an abundance of recent research has specifically
focused on juvenile crime that occurs during the school day when juveniles interact
on a regular basis (e.g. United States Department of Education, National Center for
Education Statistics, 2002; DeVoe et al., 2002; Gottfredson, 2001; Chandler,
Chapman, Rand, and Taylor, 1998). While shocking incidents of shootings at
schools have focused a great deal of media attention on the safety of our nation’s
students, many questions still exist regarding whether schools are criminogenic
places or whether they are relatively safe. In fact, many researchers point to
statistics obtained from the official arrests data, which suggest juveniles are
probably safer at schools than out of school (Snyder and Sickmund, 1999).
However these arrest statistics may actually underestimate the true
proportion of juvenile crime and victimization that occur within school boundaries
16
since many in-school crime incidents go unreported to the police (Snyder and
Sickmund, 1999). In their analysis of the NCVS data, Whitaker and Bastian (1991)
found that only nine percent of violent crimes against juveniles occurring in school
were reported to the police compared with 37 percent of those occurring on the
streets. Similarly, in their review of juveniles, ages 12 through 17 from the 1995-
1996 NCVS data, Finkelhor and Ormrod (1999) noted that approximately 15
percent of school victimizations of juveniles were reported to police, while
approximately 37 percent of non-school victimizations were reported to the police.
When estimates of juvenile crime experiences are obtained using self-report
surveys, the amount of victimization and crime experienced by school-aged youth
appears disproportionately higher when compared to the amount of time juveniles
spend in school. In other words, comparisons of in-school and out-of-school crime
can be better understood when one considers the amount of time students typically
spend in school. Gottfredson (2001:21) estimated that students spend 18 percent of
their waking hours in schools. However an examination of the 1999 NCVS School
Crime Supplement data reveals that 67 percent of all crimes and 50 percent of
serious, violent crimes among juveniles, 12-14 years old occurred at school or on
the way to and from school (calculated from tables in USDE, 2002 report). This
suggests juveniles are disproportionately victimized while at school relative to the
percentage of time they spend at school. In an earlier study, Whitaker and Bastian’s
(1991) examination of the NCVS indicated that juveniles, ages 12 through 15
experienced 37 percent of violent crimes and 81 percent of the thefts while on
17
school property, which also confirms this group experienced these victimizations at
a rate that was disproportionately higher than their time spent in school.
Additional self-reports of health risk behaviors occurring in schools, such as
the YRBSS (Centers for Diseases Control and Prevention, 2002) also suggest
somewhat higher rates of in-school victimization than previously reported in official
arrest statistics. The YRBSS data from a nationally representative sample of
students in grades 9 through 12 monitors several indicators of health behaviors and
also examines specific youth conduct with respect to general behavior and behavior
that occurred in school. In 2001, the YRBSS data indicated that approximately 37
percent of students, who carried a weapon in the past 30 days, did so while on
school property, while nearly 40 percent of reported fights occurred on school
property (DeVoe et al., 2002). Again, these data reflect percentages of in-school
crime that are greater than the percentage of time spent in school.
Another study conducted by Garofalo, Siegel, and Laub (1987) which
analyzed the structured Incident Reports and narratives from 850 victimizations
from the National Crime Survey (NCS) of juveniles’ ages 12 and 17 reported
similar conclusions regarding school crime. Their analysis found that 54 percent of
these 850 victimizations were categorized as school related; meaning they occurred
at some point during the process of attending school (Garofalo et al., 1987:329).
Still, the authors speculated their analyses might have underestimated the extent of
school related victimizations because more than half of the narratives did not
contain information about the location of the incident.
18
Perhaps it should not be surprising that self-report data suggests in-school
crime and victimization rates may be somewhat higher than previously expected.
Recently, the concentration of delinquency prone adolescents has increased at
schools as the proportion of youth enrolled in school has grown (Gottfredson, 2001).
Since schools aggregate large numbers of teenagers in one place for long periods of
time, schools may actually have the unintended consequence of exposing all youth
in general to a larger sample of other delinquency prone adolescents. Therefore
schools can potentially increase a juvenile’s risk for being the victim of a crime
and/or the risk of involvement in delinquent behavior simply by increasing their
exposure to a pool of other delinquent youth. The idea that juveniles may be more
likely to be the victim of a crime while at school seems to be supported by a recent
study by the National Center for Education Statistics and the Bureau of Justice
Statistics (1998), which reported that students were victims of 3.3 million crimes at
school and 3.1 million away from school in 1996. When one considers that youths
spend less than 20 percent of their waking hours in school, the discrepancy between
in-school and out-of-school victimizations seems even larger.
In a recent article completed by researchers at the Kennedy School of
Government at Harvard University, the authors utilized NIBRS data to examine
juvenile school crime by comparing teacher in-service days, when juveniles are
excused from school (but would otherwise be expected to attend since the days fall
within the regular school calendar), against days when school was in session. Jacob
and Lefgren’s (2003) analyses indicated that on days in which school was in
session, violent crimes committed by juveniles increased by 28 percent compared
19
with days when school was not in session due to teacher in-service days.
Alternatively, the authors noted that property crimes decreased by 14 percent on
days when school was in session relative to teacher in-service days (Jacob and
Lefgren (2003).
Although these studies suggest certain types of juvenile victimization and
crime in schools may be more prevalent than previously thought, the overall rates of
serious criminal victimization in school remains relatively low (Gottfredson, 2001).
In their review of school victimizations, Gottfredson and Gottfredson (1985) noted
that more serious forms of juvenile victimization such as those resulting in serious
physical injury or large monetary losses, were rare in comparison to other more
minor victimizations. In a national survey of secondary school students,
Gottfredson, Gottfredson, and Czeh (2000) found that 49.6 percent of students
reported a minor theft of items worth less than $1 while 45 percent of students
reported theft of items worth more than $1. When asked about more serious forms
of victimizations, 19.1 percent of students reported being threatened with a beating,
11.6 percent reported being the victim of a physical attack, and 5.0 percent reported
being threatened with a knife or gun (Gottfredson et al., 2000).
An examination of juvenile substance use during the school day suggests
this type of behavior may also be more prevalent than previously thought. For
example, slightly more than five percent of the students in grades 9-12 who were
surveyed as part of the 2001 YRBS reported using marijuana at least once on school
property, while 24 percent reported using marijuana anywhere (which could include
on school property) in the 30 days before being surveyed (USDE, 2002).
20
Additionally, approximately five percent of the youths in the 2001 YRBS sample
reported having at least one drink of alcohol on school property in the 30 days
before the survey (ONDCP, 2003), while 47 percent of the same sample reported
having at least one drink of alcohol anywhere.
While the research reviewed above specifically discusses juvenile
victimization, delinquency, and substance use that occurred during the school day,
researchers have recently more closely examined the time period immediately after
school when juveniles are often left unsupervised until their parents arrive home
from work. In actuality, criminologists observed an apparent peak in crime after
school more than 50 years ago. In 1945, Kvaraceus examined New Jersey juvenile
court referrals and reported that more juvenile crime occurred on weekdays than on
weekends and that juvenile crime peaked following the end of the school day in the
mid-afternoon period.
A half-century later, Snyder, Sickmund, and Poe-Yamagata (1996)
examined the proportion of violent crimes reported to law enforcement agencies at
various times of day. These analyses examined data from the FBI’s National
Incident Based Reporting System (NIBRS) from South Carolina in 1991 and 1992.
Although the intent of the study was to evaluate the potential prevention effects of
curfew laws, the report found that a higher percentage of violent crimes (22 percent
versus 17 percent) occurred during the hours between 2 p.m. and 6 p.m. on
weekdays than during the hours between 10 p.m. and 6 a.m. on weekdays and
between midnight and 6 a.m. on weekends. Consequently, the authors concluded
21
that more violent crimes occur during the after-school hours than during hours when
a curfew restriction would take place (Snyder et al., 1996).
The authors further replicated this initial study with a larger sample of
NIBRS data from 12 states for the years 1991 through 1996 (Snyder and Sickmund,
1999; Sickmund et al., 1997). This analysis confirmed that juvenile serious violent
crime peaked between 2 p.m. and 6 p.m. on school days, the hours just after school
is dismissed while adult serious violent crime peaked at 11 p.m. (Snyder and
Sickmund, 1999; Sickmund et al., 1997). Additionally, the authors examined the
NIBRS data to explore the peak crime for juvenile victimizations. The analysis
suggested that juveniles were at the highest risk of being the victims of a violent
crime in the four hours following the end of the school day, which they estimated to
be between 2 p.m. and 6 p.m. In order to investigate the possibility that the
observed pattern, which was based on reports of crime to the police, did not differ
from the actual pattern of crime against juveniles, data from the 1996 NCVS were
analyzed. The results indicated that juvenile victims reported even more crime
occurring between noon and 6 p.m., which includes the after-school period, than
indicated by the NIBRS data. The NCVS data showed that juveniles were at the
highest risk of being a victim of violent crimes, including robbery, aggravated
assault, and simple assault between noon and 6 p.m. (Snyder and Sickmund, 1999).
This data, which highlighted elevated levels of juvenile criminal victimization and
offenses during the after-school hours, had a substantial influence on policy makers
22
and helped contribute to the recent exploration of possible prevention tools such as
after-school programs1.
However, a more recent study based on self-report data from both the
National Study of Delinquency Prevention in Schools (NSDPS; Gottfredson,
Gottfredson, and Czeh 2000) and a sample of youths participating in Maryland
After School Community Grant Programs (MASCGP) presented a slightly different
picture on the timing of adolescent delinquency in comparison to the work of
Snyder and his colleagues. In their study, Gottfredson, Gottfredson, and Weisman
(2001) found a similar, although less marked pattern of delinquent behavior during
the after-school hours. Their analyses of the timing of self-report delinquent
behavior in adolescents noted the observed peak in juvenile crime during the after-
school hours was more modest than the peak observed in the NIBRS data as
reported by Snyder and colleagues. In addition, the MASCGP data revealed that
juvenile crime was actually the most elevated in the period before school began
after the data was standardized to control for the number of hours in each observed
time period (Gottfredson et al., 2001). In a follow-up study utilizing MASCGP data
from a subsequent year, Gottfredson and Soulé (2003) noted the timing of juvenile
delinquency varied by crime type. Crimes against persons were elevated during the
after-school hours, but not as much as during and before school. Neither property
nor substance use offenses were prominent during the after-school hours.
1 It should be noted Snyder and colleagues (1999) clearly stated their analyses focused on violent offenses. However, proponents of after-school programs have often suggested that all juvenile offenses, in general, sharply increase during the after-school hours.
23
Additional analyses from the 1999 NCVS School Crime Supplement (SCS)
indicated that victimizations at school were most likely to occur during the school
day between noon and 3 p.m. (39.7 percent), followed by the time period between 6
a.m. and noon (30.2 percent). Victimizations at school were more common during
both of these time periods than during the after-school hours of 3 p.m. to 6 p.m. (9.9
percent) (USDE, 2002:13). However, this analysis was limited to victimizations
occurring on school property and/or those occurring on the way to or from school.
Research regarding the specific timing of juvenile substance use is less
abundant than the research regarding the timing of juvenile delinquency and
victimization presented above. However, Gottfredson and Soulé (2003) noted the
MASCGP sample reported the highest level of substance use during the weekend
period. Additionally, one national survey asks students to report the time when
juveniles are most likely to use illegal substances. Recent data collected from
109,919 sixth through twelve graders nationwide, who participated in the 2002-2003
PRIDE Survey, indicates that juveniles were most likely to use illegal substances,
including alcohol, during the weekend hours as opposed to the before, during, or
after school hours and evening weekday hours (PRIDE, 2003). For example, 17.4
percent of junior high students (grades 6-8) reporting drinking beer on the weekend,
while 4.0 percent drank beer on weeknights (after dinner) and 3.6 percent drank
beer in the after-school hours (PRIDE, 2003). Alcohol use before school and during
school was generally reported by less than one percent of the sample. The same
general timing pattern persisted for juveniles regarding tobacco use, marijuana use,
and other illicit drugs such as hallucinogens and inhalants.
24
The timing of juvenile substance use may also be considered relative to a
student’s level of adult supervision. Prior research has linked juvenile problem
behavior in general, and substance use in particular, to juveniles’ levels of adult
supervision, which may vary according to the time of day. The after-school hours
have been a point of emphasis considering the growing number of families with
both parents working outside of the home and the number of single parent families.
These patterns may result in a larger portion of juveniles being unsupervised during
the hours between when school ends and parents return from work (United States
Department of Education and Justice, 2000).
There is some evidence that the more hours a youth spends unsupervised, the
greater the risk they will become involved in problem behaviors, including
substance use. For example, Richardson et al., (1989) indicated that eighth grade
youth who cared for themselves for 11 or more hours per week without an adult
present were twice as likely to use drugs as those who are always supervised. The
study concluded this relationship persisted even when youth characteristics that
might explain the relationship, such as socioeconomic status and living with a single
parent, were statistically controlled. The author’s model implied that the higher
levels of drug use among the unsupervised teens might be explained in large part by
their greater association with delinquent peers. While this study did not specifically
examine whether juvenile substance use was elevated after-school relative to other
time periods, it does provide the type of evidence often cited by proponents of after-
school programs (e.g. Newman et al., 2000) as confirmation for concerns regarding
the rate of juvenile substance use during the after-school hours.
25
In sum, previous research has produced mixed evidence regarding the
specific time period when juvenile victimization and delinquent behavior are most
likely to occur, while research regarding the timing of juvenile substance use has not
been adequately explored. One reason for the lack of consensus regarding the
timing of these behaviors is that some of the previously discussed studies had flaws
or limitations in their research design, while others have examined a limited
measure (e.g. aggregated delinquency only). The limitations of these previous
studies are discussed below and provide a rationale for a more advanced exploration
of these issues. The goal of this study is to address these limitations and more
clearly decipher whether previous research, which emphasized an apparent peak in
juvenile crime during the after-school hours, accurately reflects the timing of
juvenile victimization, offending, and substance use experiences.
Limitations of Previous Research
The literature review above provided a summary description of the existing
research regarding the time when juveniles are most likely to offend or become a
victim of crimes themselves. While this body of work has substantially contributed
to an increased awareness of the timing of juvenile victimization and delinquency,
this research generally exhibits five primary weaknesses.2 These limitations are
outlined below in detail. Each individual limitation is then utilized to provide a
rationale for the subsequent research questions examined in the current study.
2 These five limitations apply to the body of research as a whole and are not applicable to any one prior study.
26
The first primary limitation of previous research is that it has relied on
official police data and therefore fails to rule out the possibility that elevated levels
of crime rates were due to law enforcement behavior rather than youth behavior. In
other words, it may be that police are more likely to arrest juveniles during the after-
school hours, which could explain the observed juvenile crime peak during these
hours.
A second limitation is that previous research utilizing official police data,
such as the FBI’s UCR and NIBRS data, includes a select group of offenders since
being arrested or having a criminal incident reported to the police is not perfectly
related to committing an offense. Therefore, UCR data tend to underestimate the
actual level of offending behavior since arrests are made in fewer than half of crime
reported to the police (Snyder and Sickmund, 1999). In addition, while the NIBRS
data is an improved measure of criminal activity because it includes information on
all crime incidents reported to the police, the NIBRS data still has a few
disadvantages. Primarily, NIBRS data is limited because it only includes
information from jurisdictions that have agreed to participate in the system, unlike
the UCR, to which all law enforcement agencies throughout the nation report. In
1999, only 2,852 (or 14.5 percent) of a total 19,659 jurisdictions participated in
NIBRS (Jacob and Lefgren, 2003). Finally, the NIBRS data, as with all official
crime data sources, is limited because it only includes those criminal incidents
reported to the police.
27
The likelihood that official arrest data underestimates actual levels of crime
seems to be supported by information obtained from victim reports. In an analysis
of juveniles offending trends comparing victim survey data from the NCVS to
official arrest data from the UCR, Lynch (2002:15) concluded that offending arrest
rate estimates from the NCVS data are nine to 15 times greater than the arrest rate
estimates from the UCR data. Additionally, crimes involving juvenile victims
appear to be underreported in absolute terms and in comparison with adults
(Finkelhor and Ormrod, 1999). In their analysis of 1997 NIBRS data from
jurisdiction in 12 states, Finkelhor and Ormrod (2000a) observed that estimates of
juvenile victimizations relative to their composition in the total population were less
than estimates received from self-report sources. Accordingly, the authors
suggested that police data in general and NIBRS data in particular are not good
indicators of the true burden of crime victimizations by age group, but rather they
are only the relative proportions of those victimizations that police are likely to
encounter (Finkelhor and Ormrod, 2000a:5).
Juvenile crime and victimization reporting standards may be lower because
it is likely that many criminal events occurring at school are handled directly by
school personnel rather than being handled by official criminal justice agents. In a
review of the NCS narratives, Garofalo et al. (1987:335) found the number of
school related victimizations reported to school personnel exceeded the number
reported to the police by a ratio of 100 to 68. In a more recent review of the 1995-
1996 NCVS data, Finkelhor and Ormrod (1999) noted that school victimizations of
28
juveniles were less likely to be reported to police than non-school victimizations (15
percent and 37 percent, respectively).
However, Snyder and Sickmund (1999) referenced the 1996 NCVS data and
noted that while approximately 19 percent of serious violent juvenile victimizations
were reported to some other authority besides the police, only one-third of these
incidents were subsequently reported to law enforcement. Consequently, when
considering that approximately 33 percent of these incidents were reported directly
to law enforcement, the police eventually learned of about 40 percent of serious
violent juvenile victimizations (Snyder and Sickmund, 1999:27). While there are
many plausible explanations for why juveniles are less likely to report crimes to the
police, Finkelhor and Ormrod (1999) noted in their examination of the NCVS data
that juveniles’ underreporting was not totally explained by the tendency of juveniles
to report crimes to school authorities rather than to police. The underreporting was
evident even for the most serious offenses and even when taking into account
reports to other authorities (Finkelhor and Ormrod, 1999).
Still, since a pattern of underreporting of crime by juveniles is apparent,
some jurisdictions and school districts have begun to require the mandatory
reporting of school crime to law enforcement officials. Generally state and federal
statutes require that schools report any violent criminal acts (e.g. assault, homicide,
child abuse) or possession of weapons or drugs to law enforcement officials.3
3 See generally, Gun-Free Schools Act of 1994, 20 USCA § 8921 (1999) (requiring reporting of firearms in schools); Safe and Drug Free Schools and Communities Act of 1994, 20 USCS § 7101 et seq. (1999) (requiring reporting of drug possession in schools and communities).
29
Lesser crimes such as property damage and vandalism may not come under a state’s
reporting requirement. In Maryland, the Code of Maryland Regulations (COMAR)
13A.08.01.15A states, “School officials shall promptly report to the responsible law
enforcement agencies all delinquent acts coming to their attention whether occurring
on or away from the school premises which involve students attending the particular
school.” However the next section, COMAR 13A.08.01.15B states delinquent acts
“do not include conduct, which traditionally has been treated as a matter of
discipline to be handled administratively by the particular school.” Accordingly,
Maryland school officials still maintain discretion over the types of delinquent acts
reported to law enforcement officials and therefore police reports are still likely to
underestimate juvenile crime rates, especially during the school day.
Although some previous research has incorporated self-report measures, a
third limitation of this research is that it provides imprecise timing measures. For
example, the main source of self-report victimization, the NCVS, asks respondents
to estimate the time an event occurred in one of four time periods (6 a.m. to noon,
noon to 6 p.m., 6 p.m. to midnight, and midnight to 6 a.m.). While this strategy
provides a distribution of four equal time periods, this format is problematic because
the first two periods overlap the time when juveniles are expected to be in school
and therefore fail to provide an accurate description of in-school versus out-of-
school crime. Recently, the NCVS, School Crime Supplement (SCS) has adapted
the time references to further break down the periods into five reference categories
(6 a.m. to noon, noon to 3 p.m., 3 p.m. to 6 p.m., 6 p.m. to 9 p.m., and 9 p.m. to
30
midnight). However, these subsequent time periods were only referenced for those
victimizations occurring at school and therefore were unable to provide information
about other victimizations that did not occur on school grounds (USDE, 2002).
The fourth limitation of previous research is that it has not adequately
disaggregated the timing of juvenile offending behavior by specific types of crime.
For example, the Snyder and Sickmund (1999) study only examined the timing of
violent offenses and did not consider property crimes or alcohol and substance use
by juveniles. However, previous research suggests a closer examination of all crime
types may be necessary. In their systematic review of school victimizations,
Gottfredson and Gottfredson (1985) found that more serious forms of juvenile
victimization such as those resulting in serious physical injury or large monetary
losses were rare in comparison to other more minor victimizations. Similarly,
Garofalo and colleagues (1987:336) concluded from the NCS narratives that school
related victimizations are peer related and grow out of factors such as bullying,
injured pride, and misguided mischief and do not match the violent image of
stranger to stranger street crime. Still, the authors contend that the regularity, with
which adolescents do victimize each other, even if most victimization is more
bothersome than injurious, warrants further attention.
In addition, existing research has focused more attention towards the timing
of youth delinquency and has not adequately addressed the issues concerning when
juveniles are more likely to be a victim of crime themselves. This pattern of
focusing more resources toward the examination of juvenile delinquency may stem
from a traditional criminal justice perspective in which our nation’s youth are more
31
typically characterized as troublemakers and delinquents. While previous studies
(e.g. Gottfredson et al., 2001; Jacob and Lefgren, 2003; Gottfredson and Soulé,
2003) have carefully examined the timing of juvenile delinquency, these works can
be expanded by also including a closer examination of the timing of juvenile
victimization and substance use.
The final primary weakness of previous research includes the inadequate
examination of the frequency of juvenile victimizations and delinquent behavior in
relation to the timing of these events. Little existing research has incorporated
measures of frequency and therefore has been unable to make any statements about
offenders who commit the same offense multiple times during the same time period.
For example, it may be the case that the delinquency of high-rate offenders is only
weakly related to the time of day, but that for lower rate offenders, the after-school
hours are a peak time for delinquency (Gottfredson et al., 2001:80). Similarly, some
victims may be susceptible to multiple victimizations at a particular time or some
youth may repeatedly use substances such as tobacco, marijuana and alcohol at a
particular time of day. Accordingly, a closer examination of the frequency of these
repeat behaviors relative to the time the act is committed is justifiable.
Research Questions
One of the major premises behind an increased interest in supporting after-
school services is based on a body of prior research, which illustrated an apparent
sharp peak in juvenile crime during the after-school hours. However, very recent
research has presented somewhat contradictory evidence that juvenile offending and
32
victimization experiences may not be as elevated during these hours as previously
suggested. The main goal of this study is to clarify our understanding of the timing
of juvenile problem behavior by addressing some of the major limitations of
previous research outlined above. Recall that the first three limitations of previous
research were all related to the measurement issues. In particular, the use of official
data and imprecise timing measures were cited as problematic. These limitations
provide a clear starting point for an examination of the research questions described
below. Accordingly, the first research question addressed in this study is:
When juvenile victimization, delinquency, and substance use behaviors are measured with more precise time measures using self-report data, are these behaviors more likely to occur during the after-school hours as suggested by previous research rather than during other times of the day?
As previously discussed, the NCVS data has been widely cited to explore
timing patterns of juvenile victimizations and delinquency. Specifically, Howard
Snyder and colleagues (Snyder and Sickmund, 1999; Sickmund et al., 1997)
compared their findings regarding the timing of offending behavior from the NIBRS
data with victimization reports from the NCVS in order to check if the actual pattern
of crime against juveniles differed from the police data. Snyder and Sickmund
(1999) cited the 1996 NCVS data, which highlighted an apparent peak in juvenile
victimizations during the after-school hours. This finding confirmed the previous
reports of increased juvenile crime activity during the after-school hours as found in
the NIBRS data and has been widely cited as support for juvenile programs which
increase supervision during these hours or provide alternative constructive activities
33
to keep youths off the streets. However, research which utilized the NCVS data to
examine the timing of juvenile crime and victimization, failed to adequately address
the inadequacies of the available timing measures.
Specifically, the NCVS asks victims to indicate in which of a day’s four 6-
hour blocks their victimization occurred. Of primary concern is the second six-hour
block, which covers the period from noon to 6 p.m. Considering school usually
dismisses somewhere between 2 p.m. and 4 p.m., the second time period covered by
the NCVS includes a few hours of in-school time and a few hours of after-school
time. Accordingly, those who suggest the NCVS data provides evidence that
juveniles have an elevated risk of victimization during the after-school hours, should
leave open the possibility that much of this crime may occur in the last few hours
before school ends. While the NCVS School Crime Supplement (SCS) does
disaggregate between the noon to 3 p.m. and 3p.m. to 6.pm. hours, it is limited to
reporting only those crimes occurring at school or on the way to and from school.
Furthermore, additional data sources such as the YRBSS, which examine in-school
versus out-of-school crime, do not refer to specific times beyond the school
boundary. Therefore, these data sources are not particularly helpful for making
definitive statements about the timing of juvenile crime and victimizations during
after-school hours.
The first research question addressed the general timing of juvenile
victimization, delinquency and substance use experiences by examining the
aggregate measures provided in the data. However, in order to address the fourth
34
primary limitation of previous research regarding the inadequate examination of
specific offenses, the second research question further expands on this analysis by
asking:
Are specific victimization, delinquency, and substance use offense types related to the time the event occurs?
While prior research has contributed to our understanding of the timing of
aggregate delinquency and victimization patterns, a closer examination of the
NIBRS data suggests that while serious violent crime as a whole peaks for juveniles
at 3 p.m., not all of the specific crimes included in this index peak at that same time.
For example, the NIBRS data from 12 states indicated that the largest percentage of
juvenile robberies took place around 9 p.m. (Snyder and Sickmund, 1999). Yet, as
previously suggested, this data is limited to those offenses, which are captured
through official police statistics. While an examination of these official records is
beneficial, current research discussing the data available from these official records
is mainly limited to an aggregate view of violent juvenile victimizations or offenses.
The fact that the NIBRS timing analyses focuses on only a few serious
crimes is consistent with prior research trends. While an abundance of research has
examined juvenile violent crimes (Cook and Laub, 2002; Shaffer and Ruback, 2002;
Loeber, Kalb, and Huizinga, 2001; Hashima and Finkelhor, 1999), the criminal
justice literature has paid little attention to juvenile property crimes. The lack of
attention directed towards property offenses may be somewhat surprising
considering recent NCVS data indicates that property crime is the most frequent
35
type of criminal victimization and more specifically the rate of property crimes
against juveniles, ages 12-17 was approximately 40 percent higher in 1997 than the
rate for adults (Finkelhor and Ormrod, 2000b). Additionally, to date, research has
failed to adequately examine the time of day when juveniles are most likely to use
alcohol or illegal substances, which may be of particular interest to parents and
prevention practitioners.
If the timing of individual events is left unexplored, then the research may
potentially miss important differences between unique events. For example, it may
be the case that offenses that occur during a certain period of the day (e.g. during
school) are relatively minor (e.g. thefts or vandalism) and those that occur during
other hours (e.g. after-school) are more serious crimes, such as robbery or assault.
Recently, one study did find a distinct difference between the types of crimes
occurring in school and the types that occurred out of school. In their examination
of NIBRS data from 29 jurisdictions, Jacob and Lefgren (2003) found that the level
of property crime committed by juveniles decreased on days when school was in
session, while the level of violent criminal offense among juveniles increased on
school days. The authors concluded that when juveniles are not provided with a
supervised environment (e.g. when out of school), they are likely to engage in anti-
social behavior that manifests itself in increased property crime. However, when
juveniles are in school, the authors argued that the geographic concentration of
youth increased the number of potentially volatile interactions, which in turn
explained the observed increase of in-school violent crime (Jacob and Lefgren,
2003:5). Accordingly, the research discussed above confirms the need for a more
36
thorough examination of a variety of crime types, including property crimes and
alcohol/substance use.
Finally, the third research question was based on the last primary weakness
of the existing research. To date, those analyses which examined the timing of
juvenile victimization and delinquency, have not adequately examined frequency of
these behaviors relative to the timing of these events. Accordingly, the third
research question will expand this analysis by addressing the following question:
Are individuals more likely to be repeat victims, offenders, or substance users during different time periods than those observed for all incidents of these same behaviors?
The self-report survey used in this analysis has the advantage of allowing
one to differentiate between those individuals who are single-incident offenders
and/or victims versus those that are multiple or repeat offenders and/or victims.
Therefore, this proxy frequency measure provides an opportunity for disaggregating
individuals by their relative risk level.
Criminologists have long been aware of the fact that relatively few offenders
are responsible for the majority of all crime incidents. However, the distribution of
these incidents among victims has received less research attention (Lauritsen and
Quinet, 1995). More recently, as victimization surveys developed, scholars noted
that a relatively small number of victims accounted for a disproportionately large
portion of victimization (e.g. Sparks, 1981). While some previous research has
suggested that repeat victimization is rare (see Menard and Huizinga, 2001 for a
review), recent analyses of other victimization surveys present contrasting results
37
suggesting the need to carefully examine victimization data and trends. For
example, Menard (2000) examined data from nine waves of the National Youth
Survey (NYS), encompassing the years 1976-1992 and respondents’ ages ranging
from 11 to 33 and found evidence in contrast to previous suggestions that most
individuals report no victimization incidents. Rather, Menard (2000:558) reported
that an average of about half of the NYS sample reported being victimized in any
given year and furthermore, the average respondent experienced two victimizations
per year. Menard and Huizinga (2001) further examined victimization data from the
Denver Youth Survey (DYS) and found that 80 percent of youths who reported
violent victimization were either chronic, multiple, or chronic and multiple victims
of violent crimes. Similarly, Lauritsen and Quinet (1995) used longitudinal data
from the NYS and found that most victims reported being the victim of more than
one criminal incident within a one-year reference period.
Based on the evidence that repeat victimization is anything but rare and that
both a small percentage of offenders and victims are responsible for a substantial
proportion of all crime, it seems a further examination of the time of day when these
repeat behaviors occur is warranted. For example, it may be that the victimization,
delinquency, or substance use of high-risk (or repeat) juveniles is only weakly
related to the time of day, but for lower risk juveniles, a specific time may be a peak
period for victimization or delinquency. By examining this third research question,
one should be able to determine the relative importance of differing time periods in
relation to the frequency of juvenile offending, victimization and substance use.
38
In summary, this study carefully examines the relationship between juvenile
offending behavior and the time when these events occur. The research agenda
outlined above will provide some insight regarding the potential impacts of policy
initiatives such as after-school programs. If the results confirm that juveniles are
more at-risk when adult supervision is typically low (e.g. during the after-school
hours), then one could suggest activities primarily designed to keep youth busy and
“off the streets” hold promise as prevention tools.
Additionally, while not specifically tested in this study, the research does
provide a foundation for the examination of the lifestyles and/or routine activities
theoretical framework. The lifestyles theory presumes that some common activities
of young people, such as staying out late, drinking, and using drugs, are more likely
to place them in situations where the possibilities for victimization and delinquency
are increased (Hindelang, Gottfredson, and Garofalo, 1978). Similarly, routine
activities theory suggests that crime is more likely when a suitable target is
available, a capable guardian is absent, and when a motivated offender is present
(Cohen and Felson, 1979). Thus common lifestyles or “routine activities” shape
criminal opportunities since areas with high crime rates are expected to be relatively
unguarded locations where suitable targets and motivated offenders routinely
interact. By exploring the time when juveniles are most likely to offend or become
a victim of a crime themselves, this study will enhance our understanding of the
nature and motivation of juvenile offending behaviors relative to the varying
circumstances and levels of supervision juveniles typically experience throughout
the day.
39
CHAPTER 3: RESEARCH METHODOLOGY
The purpose of the following chapter is to discuss the methods used in this
study. First, the data set for the study sample is described, followed by a discussion
of the operationalization of the research constructs. Finally, the plan for analysis is
discussed.
Data
The data used for this study are from an evaluation of the Maryland After
School Opportunity Fund Program (MASOFP) administered through the State of
Maryland’s Department of Human Resources Child Care Administration from the
inception of the initiative in July 2000 and currently administered through the
Governor’s Office of Children Youth and Families. In 1999, the Maryland General
Assembly reacted to an increase in interest for addressing the after-school hours in
order to reduce the number of hours youth spend unsupervised and passed the
Maryland After School Opportunity Act (HB6) during the 1999 Legislative
Session. The Act created the Maryland After School Opportunity Fund Program
(MASOFP), which called for $10 million to assist parents in providing after-school
care and programs for children throughout the State (Maryland After School
Opportunity Fund Advisory Board, 1999).
In August 2001, the University of Maryland was contracted to evaluate the
services provided by the MASOFP-funded programs. The MASOFP initiative
40
supported services for approximately 260 after-school programs throughout the state
during the 2002-2003 school-year. An outcome evaluation of 39 of these programs,
serving youths in grades four through 12 began in September 2002. Each of the 24
counties in Maryland was expected to have at least one MASOFP site included in
the evaluation. The number of sites per county selected to be included in the
University of Maryland evaluation was calculated at a rate proportional to the total
allotment of statewide funding.4 The proportional sampling strategy for selecting
sites to be included in the evaluation is provided in Appendix A.
Additionally, 10 of the 39 programs participating in the outcome evaluation
recruited a sample of comparison group youth who did not regularly participate in
an after-school program. Comparison group youths were expected to be matched to
the MASOFP participants based on demographic characteristics, including grade
level, race, and gender. The decision to incorporate the comparison group youth in
this study’s sample was based on the following rationale. First, the inclusion of
youth in this comparison group increases the overall sample size which helps
elevate the power of any statistical tests included in the analyses. Second, the larger
sample size is beneficial for increasing the variability of the measures of interest,
mainly juvenile victimization, delinquency, and substance use. Finally, an analysis
of the pretest data was completed in order to identify any key difference between the
4 The outcome evaluation was originally scheduled to include 75 after school programs. However, in selected counties, the pre-post outcome evaluation never took place because many after school programs had difficulty in getting parental consent forms returned, which prevented the University evaluation staff from being able to administer the pre-test survey. However, all programs were still expected to participate in the process evaluation, which included submitting process data such as program attendance and staff information provider forms.
41
after-school participant group and those youth who were identified as comparison
group participants. As discussed further below, these differences were minimal
which further justified the inclusion of the comparison group in this study’s sample.
The sample for the current study includes all evaluation participants from the
36 after-school programs in the overall University of Maryland evaluation sample,
which served youth at the middle and high school levels (grades six through
twelve). The middle and high school level students completed a longer survey
instrument than the younger youth in the three evaluation programs, which served
elementary school age children. The longer survey instrument included information
about the timing of victimization and delinquency experiences, while the instrument
for the younger youth did not include this feature.
This study uses data from the pre-tested questionnaires completed by the
sample described above prior to or during the first few weeks of the program start
dates. Programs start dates varied considerably across the State and ranged from
September 2002 through March 2003.5 Table 1 shows the pre-test response rates for
the study’s sample. Pre-test questionnaires were completed by 661 (56 percent) of
the 1179 after-school participants, who received parental consent to participate in
the MASOFP evaluation. Additionally, 221 youth were identified and received
parental consent to participate as comparison group youth for the MASOFP
evaluation. Pre-test questionnaires were completed by 156 (71 percent) of the
5 Although the pre-test administration dates varied over a seven-month period, the variation in survey dates should not be a concern for this study’s analyses since the one-year reference period for the measures of interest (e.g. victimization, delinquency, and drug use) still remained a constant 12 months for all youth who participated in the study.
42
identified comparison group participants. Some potential study participants were
not pre-tested because they were absent on the days the questionnaires were
administered by the University of Maryland evaluation staff.
In order to determine the similarities and differences of the after-school
participant group and the comparison group youth, comparisons were made on
seven key measures including gender, race, age, grade, aggregate victimization
score, aggregate delinquency score, and last year substance use. Although the
sample size for the comparison group youth (n = 156) is substantially smaller than
the after-school participants group (n = 661), analyses indicate that statistically
significant differences existed for only two of the seven measures. As indicated in
Table 2, the after-school participant group and comparison group were significantly
different in terms of race whereby the after-school participant group included
significantly more non-white youths than the comparison group (p<.01).
Additionally, the after-school participant group had a significantly lower average
score (p<.05) for the last-year substance use scale than the comparison group. No
significant differences were found for the remaining demographic measures or the
measures for last year victimization and delinquency. Since the current study is not
designed to measure pre and post-test difference between these two groups, any pre-
test discrepancies between the groups are irrelevant. Rather, the inclusion of the
comparison group youth in all analyses is beneficial since their addition will only
serve to increase the variability on the measures of interest in this study. Therefore,
the final sample for this study includes a total of 817 evaluation participants who
completed the pre-test questionnaires throughout the 2002-2003 school-year.
43
Table 3 presents a summary demographic description of the sample. The
average study participant was a 12-year old, black female in the seventh grade. The
sample included a group of youths (92.6 percent) who were mostly in middle school
(grades six through eight), while the remaining students (7.4 percent) were
in high school (grades nine through twelve). Forty percent of the students were
male, with an average age of 12.35. The sample was 49 percent Black or African
American, 42 percent White, 2 percent Latino, 1 percent Native American or
Alaskan Native, 1 percent Asian American or Pacific Islander, and 4 percent of
another race. Approximately one-third of the sample lived in a single-parent
household and less than half lived in a traditional two-parent (mother and father)
household. Slightly less than half (46 percent) of the middle school students and
slightly more than half (51 percent) of the high school students in the sample
received a free or reduced-priced lunch at school. In Maryland, the percentage of
students receiving free or reduced priced lunches at school is often utilized as an
assessment of a particular school or community’s poverty level. On average, 33
percent of middle school age students and 20 percent of high school age students in
Maryland received a free lunch at school during the 2002-2003 school year
(Maryland State Department of Education, 2003), indicating that the current
sample’s poverty level is above average relative to the rest of the State. In total, the
percentage of missing data did not exceed 2.1 percent for any of the variables or
constructs included in the analysis. Consequently, missing data values are not
common and cases with missing data values could be excluded without fear of
serious miscalculations.
44
These data are used to describe the behaviors and characteristics of the
evaluation participants with a specific focus on the timing of their victimization
experiences, as well as their delinquent activities including alcohol/substance use.
The current study does not attempt to assess the effectiveness of the after-school
programs.6 Additionally, the sample is not necessarily representative of any well-
defined population. Rather, it is a convenience sample of juveniles in grades six
through 12 who participated in the evaluation of the MASOFP initiative conducted
by the University of Maryland.
It should be noted that one potential concern with using this type of sample
is that after-school programs in general may attract a less victimized and less
delinquent sample than a nationally representative sample of youth (Gottfredson et
al., 2001). Much research has been conducted on after-school programs. However,
the majority of these evaluations failed to account for selection bias. After-school
programs may attract youths who already possess many of the necessary skills for
healthy development while at-risk youth may stay away from after-school programs.
Therefore, selection bias is a legitimate concern when one is evaluating the
differences between youth in after-school programs and other youths because any
observed effect may simply be an artifact of this selection bias.
Selection bias in this study’s sample would be a legitimate concern if the
goal was to examine the effects of an after-school program on the participant’s
potential problem behaviors. However, the aim of the current study is to examine
the timing of juveniles’ victimization, delinquency, and substance using behaviors
6 The evaluation of the MASOFP initiative is still in progress and a final report is due in June 2004.
45
and no attempts are made to examine the effect of after-school programs. Therefore
any concerns regarding selection bias are immaterial to the objectives of this study.
Additionally, it is likely any potential selection bias is not so extreme as to
result in the sample being free of adolescent victimization, delinquency and other
related problem behaviors, which was the conclusion reached in a previous study
which encountered a similar sample scenario (see Agnew, 2002). In addition, in
their analyses of the National Youth Survey (NYS), Lauritsen and colleagues
(1991:270) suggest even though victimization is statistically an uncommon event
among most age groups, samples that focus exclusively on youth can be considered
a “high risk” simply because of their focus exclusively on youth. It seems
reasonable to suggest the same conclusion can be reached regarding offending
behavior.
However, in order to assess the potential concern that this study’s sample
may be biased towards “good youth”, an examination of the victimization,
offending, and substance using rates in this sample are compared to the rates in
other nationally representative samples of juveniles. In general, the rates for these
behaviors reported by the current sample appear to be comparable to those rates
reported by national samples using similar measures. In particular, the delinquency
and last-year substance use measures can be directly compared to the sample from
the National Study of Delinquency Prevention in Schools (NSDPS) study
(Gottfredson et al., 2000) since the items measuring the delinquency and substance
use scales in the current study were based on the same items used in the NSDPS
sample. The NSDPS sample is a nationally representative sample of youths in
46
grades six through 12 and includes a sample of 16,318 juveniles’ ages 11 through
18. The delinquency scale for both the NSDPS sample and the current study’s
sample has a mean score of 0.13 after the possible response values were recoded in
the current sample to match the dichotomous (Yes/No) format utilized in the
NSDPS sample. The average last-year substance use scores for the two samples
were not as closely matched. The NSDPS sample has a higher mean score of 0.23
in comparison to the current study’s mean score of 0.10. Although the NSDPS
sample reports a higher average score for the last-year substance use measure, this
may be partially explained by the demographic composition of the two different
samples. The NSDPS sample included a higher percentage of white youths (68.2
percent) than the MASOFP sample (42.3 percent). Recent data from national
surveys measuring juvenile substance use, such as the Youth Risk Behavior Survey
(Center for Disease Control and Prevention, National Center for Chronic Disease
Prevention, 2001) and the Monitoring the Future survey (Wallace, Bachman,
O'Malley, Johnston, Schulenberg, and Cooper, 2002), have consistently shown that
white juveniles report higher levels of substance use, especially alcohol use, than
non-white juveniles.
However, given the difference in the mean substance use scale scores
between the two samples, a further examination of the mean scores for all three of
the behavior measures (i.e. victimization, delinquency, and substance use) among
different demographic groups would help verify the reporting rates of the MASOFP
sample to those reported in other nationally representative data. Furthermore, the
legitimacy of the current study’s sample is strengthened if the levels of delinquency
47
and drug use among respective demographic groups (e.g. whites and non-whites,
males and females, and middle v. high school studentsl) are similar to those reported
in the NSDPS sample as well as those observed in prior research.7 Appendix B
presents the mean victimization, delinquency, and substance use scale scores
aggregated by race, gender, and grade level. These data confirm the delinquency
levels reported in the current study’s sample by each of the respective groups are
quite similar to those reported in the NSDPS sample. Furthermore, as one would
expect based on other national data sources, both delinquency and victimization are
elevated for non-white and male students.
However, the mean substance use scale scores are approximately half those
reported by each of the respective groups in the NSDPS sample. This indicates, on
average, the MASOFP sample reported substantially less substance use than the
nationally representative sample. In addition, it does not appear the overall lower
rate can be explained by the greater proportion of non-white students in the
MASOFP sample. Contrary to what one would expect based on current national
data, white students did not report higher levels of substance use relative to non-
white students. However, the gender and grade level patterns are consistent with
prior findings since males (0.11) and high school students (0.12) reported a higher
average substance use score than their female (0.10) and middle school
counterparts, respectively (0.10).
7 The means scale score for victimization can not be directly compared to any nationally representative sample since the seven individual items used in the current study’s scale have not been incorporated by prior research.
48
The overall low scale score for last-year substance use in the MASOFP
sample at first glance suggests the MASOFP sample likely under-reported their own
substance using behaviors. However, since the average delinquency and
victimization scales scores are consistent with those observed in other nationally
representative samples, it is not clear why students would seem to truthfully report
their own delinquent behavior while “holding back” regarding substance use.
A closer examination of the prevalence of juvenile substance use by the
respondents’ ages suggests the MASOFP sample and NSDPS sample may not differ
as much as it initially appeared. Appendix C presents the proportion of juveniles
who reported any substance use in the past year for both of the respective samples
by the age of the survey respondent. When one considers the prevalence of
substance use by age, the rate of use by the two samples more closely mirrors each
other. In fact, from age 11 through 14, the rates of substance use for the MASOFP
sample are almost identical to those reported in the NSDPS sample. The rates
diverge much more past age 15. However, the number of juveniles over age 15 in
the MASOFP group is very small (n=48) and represents only six percent of the total
sample. Furthermore, the average NSDPS participant was a 14-year old eighth
grader. Accordingly, even when comparisons are made between the average
substance use scores for middle school students in the two samples, the NSDPS
middle school sample will consist of a group that is a full one-year older on average.
As illustrated in Appendix C, 30 percent of MASOFP 12-year olds reported using
any substance in the past year in comparison to 40 percent of 13-years olds. In
summary, the lower average substance use scale score reported by the MASOFP
49
sample is being driven by the younger average age of the group as a whole.
Therefore, the apparent disparity in the reported substance use rates is not as severe
as initially suspected and conclusions regarding the sample’s substance using
behaviors can be interpreted without fear of serious miscalculation.
Finally, five of the seven of the individual victimization items used in this
study were adapted from the Denver Youth Survey (DYS) instrument (Huizinga and
Esbensen, 1990). Therefore a comparison of the annual prevalence rates for
victimization from the DYS is also appropriate. In general, the annual prevalence
rates from the two samples are comparable. Menard (2000) reported that
approximately half of the 1,530 youth in the DYS sample report any annual
victimization, which is consistent with the current study’s sample in which 56.5
percent of the sample report any victimization within a one-year time period.
In sum, the current study’s sample may not be generalizable to any particular
population of juveniles, however the sample’s levels of delinquency, substance use,
and victimization suggest the population cannot be considered a low-risk sample
when compared to other nationally representative samples. Additionally, the current
data set has the advantage of addressing many of the limitations of previous data
sets previously discussed and can provide key information about the timing and
circumstances of specific juvenile criminal events. Consequently, the potential
benefits from examining the information contained in this sample, coupled with the
general higher risk nature of a juvenile population, somewhat alleviates the potential
concern of selection bias from the non-generalizable sample of after-school program
evaluation participants.
50
Identification and Operationalization of Constructs
The measures utilized in this study are operationalized from the respondent’s
answers to a series of questions asking about their own victimization, delinquency
and substance use experiences as well as the timing of these individual events. The
operationalization of the main variables of interest, which include juvenile
victimization experiences, delinquent involvement, and substance use are described
first, followed by a description of the operationalization of repeat victims,
delinquents and substance users. The last section describes the operationalization
of the timing of these individual events.
Victimization
Victimization experiences were measured using respondent’s answers to a
variety of victimization questions. The victimization scale includes seven items
adapted from the Denver Youth Survey (Huizinga and Esbensen, 1990). Each
subject was asked how often any of the seven individual crimes had been committed
against him or her in the past 12 months. The possible responses for each of these
victimization items allowed the respondent to answer never, coded “0”, once, coded
as a “1” or two or more times, which was coded as a “2.” This type of response
category was utilized in order to provide a proxy measure for the frequency of each
individual victimization item in order to address the third research question which
addresses the occurrence of repeat victimizations. A further discussion of the
operationalization of repeat victimizations is provided in a subsequent section.
51
The victimization scale includes questions which examine common juvenile
victimization experiences such as being threatened with a beating, being hit by
someone (simple assault), having someone use a weapon or strong-arm methods to
get money or things (robbery), being attacked with a weapon or having someone
trying to seriously hurt you (aggravated assault), having a pocket picked or wallet
snatched, having things other than a wallet or purse stolen (theft), and having things
damaged on purpose (vandalism). Responses to the seven individual victimization
items were then averaged to produce a composite scale of juvenile victimization.
The victimization scale has a possible range from zero to two, where “0” represents
no juvenile victimization and “2” represents high juvenile victimization. Table 4
displays the descriptive statistics for each of the separate aggregate scale measures
examined in this analysis. The aggregate victimization scale has a mean of 0.25, a
standard deviation of 0.34, and a reliability of 0.73.
In order to examine the second research question, which is designed to
analyze the timing of specific victimization experiences, the seven individual
victimization items were also collapsed into two separate subcategories to provide a
breakdown of personal crime victimization versus property crime victimization.
Four of the seven items in the aggregate victimization scale measure the violent
crimes of being hit by someone else, being threatened with a beating, being attacked
with a weapon, and robbery. The four offenses can be considered proxy measures
for simple assault, aggravated assault, and robbery, which constitute approximately
90 percent of all juvenile violent crime arrests (Cook and Laub, 2002). The
remaining three victimization items measure the property crimes of pocket picking,
52
theft and having property damaged on purpose (vandalism). When these items are
disaggregated by category of crime, the alpha reliability for the four-item violent
crime victimization scale is 0.61, while the alpha reliability for the three-item
property crime victimization scale is 0.57. Finally, the violent and property
victimization scales were again broken down by each individual item, which
provided a further disaggregation of victimization experiences by each specific
crime. Table 5 displays the types of victimizations most frequently experienced by
juveniles in this sample.
Delinquency
Delinquent behavior was measured using respondent’s self-reports to a
variety of questions about offending behaviors. The aggregate delinquency scale
included 10 items asking subjects how often they had engaged in any of these
individual crimes in the past 12 months. This scale is based on a scale used by the
researchers of the NSDPS (Gottfredson et al., 2000). The possible responses for
each of these delinquency items allowed the respondent to answer never, coded “0”,
once which was coded as a “1” or two or more times, which was coded as a “2.”
Similar to the victimization items, this type of response category was incorporated
in order to provide a proxy measure for the frequency of each individual
delinquency item in order to address the third research question regarding the
frequency of committing repeat offenses. A further description of the
operationalization of repeat delinquency is provided in a subsequent section.
53
The delinquency scale items included commonly reported juvenile
delinquent behaviors such as damaging or destroying property, stealing, carrying a
hidden weapon, being in a gang fight, hitting or threatening to hit other students,
joyriding, using strong-arm methods to get money or things from a person, and
breaking into a building. Responses to the 10 individual delinquency items were
then averaged to produce a composite scale of a respondent’s delinquent behavior.
The delinquency scale has a possible range from zero to two, where “0” represents
no delinquent involvement and “2” represents high delinquent involvement. This
aggregate delinquency scale has a mean of 0.20, a standard deviation of 0.30 and a
reliability of 0.80.
In order to examine the second research question, which is designed to
analyze the timing of specific criminal events, the 10 individual delinquency items
were also collapsed into two separate subcategories in order to provide a breakdown
of personal crime delinquency versus property crime delinquency. Four of the 10
items in the aggregate delinquency scale measure the violent crimes of carrying a
weapon, gang fighting, hitting or threatening to hit a fellow student (simple assault),
and using force or the threat of force to get property (robbery). The six remaining
items measure the property crimes of vandalism, theft less than $50, theft more than
$50, theft at school, joyriding, and breaking into a building or car. When these
items are disaggregated by category of crime, the alpha reliability for the four-item
violent crime delinquency scale is 0.60, while the alpha reliability for the six-item
property crime delinquency scale is 0.75. Finally, the violent and property
delinquency scales were again broken down by each individual item, which
54
provided a further disaggregation of delinquent events by each specific crime.
Table 6 indicates the percentage of youth who reported each type of delinquency in
this sample.
Substance Use
Juvenile substance use was measured using respondent’s self-reports to a
series of substance using behaviors. The aggregate substance use scale included
five items asking subjects how often they had used each of these individual
substances in the past 12 months. This scale is based on a series of questions used
by the researchers of the NSDPS (Gottfredson et al., 2000). The possible responses
for each of these substance use items allowed the respondent to answer never, coded
“0”, once which was coded as a “1” or two or more times, which was coded as a
“2.” This type of response category was incorporated in order to provide a proxy
measure for the frequency of each individual drug use item in order to address the
third research question regarding the frequency of committing repeat offenses.
The substance use scale items included smoking cigarettes, using smokeless
tobacco, drinking beer, wine or “hard” liquor, smoking marijuana, and taking
hallucinogens (such as LSD, ecstasy, mescaline, PCP, peyote, or acid). Responses
to the five individual substance use items were then averaged to produce a
composite scale of a respondent’s substance use. The substance use scale has a
possible range from zero to two, where “0” represents no substance or alcohol use
and “2” represents high substance use. This aggregate substance use scale has a
mean of 0.15, a standard deviation of 0.30, and a reliability of 0.67.
55
In order to address the second research question, which is designed to
analyze the timing of specific criminal events, the five individual substance use
items were examined separately in order to provide a disaggregation of substance
use by each type of substance. Table 7 reports the percentage of juveniles who
reported using each type of substance.
Repeat Offenses
In order to examine the third research question, which explores whether
higher-risk (or repeat-incident) individuals commit delinquent behavior or are the
victims of crime at any specific time, the respective behavior measures were
examined in order to assess the differences between the relative risk levels of
individual victims, delinquents, and substance users. For the purpose of this study,
the aggregate repeat measures include any time an individual reported being the
victim of or committing any individual offense two or more times in the 12 months
preceding the administration of the survey. Since an individual may have also
reported two different victimization, delinquency, or substance use experiences, the
repeat measure also includes those individuals who reported two or more different
offenses that occurred during the same time period8 (e.g. before school). Therefore
a repeat aggregate victimization, delinquency, and substance use dichotomous
measure was created for each individual where a no response was coded “0” and a
8 The repeat measure could only include individuals who reported two different offenses at the same time because the timing measure could not be computed if an individual reported these separate offenses at differing times.
56
yes response was coded “1.” Table 8 presents the breakdown of the number of
individuals reporting any repeat victimization, delinquency, or substance use.
In order to examine the timing of repeat individual offenses, an analysis was
performed to identify those individual events that were reported two or more times
in the last year by at least five percent of the sample.9 In total, four of the seven
victimization items, four of the 10 delinquency items, and two of the five substance
use items were reported as repeat incidents by at least five percent of the total
sample.
Timing of Victimization, Delinquency, and Substance Use
This section discusses the operationalization of the timing of specific illegal
behaviors. In order to address this study’s major objective of providing a more
accurate understanding of the times juveniles are most likely to offend, use illegal
substance, and/or be the victims of a crime themselves, this sample included a more
precise measure of the timing of these dependent variables than previously
employed in research with similar objectives. As previously stated, survey
respondents were first asked to answer a series of individual questions about how
often they either committed or were the victim of a variety of delinquency,
substance use, and victimization offenses. Those respondents who answered “once”
9 The decision was made to limit the analyses of individual repeat offenses to the selected sample of offenses, which were reported by five percent or more of the total sample because the individual number of cases for these repeat events reported by less than five percent of the sample were too small to allow for sufficient variability of these events. The individual offenses which were reported by five percent or more of the total sample included: victim of hit by other, victim of threatened beating, victim of theft, victim of vandalism, involvement in gang fights, hitting or threatening to hit others, damaging other property, theft of less than $50, cigarette use, and alcohol use.
57
or “twice or more” to any of the individual offense behaviors were asked to proceed
to a corresponding timing grid which asked them to indicate the one time when they
were most likely to commit each crime, use each substance, or be a victim of each
respective crime. Respondents selected “Yes” (coded with a “1”) for a specific time
period by marking the circle under one of the following time categories10:
• Weekdays, before school• Weekdays, during school• Weekdays, between when school lets out until 6 p.m.• Weekdays, between 6 p.m. until midnight• Weekdays, between midnight and 6 a.m.• Anytime during the weekend
A blank response under any corresponding time period was coded “0” to indicate
the juvenile did not commit a crime or was not a victim of a crime during this time
period. At the same time, a blank response in a particular time period for a youth
who indicated he or she committed or was a victim of a crime “twice or more” may
indicate the youth selected an alternate time period in which he or she was more
likely to have committed or been a victim of that particular crime.
Although this timing grid increased the complexity regarding the
administration of survey, survey administrators read the entire survey aloud and
were trained to ensure all survey participants understood the correct way to
complete this section before proceeding. The added complexity of this section was
necessary in order to provide more precise timing measures than were utilized in
10 Although it cannot be assumed that all youth have the same school schedule, the references to periods before, during, and after school should approximate fairly equivalent absolute time periods. In addition, the referenced time periods allow for the examination of the time when juveniles are most likely to be victimized, commit a delinquent act, or use illegal substances, relative to the school day, which is of particular interest to the current study.
58
similar analyses which examined NCVS data. In addition, these data should be able
to provide a more accurate estimate of criminal events during specific time periods
than official police data such as NIBRS, which may underestimate the true
proportion of criminal events occurring during the school hours (Snyder and
Sickmund, 1999).
Validity of Measures
Whenever self-report data is used in any research design, a discussion of the
validity of this self-report information is necessary. Self-report data are often used
to enhance information obtained from official records. Self-report measures have
been used considerably by researchers to gauge youth’s delinquency and frequently
demonstrated strong concurrent and predictive validity in relation to criteria such as
juvenile court petitions (Farrington, Loeber, Stouthamer-Loeber, 1996). In addition,
previous self-report studies have illustrated that young people are willing to report
accurate information on both minor and serious delinquent activities (Espiritu,
Huizinga, Crawford, and Loeber, 2001). Furthermore, self-report data on
victimization experiences is often considered preferable to official police reports
since a large proportion of victimization, especially juvenile victimization, goes
unreported to the police.
Still, questions regarding self-report validity will always arise because of
concern regarding whether respondents are telling the truth about their victimization
experiences and delinquency participation. Previous research suggests that
exaggeration (over reporting) is a greater concern than underreporting for self-report
59
surveys that cover the previous year (Elliott and Huizinga, 1989). However, the
general conclusion from studies evaluating the validity and reliability of self-report
is they compare favorably with other typical, accepted social science indicators
(Hindelang, Hirschi, and Weis, 1981).
Since this study is mainly concerned with examining the specific timing of
juvenile victimization and delinquency, it is particularly important to verify the
validity of these outcome measures. One method for checking the validity of the
self-report data used in this study is to examine the convergent validity of different
scale measures, by examining the correlation between juvenile delinquency,
victimization, and substance use. Since these aggregate scales generally measure an
underlying latent trait of involvement in problem behavior and since previous
research consistently finds support for a positive relationship between a variety of
juvenile delinquent activities and victimization (Jensen and Brownfield, 1986;
Lauritsen, Sampson, and Laub, 1991; Lauritsen, Laub, and Sampson, 1992;
Esbensen and Huizinga, 1991), these three scales should be significantly correlated.
Appendix D presents the correlations for the aggregate victimization,
delinquency, and substance use measures. An examination of the correlation
between these three scales indicates they are significantly correlated. The
victimization and delinquency scales have a statistically significant correlation of
0.418 (p < .001), the delinquency and substance use scales have a statistically
significant correlation of 0.616 (p < .001), and finally the victimization and
substance use scales have a statistically significant correlation of 0.223 (p < .001).
Additionally, all three scales have statistically significant correlations ranging from
60
-0.504 to -0.186 with the constructs commitment to education, belief in rules, and
positive peer influence (correlations not shown), which previous research has shown
to be related to lower levels of delinquency and substance use (Gottfredson et al.,
2001), as well as victimization (Loeber et al., 2001).
Plan for Analysis
As noted earlier, the majority of previous research suggests juvenile
victimization and offending peak in the hours immediately after-school concludes,
generally including the hours from 3 p.m. to 6 p.m. However, the previously
discussed limitations of these studies suggest more precise timing measures are
necessary in order to confirm or refute these previous findings. This study utilized
an improved research design aimed at addressing these limitations and employs the
analytic strategy described below in an attempt to address the research questions
outlined in the previous chapter.
In order to address the first research question, which seeks to review whether
juvenile victimization and crime in general is more likely to occur during the after-
school hours, the following three hypotheses are examined:
H1a: Juveniles are more likely to be victimized during the after-school hours, as opposed to the other five time periods.
H1b: Juveniles are more likely to commit a delinquent act during the after-school hours, as opposed to the other five time periods.
H1c: Juveniles are more likely to use illegal substances during the after-school hours, as opposed to the other five time periods.
61
The rationale for these first three hypotheses is based on the previously
reviewed literature, which largely outlined an apparent peak in juvenile crime and
victimization during the after-school hours. Since many juveniles are typically
unsupervised during these hours, the declared association between the after-school
hours and subsequent problem behavior seems logical. However, the limitations of
prior research suggest a further examination of whether the observed peak in
juvenile victimization, delinquency, and substance use during the after-school hours
remains after more precise timing measures are employed using a self-report design.
In order to address the second research question, regarding the timing of
specific victimization, delinquency, and substance use behaviors, the aggregated
measures were disaggregated to provide a closer examination of these individual
events. Since the most widely cited research by Snyder and colleagues (1999)
suggests juveniles are most susceptible to violent crime during the after-school
hours, the following two hypotheses are examined:
H2a: Juveniles are more likely to be the victim of a serious crime (or violent offense) during the after-school hours, as opposed to the other five time periods.
H2b: Juveniles are more likely to commit a serious delinquent act (or violent offense) during the after-school hours, as opposed to the other five time periods.
These hypotheses are general statements based on the current expectation
that all juvenile crime and victimization is elevated during the after-school period.
However, a detailed exploration of a greater range of offense seriousness, including
property offenses, is explored.
62
These first five hypotheses are all examined in a similar fashion. Since the
dependent variables (measures of victimization experiences, delinquent acts, and
substance use) are categorical, a chi-square test was employed as the primary
statistical analysis tool in order to determine if the number of incidents of
victimization, delinquency, and substance use observed in each specific time period
was significantly different from the expected proportion given an assumed random
distribution and a proportionate distribution equal to the hours contained in each
time period. The first step in the analysis is to report the proportion of youth who
indicated being victimized or committing a delinquent act in each of the six possible
time periods. These proportions are then standardized by the number of hours
included in each time period and provide a general overview of which time periods
are the most or least likely to produce a juvenile victimization or delinquent act
relative to the number of hours included in each time period.
For all analyses, the number of hours per week included in each separate
time category was the following:
• Weekdays, before school: 2.5 hours per day for 5 days = 12.5 hours, which is 7.44 percent of the hours in each week.
• Weekdays, during school: 6 hours per day for 5 days = 30 hours, which is 17.86 percent of the hours in each week.
• Weekdays, between when school lets out until 6 p.m.: 3.5 hours per day for 5 days = 17.5 hours, which is 10.42 percent of the hours in eachweek.
• Weekdays, between 6 p.m. until midnight: 6 hours per day for 5 days = 30 hours, which is 17.86 percent of the hours in each week.
• Weekdays, between midnight and 6 a.m.: 6 hours per day for 5 days = 30 hours, which is 17.86 percent of the hours in each week.
• Anytime during the weekend: 24 hours per day for 2 days = 48 hours, which is 28.45 percent of the hours in each week.
63
The analyses were then refined to more specifically examine the observed
number of individuals who reported each specific victimization and delinquent
offense type in each time period in comparison to the number that would be
expected under the assumption of (a) random distribution of victimization and
offending over the six unique time periods and (b) the distribution of victimization
and offending over the time periods that is proportionate to the number of hours
contained in each time period. In order to determine if a particular time period
significantly predicts a particular event, these analyses were limited to those
individuals who reported being victimized, committing a delinquent act, or using an
illegal substance at least once in the past 12 months11.
A nonparametric (1 x 6) one-sample Chi-square test was calculated for all of
the aggregated and disaggregated dependent variable measures to compare the
observed frequency of each event within each of the six time periods with the
expected frequency of each event within each time period. Nonparametric tests are
primarily used with populations that are not normally distributed and are also used
to conduct statistical tests if the assumption of normality is violated (George and
Mallery, 2001). In this analysis, a nonparametric Chi-square test is appropriate for
those analyses which assume the expected frequency within each time period is
relative to the number of hours included in that time period as outlined above.
11 In all cases, the results from the Chi-Square analyses under the assumption of equal distribution of the behaviors over the six time periods produced similar results to the analyses assuming a distribution that was proportional to the number of hours contained in each time period. Therefore, relevant tables display only the latter Chi-Square test statistic and results are interpreted based on the assumption that the expected percentages are computed proportionally to the number of hours contained in each time period.
64
Accordingly, if the observed Chi-square (χ2) tests exceed the critical Chi-square (χ2)
of 15.086 (df= 5, p < .01), then there is evidence that the observed number of
incidents of a particular event (e.g. violent victimization) across the six time periods
is statistically different than the expected number if these incidents were distributed
proportionally to the number of hours in each time period. The probability value of
.01 utilized in all statistical tests in this study is a generally accepted threshold for
statistical significance and indicates that the difference in the observed number of
incidents within the six time periods could happen by chance less than one percent
of the time. In order to address the final research question regarding repeat victims,
offenders, and substance users, the following three hypotheses are examined:
H3a: Juveniles are more likely to be a repeat victim during the after-school hours, as opposed to the other five time periods.
H3b: Juveniles are more likely to be a repeat offender during the after-school hours, as opposed to the other five time periods.
H3b: Juveniles are more likely to be a repeat substance user during the after-school hours, as opposed to the other five time periods.
These last three hypotheses are explored because previous research has
failed to adequately examine the time when particular levels (i.e. repeat or higher
risk) of offenders and victims are most likely to offend or be the victim of a crime
themselves. After the data were manipulated to create proxy measures for repeat
victimization, delinquency, and substance use (as described in Chapter 3), these last
hypotheses were examined utilizing the same plan for analysis as described above.
65
One potential complication with the analytic strategy employed to address
all of the respective hypotheses arises if respondents reported being victimized or
committing a delinquent act in more than one time period.12 A further examination
of an “overlap” in the reporting of any victimization or delinquent act in more than
one of the six time periods examined is necessary because this overlap in reporting
would violate the independence assumption required by the chi-square test. The
percentage of cases that reported victimization experiences, delinquent activities, or
substance use in multiple time periods varied in each offense category: 38.4 percent
of those who reported any victimization, 45.9 percent of those who reported any
delinquency and 22.8 percent for those who reported any substance use. Overall,
49.8 percent of those who reported any offense (victimization, delinquency, and/or
substance use) reported it at multiple time points. Accordingly, separate analyses
that both included and excluded these overlapping cases were conducted in order to
address this potential complication. The separate analyses were then examined in
order to determine if the outcomes obtained in the analyses that included the
overlapping cases differed from the analyses that excluded these cases. In all cases,
the results from the more conservative method of eliminating those who responded
in multiple time periods were similar to results from the analyses using all cases.
Therefore, only the latter results are presented in the next section.
12 This potential complication is eliminated in the offense-specific analyses since the respondent is reporting the timing for one individual offense in contrast to the analyses of the aggregated measures in which a respondent may report separate offenses during different time periods.
66
CHAPTER 4: RESULTS
This chapter reports the results of the analyses conducted for this study. In
order to address the first research question, the first three sections discuss the results
of the timing analyses for the aggregated offense measures. The second research
question is first addressed in the fourth section, which reports the results of the
analysis for the timing of the violent and property subcategories for victimization
and delinquency. A further exploration of the second research question is provided
in the fifth section, which discusses the results of the analyses for each of the
individual offense behaviors. Finally, the last section addresses the final research
question by reporting the results of the examination of repeat offenses.
Recalling the first research question asked whether juvenile victimization,
delinquency, and substance use behaviors were still more likely to occur during the
after-school hours after utilizing more precise timing measures than employed in
previous research, the first group of analyses focused on the general timing of the
aggregate behavior measures.
Timing of the Aggregate Victimization Measure
In order to get a sense of the underlying relationship between juvenile
victimization and the timing of these events (as addressed in hypothesis 1a), it is
useful to begin by looking at the raw data. As indicated in Table 5, 462 (56.5
percent) of the sample reported being the victim of any type of victimization at any
67
time. The number of individuals reporting any victimization may seem surprisingly
high. However, as previously noted this rate is similar to the rate of victimization
reported by Menard (2000) in his examination of the NYS sample (which used
many of the same measures), who found that roughly 50 percent of the sample
reported being the victim of a crime in any given year. An additional breakdown of
the timing of juvenile victimization is provided in the first row of Table 9, which
indicates the number and percentage of juveniles who reported being the victim of
any type of crime during each of the six time periods. The largest proportion of
juveniles (32.6 percent) reported being the victim of any type of victimization
during the school hours. The next highest period for any victimization was during
the after-school hours (18.0 percent), followed by the weekend period (17.7 percent)
and from 6 p.m. to midnight (6.9 percent) respectively.
These raw percentages provide a basic understanding of what time periods
provide the largest absolute number of victimizations for the total sample’s
population. For example, based on the data presented above, we know that the
largest number of juveniles reported being victimized during the school day.
However, it is also interesting to consider the relative proportion of victimizations in
each time period after controlling for the actual number of hours contained within
each time period. In this scenario, one can consider the likelihood of victimization
in each time period relative to the amount of actual time available for one to become
a victim in each period. Figure 1 shows the proportion of juveniles who reported
being a victim of any type of crime in each time period after the proportions were
standardized relative to the number of hours in each time period. Using this analytic
68
strategy, juveniles were still most likely to be victimized during school, however the
gap in the proportion of juvenile victimizations reported during school and after-
school hours is smaller than that observed in the raw proportions. Additionally, the
standardized proportions indicate the likelihood of victimization for juveniles was
greater before school than during the weekend, considering the before school period
contains approximately one-fourth (12.5 hours) of the actual numbers of hours
included in the weekend period (48 hours).
However, the main goal of this study is to determine the timing of the
victimization (or delinquency/substance use) for those individuals who actually
experienced these behaviors. Accordingly, hypothesis 1a is further examined in a
final analysis of the timing of the aggregate victimization measure, which is limited
to the total number of individuals who reported one or more victimizations (n = 686)
in each of the six separate time periods.13 Table 10 displays the observed
percentage distribution of victimizations reported in all six time periods for those
individuals who reported one or more victimizations. Among those individuals who
reported any victimization, the largest portion of victimization experiences (38.8
percent) was reported during school hours, followed by the after-school hours (21.4
percent) and during the weekend (21.2 percent) respectively.
The Chi-square (χ2) statistic reported on Table 10 tests for the independence
of each type of victimization across time periods, after adjusting for the different
13 The number of cases (n=686) for this analysis is larger than the number of cases (n=462) for those individuals who reported any victimization at all because individuals who reported one or more victimization experiences in different time periods are included in each time period for which they reported being victimized. For example, an individual who reported being the victim of theft during school and a victim of vandalism after school would be counted in both time periods.
69
number of hours in each period to assume an expected distribution of victimization
proportional to the number of hours in each period. The obtained χ2 value of 378.9
exceeds the critical χ2 of 15.1 (df= 5, p < .01) indicating that victimization varies
significantly by time period. The figures in parentheses on the table provide the
difference between the observed percentage of youth who reported any
victimization and the expected percentage of youth who reported any victimization
for each time period under the assumption that the percentages will be distributed
proportionally to the number of hours in each period. For example, the observed
percentage of victimized juveniles who reported any victimization during school
exceeds the expected percentage for any victimization during school by 20.9 percent
providing further evidence that juveniles were more susceptible to victimization
during school hours than during any other time. Any victimization was also
elevated during the after-school hours (+11.0 percent) and was depressed in the four
remaining time periods.14
Timing of the Aggregate Delinquency Measure
An examination of the raw data for juveniles regarding their levels of
aggregate delinquency indicates 449 (55.0 percent) juveniles reported committing
14 Not surprisingly, victimization was depressed in the midnight to 6am period when most juveniles in this study’s age range (10-17) are typically sleeping. In fact, for all the subsequent analyses, each of the observed behaviors were depressed during this time period relative to the expected proportion of cases if they were distributed proportionally to the number of hours contained in each period. One might argue the observed timing patterns would be altered if these analyses were executed without this midnight to 6am period. However, this time period still remains a viable option for youth to report offending behavior even if most juveniles would not report any at this time. Furthermore, since only two to three percent of each of the various offenses are reported at this time, neither the observed timing patterns nor the variation of these behaviors across time would be substantially altered by the exclusion of this one time period.
70
one or more delinquent acts at any time (see Table 6, first row). Similar to the
percentage of juveniles who reported any victimization, the rate of delinquency is
higher than might be expected primarily because of the inclusion of the “hit or
threatened to hit other students” item. In total, 45.7 percent of the survey
respondents reported committing this offense. A further dissection of juveniles’
aggregated delinquency, relative to timing of their offending behavior (as addressed
in hypothesis 1b), is provided in Table 9 (row four). A similar pattern regarding the
timing of juvenile victimization is found for the aggregate delinquency measures.
The largest number of juveniles (n=319, 39 percent) reported committing one or
more delinquent acts during the school hours. Juveniles were next most likely to
report a delinquent act during the weekend (19.6 percent) followed by the after-
school hours (18.8 percent). The remaining three time periods contained a fairly
equivalent percentage of youths reporting delinquent acts.
In order to consider the relative proportion of delinquency in each time
period after controlling for the number of hours contained within each time period,
Figure 2 displays the proportion of juveniles who reported committing any
delinquent act in each time period after the proportions were standardized. When
the distribution of delinquency was standardized by the number of hours in each
period, juveniles were still most likely to be delinquent during the school hours.
However, juveniles were next most likely to commit a delinquent act during the
after school hours considering the relatively little amount of time contained within
this period.
71
Finally, hypothesis 1b is further addressed by examining the timing of
delinquent behavior across the six time periods for those individuals who actually
reported these behaviors. Therefore the next analysis was limited to the total
number of individuals who reported committing one or more delinquent acts in each
of the six separate time periods.15 The first row of Table 11 displays the observed
percentage distribution of delinquent acts reported across the six time periods.
Among those individuals who reported any type of delinquency, the largest portion
of delinquent acts (42.4 percent) was reported during school hours. The obtained χ2
value of 486.2 exceeds the critical χ2 of 15.1 (df= 5, p < .01) indicating that
delinquency varies significantly by time period. An examination of the differences
between the actual and expected proportions of delinquency for each time period,
where the expected proportions are computed assuming they are distributed
proportionally to the number of hours in each period, indicates delinquency is most
prominent during school (+24.5 percent), followed by the after school hours (+10.1
percent), while delinquency is depressed before school, during the weekends, and
during the evening and late night hours.
Timing of the Aggregate Substance Use Measure
An examination of the raw data for the aggregate substance use measures
indicates 249 (30.5 percent) juveniles reported using any illegal substance at any
15 Individuals who reported one or more crimes in different time periods are included in each time period for which they reported committing a crime. Therefore, the number of cases for this analysis equals 753, indicating some of the 449 individuals who reported any delinquency committed an offense in multiple time periods.
72
time (see Table 7). In order to address hypothesis 1c, the timing of these substance
use behaviors is provided in last row of Table 9, which indicates the number and
percentage of juveniles who reported using any substance during each of the six
time periods. The largest proportion of juveniles (17.0 percent) reported using any
type of substance during the weekend. The next highest period for juvenile
substance use was during the after-school hours (7.5 percent), followed by the
period from 6 p.m. to midnight (7.2 percent) and finally during the before school
period (3.1 percent). Juvenile substance use was reported by less than two percent
of the sample during school and from midnight to 6 a.m.
In order to gain a perspective of juvenile substance use relative to the
number of hours in each period, Figure 3 illustrates the standardized proportion of
juveniles who reported using substances in each time period. After standardizing
the raw proportions of individuals who reported any substance use in each time
period, the data indicate the proportion of juveniles who reported using any type of
substance after school (0.43) was slightly greater than those who reported using any
substance during the weekend (0.35).
Finally, hypothesis 1c was further examined in the next step in the analysis,
which compared juvenile substance use across time periods for those individuals
who admitted using any substance in the 12 months prior to the administration of
the survey. Accordingly, the next analyses were limited to the total number of
juveniles who reported using any type of substance one or more times in any of the
73
six time periods.16 As displayed in Table 12, the obtained χ2 value of 124.1 exceeds
the critical χ2 (df= 5, p < .01) of 15.1, indicating that substance use varies
significantly by time period for these individuals. An examination of the
percentages reported in parentheses on Table 12 indicates the difference between
the observed percentage of youth who reported any substance use versus the
expected percentage of youth who reported any substance use was largest during the
weekend period (+16.6), followed by the after school hours (+9.4), from 6 p.m. to
midnight (+1.3), and before school (+0.7) when the expected percentages are
computed assuming all substance use experiences were distributed proportionally to
the number of hours in each time period. Accordingly when the analyses were
limited to those individuals who reported using any substance, the weekend period
replaces the after school period as the most common time for juveniles to report
using any substance. The after-school hours are still an elevated period for juvenile
substance use, but the difference between the observed and expected percentage is
not as large as the difference reported for the weekend time period. It should also
be noted that in contrast to victimization and delinquency, juveniles were
substantially less likely to use any substance during the school hours.
In summary, the above results addressed the first three research hypotheses
by examining the timing of the aggregated juvenile victimization, delinquency, and
substance use measures. Contrary to the central position asserted in each of the
16 Individuals who reported using one or more substances in different time periods are included in each time period for which they reported substance use. Therefore, the number of cases for this analysis (n=308) indicates some of the 249 individuals who reported any substance use, used substances in multiple time periods.
74
related hypotheses, juveniles were generally not more likely to report any of the
aggregated offense measures during the after-school hours. In each case, the data
were examined from a few different perspectives. In general, all analyses suggested
that both victimization and delinquency are most likely to be reported during school
hours, while substance use is most commonly observed during the weekend hours.
However, important differences in specific types of offenses may have been
minimized due to the aggregation of the offense measures. Therefore, the following
sections provide a more detailed exploration of the individual offenses embedded in
these larger measures.
Timing of Violent and Property Offenses
In order to address the second research question (and hypotheses 2a and 2b)
which called for a more detailed exploration of the different types of victimization
and delinquency, separate analyses were conducted for each subcategory of
victimization and delinquency (i.e. violent and property) in addition to analyses for
each individual offense type within these subcategories (e.g. victim of robbery, theft
of more than $50, and alcohol use). The results for the analyses of the timing of the
violent and property subcategories are presented immediately below, while the
results of the analyses for each individual offense type are presented in the
subsequent section.
75
Violent Victimization
An examination of the raw data is a useful starting point for the exploration
of the underlying relationship between juvenile violent victimization and the timing
of these events. Table 5 presents the number and percentage of youths reporting all
types of victimization at any time. As shown in the second row, 338 (41.4 percent)
of the sample reported being the victim of any violent victimization in the 12
months preceding the survey. The rate for violent victimization appears particularly
high which is primarily due to the simple assault or “hit by someone” item. In total,
32.6 percent of the sample reported they had been a victim of this offense, which
should not be entirely surprising since slightly less than half of the sample reported
hitting or threatening to hit other students themselves. Table 9 indicates the number
and percentage of youths reporting any offense by type of offense and time period.
It is evident by these raw percentages that juveniles are most likely to be the victim
of a violent crime during school hours (17.9 percent).
Recalling the main goal of this study is to determine the timing of the
various juvenile behavior experiences for those individuals who experienced these
behaviors, the next analysis regarding the timing of violent victimization addresses
hypothesis 2a and is limited to the total number of individuals who reported any
violent victimization (n = 422) in each of the six separate time periods. Referring
back to Table 10, one can observe that among those who reported any violent
victimization, the largest portion of violent victimization experiences (34.6 percent)
was reported during school hours, followed by the after-school hours (25.8 percent)
76
and during the weekend (21.6 percent). This is the same pattern that was observed
for the measure of total victimization.
The observed Chi-square (χ2) value for violent victimization reported on
Table 10 of 238.8 exceeds the critical χ2 of 15.1 (df= 5, p < .01) indicating that
violent victimization varies significantly by time period. An examination of the
differences between the observed percentage of youth who reported any violent
victimization and the expected percentage of youth who reported any violent
victimization for each time period under the assumption that the expected
percentages will be distributed proportionally to the number of hours in each period
also indicate that juvenile violent victimization is most prominent during the school
hours (+16.7 percent), followed closely by the after-school hours (+15.4 percent).
Relative to their expected percentages, violent victimizations are depressed in the
four remaining time periods.
Property Victimization
While total victimization and violent victimization presented nearly identical
timing patterns, the distribution of property victimization across the six time periods
presents a slightly different picture. Starting with the raw percentages shown in
Table 5, the data indicate that 333 (40.8 percent) of the survey respondents reported
being the victim of one or more property victimizations at any time. A further
dissection of property victimization by time period (displayed in Table 9) indicates
the largest percentage (20.9) of youth reported being the victim of a property crime
during the school hours. However, for the first time in relation to all juvenile
77
victimizations, the percentage of juveniles who report any property victimization is
next highest during the weekend (11.3 percent).
Recalling hypothesis 2a explores the timing of differing severity levels of
victimization, the next step in the analysis was to compare property victimization
across time periods for those individuals who reported being the victim of one or
more property crimes in the 12 months preceding the survey. Among all types of
victimization, property victimizations show the most variability across time. This is
indicated by the range of observed percentages reported across the six time periods
as well as the difference in observed and expected percentages reported in
parentheses in the last row of Table 10. This table shows property victimization is
extremely high during the school hours as 42.9 percent of all observed property
victimizations occur during this time frame. A substantial portion of observed
property victimizations was also reported during the weekend hours (23.1 percent),
however this effect is diminished when compared to the expected percentage
relative to the larger number of hours contained in the weekend hours. In other
words, when one considers the weekend period contains 48 hours, the difference
between the observed percentage and the expected percentage reveals that property
victimization is actually slightly depressed during the weekend (-5.4 percent).
Violent Delinquency
Table 6 presents the number and percentage of youth reporting all types of
delinquent acts at any time. As shown in the second row, 398 (48.7 percent)
juveniles reported committing a violent delinquent act at any time in the 12 months
78
preceding the survey administration. An examination of the timing of violent
delinquency in Table 9 reveals that 35.4 percent of the sample reported a violent
delinquent act during the school hours while 10.4 and 10.3 percent reported
committing a violent crime during the weekend and after-school periods,
respectively.
In order to examine hypothesis 2b, the analysis of the timing of violent
delinquency for those individuals who admitted committing one or more violent
crimes is presented in Table 11. Among all types of delinquency, violent
delinquency shows the most variability across time and violent crimes are extremely
high during the school hours. In fact, the difference in the observed percentage
versus the expected percentage (+37.0) if these crimes were distributed
proportionally to the number of hours in each period is almost seven times greater
than the difference reported for the only other period when violent delinquency is
elevated, the after-school hours. These numbers are primarily driven by the “hitting
or threatening to hit other students” item, as 34 percent of the total sample admitting
to committing this offense during school hours suggesting that among this selected
sample, fighting during the school day is highly prevalent.
Property Delinquency
With the exception of the aggregate substance use measures, the results so
far have consistently suggested that among those juveniles who reported
involvement in any of the behaviors discussed, the hours during school are the most
troublesome. However, the 269 (32.9 percent) juveniles who reported committing a
79
property delinquent act at any time in the 12 months prior to the survey indicated
they were more likely to commit a property delinquent act during the after-school
and weekend hours, at least in terms of raw percentages. Referring back to Table 9,
the largest number of survey respondents reported property delinquency during the
weekend (n = 119, 14.6 percent) and after-school hours (n = 95, 11.6 percent).
However, among those juveniles who reported one or more property
delinquent acts, the greatest difference in the observed percentage of juveniles who
reported these acts versus the expected percentage occurs in the after school hours
(14.9 percent), assuming the expected percentages were distributed proportionally to
the number of hours in each time period (see Table 11). Property delinquency is
also elevated during school and weekend hours, but the observed percentages are
not as great when compared to the after-school hours.
Timing of Individual Offenses
Recalling the second research question also called for the examination of the
timing of specific victimization, delinquency, and substance use offenses, the next
set of analyses also addressed hypothesis 2a and 2b by providing an exploration of
the independent samples of youth who committed each specific type of behavior.
Since the previously presented results focused on the aggregate measures of
victimization, delinquency, and substance use as well as the violent and property
subcategories, it is perhaps not surprising that little variability in the timing of these
events existed. However, it was significant to find these behaviors are generally
most likely to occur during the school hours, as opposed to during the after-school
80
hours as consistently found in prior research. Accordingly, it is appropriate to
explore the timing of the individual items contained within each encompassing
measure to identify those offenses, which are driving the observed aggregated
results as well as to determine which behaviors diverge from the previously
acknowledged patterns.
Individual Victimization Offenses
Table 5 illustrates how often juveniles reported being the victim of each of
the seven individual victimization offenses at any time. Among the four violent
victimization offenses, the most common victimization experienced by juveniles
was simple assault (32.6 percent), followed by being threatened with a beating (20
percent). The more serious violent victimization offenses, including aggravated
assault and robbery were each reported by less than 7.5 percent of the sample. The
bottom portion of the table, which includes the three individual property
victimization offenses, indicates the most common type of these less serious
offenses was being the victim of a theft (32.9 percent), followed by victim of
vandalism (17.9 percent) and victim of a pocket pick (10.3 percent).
Tables 13 and 14 present the results of the timing analyses, which focused
only on those individuals who reported each separate victimization offense. Table
13 indicates the observed percentage of incidents for each individual violent
victimization offense within each of the six time periods for those individuals who
reported being the victim of each respective offense. For all four individual violent
victimization offenses, the obtained χ2 value exceeds the critical χ2 of 15.1 (df= 5,
81
p < .01) indicating each individual violent victimization offense varies significantly
by time period.
An examination of the distribution of the observed percentages across the six
different time periods for each offense reveals an interesting scenario. For the
individual victimization offenses of robbery and simple assault (i.e. hit by
someone), the largest percentage of victimization incidents was reported during the
school hours, 35.2 and 40.3 percent respectively. Considering the largest number of
observed incidents for any individual victimization offenses was reported for the
simple assault offense during the school period, it is evident this particular offense is
mainly responsible for the timing pattern observed in the larger total victimization
and violent victimization aggregated measures.
Comparatively, the largest observed percentage of aggravated assault (or
attacked with weapon) and threatened beating victimization incidents were reported
during the weekend period (39 and 26.3 percent respectively). However, when
examining the differences between the observed percentages and the expected
percentages (shown in parentheses), both victim of an aggravated assault and victim
of a threatened beating are most prominent during the after school hours.
Table 14 displays the observed percentage of incidents for each individual
property victimization offense within each of the six times periods for those
individuals who reported being the victim of each respective offense. For all three
individual property victimization offenses, the χ2 test is statistically significant
indicating each individual property victimization offense varies significantly by
time period.
82
An examination of the distribution of the observed percentages for the three
property victimization offenses across the six different time periods for each offense
reveals the largest percentage of pocket picking (49.4 percent) and theft
victimization incidents (54.5 percent) was reported during school hours, while the
largest percentage of vandalism victimization incidents was observed during the
weekend (33.1 percent). When examining the differences between the observed
percentages and the expected percentages (shown in parentheses), vandalism
victimization incidents become most elevated during the after school hours after
considering the relative number of hours contained in each of the six time periods.
In sum, simple assault victimizations are extremely high during the school day
while aggravated assault and threatened beating victimization offenses are most
prominent during the after school hours. Consequently, it is important to note that
for the first time in this study, the previously observed pattern of escalated
victimization during the school day does not hold true for all individual offenses.
This pattern is further reviewed in the discussion of results presented in Chapter 5.
Individual Delinquency Offenses
Table 6 shows how often juveniles in the current sample reported
committing each of the 10 individual delinquency offenses at any time. Among the
four violent delinquency offenses, the most common offense committed by
juveniles by far was simple assault (45.7 percent). The next most commonly
reported violent offenses were involvement in gang fights (13.5 percent), carrying a
weapon (8.9 percent) and robbery (6.5 percent). The reporting rates for the six
83
property delinquency offenses were more evenly distributed. Among the property
delinquency offenses shown at the bottom portion of the table, the most common
type of offenses reported was damaging other non-school property (17.7 percent),
followed by theft less than $50 (16.4 percent), damaging school property (13.0
percent), theft more than $50 (8.1 percent), joyriding (6.4 percent) and breaking into
a building or car (5.6 percent).
Tables 15 and 16 present the results of the timing analyses, which was
limited to those individuals who reported each separate delinquency offense. Table
15 reports the observed percentage of incidents for each individual violent
delinquency offense within each of the six times periods for those individuals who
reported committing each of these respective offenses. For all four individual
violent delinquency offenses, the obtained χ2 value exceeds the critical χ2 of 15.1
(df= 5, p < .01) indicating each individual violent delinquency offense varies
significantly by time period.
An examination of the distribution of the observed percentages across the six
different time periods for each of the individual delinquency offenses among those
individuals who reported committing one or more of these offenses reveals there is
more variability across time than one would expect given the results observed in the
aggregated total delinquency analysis (see Table 15). However, a closer look at the
simple assault offense reveals this particular offense was primarily responsible for
the observed pattern of total delinquency and violent delinquency being elevated
during the school hours since approximately 75 percent of all individuals who
reported hitting other students, did so during school.
84
On the other hand, Table 15 illustrates the largest percentage of the three
remaining violent offenses (carrying a weapon, involvement in gang fights, and
robbery) were reported during the weekend hours rather than during the school
hours. However, after controlling for the number of hours in each time period,
involvement in gang fights (+15.3 percent) and robbery (+15.9 percent) were most
elevated during the after-school hours.
Table 16 displays the observed percentage of incidents for each individual
property delinquency offense within each of the six time periods for those
individuals who reported committing one or more of these respective offenses. For
all six individual property delinquency offenses, the χ2 test is statistically significant
indicating each individual property delinquency offense varies significantly by time
period.
The distribution of the observed percentages for the three property
victimization offenses across the six different time periods for each offense reported
in Table 16 indicates the largest percentage of five of the six property offenses are
reported during the weekend hours: 32.1 percent for damaging other property, 50.8
percent for theft of more than $50, 45.2 percent for theft of less than $50, 45.3
percent for joyriding, and 46.9 percent for breaking into a building or car. Not
surprisingly, the sixth property offense, damaging school property, was reported
most often (67 percent of all incidents) during school hours.
An examination of the differences in the observed percentages and the
expected percentages (shown in parentheses), indicates theft of more than $50
(+22.3 percent), joyriding (+16.8 percent) and breaking into a building or car
85
(+18.3) remain most prominent during the weekend hours, when considering the
relative number of hours contained in each of the six time periods. Using the same
interpretation, damaging other property (+21 percent) and theft of less than $50
(+17.7 percent) were most elevated during the after-school hours, while damaging
school property (+49.2 percent) was extremely elevated during school hours.
Individual Substances Use Offenses
The final grouping of individual offenses focuses on juveniles’ reports of
their substance using behaviors. Table 7 displays the number and percentage of
youth reporting the five individual substance use offenses at any time. The most
commonly reported substance used by juveniles was alcohol (25 percent). Juveniles
were next most likely to report using cigarettes (13.8 percent), followed by
marijuana (7.8 percent), smokeless tobacco (3.7 percent) and hallucinogens (1.8
percent).
Table 17 presents the results of the timing analysis, which focused only on
those individuals who reported using each separate substance one or more times.
This table indicates the observed percentage of incidents for each individual
substance use offense within each of the six times periods for those individuals who
reported using each respective type of substance. For four of the five individual
substance use offenses, the obtained χ2 value exceeds the critical χ2 of 15.1 (df= 5,
p < .01) indicating each of these individual substance use offenses varies
significantly by time period. The obtained χ2 value of 4.6 for hallucinogen use did
86
not exceed the critical χ2 of 15.1 (df= 5, p < .01) indicating this substance use
behavior did not vary significantly by time period.
An examination of the distribution of the observed percentages for each of
the individual substance use offenses across the six different time periods shows that
all substances, except hallucinogens, are most likely to be used by juveniles during
the weekend hours. However the results reported for hallucinogen are not very
useful since very few total incidents of hallucinogen use (n = 15) were reported by
the sample. Since, the small number of cases results in insufficient variability
across the six time periods (as evident by the non-significant chi-square statistic
reported in Table 17), the resulting analysis of the timing of hallucinogen use cannot
be interpreted with any level of confidence.
When examining the differences between the observed percentages and the
expected percentages (if the expected percentages were distributed proportionally to
the number of hours contained within each time period), a somewhat different
pattern of the timing of juvenile substance use is presented. For alcohol (+26.4
percent) and marijuana use (+18.2 percent), the weekend hours were clearly the
most prominent period for juveniles to report using these substances. However,
relative to the actual amount of time available to use these substances, cigarette
(+15.6 percent) and smokeless tobacco use (+17.3 percent) was slightly more
elevated during the after-school hours than during the weekend hours. Interestingly,
cigarette, smokeless tobacco, and marijuana use was also high during the before
school period, although the peak was generally not as salient as that observed during
the weekend and after-school periods.
87
In summary, the timing of violent and property offenses and timing of
individual offenses sections presented above addressed the second research question
and its two related hypotheses by examining the timing of the violent and property
subcategories, as well as the individual offense behaviors embedded in these
measures. Juvenile victimization remained most prominent during the school hours
for both violent and property offenses. Similarly, violent delinquency was most
prominent during school hours. However, property delinquency was observed most
often during the weekend hours and was the most elevated during the after school
hours after controlling for the number of hours contained within each of the six time
periods. Consequently, the first analysis considered for the second research
question rejects hypothesis2a and hypothesis2b because juveniles were most likely to
report the violent offense subcategory for both victimization and delinquency during
the school hours.
However, the second research question was also addressed by providing an
examination of the individual offense measures. This crime-specific approach
revealed the timing pattern for individual offenses was more varied than the timing
pattern for the aggregated and subcategory analyses. The most prominent finding
was that simple assault was most elevated during school for both offenders and
victims. Considering a substantial portion of the sample reported being a victim of
and/or committing a simple assault, the elevated during school timing pattern for the
aggregated victimization and delinquency was primarily driven by these offenses.
However, many of the remaining individual offenses were centered around the after-
school hours and somewhat during the weekend hours. In particular, more serious
88
forms of violent crime such as involvement in gang fights and robbery are elevated
after school, while carrying a weapon is most elevated during the weekend.
Therefore, in contrast to the findings reported from the first sets of analyses, an
examination of the individual victimization and delinquency offenses appears to
partially support hypothesis2a and hypothesis2b since being a victim of an aggravated
assault and a being a victim of a threatened beating, as well as committing a robbery
and being involved in gang fights, were most prominent during the after-school
hours. A further discussion of the possible explanation for the individual timing
patterns is provided in Chapter 5.
Timing of Repeat Offenses
In order to address the final research question (and more specifically
hypotheses 3a through 3c), which explore whether high risk (or repeat-incident)
individuals are the victims of or commit delinquent offenses during any specific
time, the final analyses are an exploratory examination of the various repeat
measures included in these data.
Repeat Victimization
It is useful to again begin with an examination of how often survey
respondents reported each type of repeat victimization. As indicated in Table 8,
approximately 30 percent of the sample reported being a repeat victim, while 53.7
percent of those individuals who reported any victimization were also categorized as
repeat victims. In reference to the timing of these repeat victimizations, Table 18
89
indicates the largest number of juveniles (n = 151, 18.5 percent) reported being a
repeat victim during the school hours. The next most common period for repeat
victimization was during the weekend (13.3 percent), followed closely by the after-
school hours (12.0 percent).
In order to determine the timing of the repeat victimization for those
individuals who actually experienced these behaviors (as addressed in hypothesis
3a), the analysis of the timing of the aggregate victimization measure is limited to
the total number of individuals who reported any repeat victimization (n = 444) in
each of the six separate time periods.17 Table 19 displays the observed percentage
distribution of repeat victimizations reported in all six time periods for those
individuals who reported any repeat victimization. Among those individuals who
reported any repeat victimization, the largest portion (34 percent) was reported
during school hours, followed by the weekend hours (24.5 percent) and during the
after-school hours (22.1 percent).
The Chi-square (χ2) statistic reported on Table 19 indicates repeat
victimization varies significantly by time period. As reported in all previous
analyses, the figures in parentheses on the table provide the difference between the
observed percentage and expected percentage of youth who reported any repeat
victimization for each time period under the assumption that the percentages are
distributed proportionally to the number of hours in each period. The greatest
17 The number of cases (n=444) for this analyses is larger than the number of cases (n=248) for those individuals who reported any repeat victimization at all because individuals who reported one or more repeat victimization experiences in different time periods are included in each time period for which they reported being a repeat victim.
90
difference between the observed and expected percentage of juveniles who reported
any repeat victimization was recorded during the school hours (+16.1 percent)
providing further evidence that juveniles were more susceptible to repeat
victimization during school hours than during any other time. Any repeat
victimization was also elevated during the after-school hours (+11.7 percent) and
was depressed in the four remaining time periods.
The next step in the repeat victimization analysis was to explore those
individual repeat victimization offenses, which were most commonly reported.
These included being a repeat victim of simple assault, threatened beating, theft, and
vandalism. 18 Table 20 presents the results of the timing analyses, which focused
only on those individuals who reported each of the four most commonly reported
repeat victimization offenses. For all four individual repeat victimization offenses,
the obtained χ2 value exceeds the critical χ2 of 15.1 (df= 5, p < .01) indicating each
individual repeat victimization offense varies significantly by time period.
Table 20 indicates the distribution of the observed percentage of incidents
for each individual repeat victimization offense within each of the six times periods
for those individuals who reported being the victim of each respective offense. For
the individual repeat victimizations of simple assault and theft, the largest
percentage of repeat victimization incidents were reported during school hours, 37.7
and 48.6 percent respectively.
18 Recall the analyses of individual repeat offenses were limited to the selected sample of offenses, which were reported by five percent or more of the total sample to allow for sufficient variability of these offenses across the six time periods.
91
Comparatively, the largest observed percentage of repeat threatened beating
and repeat theft victimization incidents were reported during the weekend period
(30.3 and 31.5 percent respectively). However, an examination of the differences
between the observed percentages and the expected percentages (shown in
parentheses), reveals that both repeat threatened beating and repeat theft
victimizations are most prominent during the after school hours. In sum, the timing
of these individual repeat victimizations does not substantially differ from the
timing reported for all victimizations included in these same individual offenses.
Repeat Delinquency
As displayed in Table 8, 30.5 percent of the sample reported any repeat
delinquency at any time, while 55.5 percent of those individuals who reported any
delinquency were also categorized as repeat delinquents. In reference to the timing
of these repeat delinquent experiences, Table 18 indicates the largest number of
juveniles (n = 201, 24.6 percent) reported being a repeat offender during the school
hours. The next most common period for repeat delinquency was during the
weekend (15.2 percent), followed by the after-school hours (12.0 percent).
In order to address hypothesis 3b, the next step in the repeat delinquency
analysis was to explore those individual repeat delinquency offenses, which were
most commonly reported. These included repeat involvement in gang fights, repeat
simple assault, repeat damage of non-school property, and repeat theft less than $50.
Tables 21 presents the results of the timing analyses, which focused only on those
individuals who reported each of the four most commonly reported repeat
92
delinquency offenses. For all four individual repeat delinquency offenses, the
obtained χ2 value exceeds the critical χ2 of 15.1 (df= 5, p < .01) indicating each
individual repeat delinquency offense varies significantly by time period.
Table 21 indicates the distribution of the observed percentage of incidents
for each individual repeat delinquency offense within each of the six times periods
for those individuals who reported each respective repeat offense. For the first three
individual repeat delinquency offenses, the reported timing pattern did not differ at
all from the observed pattern reported for all incidents of these individual offenses.
However, the timing pattern for repeat theft of less than $50 was slightly altered
from that observed for all incidents of theft less than $50. In both analyses, the
observed percentage was greatest during the weekend hours, but an examination of
the differences between the observed percentages and the expected percentages
(shown in parentheses), reveals repeat theft of less than $50 was most prominent
during the weekend hours (+23.0 percent). This differs because all incidents of theft
less than $50 were most elevated during the after-school hours. In other words, the
only difference exhibited for the time in which higher risk (or repeat) offenders are
most likely to offend versus the time when all offenders are likely to offend existed
for one single offense - theft of less than $50.
Repeat Substance Use
As indicated in Table 8, 16.4 percent of the sample reported repeat substance
use, while 53.8 percent of those individuals who reported any substance use were
also categorized as repeat substance users. In reference to the timing of repeat
93
substance use (as address in hypothesis 3c), Table 18 indicates the largest number of
juveniles (n = 94, 11.5 percent) reported being a repeat substance user during the
weekend hours. The next most common period for repeat substance use was during
the after-school hours (4.7 percent), followed closely by the 6 p.m. to midnight
period (4.2 percent).
Table 22 presents the results of the timing analyses, which focused only on
those individuals who reported the two most commonly reported types of repeat
substance use. For both repeat cigarette and alcohol use, the obtained χ2 value
exceeds the critical χ2 of 15.1 (df= 5, p < .01) indicating each individual type of
repeat substance use varies significantly by time period.
Table 22 illustrates the distribution of the observed percentage of incidents
for each individual type of repeat substance use within each of the six time periods
for those individuals who reported each respective type of repeat substance use.
The reported timing pattern for repeat substance use was identical to the observed
pattern reported for all incidents of alcohol use, while the timing pattern for repeat
cigarette use was slightly different from that observed for all incidents of cigarette
use. In both analyses, the observed percentage of cigarette use was greatest during
the weekend hours.
However, an examination of the differences between the observed
percentages and the expected percentages (shown in parentheses), where the
expected percentages were distributed proportionally to the number of hours
contained in each time period, reveals repeat cigarette use was most prominent
during the weekend hours (+18.3 percent). This observed pattern is different from
94
the pattern observed for all incidents of cigarette use, which were most elevated
during the after-school hours. Consequently, when taking into consideration the
actual amount of time within each of the six time periods in which an individual
could smoke cigarettes, repeat cigarette users were most likely to smoke during the
weekend as opposed to any other time period.
In summary, the examination of repeat offenses across all offense types did
not reveal many substantial differences between the timing of these repeat offenses
in comparison to the timing of all reported incidents of these behaviors.
Accordingly, one could reasonably conclude the answer to the third research
question, which asked if individuals are more likely to be repeat victims, offenders,
or substance users during different time periods than those observed for all incidents
of these same behaviors, is no. Therefore, hypothesis3a through hypothesis3c can
also be rejected since there is no clear overall evidence that juvenile victimization,
delinquency, or substance use is most prevalent during the after-school hours.
Rather, the timing patterns for repeat offenses, in general, mirror those observed for
all incidents of their respective behaviors.
95
CHAPTER 5: DISCUSSION
This chapter provides a summary and discussion of the results presented in
the previous chapter. Limitations of the research are next reviewed, followed by a
discussion of future research directions, and finally concluded remarks are offered.
Summary and Discussion of Findings
In recent years, after-school programs have received considerable public and
policymaker support for their potential to reduce juvenile delinquency and
victimization. In a public opinion poll conducted in August 2000, eight out of ten
Americans indicated they believed after-school programs could greatly reduce youth
violent crime (Newman et al., 2000). In large part, this support stems from a series
of recent reports, which indicated juvenile crime and victimization peaks between 2
p.m. and 6 p.m. on school days or during the after-school hours (Snyder et al., 1996;
Sickmund et al., 1997; Snyder and Sickmund, 1999).
Other research efforts have examined the timing of juvenile crime and
provided evidence that the after-school crime peak may be more modest than
suggested in the Snyder and colleagues reports (Gottfredson et al., 2001). While
more recent research suggests the timing of juvenile crime may vary according to
crime type (Gottfredson and Soulé, 2003; Jacob and Lefgren, 2003). In addition,
much of the existing research suffers from a few key limitations, which have been
discussed in prior sections of this study. Accordingly, this research has provided
96
mixed evidence regarding the time when juveniles are most likely to be involved in
offending behavior making interpretation of these findings confusing.
Utilizing self- report data collected from a sample of juveniles participating
in an evaluation of after-school programs in Maryland, this study was designed to
clarify our understanding of the timing of juvenile victimization, delinquency, and
substance use by addressing some of the key limitations of previous research. In
order to thoroughly explore this topic, the results of the current study were reported
in various stages of the analyses. The first step was to provide a collective view of
the timing patterns by looking at the aggregate composite scales for victimization,
delinquency, and substance use. The timing pattern presented by this general
overview indicated juvenile victimization and delinquency was most prominent
during the school hours, while substance use was elevated during the weekend. The
next step in the analysis examined the victimization and delinquency violent and
property subcategories (reported in Tables 10 and 11) and again indicated that
violent victimization, property victimization and violent delinquency were most
prominent during the school hours. However, property delinquency was most
elevated during the after-school hours.
Consequently, when juvenile victimization and delinquency were measured
using self-report measures, the results suggest previous research may have
overestimated the after-school crime peak.19 Most likely, this stems from a reliance
19 Interestingly, property crimes were not included in the series of reports by Snyder and colleagues, which highlighted the observed peak in after-school crime. However, the current study’s analyses revealed the property delinquency subcategory was the only aggregated crime type that was elevated during the after-school hours.
97
solely on official reports of crime, such as those obtained in the NIBRS data. In
their analysis of the NCVS data, Whitaker and Bastian (1991) found that only nine
percent of violent crimes against juveniles occurring in school were reported to the
police compared with 37 percent of those occurring on the streets. Similarly, in
their review of juveniles, ages 12 through 17, from the 1995-1996 NCVS data,
Finkelhor and Ormrod (1999) noted that approximately 15 percent of school
victimizations of juveniles were reported to police, while approximately 37 percent
of non-school victimizations were reported to the police. These findings suggest
official police data will underestimate juvenile crime and victimizations that occur
at school because many of these crimes never reach the attention of the police.
Notably, the next step in the analysis, which included an examination of the
individual offenses, revealed more variation in the timing of juvenile victimization
and delinquency. Of particular interest, the more serious violent offenses for both
victimization (e.g. victim of an aggravated assault) and delinquency (e.g.
involvement in gang fights and committing a robbery) were elevated during the after
school hours, while simple assaults offenses (for both victims and delinquents) were
overwhelming most prominent during school hours.
If one categorizes these individual offenses as minor and serious violent
crimes, a distinct pattern about in-school and after-school juvenile crime becomes
apparent. More specifically, the most commonly reported type of victimization and
delinquency was simple assault. The evidence clearly suggests these incidents are
most prominent during the school day. In other words, juveniles are involved in
many incidents that result in one student hitting another while in school. This
98
finding is similar to that reported by a nationally representative survey of school
officials. According to data recorded in the 1996-1997 Principal/School
Disciplinarian Survey conducted through the National Center for Education
Statistics (NCES) Fast Response Survey System (FRSS), school officials indicated
that physical attack or fights without a weapon were the most commonly reported
crimes at the middle and high school levels (USDE, 1997).
Perhaps, the observation that simple assaults are elevated during school,
while aggravated assaults are more prominent after-school, may be reflective of an
escalation or “spill-over” effect of student fighting. In other words, one can
imagine a scenario where some in-school fights are carried over to the after-school
and weekend hours and become more serious (e.g. gang involvement or becoming
the victim of an aggravated assault) as they move away from school where the
possibility of being caught by school officials is diminished. Based on personal
observations during numerous visits to Maryland schools during and after school
hours, this possible scenario was hypothesized by the author.
Accordingly, two questions regarding student’s estimates of the timing of
minor versus more serious fights were added to a focus group interview conducted
with 276 students at 54 after-school programs, which participated in the MASOFP
evaluation during the 2002-2003 school-year. These focus group interviews were
conducted with approximately five volunteer after-school participants at each
program during observations conducted by University of Maryland evaluation staff
shortly after the administration of the pre-test surveys. The main purpose of the
focus group interviews was to ask participants general questions about how much
99
they liked or disliked the program, what they would change about the program,
what they would do if they did not attend the program, etc.
Relevant to this study, focus group participants were asked two questions
about their perception of the timing of all students’ fights. They were asked to
volunteer the time they thought a minor and conversely a more serious fight was
most likely to take place during the day20. The results to these two questions are
reported in Table 23. Slightly less than two-thirds (62.5 percent) of the focus
group participants believed minor fights among students their age were most likely
to occur during school hours. On the other hand, the largest number of focus group
participants (41.5 percent) believed more serious fights were most likely to occur
during the after-school hours. While these results are certainly not scientific, they
do provide some support for the suggestion that the observed pattern regarding the
timing of simple assaults versus more serious offenses may be reflective of an
escalation or “spill-over” effect.
The difference in timing regarding more serious and less serious forms of
juvenile violent crime is both supported and contradicted by the findings reported
by Jacob and Lefgren (2003) who suggested that one undesirable side effect of
grouping youth together for schooling is an increase in violent crimes. Jacob and
Lefgren (2003:31) noted that schools increase the level of interactions among
adolescents, thereby raising the likelihood of violent conflicts. Certainly, the
current study’s findings regarding extremely elevated levels of simple assaults
20 A minor fight was described as fights which are fairly minor, end quickly and no one gets seriously hurt. A more serious fight was described as those which are more serious, weapons may be used, someone may be seriously hurt or someone may require medical attention.
100
during the school day would seem to support this theoretical framework. In fact,
when Jacob and Lefgren estimated the influence of school on individual offenses,
the largest reported effect was observed for simple assaults. Furthermore, the
observation in the current study that more serious violent offenses are elevated
after school may reflect that the proximity of youths in school increases conflict,
but the underlying supervision of schools decreases the likelihood of major conflict
between juveniles. Consequently, it seems reasonable to suggest that schools may
serve as the precursor to subsequent, more violent offenses that are committed
outside of the school setting.
A closer examination of the timing of individual property victimizations
suggested that two of the three types of property victimizations measured (theft and
pocket-picking) were most elevated during school hours. While these results
contrast the findings of Jacob and Lefgren (2003) who noted that property crimes
decreased on days when students were in school, they do confirm estimates
provided in the NCVS data. For example, the NCVS data indicates students were
more likely to be victims of theft at school than away from school for all years
between 1992 and 1999, except for 1997 (DeVoe et al., 2002).
Interestingly, students’ reports of their own offending behavior did mimic
the findings reported by Jacob and Lefgren (2003). For all property delinquency
offenses, except damaging school property, which logically was most elevated
during school hours, the after-school and weekend periods were most often reported
as the time juveniles committed these offenses. At first glance, the difference in
reporting patterns between property victimization and delinquency may appear
101
nonsensical. However, the lack of cohesion between the two probably reflects that
the majority of the victims of the juvenile property offenses measured in this study
are likely to be non-students. For example, the three property delinquency offenses
that are most elevated during the weekend hours, theft of more than $50, joyriding,
and breaking into a building, are not likely to be committed against other students
since most would not carry $50 in cash or often keep property valued at $50 or more
in school. Similarly, although data is not available, it seems reasonable to suggest
most students in this sample would not own a car or be affected by a break-in to a
building. Finally, the survey did not specifically measures if students were victims
of these three property offenses and therefore a direct comparison of the timing of
the aggregated property victimization and delinquency measures is not possible.
Additionally, the results regarding the timing of juvenile substance use may
be of particular interest to parents. Perhaps not surprisingly, the greatest percentage
of substance users reported using cigarettes, smokeless tobacco, alcohol, and
marijuana during the weekend hours. However after controlling for the actual
amount of time available to use these substances in each time period, cigarette and
smokeless tobacco use was slightly more elevated during the after-school hours than
during the weekend hours. In reference to alcohol and marijuana use, the weekend
hours were clearly the most prominent period for juveniles to report using these
substances.21 Perhaps these observed timing patterns are a reflection of the relative
seriousness of the substances. Insofar as alcohol and marijuana are likely to need
21 As mentioned earlier, it would be particularly interesting to examine the timing of a more serious substance such as hallucinogens, but reports of hallucinogen use were too rare to provide useful estimates.
102
more privacy to be consumed without fear of repercussions, these results may
suggest they are mostly consumed at non-supervised weekend parties. On the other
hand, students probably have ample opportunities to smoke cigarettes or use
smokeless tobacco (which is easily concealed) immediately after-school and
perhaps even on school property without the same concern for facing disciplinary
actions from school personnel.
Finally as previously discussed, the examination of repeat offenses did not
reveal many substantial differences between the timing of these repeat offenses in
comparison to the timing of all reported incidents of these behaviors. The lack of
any substantial differences between the timing of all incidents and repeat incidents
may be due to the fact that more than half of those individual who reported any
involvement in victimization, delinquency, or substance use were also categorized
as repeat-incident individuals (see Table 8). Therefore, the results of the analyses
for the timing of all incidents were driven in large part by these same repeat
incidents and the chance of finding distinct differences between the two sets of
analyses was diminished.
Limitations of the Study
As with all research, there are a few key limitations to this study. First, there
was some concern that a sample of youth from after-school programs may be a less
victimized and less delinquent sample than a nationally representative sample of
youth. However, as previously discussed, it appears this sample is generally
comparable in terms of rates of delinquency and victimization with other nationally
103
representative samples. In addition, the general high-risk nature of any juvenile
population provides invaluable information regarding juvenile victimization and
delinquency experiences.
A second limitation is the measures included in this analysis were limited to
juveniles’ self-reporting of their own behavior and characteristics. Previous reviews
of the use of self-report data as a measure of adolescent victimization and
delinquency have suggested that respondents may have substantial reasons for not
reporting truthfully or accurately because of their concerns regarding any potential
repercussions or because they may want to portray a certain image (Thornberry and
Krohn, 2000). Additionally, self-report designs must always be concerned with the
ability of survey respondents to remember events accurately. A type of memory
fading in self-report survey is telescoping, or the tendency of respondents to move
forward and report events that actually took place before the reference period.
However, it is reasonable to assume that the advantages of using self-report
measures in this study, including a presumably more accurate account of the crime
that is underestimated by official records, outweigh these potential sources of
reporting error. In addition, highly respected instruments such as the NCVS and the
YRBSS use similar self-report methodology and are considered to be standard
approaches to exploration of juvenile high-risk behaviors (Kann et al., 2000).
A third limitation is that while this dataset includes measures of property
victimization (e.g. theft) and personal victimization (e.g. robbery), the data does not
provide information on other types of victimization such as sexual assault and intra-
family victimizations. This is a concern since youth are more vulnerable to these
104
types of victimizations than their adult counterparts (Finkelhor, 1997).
Additionally, the data does not provide an adequate measure for bullying, which has
received a great deal of attention since the latest SCS estimates suggest the
percentage of students ages 12 through 18 who reported being bullied at school was
more prevalent than thought and showed a slight increase from the 1999 SCS
(DeVoe et al., 2002). While there is no single accepted definition of bullying,
Farrington (1993:384) suggests most researchers agree bullying involves certain key
elements such as "physical, verbal, or psychological attack or intimidation that is
intended to cause fear, distress or harm to the victim; an imbalance of power, with
the more powerful child oppressing a less powerful one; absence of provocation by
the victim, and repeated incidents between the same children over an extended
period of time." While the data used in this study provide some measures, which
mimic “bullying acts” such as being hit by someone or being threatened with a
beating, the data do not provide a defensible measure of bullying as outlined by in
previous research (Farrington, 1993). Consequently, this study is unable to provide
a complete understanding of the entire range of all youth victimization and
offending experiences.
A fourth limitation of the current study’s data concerns a possibility of
seasonality issues relative to the timing measures and the reference period of one
year for the outcome measures. More specifically, the questionnaire completed by
the study’s participants asks respondents to report the timing of their delinquent
behaviors and victimization experiences relative to time periods concentrated
around the school day (e.g. before, after, and during school). However, the one-year
105
reference period obviously includes some periods of time where the respondent was
not in school (such as during the summer months and holiday breaks). Still, a
timing effect during the summer months or during holiday breaks would not be
expected. Since this study did find variability across the referenced time periods, it
suggests respondents discounted these time periods and reported their behaviors
relative to their school calendars. Perhaps this seasonality issue could have been
avoided by asking juveniles to keep detailed time calendars of their behaviors on a
daily basis. However, this type of research design would be logistically difficult
given the size of the population participating in the overall MASOFP evaluation and
the amount of additional information that needed to be collected for the overall
evaluation. In sum, there will be some imprecision with the timing measures
afforded in these data. However, I am satisfied these unique data have still
significantly improved measures of the timing of juvenile victimization,
delinquency, and substance use beyond what is available from other existing
resources.
The final limitation of this research is the study uses a cross sectional design
and therefore cannot provide information on chronic offenders or victims. In other
words, the cross sectional nature does not allow for the examination of those
behaviors which occur in more than one study period. Therefore, a more in-depth
research design would incorporate a longitudinal perspective in order to measure
chronic offending that spans a few different time periods. However, this study
should be viewed as a preliminary step in an orderly progress of science. Based on
106
the information derived from these analyses, future studies may utilize a prospective
longitudinal design as the next logical progression in a chain of research.
While each of these limitations suggests the results should be interpreted
with some caution, the previous successful use of similar methodological designs
suggests these limitations should not falsify or undermine any of the findings. In
addition, I contend that the benefits afforded by these unique data, coupled with an
improved research design, which addressed many of the limitations of the existing
research, more than outweigh any potential limitations.
Future Research
Future studies could address some of the limitations discussed in the above
section. For example, the research might benefit from the use of interviews with
individual adolescents that allow the interviewer to use more sensitive screening and
follow up questions when a respondent indicates that he/she has engaged in or been
a victim of a particular delinquent activity. In particular, the interviewer could more
carefully differentiate the timing of individual events when a survey respondent
admitted multiple incidents of a particular behavior type. In addition, interviewers
could carefully track the seasonality of these reported incidents to distinguish
between those offenses reported during the days when school is in session and the
days when students are on a break. These methodological enhancements would
provide a more accurate picture of juvenile victimization and delinquency over
various periods of time and days of the week.
107
In addition, future research should examine the timing of juvenile
victimization, delinquency, and substance use with nationally representative data.
Since the current study’s data are not representative of any clearly defined
population, one cannot confidently assume the results are generalizable to the
population as a whole. Furthermore, the inclusion of other measures of more
serious offenses (e.g. rape and sexual assault), other commonly experienced
offenses (e.g. bullying), and other types of substances (e.g. methamphetamines and
cocaine), would expand the scope of the study by examining a more comprehensive
range of all juvenile offenses. Consequently, the replication of this study with a
wider breadth of behavior measures and the addition of a nationally representative
sample would yield a stronger final product.
Finally, future research may also benefit from the use of longitudinal data,
which would allow one to examine the timing of chronic victimization, offending,
and substance use over multiple time periods. Additionally, a longitudinal design
that incorporated separate measuring periods within a one-year timeframe would
help clarify the limitation of seasonality. Specifically, this type of research design
could provide information on the timing of juvenile behaviors while students are on
a break from school such as during the summer and holiday periods. In summary,
these suggestions for the direction of future research would help shed light on the
timing of juvenile problem behaviors, while providing key evidence that may
enhance juvenile victimization, delinquency, and substance use prevention efforts.
108
Conclusions
The findings reported in this study, considered in whole, suggest that
previous research studies that aggregated all types of crimes or focused solely on
particular categories of crime, were somewhat misleading in their reports of an
after-school crime peak because the timing of juvenile offending varies considerably
within specific crime types. If one accepts the current study’s general findings that
after disaggregating by crime type, less serious forms of juvenile victimization and
delinquency are more prevalent during school hours, while more serious offenses
are most prominent during the after-school hours and to a lesser extent during the
weekend period, then the next step is to determine what prevention efforts, if any,
would be most effective for targeting these patterns of behavior.
One common perception has been that after-school programs are a potential
“cure-all” for reducing juvenile crime by simply providing adult supervision
between the end of the school day and the time when a parent returns home from
work. However, given the varied distribution of juvenile victimization and
offending behaviors across time, the promise of after-school programs as a
mechanism to reduce all juvenile crime, in general, may be overstated. Considering
the most prevalent violent offense for both victimization and delinquency, simple
assault, is most prominent during the school hours, simply providing a place for
youth to go after school would not address the individual violent offense which
juveniles are most likely to experience.
Consequently, it may make more sense to employ strategies in both the
after-school and in-school settings that have been shown to reduce delinquency by
109
addressing the underlying causes of problem behavior. Gottfredson (2001)
identified effective strategies supported by previous research that have shown to
reduce crime and anti-social behavior. Some examples of effective strategies that
may be employed in both an after-school and within school setting include programs
that focus on teaching social competency skills. Social competency instruction
includes lessons on recognizing and resisting social influences, social problem-
solving skills, communication, and stress management skills. In fact, one recent
evaluation found that after-school programs that incorporated a high emphasis on
social skills and character development lessons were most effective at reducing
delinquent behavior for middle-school aged youth, while reductions in delinquency
were not achieved by simply decreasing time spent unsupervised or by increasing
involvement in constructive activities (Gottfredson, Weisman, Soulé, Womer, and
Lu, forthcoming). After-school programs are perhaps better suited for meeting the
challenge of teaching social competency skills than are school programs since
academics must remain the priority during the school day.
However, after-school programs may be more beneficial if they focus on
attracting the most at-risk youth and find ways to keep them in attendance. Previous
evaluations of after-school programs in Maryland have indicated these programs
typically attract a relatively non-delinquent youth population (Gottfredson et al.,
2001) and that many of the most at-risk youth drop-out (Weisman, Womer, Lu,
Soulé, Bryner, Kahler, Kellstrom, and Gottfredson, 2002). In other words, the
typical after-school program is unlikely to provide services for those youths who are
most susceptible to offending behavior. While the current study’s delinquency
110
levels are fairly comparable to a nationally representative sample, the substance use
rate was less than that reported by the nationally representative NSDPS sample
indicating the current study’s after-school program population is also less at-risk at
least in terms of substance use. This implies that programs must work to target at-
risk youths and incorporate strategies aimed at increasing the retention of these
juveniles in the programs.
In addition, given the varied distribution of juvenile crime across time and
the relatively high rates of victimization and delinquency during the school period,
it may make sense to provide primary prevention strategies that include general
strategies to target universal populations of juveniles. Universal prevention
strategies aim to prevent the onset of youth violence and related risk factors. In this
sense, schools are a good medium for prevention programs because they provide
regular access to students throughout the developmental years (Gottfredson, 2001).
Many of the precursors to delinquency are school-related and are likely to be
amenable to change through school-based intervention. In fact, schools may
provide the most reliable access to large numbers of potentially crime prone youths.
In her review of effective school-based interventions, Gottfredson (2001)
identified four major environmental strategies that have shown strong effects on
reducing juvenile crime and antisocial behavior. These include building school
capacity, establishing norms/expectations for behavior, changing classroom
practices, and grouping students to achieve smaller classes. For example, one study
examined Project PATHE, which targeted the entire school population by making
plans for each school to clarify rules and utilize consistency of rule enforcement. In
111
this evaluation, Gottfredson (1986) found the high school population reported
significantly less delinquent behavior and drug use after one year of program
implementation. Accordingly, a universal approach to juvenile crime prevention
also appears promising.
In sum, the utilization of well-tested approaches to addressing the underlying
causes of juvenile problem behavior during the times when these behaviors are most
prevalent has more promise for reducing juvenile crime. Furthermore, since many
victims are also involved in delinquent behaviors and/or have delinquent peers
(Jensen and Brownfield, 1986; Lauritsen et al., 1991, 1992; Sampson and Lauritsen,
1990), the evasion of these delinquent behaviors may result in a decreased
likelihood of victimization. Therefore, interventions designed to prevent delinquent
behavior are also likely to be effective victimization prevention interventions.
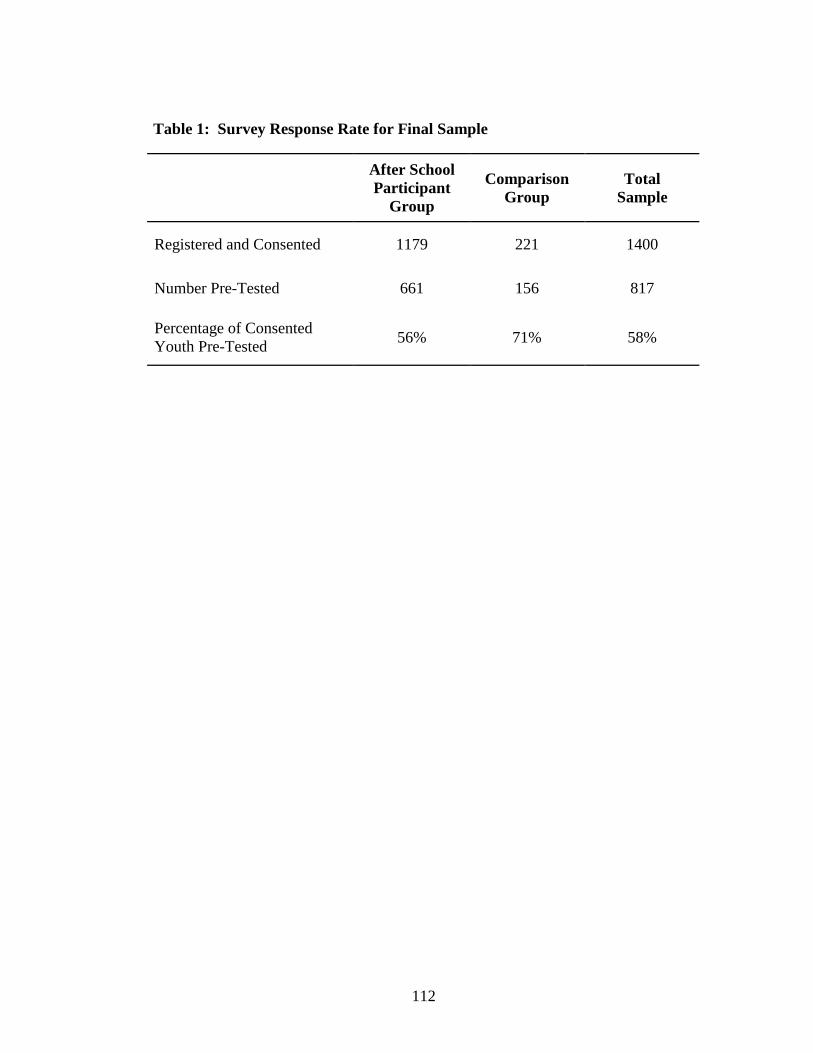
112
Table 1: Survey Response Rate for Final Sample
After School Participant
Group
Comparison Group
Total Sample
Registered and Consented 1179 221 1400
Number Pre-Tested 661 156 817
Percentage of Consented Youth Pre-Tested
56% 71% 58%
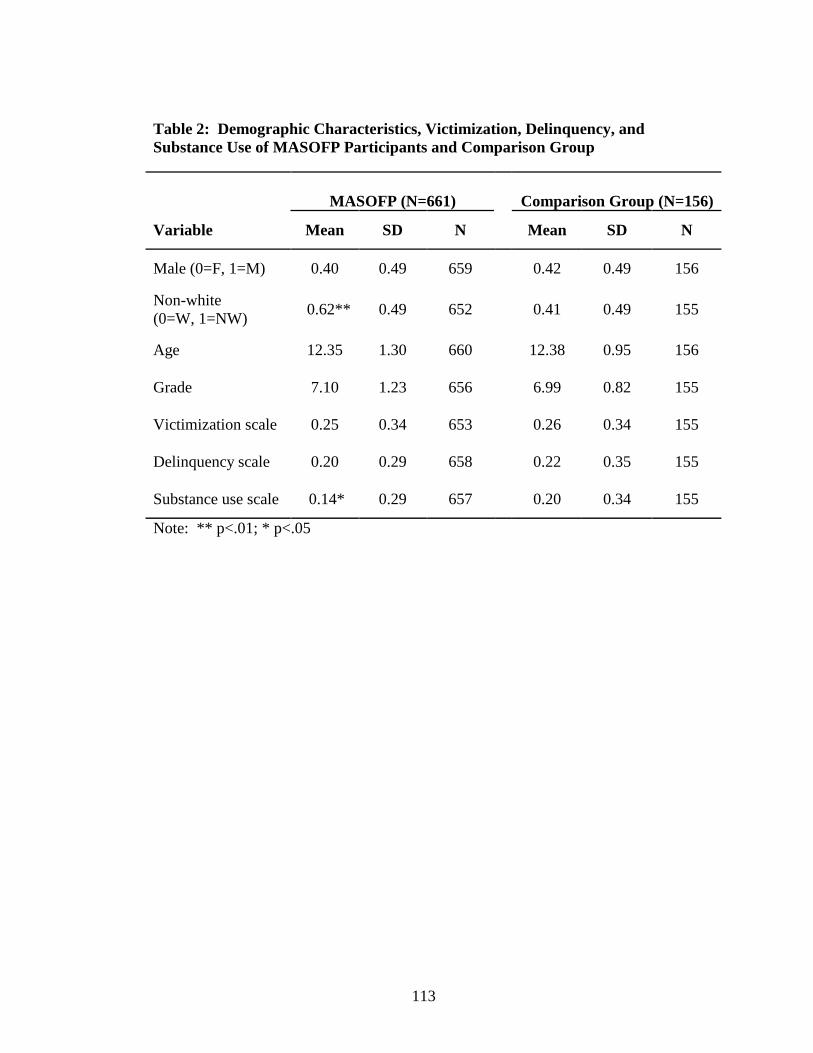
113
Table 2: Demographic Characteristics, Victimization, Delinquency, and Substance Use of MASOFP Participants and Comparison Group
MASOFP (N=661) Comparison Group (N=156)
Variable Mean SD N Mean SD N
Male (0=F, 1=M) 0.40 0.49 659 0.42 0.49 156
Non-white(0=W, 1=NW)
0.62** 0.49 652 0.41 0.49 155
Age 12.35 1.30 660 12.38 0.95 156
Grade 7.10 1.23 656 6.99 0.82 155
Victimization scale 0.25 0.34 653 0.26 0.34 155
Delinquency scale 0.20 0.29 658 0.22 0.35 155
Substance use scale 0.14* 0.29 657 0.20 0.34 155
Note: ** p<.01; * p<.05
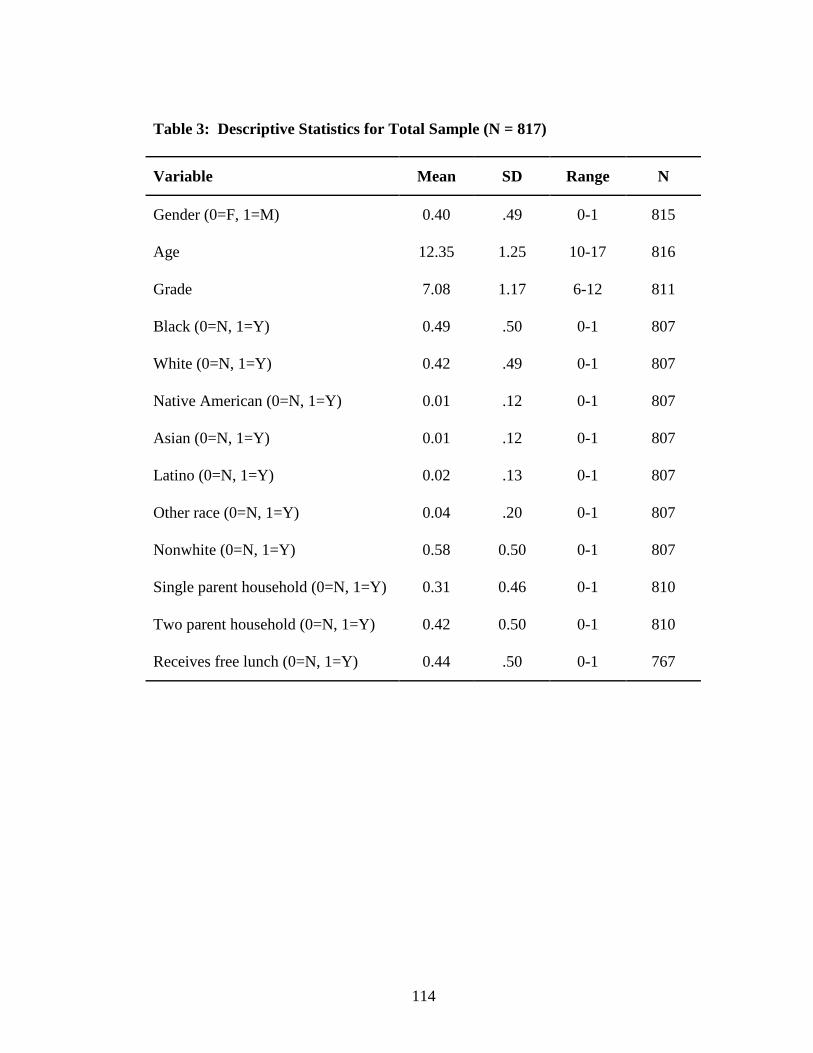
114
Table 3: Descriptive Statistics for Total Sample (N = 817)
Variable Mean SD Range N
Gender (0=F, 1=M) 0.40 .49 0-1 815
Age 12.35 1.25 10-17 816
Grade 7.08 1.17 6-12 811
Black (0=N, 1=Y) 0.49 .50 0-1 807
White (0=N, 1=Y) 0.42 .49 0-1 807
Native American (0=N, 1=Y) 0.01 .12 0-1 807
Asian (0=N, 1=Y) 0.01 .12 0-1 807
Latino (0=N, 1=Y) 0.02 .13 0-1 807
Other race (0=N, 1=Y) 0.04 .20 0-1 807
Nonwhite (0=N, 1=Y) 0.58 0.50 0-1 807
Single parent household (0=N, 1=Y) 0.31 0.46 0-1 810
Two parent household (0=N, 1=Y) 0.42 0.50 0-1 810
Receives free lunch (0=N, 1=Y) 0.44 .50 0-1 767
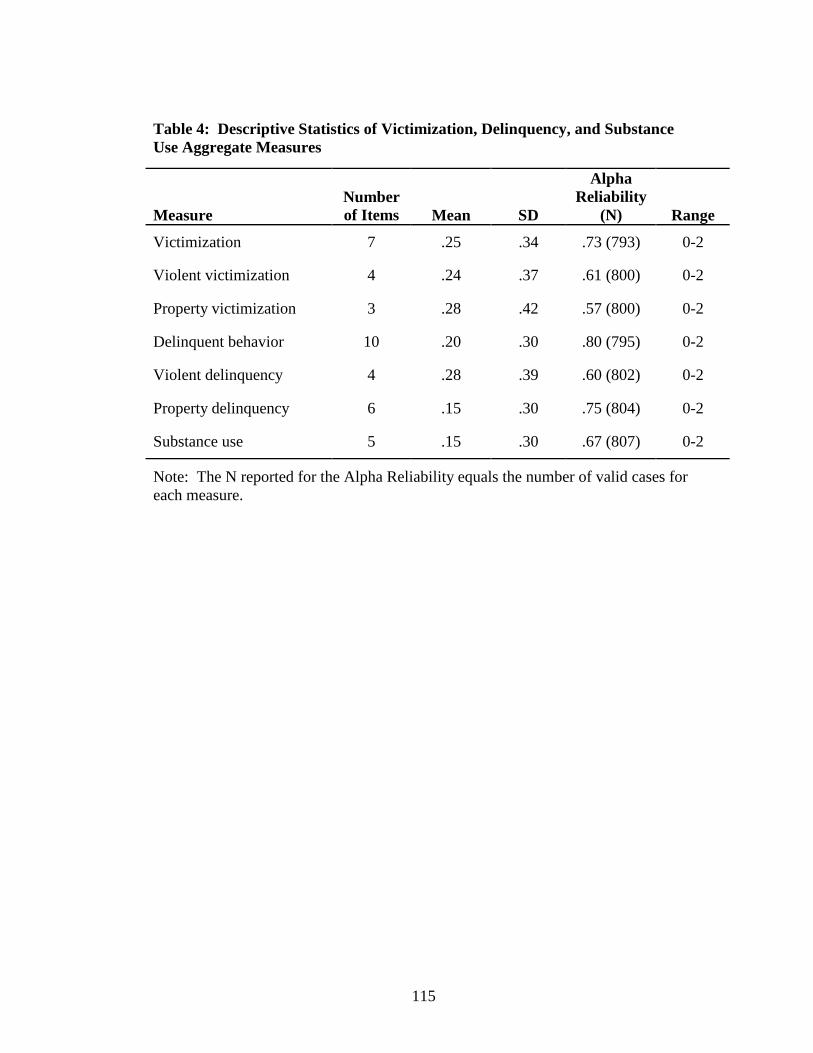
115
Table 4: Descriptive Statistics of Victimization, Delinquency, and Substance Use Aggregate Measures
Note: The N reported for the Alpha Reliability equals the number of valid cases for each measure.
MeasureNumber of Items Mean SD
Alpha Reliability
(N) Range
Victimization 7 .25 .34 .73 (793) 0-2
Violent victimization 4 .24 .37 .61 (800) 0-2
Property victimization 3 .28 .42 .57 (800) 0-2
Delinquent behavior 10 .20 .30 .80 (795) 0-2
Violent delinquency 4 .28 .39 .60 (802) 0-2
Property delinquency 6 .15 .30 .75 (804) 0-2
Substance use 5 .15 .30 .67 (807) 0-2
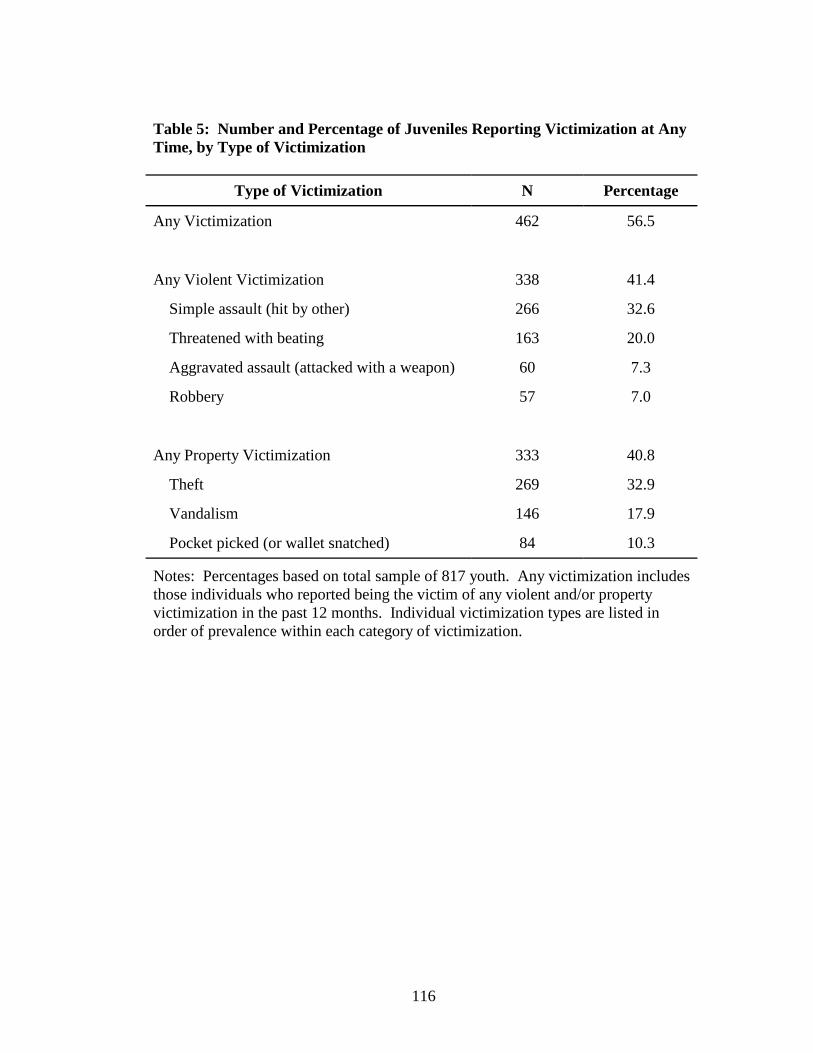
116
Table 5: Number and Percentage of Juveniles Reporting Victimization at Any Time, by Type of Victimization
Type of Victimization N Percentage
Any Victimization 462 56.5
Any Violent Victimization 338 41.4
Simple assault (hit by other) 266 32.6
Threatened with beating 163 20.0
Aggravated assault (attacked with a weapon) 60 7.3
Robbery 57 7.0
Any Property Victimization 333 40.8
Theft 269 32.9
Vandalism 146 17.9
Pocket picked (or wallet snatched) 84 10.3
Notes: Percentages based on total sample of 817 youth. Any victimization includes those individuals who reported being the victim of any violent and/or property victimization in the past 12 months. Individual victimization types are listed in order of prevalence within each category of victimization.
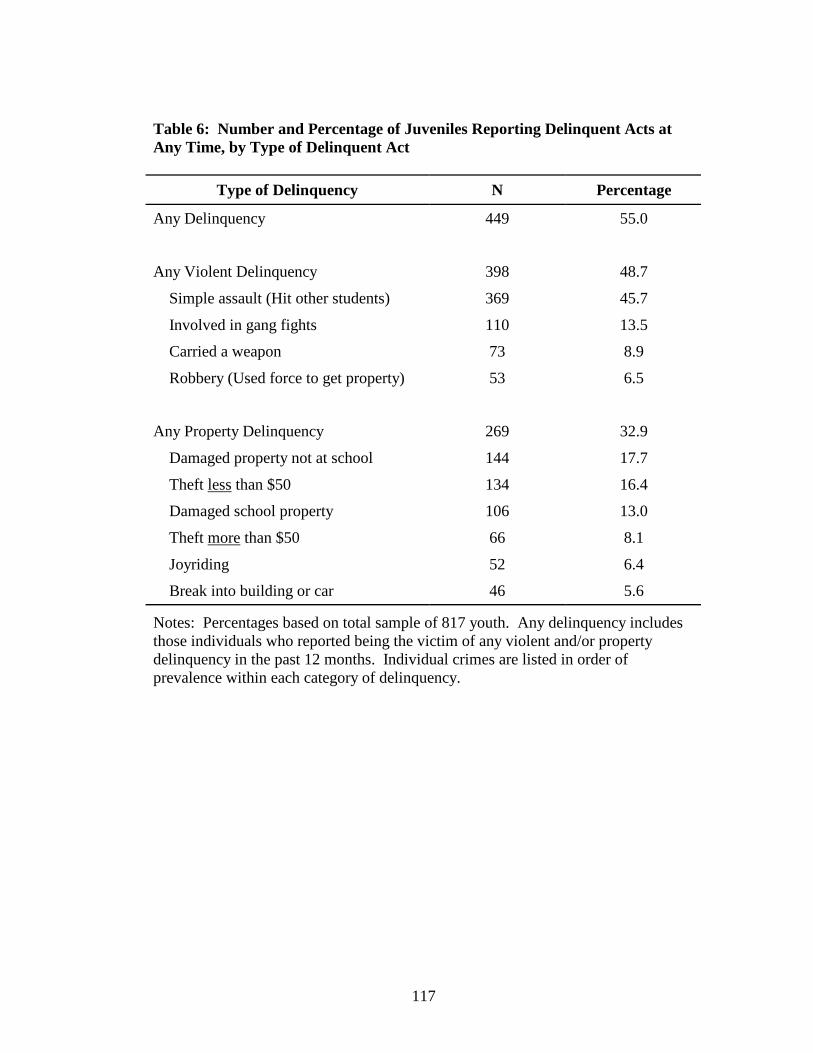
117
Table 6: Number and Percentage of Juveniles Reporting Delinquent Acts at Any Time, by Type of Delinquent Act
Type of Delinquency N Percentage
Any Delinquency 449 55.0
Any Violent Delinquency 398 48.7
Simple assault (Hit other students) 369 45.7
Involved in gang fights 110 13.5
Carried a weapon 73 8.9
Robbery (Used force to get property) 53 6.5
Any Property Delinquency 269 32.9
Damaged property not at school 144 17.7
Theft less than $50 134 16.4
Damaged school property 106 13.0
Theft more than $50 66 8.1
Joyriding 52 6.4
Break into building or car 46 5.6
Notes: Percentages based on total sample of 817 youth. Any delinquency includes those individuals who reported being the victim of any violent and/or property delinquency in the past 12 months. Individual crimes are listed in order of prevalence within each category of delinquency.
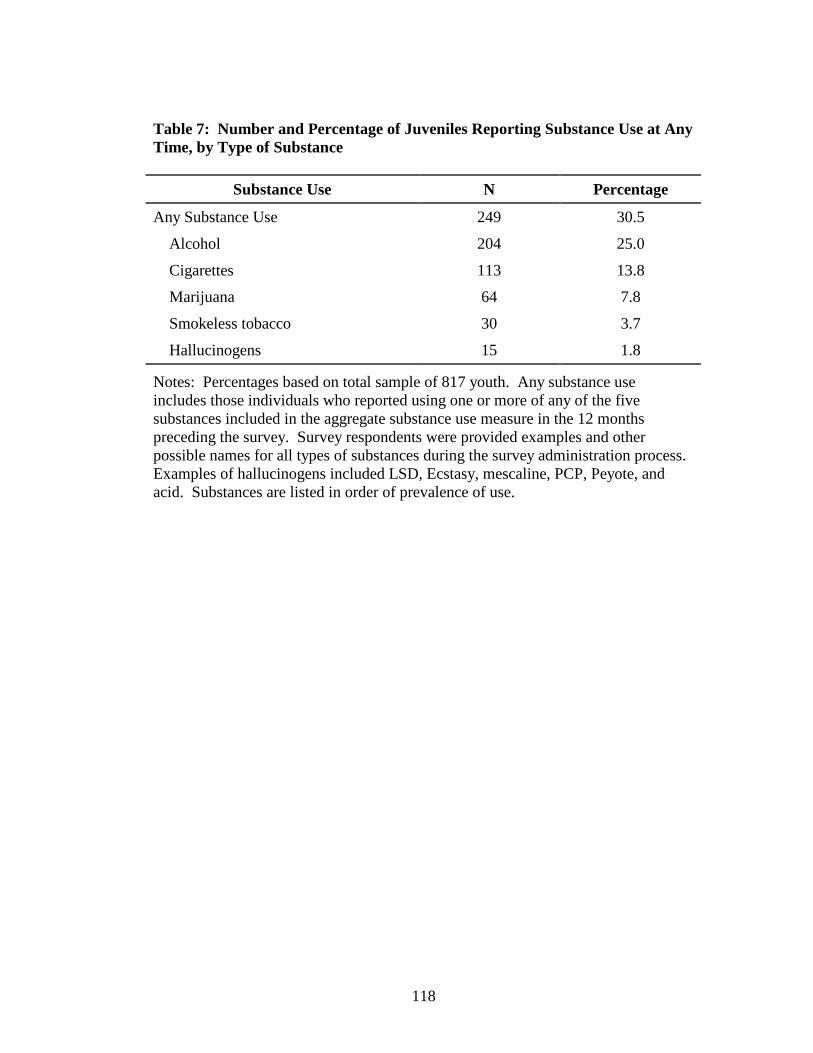
118
Table 7: Number and Percentage of Juveniles Reporting Substance Use at Any Time, by Type of Substance
Substance Use N Percentage
Any Substance Use 249 30.5
Alcohol 204 25.0
Cigarettes 113 13.8
Marijuana 64 7.8
Smokeless tobacco 30 3.7
Hallucinogens 15 1.8
Notes: Percentages based on total sample of 817 youth. Any substance use includes those individuals who reported using one or more of any of the five substances included in the aggregate substance use measure in the 12 months preceding the survey. Survey respondents were provided examples and other possible names for all types of substances during the survey administration process. Examples of hallucinogens included LSD, Ecstasy, mescaline, PCP, Peyote, and acid. Substances are listed in order of prevalence of use.
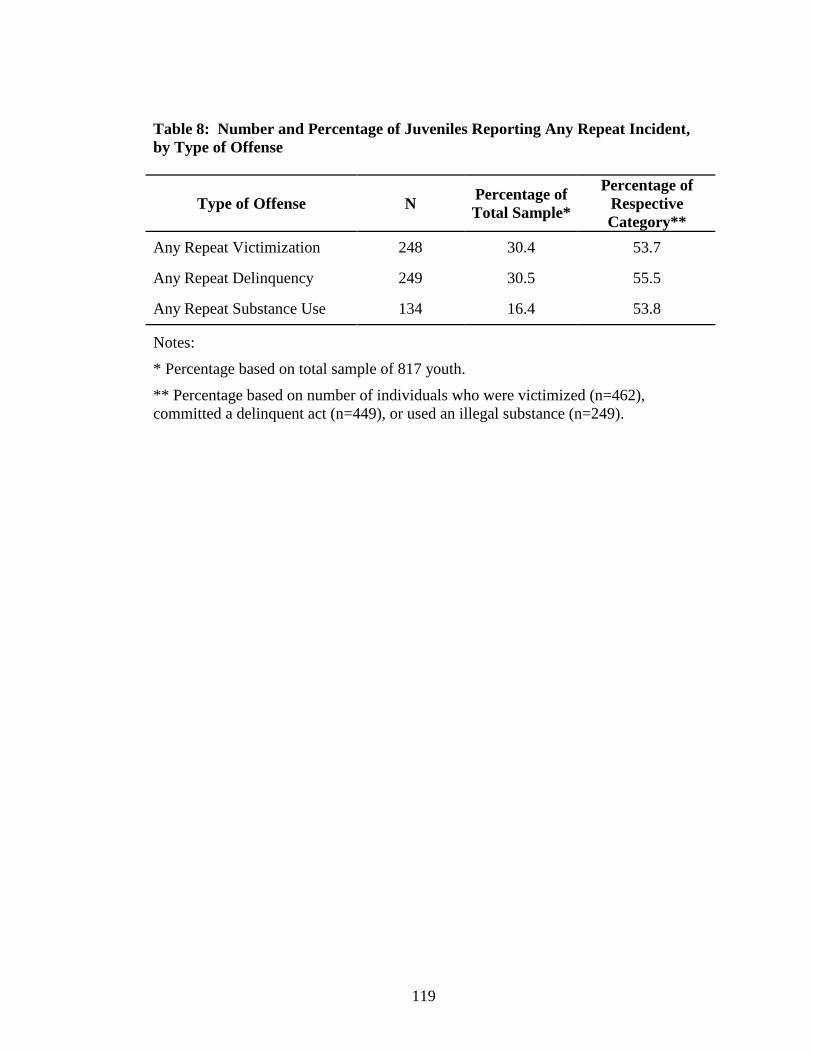
119
Table 8: Number and Percentage of Juveniles Reporting Any Repeat Incident, by Type of Offense
Type of Offense NPercentage ofTotal Sample*
Percentage of Respective Category**
Any Repeat Victimization 248 30.4 53.7
Any Repeat Delinquency 249 30.5 55.5
Any Repeat Substance Use 134 16.4 53.8
Notes:
* Percentage based on total sample of 817 youth.
** Percentage based on number of individuals who were victimized (n=462), committed a delinquent act (n=449), or used an illegal substance (n=249).
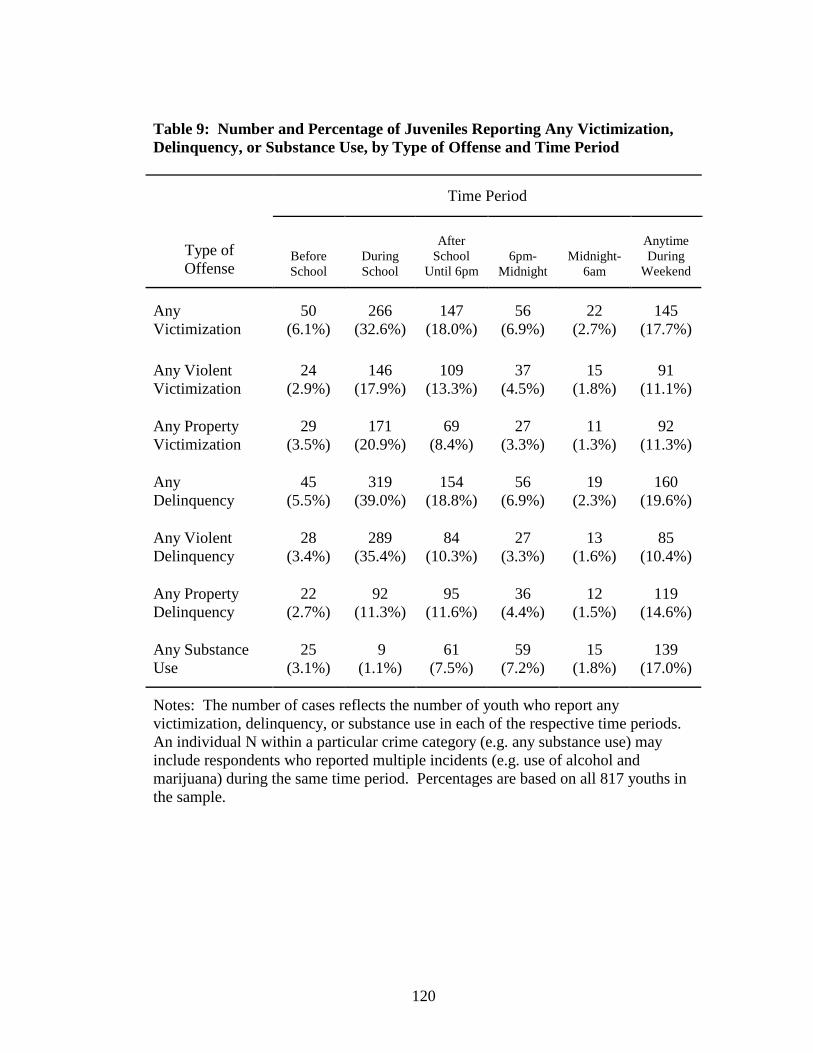
120
Table 9: Number and Percentage of Juveniles Reporting Any Victimization, Delinquency, or Substance Use, by Type of Offense and Time Period
Time Period
Type ofOffense
Before School
During School
After School
Until 6pm6pm-
MidnightMidnight-
6am
Anytime During
Weekend
Any Victimization
50(6.1%)
266(32.6%)
147(18.0%)
56(6.9%)
22(2.7%)
145(17.7%)
Any Violent Victimization
24(2.9%)
146(17.9%)
109(13.3%)
37(4.5%)
15(1.8%)
91(11.1%)
Any Property Victimization
29(3.5%)
171(20.9%)
69(8.4%)
27(3.3%)
11(1.3%)
92(11.3%)
Any Delinquency
45(5.5%)
319(39.0%)
154(18.8%)
56(6.9%)
19(2.3%)
160(19.6%)
Any Violent Delinquency
28(3.4%)
289(35.4%)
84(10.3%)
27(3.3%)
13(1.6%)
85(10.4%)
Any Property Delinquency
22(2.7%)
92(11.3%)
95(11.6%)
36(4.4%)
12(1.5%)
119(14.6%)
Any Substance Use
25(3.1%)
9(1.1%)
61(7.5%)
59(7.2%)
15(1.8%)
139(17.0%)
Notes: The number of cases reflects the number of youth who report any victimization, delinquency, or substance use in each of the respective time periods. An individual N within a particular crime category (e.g. any substance use) may include respondents who reported multiple incidents (e.g. use of alcohol and marijuana) during the same time period. Percentages are based on all 817 youths in the sample.
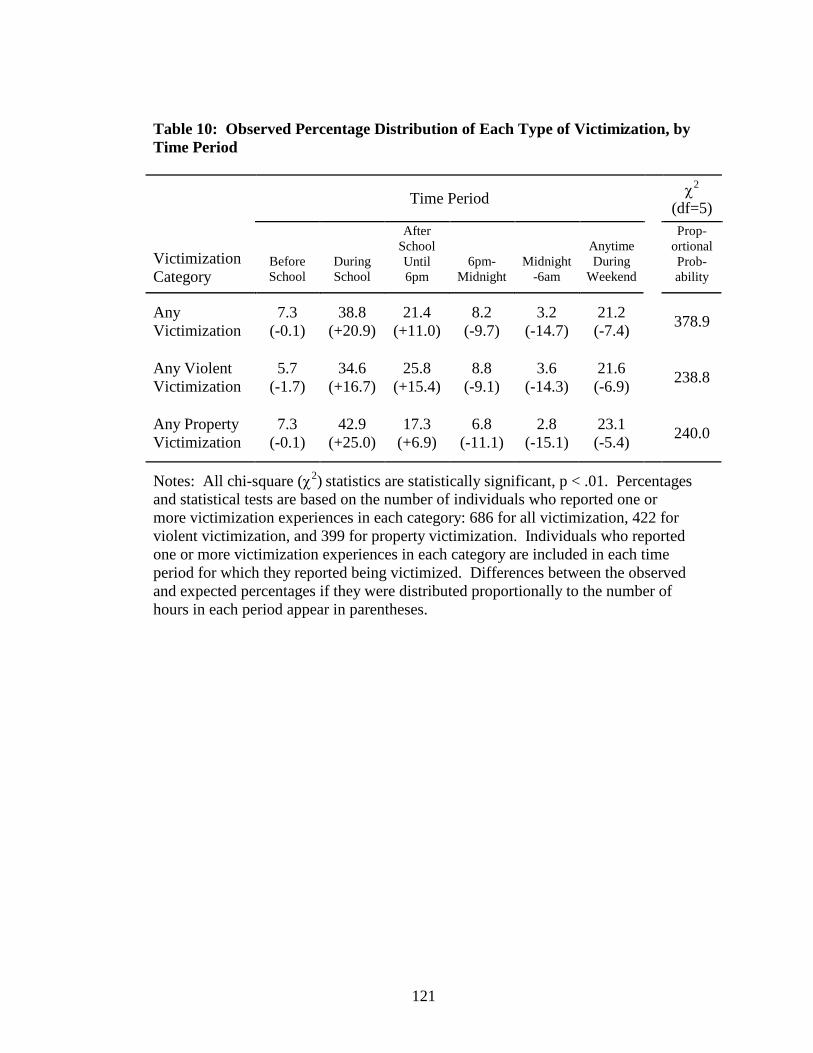
121
Table 10: Observed Percentage Distribution of Each Type of Victimization, by Time Period
Time Period χ2
(df=5)
VictimizationCategory
Before School
During School
After School Until 6pm
6pm-Midnight
Midnight-6am
Anytime During
Weekend
Prop-ortionalProb-ability
Any Victimization
7.3(-0.1)
38.8(+20.9)
21.4(+11.0)
8.2(-9.7)
3.2(-14.7)
21.2(-7.4)
378.9
Any ViolentVictimization
5.7(-1.7)
34.6(+16.7)
25.8(+15.4)
8.8(-9.1)
3.6(-14.3)
21.6(-6.9)
238.8
Any PropertyVictimization
7.3(-0.1)
42.9(+25.0)
17.3(+6.9)
6.8(-11.1)
2.8(-15.1)
23.1(-5.4)
240.0
Notes: All chi-square (χ2) statistics are statistically significant, p < .01. Percentages and statistical tests are based on the number of individuals who reported one or more victimization experiences in each category: 686 for all victimization, 422 for violent victimization, and 399 for property victimization. Individuals who reported one or more victimization experiences in each category are included in each time period for which they reported being victimized. Differences between the observed and expected percentages if they were distributed proportionally to the number of hours in each period appear in parentheses.
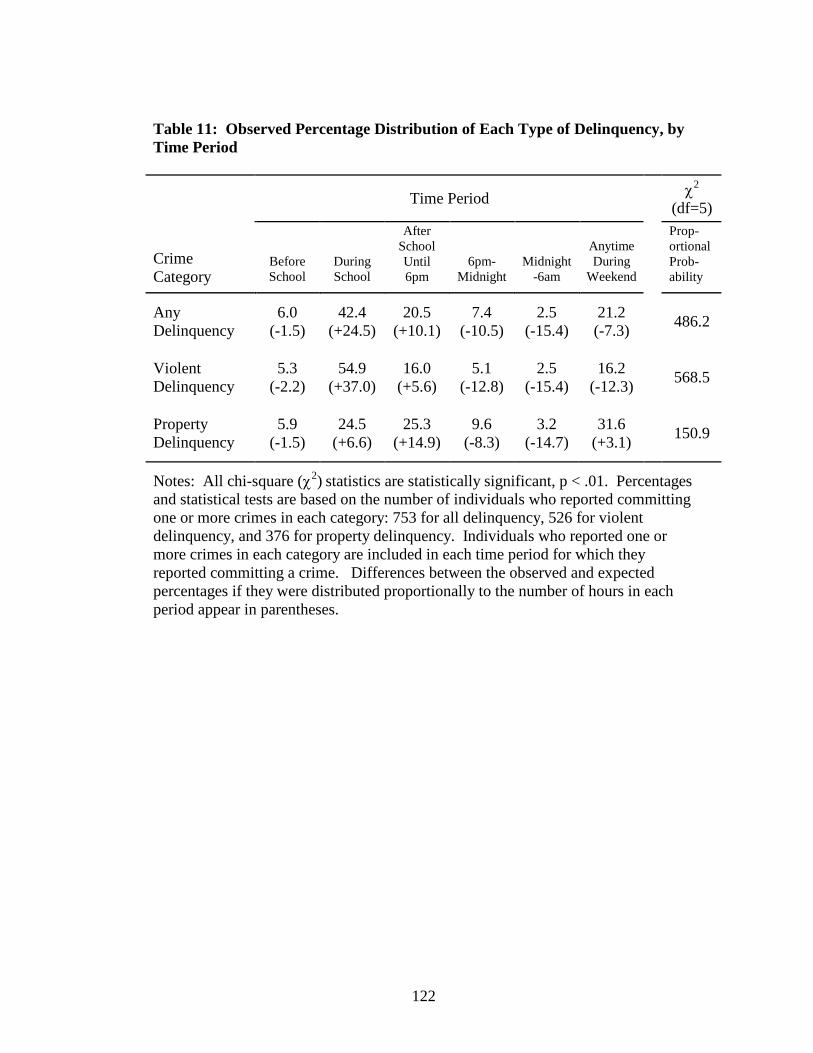
122
Table 11: Observed Percentage Distribution of Each Type of Delinquency, by Time Period
Time Period χ2
(df=5)
Crime Category
Before School
During School
After School Until 6pm
6pm-Midnight
Midnight-6am
Anytime During
Weekend
Prop-ortionalProb-ability
AnyDelinquency
6.0(-1.5)
42.4 (+24.5)
20.5 (+10.1)
7.4(-10.5)
2.5(-15.4)
21.2(-7.3)
486.2
ViolentDelinquency
5.3(-2.2)
54.9 (+37.0)
16.0 (+5.6)
5.1(-12.8)
2.5(-15.4)
16.2(-12.3)
568.5
PropertyDelinquency
5.9(-1.5)
24.5 (+6.6)
25.3 (+14.9)
9.6(-8.3)
3.2(-14.7)
31.6 (+3.1)
150.9
Notes: All chi-square (χ2) statistics are statistically significant, p < .01. Percentages and statistical tests are based on the number of individuals who reported committing one or more crimes in each category: 753 for all delinquency, 526 for violent delinquency, and 376 for property delinquency. Individuals who reported one or more crimes in each category are included in each time period for which they reported committing a crime. Differences between the observed and expected percentages if they were distributed proportionally to the number of hours in each period appear in parentheses.
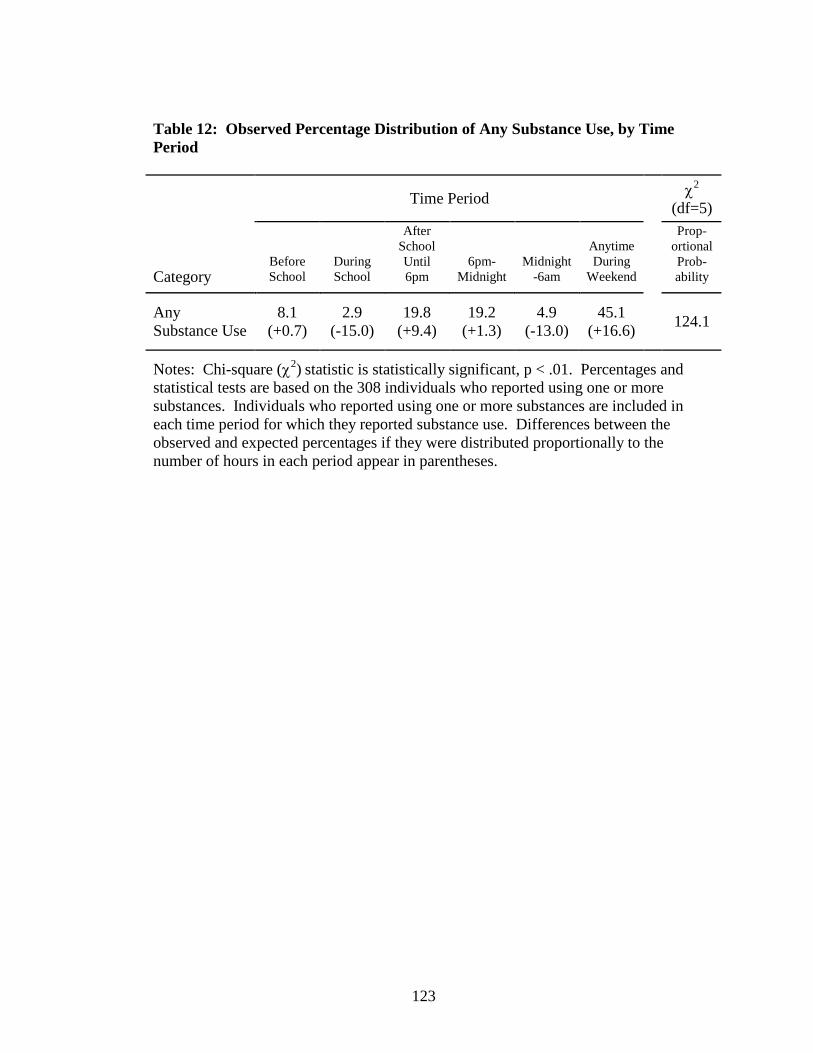
123
Table 12: Observed Percentage Distribution of Any Substance Use, by Time Period
Time Period χ2
(df=5)
CategoryBefore School
During School
After School Until 6pm
6pm-Midnight
Midnight-6am
Anytime During
Weekend
Prop-ortionalProb-ability
Any Substance Use
8.1 (+0.7)
2.9(-15.0)
19.8 (+9.4)
19.2 (+1.3)
4.9(-13.0)
45.1 (+16.6)
124.1
Notes: Chi-square (χ2) statistic is statistically significant, p < .01. Percentages and statistical tests are based on the 308 individuals who reported using one or more substances. Individuals who reported using one or more substances are included in each time period for which they reported substance use. Differences between the observed and expected percentages if they were distributed proportionally to the number of hours in each period appear in parentheses.
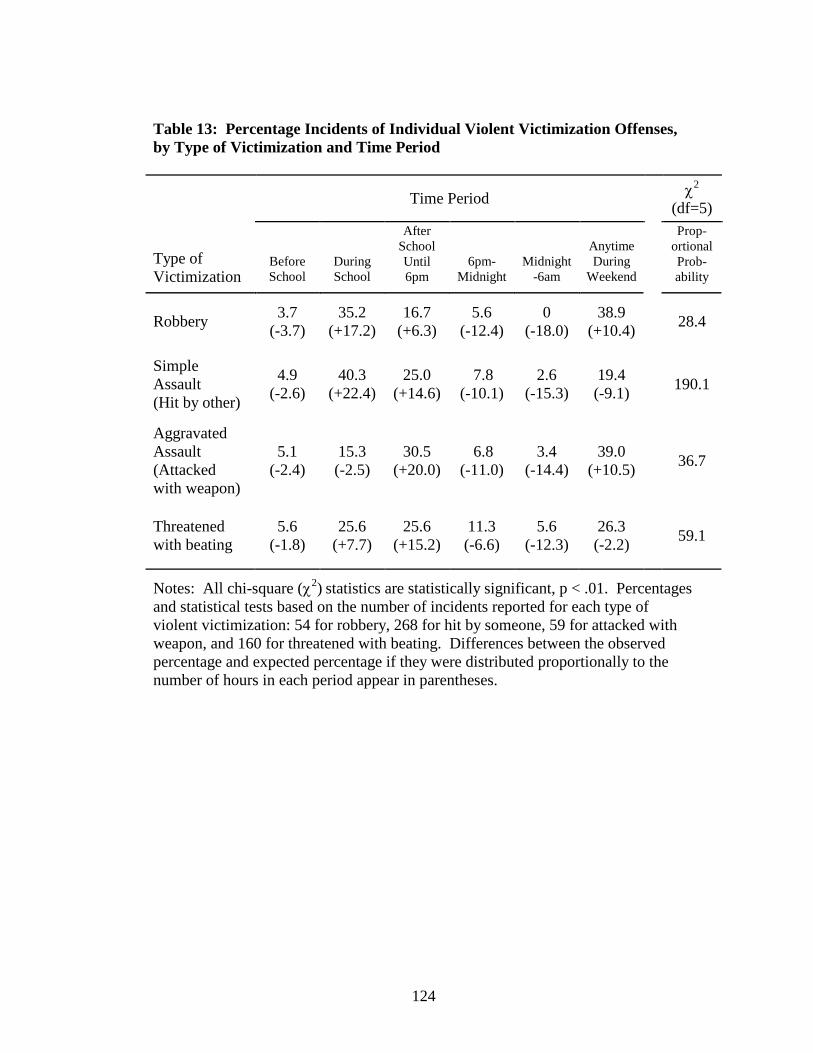
124
Table 13: Percentage Incidents of Individual Violent Victimization Offenses, by Type of Victimization and Time Period
Time Period χ2
(df=5)
Type of Victimization
Before School
During School
After School Until 6pm
6pm-Midnight
Midnight-6am
Anytime During
Weekend
Prop-ortionalProb-ability
Robbery3.7
(-3.7)35.2
(+17.2)16.7
(+6.3)5.6
(-12.4)0
(-18.0)38.9
(+10.4)28.4
Simple Assault (Hit by other)
4.9(-2.6)
40.3(+22.4)
25.0(+14.6)
7.8(-10.1)
2.6(-15.3)
19.4(-9.1)
190.1
Aggravated Assault (Attacked with weapon)
5.1(-2.4)
15.3(-2.5)
30.5(+20.0)
6.8(-11.0)
3.4(-14.4)
39.0(+10.5)
36.7
Threatened with beating
5.6(-1.8)
25.6(+7.7)
25.6(+15.2)
11.3(-6.6)
5.6(-12.3)
26.3(-2.2)
59.1
Notes: All chi-square (χ2) statistics are statistically significant, p < .01. Percentages and statistical tests based on the number of incidents reported for each type of violent victimization: 54 for robbery, 268 for hit by someone, 59 for attacked with weapon, and 160 for threatened with beating. Differences between the observed percentage and expected percentage if they were distributed proportionally to the number of hours in each period appear in parentheses.
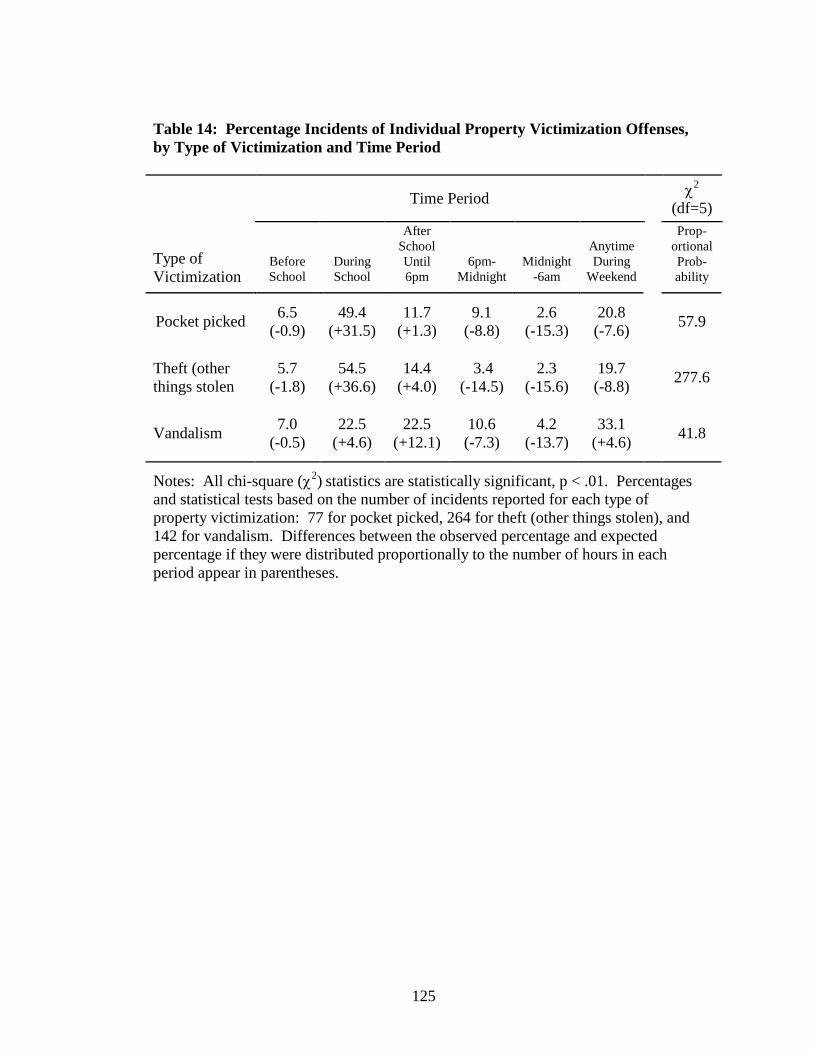
125
Table 14: Percentage Incidents of Individual Property Victimization Offenses, by Type of Victimization and Time Period
Time Period χ2
(df=5)
Type ofVictimization
Before School
During School
After School Until 6pm
6pm-Midnight
Midnight-6am
Anytime During
Weekend
Prop-ortionalProb-ability
Pocket picked6.5
(-0.9)49.4
(+31.5)11.7
(+1.3)9.1
(-8.8)2.6
(-15.3)20.8(-7.6)
57.9
Theft (other things stolen
5.7(-1.8)
54.5(+36.6)
14.4(+4.0)
3.4(-14.5)
2.3(-15.6)
19.7(-8.8)
277.6
Vandalism 7.0
(-0.5)22.5
(+4.6)22.5
(+12.1)10.6(-7.3)
4.2(-13.7)
33.1(+4.6)
41.8
Notes: All chi-square (χ2) statistics are statistically significant, p < .01. Percentages and statistical tests based on the number of incidents reported for each type of property victimization: 77 for pocket picked, 264 for theft (other things stolen), and 142 for vandalism. Differences between the observed percentage and expected percentage if they were distributed proportionally to the number of hours in each period appear in parentheses.
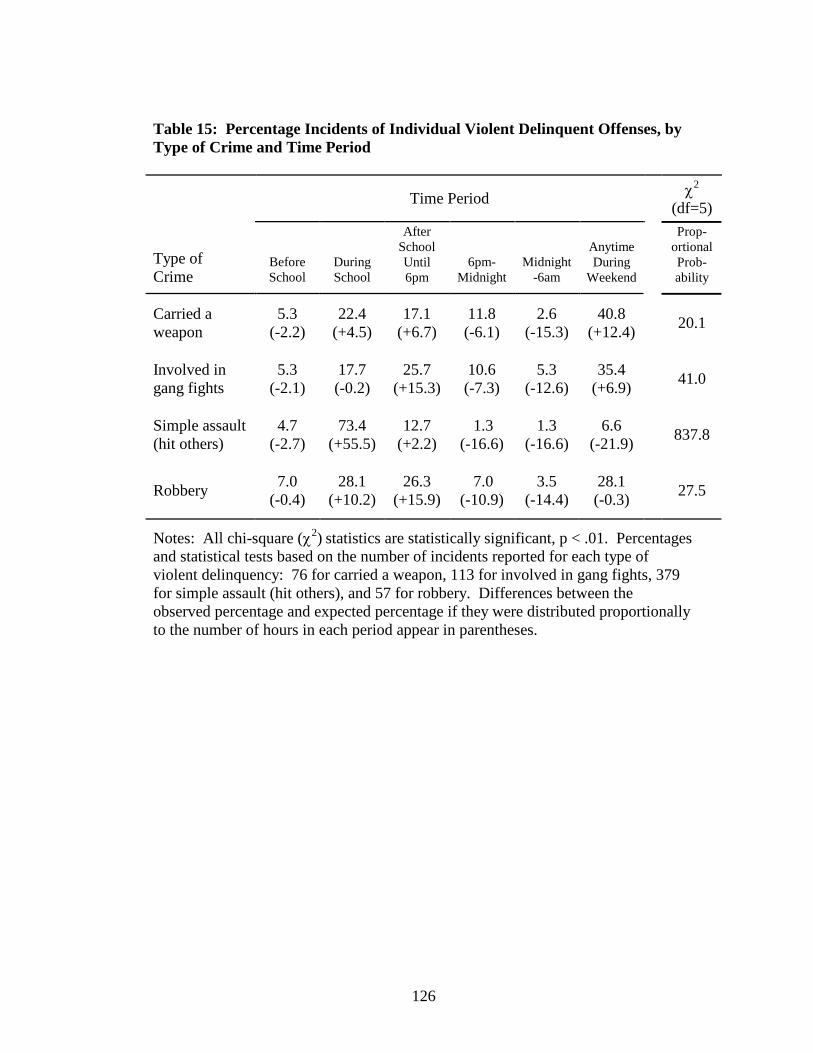
126
Table 15: Percentage Incidents of Individual Violent Delinquent Offenses, by Type of Crime and Time Period
Time Period χ2
(df=5)
Type ofCrime
Before School
During School
After School Until 6pm
6pm-Midnight
Midnight-6am
Anytime During
Weekend
Prop-ortionalProb-ability
Carried a weapon
5.3(-2.2)
22.4(+4.5)
17.1(+6.7)
11.8(-6.1)
2.6(-15.3)
40.8(+12.4)
20.1
Involved in gang fights
5.3(-2.1)
17.7(-0.2)
25.7(+15.3)
10.6(-7.3)
5.3(-12.6)
35.4(+6.9)
41.0
Simple assault (hit others)
4.7(-2.7)
73.4(+55.5)
12.7(+2.2)
1.3(-16.6)
1.3(-16.6)
6.6(-21.9)
837.8
Robbery7.0
(-0.4)28.1
(+10.2)26.3
(+15.9)7.0
(-10.9)3.5
(-14.4)28.1(-0.3)
27.5
Notes: All chi-square (χ2) statistics are statistically significant, p < .01. Percentages and statistical tests based on the number of incidents reported for each type of violent delinquency: 76 for carried a weapon, 113 for involved in gang fights, 379 for simple assault (hit others), and 57 for robbery. Differences between the observed percentage and expected percentage if they were distributed proportionallyto the number of hours in each period appear in parentheses.
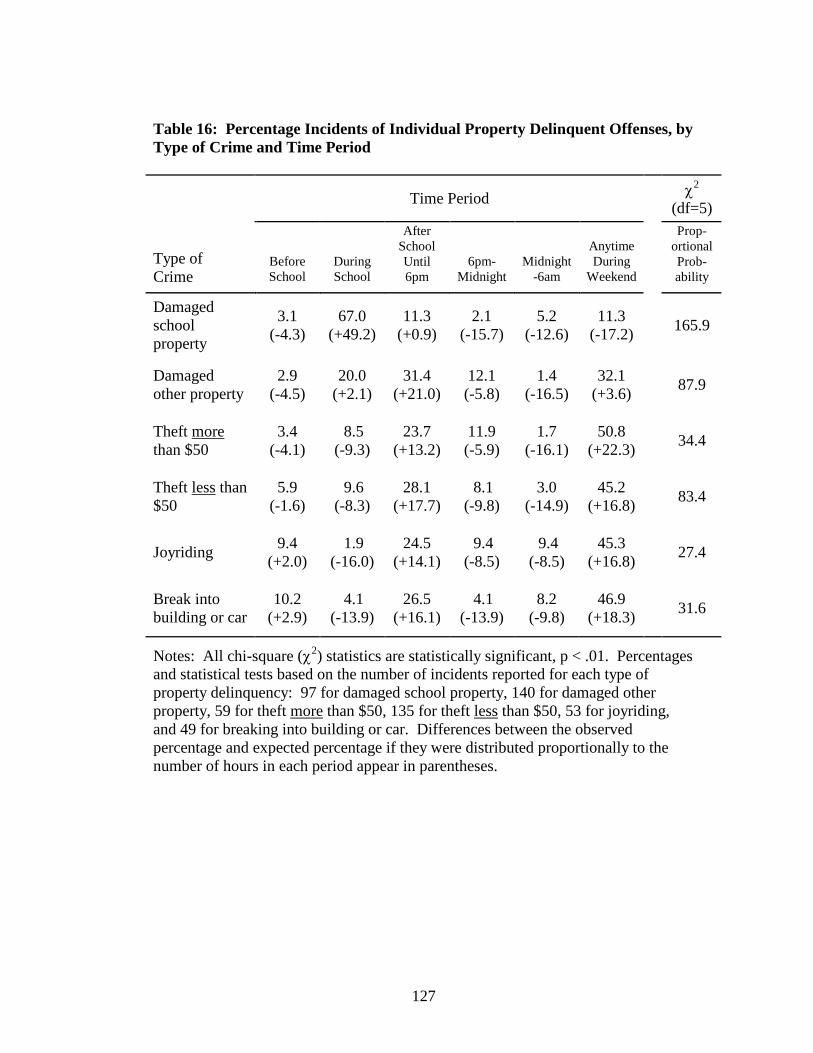
127
Table 16: Percentage Incidents of Individual Property Delinquent Offenses, by Type of Crime and Time Period
Time Period χ2
(df=5)
Type ofCrime
Before School
During School
After School Until 6pm
6pm-Midnight
Midnight-6am
Anytime During
Weekend
Prop-ortionalProb-ability
Damaged school property
3.1(-4.3)
67.0(+49.2)
11.3(+0.9)
2.1(-15.7)
5.2(-12.6)
11.3(-17.2)
165.9
Damaged other property
2.9(-4.5)
20.0(+2.1)
31.4(+21.0)
12.1(-5.8)
1.4(-16.5)
32.1(+3.6)
87.9
Theft morethan $50
3.4(-4.1)
8.5(-9.3)
23.7(+13.2)
11.9(-5.9)
1.7(-16.1)
50.8(+22.3)
34.4
Theft less than $50
5.9(-1.6)
9.6(-8.3)
28.1(+17.7)
8.1(-9.8)
3.0(-14.9)
45.2(+16.8)
83.4
Joyriding9.4
(+2.0)1.9
(-16.0)24.5
(+14.1)9.4
(-8.5)9.4
(-8.5)45.3
(+16.8)27.4
Break into building or car
10.2(+2.9)
4.1(-13.9)
26.5(+16.1)
4.1(-13.9)
8.2(-9.8)
46.9(+18.3)
31.6
Notes: All chi-square (χ2) statistics are statistically significant, p < .01. Percentages and statistical tests based on the number of incidents reported for each type of property delinquency: 97 for damaged school property, 140 for damaged other property, 59 for theft more than $50, 135 for theft less than $50, 53 for joyriding, and 49 for breaking into building or car. Differences between the observed percentage and expected percentage if they were distributed proportionally to the number of hours in each period appear in parentheses.
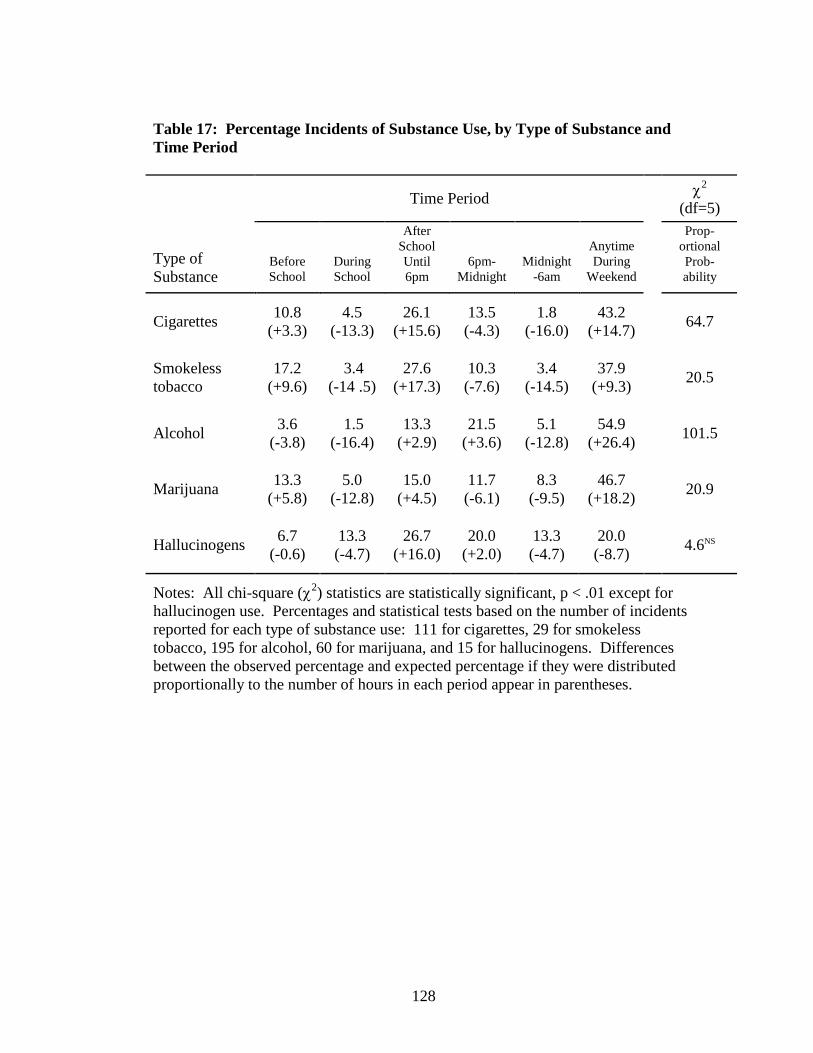
128
Table 17: Percentage Incidents of Substance Use, by Type of Substance and Time Period
Time Period χ2
(df=5)
Type ofSubstance
Before School
During School
After School Until 6pm
6pm-Midnight
Midnight-6am
Anytime During
Weekend
Prop-ortional Prob-ability
Cigarettes10.8
(+3.3)4.5
(-13.3)26.1
(+15.6)13.5(-4.3)
1.8(-16.0)
43.2(+14.7)
64.7
Smokeless tobacco
17.2(+9.6)
3.4(-14 .5)
27.6 (+17.3)
10.3(-7.6)
3.4(-14.5)
37.9(+9.3)
20.5
Alcohol3.6
(-3.8)1.5
(-16.4)13.3
(+2.9)21.5
(+3.6)5.1
(-12.8)54.9
(+26.4)101.5
Marijuana13.3
(+5.8)5.0
(-12.8)15.0
(+4.5)11.7(-6.1)
8.3(-9.5)
46.7(+18.2)
20.9
Hallucinogens6.7
(-0.6)13.3(-4.7)
26.7(+16.0)
20.0(+2.0)
13.3(-4.7)
20.0(-8.7)
4.6NS
Notes: All chi-square (χ2) statistics are statistically significant, p < .01 except for hallucinogen use. Percentages and statistical tests based on the number of incidents reported for each type of substance use: 111 for cigarettes, 29 for smokeless tobacco, 195 for alcohol, 60 for marijuana, and 15 for hallucinogens. Differences between the observed percentage and expected percentage if they were distributed proportionally to the number of hours in each period appear in parentheses.
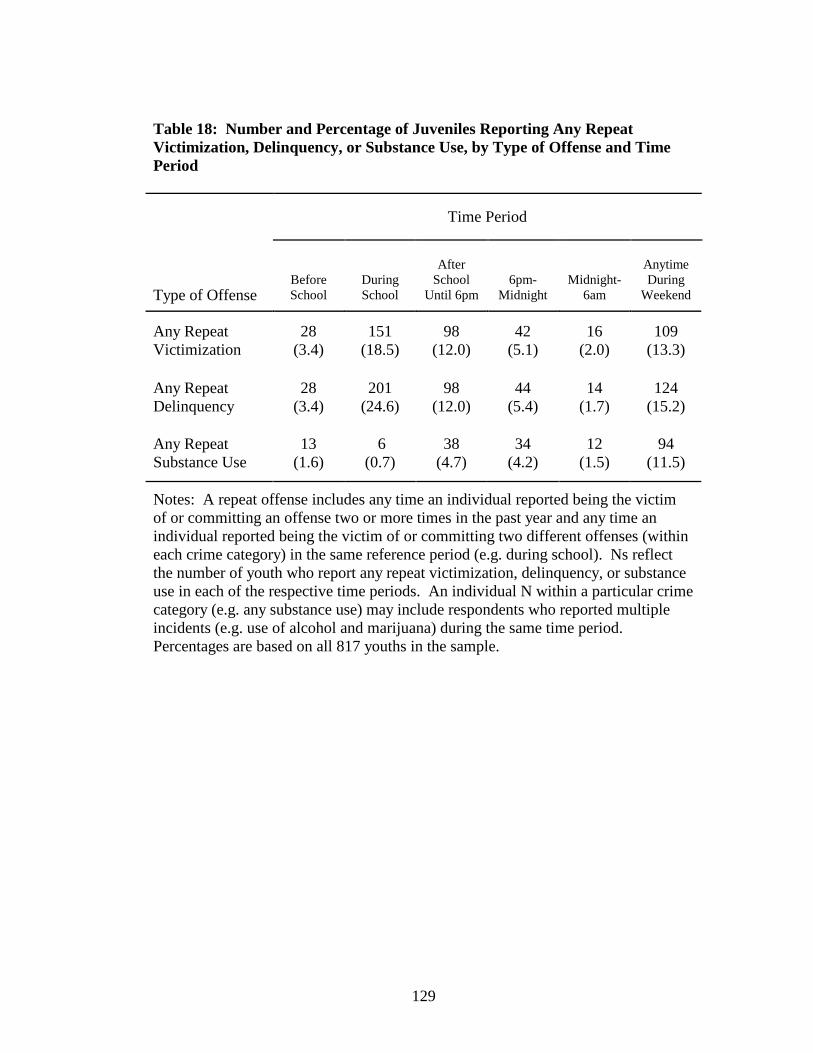
129
Table 18: Number and Percentage of Juveniles Reporting Any Repeat Victimization, Delinquency, or Substance Use, by Type of Offense and Time Period
Time Period
Type of OffenseBefore School
During School
After School
Until 6pm6pm-
MidnightMidnight-
6am
Anytime During
Weekend
Any RepeatVictimization
28(3.4)
151(18.5)
98(12.0)
42(5.1)
16(2.0)
109(13.3)
Any Repeat Delinquency
28(3.4)
201(24.6)
98(12.0)
44(5.4)
14(1.7)
124(15.2)
Any Repeat Substance Use
13(1.6)
6(0.7)
38(4.7)
34(4.2)
12(1.5)
94(11.5)
Notes: A repeat offense includes any time an individual reported being the victim of or committing an offense two or more times in the past year and any time an individual reported being the victim of or committing two different offenses (within each crime category) in the same reference period (e.g. during school). Ns reflect the number of youth who report any repeat victimization, delinquency, or substance use in each of the respective time periods. An individual N within a particular crime category (e.g. any substance use) may include respondents who reported multiple incidents (e.g. use of alcohol and marijuana) during the same time period. Percentages are based on all 817 youths in the sample.
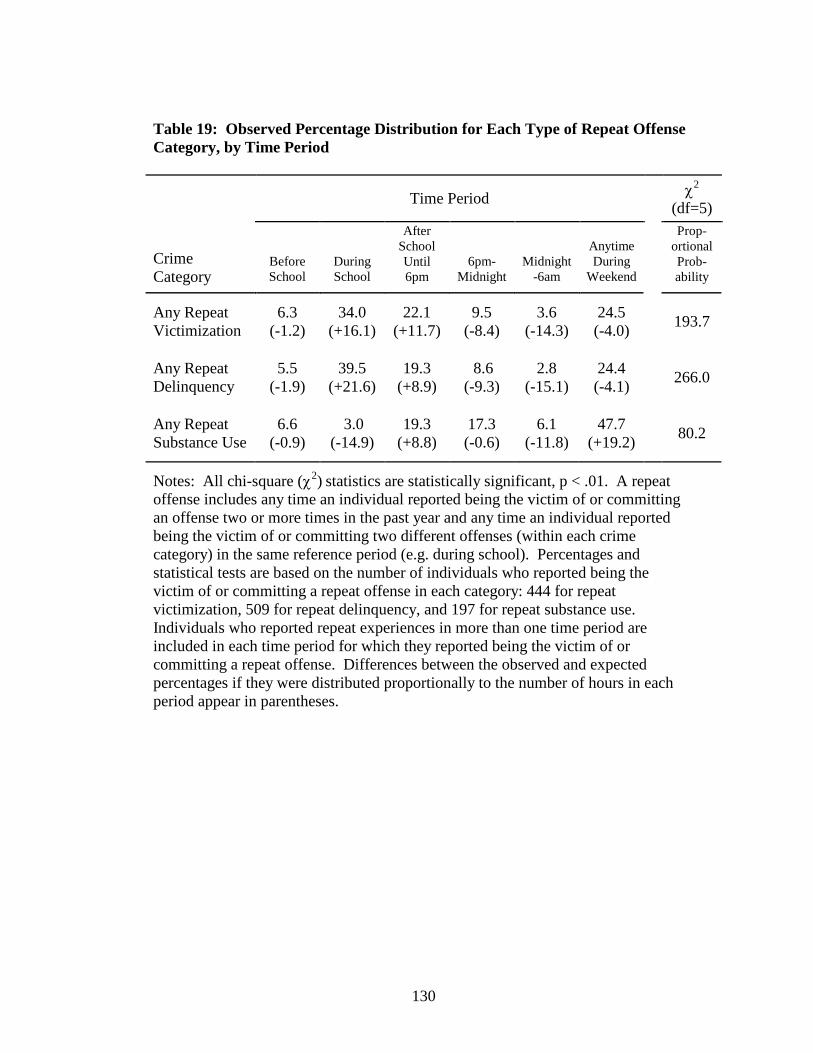
130
Table 19: Observed Percentage Distribution for Each Type of Repeat Offense Category, by Time Period
Time Period χ2
(df=5)
CrimeCategory
Before School
During School
After School Until 6pm
6pm-Midnight
Midnight-6am
Anytime During
Weekend
Prop-ortionalProb-ability
Any Repeat Victimization
6.3(-1.2)
34.0(+16.1)
22.1(+11.7)
9.5(-8.4)
3.6(-14.3)
24.5(-4.0)
193.7
Any Repeat Delinquency
5.5(-1.9)
39.5(+21.6)
19.3(+8.9)
8.6(-9.3)
2.8(-15.1)
24.4(-4.1)
266.0
Any Repeat Substance Use
6.6(-0.9)
3.0(-14.9)
19.3(+8.8)
17.3(-0.6)
6.1(-11.8)
47.7(+19.2)
80.2
Notes: All chi-square (χ2) statistics are statistically significant, p < .01. A repeat offense includes any time an individual reported being the victim of or committing an offense two or more times in the past year and any time an individual reported being the victim of or committing two different offenses (within each crime category) in the same reference period (e.g. during school). Percentages and statistical tests are based on the number of individuals who reported being the victim of or committing a repeat offense in each category: 444 for repeat victimization, 509 for repeat delinquency, and 197 for repeat substance use. Individuals who reported repeat experiences in more than one time period are included in each time period for which they reported being the victim of or committing a repeat offense. Differences between the observed and expected percentages if they were distributed proportionally to the number of hours in each period appear in parentheses.
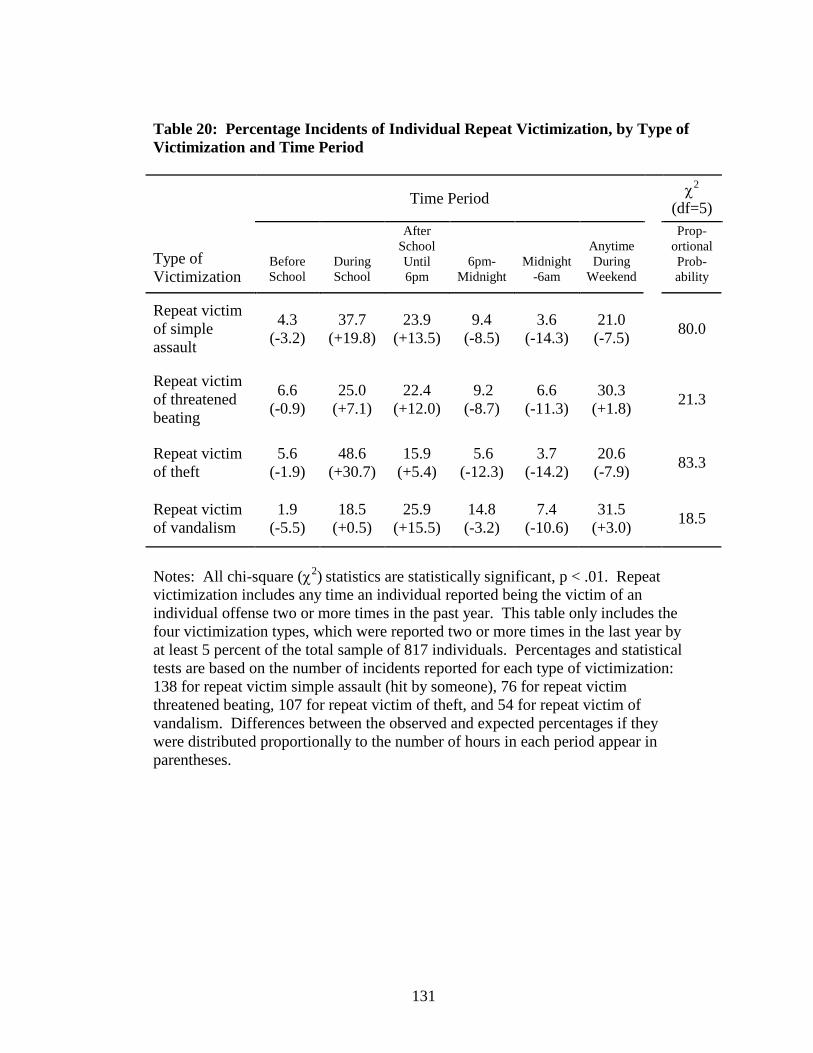
131
Table 20: Percentage Incidents of Individual Repeat Victimization, by Type of Victimization and Time Period
Time Period χ2
(df=5)
Type of Victimization
Before School
During School
After School Until 6pm
6pm-Midnight
Midnight-6am
Anytime During
Weekend
Prop-ortionalProb-ability
Repeat victim of simple assault
4.3(-3.2)
37.7(+19.8)
23.9(+13.5)
9.4(-8.5)
3.6(-14.3)
21.0(-7.5)
80.0
Repeat victim of threatened beating
6.6(-0.9)
25.0(+7.1)
22.4(+12.0)
9.2(-8.7)
6.6(-11.3)
30.3(+1.8)
21.3
Repeat victim of theft
5.6(-1.9)
48.6(+30.7)
15.9(+5.4)
5.6(-12.3)
3.7(-14.2)
20.6(-7.9)
83.3
Repeat victim of vandalism
1.9(-5.5)
18.5(+0.5)
25.9(+15.5)
14.8(-3.2)
7.4(-10.6)
31.5(+3.0)
18.5
Notes: All chi-square (χ2) statistics are statistically significant, p < .01. Repeat victimization includes any time an individual reported being the victim of an individual offense two or more times in the past year. This table only includes the four victimization types, which were reported two or more times in the last year by at least 5 percent of the total sample of 817 individuals. Percentages and statistical tests are based on the number of incidents reported for each type of victimization: 138 for repeat victim simple assault (hit by someone), 76 for repeat victim threatened beating, 107 for repeat victim of theft, and 54 for repeat victim of vandalism. Differences between the observed and expected percentages if they were distributed proportionally to the number of hours in each period appear in parentheses.
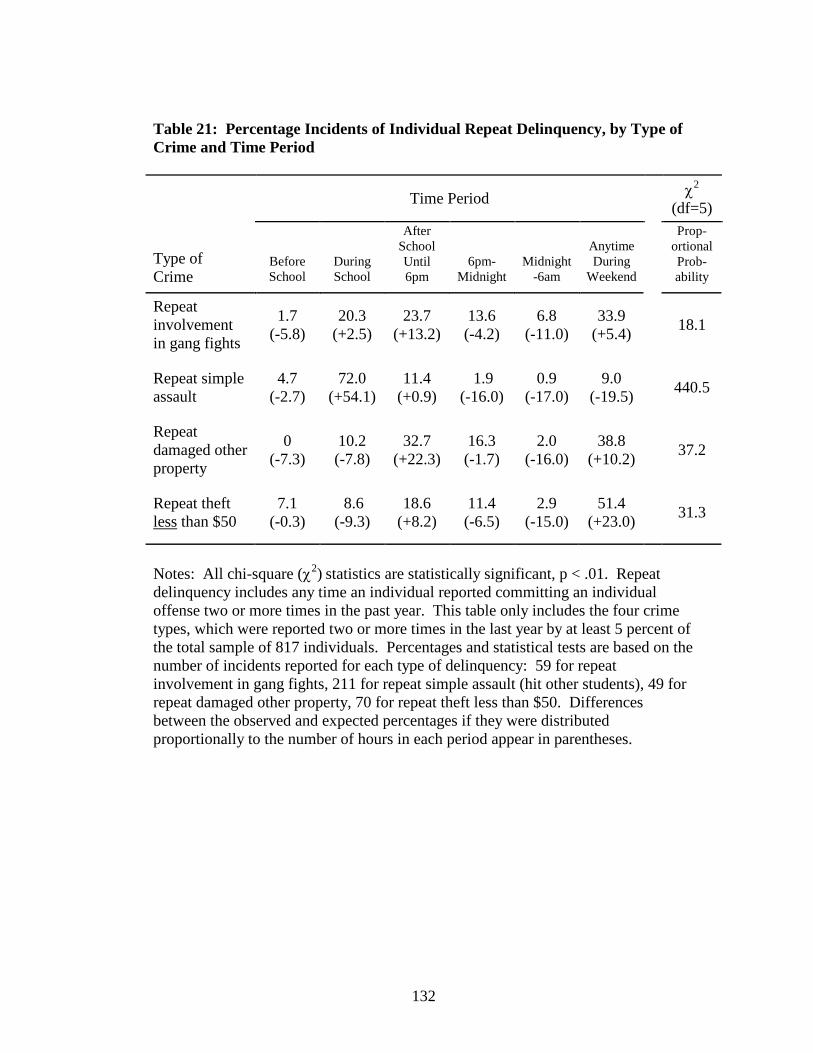
132
Table 21: Percentage Incidents of Individual Repeat Delinquency, by Type of Crime and Time Period
Time Period χ2
(df=5)
Type of Crime
Before School
During School
After School Until 6pm
6pm-Midnight
Midnight-6am
Anytime During
Weekend
Prop-ortionalProb-ability
Repeat involvement in gang fights
1.7(-5.8)
20.3(+2.5)
23.7(+13.2)
13.6(-4.2)
6.8(-11.0)
33.9(+5.4)
18.1
Repeat simple assault
4.7(-2.7)
72.0(+54.1)
11.4(+0.9)
1.9(-16.0)
0.9(-17.0)
9.0(-19.5)
440.5
Repeat damaged other property
0(-7.3)
10.2(-7.8)
32.7(+22.3)
16.3(-1.7)
2.0(-16.0)
38.8(+10.2)
37.2
Repeat theft less than $50
7.1(-0.3)
8.6(-9.3)
18.6(+8.2)
11.4(-6.5)
2.9(-15.0)
51.4(+23.0)
31.3
Notes: All chi-square (χ2) statistics are statistically significant, p < .01. Repeat delinquency includes any time an individual reported committing an individual offense two or more times in the past year. This table only includes the four crime types, which were reported two or more times in the last year by at least 5 percent of the total sample of 817 individuals. Percentages and statistical tests are based on the number of incidents reported for each type of delinquency: 59 for repeat involvement in gang fights, 211 for repeat simple assault (hit other students), 49 for repeat damaged other property, 70 for repeat theft less than $50. Differences between the observed and expected percentages if they were distributed proportionally to the number of hours in each period appear in parentheses.
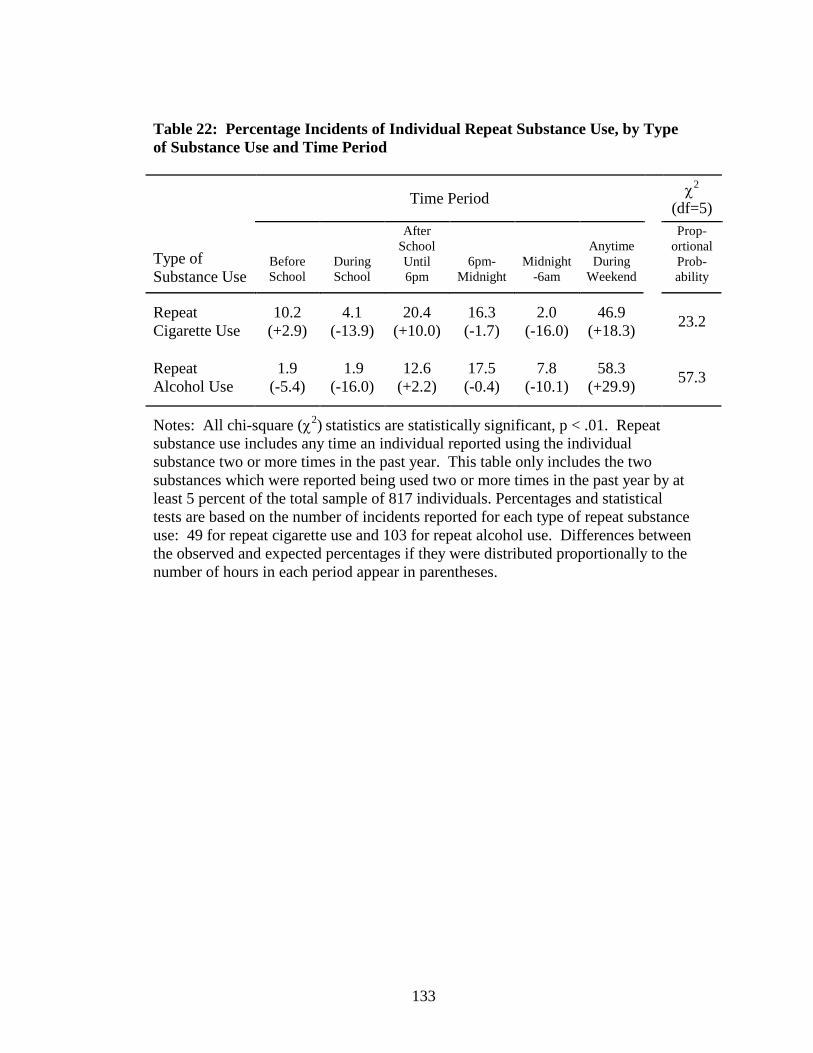
133
Table 22: Percentage Incidents of Individual Repeat Substance Use, by Type of Substance Use and Time Period
Time Period χ2
(df=5)
Type of Substance Use
Before School
During School
After School Until 6pm
6pm-Midnight
Midnight-6am
Anytime During
Weekend
Prop-ortionalProb-ability
Repeat Cigarette Use
10.2(+2.9)
4.1(-13.9)
20.4(+10.0)
16.3(-1.7)
2.0(-16.0)
46.9(+18.3)
23.2
Repeat Alcohol Use
1.9(-5.4)
1.9(-16.0)
12.6(+2.2)
17.5(-0.4)
7.8(-10.1)
58.3(+29.9)
57.3
Notes: All chi-square (χ2) statistics are statistically significant, p < .01. Repeat substance use includes any time an individual reported using the individual substance two or more times in the past year. This table only includes the two substances which were reported being used two or more times in the past year by at least 5 percent of the total sample of 817 individuals. Percentages and statistical tests are based on the number of incidents reported for each type of repeat substance use: 49 for repeat cigarette use and 103 for repeat alcohol use. Differences between the observed and expected percentages if they were distributed proportionally to the number of hours in each period appear in parentheses.
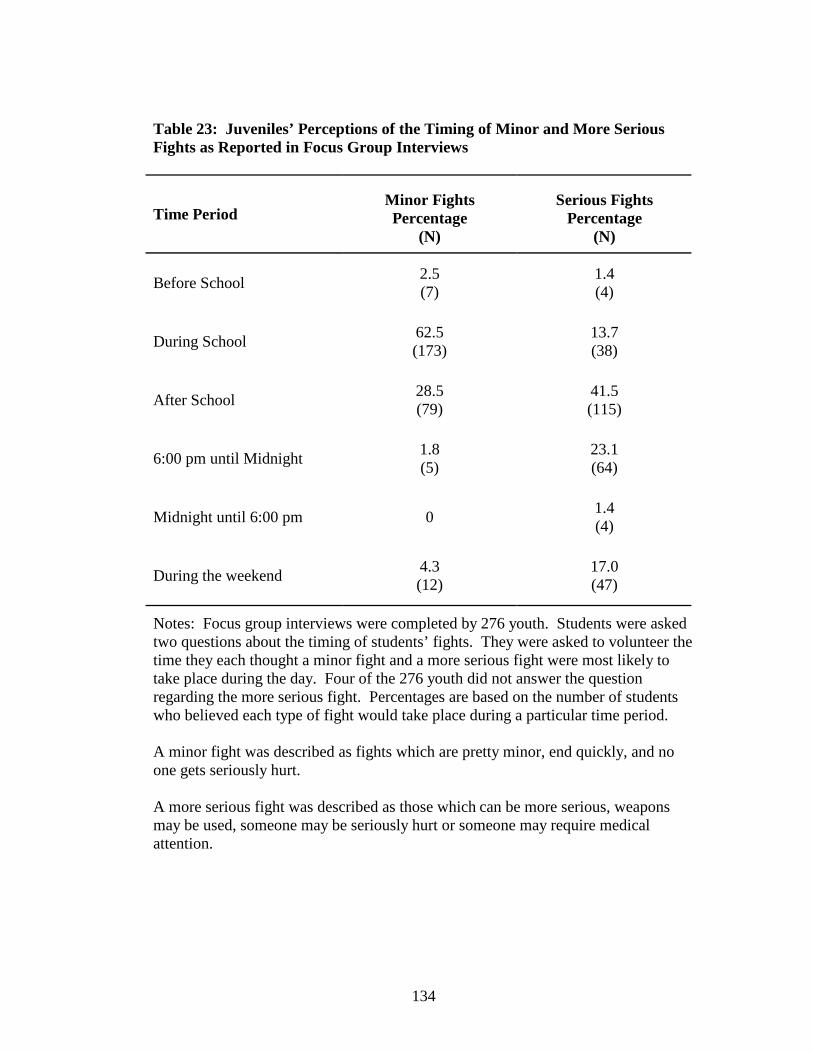
134
Table 23: Juveniles’ Perceptions of the Timing of Minor and More Serious Fights as Reported in Focus Group Interviews
Time PeriodMinor FightsPercentage
(N)
Serious FightsPercentage
(N)
Before School2.5(7)
1.4(4)
During School62.5(173)
13.7(38)
After School 28.5(79)
41.5(115)
6:00 pm until Midnight1.8(5)
23.1(64)
Midnight until 6:00 pm 01.4(4)
During the weekend4.3(12)
17.0(47)
Notes: Focus group interviews were completed by 276 youth. Students were asked two questions about the timing of students’ fights. They were asked to volunteer the time they each thought a minor fight and a more serious fight were most likely to take place during the day. Four of the 276 youth did not answer the question regarding the more serious fight. Percentages are based on the number of students who believed each type of fight would take place during a particular time period.
A minor fight was described as fights which are pretty minor, end quickly, and no one gets seriously hurt.
A more serious fight was described as those which can be more serious, weapons may be used, someone may be seriously hurt or someone may require medical attention.
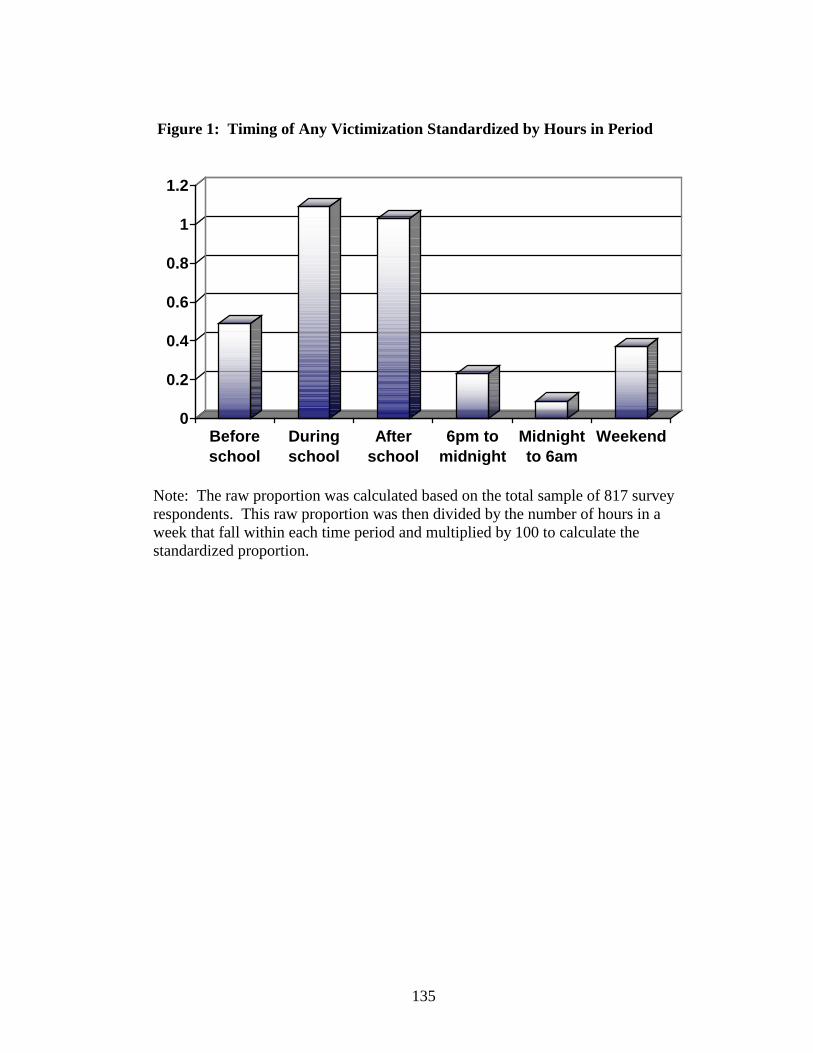
135
Figure 1: Timing of Any Victimization Standardized by Hours in Period
0
0.2
0.4
0.6
0.8
1
1.2
Beforeschool
Duringschool
Afterschool
6pm tomidnight
Midnightto 6am
Weekend
Note: The raw proportion was calculated based on the total sample of 817 survey respondents. This raw proportion was then divided by the number of hours in a week that fall within each time period and multiplied by 100 to calculate the standardized proportion.
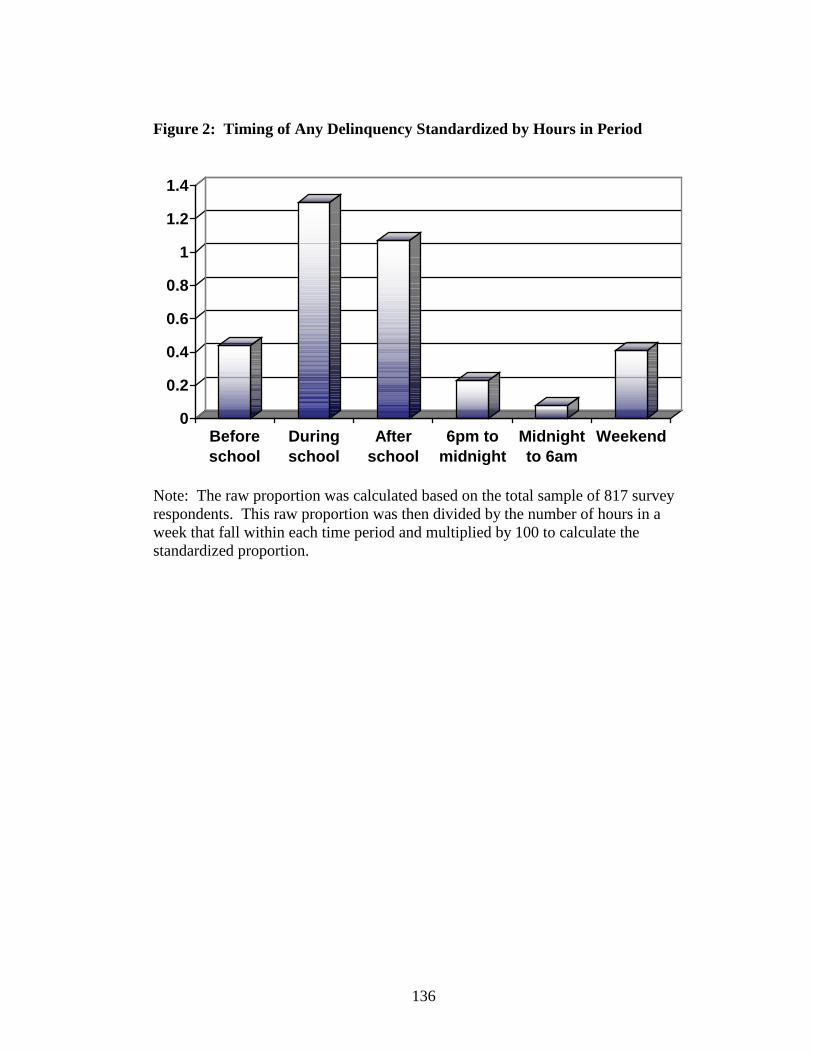
136
Figure 2: Timing of Any Delinquency Standardized by Hours in Period
0
0.2
0.4
0.6
0.8
1
1.2
1.4
Beforeschool
Duringschool
Afterschool
6pm tomidnight
Midnightto 6am
Weekend
Note: The raw proportion was calculated based on the total sample of 817 survey respondents. This raw proportion was then divided by the number of hours in a week that fall within each time period and multiplied by 100 to calculate the standardized proportion.
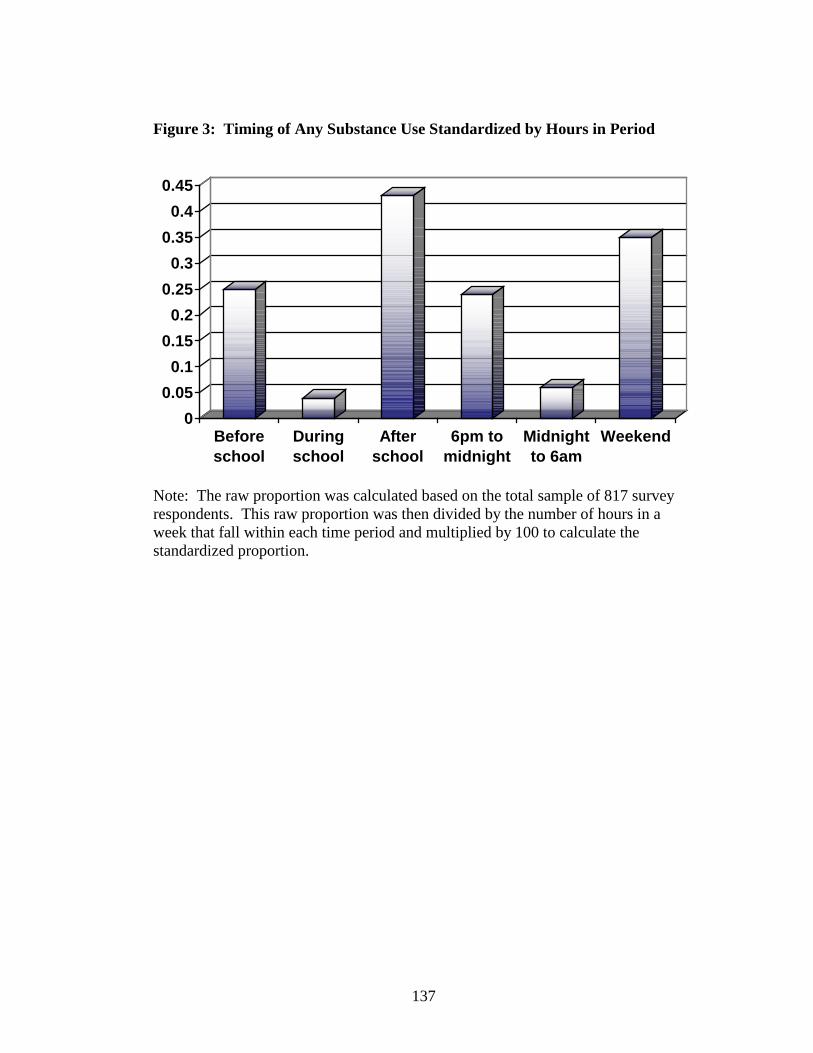
137
Figure 3: Timing of Any Substance Use Standardized by Hours in Period
0
0.05
0.1
0.15
0.2
0.25
0.3
0.35
0.4
0.45
Beforeschool
Duringschool
Afterschool
6pm tomidnight
Midnightto 6am
Weekend
Note: The raw proportion was calculated based on the total sample of 817 survey respondents. This raw proportion was then divided by the number of hours in a week that fall within each time period and multiplied by 100 to calculate the standardized proportion.
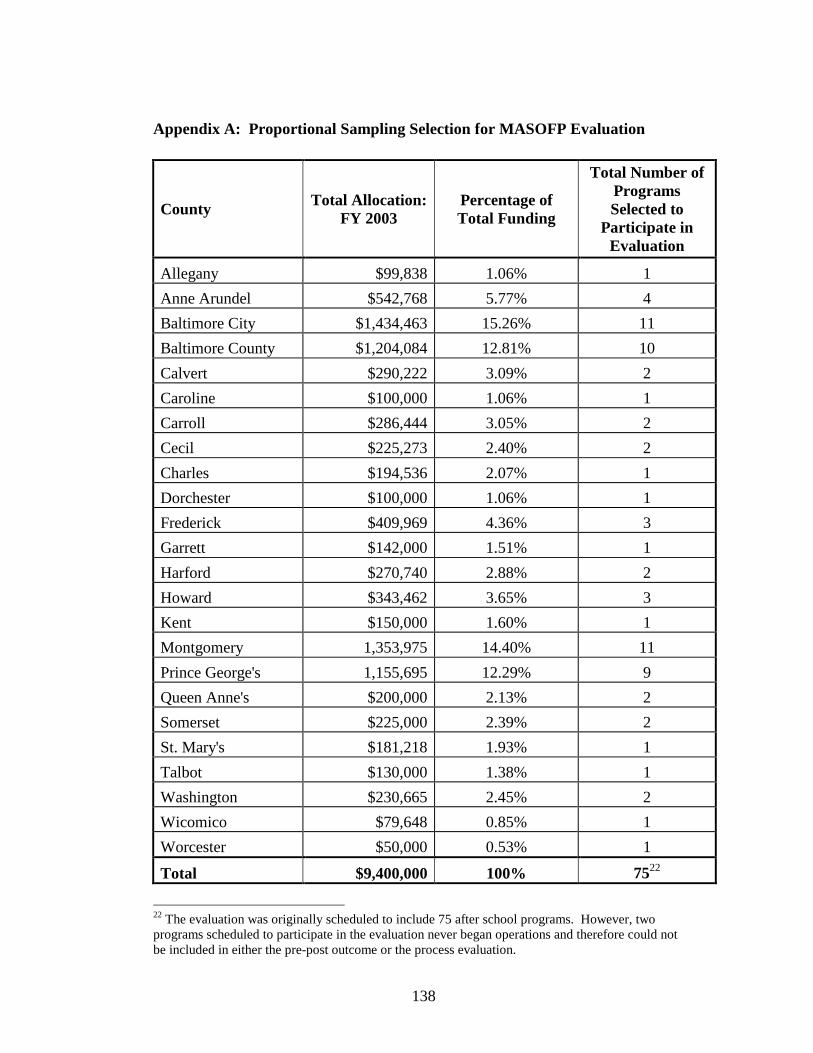
138
Appendix A: Proportional Sampling Selection for MASOFP Evaluation
County Total Allocation: FY 2003
Percentage of Total Funding
Total Number of Programs Selected to
Participate in Evaluation
Allegany $99,838 1.06% 1
Anne Arundel $542,768 5.77% 4
Baltimore City $1,434,463 15.26% 11
Baltimore County $1,204,084 12.81% 10
Calvert $290,222 3.09% 2
Caroline $100,000 1.06% 1
Carroll $286,444 3.05% 2
Cecil $225,273 2.40% 2
Charles $194,536 2.07% 1
Dorchester $100,000 1.06% 1
Frederick $409,969 4.36% 3
Garrett $142,000 1.51% 1
Harford $270,740 2.88% 2
Howard $343,462 3.65% 3
Kent $150,000 1.60% 1
Montgomery 1,353,975 14.40% 11
Prince George's 1,155,695 12.29% 9
Queen Anne's $200,000 2.13% 2
Somerset $225,000 2.39% 2
St. Mary's $181,218 1.93% 1
Talbot $130,000 1.38% 1
Washington $230,665 2.45% 2
Wicomico $79,648 0.85% 1
Worcester $50,000 0.53% 1
Total $9,400,000 100% 7522
22 The evaluation was originally scheduled to include 75 after school programs. However, two programs scheduled to participate in the evaluation never began operations and therefore could not be included in either the pre-post outcome or the process evaluation.
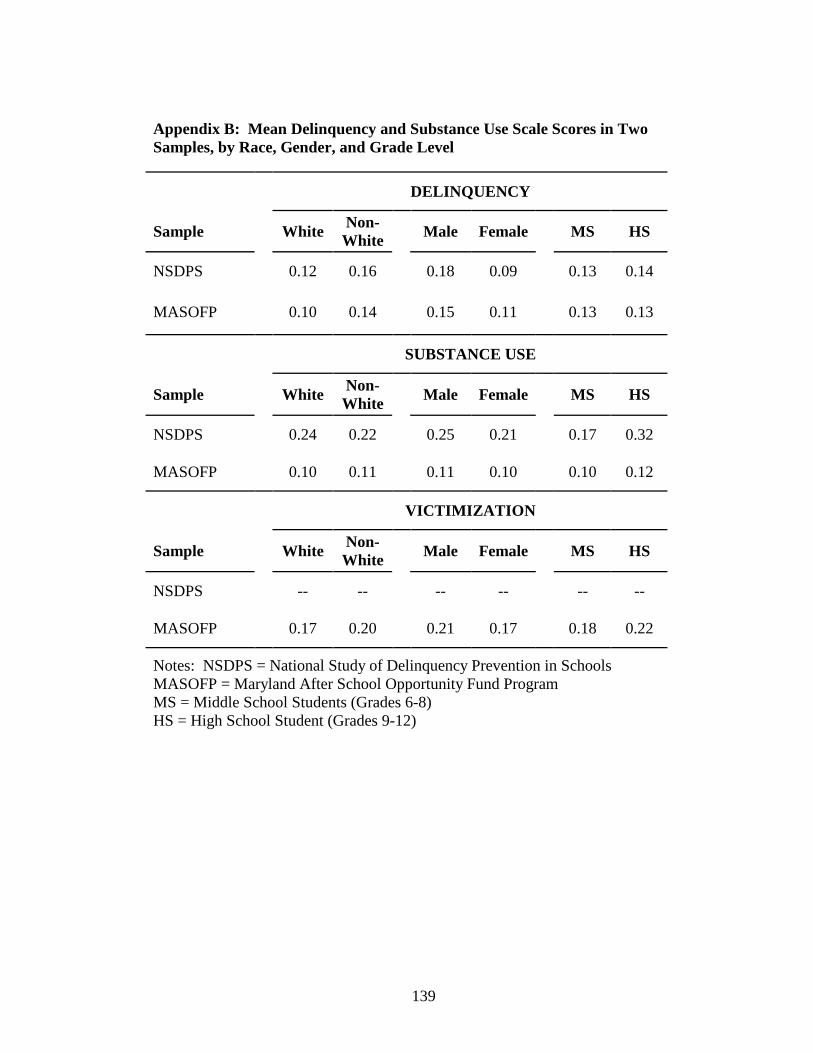
139
Appendix B: Mean Delinquency and Substance Use Scale Scores in Two Samples, by Race, Gender, and Grade Level
DELINQUENCY
Sample WhiteNon-White Male Female MS HS
NSDPS 0.12 0.16 0.18 0.09 0.13 0.14
MASOFP 0.10 0.14 0.15 0.11 0.13 0.13
SUBSTANCE USE
Sample WhiteNon-White Male Female MS HS
NSDPS 0.24 0.22 0.25 0.21 0.17 0.32
MASOFP 0.10 0.11 0.11 0.10 0.10 0.12
VICTIMIZATION
Sample WhiteNon-White Male Female MS HS
NSDPS -- -- -- -- -- --
MASOFP 0.17 0.20 0.21 0.17 0.18 0.22
Notes: NSDPS = National Study of Delinquency Prevention in SchoolsMASOFP = Maryland After School Opportunity Fund ProgramMS = Middle School Students (Grades 6-8)HS = High School Student (Grades 9-12)
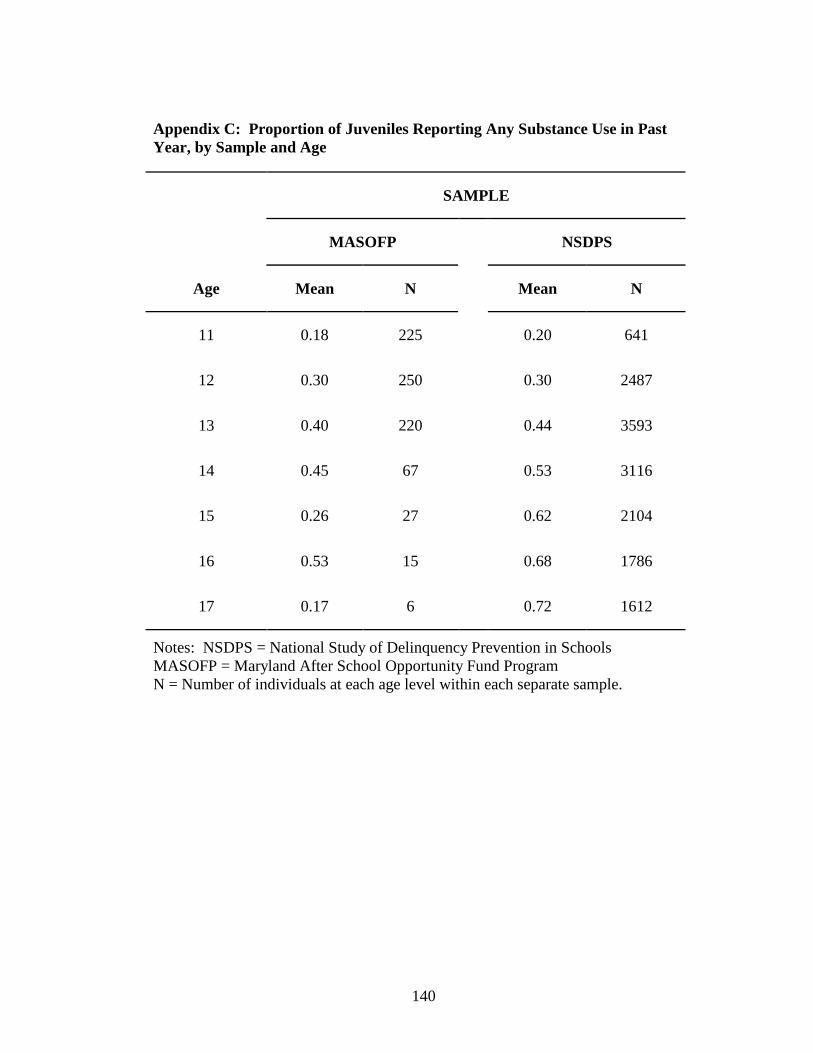
140
Appendix C: Proportion of Juveniles Reporting Any Substance Use in Past Year, by Sample and Age
SAMPLE
MASOFP NSDPS
Age Mean N Mean N
11 0.18 225 0.20 641
12 0.30 250 0.30 2487
13 0.40 220 0.44 3593
14 0.45 67 0.53 3116
15 0.26 27 0.62 2104
16 0.53 15 0.68 1786
17 0.17 6 0.72 1612
Notes: NSDPS = National Study of Delinquency Prevention in SchoolsMASOFP = Maryland After School Opportunity Fund ProgramN = Number of individuals at each age level within each separate sample.
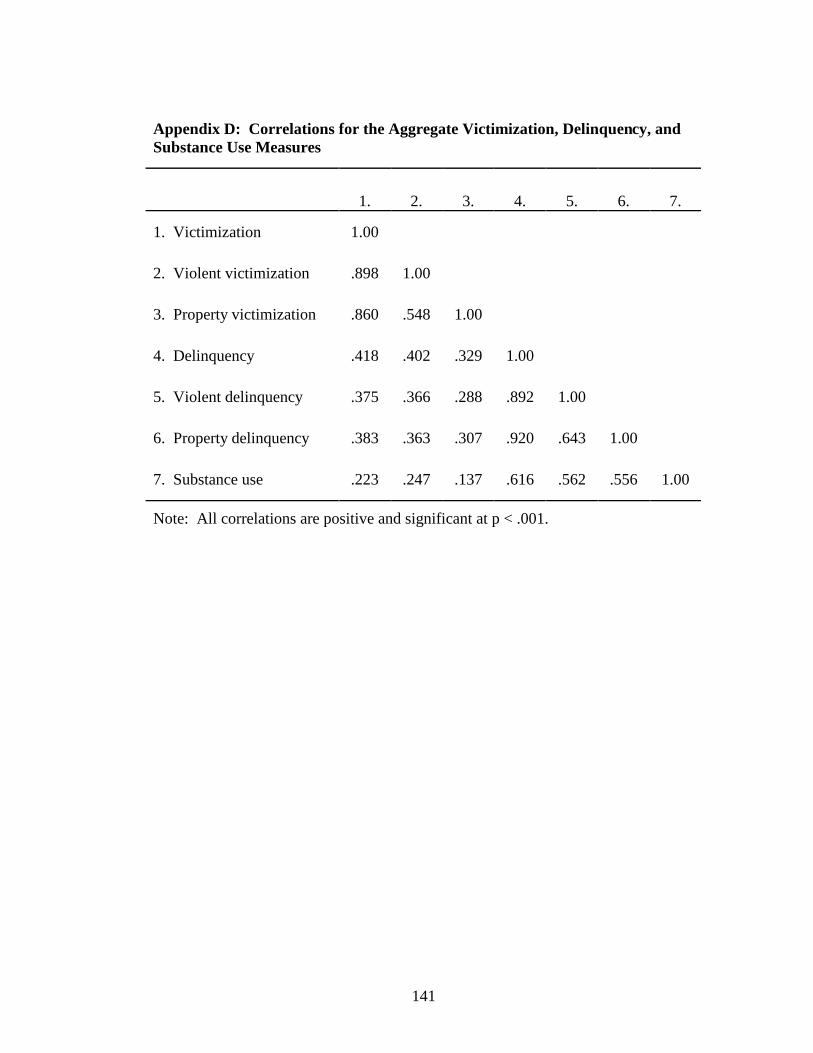
141
Appendix D: Correlations for the Aggregate Victimization, Delinquency, and Substance Use Measures
Note: All correlations are positive and significant at p < .001.
1. 2. 3. 4. 5. 6. 7.
1. Victimization 1.00
2. Violent victimization .898 1.00
3. Property victimization .860 .548 1.00
4. Delinquency .418 .402 .329 1.00
5. Violent delinquency .375 .366 .288 .892 1.00
6. Property delinquency .383 .363 .307 .920 .643 1.00
7. Substance use .223 .247 .137 .616 .562 .556 1.00
142
REFERENCES
Agnew, R. (2002). Experienced, Vicarious, and Anticipated Strain: An Exploratory
Study on Physical Victimization and Delinquency. Justice Quarterly
19(4):603-632.
Brooks, K., V. Schiraldi, and J. Ziedenberg (2000). School House Hype: Two Years
Later. Justice Policy Institute and Children’s Law Center, Inc. Washington,
DC.
Bureau of Justice Statistics (2001). Criminal Victimization in the United States,
1999 Statistics Tables: National Crime Victimization Survey. Washington,
DC: U.S. Department of Justice, Office of Justice Programs.
Bureau of Justice Statistics (2002). Criminal Victimization in the United States,
2001. Washington, DC: U.S. Department of Justice, Office of Justice
Programs.
Centers for Diseases Control and Prevention (2002). Surveillance Summaries, June
28, 2002. Morbidity and Mortality Weekly Report 2002:51 (No. SS-4).
Centers for Diseases Control and Prevention, National Center for Chronic Disease
Prevention (2001). Youth Risk Behavior Surveillance System (YRBSS),
Youth Risk Behavior Survey. Washington, DC: U.S. Department of Health
and Human Services.
143
Chandler, K.A., C.D. Chapman, M.R. Rand, and B.M. Taylor (1998). Students’
Reports of School Crime: 1989 and 1995. Washington, DC: U.S.
Department of Education and Justice.
Cohen, L.E and M. Felson (1979). Social Change and Crime Rate Trends: A
Routine Activity Approach. American Sociological Review 44:588-608.
Cook, P.J. and J.H. Laub (2002). After the Epidemic: Recent Trends in Youth
Violence in the United States. In M. Tonry (Editor), Crime and Justice: A
Review of Research (Vol. 29 pp. 1-37). Chicago: The University of Chicago
Press.
DeVoe, J.F., K. Peter, P. Kaufman, S. A. Ruddy, A.K. Miller, M. Planty, T.D.
Snyder, D.T. Dunhart, and M.R. Rand (2002). Indicators of School Crime
and Safety: 2002, (NCES 2003-009/NCJ 196753). Washington, DC: U.S.
Department of Education and Justice.
Dishion, T.J., G.R. Patterson, M. Stoolmiller, and M.L. Skinner (1991). Family,
School, and Behavioral Antecedents to Early Adolescent Involvement With
Antisocial Peers. Developmental Psychology 27:172-180.
Ellickson, P.L., J.S. Tucker, and D.J. Klein (2003). Ten-Year Prospective Study of
Public Health Problems Associated with Early Drinking. Pediatrics
111(5):949-955.
Elliott, D.S. and D. Huizinga (1989). Multiple Problem Youth: Delinquency,
Substance Use and Mental Health Problems. New York: Springer-Verlag.
Esbensen, F. and D. Huizinga (1991). Juvenile Victimization and Delinquency.
Youth and Society 22(2):202-228.
144
Espiritu, R.C., D. Huizinga, A. Crawford, and R. Loeber (2001). Epidemiology of
self reported delinquency. In R. Loeber and D.P. Farrington (eds.), Child
Delinquents: Development, Intervention, and Service Need (pp. 47–66).
Thousand Oaks, CA: Sage Publications, Inc.
Farrington, D.P. (1993). Understanding and Preventing Bullying. In M. Tonry
(ed.), Crime and Justice: A Review of Research, vol. 17, (pp. 381-458).
Chicago, IL: University of Chicago Press.
Farrington, D.P., R Loeber, M. Stouthamer-Loeber, W.B. Van Kammen, and L.
Schmidt (1996). Self-Reported Delinquency and a Combined Delinquency
Seriousness Scale Based on Boys, Mothers, and Teachers: Concurrent and
Predictive Validity for African-Americans and Caucasians. Criminology
34:493-517.
Federal Bureau of Investigation (2000). Crime in the United States 1999 .
Washington, DC: U.S. Government Printing Office.
Farrell, A.D, S.J. Danish, and C.W. Howard (1992). Relationship Between Drug
Use and Other Problem Behaviors in Urban Adolescents. Journal of
Consulting and Clinical Psychology 60(5):705-712.
Finkelhor, D. (1997). The Victimization of Children and Youth. In R. Davis, A.J.
Lurigio, and W.G. Skogan (eds.), Victims of Crime, 2nd Edition, (pp. 86-
107). Thousand Oaks, CA: Sage.
Finkelhor, D. and R. Ormrod (1999). Reporting Crimes Against Juveniles. Juvenile
Justice Bulletin. Washington, DC: U.S. Department of Justice, Office of
Justice Programs, Office of Juvenile Justice and Delinquency Prevention.
145
Finkelhor, D. and R. Ormrod (2000a). Characteristics of Crimes Against Juveniles.
Bulletin. Washington, DC: U.S. Department of Justice, Office of Justice
Programs, Office of Juvenile Justice and Delinquency Prevention.
Finkelhor, D. and R. Ormrod (2000b). Juvenile Victims of Property Crimes.
Juvenile Justice Bulletin. Washington, DC: U.S. Department of Justice,
Office of Justice Programs, Office of Juvenile Justice and Delinquency
Prevention.
Garofalo, J., L. Siegel, and J.H. Laub (1987). School-Related Victimizations
Among Adolescents: An Analysis of the National Crime Survey (NCS)
Narratives. Journal of Quantitative Criminology 3(4):321-338.
George, D. and P. Mallery (2001). SPSS for Windows Step by Step: A Simple Guide
and Reference 10.0 Update. Boston: Allyn and Bacon.
Gottfredson, D.C. (1986). An Empirical Test of School-Based Environmental and
Individual Interventions to Reduce the Risk of Delinquent Behavior.
Criminology 24:705-731.
Gottfredson, D.C. (2001). Delinquency and Schools. New York: Cambridge
University Press.
Gottfredson, D.C. and D.A. Soulé (2003). The Timing of Property Crime, Violent
Crime, and Substance Use Among Juveniles. Unpublished manuscript.
University of Maryland, College Park.
Gottfredson, D.C., G.D. Gottfredson, and S.A. Weisman (2001). The Timing of
Delinquent Behavior and Its Implications for After School Programs.
Criminology and Public Policy 1:61-86.
146
Gottfredson, D.C., S.A. Weisman, D.A. Soulé, S.C. Womer, and S. Lu
(forthcoming). Do After School Programs Reduce Delinquency?
Prevention Science.
Gottfredson, G.D. and D.C. Gottfredson (1985). Victimization in Schools. New
York: Plenum.
Gottfredson, G.D., D.C. Gottfredson, and E.R. Czeh (2000). National Study of
Delinquency Prevention in Schools. Ellicott City, MD: Gottfredson
Associates, Inc.
Gottfredson, M.R. (1986). Substantive Contributions of Victimization Surveys. In
M. Tonry and N. Morris (eds.), Crime and Justice. An Annual Review of
Research (pp. 251-287). Chicago: University of Chicago Press.
Grunbaum, J.A., L. Kann, S.A. Kinchen, B. Williams, J.G. Ross, R. Lowry, and L.
Kolbe (2002). Youth Risk Behavior Surveillance – United States, 2001. In
Surveillance Summaries, June 28, 2002. MMWR 2002:51 (No. SS-4):1-64.
Hashima, P.Y. and D. Finkelhor (1999). Violent Victimization of Youth Versus
Adults in the National Crime Victimization Survey. Journal of
Interpersonal Violence 14(8):799-820.
Hindelang, M.J. (1981). Variations in Sex-Race-Age-Specific Incidence Rates of
Offending. American Sociological Review 46:461-474.
Hindelang, M.J., M.R. Gottfredson, and J. Garofalo (1978). Victims of Personal
Crime: An Empirical Foundation for a Theory of Personal Victimization.
Cambridge, MA: Ballinger.
147
Hindelang, M.J., T. Hirschi, and J.G. Weis (1981). Measuring Delinquency.
Thousand Oaks, CA: Sage Publications.
Huizinga, D. and F. Esbensen (1990). Scales and Measures of the Denver Youth
Survey. Institute of Behavioral Science, University of Colorado.
Jacob, B.A. and L. Lefgren (2003). Are Idle Hands the Devil’s Workshop?
Incapacitation, Concentration, and Juvenile Crime. Unpublished
manuscript. Harvard University and Brigham Young University.
Jensen, G. and D. Brownfield (1986). Gender, Lifestyles, and Victimization:
Beyond Routine Activity. Violence and Victims 11:85-99.
Kann, L, S.A. Kinchen, B.I. Williams, J.G. Ross, R. Lowry, J.A. Grunbaum, L.J.
Kolbe and State and Local YRBSS Coordinators. (2000). Youth Risk
Behavior Surveillance: United States 1999. MMWR CDC Surveillance
Summary 49:1-96.
Klaus, P. and C.M. Rennison (2002). Age Patterns in Violent Victimization, 1976-
2000. Washington, DC: Bureau of Justice Statistics.
Kvaraceus, W. (1945). Juvenile Delinquency and the School. New York: World
Book Company.
Lauritsen, J.L. and K.F.D. Quinet (1995). Repeat Victimization Among
Adolescents and Young Adults. Journal of Quantitative Criminology
11:143-166.
Lauritsen, J.L., J.H. Laub, and R.J. Sampson (1992). Conventional and Delinquent
Activities: Implications for the Prevention of Violent Victimization Among
Adolescents. Violence and Victims 7(2):91-108.
148
Lauritsen, J.L., R.J. Sampson and J.H. Laub (1991). The Link Between Offending
and Victimization Among Adolescents. Criminology 29:265-291.
Loeber, R., L. Kalb, and D. Huizinga (2001). Juvenile Delinquency and Serious
Injury Victimization. Washington, DC: U.S. Department of Justice, Office
of Justice Programs, Office of Juvenile Justice and Delinquency Prevention.
Lynch, J.P. (2002). Trends in Juvenile Violent Offending: An Analysis of Victim
Survey Data. Bulletin. Washington, DC: U.S. Department of Justice,
Office of Justice Programs, Office of Juvenile Justice and Delinquency
Prevention.
Maryland After School Opportunity Fund Advisory Board, Lt. Governor Kathleen
Kennedy Townsend, Chair (1999). Maryland After-School Opportunity
Fund Program Comprehensive Plan (December 30).
Maryland State Department of Education (2003). Maryland’s Report Card: 2003
Performance Report. http://msp.msde.state.md.us/state.asp.
Menard, S. (2000). The “Normality” of Repeat Victimization from Adolescence
through Early Adulthood. Justice Quarterly 17(3): 543-574.
Menard, S. and D. Huizinga (2001). Repeat Victimizations in a High-Risk
Neighborhood Sample of Adolescents. Youth & Society 32(4):447-472.
National Center for Educational Statistics and Bureau of Justice Statistics (1998).
Indicators of School Crime and Safety, 1998. Washington, DC: U.S.
Department of Education and U.S. Department of Justice.
149
National Research Council and Institute of Medicine (2002). Community Programs
to Promote Youth Development. Committee on Community-Level Programs
for Youth. Jacquelynee Eccles and Jennifer A. Gootman, eds. Board on
Children, Youth and Families, Division of Behavioral and Social Sciences
and Education. Washington, DC: National Academy Press.
Newman, S.A., J.A. Fox, E.A. Flynn, and W. Christeson (2000). America’s After-
School Choice: The Prime Time for Juvenile Crime, or Youth Enrichment
and Achievement. Washington, DC: Fight Crime: Invest in Kids.
Office of National Drug Control Policy (2003). Juveniles and Drugs. Fact Sheet.
Washington, DC: Executive Office of the President.
PRIDE (2003). 2002-2003 PRIDE Surveys National Summary. Bowling Green,
KY.
Rennison, C. (2002). Criminal Victimization 2001: Changes 2000-01 with Trends
1993-2001. Washington, DC: Bureau of Justice Statistics.
Richardson, J., K. Dwyer, K. McGuigan, W. Hansen, C. Dent, C.A. Johnson, S.Y.
Sussman, B. Brannon, and B. Flay (1989). Substance Use Among Eight-
Grade Students Who Take Care of Themselves After School. Pediatrics
84(3):556-566.
Sampson, R.J. and J.L. Lauritsen (1990). Deviant Lifestyles, Proximity to Crime,
and the Offender-Victim Link in Personal Violence. Journal of Research in
Crime and Delinquency 27:110-139.
150
Shaffer, J.N. and R.B. Ruback (2002). Violent Victimization as a Risk Factor for
Violent Offending Among Juveniles. Bulletin. Washington, DC: U.S.
Department of Justice, Office of Justice Programs, Office of Juvenile Justice
and Delinquency Prevention.
Sickmund, M, H. Snyder and E. Poe-Yamagata (1997). Juvenile Offenders and
Victims: 1997 Update on Violence—Statistics Summary. Washington, DC:
Office of Juvenile Justice and Delinquency Prevention.
Snyder, H. (2002). Juvenile Arrests 2000. Bulletin. Washington, DC: U.S.
Department of Justice, Office of Justice Programs, Office of Juvenile Justice
and Delinquency Prevention.
Snyder, H. and M. Sickmund (1999). Juvenile Offenders and Victims: 1999
National Report. Washington, DC: Office of Juvenile Justice and
Delinquency Prevention.
Snyder, H., M. Sickmund, and E. Poe-Yamagata (1996). Juvenile Offenders and
Victims: 1996 Update on Violence. Washington, DC: Office of Juvenile
Justice and Delinquency Prevention.
Sparks, R.F. (1981). Multiple Victimization: Evidence theory and Future Research.
Journal of Criminal Law and Criminology 72:762-778.
Substance Abuse and Mental Health Services Administration (SAMHSA) (2002).
Results from the 2001 National Household Survey on Drug Abuse: Volume
1. Summary of National Findings (Office of Applied Studies, NHSDA Series
H-17, DHHS Publication No. SMA 02-375B,). Rockville, MD: Substance
Abuse and Mental Health Services Administration.
151
Thornberry, T. and M. Krohn (2000). The Self-Report Method for Measuring
Delinquency and Crime. In D. Duffee, D. McDowall, B. Ostrom, R.
Crutchfield, S. Mastrofski, and L. Mazerolle (Editors), Criminal Justice
2000: Measurement and Analysis of Crime and Justice (Vol. 4).
Washington, DC: U.S. Department of Justice, Office of Justice Programs,
National Institute of Justice.
United States Department of Education and Justice (2000). Working for Children
and Families: Safe and Smart Afterschool Programs. Washington, DC: U.S.
Department of Education and Justice.
United States Department of Education (USDE), National Center for Education
Statistics (2002). Are America’s Schools Safe? Students Speak Out: 1999
School Crime Supplement, (NCES 2002-331). Edited by L.A. Addington,
S.A. Ruddy, A.K. Miller, J.F. DeVoe. Project Officer: K.A. Chandler.
Washington, DC: U.S. Department of Education.
United States Department of Education (USDE), National Center for Education
Statistics (1997). Principal/School Disciplinarian Survey on School
Violence. Fast Response Survey System (FRSS) 63.
United States Department of Health and Human Services (2001). Youth Violence: A
Report of the Surgeon General Report. Rockville, MD: U.S. Department of
Health and Human Services, Centers for Disease Control and Prevention,
National Center for Injury Prevention and Control; Substance Abuse and
Mental Health Services Administration, Center for Mental Health Services;
and National Institute of Health, National Institute of Mental Health.
152
Wallace, J.M., Jr., J.G. Bachman, P. M. O'Malley, L.D. Johnston, J.E. Schulenberg,
and S.M. Cooper (2002). Tobacco, alcohol, and illicit drug use: Racial and
ethnic differences among U.S. high school seniors, 1976-2000. Public
Health Reports, 117 (Supplement 1), S67-S75.
Weisman, S.A., S.C. Womer, S.L. Lu, D.A. Soulé, S. Bryner, A. Kahler, M.
Kellstrom, and D.C. Gottfredson (2002). Maryland After School Community
Grant Program Report on the 2000-2001 School Year Evaluation of the
Phase 2 After-School Programs. College Park, MD: University of
Maryland.
Whitaker, C.J. and L.D. Bastian (1991). Teenage Victims: A National Crime Survey
Report (NCJ-128129). Washington, DC: Bureau of Justice Statistics.
Wordes, M. and M. Nunez (2002). Our Vulnerable Teenagers: Their Victimization,
Its Consequences, and Directions for Prevention and Intervention. Oakland,
CA: National Council on Crime and Delinquency.


![[Drum] Bob Moses - Drum Wisdom](https://img.pdfslide.us/doc/110x75/577cbfd31a28aba7118e36ec/drum-bob-moses-drum-wisdom.jpg)