Embed Size (px)
Citation preview
The Innovation Journal: The Public Sector Innovation Journal, Volume 9 (3), 2004
The Consequences of Innovation by Bann Seng Tan
Abstract
Although innovation is frequently heralded as the driver of the ‘new economy’, its myriad claims have yet to be substantiated. The paper surveys the literature and addresses some of the claims skeptically. It differentiates between the public and private sector prerogatives in order to understand why the public sector organization is typically less innovative than its private sector counterparts. It also adopts a typology that sensitizes the evaluator to the impact of innovation upon the allocative efficiency (‘are we doing the right things?’) of the public service. Although a survey of innovation indicators available in the public domain would indicate that there is a growing sophistication in financial measures, such as the Economic Value Added, for the private sector, and in Net Economic Value, for the public sector; the trend is for an emphasis away from technical efficiency (‘are we doing things the right way?’) towards allocative efficiency. In this light, both the private sector notion of service encapsulation and public sector notion of public value provide a framework with which to assess the consequences of innovation. In essence, the answer to the question “why public sector organizations seek innovation?” has to be because “innovation helps to increase public value”.
The Consequences of Innovation
Virtually all companies talk about innovation, and the importance of “doing” innovation, many actually try to “do it”, and only few actually succeed in doing it. The reality is that innovation, for the most part, frightens organizations because it is inevitably linked to risk. Many companies pay lip service to the power and benefits of innovation. To a large extent most remain averse to the aggressive investment and commitment that innovation demands. Instead they dabble in innovation and creativity. Even though innovation is debated in senior level meetings as being the lifeblood of the company, and occasional resources and R&D funds are thrown at it, often the commitment usually ends there.1
Due to the hype about innovation as the ‘new’ driver of the ‘new’ economy, it is
easy, even legitimate, to be cynical and consider innovation as just another management
fad.2 Disentangling some of the myriad competing claims about innovation, is one of the
aims of this paper. Specifically, this paper i) considers the consequences of innovation3;
ii) attempts to categorize them; iii) suggests the public value framework which takes into
account the role of innovation at the organizational level; and iv) concludes by suggesting
future avenues of research, all within the context of the Singaporean Public Service.4
Ultimately, the goal of the paper, besides establishing reasonable claims for the
consequences of innovation, is to persuade senior management within the public service
that innovation policies has quantifiable results that makes it intrinsically valuable as a
organizational goal provided allocative efficiency is considered. Towards this goal, we
start with some definitional issues and a literature review of innovation and it
consequences as well as a methodological discussion.
Definitional Issues
Any concept is liable to be abused if it is used loosely. The appropriate starting
point of any definition is conceptual. Innovation as a concept was first highlighted within
academia by Joseph Alois Schumpeter, a Harvard economics professor, who saw
innovation as a process that takes an invention and develops it all the way to a marketable
product and service that changes the economy. New products must change the economy
in a fundamental sense by:5 -introduction of a new product or a qualitative change in an existing product; or
1
-process innovation new to an industry; or -the opening of a new market; or -development of new sources of supply for raw materials or other inputs; or -changes in industrial organization Examples Schumpeter considers as innovation include the television, jet plane and the
personal computer, all of which have changed the way the economy works.6 By his
conception, few products could be considered ‘innovative’.
Schumpeter’s definition underlies another aspect of innovation – that of
innovation as coming up with better products or what is broadly termed as product
innovation. The problem with the conception of innovation as product innovation, in
addition to its emphasis on technology and its associated R & D, is that it is less relevant
to the public service, traditionally associated with intangible products and more emphasis
on services.
What was needed is a conception of innovation as process innovation –
emphasizing the creation of new value or new services for customers. Process innovation,
however, suffers from vague conceptual boundaries. As John W. Hawks asked, where is
the difference between innovation and: Doing something I know about more often Doing something I know about better Doing something somewhat different and Doing something altogether different.7
Within the management literature, there has been a similar attempt to distinguish
between innovation and closely allied concepts. Teresa M. Amabile, for example saw the
need to distinguish between innovation and creativity. For her, “creativity is the
production of novel and useful ideas in any domain”; whereas “innovation is the
successful implementation of creative ideas within an organization.”8 Creativity is thus a
necessary but not sufficient condition for innovation.
In the same vein, there is also a distinction between innovation and invention.
“Innovation is concerned with the process of commercializing or extracting value from
ideas; that is in contrast with ‘invention’ (sic) which need not be directly associated with
commercialization.”9
2
Thus we can conclude that once innovation is conceptualized as distinct from its
technological, product-driven aspects10 – the boundaries between process innovation and
many management concepts like change management11, re-invention,12 information
management (as opposed to IT management), diffusion studies,13 and knowledge
management14 starts to blur. Similarly, if innovation is conceptualized as a mode of
organizational change, then disciplines as diverse as philosophy, sociology, political
science, social action theories, and system theories all have their relevance.
Whilst interesting, the context of the Singapore public service circumscribes the
scope of this discussion.15 The official definition adopted by the Singaporean authorities
defines innovation as the creation of new value for the organization through doing things
differently and doing different things.16 Literature Review
In this section, I summarize two types of literature- the management/academic
literature (professors teaching in business schools and so on), and the practitioner
literature (consultants selling their services and so on).
Much of the practitioner literature focuses on how to be innovative17 and is
usually vague on why we want innovation at the organization level. Apparently, the
reason for innovation is strongly linked to extrinsic factors outside of innovation per se,
for example to fulfill a bureaucratic assessment criteria, to win an innovation award, or
for that most bureaucratic of reasons to value innovation because the authorities declared
it to be so.
From the academic literature, a conservative count of innovation relevant
literature by Everett Rogers, yielded more than four thousand publications from many
disciplines in 1995.18 However, while some of that literature is about innovation at the
individual/regional/national level, little is known about it at the firm and/or organizational
level.19 Also, much of the management literature is traditionally heavy on the
manufacturing perspective (emphasizing R&D and new technology) at the expense of
services.20
3
In the face of this diversity, I found it useful to group the literature review into
three issue-areas of A) public and private sector attitude towards risk, B) innovation as
the independent variable, C) level of analysis. Public and private sector attitudes to innovation and risks21
A few years ago, during a seminar for managers from different companies, I mentioned the importance of risk taking to the creative process. One manager raised his hand and, to the amusement of others in the audience, earnestly remarked, “In my company we pride ourselves on encouraging people to take risks. We really do. [pause] We don’t want them to make mistakes, but we do want them to take risks.” 22
Innovations within the public sector can seem contradictory.23 The classic work
on bureaucracy by Max Weber identifies routine, repetitiveness and order as the essence
of bureaucracy.24 These values are not associated with innovation. The public sector is
different from the private sector in the following areas (see table 1 below): 1. Customer and Market focus.
In the private sector, customer focus and targeted markets are clear-cut and
customer satisfaction is for the most part indicated by the price mechanism. In the public
sector, the “customer” is replaced by the public or ‘stakeholders’25 who are much more
diverse. Often, the stakeholders are diverse enough to force difficult tradeoffs between
different public interests. For example the Prisons department has obligations to ensure
public safety (by keeping criminals in jail), to ensure rehabilitation (by reintegrating ex-
criminals back into society), to reduce costs (by simplifying and reducing the amenities in
jails) and to respect the rights of the criminals (keep prisoners’ amenities)- all of which
involves trade-offs. 2. Planning horizons:
The private sector, due to its market-driven nature, does shorter term planning
than the public sector. Private sector organizations also have shorter life-spans then key
public bodies.
4
The public sector may plan with election cycles in mind (for example in liberal
democracies) or much longer, even generational time-frames (for example in Singapore,
economic development is planned for 25 years). 3. Ownership and accountability:
Private sector organizations usually have clear ownership and accountability.
They aim to increase the value of the shareholders. For public sector organizations,
neither is clear-cut. Whereas most public sector employees accept that they are public
‘servants’ and hence ‘owned’ by the public in principle, in daily practice, they are
accountable to a variety of bureaucratic bodies as well as elected executives. This means
they are accountable to conflicting goals- for example, economic development and
sustainable development or between fiscal prudence and populist deficit spending.26
Governments also have a stewardship role towards future generations of voters.27
Shareholders in private sector firms can afford several failures as long as one
success yields on average a positive rate of return. The archetypal example is the US
pharmaceutical industry. It is the world leader in scientific, medical and commercial
terms. It is the most innovative. Yet it takes risks and accepts failure rates which would
be mind-numbing elsewhere. Only one out of five thousand new compounds tested makes
it to the market.28 The laboratory and clinical trial period for a compound to make it to
market takes an average of 10-15 years and costs $ 500 million (US).29
Public sector organizations, by contrast, cannot net out successes and failures.
They “rarely have the luxury of living with several failures regardless of how many
policy success they may have.”30 4. Process-constraints:
Unlike the private sector, the public sector has to operate in an environment
subjected to scrutiny from the media, the public and executive oversight. Such an
operating environment has been described as a ‘fishbowl’ by Gambhir Bhatta.31
Admittedly, the ‘fishbowl’ is considerably more ‘opaque’ for the Singaporean public
service, insulating them from the pressure of accountability and severe budgetary
constraints. Consider the comments of Lim Siong Guan, permanent secretary of the
Ministry of Finance:
5
…there is the Singapore approach with PS21, which is based on a change and attitudinal paradigm without the demands of accountability or the discipline of severe budgets. Largely because we do not have the accountability and budget imperatives, the US, UK, Australian and New Zealand have shown themselves to be much more innovative, creative, flexible and hard driving than we. While an unwillingness to stir undue public accountability and a discomfort with creating budget boundaries may be understandable, the question is whether we believe clear performance accountabilities and budget boundaries would drive the Singapore Public Service to greater sense of urgency, bias for action, focus in efforts, prioritisation of objectives, efficiency in use of resources, and inventiveness and creativity in achieving effectiveness. What this requires is voluntarily submitting ourselves to tough performance criteria within predefined budget boundaries as a public sector version of the challenges of technology, globalisation and competition which the private sector faces. Like it or no, much of the spur to innovation in the public sector lies in budget capping (as has happened in the UK, and in MINDEF at home) just like the spur in the private sector lies in the profit line.32
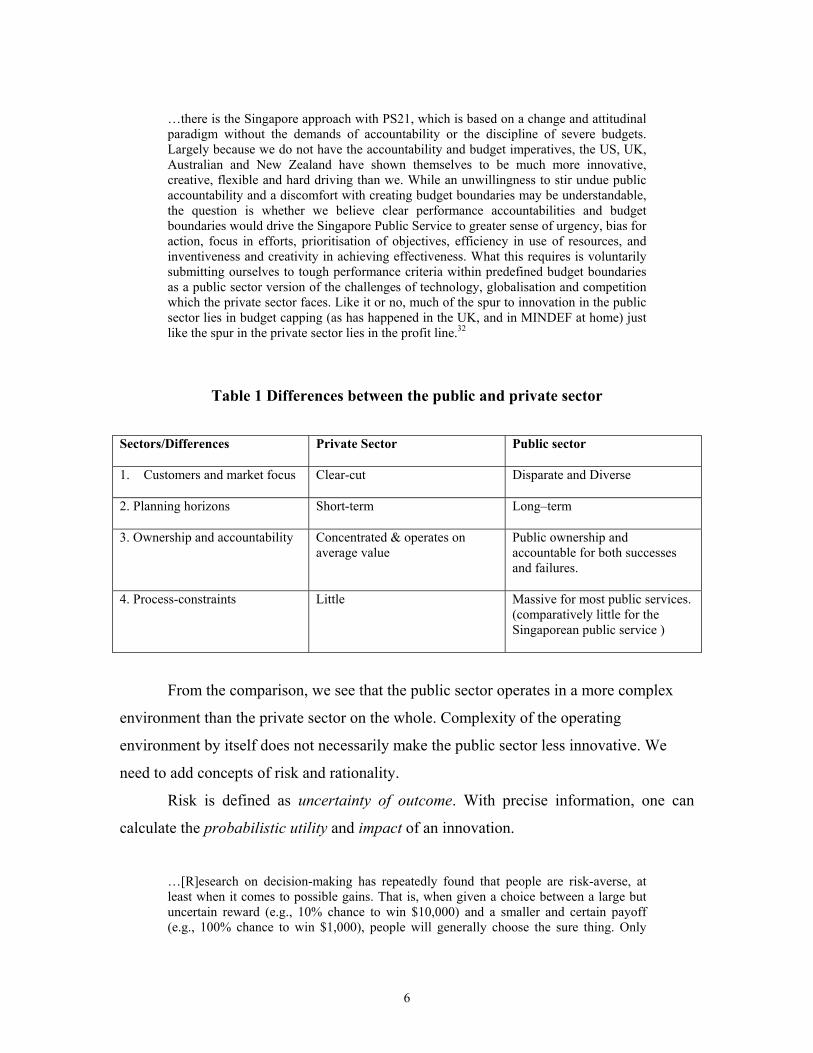
Table 1 Differences between the public and private sector Sectors/Differences
Private Sector Public sector
1. Customers and market focus
Clear-cut Disparate and Diverse
2. Planning horizons Short-term
Long–term
3. Ownership and accountability Concentrated & operates on average value
Public ownership and accountable for both successes and failures.
4. Process-constraints Little
Massive for most public services. (comparatively little for the Singaporean public service )
From the comparison, we see that the public sector operates in a more complex
environment than the private sector on the whole. Complexity of the operating
environment by itself does not necessarily make the public sector less innovative. We
need to add concepts of risk and rationality.
Risk is defined as uncertainty of outcome. With precise information, one can
calculate the probabilistic utility and impact of an innovation.
…[R]esearch on decision-making has repeatedly found that people are risk-averse, at least when it comes to possible gains. That is, when given a choice between a large but uncertain reward (e.g., 10% chance to win $10,000) and a smaller and certain payoff (e.g., 100% chance to win $1,000), people will generally choose the sure thing. Only
6
when they are in losing situations have people reliably been shown to choose the riskier alternative.33
However, what happens when the information about the probabilities themselves
is uncertain? This is the distinction between risk aversion and risk ambiguity aversion.
The latter refers to the fact that people prefer to take risks on the basis of known rather
than unknown probabilities.34 In the face of uncertainty from taking risks, especially
uncertainty about the future, most rational people will try to minimize the costs of
uncertainty. In such situations, the most direct way of minimizing uncertainty is to refuse
to take the risk in the first place.35 On this basis, most people, economists assume, are risk
ambiguity averse.36
Rationality relies on the assumption that people have ranked preferences, which
they then try to pursue consistently.37 The problem is that people tend not to be rational
all the time. They are guided by “bounded rationality”.38
They are satisficers rather than searchers for the optimal or most desirable solution. They follow a number of energy-saving heuristics that generally lead to a set of systemic biases or inaccuracies in processing information. And, unless they are held accountable for their decision-making strategies, they tend to find the easy way out- either by not engaging in very careful thinking or by modeling their choices on the preferences of those who will be evaluating them.39
They decide, intuitively, either that the information they currently possess about a
given situation is enough for them to make a decision or that the marginal cost in
resources in acquiring more information about a given situation is greater than the
marginal gain in utility from having acquired that extra information.40
Thus, due to a complex operating environment, bounded rationality of the
decision-makers and uncertainty over outcomes, public sector officials and organizations
cope by reducing the scope and framework of the problem. In effect public service
management react to change by being conservative (playing it safe) and by suboptimising
their decisions with the result of incrementalism or change in small proportions.41 In
most situations, suboptimising would mean in effect, doing nothing:
The bias toward playing safe has it sharpest impact in encouraging the selection of the alternative that consists of doing nothing… the uncertainty-discounted expected advantage of standing pat will tend to be elevated, other things the same, … than that of alternatives 42
In other words, the risks of innovation are managed by avoiding innovation altogether.
7
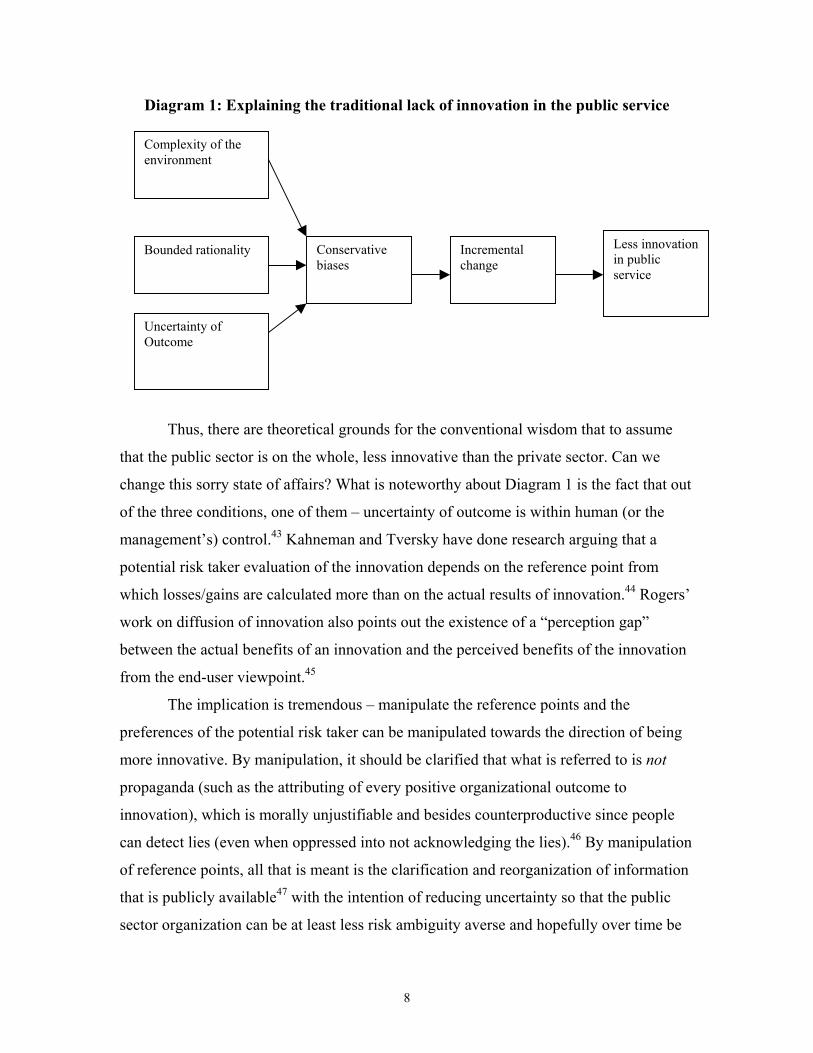
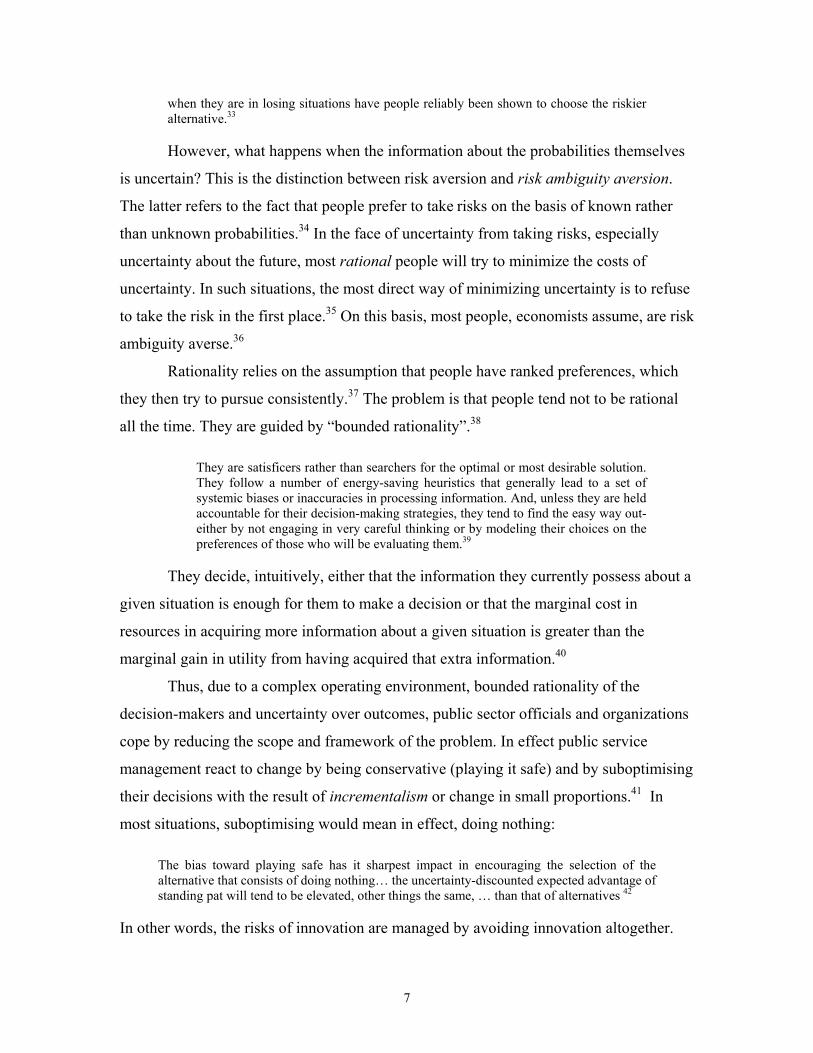
Diagram 1: Explaining the traditional lack of innovation in the public service
Bounded rationality
Uncertainty of Outcome
Conservative biases
Less innovation in public service
Incremental change
Complexity of the environment
Thus, there are theoretical grounds for the conventional wisdom that to assume
that the public sector is on the whole, less innovative than the private sector. Can we
change this sorry state of affairs? What is noteworthy about Diagram 1 is the fact that out
of the three conditions, one of them – uncertainty of outcome is within human (or the
management’s) control.43 Kahneman and Tversky have done research arguing that a
potential risk taker evaluation of the innovation depends on the reference point from
which losses/gains are calculated more than on the actual results of innovation.44 Rogers’
work on diffusion of innovation also points out the existence of a “perception gap”
between the actual benefits of an innovation and the perceived benefits of the innovation
from the end-user viewpoint.45
The implication is tremendous – manipulate the reference points and the
preferences of the potential risk taker can be manipulated towards the direction of being
more innovative. By manipulation, it should be clarified that what is referred to is not
propaganda (such as the attributing of every positive organizational outcome to
innovation), which is morally unjustifiable and besides counterproductive since people
can detect lies (even when oppressed into not acknowledging the lies).46 By manipulation
of reference points, all that is meant is the clarification and reorganization of information
that is publicly available47 with the intention of reducing uncertainty so that the public
sector organization can be at least less risk ambiguity averse and hopefully over time be
8
less risk averse. This supports the key assumption of PS21’s innovation drives that
everyone can be innovative. Also it points to the need for clarification of the
consequences of innovation public service, the purpose of this paper.
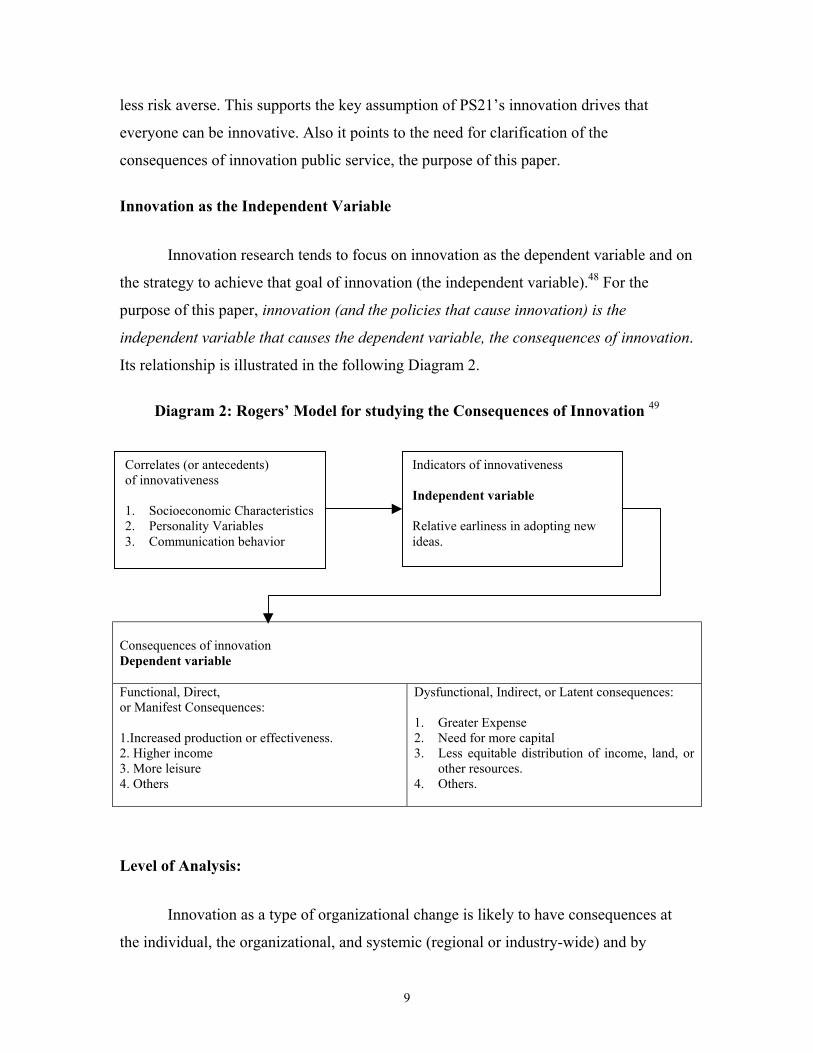
Innovation as the Independent Variable
Innovation research tends to focus on innovation as the dependent variable and on
the strategy to achieve that goal of innovation (the independent variable).48 For the
purpose of this paper, innovation (and the policies that cause innovation) is the
independent variable that causes the dependent variable, the consequences of innovation.
Its relationship is illustrated in the following Diagram 2.
Diagram 2: Rogers’ Model for studying the Consequences of Innovation 49
Consequences of innovation Dependent variable Functional, Direct, or Manifest Consequences: 1.Increased production or effectiveness. 2. Higher income 3. More leisure 4. Others
Dysfunctional, Indirect, or Latent consequences: 1. Greater Expense 2. Need for more capital 3. Less equitable distribution of income, land, or
other resources. 4. Others.
Correlates (or antecedents) of innovativeness 1. Socioeconomic Characteristics 2. Personality Variables 3. Communication behavior
Indicators of innovativeness Independent variable Relative earliness in adopting new ideas.
Level of Analysis:
Innovation as a type of organizational change is likely to have consequences at
the individual, the organizational, and systemic (regional or industry-wide) and by
9
extension, the national level. At the national level, research suggests that innovation is
correlated with various desirable macro-level economic indicators like the GDP, per
capita GDP, and economic productivity.50 At the systemic level, the focus is on ‘clusters’
of innovation. “Clusters are geographically proximate groups of interconnected
companies, industries, and associated institutions in a particular field, linked by
commonalties and complementarities.”51 Clusters, according to Porter’s diamond model
thrive on intense competition, high quality-specialized inputs, strong and sophisticated
domestic demand and a presence of related supporting industries.52 Some nations, notably
Canada have conducted extensive research into the regional basis of innovation.53
While the other levels of analysis represent avenues of fruitful research, this paper
focuses on the organizational consequences of innovation. This focus may raise some
concerns – if creativity and innovation are conventionally understood to be located within
individuals. Why should one study the organizational consequences of innovation
initiatives? There are two reasons. The first, as specified within the introductory
paragraph of this paper, is that ultimately, organizations are the funding agencies for the
various innovation training programmes, they will decide who attends what training
programs. Second, any creative idea by individuals needs the organization to invest in the
development, manufacturing and marketing of a new product/service.54 This is why the
paper’s working definition of innovation explicitly has an organizational focus. Consequences of Innovation
What are the consequences of innovation? Consequences are defined as the
changes that occur to an individual, organization or social system as a result of the
adoption or rejection of an innovation.55 In this respect, Everett Rogers’ framework, one
of the best in this area, is worth elaborating.
Rogers started by pointing out that most research focuses overwhelming on the
adoption of an innovation, assuming that the consequences of that adoption are positive
for the recipient of the innovation.56 The reasons for this pro-innovation bias in research
are twofold. Firstly, most studies rely (especially those in the practitioner field) on survey
data which by their nature, capture snap-shots of data that are inherently longitudinal.
Longitudinal data in turn require extended observation over time or in-depth case studies
10
(the latter is usually not conducive to generalization to other cases). The United States
National Science Foundation (NSF) for example feels that it is potentially three to five
years before a typical innovation program bears results.57 Secondly, evaluating
consequences involves judgements about the results, which are value-laden and open to
charges of ethnocentrism. Lastly, the consequences of innovation are in themselves
frequently confounded with other effects that would have occurred even if the innovation
had not occurred.58
Rogers came up with a taxonomy of the consequences of Innovation.
Consequences can be: desirable or undesirable, direct or indirect, anticipated or
unanticipated. Whether a consequence is desirable or undesirable depends on whether the
effects of an innovation are functional or dysfunctional from the point of reference of the
organization. In making this distinction, the assumption is that usually, the desirable and
undesirable effects of an innovation cannot be managed separately.59
Whether a consequence is direct or indirect depends on whether the changes in
response to the innovation are first-order or second order. Direct consequences are
changes to an organization that occur in immediate response to an innovation. Indirect
consequences may take years to develop.
Whether a consequence is anticipated or unanticipated depends on whether the
changes are recognized by members of an organization as the intended consequences of
the innovation. Unanticipated consequences are by definition unknown to the innovator
until after the innovation is widespread.
Innovators introduce into a system, innovations that they expect will have
desirable, direct and anticipated consequences. However, the recipients of an innovation
may not share the same viewpoint.
Simply to regard adoption of the innovation as rational (defined as the use of the most effective means to reach a given end) and to classify rejection as wrong or stupid is to fail to understand that individual innovation decisions are idiosyncratic and particularistic.60
Innovators frequently concentrate on an innovation’s form, the direct
consequences of an innovation’s function and its contribution to the way of life of the
system’s members, neglecting the subjective perceptions of the innovation’s meaning for
11

its clients. Whereas the innovators are asking questions like “What is innovation?” and
“How does it work?”, the recipients of innovations are asking “How do the consequences
of the innovation improve or weaken my position?” The differences between the
innovator’s and the recipient’s perception constitutes the perception gap. The narrower
the perception gap, the more successful the innovation program is at reaching out to the
public.61
Another critical factor Rogers mentioned, is the distribution of the consequences
of innovation. It was found that ceteris paribus, innovation tends to widen the
socioeconomic gap between the ‘haves’ and the ‘have-nots’ hence exacerbating
inequality.62 To illustrate with a generic example, consider an innovation that brings a
greater level of Good to the entire system. Prior to the innovation (diagrams 3 & 5), the
distribution of socioeconomic assets (wealth, incomes, physical assets, political power
and so on) amongst the ‘haves’ and ‘have-nots’ is fixed at an illustrative 10 to 90 ratio. It
is assumed that the absolute number of ‘haves’ and ‘have-nots’ remains constant for this
illustration.63
If the distribution of assets remained the same after the innovation, we should
expect Diagram 4, where the overall level of Good in the system increases but the
distribution remains the same. Rogers’ research implies that innovation often changes the
distribution of assets in the system in favor of the ‘haves’ so that they come to own a
greater proportion of the Good in the system, thus exacerbating inequality in the system
(illustrated in diagram 6). In international trade, this is the mercantilist distinction
between relative and absolute gains.
12

Diagram 3: Diagram 4: Distribution of assets before the innovation Distribution of assets after the innovation
10%
90%
10%
90%
I The level of Good in the system increases, but its distribution remains with the same level of equality. Diagram 5 Diagram 6 Distribution of assets before the innovation Distribution of assets after the innovation
30%
70%
10%
90%
II The level of Good in the system increases, but its distribution is more concentrated (the ‘haves’ gain from 10 % to 30 % of the assets ) and hence the system is less equal.64
13
What Diagrams 3-6 show is that while innovation may increase technical
efficiency (“doing things right”), it is possible that they reduce allocative efficiency
(“doing the right things”). This situation arises because i) early adopters of an innovation
tend to be those already well placed to exploit and pay for the higher-cost innovation
while the late adopters tend not to be; ii) innovators tend to concentrate on persuading
early adopters in the hopes that they will be opinion leaders and diffuse the innovation
further; iii) early adopters of an innovation earn windfall or supernormal profits.65
Basically, the socioeconomic gap tends to widen unless carefully managed.
Understandably, the prospect that outcomes of innovation can be undesirable,
indirect, unanticipated and exacerbate the socioeconomic gap between the ‘haves’ and
‘have-nots’ is a politically sensitive issue for any public service, let alone one as
uncomfortable with public accountability as the Singaporean public service.66 There are
no easy solutions. Given such political-policy parameters and the need for research that
relies on information within the public domain, our typology of the outcomes of
innovation only focuses on the consequences that are desirable, anticipated and that may
be direct and/or indirect.67 Such assumptions coincide, unfortunately, with various
commercial and governmental indicators, to which we now turn.
Indicators of Innovations Outcomes in the Public Domain:
The purpose of this section is to create a database of sets of indicators from which
we can acquire a sense of what the public domain (the market) deems to be indicators for
measuring the consequences of organizational innovativeness. It starts with a brief
introduction of the tools and follows up with the indicators themselves. Due to the fact
that most indicator sets attempt to measure the “innovativeness” of the organization or
the country rather than the consequences of innovation, those indicators that are
inappropriate are removed, resulting in some truncated data sets.
14
EUROPEAN UNION INNOVATION SCORECARD
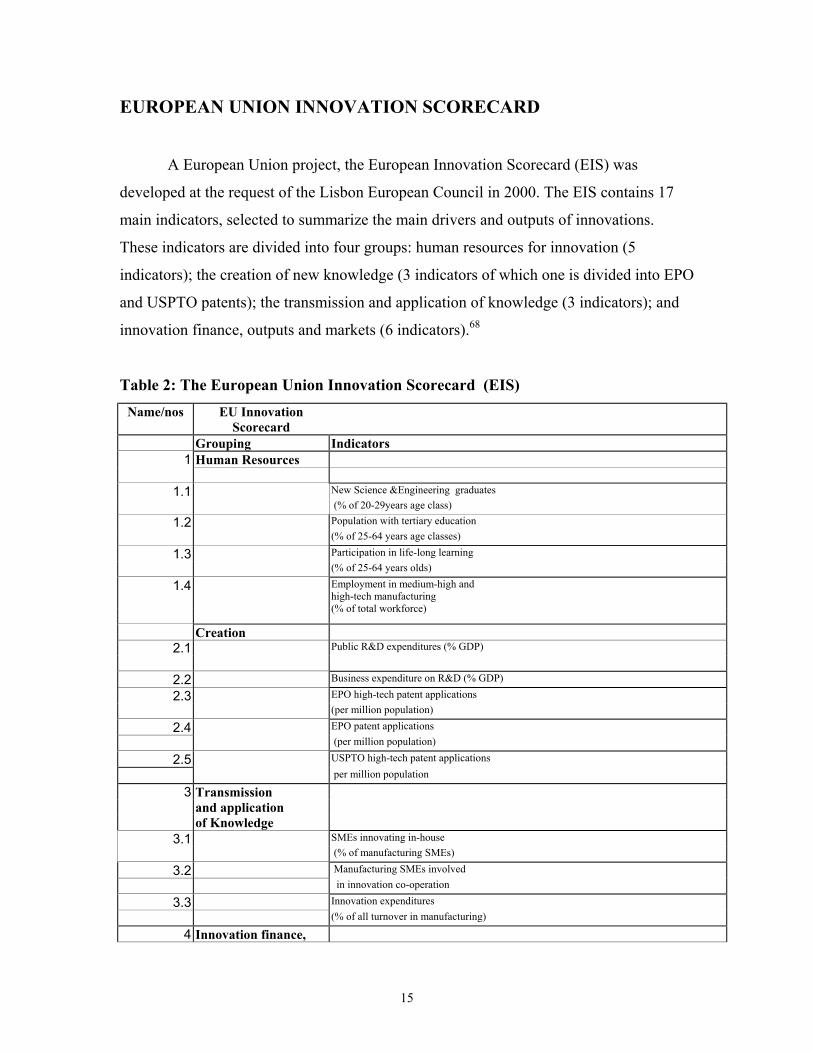
A European Union project, the European Innovation Scorecard (EIS) was
developed at the request of the Lisbon European Council in 2000. The EIS contains 17
main indicators, selected to summarize the main drivers and outputs of innovations.
These indicators are divided into four groups: human resources for innovation (5
indicators); the creation of new knowledge (3 indicators of which one is divided into EPO
and USPTO patents); the transmission and application of knowledge (3 indicators); and
innovation finance, outputs and markets (6 indicators).68
Table 2: The European Union Innovation Scorecard (EIS) Name/nos EU Innovation
Scorecard
Grouping Indicators 1 Human Resources
1.1 New Science &Engineering graduates
(% of 20-29years age class)
1.2 Population with tertiary education
(% of 25-64 years age classes)
1.3 Participation in life-long learning
(% of 25-64 years olds)
1.4
Employment in medium-high and high-tech manufacturing (% of total workforce)
Creation
2.1 Public R&D expenditures (% GDP)
2.2 Business expenditure on R&D (% GDP)
2.3 EPO high-tech patent applications
(per million population)
2.4 EPO patent applications
(per million population)
2.5 USPTO high-tech patent applications
per million population
3 Transmission
and application
of Knowledge
3.1 SMEs innovating in-house
(% of manufacturing SMEs)
3.2 Manufacturing SMEs involved
in innovation co-operation
3.3 Innovation expenditures
(% of all turnover in manufacturing)
4 Innovation finance,
15
output and markets
4.1 High-tech venture capital investment
(‰ of GDP)
4.2 New capital raised on
stock markets (% of GDP)
4.3 "New to market" products
(% of sales by manufacturing firms)
4.4 Home internet access
(% of all households)
4.5 Home internet access
(% of population)
4.6 ICT expenditures (%of GDP)
4.7 Percent of manufacturing
value-added from high technology
4.8 Stock of inward FDI (% of GDP)
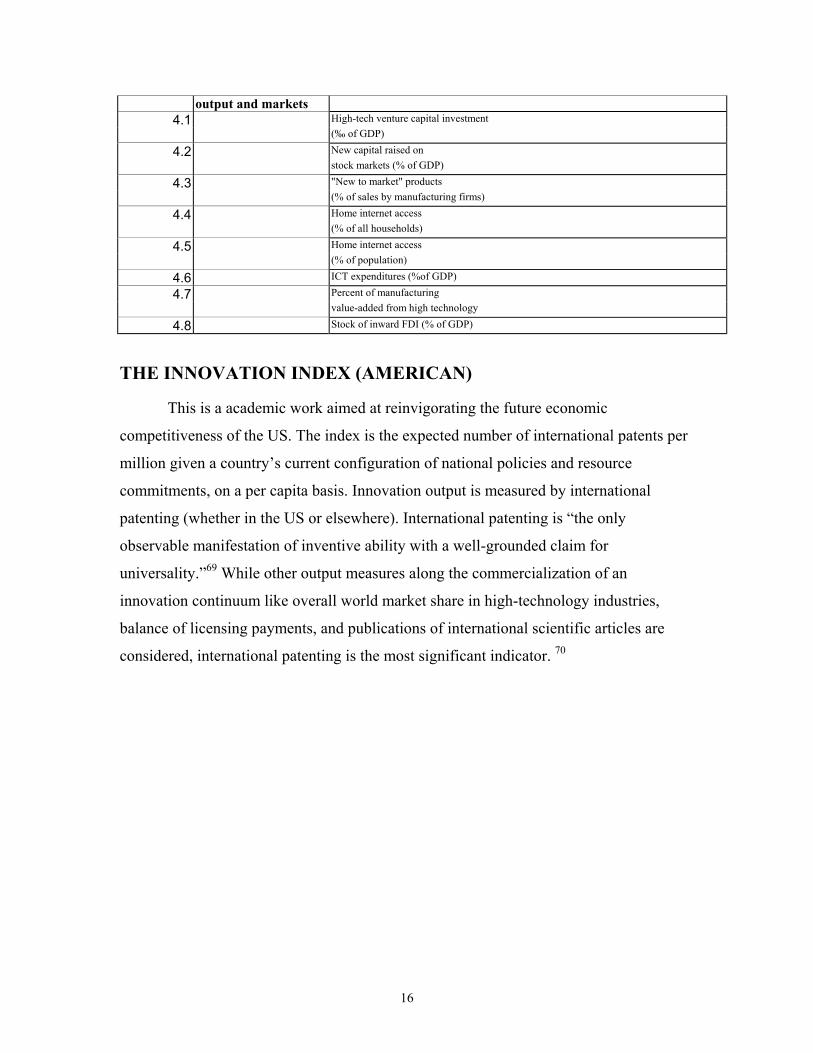
THE INNOVATION INDEX (AMERICAN)
This is a academic work aimed at reinvigorating the future economic
competitiveness of the US. The index is the expected number of international patents per
million given a country’s current configuration of national policies and resource
commitments, on a per capita basis. Innovation output is measured by international
patenting (whether in the US or elsewhere). International patenting is “the only
observable manifestation of inventive ability with a well-grounded claim for
universality.”69 While other output measures along the commercialization of an
innovation continuum like overall world market share in high-technology industries,
balance of licensing payments, and publications of international scientific articles are
considered, international patenting is the most significant indicator. 70
16

Table 3: Innovation Index (US) Indicator Group Indicators Common Innovation Infrastructure 1. Total R & D personnel 2. Total R & D investment 3. Openness to international trade and investment 4. Strength of intellectual property protection 5. Spending on higher education (% of GDP) 6. A nation’s per capita GDP Cluster-specific Innovation Environment 1. The % of R &D privately funded Quality of Linkages 1. The % of R &D funded by universities
Straits Knowledge, Innovation in Singapore Organizations, February 2002.
The Straits Knowledge is a local consultancy firm. It conducted a survey-based
inquiry into what local management thinks about innovation. Under “Benefits of
Innovation”, government linked sectors (defined as educational, government, and the
government linked corporations) ranked the following as the most important benefits of
innovation. The survey results shows that innovation is perceived as having strategic
rather than tactical value and that costs savings from innovation is viewed as less
important than competitive advantage.71
Table 4: Opinion Poll on Innovation in Singaporean Organizations. Why Innovate? 1 It preparation for the future. 2 It keeps us competitive 3 It makes our work more exciting and
interesting
4 It gives us market leadership. 5 It saves us money and makes us more
efficient
6 It attracts top talent into our organization
7 It brings new revenue streams.
17
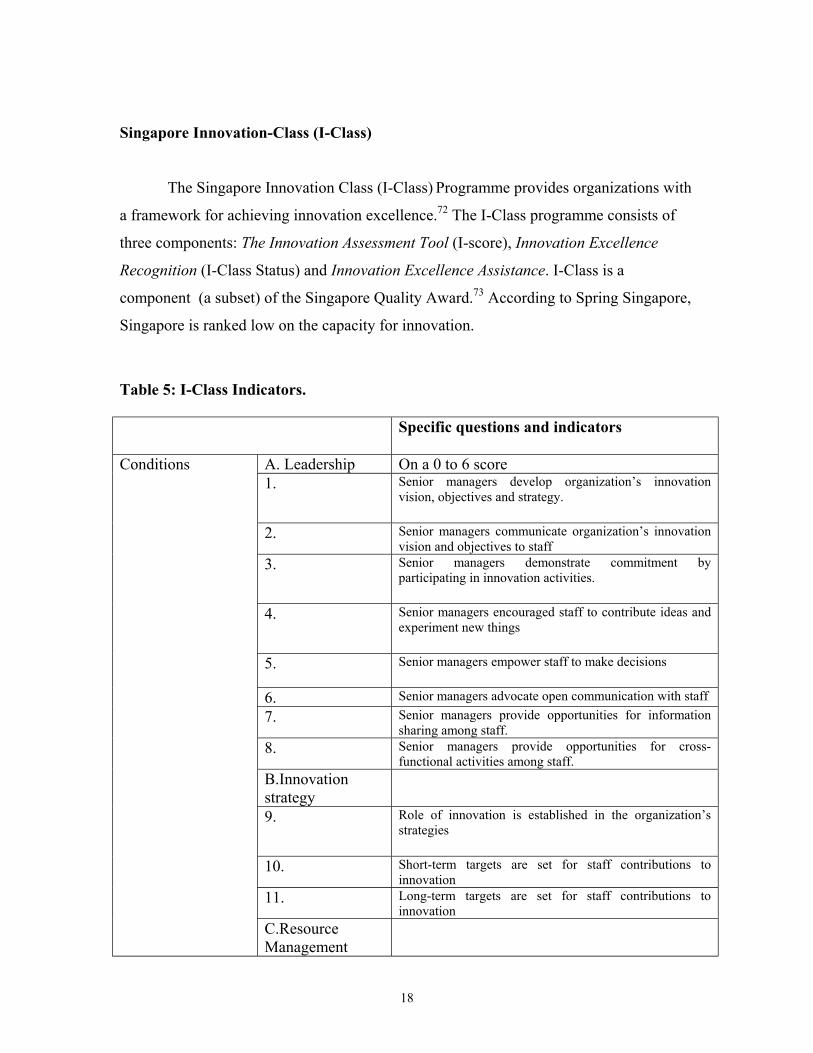
Singapore Innovation-Class (I-Class)
The Singapore Innovation Class (I-Class) Programme provides organizations with
a framework for achieving innovation excellence.72 The I-Class programme consists of
three components: The Innovation Assessment Tool (I-score), Innovation Excellence
Recognition (I-Class Status) and Innovation Excellence Assistance. I-Class is a
component (a subset) of the Singapore Quality Award.73 According to Spring Singapore,
Singapore is ranked low on the capacity for innovation.
Table 5: I-Class Indicators.
Specific questions and indicators
A. Leadership On a 0 to 6 score 1. Senior managers develop organization’s innovation
vision, objectives and strategy.
2. Senior managers communicate organization’s innovation vision and objectives to staff
3. Senior managers demonstrate commitment by participating in innovation activities.
4. Senior managers encouraged staff to contribute ideas and experiment new things
5. Senior managers empower staff to make decisions
6. Senior managers advocate open communication with staff 7. Senior managers provide opportunities for information
sharing among staff. 8. Senior managers provide opportunities for cross-
functional activities among staff. B.Innovation strategy
9. Role of innovation is established in the organization’s strategies
10. Short-term targets are set for staff contributions to innovation
11. Long-term targets are set for staff contributions to innovation
Conditions
C.Resource Management
18

12. Champions are appointed to drive innovation activities. 13. Conducive physical environment is provided for
innovation activities. 14. Time is allocated for innovation activities. 15. Financial resources are allocated for innovation activities. 16. Information is captured to support innovation activities. 17. Knowledge is retained to support innovation activities. A. Organizational Values
18. Values are developed to foster innovation 19. Organisation translates innovation values into practices
that support innovation 20. Organisation reviews practices to improve innovation
cultures. B Organizational Behaviors
21. Staff communicates openly 22. Staff are receptive to new ideas. 23. Staff challenge accepted conventions 24. Staff take risks in the course of work 25. Staff accept failures as improvement opportunities 26. Staff seek to learn continuously 27. Staff contribute ideas 28. Staff follow through on ideas
2. Culture
29. Staff participates in cross-functional activities. A.People Development
30. Innovation capabilities of potential recruits are accessed. 31. Innovation development of potential recruits are assessed. 32. Staff are equipped with skills and knowledge for
innovation. 33. Staff are provided opportunities for cross-cultural learning 34 Staff contributions to innovations are assessed and
reviewed 35. Staff are recognized for contributions to innovation B.Innovation Management
36. Staff use different channels to acquire information. 37. Staff translate information to knowledge that creates value
to business. 38. Organisation protects knowledge. 39. Staff assess risks related to innovations 40. Staff incorporate new developments and changing
requirements into innovations 41. Organisation manages ideas generated by staff
3. Competencies
42. Organisation selects ideas generated for innovation
19

43. Organisation validates innovation projects before launch. 44. Organisation implements innovation projects 45. Organisation reviews the management of innovation
projects A. Networks 46. Organisation communicates innovation vision and
objectives to external parties 47. Organisation involves external parties in innovation
activities 48. Organisation seeks feedback from external parties for
identifying innovation opportunities 49 Organisation incorporates feedback from external parties
in innovation activities. B.Innovation Performance
50. Innovation targets are met. 51. There is an improvement trend in the achievement of
innovation targets. 52 There is an improvement trend in in the ideas generated
by staff for innovation 53. There is an improvement trend in the selection rate for
innovation projects 54. There is an improvement trend in the mass customisation
of innovation projects 55. There is an improvement trend in innovations 56. There is an improvement trend in the contribution of
innovation to business performance. 57. There is favourable comparison of innovation
performance with benchmarks.
D. Connectivity
58. Organisation is acknowledged by external parties for achievements in innovation
MINNESOTA MINING AND MANUFACTURER (3M) Company’s Innovation targets
Minnesota Mining and Manufacturing (3M) is generally acknowledged as one of
the most innovative companies around with products like Post-it notes. It has a
performance measure that 30% of the sales revenue in any one year is attributable to
products that were not in the catalogue four years before.74 The 15% rule where all
employees are allowed to spend up to 15 % of their time on projects of their own
interests, whether or not those projects directly benefit the company. The 15% rule is not
monitored, employees do not have to account for what they are doing.
20
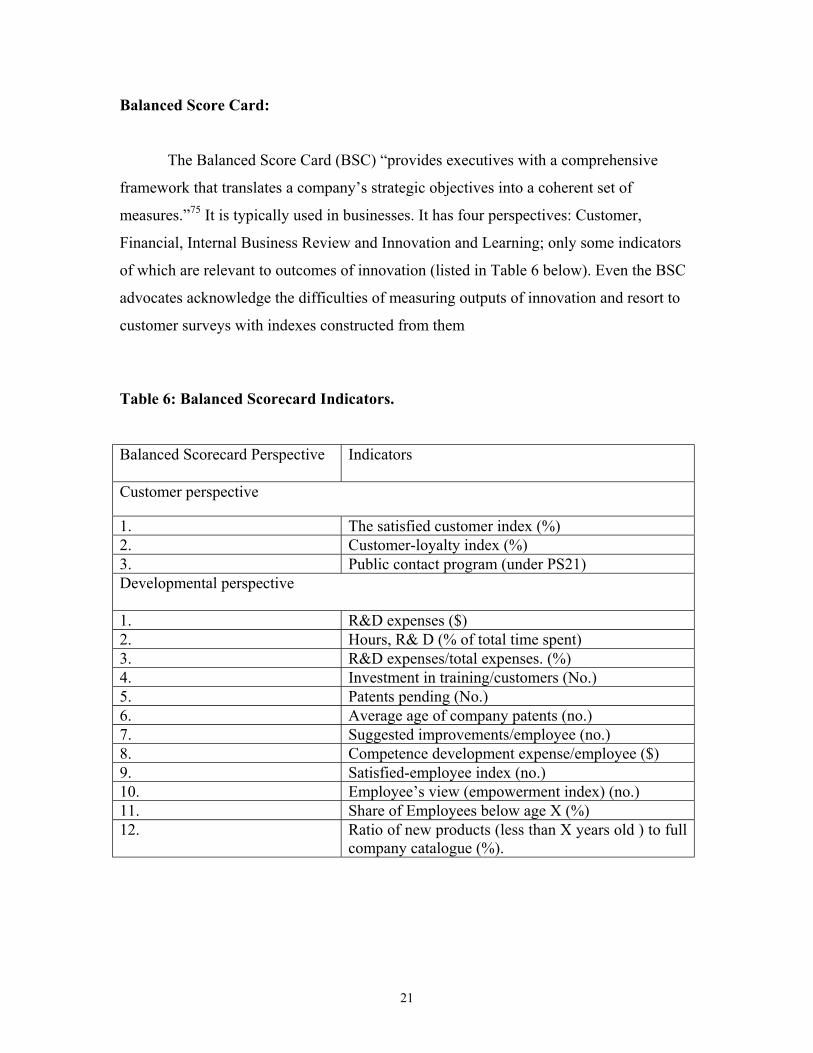
Balanced Score Card:
The Balanced Score Card (BSC) “provides executives with a comprehensive
framework that translates a company’s strategic objectives into a coherent set of
measures.”75 It is typically used in businesses. It has four perspectives: Customer,
Financial, Internal Business Review and Innovation and Learning; only some indicators
of which are relevant to outcomes of innovation (listed in Table 6 below). Even the BSC
advocates acknowledge the difficulties of measuring outputs of innovation and resort to
customer surveys with indexes constructed from them
Table 6: Balanced Scorecard Indicators. Balanced Scorecard Perspective
Indicators
Customer perspective 1. The satisfied customer index (%) 2. Customer-loyalty index (%) 3. Public contact program (under PS21) Developmental perspective 1. R&D expenses ($) 2. Hours, R& D (% of total time spent) 3. R&D expenses/total expenses. (%) 4. Investment in training/customers (No.) 5. Patents pending (No.) 6. Average age of company patents (no.) 7. Suggested improvements/employee (no.) 8. Competence development expense/employee ($) 9. Satisfied-employee index (no.) 10. Employee’s view (empowerment index) (no.) 11. Share of Employees below age X (%) 12. Ratio of new products (less than X years old ) to full
company catalogue (%).
21
Net Economic Value (NEV):
We are very much caught up with this idea that the budget the government provides is very much to cover your cost, as though the purpose of the whole exercise is you have a job and you cost something to the government, you consume materials and that costs something to the government, and it is the job of MOF to give you the money to cover the cost so that you have your job and to buy stuff to keep you going.76
The preceding survey of indicators of innovation outcomes highlights three
issues. Firstly, there is no real consensus on measuring innovation, let alone innovation
outcome. For example the commonly understood indicator of innovation outcomes,
patents is not clear-cut. On the one hand, patents are concrete expressions of the
innovator conviction that their idea is original, innovative and have enough market
potential to justify the often costly patenting process.77 On the other hand, patents are
bad indicators of service innovation which are often intangible and hampered (from a
research viewpoint) by a lack of data availability. Whereas the manufacturing sector
mainly uses patenting, service sectors rely on copyrights and trademarks in intellectual
property protection regimes.
Secondly, the indicators still exhibit bias towards manufacturing rather than
services, a trend that at least in academia is under going change.78 According to Howells:
At best, service companies, and the service sector as a whole, are seen as facilitators to the ‘proper’ innovators –manufacturing – or occasionally as good imitators through taking ideas from manufacturing sector and applying theme within the service sector. … They have been primarily been perceived as representing consumers, albeit often significant consumers, of innovations produced by manufacturing firms. 79
The reasons for this bias are due to i) the nature of service innovation where “much
innovative expenditure and activity is centered in non-R&D areas” and ii) a simple lack
of data, especially governmental data on the service sector which in turn hampers
research on services.80 Both the lack of consensus and the bias towards manufacturing
innovation is bad because service sectors (of which large part of the public service is
classified under) are recognized as the largest section of the national economies.81
Thirdly, given such disparate indicators, the attempt to find a innovation metrics
based on the “least common factors” approach (that is, to group indicators together and
22
seek commonalties amongst them) is ultimately, an arbitrary and unsatisfactory
exercise.82
Why use the Net Economic Value metric?
The preceding discussion of the difficulties of adapting the existing
towards the Singaporean Public Service points to the need for a framework, that takes
into account the disparate, diverse and non-profit nature of public service organizations.
In the private sector, the need to generate a single metric indicator of success as the
ultimate reference point of performance for managers led to the conception of the
Economic Value Added (EVA).83 EVA measures profit after the expected return to
shareholders. It takes into account the concept of the opportunity costs of capital and
capital to measure economic profitability. Thereby it serves as the point of reference for
managers measuring performance.
Whereas the EVA concept implies that the normal value is positive (unless the
business is making losses), the situation for the public sector organizations is usually the
reverse. The two sources of revenue for the public sector organizations are the revenue
provided by the government and the fees it charges the public for its good and services.
However, public sector organizations should not seek to make the bulk of their revenue
from the public and have duties to the public which they have to discharge. It also means
the ‘bottomline’ for the public sector is usually negative. There is a need for a new metric
that takes into account those facts.
NEV, which is basically revenue less operating cost less capital costs, is the
public sector counter part to the EVA.84 Championed by Singapore’s Ministry of Finance,
it is a way for the various ministries and Statutory Boards (SB) to measure the financial
resources that they are going to make use of. Although the net NEV of the public sector
organizations is usually negative, it is delta NEV, or the change in NEV from year to year
that is important as it identifies whether the organization measured in making progress in
the use of it resources. The aim is to keep delta NEV positive and improve it. The way to
improve it is not to rise prices and exploit the monopolistic positions of the public sector
but through better resources management.
23
The consequences of innovation would be the change in delta NEV after the
innovation program is introduced. This way of calculating the outcomes of innovation
may be paradoxically too simple for some and uncomfortably too accurate for others. For
in using the delta NEV, it is possible, even plausible if Everett’s work is definitive, that
an innovation policy or program hurts the NEV of the organisation. The fact that delta
NEV is a numerical indicator would also allows one to evaluate the worth of competing
innovation projects. Public service organizations could decide for themselves how much
contribution the delta NEV that a potentially innovative policy/program has to achieve
before it can be considered an ‘innovative’ project (in the Schumpeterian sense of the
concept). Therefore, the concept of NEV also helps, as Lim Siong Guan made clear, in
asking difficult political questions about the efficiency of the public sector:
Under a ministry, there are various SBs [Statutory Boards] and under SBs, there are various companies. The question is how do the companies contribute to the NEV of the SB and how do the SBs contribute to the NEV of the ministry ? … [Some] think our SBs are independent and therefore, the attribution factor should be zero. Some SBs think so, some don’t. In fact, some SBs think that the attribution factor should be negative because with no ministry HQ, they will become even better. Therefore, the ministry HQ is just an impediment in the system. But (sic) surely it would be irresponsible of a ministry HQ to be creating negative NEV for its SBs!… those of us working in the ministry HQ have to ask ourselves: How are we contributing towards the work of our SB (sic), are we actually a burden or a help to them ? If we are a burden to them, why do we need to exist? I mean [the] SBs are right, we shouldn’t be there. Just like the SBs that own companies below them, the question now for all of us is how are you helping your company to succeed?85
This goes beyond questions of efficiency. It is plausible that a public service
organization that is consistently in negative NEV and delta NEV, can be justified on the
public good it provides to the public. 86 In recognizing this, Singapore’s Ministry of
Finance is emphasizing is that the NEV is only part of the calculation of the worth of a
public sector organization. There is a need to elaborate on this conception of ‘worth’. Public Value and Service Encapsulation: A Framework for Innovation?87
Public value is “the value created by government through services, laws (sic)
regulation and other actions.”88 For democracies, this value is ultimately, decided by the
public themselves. For the public, this value must not merely be desirable but desirable
24
enough for them collectively or individually to give up something else in return for it.
This is because each attempt to fulfill a public need involves opportunity cost- resources
committed for one need is denied for another. Since the things that citizens value tends to
fall into three categories- outcomes, services, trust/legitimacy; together they constitutes a
formulation89 of public value.90
Public Value = Services + Outcomes + Trust/Legitimacy
To the extend that management techniques are applicable to both the public and
private sectors, public sector management discourse tends to follow management
techniques developed in the private sector. While this had positive influence of
encouraging the strict use of performance data; it also focused on improving issue-areas
that are easily measured (these became objectives) and avoiding areas that are intangible
and not easily measured. The result for the public service had been an increase in
technical efficiency which is not necessarily synonymous with an increase in public
value.
Recent private sector management discourse shows awareness of these trends. In
part due to globalization of services and of service firms and the increasing proportion of
services produced by manufacturing firms, private sector organizations are increasingly
trying “to offer the consumer, not the manufactured product itself, but rather what the
purchase of the manufactured product would be seeking to ultimately fulfil (sic).”91
Diagram 7 illustrates service encapsulation, which is the process of providing both the
product and services with the aim of satisfying but the less immediate but central concern
of the consumer.
25

Diagram 7: Service Encapsulation92
Maintenance and Repair
Monitoring and
diagnostic services
Physical Product
Re-purchase and/or
disposal
Retrofitting and
updating
Purchase and operation
of related support
activities, such
troubleshooting …
Purchase, finance
and leasing facilities.
To use an example of the car, consumption is no longer a one-off purchase but includes
the process of buying, using and maintaining the car, to meet the ultimate consumer’s
need of motor transport. More commercial examples are shown in Table 7 below.
26
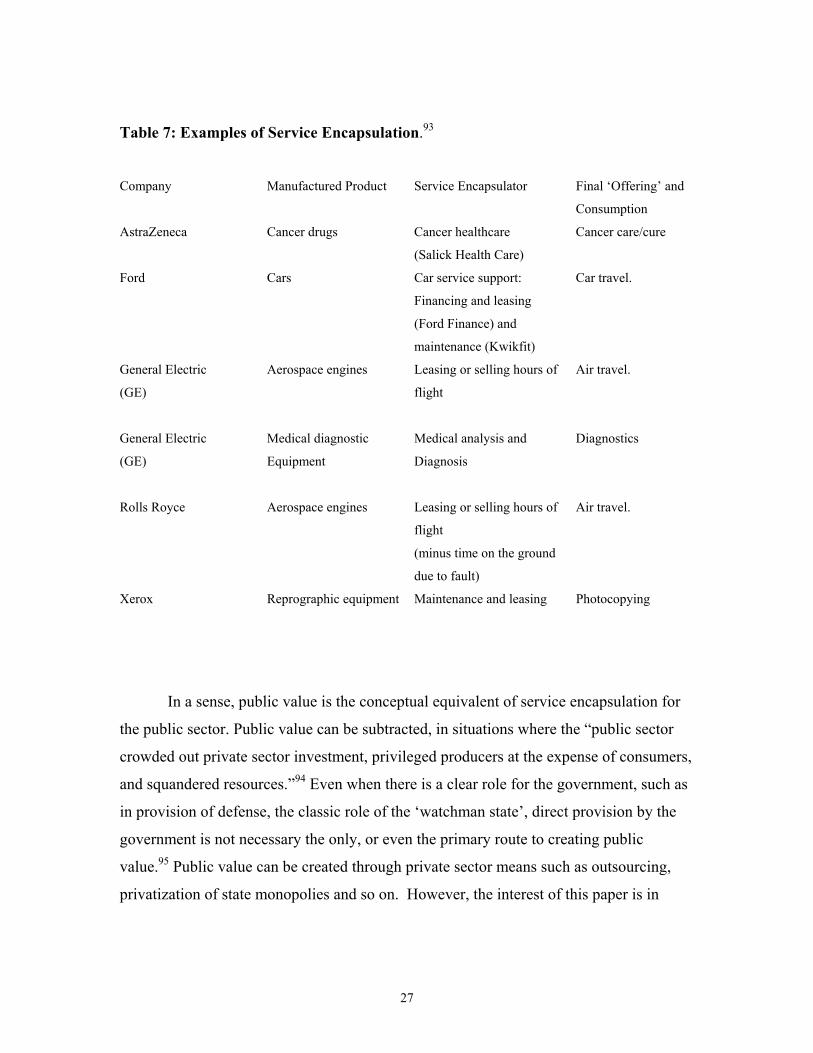
Table 7: Examples of Service Encapsulation.93
Company Manufactured Product Service Encapsulator Final ‘Offering’ and
Consumption
AstraZeneca
Cancer drugs Cancer healthcare
(Salick Health Care)
Cancer care/cure
Ford
Cars Car service support:
Financing and leasing
(Ford Finance) and
maintenance (Kwikfit)
Car travel.
General Electric
(GE)
Aerospace engines Leasing or selling hours of
flight
Air travel.
General Electric
(GE)
Medical diagnostic
Equipment
Medical analysis and
Diagnosis
Diagnostics
Rolls Royce
Aerospace engines Leasing or selling hours of
flight
(minus time on the ground
due to fault)
Air travel.
Xerox
Reprographic equipment Maintenance and leasing Photocopying
In a sense, public value is the conceptual equivalent of service encapsulation for
the public sector. Public value can be subtracted, in situations where the “public sector
crowded out private sector investment, privileged producers at the expense of consumers,
and squandered resources.”94 Even when there is a clear role for the government, such as
in provision of defense, the classic role of the ‘watchman state’, direct provision by the
government is not necessary the only, or even the primary route to creating public
value.95 Public value can be created through private sector means such as outsourcing,
privatization of state monopolies and so on. However, the interest of this paper is in
27
public value added, which is the difference between these benefits and the resources and
powers which citizens decide to give to their government.
Each of the three sources of public value deserves elaboration. To the extent that
private citizens drive benefits from the personal use of public services, user satisfaction is
the most critical indicator of the public value for the services component. User
satisfaction is in turn affected by the following variables:96
1) the quality of the customer service- this is affected by timeliness, knowledge and
courtesy of the staff, comfort of the user, fairness, outcome of the encounter and
involves correctly identifying the customers; 97
2) information available to the user – the well-informed user makes precise feedback
on satisfaction;
3) Choice – the availability of alternatives to the public provider of the service seems
to improve satisfaction;
4) Use of services – the personal use of the service as opposed to hearing about it
significantly affects their specific satisfaction with that service.
The public has always seen outcomes as key part of the social contract between
the people and its government.98 Typically a government will inter alia, promise
economic growth, employment, physical security, and promote the welfare of the citizens
in return for being elected back to power. Measuring these with objective indicators
invariably involves “complicated (and contested) assessment of causation”.99 To
complicate things, government policies are necessary but not sufficient conditions for the
social outcomes (for example better personal hygiene, full employment).100 This is
because outcomes involve changes in social behavior which are in turn mediated through
norms, culture and identity. The effect of the latter (norms, culture and identity) upon
social behavior and therefore upon social outcomes is still poorly understood area of
research.101
Whereas the preceding two components of public value can be measured through
a combination of social indicators (for example, user satisfaction) and the NEV, trust and
legitimacy is more intangible.102 It is also unavoidable in any discussion of public value.
“Trust is at the heart of the relationship between citizens and government.”103 Similarly,
28

the concept of the public service derives its legitimacy ultimately by its ability to serve
the public interest.104 In stark contrast to the private sector, where each individual
consumer acts basically on the basis of his own needs and wants, the general public
appears to care about how the same good and services are delivered to other people (that
is the poor, the under-privileged and the “have-nots”) as well as the services they
themselves benefit from. Research done in the United Kingdom on the state of its public
service found that:
1) 79% of the people tend to agree with the statement that public service should be
targeted at those with the greatest need; and
2) 66% of the people characterized their relationship with the public services as
being that of citizens of members of the public while 30% of those surveyed
viewed themselves as customers; and
3) 97 % of the people believed that the public service should be for everyone.105
In other words, there are grounds106 for believing that a public sector organization that
strives to be fair creates public value because the public values fairness.
Trust as a research variable is even more difficult to measure than outcomes and
services. There appears to be three schools of thought on it:107
1) Trust in government is shaped by general levels of social trust and propensity to
trust institutions in general.
2) Trust in government is shaped by the effectiveness with which it manages the
economy and delivers services.
3) Trust in government is shaped by the way politicians and political institutions
behave.
Just as user satisfaction is the best proxy indicators for services and outcomes, trust is
measured by proxy indicator the public opinion surveys. Within the Singaporean context,
one of the few rigorously conducted public opinion surveys (total sample size of 12, 552)
conducted by Market Behaviour (Singapore) Pte Ltd., at the behest of the Prime
Minister’s Office (Public Service Division) found that:108
29
1) on a scale of 1= very poor to 7 =excellent, the public service was rated a mean
score of 5.09 by the individuals, that is, the general public perception and a mean
score of 4.95 by the businesses.
2) The general ratings of the public service agencies were lower than the private
sector benchmarks.
From this survey, it appears that the Singapore public service is generally well regarded
(implying a level of trust).
Both concepts, public value and service encapsulation highlight the shift in
thinking from technical efficiency that focuses on processes (‘how to increase
productivity?’) towards allocative efficiency that focuses on outputs (‘how do we know
what we have produced meet the public needs?’). Armed with these two concepts, we can
now make a programmatic claim about the role of innovation (that is, to ask what is the
outcome of innovation for?). Why should public sector organization seek innovation?
They seek innovation because the outcomes of innovation, assuming allocative efficiency
is taken into account, helps them increase public value. Two generic decision-making
trees for most public sector innovation policies can result.
30
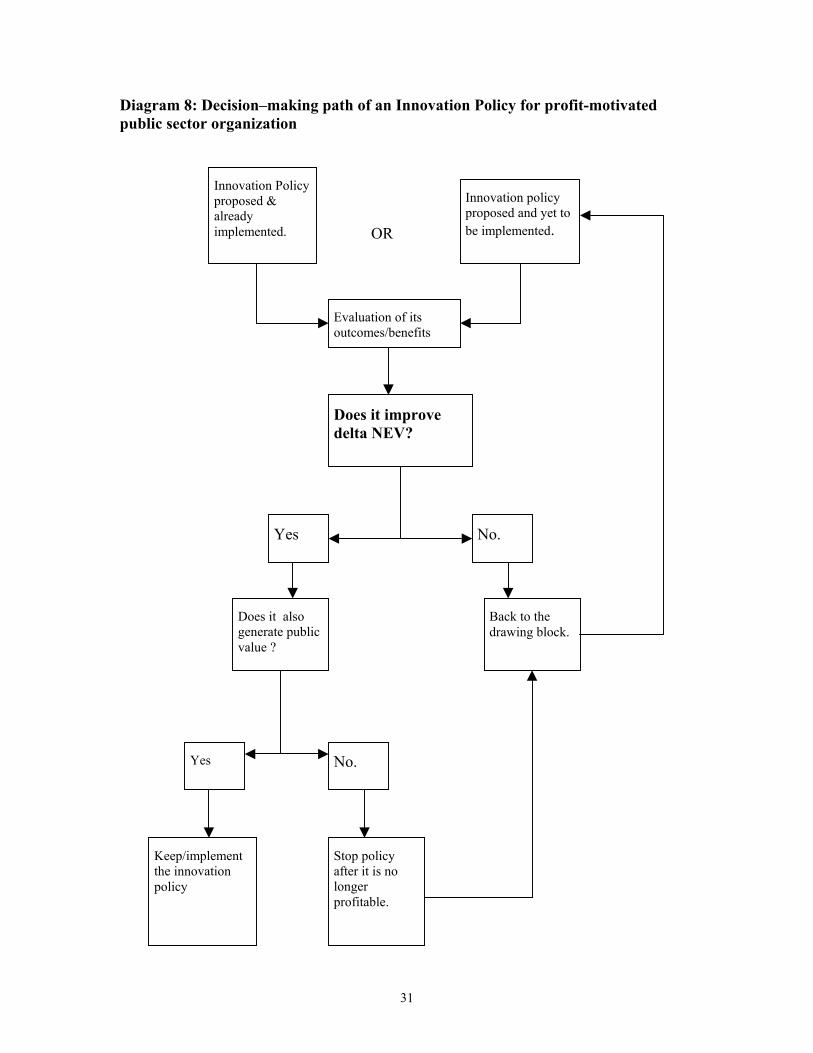
Diagram 8: Decision–making path of an Innovation Policy for profit-motivated public sector organization
OR
Innovation Policy proposed & already implemented.
Evaluation of its outcomes/benefits
Does it improve delta NEV?
Innovation policy proposed and yet to be implemented.
Keep/implement the innovation policy
Stop policy after it is no longer profitable.
Back to the drawing block.
Does it also generate public value ?
Yes No.
No. Yes
31
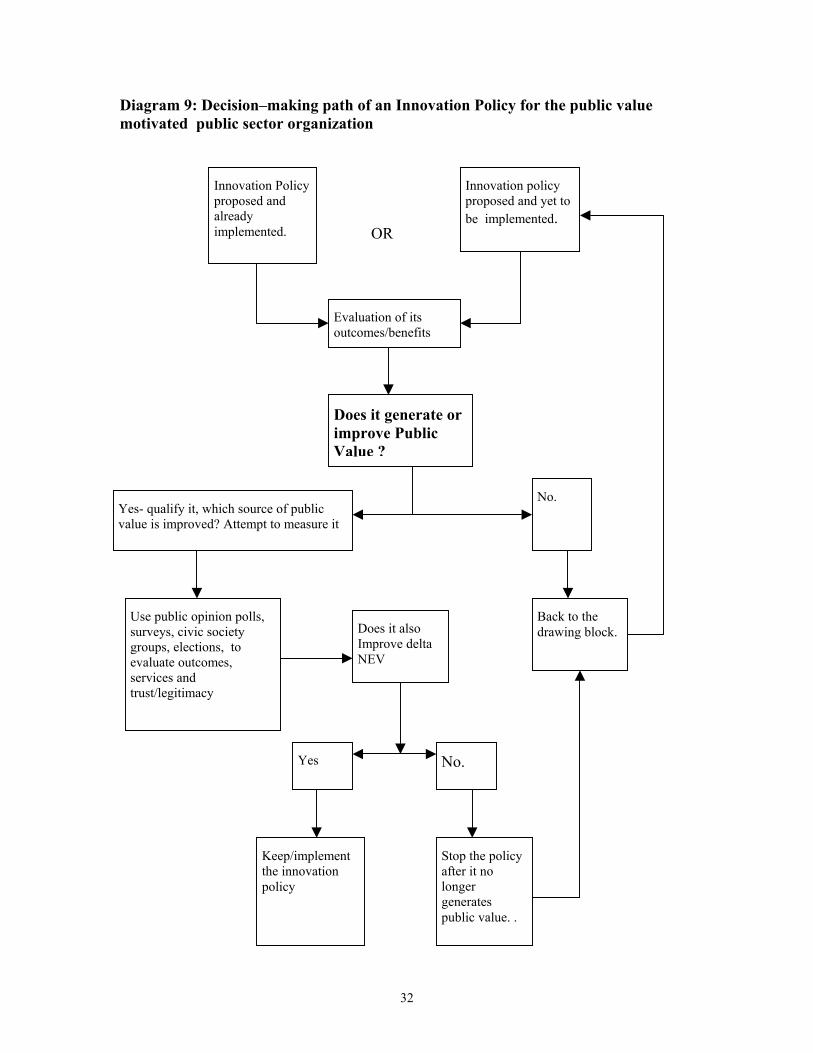
Diagram 9: Decision–making path of an Innovation Policy for the public value motivated public sector organization
OR
Use public opinion polls, surveys, civic society groups, elections, to evaluate outcomes, services and trust/legitimacy
No. Yes
Stop the policy after it no longer generates public value. .
Keep/implement the innovation policy
Yes- qualify it, which source of public value is improved? Attempt to measure it
No.
Does it also Improve delta NEV
Back to the drawing block.
Innovation policy proposed and yet to be implemented.
Does it generate or improve Public Value ?
Evaluation of its outcomes/benefits
Innovation Policy proposed and already implemented.
32
There are two decision-trees because profitability is an acute driver of public
policy – be it in the form of Singapore’s “economy drive” or United Kingdom’s
privatization policy (when Margaret Thatcher was prime minister). It is entirely possible
that a public service organization will pay lip service to public value while in effect be
totally driven by the profit-motive. The decision-making trees do not mitigate the need
for management to make judgment calls, especially at times when the metrics themselves
are unclear. Each public sector organization would have to decide which decision-tree
characterizes them more.
Thus far, the discussion has emphasized the need to both i) measure the tangible
financial aspects of innovation more accurately (via NEV) and ii) addresses the difficult
questions about the role of public sector organizations because it is only armed with those
values (which is ultimately is up to the citizenry to decide) that we can judge the
consequences of innovation (see table 8 below). Table 8: Private and Public sector answers as to why we seek innovation. Why Innovate ? Private Sector Public Sector
Financial (tangible) EVA
NEV
Values (intangible) Service Encapsulation
Public Value
This necessarily implies the lack of a single, easily understood metric for the
consequences of innovation. In fact, given the multifaceted nature of public value, any
single measure of success is likely to oversimplify. The private sector had for some time
dealt with this need to measure numerous activities of their companies by the Balanced
Scorecard (BSC). Although the take-up rate for the BSC amongst the public sector has
been reticent, this needs to change.109
33
Future Research:
Since the paper argues for a “Balanced Scorecard” approach towards measuring
the consequences of innovation, more research needs to be done into what would
constitute a proper perspective of such a scorecard. The existing perspectives used in the
BSC - customer, financial, internal business review and innovation and learning as they
stand are inappropriate for public sector use. To take an example, a public service
scorecard that measures the consequences of innovation and yet has as one of its
perspectives “innovation and learning” would be tautological.110
The need to find out what the citizenry actually wants involves another issue -
how to go about doing it. Although routine democratic processes (elections and
referendums) can be blunt instruments with which to understand the needs and values of
citizens. The solution is not simply more surveys and opinions polls. Survey fatigue and
political apathy emerges when citizen participation does not translate into changes in
public policies.111 People will naturally be cynical if the regime seeks feedback only to
reject citizens’ viewpoints with a ‘government knows best’ response. It is a fine line
between genuinely seeking citizen’s inputs and recognizing rent-seeking behaviour (for
example wanting the government to provide goods/services at the lowest cost to the
consumer). Trust is at the heart of the issue here. One possible approach would be to
develop ways to actively engage the citizenry in budgetary decisions (participatory
budgeting) at the city level. 112 As the Brazilian city of Porto Alegre has shown, involving
100,000 people or 8 % of the total population in participatory budgeting is not impossible
if the political will is present.113
Bann Seng Tan is currently a graduate student at the City University New York. His research interests are in democratic peace and liberal political philosophy. The research for the paper was done during a stint in the Public Service Center for Organizational Excellence, Civil Service College, Singapore. The views expressed in the paper are the author’s own and do not represent those of the College.
34
References Articles, Books, Conference Papers: Ahmed, Pervaiz K, 1998. “Culture and Climate for Innovation”, European Journal of Innovation Management Vol.1 No. 1. Amabile, Teresa M., 1996. “Creativity and Innovation in Organizations”, Harvard Business School, January 5th. ________________., 1998. "How to Kill Creativity." Harvard Business Review 76 (5): 76-87. Bhatta, Gambhir, 2003. “ ‘Don’t just do something, stand there !’: Revisiting the Issue of Risks in Innovation in the Public Sector”, The Innovation Journal: A Special Issue on Innovation in Governance. 8,(2). Cainelli, Giulio, Rinaldo Evangelista and Maria Savona, 2004. “The Impact of Innovation on Economic Performance in Services.” The Service Industry Journal 24 (1):forthcoming. Fung, Archon, and Erik Olin Wright, 2001. "Deepening Democracy: Innovations in Empowered Participatory Governance." Politics and Society, 29 (1): 5-42. Ford, Cameron M., and Dennis A. Gioia, (eds) 1995. Creative Action in Organizations: Ivory Tower Visions & Real World Voices, London: Sage Publications. Fukuyama, Francis, 1995. The Social Virtues and the Creation of Prosperity, London: Penguin. The Innovative Management Network, 1999. “An Exchange of Definitions of Innovations from the Innovative Management Network.” Innovation Journal 4 (2). Howells, Jeremy, 2000. “Innovation & Services: New Conceptual Frameworks”, Center for Research on Innovation and Competition, CRIC Discussion Paper 38, University of Manchester. Kaplan, Robert S., and David P. Norton, “Putting the Balanced Scoreboard to Work,” Harvard Business Review, September-October 1993: 134 Kelly, Gavin, and Stephen Muers, 2002. “Creating Public Value: An Analytical Framework for Public Service Reform.” Discussion Paper , Strategy Unit, Cabinet Office, United Kingdom. MacPherson, Malcolm, 2001 “Performance Excellence Principles- Drivers of Innovation in Public Sector Organisations”, Paper presented at the National Conference of the New Zealand Organisation for Quality, Christchurch Convention Centre, 31st May. Miller, Danny and Jon Hartwick, “Spotting Management Fads,” Harvard Business Review October 2002: 2-3. Porter, Michael, and Scott Stern, 1999. The New Challenge to America’s Prosperity: Findings from the Innovation Index, Washington, D.C., Council on Competitiveness. Rogers, Mark, The Definition and Measurement of Innovation, 1998. Melbourne Institute Working Paper No. 10, Melbourne Institute of Applied Economic and Social Research. Rogers, Everett M.,1995. Diffusion of Innovation, Fourth edition, Singapore: The Free Press.
35

Straits Knowledge, 2002. Innovation in Singapore Organizations. Singapore : Straits Knowledge. Sherwood, Dennis, 2002. Creating an Innovative Culture, UK: Capstone Publishing. Stewart, Stern, 1999 “ABC, The Balanced Scorecard and EVA”, EVAluation, Vol. 1(2). Woolthuis,Rosalinde Klein, Bas Hillebrand and Bart Nooteboom, 2002. “ Trust and Formal Control in International Relationships”, Erasmus Research Institute of Management (ERIM), ERIM Report Series: Research in Management. Websites: Bordoy, Catalina, MERIT, “Innovation and Economic Outcomes” available at http://trendchart.cordis.lu/Reports/Documents/Bordoy.ppt . Enterprise Innovation Centre, SPRING Singapore, Available at homepage: http://www.enterpriseone.org.sg/I-Class . Graham, Mary, “Information as Risk Regulation: Lessons from Experience,” Institute for Government Innovation, John F. Kennedy School of Government, Harvard University, available at http://www.innovations.harvard.edu/research/papers/m_graham.pdf Innovation System Research Network (ISRN), website at http://www.utoronto.ca/isrn/working_papers.htm Nickols, Fred, 2000. Change Management 101: A Primer, available at http://home.att.net/~nickols/change.htm US National Science Foundation, Partnerships: Building a New Foundation for Innovation, conference held June 18-19, 2001, in Arlington, Virginia, conference report of which at this site: http://www.rand.org/publications/DRU/DRU2651/ Sveiby, Karl-Erik, “What is Knowledge Management? ”, April 2001 available at http://www.sveiby.com/articles/KnowledgeManagement.html . Official Publications: AO Project Team and PSD I-Team, Strategy and System for an Innovative Public Service, 7 Jul 2001. The European Union, The European Innovation Scorecard (EIS), available at http://trendchart.cordis.lu/Scoreboard2002/index.html . ________________., The Regional Innovation Scoreboard (RIS), available from the website http://trendchart.cordis.lu/Scoreboard2002/html/eu_regions/eu_regions.html. OECD., The Oslo Manual: Proposed Guidelines for Collecting and Interpreting Technological Innovation Data. Paris, OECD, 1997. Lim Siong Guan, Permanent Secretary for the Ministry of Finance (Singapore), Sabbatical Report, 17th June 2000.
36

_____________, Permanent Secretary of the Ministry of Finance, Opening Speech of the 11th MFE Forum: NEV Seminar, 2nd July 2002, Transcript available at http://www.intranet.gov.sg/mof/nev/doc/PS%20speech%20-%20final.pdf The Net Economic Value (NEV) Unit, Managing for Excellence Directorate, Ministry of Finance, at the site : http://www.intranet.gov.sg/mof/nev/ Market Behaviour (Singapore) Pte Ltd, “Report on External Customer Perception Survey on Public Service in Singapore.” Singapore: 2000.
37
38
1 Pervaiz K Ahmed, “Culture and Climate for Innovation”, European Journal of Innovation Management Vol.1 No. 1 1998: 30. 2 Danny Miller and Jon Hartwick, “Spotting Management Fads,” Harvard Business Review October 2002, 2-3. 3 Throughout this paper, the terms consequences and outcomes are used interchangeably. 4 That said, it must be noted that there are situations where there just isn’t enough public unclassified data about the Singaporean public service and in such cases, I rely on published, public unclassified works. 5 OECD. The Oslo Manual: Proposed Guidelines for Collecting and Interpreting Technological Innovation Data. Paris, OECD, 1997: 28; cited in Mark Rogers, The Definition and Measurement of Innovation, Melbourne Institute Working Paper No. 10, 1998, Melbourne Institute of Applied Economic and Social Research, p. 6. Home page at http://www.ecom.unimelb.edu.au/iaesrwww/home.html. 6 Joseph A. Schumpeter, “Economic Theory and Entrepreneurial History,” pp. 63-84, in A.H. Cole (ed.), Change and the Entrepreneur: Postulates and Patterns for Entrepreneurial History, Cambridge, MA: Harvard University Press, 1949. 7 The Innovative Management Network, 1999. “An Exchange of Definitions of Innovations from the Innovative Management Network.”, The Innovation Journal 4(2). Available at http://www.innovation.cc/discussion_papers/definition.htm 8 Teresa M. Amabile, “Creativity and Innovation in Organizations”, Harvard Business School, January 5th, 1996, p.1. 9 Mark Rogers, The Definition and Measurement of Innovation, Melbourne Institute Working Paper No. 10, 1998, Melbourne Institute of Applied Economic and Social Research, p. 5. Home page at http://www.ecom.unimelb.edu.au/iaesrwww/home.html. 10 See for example the OECD definitions of technological product innovation and technological process innovation in OECD., op. cit., p. 7. 11 For an overview, see Fred Nickols, Change Management 101: A Primer, 2000, available at http://home.att.net/~nickols/change.htm . 12 J.D. Eveland, et al., The Innovative Process in Public Organizations, Ann Arbor, University of Michigan, Department of Journalism, Mimeo report, 1977; cited in Everett M. Rogers, Diffusion of Innovation, Fourth edition, Singapore: The Free Press, 1995: 17. 13 On diffusion studies, see Everett M. Rogers, Diffusion of Innovation, Fourth edition, Singapore: The Free Press, 1995. 14 See Karl-Erik Sveiby, “What is Knowledge Management? ”, April 2001 available at http://www.sveiby.com/articles/KnowledgeManagement.html . 15 For brevity, many other distinctions are excluded. For example, the distinction between mimicry and imitation in learning innovation. Imitation refers to the copying institutional practices of ‘innovative organizations’ without understanding or implementing the pre-requisites of innovation; whereas mimicry refers to adoption of the same policies that potentially leads institutional isomorphism. 16 PS21 is the Singapore Public Service movement that attempts to achieve the Singapore 21 vision. Under it a combined team comprising of the AO Project Team and PSD I-Team completed a report termed , Strategy and System for an Innovative Public Service, 7 Jul 2001, which became Singapore’s Public Service official position on innovation. 17 This usually involves taking up the consultant’s ‘special’ innovation program. 18 To be precise, Rogers counted the literature on the diffusion of innovation rather than innovation per se. E.M. Rogers, op. cit., p. XV. 19 For brevity, only a sample of the literature at each level of analysis will be included: For research on personal innovation see Teresa Amabile’s works on creativity (a concept that is usually at the individual level as evidenced by her distinctions between intrinsic and extrinsic motivations to creativity) Amabile, T. M. "How to Kill Creativity." Harvard Business Review 76, no. 5 (September-October 1998): 76-87. For research on regional innovation (which tends to be government funded projects), see the European Union, European Innovation Scorecard (EIS) report on the Regional Innovation Scoreboard (RIS), available from the website http://trendchart.cordis.lu/Scoreboard2002/html/eu_regions/eu_regions.html. For research on national innovation , see the EIS website at http://trendchart.cordis.lu/Scoreboard2002/index.html, also interesting is the report on the American economy’s innovation., Michael Porter and Scott Stern, The New
39
Challenge to America’s Prosperity: Findings from the Innovation Index, Washington, D.C., Council on Competitiveness, 1999. 20 Giulio Cainelli, Rinaldo Evangelista and Maria Savona, “The Impact of Innovation on Economic Performance in Services.” The Service Industry Journal January 2004, Vol 24, Number 1(forthcoming). 21 I acknowledge an intellectual debt to Gambhir Bhatta, “ ‘Don’t just do something, stand there !’: Revisiting the Issue of Risks in Innovation in the Public Sector”, The Innovation Journal: A Special Issue on Innovation in Governance. Volume 8, Issue 2 (April-May 2003) available at http://www.innovation.cc/peer_reviewed/BhattaRisks.pdf . 22 T.M. Amabile, “Discovering the Unknowable, Managing the Unmanageable,” in Cameron M. Ford & Dennis A. Gioia, (eds) Creative Action in Organizations: Ivory Tower Visions & Real World Voices, (London: Sage Publications, 1995): 77-78. 23 For a simple view, see Barry M. Staw, “Why No One Really wants Creativity,” in in Cameron M. Ford & Dennis A. Gioia, (eds) Creative Action in Organizations: Ivory Tower Visions & Real World Voices, (London: Sage Publications, 1995): 161-166. 24 Max Weber, Wirtschaft und Gesellschaft, part III, chap. 6, pp. 650-78. 25 This category includes both government (the executive level) and the public. 26 It is possible for populations to live beyond their means by passing the costs of deficit spending onto future generations. See also Malcolm Macpherson, “Performance Excellence Principles- Drivers of Innovation in Public Sector Organisations”, Paper presented at the National Conference of the New Zealand Organisation for Quality, Christchurch Convention Centre, Thursday 31 May, 2001. Available at www.baldridgeplus.com . 27 Gavin Kelly and Stephen Muers, “Creating Public Value: An Analytical Framework for Public Service Reform.”, Discussion Paper , Strategy Unit, Cabinet Office, United Kingdom, 2002. Website at www.strategy.gov.uk p. 9. 28 Most people and most organization demand and expect excellence in corporate life. In fact there are management tools such as Six Sigma, seems to operationalize a way of thinking that is fundamentally failure- intolerant. That brings up a fundamental dilemma how to build risk-tolerance in the Singaporean Public sector where the culture, the corporate ethos and management expectation are failure-intolerant ? Dare the public sector organizations accept such success rates at less than One Sigma? 29 Statistics taken from Porter and Stern, op. cit, p. 22. 30 Gambhir Bhatta, “ ‘Don’t just do something, stand there!’: Revisiting the Issue of Risks in Innovation in the Public Sector”, The Innovation Journal: A Special Issue on Innovation in Governance. Volume 8, Issue 2 (April-May 2003), p.2 available at http://www.innovation.cc/peer_reviewed/BhattaRisks.pdf 31 Ibid. 32 Lim Siong Guan, Sabbatical Report dated 17th June 2000. 33 B. M. Staw, op. cit., 162. 34 D. Ellsberg, “Risk, Ambiguity, and Savage Axioms”, Quarterly Journal of Economics Vol. 75, 1961: pp. 643-669. 35 Bhatta, op. cit., p. 2. 36 Bhatta, op. cit., p. 3. 37 To be sure, there always will be the odd person, or even group of people for whom this assumption does not hold. However, as a generalization, the assumption does hold true for enough people to generate theorizing. 38 H. Simon, Administrative Behavior: A Study of Decision Making Processes in Administrative Organizations, (New York: Macmillan, 1947). 39 B.M. Staw, op. cit., p. 163. 40 In the latter case of deciding whether to act based on current information or attempt to gain more information, the ‘correctness’ of the decision can only be known with hindsight. That is why I asserted that such decisions made in imperfect information are done intuitively. 41 R. Mack, Planning on Uncertainty: Decision Making in Business and Government Administration (New York: Wiley-Interscience 1971. 42 Mack, op. cit. pp. 130-131. 43 Strictly speaking, ‘bounded rationality’ is also within human control in the sense that people can be forced to think if they are made accountable for their decisions, an argument that is ultimately anchored in Enlightenment logic that there is nothing outside of human comprehension. However, in practice, this
40
amount of accountability is only manifested in perfect liberal democracies (and possibly its converse, a totalitarian “Big Brother” regime) and democratization lies outside the scope of this essay. I thank Cheng Ailing for her comments. 44 D. Kahneman and A. Tversky, “Prospect Theory: An Analysis of Decision Under Risk”, Econometrica 47(2): 263-291. 45 E.M. Rogers, op. cit., p. 414. Generalization 11-1. 46 Consider the arguments of Vaclav Havel with his infamous green grocer metaphor in Vaclav Havel, the Power of the Powerless, 1978. Is the greengrocer putting up the “Workers Unite!” flag during Labor Day in front of his shop doing it out of his belief in communism or because it is part of the ‘perverse’ social contract- that is the greengrocer is signaling to the authorities that he will obey the forms of obeisance so long as the authorities leave him alone to manage his life? 47 There is also the possibility of the release of previously unpublished factual information as a means of making the public agencies regulate risks. This can take the forms of labels on foodstuff, periodic reports to the public and on the internet and so on. Literature on such “structured disclosure policies” can be found in Mary Graham, “Information as Risk Regulation: Lessons from Experience,” Institute for Government Innovation, John F. Kennedy School of Government, Harvard University, available at http://www.innovations.harvard.edu/research/papers/m_graham.pdf . 48 “But most diffusion [of innovation] research has stopped with an analysis of the decision to adopt an idea, ignoring how this choice is implemented, and with what consequences.” E.M. Rogers, op. cit., p. 409. 49 E. M. Rogers, op. cit., p. 410, Figure 11-1. 50 Refer to the European Trend Chart on Innovation reports, available at http://trendchart.cordis.lu/Reports/ ; Also Catalina Bordoy of MERIT, “Innovation and Economic Outcomes” available at http://trendchart.cordis.lu/Reports/Documents/Bordoy.ppt . 51 Porter and Stern, op. cit., p. 17. 52 Porter and Stern, op. cit., p. 18. On the Porter’s ‘diamond’ model, see M. Porter, The Competitive Advantage of Nations, (New York: Free Press, 1990). 53 A good selection of papers on Canadian innovation with either an industry-specific or region-specific focus can be found in Innovation System Research Network (ISRN) website at http://www.utoronto.ca/isrn/working_papers.htm . 54 M. Csikszentmihalyi and K. Sawyer, “Shifting the Focus from Individual to Organizational Creativity,” in Cameron M. Ford & Dennis A. Gioia, (eds) Creative Action in Organizations: Ivory Tower Visions & Real World Voices, (London: Sage Publications, 1995): 167. 55 Definition derived and modified from E.M. Rogers, op cit., 441. The italicization is added. 56 Ibid., pp. 409-412. 57 The US National Science Foundation held a conference: Partnerships: Building a New Foundation for Innovation, held June 18-19, 2001, in Arlington, Virginia, the report of which is available at this site: http://www.rand.org/publications/DRU/DRU2651/ . What is significant is in “Appendix Four: Summary of Key Workspace Findings and Recommendations” that the participants find found that the a time frame of 3 years , (with some suggesting as long as five years) as the minimum time needed to evaluate the government’s role as a catalyst of innovation.; available at http://www.rand.org/publications/DRU/DRU2651/DRU2651.appg.pdf p. 77. 58 Confounding of variables and counterfactual arguments are two methodological problems plaguing innovation studies. 59 E.M. Rogers, op. cit., p. 414. Generalization 11-1. 60 Italics in original, Ibid., p. 111. 61 This is partly why Rogers’ work listed many examples where the results of innovation could be undesirable, indirect and unanticipated. 62 E.M. Rogers , op cit., 429-435. 63 This is a conservative assumption. Most capitalist economies tend to concentrate wealth in the elite over time. 64 Diagrams 3-6 were taken and modified from E.M. Rogers, op. cit., 1995; pp. 431, Figure 11-3. The numbers are arbitrary and meant to illustrate only. 65 E. M. Rogers, op. cit., pp. 429-430. 66 Cf Lim Siong Guan’s comments in footnote 32. 67 In reality, this assumption is of course tenuous.
41
68 European Union, EIS, available at: http://trendchart.cordis.lu/Scoreboard2002/index.html . 69 Manuel Trajtenberg, “Patents as Indicators of Innovation,” Economic Analysis of Product Innovation. Cambridge (MA) Harvard University Press, 1990 70 Porter and Scott, op. cit., p. 77. 71 Straits Knowledge, Innovation in Singapore Organizations, Feb 2002: 16. 72 Enterprise Innovation Centre, SPRING Singapore, Available at http://www.enterpriseone.org.sg/stats/keyrankings/ Homepage: http://www.enterpriseone.org.sg/I-Class . 73 More information about the I-Class can be found here: http://www.enterpriseone.org.sg/i-class/faq.pdf . 74 Ernest Gundling, The 3M Way to Innovation: Balancing People and Profit, Kodansha International, New York, 2000; cited in Dennis Sherwood, Creating an Innovative Culture (UK: Capstone Publishing, 2002) 66. 75 Robert S. Kaplan and David P. Norton, “Putting the Balanced Scoreboard to Work,” Harvard Business Review, September-October 1993, p. 134. 76 Lim Siong Guan, Permanent Secretary of the Ministry of Finance, Opening Speech of the 11th MFE Forum: NEV Seminar , 2nd July 2002, Transcript available at http://www.intranet.gov.sg/mof/nev/doc/PS%20speech%20-%20final.pdf 77 Manuel Trajtenberg, “Patents as Indicators of Innovation,” Economic Analysis of Product Innovation. Cambridge (MA) Harvard University Press, 1990; and Porter and Stern, op. cit., p. 77. 78 Jeremy Howells, “Innovation & Services: New Conceptual Frameworks”, Center for Research on Innovation and Competition, CRIC Discussion Paper 38, University of Manchester, August 2000. Available at http://les.man.ac.uk/cric/papers.htm#BriefingPapers . 79 Ibid., p. 5. 80 Ibid., pp. 5, 19. 81 Ibid., p. 6. 82 Deciding which indicators is appropriate without a suitable theoretical framework usually yields incoherence. 83 G. Bennett Stewart, The Quest for Value: The EVA Tm Management Guide, Harper Business 1991. 84 I have avoided going into technical details and calculations. The official site which includes explanation and technical calculations for the NEV is in The Net Economic Value (NEV) Unit, Managing for Excellence Directorate, Ministry of Finance, at the site: http://www.intranet.gov.sg/mof/nev/ . 85 Quotation taken from Lim Siong Guan, Permanent Secretary (Finance), Opening Speech at the 11th MFE Forum: NEV Seminar, 2nd July, 2002, Transcript available at http://www.intranet.gov.sg/mof/nev/doc/PS%20speech%20-%20final.pdf . 86 A public good is a good or service that is by it nature indivisible, have significant positive externalities and free-riders cannot be prevented from consuming it. Examples would include defence and transport infrastructure. 87 I acknowledge an intellectual debt in this section to Gavin Kelly and Stephen Muers, “Creating Public Value: An Analytical Framework for Public Service Reform.”, Discussion Paper , Strategy Unit, Cabinet Office, United Kingdom, 2002. Website at www.strategy.gov.uk . 88 Ibid. 89 Note that this is not the same as saying public value is anything that the public says it is because those making the valuation (the public) must be willing to give up something in return for it (ie, pay the opportunity costs). 90 The Singapore’s Ministry of Finance formulates public value as NEV and public good. MOF’s conception of public value is notably less coherent on public value than Kelly and Meurs’ work, which is why I prefer the latter. 91 J. Howells, p. 12. 92 Ibid., p.15. 93 Ibid., Table 3, p. 13. 94 G. Kelly and S. Muers, op. cit. 95 The Singaporean Civil Service also shows awareness of this; cf. Lim Siong Guan’s comments on p. 32. 96 For numerical data and citation for the variables cited, see Kelly and Muers, op. cit., pp. 11-13. 97 This includes correctly identifying the customers. As a example, the police force have meet targets for criminals arrested and still suffer a decline in public value if its treatment of victims and the accused are brutal.
42
98 Conceptually both services and outcome are distinct, although in practice they are interrelated. 99 Kelly and Muers, op. cit., pp. 11-13. 100 Assuming of course that governments do not resort to “social engineering” (morally questionable) or brute force (for example, China’s Cultural Revolution or the Khmer Rouge’s Year Zero policy). 101 This holds true for the business management discourse (despite all the research on organizational culture). Within other social sciences like sociology and political science, a school of thought known as constructivism attempts to theorize upon the effects of norms upon behavior (normative behavior). 102 Brand reputation in the private sector show some similar characteristics to trust in the public sector. 103 Kelly and Muers, op. cit., p.17. Also, see the impact on trust in this article in see also the Rebecca Lee, “Betrayal”, Straits Times, 3rd September, 2003. 104 What constitutes the public interests is also contingent upon how broadly or narrowly the ‘public’ is defined. 105 G. Parston, K. Rudat and A. Maidment, “The Glue that Binds: The Public Value Services.”, Public Management Foundation and MORI Social Research institute, 1996. Inquires about that paper can be made at this site: http://www.mori.com/nhs/database.html . Also refer to this site http://www.publicnet.co.uk/publicnet/re981007.htm . 106 Ideally there should be equivalent data for Singapore’s context for making this claim. However , in Singapore, there are few rigorously conducted public opinion surveys that lies in the public domain and hence available for research purposes (more on this later). 107 The literature on trust and legitimacy is too large to be summarized in this section. Two possible starting points are: A) Rosalinde Klein Woolthuis, Bas Hillebrand and Bart Nooteboom, “ Trust and Formal Control in International Relationships”, Erasmus Research Institute of Management (ERIM), ERIM Report Series: Research in Management, January 2002, available at this site: http://www.eur.nl/WebDOC/doc/erim/erimrs20020201091324.pdf (anchored within economic literature ); and B) Francis Fukuyama, The Social Virtues and the Creation of Prosperity, London: Penguin, 1995 (anchored within popular writing). 108 Market Behaviour (Singapore) Pte Ltd at the behest of Prime Minister’s Office (Public Service Division), “Report on External Customer Perception Survey on Public Service in Singapore.” December 2000. For inquires on this report please email: Ms Peggy Tan, PS21 Office at Peggy P [email protected] As far as I am aware, this is the only rigorous customer perception survey within Singapore that is (barely) accessible to the public. Even this report has bureaucratic/legal restriction on its use for research. 109 As far as I am aware, the only cited example of public service organization implementing the Balanced scorecard is the town of Charlotte, North Carolina, United States. 1999. Stern Stewart, “ABC, The Balanced Scorecard and EVA”, EVAluation, Vol. 1, No. 2 (April 1999): 3. I also thank Tham Puay Ling for suggesting this point about using the BSC to provide a composite measure of innovation. 110 To use adapted BSC to measure the outcomes of innovation (the variable to be measured) by reference to the innovation perspective is tautological and methodologically flawed; analogous to explaining the differences in the artifacts of culture by mere reference to culture. 111 Research in the United Kingdom showed that a large proportion of citizen participation did not impact the final policy. Lowndes, Pratchett and Stoker, Trends in Public Participation Part 1-Local Government Perspectives, Public Administration, 1999. 112 Fung, Archon and Erik Olin Wright. "Deepening Democracy: Innovations in Empowered Participatory Governance." Politics and Society, 29.1, (March 2001): 5-42. A draft version is available at this site : http://www.archonfung.net/papers/DeepeningIntro.pdf . Singapore is a city state and hence is comparable to other successful examples of innovative governance at the city-level such as those that occurred in Porto Alegre. 113 Ibid., pp. 14-16. Also see Clive Doucet, “The Participative Budget in Porto Alegre: Insights from a Study Visit of a Canadian Councillor”, The Innovation Journal: Case Studies, August 2002 available at http://www.innovation.cc/case-studies/doucet.htm.