Embed Size (px)
Citation preview
TH CALIFORNIA PINE RISK-RATING SYSTEM: ITS DEVELOPMENT, USE,
AN RELATIONSHIP TO OTHER SYSTEMS
Richard H. Smith, Boyd E. Wickman, Ralph C. Hall,Clarence J. DeMars, and George T. Ferrell 1
Abstract. --The California Pine Risk-Rating System provides a method for ratingcurrent probability of tree mortalitycaused largely by western and Jeffrey p~nebeetle. It was formulated in stands ofold-growth, eastside ponderosa and Jeffreypine in California. Individual trees arerisk-rated on easily recognized and classi-fied crown characteristics. When appliedto selective logging, it is called sanita-tion/salvage. Removal of high-risk trees,generally about 15 percent of the stand,recovers the value of trees that wouldotherwise be lost to insects, and has sig-nificantly reduced beetle activity in thearea by 80 percent for more than 20 years.
In the mid-1920's efforts were madeto find host conditions that cause suscep-tibili ty to western pine beetle. No de-cisive or easily recognized condition wasfound until Salman turned to crown charac-teristics of eastside ponderosa pine inthe mid-1930's. The California System re-sulted from this effort. It has become asilvicul tural principle for eastside pon-derosa and Jeffrey pine in California andOregon and is applicable to other regionsin the West.
Keen Tree Classes preceded and arerelated to the California System. A pen-al ty system quantifying crown and stemcharacteristics is a refinement to assistfield application of the System. Deriva-tives of California System include a standhazard classification for ponderosa andJeffrey pine in northeastern Californiaand risk-rating systems for red and whitefir in northern California.
INTRODUCTION
This paper traces the origins, devel-opment, testing, and application of the
i Drs. Smith, DeMars, and Ferrell areResearch Entomologists at the Pacific South-west Forest and Range Experiment Station,USDA Forest Service, Berkeley, Calif.Mr. ~ickman is Research Entomologist at thePacific Northwest Forest and Range Experi-ment station, Portland, Ore.; and Dr. Hallis a consulting forest entomologist.
California Pine Risk-Rating System, calledthe California System throughout this pa-per. It is usually called sani tation/sal-vage when utilized as a logging practice.The System will be described, and exampleswill be given that first demonstrated itsutili ty as a forest management procedure.A penalty scoring procedure that refinesthe System and a stand hazard classifica-tion that is derived from it will be re-viewed along with efforts to extend itsuse to other forest regions. We concludewi th a résumé of research which sought toexplain the mode of operation of and causalrelationships underlying the risk-ratingsystem.
The California System is applicableprimarily to eastside old-growth ponderosapine (Pinus ponderosa Laws.) and Jeffreypine (P. jeffregi Grev. and Balf.) (fig.i). Eastside is defined as east of theSierra Nevada-Cascade crest. It is anindividual tree classification systembased on an array of easily recognizedcrown characteristics. Risk, as original-ly defined and as used in this paper, isbasically an estimation of the currentprobabili ty of a tree being attacked andkilled by bark beetles, primarily the west-ern pine beetle (WPB) (Dendroctonus brevi-comis Lec.) and the Jeffrey pine beetle(JPB) (D. jeffregi Hopk.), and to someextent by the flathead borer (Melanophilacalifornica VD).
Figure 1. --Typical stands of eastside pon-derosa pine sui table for risk rating.
From an evolutionary and developmen-tal viewpoint it is worthwhile to discussthe Keen Tree Class System along with theCalifornia System, since there may be someconfusion between the two. Both evolvedfrom the same background experience andhad nearly a parallel course of develop-ment. From all evidence. it appears thatthe California System might have been par-
53
tially derived from the Tree Class System;or at least those who developed the Cali-fornia System were able to benefit fromthe experience of the Tree Class system.
We chose to organize the review rath-er strongly around the processes whichwere involved because these are importantaspects for subsequent research and devel-opment, and they are often overlooked.Much of the content of our review can befound in a small number of technical re-ports, particularly in several sectionsof Miller and Keen (1960). The task wasto recheck old reports and publicationsand, hopefully, to highlight the processesused, to examine the successes and fail-ures, and to record the ideas which weretried during the period of development.
BACKGROUN
Four related developments precededthe California System: (1) studies oftree selection, (2) development of treeclassification systems, (3) conduct andanalysis of large-scale direct controlprograms (i. e., directly killing the broodor removing it from the forest) in north-eastern California and southern Oregon,and (4) establishment of a small experimen-tal cutting based on tree classification.
Tree selection research was an earlyeffort to determine the nature of treesattacked by WPB. This research. was fol-lowed by Dunning's Classification, basedon tree physiognomy (Dunning 1928), whichin turn was modified to produce the KeenTree Classification System (Keen 1943).All three developments in selection andclassification partially reached theirobjectives, but none was successful inproviding a reasonable explanation of se-lection or an easy and effective systemof risk classification. These develop-ments, however, formed a partial basisfor the California System. Analysis oflarge-scale direct control programs, show-ing uncertainty of their results, estab-lished a climate that gave impetus to re-search on al ternati ve methods of control.The small logging study, based on insectselection criteria, was a key developmentthat led most directly to the CaliforniaSystem.
Tree Selection
The origins of many new developmentsin biology are often lost in the past;and so it seems to be with the CaliforniaSystem. Thirty years before it was formal-ized, there were suggestions, includingreports by A. D. Hopkins shortly after1900, of a preferential habit of attackby bark beetles. But until about 1925
54
.
these references were general, sketchy,and based on only casual field observa-tions.
The story really begins in the 1920' s,when there was a concerted thrust of re-search on the basic biology and ecologyof the WPB. It was from this work thatspecific ideas of risk originated. Mil-ler's report (1926b) is a good place tostart. In that report of bark beetle los-ses on plots located on the western slopeof the Sierra Nevada, he presented evidenceof the preference of WPB for ponderosapines with slower growth rates. He alsofound some degree of association betweencrown characteristics and the incidenceof beetle attack, the starting point forthinking of the possible value of crowncharacteristics as indicators of risk.At about the same time Person (1926) re-ported on one of the key studies in thedevelopment of risk in which he concludedthat trees with the smallest crowns werethe most susceptible to attack. In fact,he suggested that there is an inverse re-lationship between crown size and suscep-tibility to attack. As for populationphenomena in relationship to susceptibletrees, Person (1928) thought that largenumbers of susceptible trees in a standpermi t a rapid increase in beetle popula-tion resulting in greater probability ofepidemic infestations in trees that werenot normally susceptible. Person (1931)then theorized that a secondary attrac-tion for beetles is created in and bytrees which are easily overcome.
Struble continued the work Personhad started on growth rate. The finalreport (struble 1942) showed 22 percentof the trees and 28 percent of the volumewas killed over a 22-year period. Inyears of light beetle activity, a decidedpreference was shown for the slower-growingtrees. This preference was less pronouncedin years of heavy beetle acti vi ty.
From 1925 to 1929 research was expan-ded to discover the reasons for a tree'srelative susceptibility or resistance tobeetle attack. The early portion of thiswork was done near Northfork on the SierraNational Forest; the latter porti6n wasnear Buck Creek on the Modoc National For-est. Among the characteristics consideredwere phloem moisture, bark sugar, phloemelectric potential, bark thickness, andresin toxicity. Neither these stem charac-teristics nor the crown characteristicsstudied by Miller and Person were foundto be decisive. It is worth noting thatmuch of this early research was done inwest slope Sierra Nevada ponderosa pinetype, an area in which no risk system yetdeveloped has been found applicable. Al-though these early scientists had the rightidea, they were working in the wrong placefor demonstrating the risk phenomenon.

Nevertheless, they began a course of ac-tion which was to produce the CaliforniaSystem. Their research also served asthe training ground for many of those whodid much of the subsequent studies on themore important bark beetles in the West.
Analysis of Direct Control Programs
Direct control is killing immaturebrood or beetles in, or as they emergefrom, infested trees--before brood emer-gence. From 1910 to 1925 numerous directcontrol programs were conducted for WPBin California and southern Oregon, primar-ily using the feel-peel-burn procedure.
Craighead (1925) noted this aboutWPB:
The theory that kill i ng the broods in a1 arge percentage of the trees wi 11 reducethe infestation to just such an extent soundsreasonable. It does not, however, take intocons i derat i on the fact that under favorablecondi t ions these insects have extraordi narypowers of multipl ication and that underthese same conditions possibly fewer beetlesare requi red to overcome the res i stance ofthe tree. Even with the most carefully exe-cuted work it is rarely possible to treatmore than 80 percent of the i nfes tat ion.The other 20 percent, under optimum condi-tions for attack and development, might read-ily offset such a reduction. For some timeMr. Mi 11 er has been doubtful of the effec-tiveness of this method of fighting the west-ern pine beetle. He has stated his objec-tions as follows: (1) This type of controlwork is expensive, (2) uniformly successfulresults have not been secured, and (3) theresults are not permanent.
Miller (1926a) referred to the WPB/ponderosa pine relationship:
In the early studies of this problem the in-sect i tse 1 f was regarded as the pri mary ac-tive agent and the host tree was consideredonly as a passive medium which was attackedindiscriminately. It is now realized thatthe reactions of the tree must be cons i deredas well as the activities of the beetles,and that the vigor of a tree has much to dowith its susceptibility or its resistance tobark beetle attack.
After recounting the work on tree selec-tioii, Miller stated that
these discoveries open up the possibility ofreducing losses through logging practice andof taking out most of the susceptible treesin the marking practice on sale areas so asto leave only the more resistant trees forseedi ng purposes and future cuts.
Finally Craighead et al. (1931) notedthat the benefits of direct control of
bark beetles, including WPB, were sometimesuncertain and the effects were usuallytemporary. They asked for research anddevelopment on some kind of silvicul turalpractice to overcome these disadvantages.
It would appear that these three ar-ticles represented the attitude and philos-ophy that fostered research and developmenton tree classification and risk-rating.
Addi tional support for the positionthat the host played a critical role inthe dynamics of bark beetle populationcame from the effects of a natural phenom-enon, the cold temperatures of winter 1932-33. These temperatures caused a severereduction in WPB broods throughout north-ern California (Miller 1933); yet 2 yearslater, the outbreak was as extreme andwidespread as before the freeze.
Keen and Dunning Tree Classifications
In the late 1920' s the research thrustshifted from the west slope of the SierraNevada to eastside ponderosa pine in north-east California and southern Oregon, whereKeen was conducting annual surveys of areaswi th persistently heavy bark beetle losses.Early surveys were primarily loss surveys,al though some attention was given to crowncharacteristics of attacked trees. Then,during an epidemic year, Keen added Dun-ning's (1928) new tree vigor classifica-tion to the requirements of the survey;that is, the survey crew placed each at-tacked tree into one of Dunning's sevenclasses. The relative abundance of Dun-ning's seven classes in the unattackedstand was tallied so that the ratio ofattacked to unattacked trees could be ob-tained. This first effort to link at-tacked trees with Dunning's vigor classeswas unsatisfactory, because often as muchvariation occurred wi thin a Dunning classas between classes.
It was becoming clear, however, thatwhat was described by the vague term"vigor" was a fruitful concept to explore.Keen expanded Dunning's 7 classes into 16classes. First called bark-beetle suscepti-bili ty classes, these were later to becomethe Keen Tree Classes (fig. 2). Keen(1936) also saw quite clearly what wasrequired for the solution of the bark bee-tle problem in southern Oregon and north-ern California:
. . one of the fi rst requi rements in thesolution of the pine beetle problem is aknowledge of what type of tree presents thegreatest risk of beetle attack. Once thetype of tree most likely to be killed can berecogni zed wi th a fair degree of certai nty,it is possible to make partial cuttings ofbeetle-susceptible trees, either for the pur-p0~e of salvaging valuable high-risk treesbefore they are damaged by beetle attack or
55

for the silvicultural objective of reducingmortality and increasing net growth.
~ t r,
2
.,
,l:~~.
"f' ..~:."'/j .
~ê'l,'1.1.....:..
.fZ : ."'., ,~
;'T"".~'"
. .' ........ ~~
t
êC.,¡:-. Ii'" 1;'.-. ... .'.... l.,~
"':...... ¡?, c),', i::i. ., .,' :":! __.. "p,',.~~ ~ ~e. ",'J.r~ 3f' ~f'." 11.~ ,'/ r'¡. I
,
,
i..
3
~å;";r:~"~:~.:~i' .',0"'''
-\.r;~
4
A B
l
't
':"""
. .
-c o
Figure 2. --The Keen ponderosa pine treeclassification. Age increases from 1to 4 and vigor decreases from A to D.(From Keen 1936.)
From 1928 to 1931 an impressive studywas conducted in southern Oregon, nearAshland, in which 27,465 attacked treeswere classified according to the Keen TreeClasses; and 22,428 unattacked trees wereclassified for comparison. The resultsshowed a distinct improvement over theuse of Dunning's vigor classes. Mortalityratios found ranged from 0.17 for treeswi th a high vigor classification to 2.50for trees with a low vigor classification.The mortality ratio is the percentage ofthe loss in a given class divided by thepercentage of that class in the originalstand. Mortality ratios ) 1 denote suscep-tible classes. Therefore, the Keen TreeClasses provided, for the first time, asharp and easily recognized differenceamong types of crown classes. However,there were too many trees in the suscep-tible classes, requiring the removal oftoo much of the stand. The development
56
of the California System resolved thisproblem.
It is interesting to note that Dun-ning's classes were developed for ponderosapine on the west slope of the Sierra Nev-ada, where the California System has beenfound unsuitable. Ecologically, east andwest slope Sierra Nevada-Cascade haveproved to be two quite different areasfor ponderosa pine, and the insect com-plexes appear to be different and to oper-ate differently in the two regions. Thisvariation in site emphasizes the need toestablish a sound ecological basis forrisk studies.
An Insect Selection Cutting
Person shifted his base of operationfrom the west slope of the Sierra Nevadato northeastern California. And as Keenhad done, Person started with Dunning'stree classes. In 1927 he established anexperimental cutting on a 20-acre plot onthe Modoc National Forest by using Dun-ning's classes and removing what werecalled "the most susceptible trees," al-though the classes were not identified.The purpose of the experiment was to deter-mine for the first time if selection cut-ting could be used to remove susceptibletrees and reduce subsequent loss. Shortlyafter Person established this experiment,K. A. Salman assumed responsibility forcontinuing the work. Salman seemed tobene fi t from Person's work on tree selec-tion and was able to carry it forward toa risk system.
Increment cores were used to deter-mine the year of tree death on both cutand uncut plots. From 1920 to 1927 ca.28 percent of the stand had been killedat a fairly even annual rate. In the 4years after the selection cutting, a 4percent loss occurred in the untreatedstand and a 1 percent loss in the treatedstand. Salman (1932) concluded as Keenhad that Dunning's classes did not dis-criminate risk clearly enough. Salientpoints of this study, particularly as theypertain to research and development pro-cesses are: it was the first experimentalcutting in which a principle of insectselection was applied; the results werenot strikingly successful; and scientists,particularly Salman, used the experiencegained from this study to develop otherand more profitable research.
CALIFORNIA PINE RISK-RATING SYSTEM
Development
Final formulation of the CaliforniaSystem was made in 1936 by Salman, who

was convinced by his analysis of the studyPerson had established that Dunning's clas-ses were unsuitable for rating risk. Sal-man also noted two limitations in the 16-class system developed at this time byKeen for use in southern Oregon. First,the 16 classes made it cumbersome as aworking tool, and second, it would requirethe removal of too large a volume of tim-ber for quick treatment of stands. Ifthe forest manager was to reduce thechances of bark beetle losses, the cuttingshould be light enough to cover standsquickly.
Salman took advantage of the observa-tions of workers making annual loss sur-veys in northeastern California in theearly 1930' s. They had reported that mosttrees killed could be characterized byvarious kinds and degrees of crown deteri-oration before attack. These observationswere crystalized into a study by Salmanin 1936, in which 973 infested and 2,026unattacked trees were cut and carefullyexamined for various types of crown deter-ioration.
A three-class structure was prelimin-arily established, but Salman i s field crewfound that four classes were better forfield application. Eventually the ele-ments of high risk were described as fol-lows (Salman 1937 and Salman and Bongberg1942) (fig. 3):
--thin or sparse foliage complement, shortneedl es, and the dyi ng of twi gs and brancheswere characters of the trees that become i n-fested and die--active or recent top-killinginfestations, the localization of branch ortwig injuries, and the thinning and shorten-ing of foliage in portions of the crown alsooccurred in many of the trees that di ed--
f;
t~21L 4
Low Riiii High Rllk
Figure 3. --Four stylized trees, illustrat-ing the four risk classes of the Cal-ifornia Pine Risk-Rating System.
green trees which exhibited those characterswere likely to die and were considered ashigh-risk trees. High-risk characters wereabsent in healthy appearing trees considered
(lower) risk from insect attack under normalconditions--gradations were segregated intofour degrees of risk for application in fieldtests.
The next step was to test the classi-fication more extensively and 18,056 pon-derosa and Jeffrey pines were classifiedaccording to risk on the Modoc and LassenNational Forests. About 11 percent ofthe trees fell into Risk Classes I I I andiv, the high-risk classes (table 1); andabout 84 percent of the attacked volumefell into the same two classes (table 2)(Salman and Bongberg 1942). These datashow that bark beetles attacked and killed23 trees or 30 fbm in high-risk categories(Risk III and iv) for everyone, tree orfbm, killed in the low-risk categories(Risk i and II).
It is important to note, as pointedout by Keen and Salman (1942), that neitherthe Keen tree susceptibility classes northe California System risk classes are,in themselves, a timber management system.They are, instead, silvical principles.The Keen Tree Class system associates 16age and crown vigor classes with averageannual susceptibility to attack. It shouldbe noted that the four classes of the Cali-fornia System are somewhat similar to cer-tain of the Keen Tree Classes. The Cali-fornia System associates four generalizedcrown types with the current probabilityof attack, i. e., risk of being killed. Tobecome a timber management procedure, ortree-marking system, the objectives ofthe timber manager must be considered also,i.e., the amount to be cut, the purposeof logging, the speed at which the standis to be logged, the type of residualstand required, and the method and timeof regeneration. When the California Sys-tem became a logging procedure, the termsani tation/salvage was applied to theoperation. This term has since been usedto describe any process of removing low-vigor, more susceptible trees.
Thus, by 1936 the California Systemwas fairly well fixed and a period of test-ing and modification began. The develop-ment period was characterized by largestudies which associated certain crowncharacteristics with subsequent tree mor-tali ty. In a sense it appears that Keenmodified the existing vigor classificationsystem of Dunning, while Salman developedhis definitions from the results of severalyears' observation of thousands of trees,though he was aware of the other classifi-cations. Keen i s classification seems tohave been the more logical approach; Sal-man 's, though oriented toward practicalapplication, seems to have rested on someintui tion.
57

Table l.--Distribution of green trees by risk ratings, by trees and volume
Percent of tota 1
Ri sk rating Number of trees number of trees
I 12 , 184 67.5II 3,865 21.4
III l,099 6.1iv 908 5.0
Total 18,056 100.0
Volume b.m.Percent of total
volume b.m.
8,725,0154,692,5731,418,457l,047,644
15,883,689
54.929.68.96.6
100.0
Source: Salman and Bongberg (1942).
Table 2.--Distribution of insect-killed trees by risk ratings, by trees and volume
Percent of Mortal ity
Ri sk Percent of total loss in total rat i 01
rat i ng Number of trees Volume b.m. loss volume b.m. volume b.m. volume b.m.
i l6 11,142 4. I 0.13 1
II 27 31,130 11.4 0.66 5
III 43 44,579 16.4 3.14 24
iV 178 185 ,395 68. I 17.70 136
Total 264 272 ,246 100.0Average 1. 71
Source: Sa 1 man and Bongberg (l942).
i Percentage of loss in Risk i considered as 1, or the unit of comparison.
Testing
Salman reasoned that the removal ofthe high-risk trees from a stand wouldresul t in significant benefits and he pro-posed a logging experiment to test histheory.
The basic experiment to test and ver-ify the California System was started in1937 on the Blacks Mountain ExperimentalForest, located in the north-central por-tion of the Lassen National Forest. Allof the high-risk trees, i. e., Classes I I Iand iV, were removed on a 322-acre compart-ment; added to the high-risk trees was asufficient volume of lower-risk trees toensure a cut of 2,500 fbm/acre. In thefol lowing 6 years additional compartmentswere treated each year until about 3,200acres had been treated. The average vol-ume removed was 15.7 percent of the mer-chantable stand. An annual 100-percentcruise of cut and uncut compartments pro-vided data on loss by classes of trees.
Bongberg (1939) reported that theresul t of the first year's test was a verysatisfactory 91 percent reduction in annu-al insect-caused timber loss. At the endof 10 years, Bongberg (1949) reported thatthe reduction in annual beetle-caused mor-
58
tali ty ranged from 67 to 92 percent withan average of 82 percent for the 10-yearperiod. The final results cover a 22-yearperiod (table 3) (Wickman and Eaton 1962).I f only insects are considered, this losswas reduced by 80 percent, i. e., 99.5 fbm/acre loss per year on the uncut blocksand 19.5 fbm/acre per year on the cutblocks. Annual mortality on treated anduntreated plots varied considerably fromplot to plot and from year to year. Themean annual loss ranged from 0 to 40.8fbm/acre on the treated plots and from9.4 to 249.0 fbm/ acre on the untreatedplots. Part of this variation was attrib-uted to year of cutting, since 6 yearswere required to establish the study; andpart was undoubtedly attributable to theannual and spatial fluctuations in thebeetle populations. The variation in thepercent reduction from year to year rangedfrom a high of 97 percent in 1945 to alow of 38 percent in 1953 (fig. 4); neitheryear was an extreme 0 f insect acti vi ty .Salman contended that risk rating was pri-marily a probability of current attack.I f we consider that these probabilitieslie in a confidence band, of say 90 percent,then we would expect by chance that twicein 20 years, deviations outside the confi-dence intervals would be obsèrved. AI-

1.4
'0
1,2
"~ 10
~ .8
~".'
~"
() ~8 40 4;: '44 '46 48 .~O '~2 '~4 '~6 '58 '60Calendar year
lrl~:f'('t-('alj:;pd pirll i;H\itlintJet" mJrtallty .m ('ut Il.rid iiicut(" imi"':.' n.m/'nLI 1\; r tlll' calendar yeurs 1 '_i3H t\) i ')'y)"
Figure 4. -- Insect-caused pine sawtimbermortali ty on cut and uncut componentsfor the calendar years 1938 to 1959.(From Wickman and Eaton 1962.)
though no estimates were made of confi-dence limits, we think this is the case.The cumulative insect-caused mortality( fig. 5) shows a steady and continued ac-crual of loss reduction.
A second study compared sani tation/salvage with several other types of ForestService cutting methods (Eaton i 959) .Resul ts suggested that any system thatremoves a large volume of the total standor much of the volume of trees with poorgrowth will reduce subsequent losses. Ina sense it is a matter of getting to thetree before the beetle as well as improv-ing growth conditions for the residualstand. Sanitation/salvage was the lightestof all cutting methods; therefore, it pro-vided the quickest means of "sanitizing"an area as proposed by Salman.
The final step in establishing thesani tation/salvage procedures was a pilottest. In 1939, the McCloud River LumberCompany began logging under the guidanceof Bongberg (1947). An area 10 milesnorth of Burney Falls, California, thathad experienced continuing loss caused byWPB was marked using the California Sys-tem. The cut of 563 fbm/acre was unusu-ally light, but the cost of logging wasonly about 23 percent higher than a stan-dard heavy cut. This additional cost wasmore than offset by the value of timberrecovered that would have been lost tosubsequent beetle attack. Insect-caused
Tab 1 e 3. --Cumulative insect-caused mortal i ty of pine sawtimber reserve per acre in successive numbers
of years after cuttings, by treatment, 1938- 591
Treatment and wei ghted mean reserve stand volume (board feet)
Year aftercutt i ng Sani tat ion/sa 1 vage (13,682 trees) Untreated (16,358 trees)
Board feet Percent stand Board feet Percent stand
1 14.7 0.11 89.3 0.552 22.8 0.17 172.0 1. 053 26.8 0.20 251. 2 1. 544 38.2 0.28 325.0 1. 995 53.6 0.39 418.1 2.566 68.5 0.50 5l4.3 3.157 77.8 0.57 626.4 3.838 108.2 0.79 749.3 4.599 134.0 0.99 878.0 5.37
10 170.0 1. 24 1,016.2 6.2211 204.5 1.49 1,154. 7 7.0712 258.5 1. 89 1,301.5 7.9713 272.7 1. 99 l,420.5 8.69l4 297.7 2.18 l,540.7 9.4315 323.9 2.37 1 , 640 . 6 10.0416 357.7 2.61 1,741. 9 IO.6617 384.8 2.81 1 , 844 . 2 11.2918 403.8 2.95 1,950.6 11.9419 422.0 3.08 2,059.5 l2.6020 473.3 3.46 2,135.4 13.0721 494.7 3.62 2 ,215. 3 13.5622 514.9 3.76 2,281.3 13.96
i The first year after cutting is based on 3,200 treated acres and 9,250 untreated; the 22nd year
is based on 8l treated acres and 407 untreated.
Source: Wickman and Eaton (1962).
59

loss in these stands was reduced by 85percent over the next 6 years. Loss reduc-tion was based on a projection of the lossexperienced on the treated area for sever-al years before logging. An unexpectedand important benefit of sanitation/ sal-vage cutting materialized in 1944, when arapid increase in WPB activity developedin the general geographic area. Lossesin uncut stands were heavy and direct con-trol operations were taken. Losses re-mained very low in the areas logged bysanitation/ salvage, however, and no di-rect control was necessary.
õ
14
"
"~ 10 -
" .t~0.~ 6:-'""~ 4::
I. 20 228 10 12 14 16Number of years ofter cutting
Cumlative inBect-caußed mortality 1n pine B6vt1mber reserveon cut and uncut compartments.
Figure 5. --Cumulative insect-caused mor-tality in pine sawtimber reserve oncut and uncut compartments. (FromWickman and Eaton 1962.)
Bongberg (1942) also applied sani ta-tion/salvage to eastside Jeffrey pine andobtained results essentially the same asthose obtained in ponderosa pine stands.This similarity showed the general suita-bili ty of the California System to standsof predominantly Jeffrey pine attacked byJPB.
These reports by Bongberg, Eaton,and Wickman and Eaton demonstrated conclu-si vely the immediate, large, and lastingbeneficial effects of applying cuttingsto eastside ponderosa and Jeffrey pinebased upon a risk-rating system. The nextstep was to determine the scope of itsapplicabili ty as well as to establish itas a forest management tool.
Early Application
After the favorable results with sani-tation/salvage on part of its holdings,the McCloud River Lumer Company adoptedthis method of management on the balanceof its ponderosa pine stands.
In 1940, the U. S. Forest Service test-ed sani tation/sal vage on 8,000 acres onthe Dixie Valley Sale Area on the Plumas
60
National Forest in a mixed ponderosa-Jeffrey pine type. The first year aftertreatment there was 100-percent reductionin loss of ponderosa and 82 percent ofJeffrey pine. In 1942, the Forest Serviceundertook another sanitation/salvage saleon the Lassen and Modoc National Forestsand in subsequent years adopted sani tation/salvage as standard management procedureon all eastside pine stands that it man-aged.
In 1940, Collins Pine Company at Ches-ter, California, tested sanitation/salvagewi th excellent results and adopted thismethod of treatment on its 80, OOO-acretract. The company continues to use thismethod today in appropriate stands.
After the successful application ofsanitation/salvage, many private timberoperators in northeastern California adop-ted it as standard management procedure.
Expanded Use
Keen (1940) extended the use 0 f theCalifornia System to southern Oregon withthe establishment of logging studies bythe weyerhaeuser Timber Company near Kla-math Falls. The studies used hybrids ofKeen Classes and California Risk Classesbecause the early results of using riskclasses were so promising in northeasternCalifornia. The logging removed slightlymore than 10 percent of the volume. Earlyresul ts (Keen 1942) showed that a hybrid-based cutting worked as well as one basedsolely on the risk classification. Con-tinued evaluation of the study showed thehybrid to have the desirable long-lastingeffects shown by the California System(Keen 1955). In the early 1940's, Orr(1945) applied the hybrid system to exten-sive areas in southern Oregon. In all,200,000,000 fbm, comprising ca. 25 percentof the volume of the stands, were logged.Subsequent losses were judged to be mar-kedly reduced. Sowder (1951) extendedthe use of California System still furthernorth in eastside Cascade to the area ofBend, Oregon. These studies and applica-tions greatly expanded the area of appli-cabili ty to nearly all of ponderosa-Jeffrey pine stands east of the Sierra-Cascade crest.
Sani tation/salvage was applied opera-tionally to a limited area in the coastalmountains of southern California in 1953and 1954. Losses over the preceding yearshad become progressively heavier and thedirect control efforts applied had notbeen fully satisfactory. Primarily a rec-reational area, cutting of green treeswas not viewed with favor. However, in-creasing salvage of dead trees was lookedupon with even less favor. Thus a sani-tation/salvage ope~ation was carried out

wi th favorable public support. Hall (1958)estimates that losses after sani tation/salvage logging was conducted were lessthan 10 percent of the losses experiencedbefore the operation. with this experi-ence as a basis, some 80,000 acres ofsimilar forest were logged by sani tation/salvage operation between 1955 and 1957.
Al though precise data were not recor-ded, Hall and Pierce (1965) estimated thatlosses on the recreational area were re-duced by 60 percent for the first 6 yearsbut then started to rise because of a rap-id increase in the numer of trees whichbecame high risk. The area was loggedagain and the effect in subsequent yearswas favorable. In several other areas, asimilar pattern developed and Hall applieddirect control measures to suppress lossesuntil sanitation/salvage could be applied.This procedure of combining sani tation/salvage with direct control is oftencalled maintenance control.
A long-term study was established in1948 to determine the applicability ofrisk-rating to ponderosa pine in westernMontana (Johnson 1972). A second objec-tive of the study was to determine thethreat of WPB in that area. In all, 11,946pines were tagged, measured for size andvolume, and risk-rated according to theCalifornia System criteria. In Montana amuch greater percent of the volume fellinto the middle classes and a much smallervolume in the extreme classes (table 4)than was found in California (Salman andBongberg 1942). The combined percent inrisk I I I and iV--the trees usually cut ina sani tation/ salvage operation--is some-what similar, with 11 percent in Califor-nia and 20 percent in Montana.
Table 4.--A comparison of stand and loss volume,by percent, in the four risk classes inCa 1; forn; a1 and Montana2
Cal ifornia MontanaRisk Stand Loss Stand Loss
I 68 4 8 0II 2l l2 72 24
III 6 l6 17 42iv 5 68 3 34
1 Data from Sa 1 man and Bongberg (1942).2 Data from Johnson (1972).
Bark beetle acti vi ty in ponderosapine in Montana during the period of thestudy was lower than that experienced innortheastern California during the periodof development of the California System.Nevertheless, the apportionment of lossin the various risk classes was quite sim-
ilar. The results, therefore, suggest thatthe risk principles are applicable to lowendemic conditions as well as to outbreakcondi tions. They further indicate thatthe percentage of high-risk trees in thestudy area is sufficient to support anoutbreak of bark beetles when other fac-tors become favorable for an increase inthe beetle population. Even before theCalifornia System had been tested in Mon-tana by Johnson's experiment, many landmanagers in the intermountain region, suchas J. Neils, Anaconda Copper, Potlach, aswell as the U. S. Forest Service and Mon-tana State Forestry Division, were apply-ing it to stands which were considered tobe of the same type as the stands in Cali-fornia and Oregon (Johnson 1951).
Refinement: Penalty System
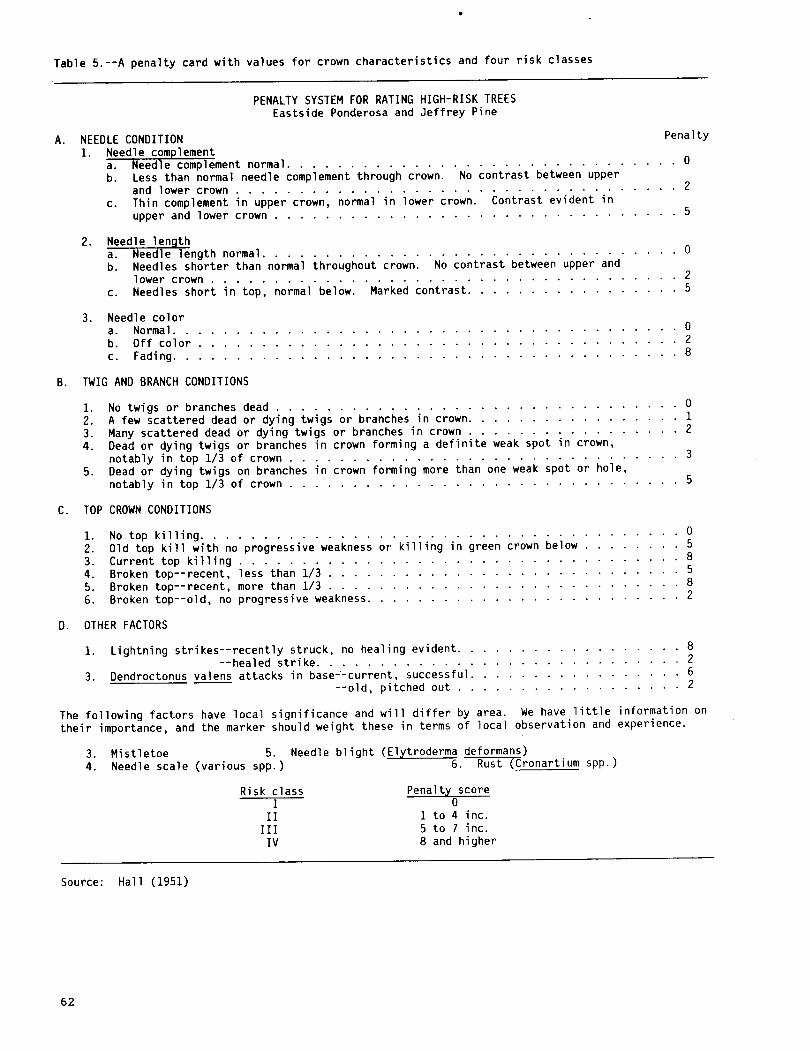
A refinement of the California Systemis the penalty system in which penaltypoints are assigned to crown and stem char-acteristics of a tree. The penalty systemwas devised primarily as a way to traininexperienced tree-markers in using therisk system. Usually after a day or twowi th a penalty card, the marker felt con-fident in continuing without the aid of acard.
The first penalty system, formulatedin 1941 (Keen 1954), was based upon theassociation of crown or stem characteris-tic with risk classes and subsequent treemortali ty. Values, called penal ties, wereassigned to these associated characteris-tics. Thus, the stronger the associationof the characteristic with risk and treemortali ty, the larger was the value andthe greater the penalty. In practice, apenal ty card was scored according to aquick visual assessment of the crown andtrunk. Keen's original system has beenmodified several times, the last by Hall(1951) (table 5).
Derivative: Stand Hazard
No sooner had the California Systembeen preliminarily formulated than entomol-ogists turned their attention in 1937 todeveloping a system for rating stand haz-ard. The 1936 field season was spent indeveloping indices for classifying some 2million acres of ponderosa-Jeffrey pinetype in northeastern California (Salman1938) . As a result of this study two sep-arate but related stand characteristicswere used for hazard classification (Mil-ler et. al. 1941) (Johnson 1949): (1)the past 10 years' cumulative volume ofbeetle-caused mortality, (2) the currentvolume of high-risk trees in the stand.The current green volume of the stand wasdetermined and two percentages were calcu-lated by dividing each of the above vol-umes by the green stand volume. The two
61
.
Table 5.--A penalty card with values for crown characteristics and four risk classes
PENALTY SYSTEM FOR RATING HIGH-RISK TREESEasts i de Ponderosa and Jeffrey Pi ne
A. NEEDLE CONDITION1. Needle complement
a. Needle complement normal. . . . . . . . . . . . .b. Less than normal needle complement through crown. No contrast between upper
and lower crown . . . . . . . . . . . . .c. Thin complement in upper crown, normal in lower crown. Contrast evident in
upper and lower crown . . . . . . . . . .
Pena lty
o
2
5
2. Needl e 1 engtha. Needle length normal. . . . . . . . . . . . .b. Needles shorter than normal throughout crown.
lower crown . . . . . . . .c. Needles short in top, normal below.
o
No contrast between upper and25Marked contrast. . . . . . . . . . . . .
3. Needl e colora. Normal..b. Off colorc. Fading.
o28
B. TWIG AND BRANCH CONDITIONS
1. No twi gs or branches dead . . . . . . . . . . . . . . . . .2. A few scattered dead or dyi ng twi gs or branches in crown. .3. Many scattered dead or dyi ng twi gs or branches in crown . .4. Dead or dying twigs or branches in crown forming a definite weak spot in crown,
notably in top 1/3 of crown. . . . . . . . . . . . .5. Dead or dyi ng twi gs on branches in crown formi ng more than one weak spot or hole,
notably in top 1/3 of crown. . . . . . . . . . . . . . . . . . . .
o12
3
5
C. TOP CROWN CONDITIONS
1. No top kill i ng.0
2. 01 d top ki 11 with no progressive weakness or kill ing in green crown below 5
3. Current top killing 8
4. Broken top--recent, less than 1/3 5
5. Broken top--recent, more than 1/3 8
6. Broken top--o 1 d, no progressive weakness. 2
D. OTHER FACTORS
l. Lightning strikes--recently struck, no healing evident. .--healed strike. . . . . . . . . . . . .
3. Dendroctonus val ens attacks in base~-current, successful.-- --old, pitched out
8262
The following factors have local significance and will differ by area. We have little information ontheir importance, and the marker should weight these in terms of local observation and experience.
3.4.
Mistletoe 5.Needle scale (various spp.)
Needle bl ight (Elytroderma deformans)6. Rust (Cronartium spp.)
Risk classI
IIIII
IV
Pena 1 ty score
o1 to 4 i nc .5 to 7 i nc.8 and higher
Source: Hall (1951)
62

percentages were added and five stand (orbeetle) hazard classes were established;values less than 4 were considered veryl?w hazard and 27 or more considered veryhigh hazard. A map showed areas with vari-ous degrees of hazard (fig. 6). With thisinformation the land manager could thendirect his logging to the most hazardousstands first in order to reduce lossesuntil a normal high volume logging opera-tion could be installed.
T 43N
T 44N
T 42 N
T 41 N R 8 E
T 40 N '
::" 10. H'uoid:.~'fJ iii Mo(Jl'role Hotord::;:m IV Hir.ti Hoiord
~ V Very Hiqh Hoiord~ P,oe Cola"1
seA L E
;; - -~lJrlo! BOundor y
Figure 6. --Relative hazard is illustratedin this map of eastern Lassen County,California. (From Miller et al. 1 9~1. )
Contingent Research
After the California System was estab-lished, several studies analyzed, explained,qualified, or elaborated the principlesbehind risk; six of these are worthy ofbrief review.
Changes in Risk
The questi?n was logically asked aboutthe permanence in the risk class of a tree,i. e. does the risk of a tree tend to in-crease gradually (or quickly), does itremain fairly constant, or does it evendecrease?
Eaton (1941) initiated a photographicstudy to answer these questions. Forty-eight trees representing the four riskclasses were selected for periodic photog-raphy. Furniss (1954) reports the follow-ing results after 13 years:
Accidentally cutKilled and showed
increase in riskstill alive
5
1132
The 32 trees still alive showed as follows:
An increase in risk 2No change in risk (fig. 7A) 3A decrease in risk (fig. 7B) 27
Figure 7A. --Tree shows no change in riskfrom 1942 (left) to 1953 (right).(From Furniss 1954.)
1l
Figure 7B. --Tree shows decrease in riskfrom 1942 (left) to 1953 (right).(From Furniss 1954.)
63

others found much the same phenomenonafter reclassifying large numbers of trees.Records were not kept on specific trees,but the average risk structure of the standimproved over a period of several years.
These studies were conducted overthe same climatic cycle in which therewas a general improvement in precipi ta-tion, which is usually assumed to be afactor regulating risk. Thus, risk canbe a reversible process; but because manytrees did not show improvement, the fac-tors and processes expressed by risk maynot be simple.
In another locality, however, Furnissand Hallin (1955) found a slow change tohigh-risk trees. They recorded one high-risk tree per acre in an area 16 yearsafter all such trees had been removed.
California Flathead Borer
Incipient attacks by the borer (Mel an-ophila californica VD.) were suspected asone of the more important agents whichdetermined the condition making a treehigh risk. Substantial effort was madeto confirm these suspicions. Salman (1940)concluded from a 4-year study that incipi-ent infestations of the borer tended tooccur more frequently in trees that werekilled, and that the incidence of incipi-ents was much greater in the higher-riskclasses. However, incipient attacks couldbe found in low-risk trees. The borerappeared to be part of the whole riskphenomenon, but other factors were in-volved as well.
Crown Analysis
Since risk is based almost entirelyon crown characteristics, Wygant (1942)studied in detail these crown and stemcomponents: (1) needle fascicles pertwig, (2) needle length, (3) needlediameter, (4) annual twig growth in
length and (5) in diameter, (6) annualradial growth in different parts of thestem. For all components he found thatthe vahies for' low-risk trees were muchgreater, usually significantly so, thanfor high-risk trees (table 6). The onemeasure that did not change was needleretention. ~rees in both risk I and IVretained needles for 5 to 6 years. Otherstudies have shown that the period of nee-dle retention is largely controlled bylocal environmental conditions.
Accuracy of Risk-Rating
Though much effort was made to makerisk-rating objective and to define clas-ses as distinctly as possible, the fourclasses overlap and there is still consid-erable subjectivity in assigning trees toclasses. Thus the accuracy of comparingrisk-rating among observers or two evalu-ations by the same observer come intoquestion. Among the many studies of thisproblem, the one by Eaton (1942) illus-trates the general results. He found theagreement among expert risk-raters wasabout 80 percent, i.e. experts disagreeon the risk class of about 20 percent ofthe trees (fig. 8). He concluded that thepercent of agreement improves with experi-ence, and that there was close agreementamong experienced classifiers using allthree tree classification systems. But,inêxperienced raters used the risk systemmore accurately than the Keen or Dunningclassifications.
In commenting on Eaton's results,Keen2 reports that trained survey crewswere about as accurate as trained forestentomologists in using Keen Tree Classes,and both groups were considerably betterthan untrained rangers.
2 Personal communication to J. M.Miller, April 9, 1942, on file at PacificSouthwest Forest and Range Experiment sta-tion, P. O. Box 245, Berkeley, California,94701.
Table 6.--Average growth characteristics of 16 Risk I and of 17 Ri sk iv ponderosa pines
Top crown Mid crown 1 Lower crown2Risk i Ri sk iv Risk i Ri sk iv Ri sk i Risk iv
Number of needle fascicles per twig 197.4 119.l 188. I 108.8 173.9Needl e 1 ength in inches 6.22 4.91 6.47 4.96 6.56Needl e di ameter in mm 1.87 1.80 1.86 1. 76 1. 80Annua 1 twi g growth in inches, 1917-1940 .80 .58 .72 .57 .70Twi g di ameter in em 1. 52 1. 23 1. 38 1. 10 1. 32
Annua 1 rad i a 1 stem growth inches,1912- 1941 .0128 .0105 .0211 .0112 .0144 .0126
1 For radial stem growth this column should be headed "mid bole."2 For radial stem growth this column should be headed "stump."
Source: Wygant (1942).
64

i¡ DUNNING
~RI'SK-.-. KEEN -
::.'.'::i- .:
'. ":. :..:'- - - :: f-
:::.- - - :: - f-i-::
:::.
~L::~ .' - -
'00
~:'aoù..lt"'~ 60'""':;40~..
,,',1' 20
AEX PE R T
CEXPERiENCED
aINExPERiENCED
"Figure 8. --Frequency of agreement in twosets of tree class ratings made bymen of different experience levels,based on observations on 100 trees.(From Eaton 1942.)
These two studies, along with manyothers of the same type, illustrate thevery important point that there is stillsome imprecision in the risk system foran individual tree. However, for a stand,the effects average out, and cutting thehigh-risk trees reduces subsequent losses.
It is important to keep this impre-cision in mind when studies of individualtrees do not produce clear results. Thereis an inaccuracy in rating the tree, afurther uncertainty in risk itself, a com-pounding phenomenon of changing risk, andchanging environmental conditions whichmight override all these factors.
Brood Production
Just how the risk class of a treefunctions in the dynamics of the beetlepopulation is a basic que~t~on. C~riouslyenough, it has had surprisingly li ttleattention, probably because the systemworks so well that scientists felt it wasmore profitable to expand and refine the.use of risk rather than attempt to explainits mode of operation. It is generallyhypothesized that high-risk trees are mosteasily overcome by the beetles. But h~wdoes this influence the beetle population?
Hall (1942) recorded brood productionfrom trees of the four risk classes. Theresul ts, even though based on only fourto seven trees per risk class, are strik-ing (table 7). Emergence per square footof bark surface was 18, 24, 44, and 115beetles for Risk Classes I, I I, I I I, andiv, respectively. The ratio of attackingto emerging beetles was not measured, butthe results suggest that high risk treescan provide a source of population main-tenance and may provide a real impetus topopulation increase.
Table 7.--Emergence of adult western pine beetlefrom bark of infested trees of the fourrisk classes
Risk classTrees
samp 1 edFt2 ofbark
Tota 1
beet 1 es
emergi ng
Emer-gence
per ft2
I (low)I I (medi um)
III (high)iv (very high)
4477
29335657
510795
24886543
182444
115
Source: Hall (1942).
i f we assume an average of 12 attack-ing pairs per square foot and inflightmortality of 75 percent, only the high-risk trees would produce sufficient broodto support an increasing population. Sucha situation might exist under endemic con-di tions but might not prevail under epi-demic conditions, where the enormous bee-tle population and some overall change inhost condition could override much of theinfluence of risk.
Resin Flow
For as long as forest entomologistshave been observing bark beetles in coni-fers, they have associated attack fail~rewi th copious resin flow. Little experi-mentation was attempted, however, untilCallaham (1955) investigated resin flowfrom trees rated for risk and for Keentree classes by using permanent plot treeson the Blacks Mountain compartments. Addi-tionally, he had both Keen and Bongbergrate the permanent plot trees again. Notsurprisingly, their agreement exceeded 80percent for the risk i and i i i trees butdropped to less than 60 percent for therisk i i and iv trees. Their lack ofagreement was particularly pronounced inthe very high-risk class, i. e. iv, withone rating 25 trees and the other only 5in that class. Callaham's hypothesis wasthat low-risk trees \1ould have greaterflow of resin and, therefore, would beless likely attacked and killed. To testthis hypothesis, resin flow from a stan-dard wound was measured. Al though therewas less flow of resin from high-risktrees, mean values for the total flow ofresin were not significantly differentamong risk classes. There were signifi-cant differences in the duration of flowhowever. Resin flow from the low-risktrees, i. e. i and i I, continued much long-er than from high risk trees, i. e. i i iand iv. There was appreciable flow ofresin from low-risk trees' even after thefourth day after wounding, while resinflow from very high-risk trees had nearlystopped by then.
65

Callaham (1955) hypothesized thatthe shorter duration of resin flow fromhigh-risk trees permitted successful at-tack by the beetles while the continuedflow from low-risk trees prevented success-ful attack. Because the study was conduc-ted toward the end of the period in whichEaton (1941) and Furniss (1954) studiedchange in risk, the lack of sharp differ-ences might have been caused by some basicimprovement of tree condition prior toexternal evidence of change of risk.
SYSTEMS FOR TRUE FIRS
Risk-rating systems derived from theCalifornia System have been developed forindividual, mature red firs (Abies magnifi-ca A. Murr.) and white firs (A. concolorGord. and Glend.) ( Ferrel i 1980). Thesesystems, as yet untested, predict the prob-abili ty of tree death wi thin 5 years basedmainly on the same crown characteristicsused by the California system. The firsystems were developed by using computer-based analytical techniques f9r extensivecutover and virgin, old-growth stands ofthese firs in northern California. Forroutine field use, the systems have beenformulated on an award/penalty basis inwhich trees are awarded points based onsome characteristics, and penalized pointsbased on others.
To expedite development of prelimin-ary systems, characteristics of recentlydead and live firs, obtained during' ini-tial survey of 47 20-acre plots, werecomputer-screened and major predictors ofrisk were selected from the resulting "de-cision tree" output. Risk equations, pre-dicting I-year probabilities of tree death,were developed by regressions based on thelogistics model, then tested for goodness-of-fi t to the observed distribution of mor-tali ty in the data base. One-year proba-bili ties were extrapolated to 5-yearprobabili ties by using a variant of thestandard compound interest formula. Forfield use, the equations were translatedinto Award-Penalty Point systems based onthe signs of the predictors i regressioncoefficients. AnnulI surveys of tree mor-tali ty and decline are continuing in orderto refine the present systems, producingfinal systems capable of predicting riskover longer time periods.
SUMY AN CONCLUSIONS
The California Pine Risk Rating Sys-tem is basically a silvical principlewhich rates the current probability ofattack by insects, primarily western andJeffrey pine beetles for eastside pondero-sa and Jeffrey pine. The system is basedon the classification of individual treesby easily and quickly recognized crown
66
characteristics. When the system is util-ized as a forest management practice, itis called sanitation/salvage logging. Ithas been found to be highly effective inreducing losses by bark beetles on appli-cable forest sites. The removal of asIi ttle as 10 to 15 percent of the standvolume, as high-risk trees, reduces subse-quent losses by as much as 80 percent formore than 20 years.
The California System evolved duringthe period 1925 to 1940 in California andsouthern Oregon. It was the first risk-rating system of its kind to be developedand applied. The experiences of researchon tree selection and classification, andthe analysis of large-scale bark beetlesurveys and direct control programs formedthe background of information and atti-tudes for the research and development ofthe California system. This endeavor com-manded the whole or partial attention ofsome of the most competent forest entomol-ogists in the West. Contributions weremade by many whose names do not appear onthe cited reports and publications, throughtheir participation in meetings, consul ta-tions, and correspondence. Those earlyscientists accomplished an amazing amountof high-caliber work without many of thetools and amenities of today i s research.They also seemed to apply a fortunate bal-ance of logic and intuition along withcareful and extensive field observations.This was also the developmental periodfor the forest entomologists who did manyof the basic studies on forest insectpests in the West.
The critical study which resulted inthe formulation of the system was designedand conducted by K. A. Salman, who wasguided by results of careful research,collaboration, and testing of many scien-tists and forest managers. His study in1936 resulted in the definition of fourrisk classes, based primarily on kindsand degrees of crown deterioration. Thisformative research was followed by large-scale logging studies starting in 1937 onthe Blacks Mountain Experimental Foreston the Lassen National Forest. Thesestudies were highly successful in provingthe immediate, large, and lasting favor-able benefits of sanitation/salvage log-ging. The first use of the System by pri-vate forestry was designed by J. W. Bong-berg in 1939 for the McCloud River LumberCompany in Shasta County, California.This operation demonstrated both its effec-tiveness and ease of application. The Cali-fornia System meets most of the require-ments of a good forest practice; it iseasy to apply, is economical, and haslarge and lasting favorable benefits witha minimum of adverse environmental effects.It was adopted as a standard managementpractice by the U. S. Forest Service inRegion 5 and by many timberland owners inCalifornia and Oregon.

Three important modifications or de-rivatives of the System are a stand hazardclassification system, a penalty scoringprocedure, and an award/penalty systemfor risk rating true firs. The stand haz-ard classification uses risk-rating valuesof a stand and the recent past experienceof insect-caused losses to rate the rela-tive need of areas for pest managementattention, either surveyor control. Thatis, hazard rating is a guide to the re-source manager to target or intensify sur-veillance or to direct his sani tation/salvage operation. The penalty scoringprocedure was designed to train timbermarkers and to increase the ob j ecti vi tyof risk rating by assigning numerical pen-al ties to easily recognized tree charac-teristics. The sum of the penal ties deter-mines the risk class of a tree. The awardlpenal ty system for risk rating individualtrue firs uses the principles and proce-dures developed by the California Systemand can be considered a derivative of it.
In 1962, efforts were made to definemore clearly the risk classes through theuse of several types of recently developedstatistical procedures. The results ofthe analysis did not improve the defini-tion or identity of the risk classes.However, recently developed analyticalprocedures using computers were effectivelyused in the work on true fir.
Subsequent research has attempted toexplain the System and its mode of opera-tion in the dynamics of the tree and thebeetle. One study showed the expressionof crown deterioration was largely a func-tion of size, growth, and position of nee-dles and twigs. Another study showed thatthe duration of xylem resin flow was short-er for high-risk trees than for low-risktrees. Also, high-risk trees producedthe largest number of beetles. The riskclassification of a tree can change overlong periods; some trees showed improve-ment, others showed decline. Anotherstudy showed the accuracy and repeatabilityin rating the risk class of trees is in-creased by experience.
Al though risk rating is based on indi-vidual trees, it appears to function mosteffectively on an area basis. This isprobably caused by the compensating actionof such factors as imprecision of defini-tion, inaccuracy in rating, changes inrisk, overall shifts in environmental con-di tions, and the spatial and temporalfluctuations in beetle populations.
The System has been widely appliedvia sanitation/salvage logging on privateand public forests of the eastside pinetype of northeastern California and south-ern and eastern Oregon. In many areasthe System has been effectively hybridizedwi th the Keen Tree Classes. The extentof its use is difficult to determine, but
there may be 3 to 5 million acres of ap-plicable forests which have been processedto some degree by sani tation/sal vage log-ging. Also, it has been found to be gener-ally applicable to ponderosa and Jeffreypine stands that are under long-termstress; such stands occur in southern Cal-ifornia and intermountain regions of Mon-tana and Idaho. The System may be morewidely used than direct evidence can showbecause the terms risk and sani tation/salvage or derivatives of them are nowstandard terminology in forest practice;thus, the principles of the CaliforniaSystem may be applied without the con-scious effort to identify the System.
The California Risk Rating System isone of the more notable developments inforest insect control because of its in-trinsic value. It has also been of in-estimable extrinsic value in demonstratingthe possibilities of utilizing insect/hostrelationships in pest control for a widevariety of insects.
It would seem advisable to close withan air of optimism and hope for futurerisk-rating systems. But we have chosento close with a precautionary note as ex-pressed by Craighead et al., (1931) asthey concluded about bark beetle controlin general.
However, at least one outstanding conclusionapplies to the entire matter, (of bark bee-tle control) and may be stated as follows:Each species of bark beetle presents its ownspecial problem and must be dealt with dif-ferent ly from other speci es as to controlmethods and strategy, and even the same spe-cies may present problems which differ indifferent regions. The management of controlope rat ions must therefore vary accordi ng tolocal conditions within the area being pro-tected.
ACKNOWLEDGMENTS
We would like to acknowledge the re-view of the manuscript by Philip C. John-son, Malcolm M. Furniss, George R. Stru-ble, Philip A. Briegleb, and Charles Sart-well, and the use of the unpublished dataof J. W. Bongberg, Robert Z. Callaham,Charles B. Eaton, Malcolm M. Furniss,Philip C. Johnson, F. P. Keen, J. M. Mil-ler, H. L. Person, K. A. Salman, George R.Struble, and Noel D. Wygant. We are deep-ly grateful for and appreciative of theircontributions. It is quite obvious thatwi thout these the scope and depth of thisreview would not have been possible.
67

LITERATU CITED
Bongberg, J. W. 1939. Loss preventionstudies Blacks Mountain ExperimentalForest, Season 1938. 11 p. *
Bongberg, J. W. 1942. Descriptions andillustrations of risk ratings forponderosa and Jeffrey pine in east-side areas of California. 7 p. *
Bongberg, J. W. 1947. Experimental cut-ting for beetle control at McCloudRiver Lumber Company. The Timberman48(7):128-130.
Bongberg, J. W. 1949. Results of tenyears of bark beetle control by log-ging high risk trees, Blacks MountainExperimental Forest, Lassen County,Calif. 18 p. *
Callaham, R. Z. 1955. Oleoresin produc-tion in the resistance of ponderosapine to bark beetles. 84 p. *
Craighead, F. C. 1925.problem. J. For.
The Dendroctonus23 (4): 340-354.
Craighead, F. C., J. M. Miller, J. C. Even-den, and F. P. Keen. 1931. Controlwork against bark beetles in westernforests and an appraisal of its re-sui ts. J. For. 29-1001-1018.
Dunning, D. 1928. A tree classificationsystem for the selection forests ofthe Sierra Nevada. J. Agric. Res.36: 757-771.
Eaton, C. B. 1941.of risk trees.
A photographic study5 p. *
Eaton, C. B. 1942. Variation in the ap-plication of tree classification sys-tems to ponderosa pine. 13 p. *
Eaton, C. B. 1959. Insect-caused mortal-i ty in relation to methods of. cuttingin ponderosa pine on Blacks MountainExperimental Forest. 33 p. U.S. Dep.Agric. For. Serv., Tech. Pap. PSW-243.Pacific Southwest For. Range Exp.Stn., Berkeley, Calif.
Ferrell, G. T. 1980. Risk-rating systemsfor mature red fir and white fir innorthern California. 29 p. U.S. Dep.Agric. For. Serv., Gen. Tech. Rep.PSW-39. Pacific Southwest For. RangeExp. stn., Berkeley, Calif.,
Furniss, M. M. 1954. A photographic studyof the change of insect risk in pon-derosa pine. 11 p. *
Furniss, M. M., and W. E. Hallin. 1955.Development of high-risk trees in pon-derosa pine and Jeffrey pine standsfollowing sani tation/sal vage cutting.
68
2 p. U.S. Dep. Agric. For. Serv.,For. Res. Note 94. Calif. For. RangeExp. Stn., Berkeley.
Hall, R. C. 1942. High risk trees arehigh producers of western pine bee-tles. 2 p.*
Hall, R. C. 1951. Penalty system forrating high-risk trees: eastsideponderosa and Jeffrey pine. 1 p. *
Hall, R. C. 1958. Sanitation/salvagecontrols bark beetles in southernCalifornia recreation areas. J. For.56(1):9-11.
Hall, R. C., and J. R. Pierce. 1965. San-i tation treatment for insect control.21 p. *
Johnson, P. C. 1949. Determining thebark beetle hazards of pine stands innortheastern California. J. For.47(4):277-284.
Johnson, P. C. 1951. Application of riskratings for western pine beetle con-trol in the Inland Empire. NorthwestScience 25: 32-37.
Bark beetle risk inpine forests in32 p. U. S. Dep.Res. Pap. INT-119.Range Exp. Stn.,
Johnson, P. C. 1972.mature ponderosawestern Montana.Agric. For. Serv.,Intermountain For.Ogden, Utah.
Keen, F. P. 1936. Relative susceptibil-i ty of ponderosa pines to bark beetleattack. J. For. 34(10):919-927.
Keen, F. P. 1940. Pine beetle controllogging experiment on the Weyerhaeu-ser Timber Company, Bly District,Oregon. 20 p. *
Keen, F. P. 1942 . Second year's resul tson the pine beetle control loggingexperiment of the Weyerhaeuser TimberCompany, Rail Glade area, Bly Dis-trict, Oregon. 12 p. *
Keen, F. P. 1943. Ponderosa pine treeclasses redefined. J. For. 41 (4) :249-253.
Keen, F. P. 1954. Ponderosa pine treecharacteristics indicative of highrisk to pine beetle attack: a prog-ress report on studies conducted ineastern Oregon, 1938-1952. 49 p.*
Keen, F. P. 1955. Thirteen years' re-suI ts of a test of pine beetle con-trol logging by the Weyerhaeuser Tim-ber Company, Swede Cabin Area--BlyDistrict, Oregon, 1941-1953. 11 p.*

Keen, F. P., and K. A. Salman. 1942. Prog-ress in pine beetle control throughtree selection. J. For. 40(11):854-858.
Miller, J. M. 1926a. The western pinebeetle control program. J. For.24 (8) : 897-914.
Miller, J. M. 1926b. Report of westernpine beetle studies and experimentson the Cascadel Unit, North Fork,California. 9 p. *
Miller, J. M. 1933. A record of winterkill of western pine beetle in Cali-fornia. J. For. 443-446.
Miller, J. M., K. A. Salman, and P. C.Johnson. 1941. Bark beetle hazardsin pine stands of northeasternCal i forni a: Part I I, Methods andbasic data. 277 p. *
Miller, J. M., and F. P. Keen. 1960. Bi-ology and control of the western pinebeetle. 381 p. U.S. Dep. Agric. For.Serv., Misc. Publ. 800.
Orr, T. J., Jr. 1945. Selecti ve markingin ponderosa pine on a Klamath Fallstree farm. J. For. 43:738-741.
Person, H. L. 1926. Report on studies ontree selection by the western pinebeetle. 15 p. *
Person, H. L. 1928. Tree selection bythe western pine beetle. J. For.26(5):564-578.
Person, H. L. 1931. Theory in explana-tion of the selection of certaintrees by the western pine beetle. J.For. 29(5):696-699.
Salman, K. A. 1932. Results of an ex-perimental cutting in the TimberMountain sample plot, Modoc NationalForest. Prog. Rpt. Season 1931.7 p. *
Salman, K. A. 1937. Preliminary results:Test markings of tree susceptibility.5 p. *
Salman, K. A. 1938. Insect hazards tothe pine resources of northeasternCalifornia. 8 p.*
Salman, K. A. 1940. A preliminary studyof the diameter growth of ponderosapine and of some of its relationswi th risk and incipient infestationsof the flathead borer, (Melanophilacal ifornica VD.). 33 p. *
Salman, K. A., and J. W. Bongberg. 1942.Logging high-risk trees to controlinsects in the pine stands of north-eastern California. J. For. 40 (7):533-539.
Sowder, J. E. 1951. A sanitation/salvagecutting in ponderosa pine, PringleFalls Experimental Forest. 24 p. U. S.Dep. Agric. For. Serv., Res. Pap.PNW-2. Pacific Northwest. For.Range Exp. Stn.
Struble, G. R. 1942. Cascadel tree selec-tion plot: a study of tree selectionby the western pine beetle, final re-port. 22 p. *
wickman, B. E., andC. B. Eaton. 1962.The effects of sanitation/salvagecutting on insect-caused mortality atBlacks Mountain Experimental Forest,1938-1959. 39 p. U.S. Dep. Agric.For. Serv., Tech. Pap. 66. Paci ficSouthwest For. Range Exp. stn., Ber-keley, Calif.
Wygant, N. D. 1942. Studies of physicalcharacteristics of high and low riskponderosa pine, Black's Mountain Ex-perimental Forest, Season of 1 a41.19 p. *
*Unpublished report on file at PacificSouthwest Forest and Range Experiment Sta-tion, P. O. Box 245, Berkeley, California94701.
69
C/f ¡?117t? /2/~/c. ~AT//V& .s y-51 t--l E f! .5I'ITIf ¿r~
IN Hazrd-Rating SystemsIn Forest Inse Pest Management:Symposium Proceedings
Athens, Georgia, July 31-August 1,1980
Technical Coordinators:
Roy L. HeddenCollege of Forest and Recreation ResourcesClemson University
Stanley J. BarrasSouthern Forest Experiment StationForest Service, U.S. Dept. of Agriculture
Jack E. Coster
Division of ForestryWest Virginia University
Sponsored jointly by theSociety of American Foresters, Entomology Working Group;The Forest Service, U. S. Department of Agriculture;andThe University of GeorgiaDepartment of EntomologySchool of Forest ResourcesCenter for Continuing Education
lb1 fP
General Technical Report WO-27U.S. Department of Agriculture,Forest Service
August 1981


![Abstract arXiv:2006.10042v1 [cs.CV] 17 Jun 2020 · Univ. of Southern California liushich@usc.edu Yi Ma Univ. of California, Berkeley yima@eecs.berkeley.edu Abstract 3D reconstruction](https://img.pdfslide.us/doc/110x75/5fc9fcab11d0cf0edc6279e5/abstract-arxiv200610042v1-cscv-17-jun-2020-univ-of-southern-california-liushichuscedu.jpg)