Embed Size (px)
Citation preview

ABSTRACT
Paul Vogt Magnus Yale University
1988
The energetics and the rates of the various nuclear reaction chains active in stars play a critical role in the stars' evolution and in the isotopic abundances resulting from this nucleosynthesis. One can therefore gain information about the structure and evolution of stars by examining these nuclear reaction chains and the resulting elemental and isotopic abundances.
The abundances of a number of isotopes (e.g., 13C and 15N) point to the importance of explosive hydrogen burning which takes place on time scales which are short compared to the relevant beta-decay lifetimes . Explosive hydrogen burning is expected to occur at high temperatures (T>2xl08K) in many astrophysical environments such as super-massive stars, accreting neutron stars, red giants with neutron star cores, novae, and supernovae. In these environments it is usually assumed that hydrogen burning occurs via the Hot-CNO (HCNO) cycle which is responsible for the observed abundance of 15N. At sufficiently high temperatures, however, the 150(a,y)19Ne reaction can break the H C N O cycle and initiate a reaction chain called the rapid-proton capture (rp) process. The rp process transforms C N O nuclei to heavier nuclei (up to iron and nickel) by a chain of successive proton captures and beta decays. Hydrogen and helium-burning reactions, including the 150(oc,y)19Ne breakout reaction and the subsequent rp process, are thought to be the energy source for novae on the surface of accreting neutron stars and are possibly responsible for the unusual concentrations of heavy elements recently observed in novae.
The 150(a,Y)19Ne Reaction Rate and the rp Process
At astrophysically important temperatures, the 150(a,y)19Ne reaction rate is determined by the properties of several resonances just above the alpha- particle threshold in 19Ne (Ecm<1.2 MeV). This thesis involves a series of experiments which determine the reaction rate for the lsO(a,y)19Ne reaction by measuring the properties of these resonances. The 15N(a,y)19F reaction has been measured to directly determine the resonance strengths of two mirror resonances in 19F, isospin analogs of two of the important resonances in 19Ne. With appropriate corrections for the different coulomb barriers for these nuclei, these strengths determine the alpha-particle widths of their analog lsO+a resonances in 19Ne. The alpha-particle branching ratios for these two resonances in 19Ne were also determined more directly by measuring the 19F(3He,t)19Ne*(a)150 coincidence reaction. The combination of these two results determine the contribution of these two resonances to the 150(a,y)19Ne reaction rate.
The 150(a,y)19Ne Reaction Rate and the rp Process
A Dissertation Presented to the Graduate School
ofYale University
in Candidacy for the Degree of Doctor of Philosophy
ByPaul Vogt Magnus December, 1988
ACKNOWLEDGEMENTS
The completion of this thesis was possible, and my stay in graduate school was made very enjoyable because I had the opportunity to work with and become friends with many people who I would like to acknowledge here.
I am most indebted to my advisor Peter Parker who is always full of good ideas, encouragemant and an infinite amount of patience. Many thanks also to Art Champagne, Al Howard, Michael Smith and Tzu-Fang Wang who along with Peter contributed months of time to discussions, planning, set up, and data collection, and who also allowed me to get involved with their work. Collaborating with them has been beneficial not only in terms of the quality of work I was able to do and the quality of education I received, but also has made physics simply lots of fun. I would also like to thank Professor D. Allan Bromley for providing the support which enabled me to carry out this research.
I also greatly benefitted from the time I spent with Nick Tsoupas (my "interim advisor" while Peter was arguing with local 34.) The work we did together on the split pole was both educational and fun. I regret only that I was not able to make a measurement with the spectrograph for this thesis.
I would also like to thank the staff at W N S L for providing a excellent research environment: John Baris, Tom Barker, Dee Berenda, Rite Bonito, Joe Cimino, Ray Comeau, Phil Clarkin, Karen DeFelice, Teddy Duda, Charles Gingell, Nitza Hauser, Al Jeddry, Tom Leonard, Don McDuff, Al Ouellette, Kenzo Sato, Mary Anne Shulz and Richard Wagner.
There are many other people I would like to thank for many kinds of help. In approximate order of our meeting they are Sara Batter, Kevin Hubbard , Paul Cottle, Steve Sanders, Bronek Dichter, Anna Hayes, Steve Sterbenz, Bob Weller, Laurie Baumel, Moshe Gai, Jolie Chisevski, Bill Moore, Richard Azuma, Chip Campbell, J.D. King, J. Vise, John McKay and Richard Hyder. A special thanks to Bronek who showed me the ropes my first summer at WNSL.
I would like thank my family, especially my m o m and dad who have spent the last thirty years of their lives reaching out in every possible way to make the lives of their kids more meaningful and enjoyable.
Finally I would like to thank my wife Toko for being so supportive and patient.
Table of Contents
I. IntroductionA) Orientation.......................................... 1B) Nucleosynthesis in novae............................... 4
n. Theoretical CalculationsA) Calculation of reaction rates............................. 11B) Present knowledge of mass 19........................... 12C) Calculation of reaction rate for 150(a,y)19N e ................ 14
III. The ExperimentsA) Selection of reactions................................... 21B) 15N(a,y)19Fi. Target preparation-.................................... 22ii. The 15N(a,y)19F measurement........................... 24iii. Analysis of 15N(a/y)19F ............-......— ......... 25
C) 19F(3He,t)19Ne*(a)150i. Selection of the population reaction....................... 28ii. Target preparation.................................... 30iii. The experimental set up and measurement................ 31iv. Analysis of 19F(3He,t)19Ne*(a)150 ....................... 36
IV. Conclusions............................................ 53References 63
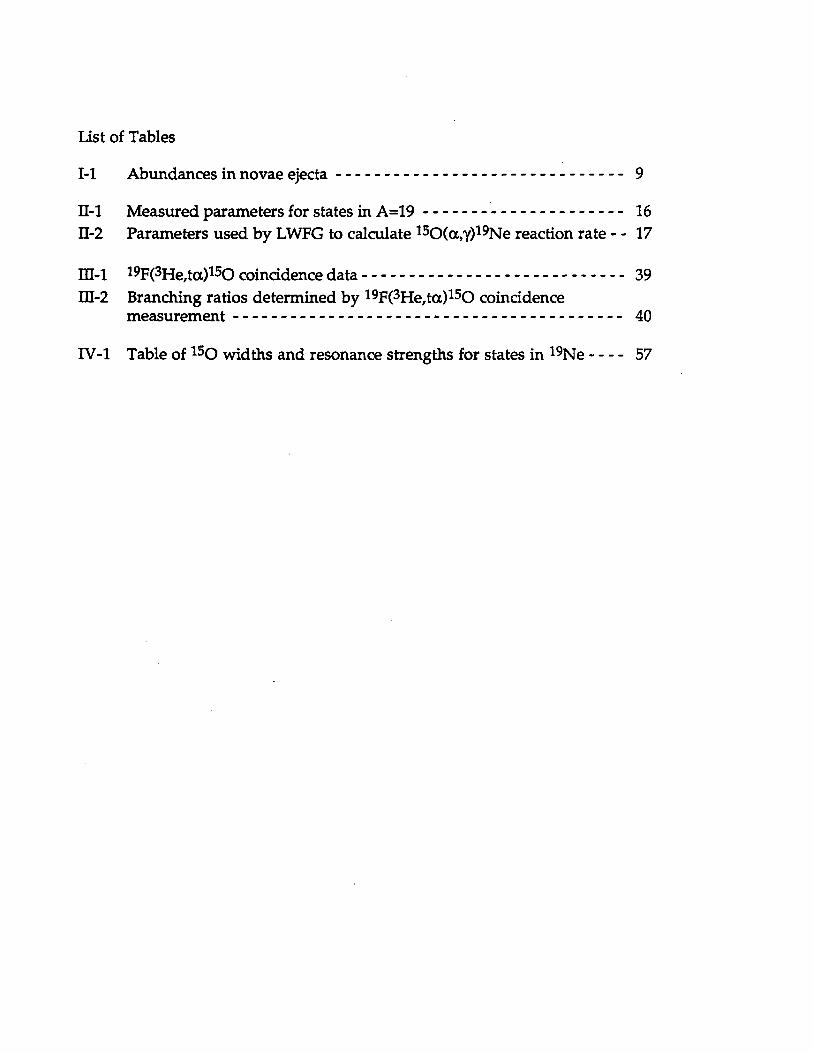
List of Tables
1-1 Abundances in novae ejecta .......................... 9
H-l Measured parameters for states in A=19...................... 16H-2 Parameters used by LWFG to calculate 150(a,y)19Ne reaction rate - - 17
m-1 19F(3He,ta)lsO coincidence data..............................39m-2 Branching ratios determined by 19F(3He,ta)150 coincidence
measurement.......................................... 40
IV-1 Table of 150 widths and resonance strengths for states in 19N e 57
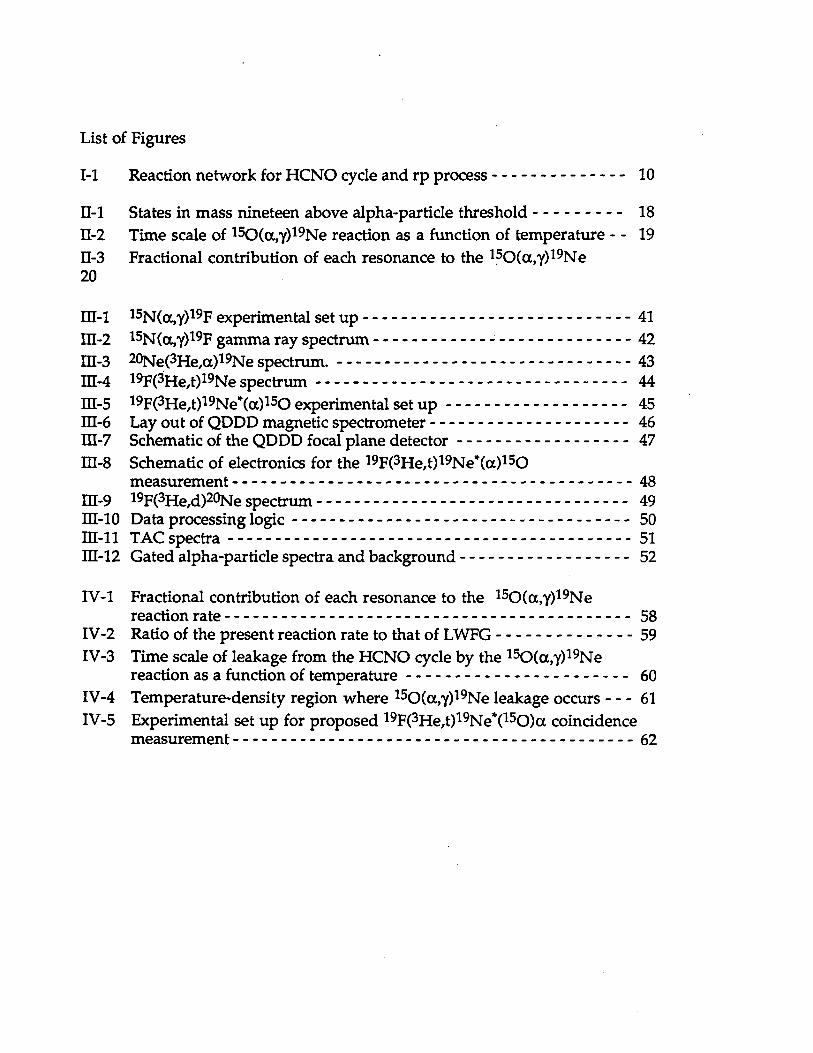
List of Figures
n-1 States in mass nineteen above alpha-particle threshold......... 18H-2 Time scale of 150(a,y)19Ne reaction as a function of temperature - - 19H-3 Fractional contribution of each resonance to the l30(a,y)19Ne20
m-1 15N(a,y)19F experimental set up............................. 41m-2 l5N(a,y)l9F gamma ray spectrum............-............... 42m-3 20Ne(3He,a)19Ne spectrum. ................-..........43m-4 19F(3He,t)19Ne spectrum....... -................ 44m-5 19F(3He,t)19Ne*(a)150 experimental set u p .................... 45IE-6 Lay out of Q D D D magnetic spectrometer................ 46HI-7 Schematic of the Q D D D focal plane detector------------------- 47m-8 Schematic of electronics for the 19F(3He,t)19Ne*(a)150
measurement................. 48m-9 l9F(3He,d)20Ne spectrum................ -........... 49m-10 Data processing logic..................................... 50m-11 TAC spectra .......... 51IH-12 Gated alpha-particle spectra and background ............. 52
IV-1 Fractional contribution of each resonance to the 150(a,y)19Nereaction rate.............................................58
IV-2 Ratio of the present reaction rate to that of L W F G ............... 59IV-3 Time scale of leakage from the H C N O cycle by the lsO(a,y)19Ne
reaction as a function of temperature......................... 60IV-4 Temperature-density region where lsO(a,y)l9Ne leakage occurs 61IV-5 Experimental set up for proposed 19F(3He,t)19Ne*(150)a coincidence
measurement............................................ 62
1-1 Reaction network for H C N O cycle and rp process............. 10
1) IntroductionA) Orientation
Two key problems in nuclear astrophysics are the generation of energy and the nucleosynthesis of the elements. It is currently believed that all of the elements, other than hydrogen, helium and traces of lithium, have been synthesized as a product of nuclear reactions in stars. The energetics of the reaction chains active in a star play a critical role in determining that star's evolution. One can therefore gain information about the structure and evolution of stars by examining the abundances of various elements and isotopes and by studying the nuclear reactions that may have generated them. Abundance data come from many sources including measurements of the composition of the earth's crust, meteorites, the solar wind, the surface of the sun, cosmic rays, and the radiation from distant stars. A great deal of effort has been put into determining the "solar abundances", the fraction of the total mass in the solar system accounted for by each isotope of each element.It is unlikely that the solar abundances accurately reflect the composition of the entire galaxy in detail since it is unlikely that this material is always produced under identical conditions or is uniformly mixed; some of the abundances observed are no doubt due to local deviations. It is possible that the sun has twice the heavy element abundance of the galaxy as a whole, due to a nearby supernova that might have triggered the collapse of the presolar nebula to form the solar system (Sc83). The solar abundances do, however, give us our most detailed and accurate reference point for the general composition. A great deal of success has been made in determining what nuclear reaction chains produce the elements observed and what
astrophysical sites they occur in, but much work still needs to be done, especially in the area of non-equilibrium, explosive hydrogen burning.
There are many astrophysical environments where hydrogen is expected to bu m explosively in conditions of extremely high temperature and density ( including super-massive stars (Fr74), the surfaces of accreting neutron stars (novae) (Ta79), red giants with neutron star cores (Th75), novae, and super novae (St74)). One process by which such burning occurs is the Hot-CNO (HCNO) cycle which processes hydrogen into helium. This is the same as the traditional C N cycle of Bethe (Be39) and von Weizsacker (We38) except that 13N captures a proton instead of beta decaying (figure 1-1). The H C N O reaction chain is
12C(p/y)13N (p,Y)140(e+ve)14N (p,Y)150(e+ve)15N (p,a)12C.If the temperature and density are high enough, the 140 and lsO beta decays will be the the slowest reactions in the H C N O cycle. Consequently, at any given time most of the catalyst nuclei will be in the form of lsO and 140 , and the rate at which energy is produced by the process will be limited by these beta decay lifetimes. There are other reactions that will be branches on the H C N O cycle such as
140(a,p)17F(p,Y)18Ne(e+ve)18F(p,a)150 and 15N(p,Y)160(p,Y)17F(p,Y)18Ne(e+ve)18F(p,a)150
which will result in the production of other nuclei, but no products of mass greater than 18 would be expected to be formed. The products of such an explosion would predominantly be 140,150, and any other C N O nuclei which did not have time to proton capture. (The exact abundances would depend on the details of the primary composition, the temperature and density, the H C N O proton capture rates, and the time scale of the explosion.) The 140 and 15Q would then decay to form 14N and 15N with very different relative
abundances than are produced in the normal C N O cycle. One piece of evidence that points out the importance of hot hydrogen burning is the abundance ratio of 14N to 15N in the solar system [14N]/[15N] = 2.8xl02. The C N cycle, which is responsible for production of most of the 14N, produces 14N and 15N in a ratio of [14N]/[15N] « 105, whereas the H C N O cycle produces them in the ratio [14N]/[15N] * 0.5. Understanding explosive hydrogen burning clearly will shed light on the nucleosynthesis of 15N.
Carbonaceous chondrites are considered to be the solar system material which has undergone the least amount of chemical processing during the years since the origin of the solar system, and they are hence commonly used as the baseline for relative isotopic abundances (Ca83,Su52). Black and Pepin (B169) were the first to observe large (relative to solar abundances) amounts of 22Ne in carbonaceous chondrites [20Ne]/[22Ne] <0.34 (8.2 is the solar ratio (Ca82)). Chondrites Murchison (Sr78,A179), Dimmitt (Ni77) and Orgueil (Eb79) have also exhibited similar enrichments. It is thought that this neon was synthesized in an astrophysical event that did not contribute to the presolar nebula, but was carried into the solar system trapped in presolar grains (B172,Sm78). Recent measurements of cosmic rays also show an enhancement of 22Ne relative to 20Ne (Wi82). Though the history of material in cosmic rays is not well understood, it is possible that the relative isotopic abundances in cosmic rays is a better representation of galactic composition than the solar system abundances. This raises the question of what astrophysical environment would produce such abundance ratios. As will be shown in the next section explosive hydrogen burning is a good candidate for such a production site.
Novae are a good laboratory in which to examine explosive hydrogen burning because they are one of the best understood of the astrophysical
environments where explosive hydrogen burning occurs and explosive hydrogen burning is thought to be the dominant energy producing mechanism for those events. Recently, amounts of Ne, Na, Mg, and Al in excess of the solar abundances have been observed in the ejecta of novae, Aguilace 1982 (Sn84), Vulpeculae (Ge86), CrA81 (Wi85) and V1500 Cyg 1975 (Fe78). The amounts of various elements ejected from recent novae are listed in table 1-1. The abundance determinations were made by looking at infrared emission lines. (Sn84) and (Wi85) made their observations using the IUE satellite, and (Ge86) using the Wyoming bolometer and the Wyoming infrared telescope. These abundances are in excess of those predicted by the current models for novae, by factors of up to 100. Some new input into these models is necessary in order to understand the observations.
B) Nucleosynthesis in Novae
Novae occur in binary systems where a white dwarf accretes matter , typically 10'9 to 10-8 M q per year, from a companion star via overflow of the Roche lobe. When a sufficient amount of material, typically 10*5 to 10*3 Mq, has accumulated, the envelope ignites and explodes, throwing material into the interstellar medium. When calculating the expected composition of the material ejected from such an event, one needs to know the mass, composition, and intrinsic luminosity of the white dwarf, as well as the composition of the accreted material and the degree to which the accreted material is mixed into the material of the white dwarf. Because it is coming from the outer envelope of a younger star, it is reasonable to assume that the accreted material is solar-like, that is, it is predominantly hydrogen (=80%) and helium (=20%) with traces of heavier (predominantly CNO) elements
mixed in. The white dwarf is thought to be composed predominantly of carbon and oxygen, because they are the core remnants of burned out stars that were light enough so that electron degeneracy provided sufficient pressure to prevent the star from compressing enough to ignite carbon burning. A star heavy enough to ignite carbon burning is expected to develop such a heavy core that it will undergo gravitational collapse, causing a supernova and producing either a neutron star or a black hole. The mass of the white dwarf must be less than 1.4 M q , otherwise the electron degeneracy could not have prevented further collapse under gravitational contraction.
Since novae explosions are believed to be powered by the H C N O cycle, using the carbon and oxygen from the white dwarf to catalyze the accreted hydrogen into helium, and since the H C N O cycle produces no nuclei heavier than mass 18 (and little is expected to be present initially), this would leave the origin of the heavier (Ne,Mg,Al) elements recently observed in the material ejected from novae unaccounted for.
There are currently two plausible theories of how heavier nuclei could be produced in novae. The first is that the white dwarf is the core remnant of a heavier star that has undergone carbon burning, (leaving the core material mostly as oxygen neon and magnesium), but whose core did not become heavy enough to collapse (Tr83). For such a scenario to occur the star would have to transfer much of its mass to its companion star after carbon burning but before gravitational collapse (La83). It has been estimated that =3% of white dwarves in binaries will be the product of such a scenario (Ib84). Such a star will be predominantly composed of oxygen, neon and magnesium and hence is called an O-Ne-Mg white dwarf. An explosion on the surface of such a star will produce nuclei in the mass ranges of O, Ne and Mg. The detailed composition of the resulting material will depend on the details of the proton
capture rates. One calculation indicates that a O-Ne-Mg white dwarf can not explain the A>19 abundance problem because the Ne will be processed to heavier nuclei (Wi86). This, however, is a matter of current debate.
The second plausible explanation for the creation of masses greater than 20 in novae is that a break-out of the H C N O cycle can occur. If temperature and density are extreme enough, this cycle may be altered by the 140 +a and lsO+a reactions (Wa81,La86). These are the reactions that will first alter the cycle because hydrogen and helium are the only species of significant abundance for the H C N O seed nuclei to react with and because 15F and 16F (the products of 140+p and lsO+p) are proton unstable. If 140 were to react with an alpha particle the H C N O cycle would change to
12C(p,Y)13N(p,Y)140(a,p)17F(p,Y)18Ne(e+ve)18F(p,a):l50(e+Ve)15N(p,a)12C.
The net result of this is that the beta decay of 140 (102 sec) is bypassed, and the rate of energy production of this cycle is limited only by the lsO beta lifetime (176 sec) and is hence 60 percent faster than the H C N O cycle. [The beta decay life time of 18Ne is 1.67 sec and hence does not slow the cycle appreciably.] If lsO were to capture an alpha particle the most likely result would be a break from the H C N O cycle via
15O(a,Y)19Ne(p,Y)20Na.[It should be noted that it is not entirely clear if *9Ne will beta decay leading
to the sequence l9Ne(P+ve)l9F(p,a)160 or if it will proton capture; however, the most recent estimate (Wi87) of the 19Ne(p,Y)20Na reaction rate predicts that under conditions where 150(<x ,y) leakage occurs, 19Ne(p,Y) will compete favorably with 19Ne(J3+ve).]
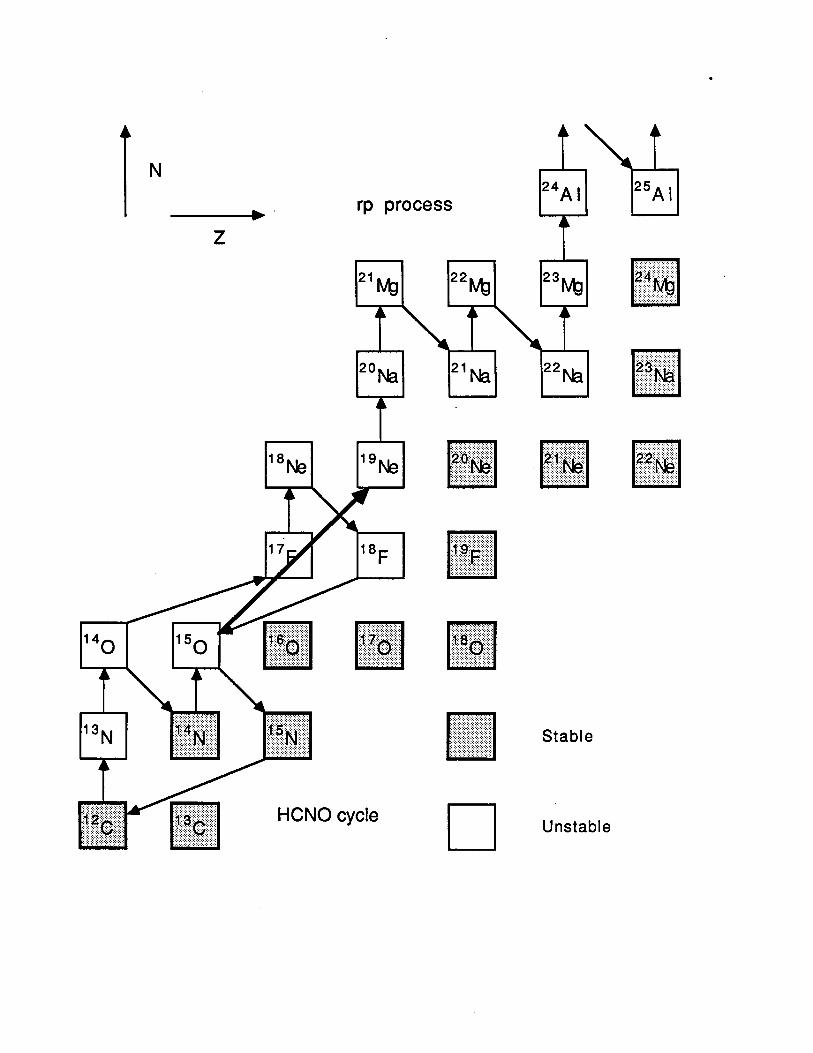
There will be two important consequences if the 15O(a,Y)19Ne(p,Y)20Na sequence occurs. Once 20Na has been formed there is no sequence of reactions which will convert the seed nucleus back into a nucleus with mass less than 20, and hence an excess of nuclei above mass 20 will be produced. Secondly the rate of energy production will no longer be limited by the slow beta decay of 140 and lsO, and under certain conditions the energy generation of the resulting reaction sequence will exceed the energy generation rate of the H C N O cycle by a factor of 100 (Wa81). After 19Ne captures a proton, a sequence of rapid proton captures and beta decays can occur which would produce elements above mass twenty (Wa81). This process has been named the rp process and under extreme conditions will process C N O nuclei all the way to mass 56.
The break out of the H C N O cycle and the subsequent rp process will play an important role in many of the other hydrogen burning environments as well. For novae involving accreting neutron stars where temperatures are higher than in white dwarf novae, it is thought that the rp process drives the explosion (Ta79) which is observed as an X-ray burst.
It is possible that novae contribute a significant amount of the 22Ne observed in the interstellar medium. If for example a nova explosion occurs in which the temperature gets high enough for the 15O(a,Y)19Ne(p,Y)20Na leakage to occur ,then the reaction sequence
l5O(a,Y)19Ne(p,Y)20Na(p,Y)21Mg(e+ve)21Na(p,Y)22Mg(e+Ve)22Na might produce 22M g and 22Na which, upon ejection into the interstellar medium, would beta decay into 22Ne. The amount of 22Ne produced will depend on the details of all the particle capture rates of various nuclei and the temperature-density profile of the explosion.
In order to make accurate determinations of energy production and element synthesis in explosive hydrogen burning, many nuclear reaction rates must be determined. In particular the 150(a,y)19Ne breakout reaction plays the critical role bridging the gap between the H C N O cycle and the rp process. Because the properties of the important resonances had not been measured in *9Ne or its isospin mirror 19F, all previous determinations of the rate of the 150(a,y)19Ne reaction have been based on calculations based on nuclear systematics. The object of the present thesis is to determine the rate of this reaction experimentally, by measuring the properties of these resonances.
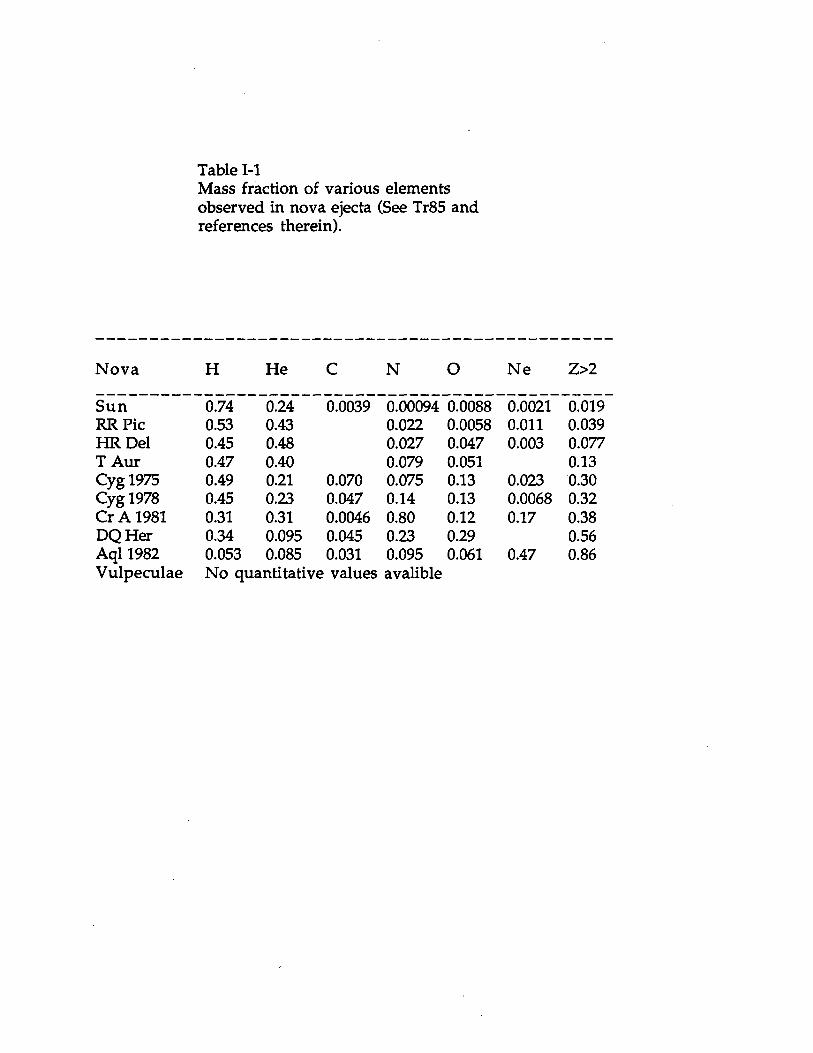
Table 1-1Mass fraction of various elements observed in nova ejecta (See Tr85 and references therein).
Nova H He C N O Ne Z>2
Sun 0.74 0.24 0.0039 0.00094 0.0088 0.0021 0.019RR Pic 0.53 0.43 0.022 0.0058 0.011 0.039H R Del 0.45 0.48 0.027 0.047 0.003 0.077T Aur 0.47 0.40 0.079 0.051 0.13Cyg 1975 0.49 0.21 0.070 0.075 0.13 0.023 0.30Cygl978 0.45 0.23 0.047 0.14 0.13 0.0068 0.32Cr A 1981 0.31 0.31 0.0046 0.80 0.12 0.17 0.38DQHer 0.34 0.095 0.045 0.23 0.29 0.56Aql 1982 0.053 0.085 0.031 0.095 0.061 0.47 0.86Vulpeculae No quantitative values avalible

Figure 1-1Schematic of the H C N O and rp process reaction networks. The H C N O cycle is in the lower left handcomer. The 150(a,y)19Ne breakout reaction is shown by the heavy arrow, and the first few steps of the rp process are in the upper right hand corner.
A
N
a\
1
-------► ' rp process 24a i 26a i
21 Mg ‘ Mg
v r \Mg
20 Na 21 Na 22 Na
24Mg
23 Na
20 Ne 21 Ne 22 Ne
i x r \HCNO cycle
V
/18f 19p
o<o
17o 18o
Stable
Unstable
11
II) Theoretical CalculationsA) Calculation of Reaction Rates
The reaction rate of a two-body process is given by the product of the number densities of the two species with their relative velocities and the cross section of the reaction
R = Na Nb Vrel o(v).
Low energy capture reactions, such as 150(a/y)19Ne, can be described as happening through one of two mechanisms, direct capture or resonant capture. Direct capture is the process whereby a particle from the continuum interacts with the electromagnetic field of the target nucleus and emits a photon to form a bound system. It is the inverse of photo-disintegration in which a photon is absorbed by a bound system which then dissociates into two parts. A resonance reaction, on the other hand, proceeds through the strong interaction and occurs at those "resonant energies" for which the wave function of the compound system is a maximum at the nuclear surface.
Previous calculations (Wa81,La86) of the 150(a,y)19Ne reaction rate indicate that at the energies of astrophysical interest, this rate is expected to be dominated by the contribution of several resonances. To calculate the stellar reaction rate that results from a particular resonance at a particular temperature, a Maxwellian velocity distribution (because the nuclei are far from degenerate) is integrated over a Breit-Wigner resonance cross section.
<ov> =
0
/ W j , rarY 2 e f e lV n ’dt“ (E-ER)2+(r/2)2V;kT exK:kTJ(kTE)i/2dE
In the case of 150(a,y)19Ne, the width of the resonance T is so small (r < 10* ^v) compared to the energy dependence of the Maxwellian velocity
distribution that the result of this integral is given by the narrow resonance expression (C183)
Here N x are the number densities of the reactants 11 is the reduced mass G> = (2Jr+l)/(2Ja+l)(2Jb+l)Y = r i r f/ r T
Ja,Jb,Jr are the spins of the two reactants and the resonance r+rfXT are the partial widths of the resonance to the incoming and
outgoing channel and the total width of the resonance.If the resonances are well separated (as they are in the 150(oc,y)19Ne case) the reaction rate that results from several resonances will simply be the sum of the reaction rates at each resonance.
Therefore determining the reaction rate for lsO(a,y)19Ne in stellar environments reduces to simply determining the properties of the appropriate resonances. The properties of interest are the energy Ec.m ., the spin, and the partial and total widths of each resonance.
B) Mass 19
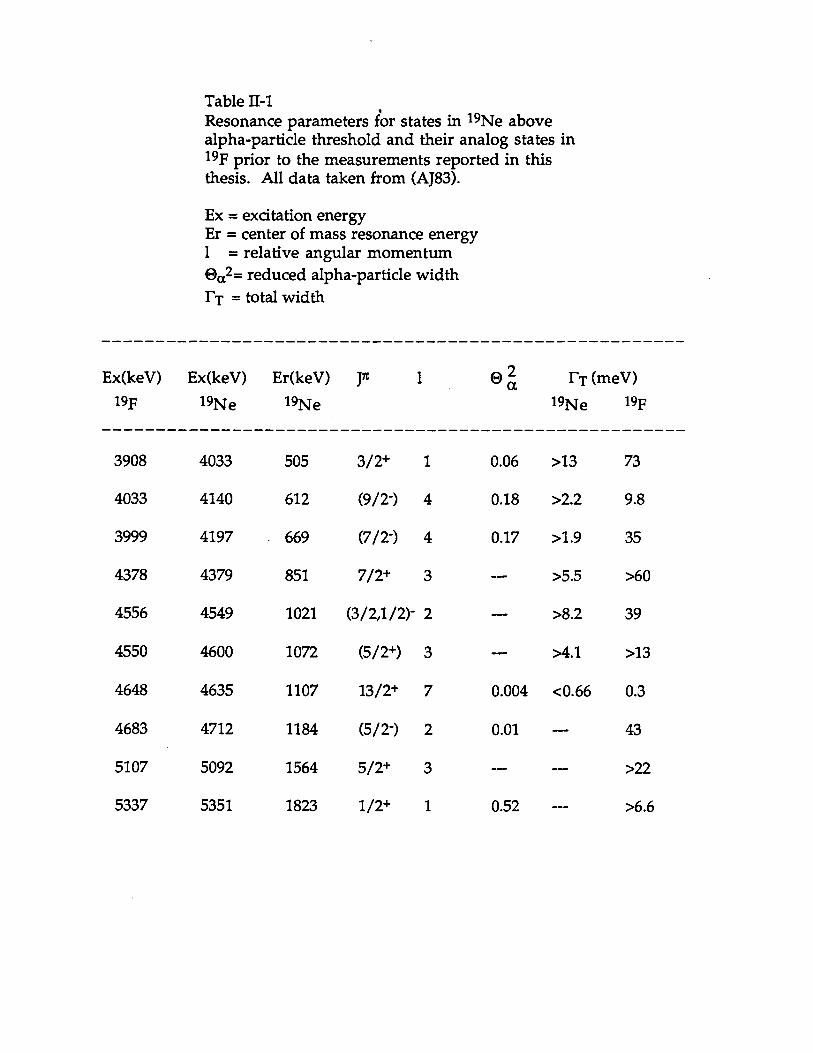
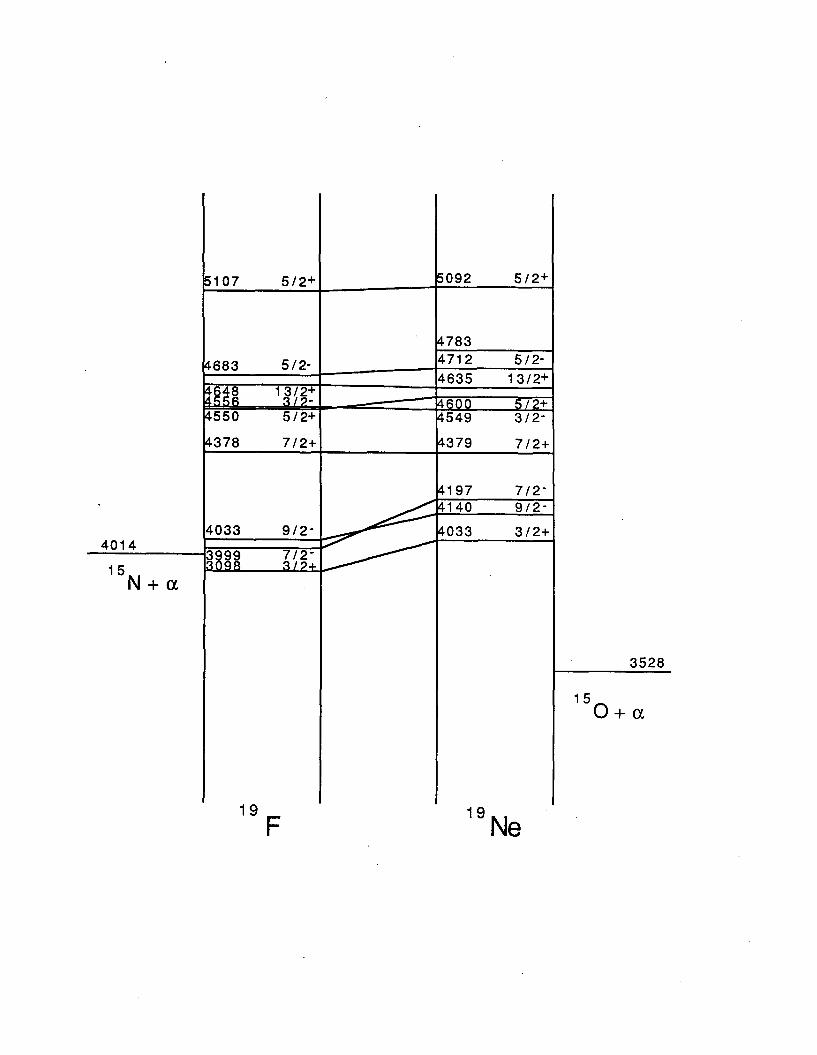
Table II-l and Figure II-l show what was previously known about the 19Ne resonance parameters necessary to calculate the reaction rate. Since 19F is a well studied nucleus and since there is an established analog relationship between each of the states in 19Ne in this energy region and each of their
13
isospin mirrors, in 19F (Bi71), it is unlikely that any state in 19Ne in the region of interest has not been identified. The excitation energy of each of these states is known to 5 keV or better; this accuracy is sufficient for the requirements of this study because the lowest resonance has an energy of over 500 keV, and the temperature range of interest is kT > 20 keV. The spin and parity assignments of the relevant states in 19Ne can be made with considerable confidence. Each state has a spin and parity suggested for it based on gamma ray branching ratios and direct reaction angular distributions, though many are not definite assignments. In addition comparison of the level schemes of 19Ne and 19F shows that the suggested spins and parities for the states in 19Ne match up with those in 19F. It is therefore reasonable to assume the analog connections indicated in figure II-l.
In contrast, little was known about the widths of these states. Some information about total widths, some in the form of lower limits, has been determined using the Doppler-Shift-Attenuation Method (Di77,An80,Ro76). Essentially nothing was known about the alpha-particle widths. The reduced alpha-particle width ©a2 for the 504 keV lsO+a resonance was indirectly extracted by a Distorted-Wave-Born-Approximation analysis of a 15N(6Li,d)19F angular distribution to the bound analog state in 19F (Fo86). The reduced widths for the 612-keV, 669-keV and 1107-keV resonances are based on theoretical model calculations for the mirror states in 19F (Sa79). There was no previous information about the alpha partial widths of the 851-keV 1021-keV and 1072-keV resonances.
14
Two calculations (Wa81,La86) of this reaction rate have been carried out using (a) the resonance parameters discussed in the previous section and (b), where no width information was available, values of widths derived using extrapolated systematics. The more recent calculation, that of Langanke, Wiescher, Fowler and Gorres [LWFG] (La86), will be discussed here since it incorporates the most up-to-date information, particularly reflecting changes in the measured values of Ty in *9F. LWFG assumed that the gamma-ray widths in 19Ne are equal to the gamma-ray widths of their analog states in *9F (for all these states in 19F, the total width is essentially equal to the gamma-ray width) and the lower limit values were used when only lower limits were given. Their 19Ne alpha-particle widths were calculated from the reduced alpha widths for the analog states in 19F when they were available, and they simply assumed a reduced alpha-particle width of 0.02 when no information was available. The alpha-particle width was calculated from the reduced width using the expression (C183)
r a = 6 e a2Er fa p,(R,,Ea)
where Er = fi2/2MRi2, fa is the reflection factor taken to be 4.8, Ri is the interaction radius taken to be 4.99 fm (Mi70) and Pi = kR/(Fi2+G]2) is the barrier penetrability where Fi and Gi are the regular and irregular Coulomb functions. The resonance parameters used by LWFG are given in table II-2.
C ) Calculation of the Reaction Rate for 150(a.y)19Ne
15
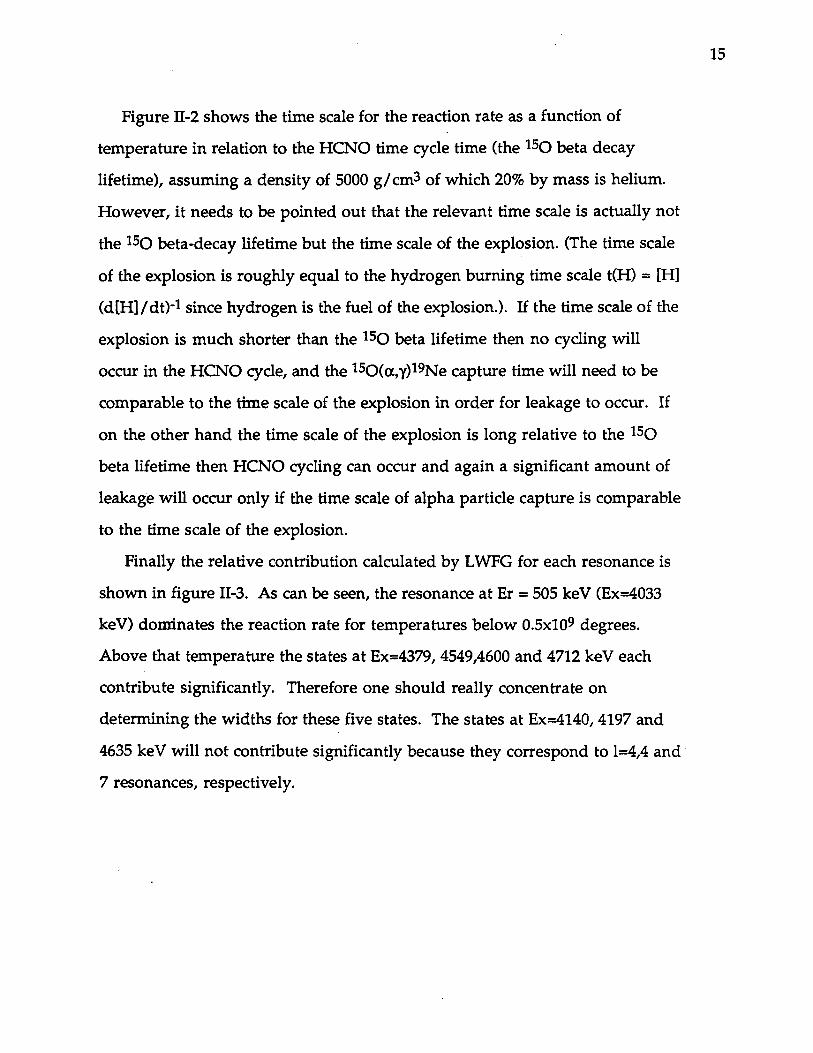
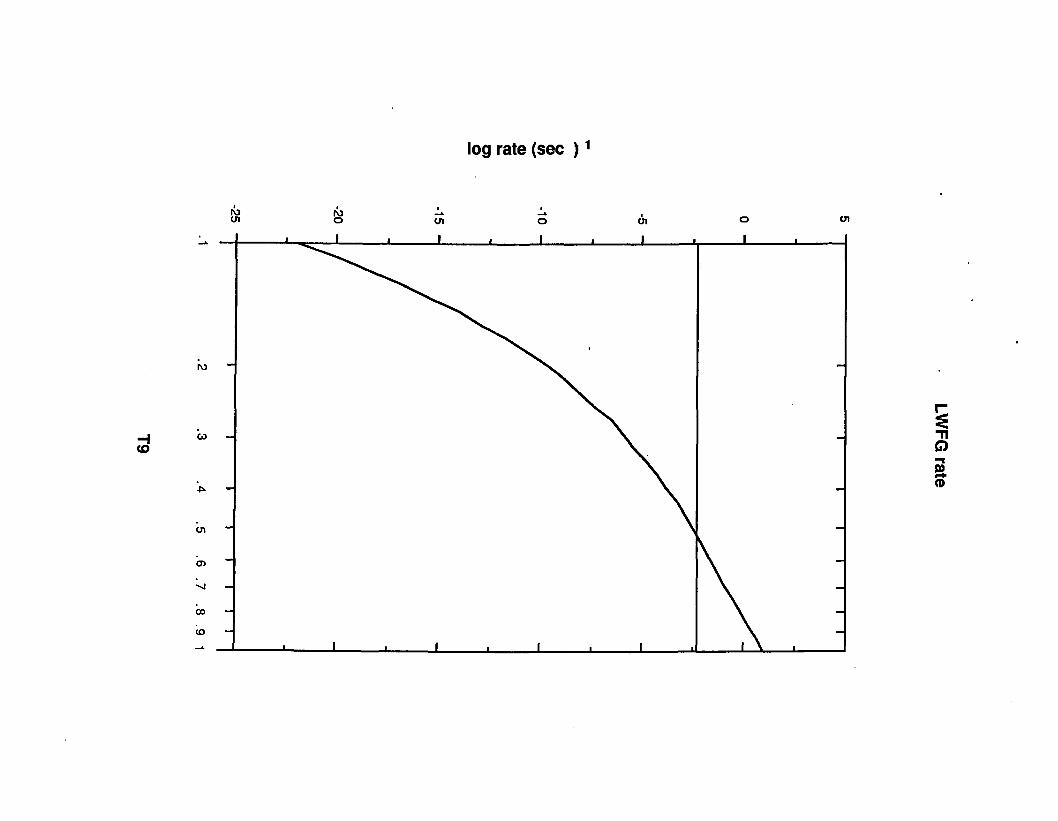
Figure II-2 shows the time scale for the reaction rate as a function of temperature in relation to the H C N O time cycle time (the lsO beta decay lifetime), assuming a density of 5000 g/cm3 of which 20% by mass is helium. However, it needs to be pointed out that the relevant time scale is actually not the 150 beta-decay lifetime but the time scale of the explosion. (The time scale of the explosion is roughly equal to the hydrogen burning time scale t(H) = [H] (d[H]/dt)*l since hydrogen is the fuel of the explosion.). If the time scale of the explosion is much shorter than the 150 beta lifetime then no cycling will occur in the H C N O cycle, and the 150(a,y)19Ne capture time will need to be comparable to the time scale of the explosion in order for leakage to occur. If on the other hand the time scale of the explosion is long relative to the 15o beta lifetime then H C N O cycling can occur and again a significant amount of leakage will occur only if the time scale of alpha particle capture is comparable to the time scale of the explosion.
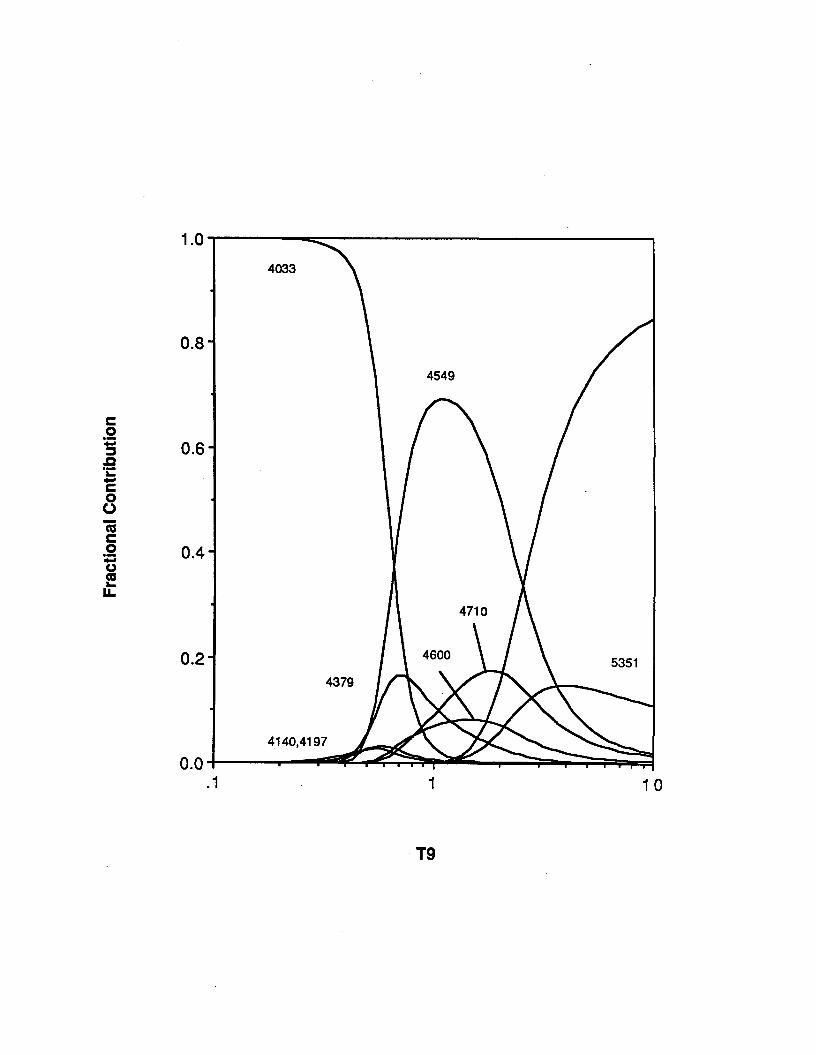
Finally the relative contribution calculated by LWFG for each resonance is shown in figure II-3. As can be seen, the resonance at Er = 505 keV (Ex=4033 keV) dominates the reaction rate for temperatures below 0.5xl09 degrees. Above that temperature the states at Ex=4379, 4549,4600 and 4712 keV each contribute significantly. Therefore one should really concentrate on determining the widths for these five states. The states at Ex=4140, 4197 and 4635 keV will not contribute significantly because they correspond to 1=4,4 and 7 resonances, respectively.
19p
3908
4033
3999
4378
4556
4550
4648
4683
5107
5337
Table E-lResonance parameters for states in 19Ne above alpha-particle threshold and their analog states in 19F prior to the measurements reported in this thesis. All data taken from (AJ83).
Ex = excitation energy Er = center of mass resonance energy 1 = relative angular momentum© a2= reduced alpha-particle width Tt = total width
Ex(keV) Er(keV) J* 1 0 Z r T (meV)19Ne 19Ne 19Ne 19F
4033 505 3/2+ 1 0.06 >13 73
4140 612 (9/2-) 4 0.18 >2.2 9.8
4197 669 (7/2-) 4 0.17 >1.9 35
4379 851 7/2+ 3 — >5.5 >60
4549 1021 (3/2,1/2)- 2 — >8.2 39
4600 1072 (5/2+) 3 — >4.1 >13
4635 1107 13/2+ 7 0.004 <0.66 0.3
4712 1184 (5/2-) 2 0.01 — 43
5092 1564 5/2+ 3 — — >22
5351 1823 1/2+ 1 0.52 >6.6

Table II- 2Resonance parameters for states in 19Ne above alpha-particle threshold used in the calculation of LWFG (This table was copied from La86.).
Ex = excitation energy P1 = spin and parity ra = alpha-particle widthTy = gamma-ray width
Er Ex Ex J7C 1(keV) (19Ne) (19F)
504 4033 3908 3/2+ 1611 4140 4033 9/2- 4668 4197 3999 7/2- 4850 4379 4378 7/2+ 31020 4544 4556 3/2- 21076 4605 4550 5/2+ 31106 4635 4648 13/2+ 71181 4710 4683 5/2- 21564 5092 5107 5/2+ 31823 5351 5337 1/2+ 11890 .... 5418 7/2- 41896 5424 5464 7/2+ 31970 5463 5507 3/2+ 12016 5545 5535 5/2+ 32093 .... 5621 5/2- 22303 5832 5938 1/2+ 12485 6013 6088 3/2- 22542 .... 6070 7/2+ 32621 6144 6255 1/2+ 12760 6288 6282 5/2+ 32802 .... 6330 7/2+ 32908 6437 6429 1/2- 02969 6497 3/2+ 13000 6528 3/2+ 1
Er = center of mass resonance energy 1 = relative angular momentum©a2 = reduced alpha-particle width ayy = resonance strength
©a2 r a(eV)
Cy(eV)
coy(eV)
0.06 7.2(-6) 0.073 1.44(-5)0.18 1.04(-6) 0.010 5.20(-6)0.17 4.93(-6) 0.035 1.97(-5)0.02 7.0(-4) 0.060 2.8(-3)0.02 8.0(-2) 0.23 1.19(-1)0.02 2.20(-2) 0.013 2.45(-2)0.004 4.49(-9) 304) 3.15(-8)0.01 2.80(-l) 0.041 1.07(-1)
5(-3) 0.026 1.20(-2)0.52 1.04(4) 1.64 1.640.01 0.63 0.105 0.360.097 8.73(1) 0.63 2.520.05 2.15(4) 2.1 4.200.06 9.90(1) 0.16 0.480.02 1.86(2) 0.123 0.380.02 4.0(3) 0.53 0.530.009 3.6(2) 2.25 4.500.2 3.0(3) 0.68 2.720.046 2.90(4) 0.35 0.350.48 1.42(4) 0.33 0.990.45 1.53(4) 0.19 0.760.02 2.20(4) 0.1 0.100.02 3.60(4) 0.85 1.700.011 2.20(4) 1.20 2.40

Level Spectra for 19F and 19Ne, showing the assumed analog connections and the alpha particle thresholds.
Figure II-l
The log of the lsO(a,y)19Ne reaction rate calculated by LWFG in inverse seconds. The rate was calculatedassuming p=5000g/ cm3 and a helium mass fraction of Y=0.20. The rate of 150 beta decay on this scale is -log(176) = -2.246.
Figure II-2
log rate (sec ) 1
■vr |\j —a -u. ,cn o tn o w o 01
LWFG
rate
Figure II-3The fractional contribution of each resonance to the 150(a,y)19Ne reaction rate calculated by LWFG (La86). The contributions of the 4635 and 5092 keV states are too small to be seen. The unlabeled curve is the contribution of all higher resonances.
Frac
tiona
l C
ontr
ibut
ion
T9
Ill) The ExperimentsA) Selection of Reactions
Because the energy range of interest for astrophysical reactions is typically well below the Coulomb barrier, it is usually very difficult, or impossible, to directly measure these charged particle reaction rates. If the reaction is nonresonant, one typically measures the reaction rate to as low an energy as possible and then extrapolates to the region of interest. If the reaction is resonant and the resonance strengths are too weak to be measured directly, then the resonance parameters must be extracted indirectly by using a different reaction to populate the resonant states and to study its subsequent decay.
An additional complication is introduced when dealing with explosive burning because the reactants of interest can have very short half-lives. lsO has a lifetime of 176 seconds, and it is currently impractical to make a sufficiently dense target or a sufficiently intense beam from lsO particles to measure its nuclear reactions directly. This thesis presents two experiments that measure the width parameters which determine the contribution to the lsO(a,y)19Ne reaction rate for three of its resonances, corresponding to the states in 19Ne at Ex=4549 keV 4600 keV and 4712 keV, which dominate the reaction rate for temperatures between 0.5xl09K and 3.0xl09K and for which little information was previously available.
In the first experiment, the 15N+a resonance strengths, coy, for the analog resonances in 19F of the 4549 and 4600 keV states in 19Ne were measured directly. The resonance strengths had previously been measured for the higher energy 15N(oc,y) resonances; for the resonances at still lower energies (Ec .m. 370 keV) the resonance strengths are still too small to be determined
with the current technology. A model independent analysis was used to relate these measurements to the resonance strengths for the corresponding resonances in the 150(oc,y)19Ne reaction.
In the second experiment, the states of interest in 19Ne were populated via the 19F(3He,t)19Ne reaction, and their subsequent alpha-particle decays were measured to determine the branching ratios ra/lTand Ty/Pr. The combination of these branching ratios along with the alpha-particle widths, To, measured in the the 15N(a,y)19F experiment determine the desired quantity, the resonance strength coy.
B) 15N(q.y)19Fi) 15N Target Preparation
Targets for the 15N(a,y)19F measurements were prepared by vacuum (p=lxlO-6 torr) evaporation of titanium (15|i.g/cm2) onto a 0.13-mm thick tungsten backing. Tungsten and titanium are good backing materials because both have high nuclear charge (Z= 74 and 22, respectively); because of their large Coulomb barriers these backings will not contribute any background at the low alpha-particle bombarding energies used in these measurements. After the titanium evaporation, the bell jar was immediately filled with isotopically enriched (>99%) 15N (p=0.1 torr), and the target was resistively heated in the 15N atmosphere to about 800°C for five minutes thereby, forming Ti15N in the titanium layer. Under these conditions the tungsten is inert to nitration so that the tungsten not only serves as a support for the Ti15N, but also allows for the production of a well defined 15N target. In preparing these targets it was found to be necessary to keep the titanium
under vacuum until it was nitrided, otherwise the targets became badly oxidized. After nitriding, the Ti15N targets were stable.
The nitrogen density profile for each target was determined by measuring the excitation function of the 430 keV resonance in the 15N(p,ay)12C reaction. [The 430-keV resonance corresponds to an 1=2 J7t=2‘ state in 160 at Ex = 12530 keV which decays into 12C*+a populating the Ex=4439 keV Jn=2+ first excited state in 12C which decays by emission of a 4439 keV gamma ray to the ground state.]
The absolute nitriding efficiency was determined by measuring the yield for the 15N(a,y)19F reaction at the Ea = 847 keV resonance, [a resonance for which the value of coY=(6.0±1.0)xl0_3eVhas already been determined (Ro72)], and using the thick target relation
p (Mb+ M t) 2 2S M t Xcm- 037
where Y is the yield, p is the number of disintegrate atoms per gram, S is the stopping power in energy per gram per area, Xc.m .is the center-of-mass wavelength given by
i h2 M , + M n 2- 2 M b Eiablk M t J
and where M b, Mt and Eiab are the masses of the beam and the target particles and the beam energy in the lab frame, respectively. In this case we have
Y = 2 .110'3 ----- ~ -8 Ti+ X 8 N lab
24
where £ii and £n are the alpha-particle stopping powers in titanium and nitrogen in eVcm2/1015atoms [the values for the stopping powers are taken from (Zi77)], X is the nitriding efficiency, and Eiab and coy are the beam energy and the resonance strength in eV. The nitriding efficiency for the targets used is this experiment was typically 45% (X=0.45).
ii) The (a.v) measurement
The experimental set up for the 15N(a,y)19F reaction is shown in figure III- 1. Alpha particle beams provided by the Toronto JN Van de Graaff accelerator were used to bombard the thick Ti15N targets. In order to reduce target deterioration the back of the target was directly water cooled, the beam current was limited to 100|iA, and the beam was defocused to a 0.6 cm by 0.6 cm spot. The up stream cold trap was biased to -300 Volts to prevent electrons from the upstream slits from drifting into the target Faraday cage and to prevent the escape of secondary electrons from the target, insuring accurate beam current integration. The gamma rays were detected with a 35% Ge(Li) detector placed only 2 cm from the target. Because the alpha particle is spinless and the 15N has spin V 2, only the m = ± V 2 magnetic substates were populated in this reaction. This implies that there could be large angular distribution effects. Since the largest contribution to any nonisotropic angular distribution is apt to be proportional to P2(cos0), the detector was placed at 55° (relative to the beam axis) near a zero of P2(cos0) to reduce any angular distribution effects. The signals from the Ge(Li) were amplified and analyzed to generate spectra of counts vs. gamma ray energy. The detector efficiency was determined by measuring the gamma rays from the 14N(p,y)150 and 27Al(p,y)28Si reactions and from several calibrated sources. These calibrations were carried out using
25
the same geometry in which the 15N(a,y)19F data were measured so that both solid angle and absorption efficiency were accounted for. The target and detector were surrounded by a minimum of 10 cm of lead in order to reduce the room background.
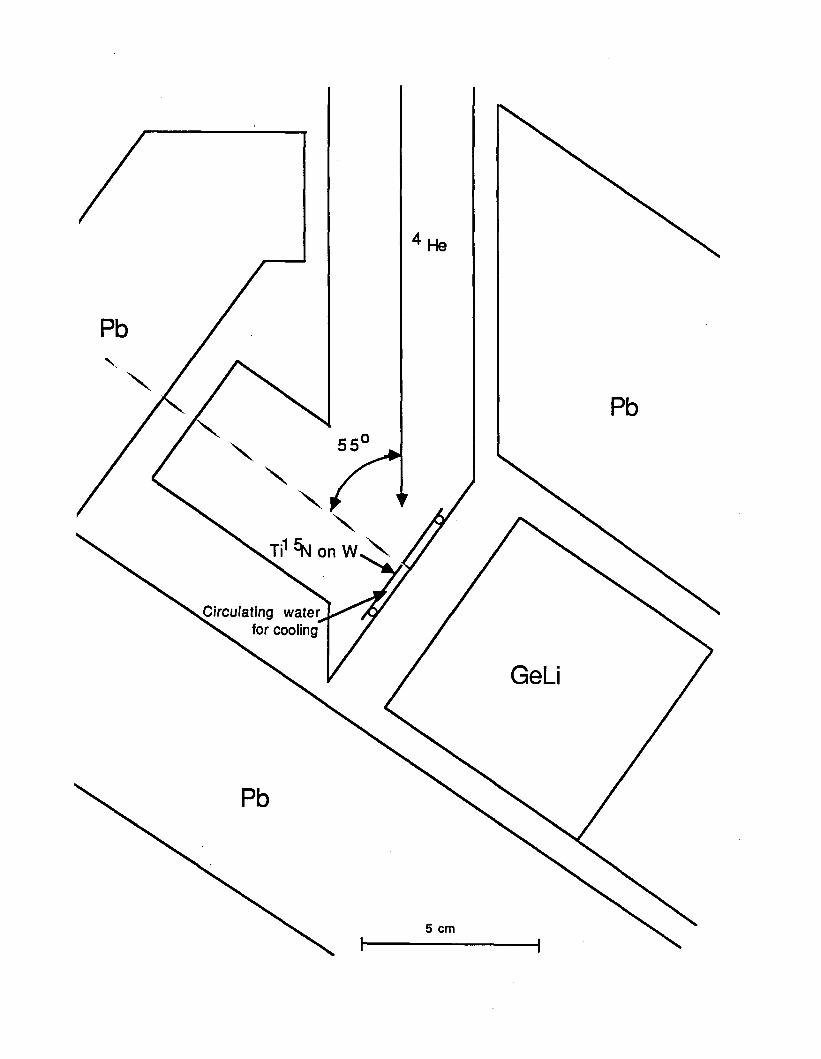
Three sets of measurements were made. One was made at a beam energy of 690 and one at 700 keV, in order to measure the resonance strengths of the Ea = 679 and 687 keV resonances. The 690 keV spectrum is shown in figure m-2. Finally a set of measurements was made at 670 keV, just below the two resonances, in order to determine backgrounds. (The beam energy calibration was done by measuring the resonance yield curve of the 847 keV resonance in 15N(a,y)19F.)
Target quality plays a critical role in these measurements, and therefore during the course of the runs the 197 keV and 4353 keV gamma-ray yields were monitored in 0.25 C intervals. If (judging from these yields) a target was starting to deteriorate, the data from the most recent 0.25 C bombardment were not used in the yield determination. Targets were typically exposed to 2.0 to 3.0 C before being replaced, and were typically replaced before any deterioration occured. A total charge of 6 C and 5.5 C was accumulated for the 690 and 700 keV measurements, respectively. After the experiment each of the targets was again analyzed by measuring the 15N(p,ay)12C reaction to check if any significant depletion of their nitrogen content had occurred.
iii) Analysis of 15N (a.y)19F
The yields of the Ea=679 keV (5/2+) and Ea=687 (3/2') resonances [corresponding to Ex=4550 and Ex=4556 keV, respectively] were measured at Ea=690 keV (an energy that placed both resonances well within the Ti15N
26
target which was 30 keV thick to the beam at Ea=690 keV) for a total accumulated charge of 6 Coulombs. The resulting spectrum is shown in figure m-2. After taking into account the detector solid angle, and efficiency, the measured yields of the 4550-197-0 and the 4550-1554-197-0 transitions resulting from population of the 4550-keV state were found to agree within errors with the previously reported branching ratios (Aj83). Note that the angular distribution effects are negligible. Since the state at Ex=4556 keV has j7t=3/2-/ and since its dominant decays are to the Jrt=1/2+ (El radiation) ground state, and the J7t=1/2' (Ml radiation) first excited state the gamma-ray angular distribution will have the form
W(0) = Ao + A2 P2(cos(0))
By measuring gamma rays at 55° near a zero of nonisotropic term P2(cos(0)) a non-zero A 2 term does not effect the measured yield. Similarly for the j7i=5 / 2+/ Ex=4550 keV state which decays predominantly to the Jn= V 2'/ (M1+E2 radiation) Ex=197 keV, and the J x = 3 /2+ (M1+E2 radiation) Ex=1554 keV the angular distributions of the initial gamma rays will be of the form
W(0) = Ao + A 2 P2(c o s(0)) + A4 P4(c o s(0))Here A 4 is proportional to the square of the M1+E2 mixing parameter 8, and a value of 181 >0.7 would be necessary to make the measured yield at 55° unequal to the angle averaged yield within the accuracy of this measurement. This requirement and the fact that all the yield of gamma rays (measured at 55°) resulting from population of the Ex=4550 keV state agree with the known absolute branching ratios, one can conclude that the yield measured at 55° is equal to the absolute yield. The yield of these lines measure the resonancestrength coy for this state through the equation
p M b+M t .2S M t ^-m -
At Ea=690 keV, the 4556-110-0 and the 4556-0 transitions which would result from population of the 4556 keV state (Aj83) were not observed. An additional run of 5.5 Coulombs was measured at a beam energy of 700 keV to insure that the 4556-keV state was indeed within the target and that its nonobservation did not reflect an uncertainty in the beam energy. The transitions from the 4550-keV state were observed with the same strength in the 700-keV run as in the 690-keV rim, and the transitions from the 4556-keV state remained unobserved. An off-resonance run was measured at 670 keV for 6 Coulombs in order to determine the gamma ray backgrounds.
From a comparison with our measurement of the 4683 keV state [Ea=847 keV; C0Y=(6±l)meV], these data enable us to determine a resonance strength of coy = (9.7±2.0)xl0*5 eV for the 4550-keV state and to set an upper bound of coy < lxl0_5eV, for the 4556-keV state. For these two states in 19F, Ty is of the order of one tenth of an electron volt which implies that y [ y = ryra/(ry+ra) ] is approximately equal to Ta. Therefore these coy values correspond to Ta = (3.2±0.7)xl0*5 eV and ra< 5x10"6 eV for the 4550-keV and 4556-keV states, respectively.The alpha-particle widths of the corresponding states in 19Ne can then be
determined by assuming that mirror states have the same dimensionless reduced alpha-particle widths (@a2) as defined in section 11(C) above.
ra = 6 ©a2 Er fa Pi(Ri,Ea)Using this equation to correct for the different barrier penetrabilities of the 19Ne and 19F systems, we can extract values for Ta for the two mirror states in 19Ne. The results are ra(4600) = (88±19) meV and ra(4549) < 3.8 meV. Both 15N+a and lsO+a are assumed to have the same interaction radius Ri=4.99 fm. If the same radius is used for both compound systems, these 19Ne alpha- particle widths are very insensitive to the radius of interaction selected; the
28
results are only three percent different if the common radius used in the calculation is six fm. Furthermore, even if the radius for 15N+a were different from the lsO+a radius by as much as one fm, the 19Ne results would only change by fifty percent; the difference in radius should be much less than one fm since the two systems are isospin mirrors. Because of the uncertainty in the absolute radius, the reduced alpha particle width (0 a2) defined by the above equation is not known very accurately; however, the value of Ta can be accurately known because almost all of the effect of the absolute uncertainty in the radius cancels out in the comparison of the two isospin mirror systems.
As discussed below in the conclusion, an independent check on this method for determining Ta can be made by directly measuring the alpha particle branching ratio (B=ra/rT) for each of these states, since there only two independent width parameters for each state, the three independently measured quantities for each of these states [D/from DSAM), ra(from section B above) and Ba(from section C below)] over determine the system. As discussed in Chapter IV, this then (1) allows for a consistency check of the values of coy determined by combining these data in three different ways and (2) permits one to choose the most accurate method for determining coy for each resonance.
Cl 19F(3He.t)19Ne*(a)15Qi) Selection of the Population Reaction
There are four charged-particle reactions which involve stable targets and beams (Z<2) which can be used to populate states in 19Ne. These reactions are 20Ne(3He,a)19Ne, 20Ne(d,t)19Ne, 20Ne(p,d)l9Ne and 19F(3He,t)l9Ne. Use of the (d,t) reaction has no advantages over the (3He,a) or (p,d) reactions and
29
suffers from the fact that there will be an enhanced neutron background
caused by dumping the deuteron beam, compared to the other reactions. Each
of the remaining three reactions was examined using the Princeton cyclotron
and QDDD magnetic spectrometer in order to decide which would be the best
for measuring r a/rx for the 19Ne states of interest
For measuring the reactions involving 20Ne as the target, a gas cell could
not be used because the low energy alpha particles from the breakup of 19Ne
would not be able to get out of the cell. A gas jet target would be ideal, but the
Princeton cyclotron facility does not have one. Instead neon targets were
prepared by implanting neon into carbon foils using either the Princeton
isotope separator or the Yale ion implanter. Using this method, targets with
neon thicknesses of 4-6 pg/cm2 were implanted in 40 pg/cm2 carbon foils.
The neon thicknesses were roughly determined by measuring the
Rutherford scattering cross section of the implanted foils using a 900 keV
alpha particle beam, and detecting the scattered particles at angles near 180
degrees.
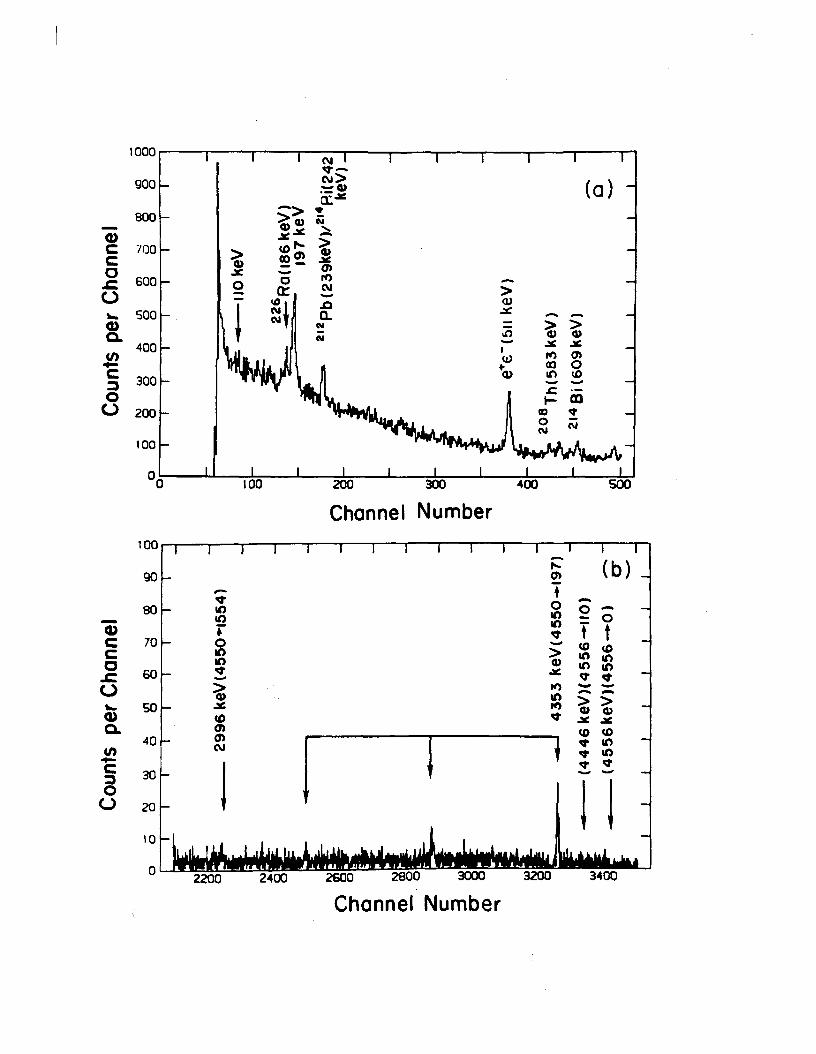
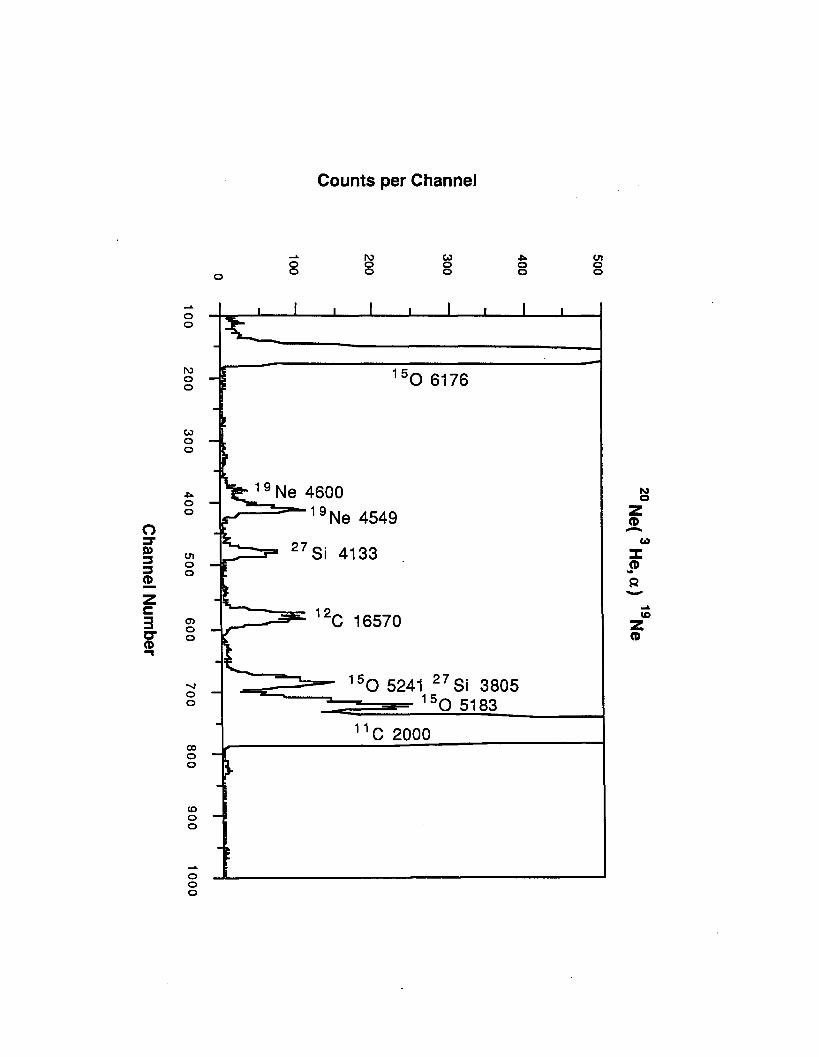
Spectra for the 20Ne(3He,a)19Ne and 19F(3He,t)19Ne reactions are shown in
figures HI-3 and HI-4. The neutron pickup reactions have larger cross-sections
(typically da/dQ = lmb/sr) than the (3He,t) reaction (typically d o / d Q =
50pb/sr). In spite of its' smaller cross-section the (3He,t) reaction was selected
in this case for several reasons. First a fluorine target can be made ten times
thicker (80pg/cm2 CaF2> than the implanted neon (5pg/cm2) while still
allowing the decay alpha particles to escape from the target. This difference in
target thickness nullifies most of the advantage of the larger (3He,a) cross-
section. Secondly the (3He,t) triton spectrum is much cleaner because
reactions involving the contaminant nuclei 12C, 160 , 28Si and 40Ca ( the
targets used for this experiment were CaF2 ) can not contaminate the
30
19F (3He,t)19Ne spectrum because their Q0 values are too negative. The
49F(3He,t)19Ne reaction has a Q0 value near zero (Q0=-3.257 MeV) because the
initial and final systems are isobaric analogs. The Q0 values for (3He,t)
reaction involving the nuclei 12C, 160 , 20Ne, 28Si and 40Ca are very negative
(Q=-17.357,-15.448,-13.908, -14.350 and -14.338 MeV respectively) because the
heavy nucleus changes from a very stable alpha-particle-like nucleus to an
odd-odd nucleus. The neutron pick up reactions do not have this advantage
because the target (20Ne) and the major contaminants are alpha-particle
nuclei with similar Q0 values. As seen in figure HI-3 there are strong peaks
due to the carbon backing and oxygen contamination which completely
obscure the 19Ne state at Ex=4033 keV. One other advantage of the (3He,t)
reaction is that the QDDD can be used to separate the beam dump, the target
chamber (which contains the alpha particle detectors), and the focal plane
(triton) detector, helping to reduce the background. This separation could not
be done as cleanly for the neutron pick-up reactions because the beam and the
resulting light ion have the same charge; the bending of the particle
trajectories in the QDDD is proportional to charge divided by momentum and
would not separate the beam dump from the focal plane as well.
j i ) 19F Target Preparation
Fluorine targets were prepared by vacuum evaporation (p=lxl0 ' 6 torr) of
80|ig/cm2 of CaF2 onto 10(j.g/cm2 carbon foils. The calcium fluoride salt was
chosen for two reasons. First, among the various fluorine compounds CaF2
has a large ratio of fluorine atoms to total stopping power. (LiF which has an
even better ratio is not a good choice because 6'7Li(3He,t)6'7Be(a)X will give a
triton-alpha coincidence background.) Second, 40Ca has very large negative
Qo value (Q0 = -14.338 MeV) for (3He,t) and hence contributes no background
to the triton spectra. Target thicknesses were determined by monitoring the
CaF2 deposition with a piezoelectric gauge during evaporation and then by
measuring the 19F(p,ay)160 reaction with the Yale JN Van de Graaff
accelerator. There is an 1=1 J7C=1+ resonance at 340 keV in 19F(p,ay)160 that
populates the 13.168-MeV state in 20Ne which then alpha decays to the 6.130
MeV second excited state in 160 . By measuring the yield of the gamma decay
of that state to the ground state as a function of beam energy the target
thickness could be determined using the following expression.
. M(CaF2) t --------------AE£(CaF2)
where t is the target thickness in mass per unit area, £(CaF2) = £(Ca) + 2£(F) is
the differential energy loss in energy per molecule of CaF2 per unit area, *
M(CaF2) is the mass of a molecule of CaF2, and AE is the measured width of
the peak in the excitation function in units of energy.
iii) The Experimental Arrangement and Measurements
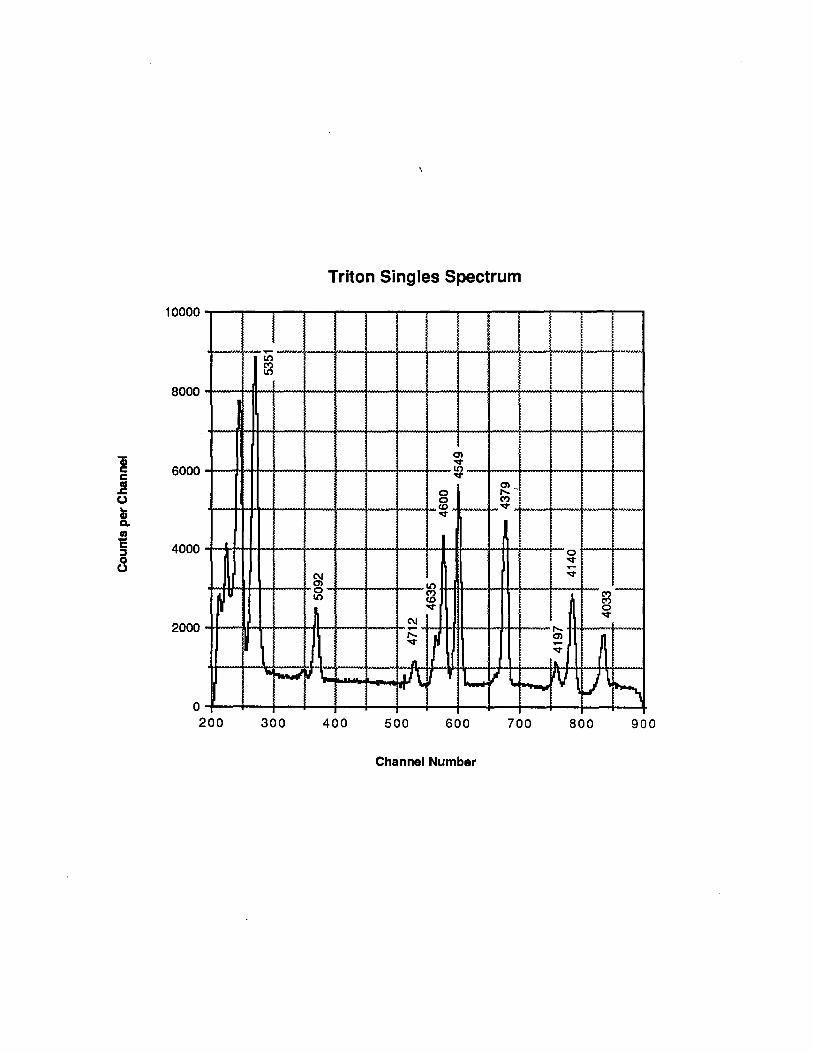
The experimental arrangement used to measure the 19F(3He,t)19Ne*(cc)150
reaction is shown in figure HI-5. When measuring a branching ratio it is
always better to measure the smaller branch because less relative accuracy in
its measurement is needed to yield the same absolute accuracy in the
branching ratio. In this case the weaker branch is expected to be the alpha-
particle one for all the important resonances. A magnetic spectrometer (the
Princeton QDDD spectrometer) was used (a) in order to resolve states
separated by only 30 to 50 keV and (b) because its large solid angle
(AQ=14.7msr) gives the high efficiency required for these coincidence
measurements. The rigidity selection easily separates the tritons of interest
from the stronger groups, which result mainly from elastic and inelastic
scattering. The layout of the QDDD is shown in figure HI-6 . As with any
magnetic spectrometer, the dipole fields disperse the particles such that the
distance along the focal plane is approximately proportional to momentum
divided by charge. If a particle of energy E is bent to a position X at the focal
plane; then a particle of energy E+AE will be bent to a position X+AX where
AX = D AE/E for a given charge. D is called the dispersion and for this
spectrometer is 8.72 MeV mm/keV. For this measurement the experimental
resolution was 20 keV and was limited by the target thickness.
Because the QDDD has such a large solid angle (AQ=14.7msr), in order to
get optimum resolution, corrections must be introduced for the ion-optical
aberrations and the kinematic shift of the reaction. This is done in the
following way. The quadrupole lens is used to focus the particles of interest
to a vertical crossover at the multipole element between dipoles #1 and #2 .
The multipole element is adjusted to compensate for the horizontal
aberrations; because the multipole element is placed at a vertical crossover
the effect of the multipole on the vertical focusing is minimized. Finally the
shapes of the boundaries of the second and third dipoles produce another
vertical crossover at the focal plane allowing a relatively simple focal plane
detector to be used. The particles are detected at the focal plane using a
position-sensitive resistive wire gas proportional counter . A schematic of
the focal plane counter is shown in figure HI-7. A kapton foil entrance
window confines 200 torr of propane gas. Three 10 Jim aluminized mylar
foils act as ground planes for two 13 Jim diameter high-resistance nichrome
33
proportional wires biased to 1430 volts. Behind this, in the gas volume, is a
0.64cm thick plastic scintillator (pilot B) glued to a lucite light pipe which is
coupled to a photo tube. The active length of the detector is 60 cm, and its
position resolution is typically 2 mm. As a particle passes through the
detector it leaves a trail of ionized propane molecules in the gas. The
electrons from the ionization trail drift quickly to the proportional wire
where the high electric field causes an electron avalanche to occur . This
avalanche deposits a quantity of negative charge on the wire in proportion to
the amount of initial ionization in the gas at the position where the particle
passed. These charges travel to each end of the wire and are summed to
determine the energy loss of the particles in the gas; the position is
determined by dividing the charge from one side of the wire by this summed
charge (the charge that goes to each end of the wire is proportional to both the
total charge on the wire and the distance from the avalanche to that end).
The scintillator measures the residual energy. These parameters AE, Eresidual/
and position along with the momentum to charge ratio (p/q) selection of the
magnet determine the mass A, nuclear charge Z, atomic charge q, and total
energy of the particle.
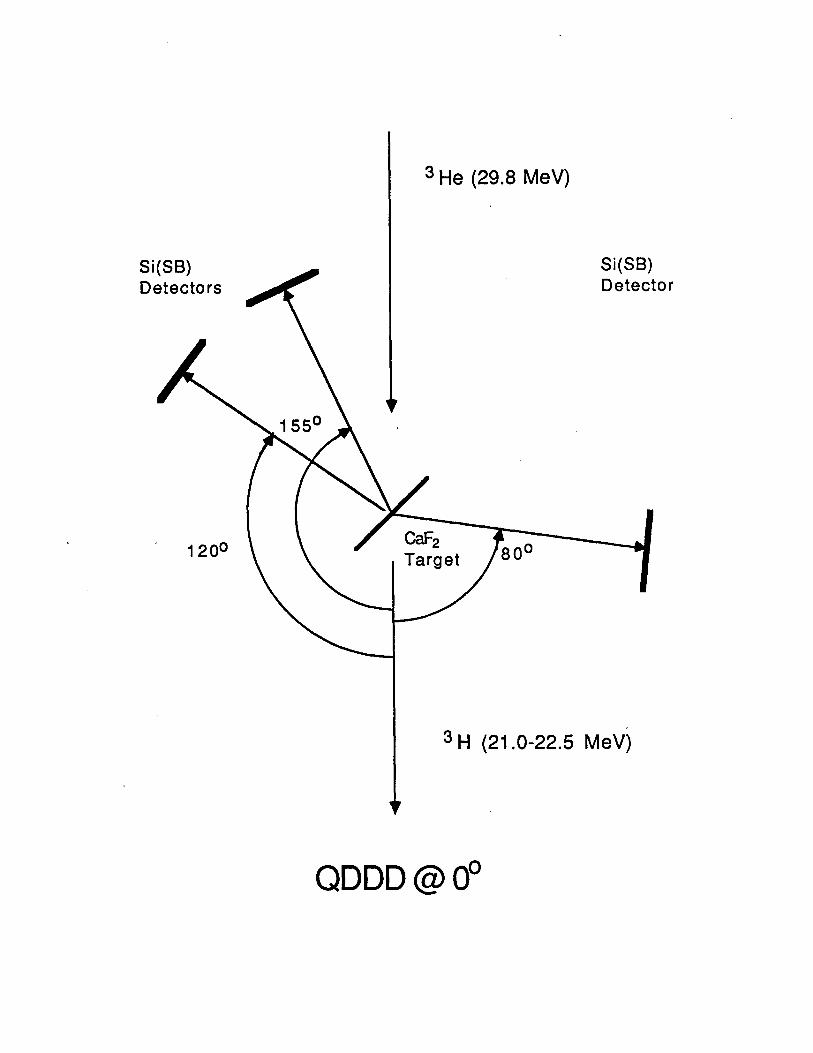
The CaF2 target was bombarded by a 29.8-MeV, 50 nA 3He beam produced
by the Princeton cyclotron. The recoiling tritons (21.0 MeV < Et < 22.5 MeV)
were measured with the QDDD at 0°. Zero degrees was selected because the
beam stop could then be put in the spectrometer without loss of solid angle
and because the beam would then not be dumped in the scattering chamber
where it would produce background for the Si(SB) alpha-particle detectors. It
was possible to measure the decay products at back angles because the reaction
is well momentum matched so that very little momentum is transferred to
the target nucleus during the charge exchange. The recoiling 19Ne nuclei had
only =80keV of energy in the lab frame, and therefore dEa/d0 is small enough
so that the alpha particles from the decay will have enough energy in the
laboratory frame to be detected at back angles and will be fairly monoenergetic
over a large solid angle. These low-energy alpha particles were spread out in
energy because thick targets were used to make yields as large as possible. The
alpha particles from the subsequent decay of 19Ne* (450 keV < Ea < 1200 keV)
were detected with Si(SB) detectors at 80°, 120°, and 155° in the lab. It was only
necessary to measure the decay
a-particles at back angles because detecting the tritons at zero degrees and
parity conservation ensure that the alpha particle angular distribution is
symmetric about 90° in the center-of-mass frame. In order to get maximum
collection efficiency large area detectors (450mm2) were placed close (7.3 cm)
to the target. Each detector covered about 0.7 percent of the 4tc solid angle.
Standard NIM electronics were used, as shown in figure III-8 . All the
energy signals were amplified and routed to the data acquisition computer
through Camac Analog-to-Digital Converters (ADC). The position was
determined by dividing the digitized signals Eside (Eright) and ESUm
(Erfght+Eieft) in the data acquisition program. Esum was also the AE part of a
AE/E telescope where E was the residual energy measured in the scintillator.
In addition to these raw signals, timing (TAC) signals were generated with
amplitudes proportional to the the time difference between the scintillator
and each of the three Si (SB) detector signals. The TAC signals were used to
determine which alpha particles were in real time coincidence with the
tritons detected at the focal plane. The trigger which signaled the computer to
process a given event was generated if the focal-plane wire counter and its
associated scintillator detected radiation in time coincidence. The branching
ratio will be proportional to the number of coincidence events (events where
35
a triton was detected at the focal plane of the spectrometer at a position
indicating population of a certain state in 19Ne and an alpha-particle was
detected in one of the Si(SB) detectors) divided by the number of singles
events(events where no alpha particle was detected in coincidence with the
triton). The details of the extraction of the branching ratios is given in the
analysis section. Data were written onto magnetic tape in an event-by-event
mode.
Because the yields for the 19F(3He,t)19Ne*(a)150 reaction are so small, the
much stronger reaction 19F(3He,d)20Ne*(a)16O was used to initially set up the
timing of the electronics and to determine the relative efficiencies of the
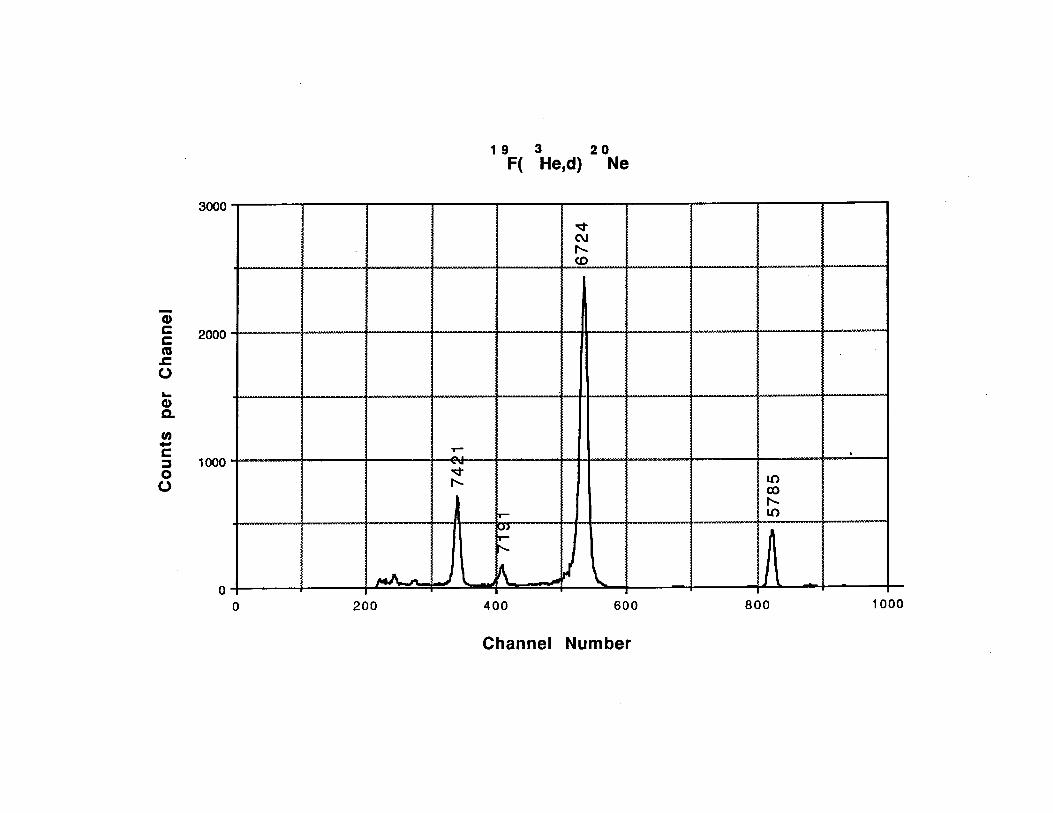
Si(SB) detectors. 20Ne has a 0 + state at Ex = 6724 keV (1993 keV above alpha
particle threshold) that is strongly populated (da/dD = lOmb/sr) in the (3He,d)
reaction (figure m-9). This state decays via alpha particle emission essentially
100 percent of the time; its total width 15±7 keV, indicates that its gamma ray
branch must be <10'3. Its decay alpha particles are distributed isotropically in
the center mass because its spin is zero. Once the timing had been set up
using the (3He,d) reaction, the magnetic field and the particle identification
gate were adjusted to look for triton-alpha coincidences. At the magnetic field
for the tritons of interest, deuterons from the population of states in 20Ne
with excitation energies between 3.6MeV and 5.8MeV were bent to the focal
plane as well as tritons from population of states in 19Ne with excitation
energies between 4.0MeV and 5.5MeV. In this excitation region in 20Ne is the
Ex = 5785 keV J7C=1' state (1055 keV above alpha-particle threshold) which has
nearly the same kinematics for alpha-particle breakup as the states of in 19Ne
at Ex = 4549 keV and 4600 keV (1021 keV and 1072 keV above alpha-particle
threshold) and which was used as an efficiency double check for those low
energy decays.
36
The data were processed using software windows and gates as shown in
figure
m -10 . First a window was placed on the two dimensional ESUm vs. Egcint (AE
vs. E) spectrum to select out only those events corresponding to tritons (or
deuterons) in the focal plane detector. Second a gate was put on each peak
(excited state) of interest in the focal plane position spectrum (figures HI-4 and
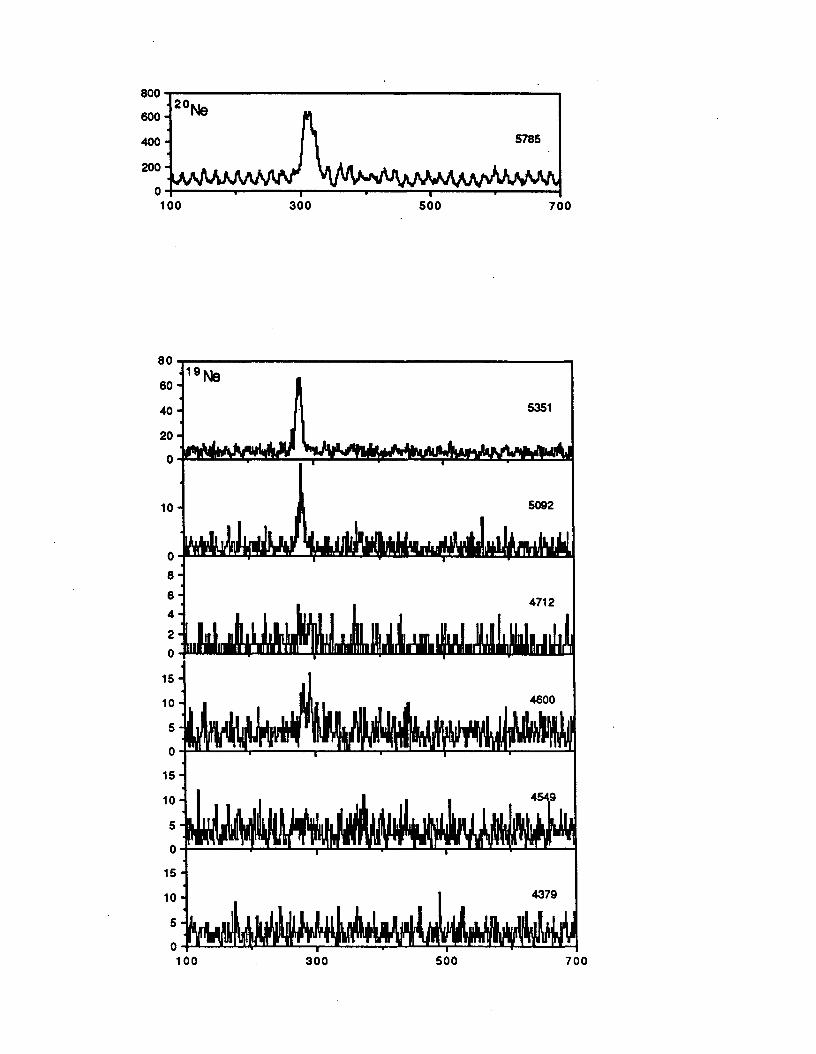
m-9). For each peak of interest, TAC spectra were generated between the focal
plane detector and the various Si(SB) detectors, and gates were then put on
the peaks in the TAC spectra to select only the events where the coincidence
timing was proper (figure HI-11). Finally by selecting only those events that
satisfied all three gates Si(SB) detector energy spectra were generated for
charged particles in proper time coincidence with each excited state of interest
(figure m-12). The background for these TAC-gated charged particle spectra
were determined by moving the TAC gates to select only events that were not
in proper time coincidence with the primary tritons (There are many more
counts in the background spectra because the time windows used to generate
the background spectra are much longer than those used to generate the reals
spectra. The scales of the plots have been adjusted to compensate for that).
The background was typically equivalent to a five percent branch (i.e., for
states that alpha decay 100% of the time the background was one twentieth
the peak area and for states that alpha decayed 30% of the time the
background was about one sixth of the peak area).
The raw coincidence data are shown in table HI-1. In order to calculate
branching ratios from these data, the data for the 5351-keV state in *9Ne were
used to determine the efficiencies of the three Si(SB) detectors; this state alpha
iv) A nalysis o f the 19F(3H e,t)19N e *(a )15Q
37
decays * 100% of the time and has JTC=l/2+ so that it produces an isotropic
distribution of the alpha particles. Then the angular distribution of each of
the other states was calculated by fitting its data to the expression,
J 1/2 .W ( 0 ) » £ p ( M ) I 1 1 J M > YlM-m<e,4>) I 2
M=-J m=-l/2
(Sa80) where the Yi M-m are the spherical harmonics corresponding to the
relative angular momentum 1 between the alpha particle and the 150 ,
m , M-m I J M > is the coefficient coupling the angular momentum 1, the ]n = 1 "j 150, and the spin zero alpha particle to spin J, and the p(M) are the
magnetic substate populations which were varied in the fit. Since 19F, 3He
and the triton are all spin one half particles and since the tritons were
observed near zero degrees only the 1/2 and 3/2 magnetic substates will be
strongly populated in l9Ne, and hence there are only two parameters that
need to be determined, p(l/2) and p(3/2) [p(m)=p(-m)]. Once this angular
distribution has been fitted to the measured data, integrating the angular
distribution gives the total alpha particle yield.7C
Na = 2tc J w (0) sin(0)d0
Finally this total yield was normalized to the number of single triton events
using the 5351 keV excited state in 19Ne. The branching ratio is given by
Na(x) Nt(5351)B “ Nt(x) Na(5351)
where Nt is the number of singles triton events and Na is the integrated yield
of the alpha-triton coincidences. The final numbers for the branching ratios
38
are given in table HI-2. The second column shows the branching ratios
determined by a preliminary set of measurements with poorer statistics but
somewhat less background ion the TAC spectra. The two measurements gave
completely consistent results.
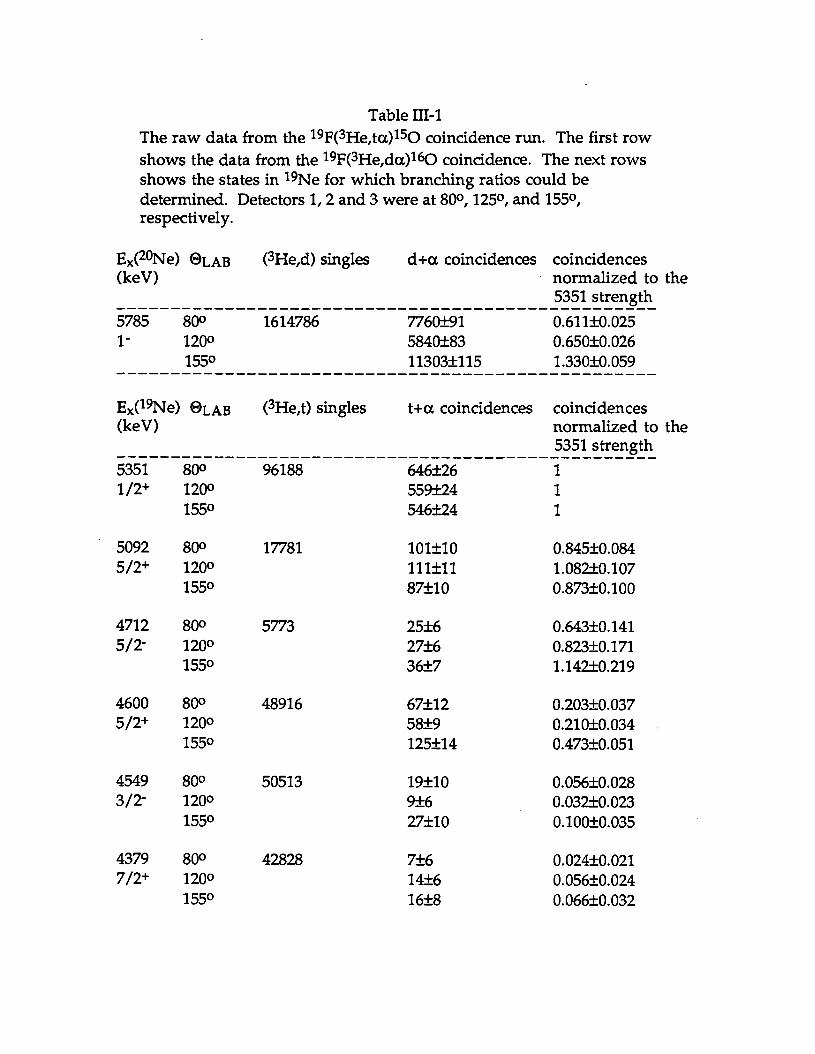
Table m-1The raw data from the 19F(3He,ta)150 coincidence run. The first row shows the data from the 19F(3He,da)160 coincidence. The next rows shows the states in 19Ne for which branching ratios could be determined. Detectors 1, 2 and 3 were at 80°, 125°, and 155°, respectively.
Ex(20Ne) © l a b (3He,d) singles d+a coincidences coincidences (keV) normalized to the
5351 strength5785 80° 1614786 7760±91 0.611±0.0251 - 120° 5840±83 0.650±0.026
155° 11303±115 1.330±0.059
Ex(19Ne) © l a b (3He,t) singles t+a coincidences coincidences(keV) normalized to the
5351 strength5351 80<> 96188 646±26 11 /2+ 120° 559±24 1
155° 546±24 1
5092 80o 17781 101±10 0.845±0.0845/2+ 120° 111±11 1.08210.107
1550 87±10 0.87310.100
4712 80o 5773 25±6 0.64310.1415/2- 120° 27±6 0.82310.171
1550 36±7 1.14210.219
4600 800 48916 67±12 0.20310.0375/2+ 1200 58±9 0.21010.034
1550 125±14 0.47310.051
4549 80o 50513 19±10 0.05610.0283/2* 1200 9±6 0.03210.023
155° 27±10 0.10010.035
4379 80° 42828 7±6 0.02410.0217/2+ 1200 14±6 0.05610.024
155° 16±8 0.06610.032
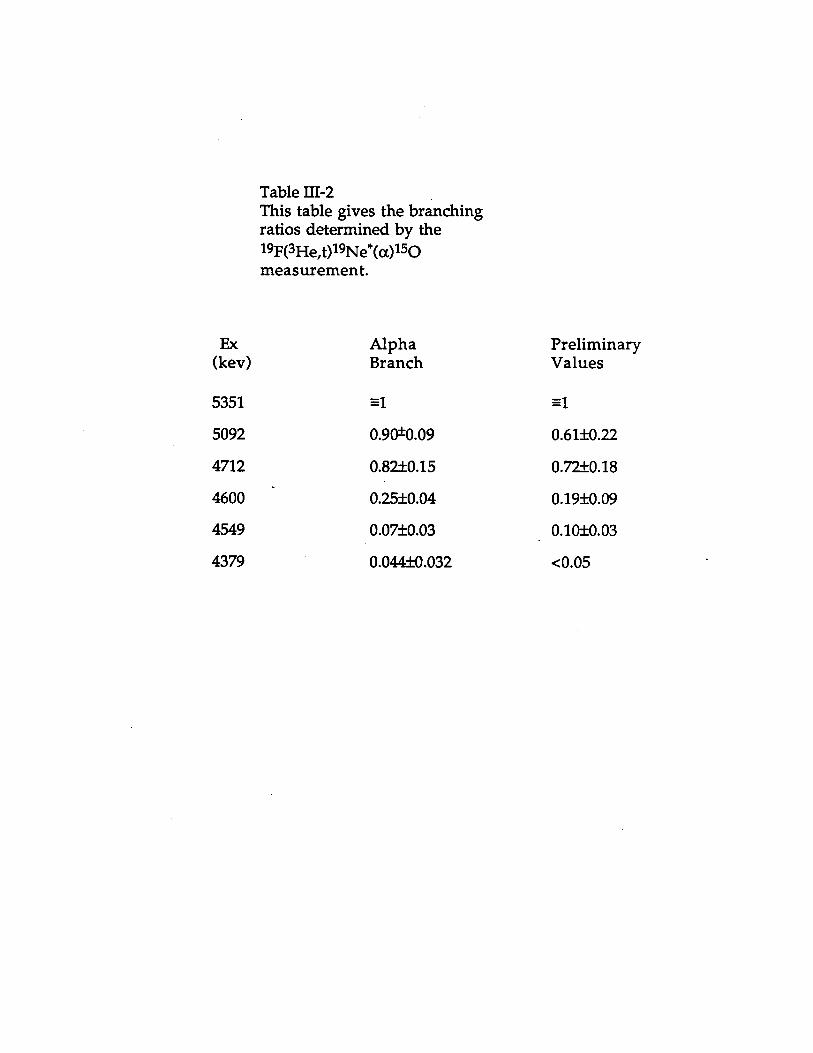
Table m-2This table gives the branching ratios determined by the19F(3He,t)19Ne*(a)150measurement.
Ex Alpha Preliminary(kev) Branch Values
5351 =1 =1
5092 0.90*0.09 0.61±0.22
4712 0.82±0.15 0.72±0.18
4600 ' 0.25±0.04 0.19±0.09
4549 0.07±0.03 0.10±0.03
4379 0.044±0.032 <0.05
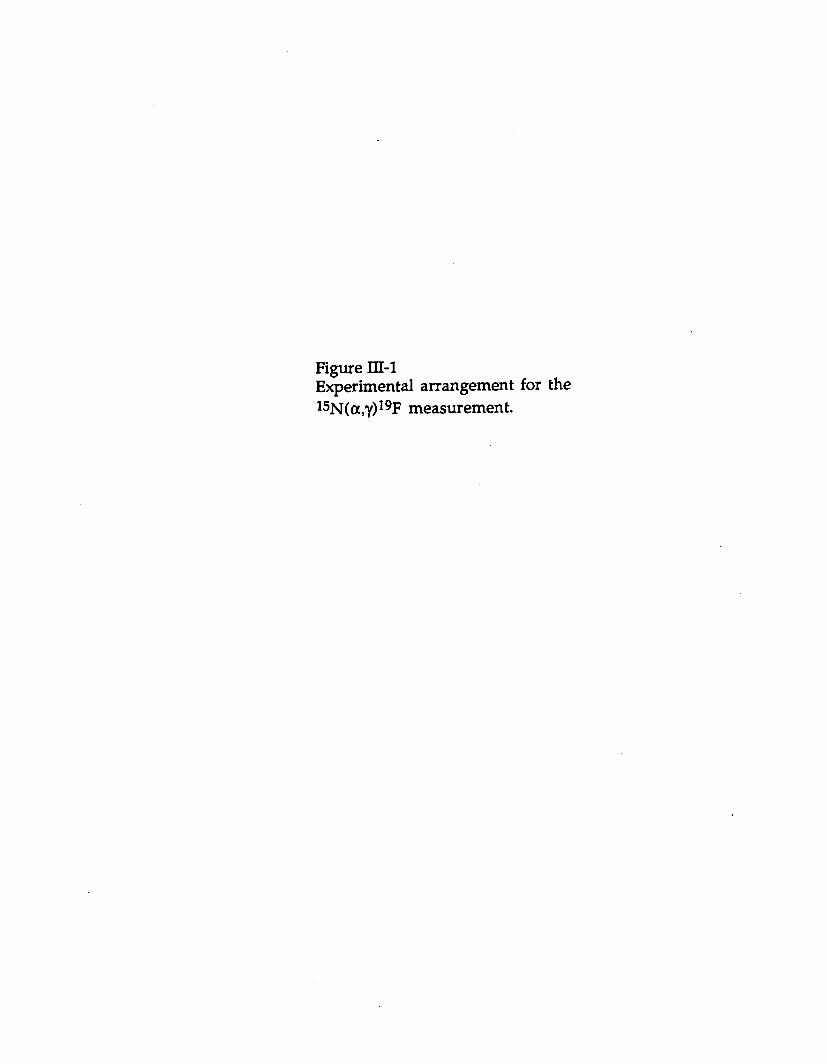
Figure HI-1Experimental arrangement for 15N(a,y)19F measurement.
Circulating water for cooling

Figure HI-2The low and high energy parts of the 15N ( cx,y)19F gamma ray spectrum measured at Ea=690keV. The transitions due to the 4550-197-0 and 4550-1554-197-0 are indicated as are the locations where the unobserved 4556-0 and 4556-110-0 branches would be.
Coun
ts pe
r Ch
anne
l Co
unts
per
Chan
nel
900
800
700
600
500
400
300
200
100
°<
100
90
80
70
60
50
40
30
20
1000
10
(a) "
><uJC
inia)fa>
> > 0) <u J£ JC ro CD 00 O m u><x> m u>
100 200 300 400
Channel Number500
*inin40 m m *
1JC(O0>0>CM
97)
( b )tO ftinin w
7ot
>Q>JC
<0 m m(0min
minIO >0) >a>JC JC
1(0 (0min<»■
2200 2400 2600 2800 3000
Channel Number3200 3400

20Ne(3He,a)19Ne alpha particle spectrum. The horizontal axis is the position along the focal plane of the QDDD. The residual nucleus and the excitation energies in keV of the states populated are given for each peak.
Figure m -3
Channel Number
Counts per Channel
OO
COO
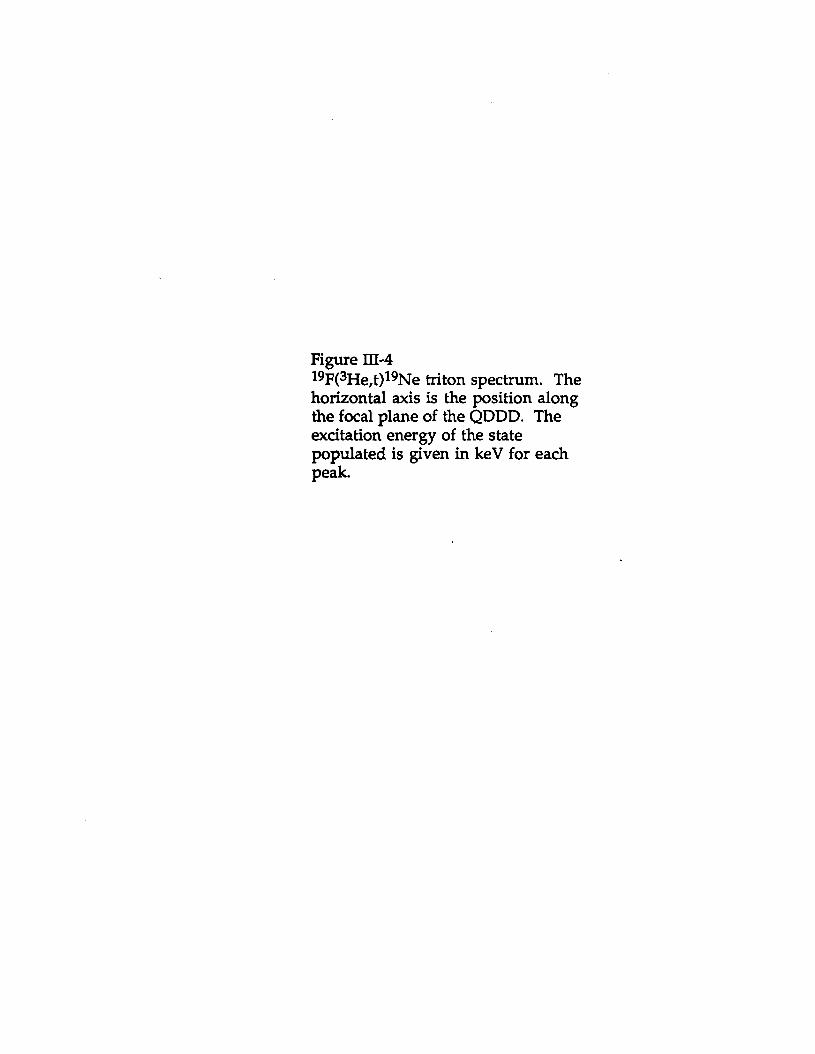
19F(3He,t)19Ne triton spectrum. The horizontal axis is the position along the focal plane of the QDDD. The excitation energy of the state populated is given in keV for each peak.
Figure m -4
Coun
ts pe
r Ch
anne
l
T riton S in g le s S p e ctru m
Channel Number
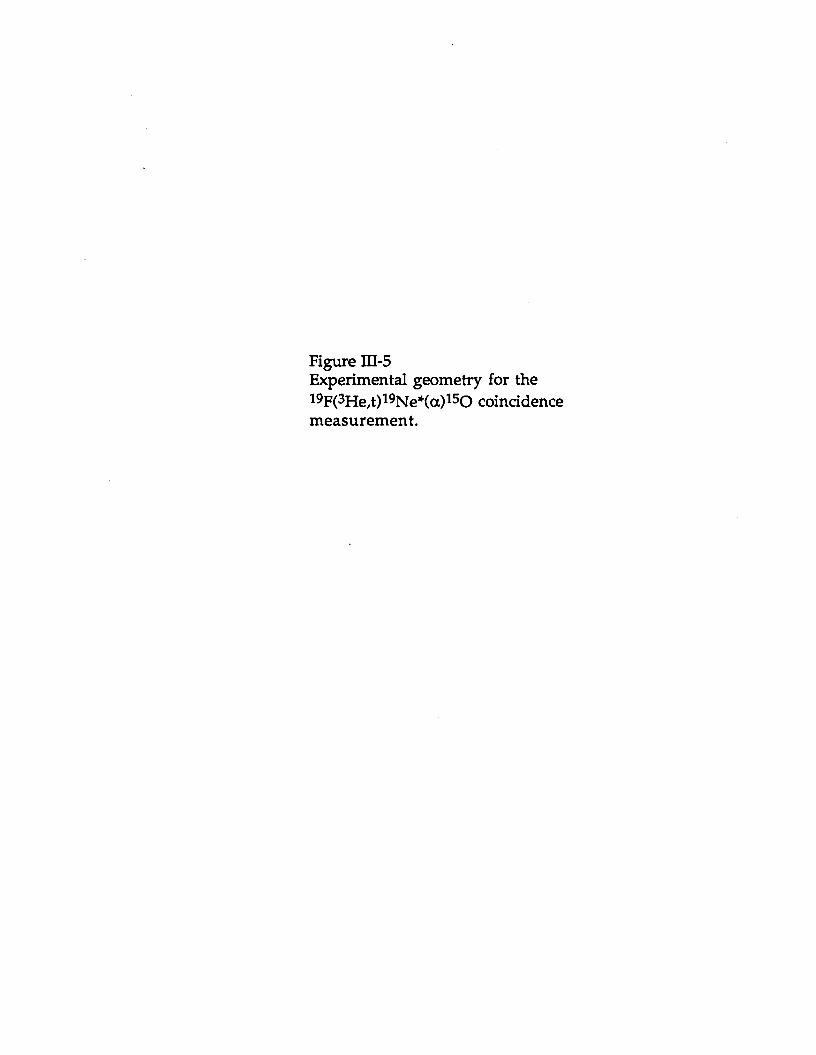
Figure HI-5Experimental geometry for the 19F(3He,t)19Ne*(a)150 coincidence measurement.
3 He (29.8 MeV)
3 H (21.0-22.5 MeV)
Q D D D @ 0 °
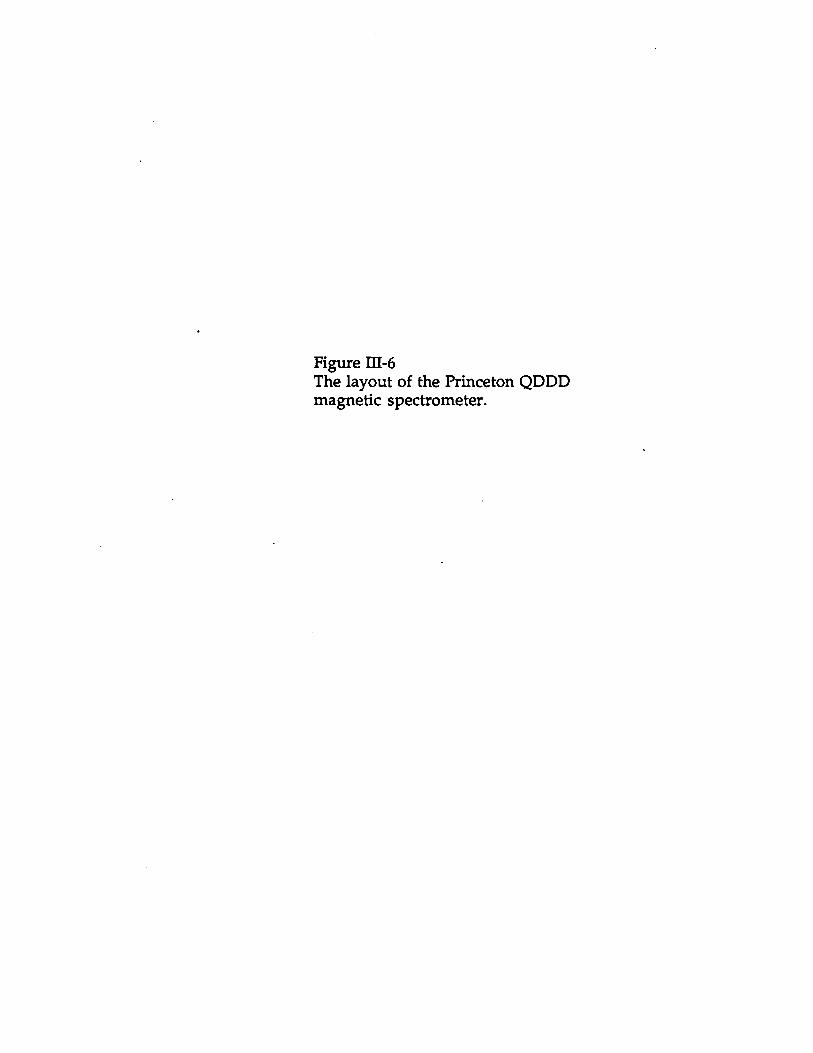
Figure HI-6The layout of the Princeton QDDD magnetic spectrometer.
P R I N C E T O N QDDD S P E C T R O G R A P H
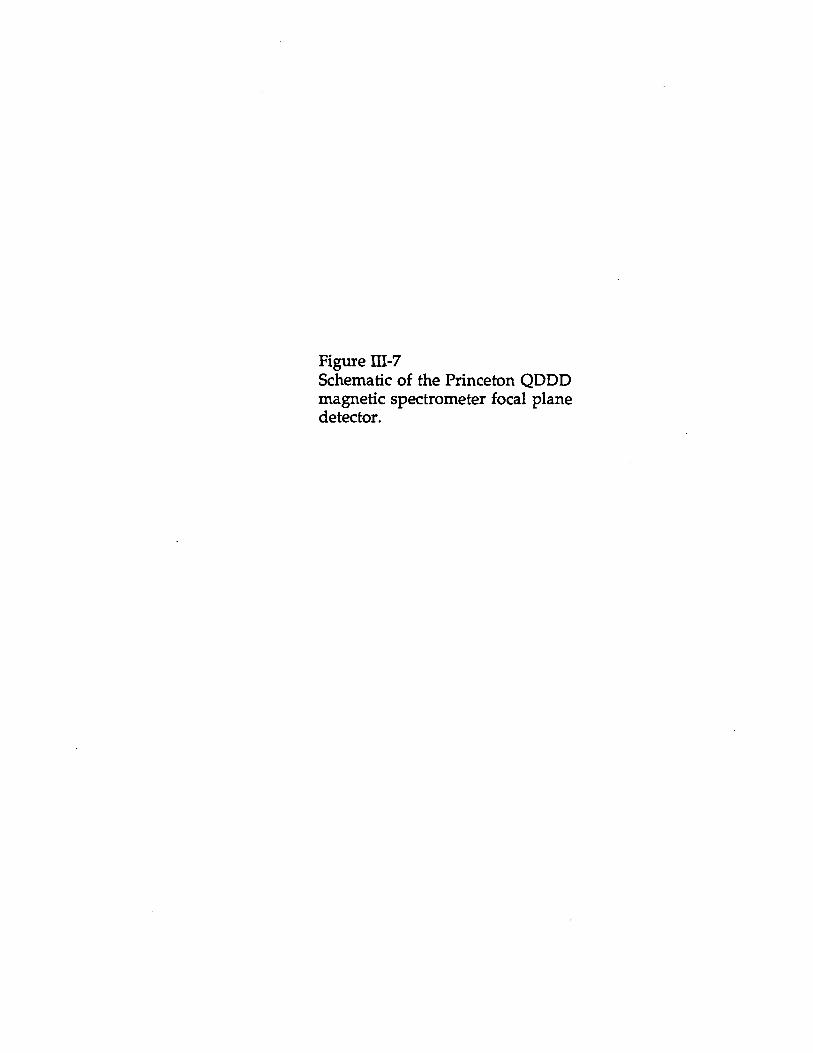
Figure HI-7Schematic of the Princeton QDDD magnetic spectrometer focal plane detector.
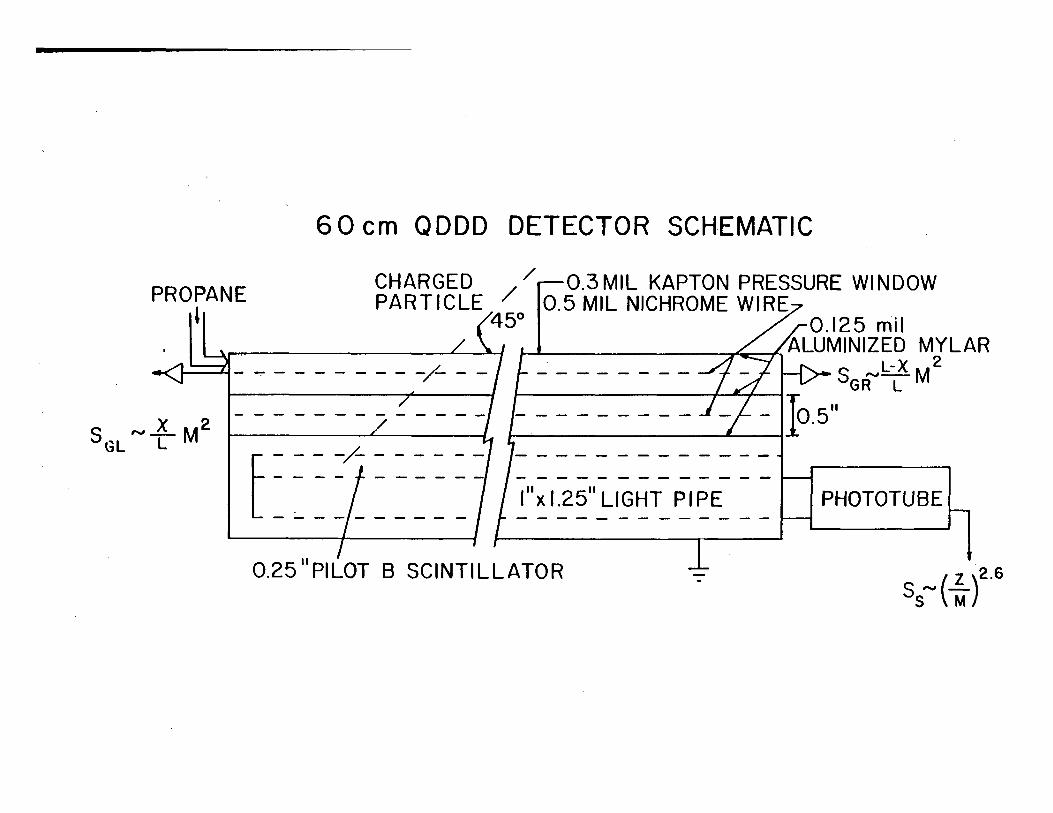
6 0 c m QDDD DETECTOR SCHEMATIC
P R O P A N E I
C H A RG E DP A R T I C L E
C ~ J L M 2 G L L M
r— 0 . 3 MIL KAPTON P R E S S U R E WINDOW 0 . 5 MIL NICHROME W I R E
0 . 1 2 5 mil ALUMINIZED M Y L A R
l " x l . 2 5 " L I G H T P I P E P H O T O T U B E
0 . 2 5 P ILOT B S C I N T I L L A T O R T / z \2®S s ~ ( i )
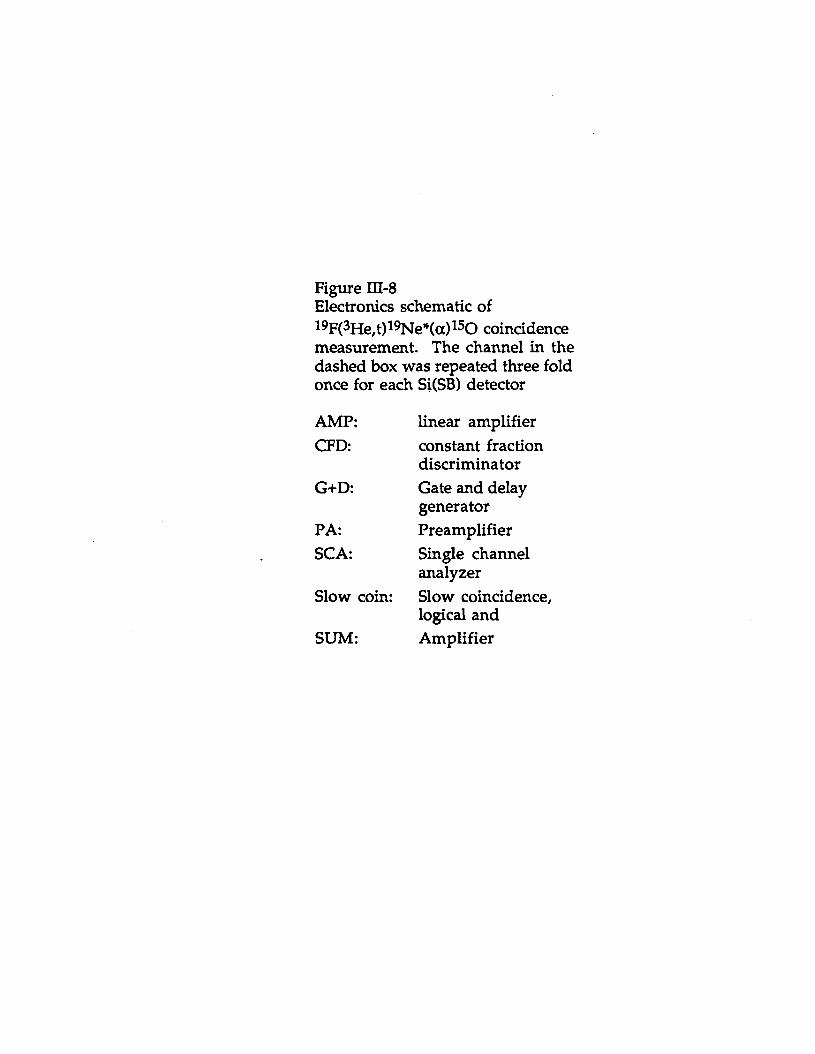
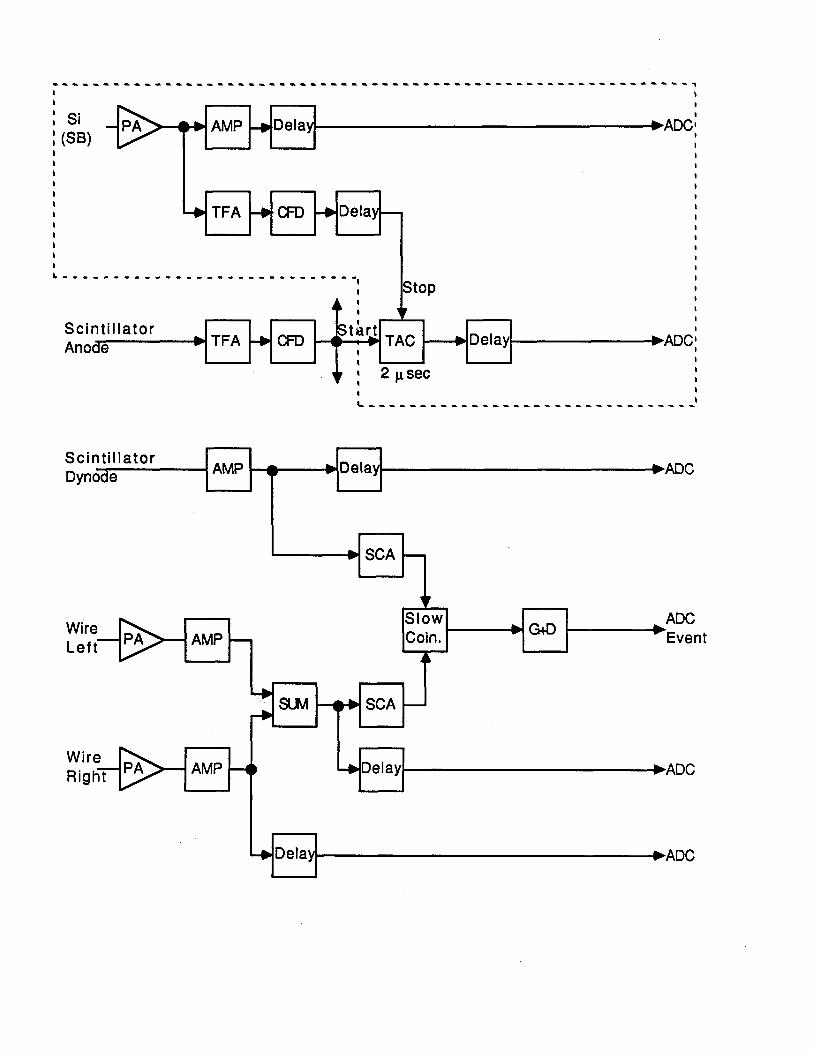
Figure HI-8Electronics schematic of 19F(3He,t)19Ne*(oc)150 coincidence measurement. The channel in the dashed box was repeated three fold once for each Si(SB) detector
AMP: linear amplifierCFD: constant fraction
discriminatorG+D: Gate and delay
generatorPA: PreamplifierSCA: Single channel
analyzerSlow coin: Slow coincidence,
logical andSUM: Amplifier
c ,
19F(3He,d)20Ne deuteron spectrum. The horizontal axis is the position along the focal plane of the QDDD. The excitation energy of the state populated is given in keV for each peak.
Figure IQ-9
Coun
ts
per
Cha
nnel19 3 20
F( He,d) Ne
C hannel N um ber
Figure III-10Flow chart showing the software gates used to select the coincidence events.
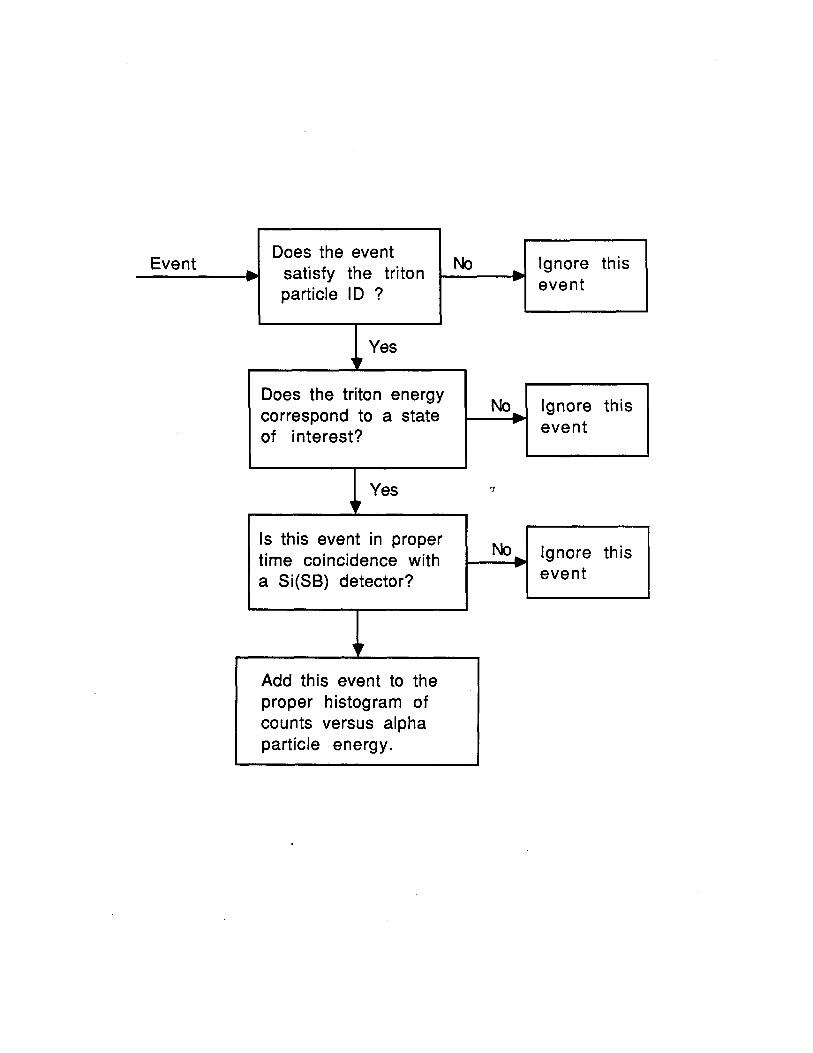
Figure III-ll TAC spectra for the 19F(3He,t)19Ne(a)150 reaction and the state at Ex=5785 keV in 20Ne for the19F(3He,d)20Ne(a)16O reaction. The time of alpha detection time minus triton (deuteron) detection time is plotted along the horizontal axis.
100 300 500 700
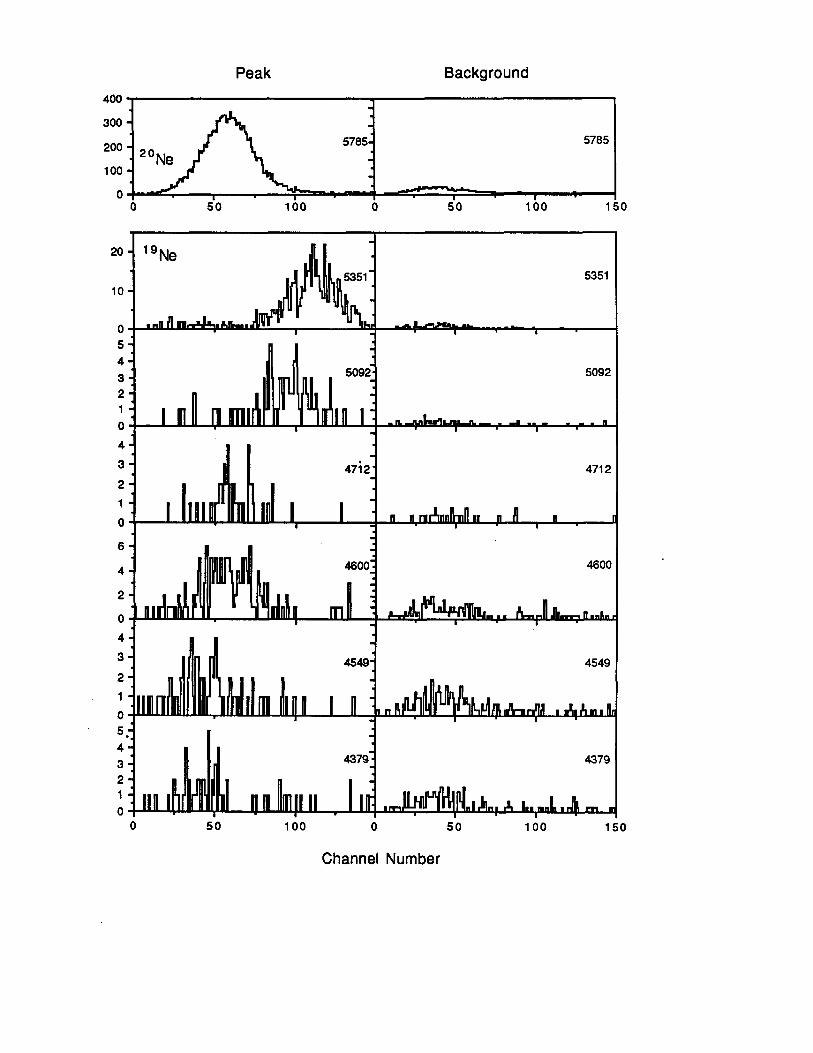
Figure IE-12The Si(SB) detector spectra. The left hand column shows the those events in coincidence with tritons (deuterons) resulting in the population of states in 19Ne(20Ne). The right hand side shows the those events not in coincidence (i.e. gated on a background TAC window) with tritons or deuterons. Because much longer windows were used for the background TAC window to improve statistics, the background spectra are scaled down by the appropriate proportion.
0
>0
10
0543210432106
4
20432105,43210
Peak Background
19Ne Jl
.................... J \ :
5351
I! 5092*
i H i J m l . r
5092
1 III i A
1
4712 ‘
l i i l i i '
4712
n n nrfnnlUiH n n fl n r
n i U l r
4600]
J^ iU i m l i
4600
h_rIIJb—
l l l l l i
1 4549‘
u l l i l m l | i i r
4549
III l ' l
4379j
l N n n L|> ii I ' f
4379
A lnwnti irJ m . ■50 100 0 50 100 150
Channel Number
53
A summary of the width information for the 4379, 4549, 4600, 4712 and
5092-keV states in 19Ne is given in table IV-1. A value of (or a limit on) the
quantity of interest coy (the resonance strength) can be calculated from any two
of the three parameters (1^ ,1%, B=Ta/Ty). To see this we can write y in three
ways (co is known in all cases).
IV ) C on clu sion s
Since all three parameters now have independently measured values or
limits, a variety of consistency checks can be made. The values for coy
calculated by the three formulae above are listed in table IV-1, and are self
consistent for the states at Ex=4549 keV, 4600 keV and 4712 keV. The values
of coy calculated for the state at Ex=5092 keV are not in complete agreement,
however, a value of coy of 40 meV would not be in strong disagreement with
any of the calculated values. This agreement confirms the validity of
calculating Ta's in l 9Ne from Toe's measured in 9F by simply considering
barrier penetration. No other states in this system are presented in table IV-1
because the check is not sensitive enough to be enlightening because either
T a » T y and B=1 or r<x«Ty and B=0.
The value of coy for the 4549 keV state is small enough that it does not
contribute significantly to the lsO(a,y)19Ne reaction rate. The value of coy for
the Ex = 4600 keV state is, however, nine times bigger than the value given by
LWFG. The net result of these two changes does not change the reaction rate
predicted by LWFG by more than 20% at any given temperature. Figures IV-1
and IV-2 show the fractional contribution of each resonance calculated using
y - T a Ty/ (Ta + Ty)
y = TyB
y - T a ( l - B )
IV-1
IV-2
IV-3
the modified resonances strengths and the ratio of the current reaction rate to
that calculated by LWFG.
This results are somewhat different than we reported previously (Ma86 ).
At the time that our previous calculation was made not enough information
was available to determine the resonance strength of the 4600-keV state, and
therefore the available lower limit for Ty had to be used.
To determine under what conditions leakage will occur out of the HCNO
cycle the hydrogen burning time scale needs to be compared with to the lsO
capture life time. The reaction rate for alpha-capture on lsO is given by the
sharp resonance formula and is of the form
Rl5 = [150 ][<xU(T) IV-4
where [X] is the density of species X and X(T) is a function of temperature
calculated using the parameters for resonances in 19Ne (see chapter II).
U T ) = ( ^ J / 2 K2 £ (coy)r exp(-Er/kT) IV-5r
The time scale for lsO consumption via alpha-particle capture is simply
rl5oi 1
and is plotted in figure IV-3 for a density of 5000g/cm3 and a helium mass
fraction of one fifth, typical of solar compositions^ conditions which might be
found on the hottest novae.
The hydrogen burning time scale is given by t(H)=[H] (d[H]/dt)-L For slow
burning the hydrogen consumption rate will be governed by the beta decay
55
times of 140 and 150 and d[H]/dt can be calculated by d[H]/dt=4 [Z]/(tpi5+tpi4)
where [Z] is the concentration of HCNO catalyst seed nuclei and tpx is the life
time for beta-decay of xO. The factor of four comes in because four protons are
consumed each cycle. The result is
t(H) = [H] (tpi4 +tpi5> / 4 [Z]
For leakage to occur t(H)/t(lsO) >1 and this can now be written as
[H] [a] (tpi4 +tpis) A,(T) / 4 [Z] > 1
for the assumed conditions. Figure IV-4 shows the area on a temperature
density plot where this condition is satisfied for solar abundances. Significant
leakage begins to occur near T=3.5xl08K. For burning time scales shorter than
the oxygen beta decay times, the burning time scale will be given by the
proton capture rates which are extremely temperature dependent.
From these results it is still not clear that 150(a,y)19Ne provides a
mechanism for break-out from the HCNO cycle in novae in order to produce
the observed abundances for nuclei with A>20. Model calculations indicate
that novae temperatures can reach as high as 3.5 to 5.0xl08K (Su80) These
conditions occur in fast burning novae and leakage will occur, but the
conditions necessary (M=1.4M0) for these high temperatures to occur are at
the extreme of possible conditions. For novae where the burning time is
longer, peak temperatures are expected to be lower, near 2.5x10⁸K. At these
temperatures the reaction rate is dominated by the 504-keV resonance
(Ex=4033 keV in 19Ne). Neither of the experiments presented in this thesis
were sensitive to that resonance. On the other hand, it is also not clear that
56
the observed abundances can be explained by explosions on the surfaces of O-
Ne-Mg white dwarfs since the preexisting 0,Ne,Mg material is apt to be
processed to heavier nuclei by the rp process.
These results indicate the need to put the 150(a/y)19Ne reaction rate at
lower temperatures on a firmer footing by determining the resonance
strength for the 4033 keV state in 19Ne. We plan to determine the branching
ratios for the 4033 keV state in 19Ne by measuring the 19F(3He/t)19Ne*(150 )a
reaction. The experimental set up will be something like figure IV-5. A 19F
target will be bombarded by a 60MeV 3He beam. By observing tritons at a back
angle (140°) one can (a) know when the state of interest is populated and (b)
insure that the 19Ne recoils (0=16.1°) with enough energy (24.2MeV) so that
the 150 from its subsequent decay can be easially detected. If the l9Ne* decays
into an 150 and an alpha particle the resulting lsO will recoil forward in a
cone with an opening angle of 4.3° around 16.1°. By detecting the recoiling
150 in coincidence with the tritons the branching ratios can be determined.
This method has the advantage over the triton alpha coincidence method
presented in this thesis in that the recoiling 150 are so tightly collimated that
whenever a 150 is produced by 19Ne* decay there is a probability of about 1/2
that it will be detected (the three Si(SB) detectors in the triton alpha
coincidence cover only 1.5% of the 4n solid angle). Even under these
conditions it will be a difficult measurement. Assuming a cross section of
50p.b/sr to populate the Ex=4033-keV state, a solid angle of 0.03sr for triton
detection and a alpha-particle branch of 10~4 the yield will be only three or
four coincidences per day given a lOOnA beam of 3He++.

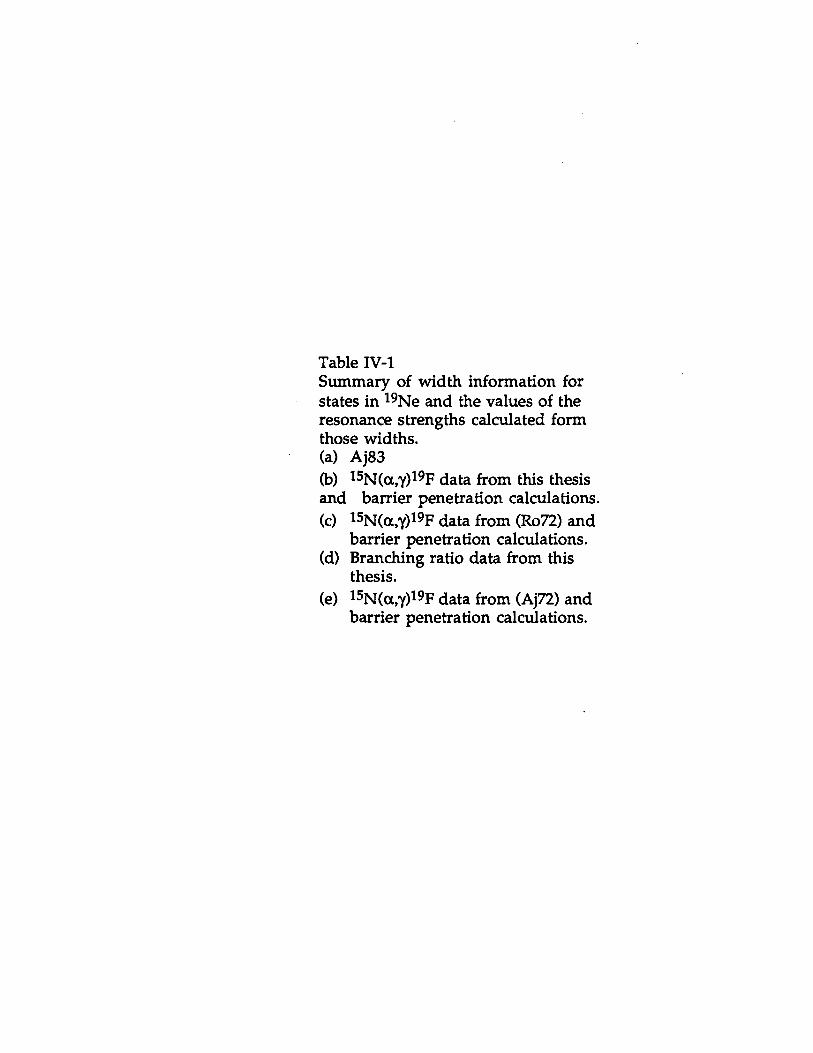
Table IV-1Summary of width information for states in 19Ne and the values of the resonance strengths calculated form those widths.(a) Aj83(b) 15N(<x,y)19F data from this thesis and barrier penetration calculations.(c) 15N(<x,y)19F data from (Ro72) and
barrier penetration calculations.(d) Branching ratio data from this
thesis.(e) 15N(<x,y)19F data from (Aj72) and
barrier penetration calculations.
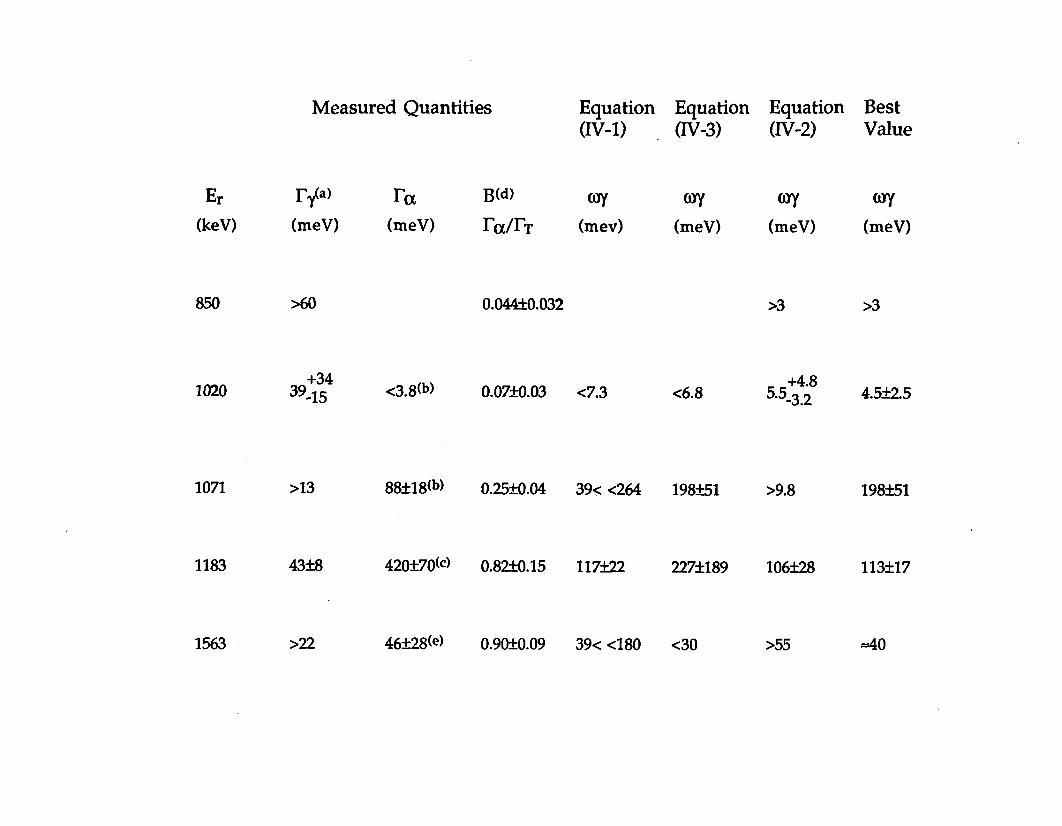
M easured Q uantities Equation Equation Equation B est(IV-1) (IV-3) (IV-2) Value
Er iy a ) r « BW> toy wy ojy (uy
(keV) (meV) (meV) r<x/rx (mev) (meV) (meV) (meV)
850 >60 0.044±0.032 >3 >3
+34 +4 81020 39 15 <3.8 O5) 0.07±0.03 <7.3 <6.8 5.5.3 2 4.5±2.5
1071 >13 88±18(b) 0.25±0.04 39< <264 198±51 >9.8 198151
1183 4318 420i70(c> 0.8210.15 117122 2271189 106128 113117
1563 >22 46128(e) 0.9010.09 39< <180 <30 >55 =40
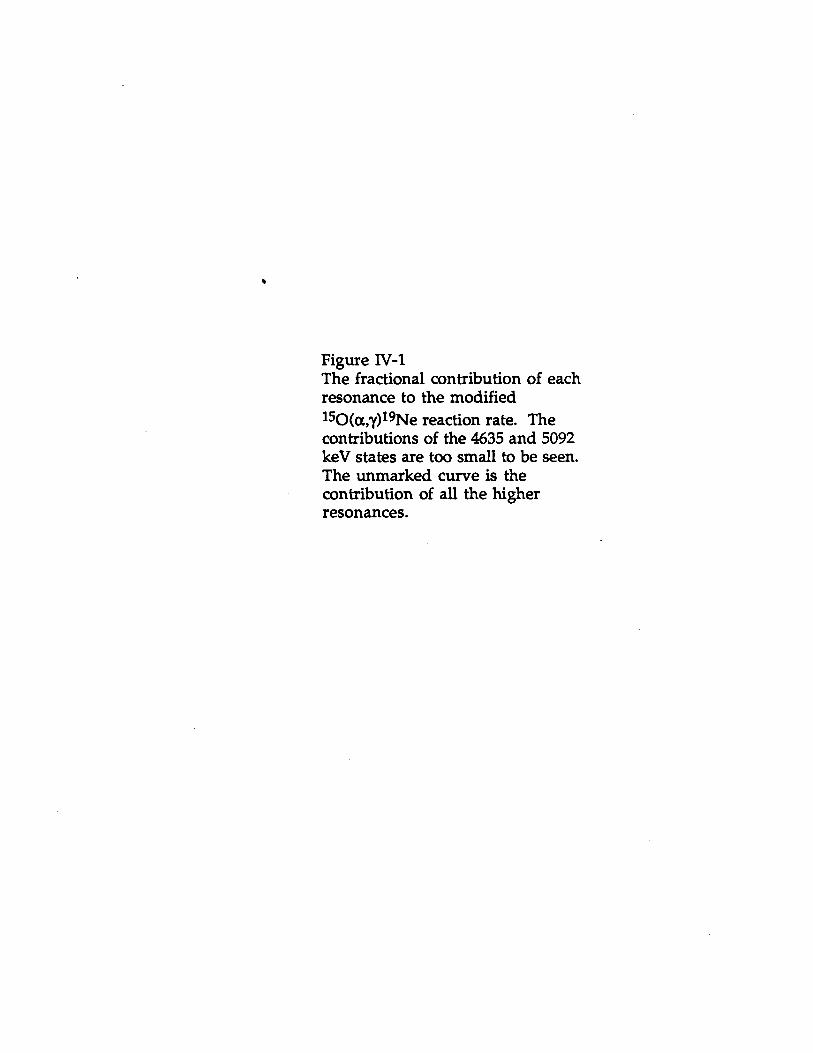
Figure IV-1The fractional contribution of each resonance to the modified150(a,y)19Ne reaction rate. The contributions of the 4635 and 5092 keV states are too small to be seen. The unmarked curve is the contribution of all the higher resonances.
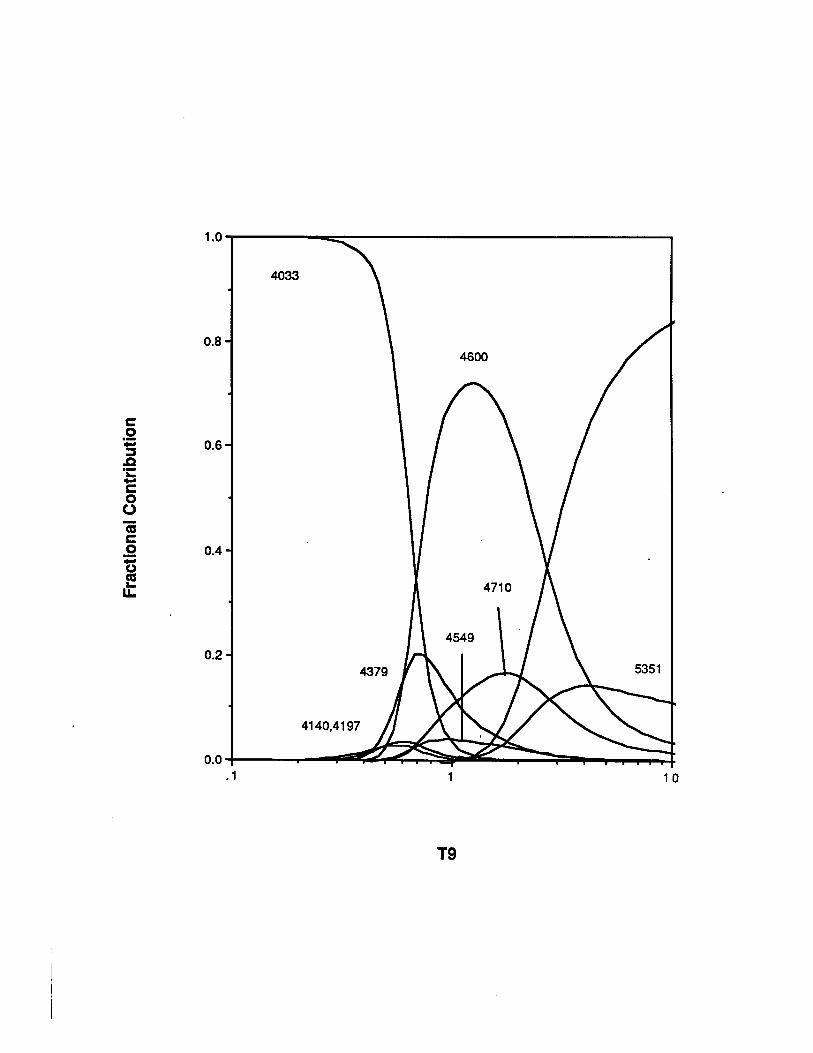
Frac
tiona
l Co
ntrib
utio
n
T9
Figure IV-2The ratio of the present reaction rate to that of LWFG as a function of temperature.
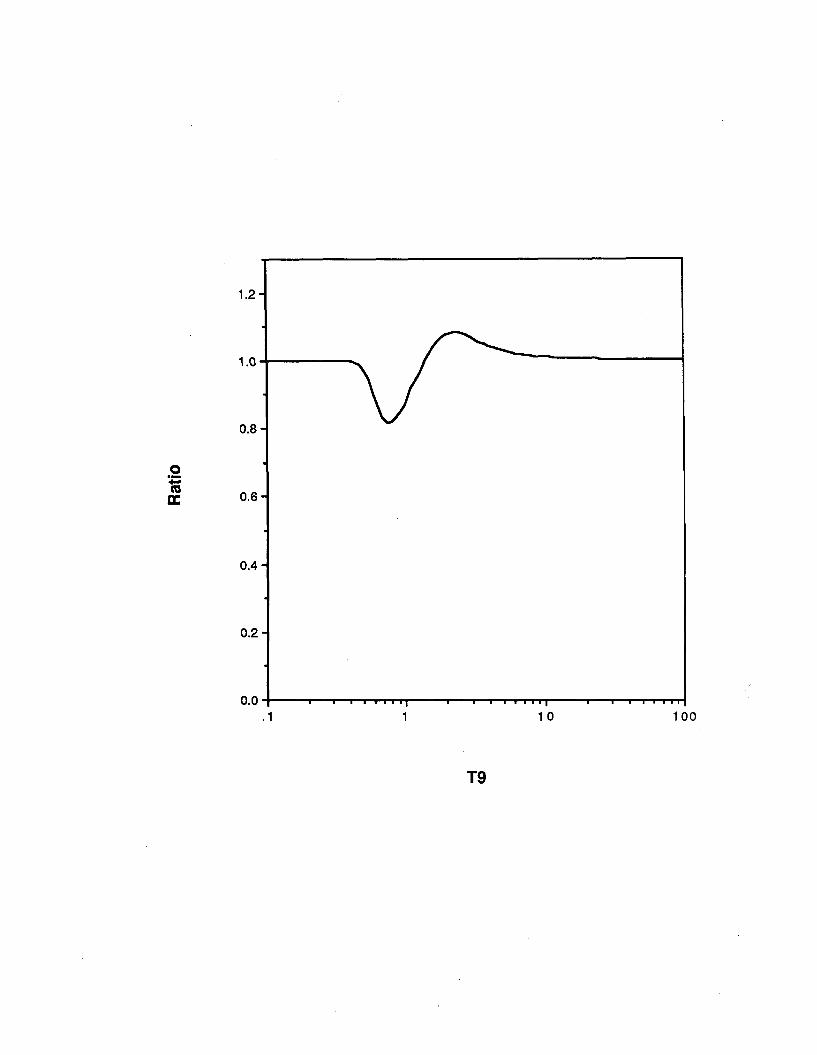
Ratio
T 9
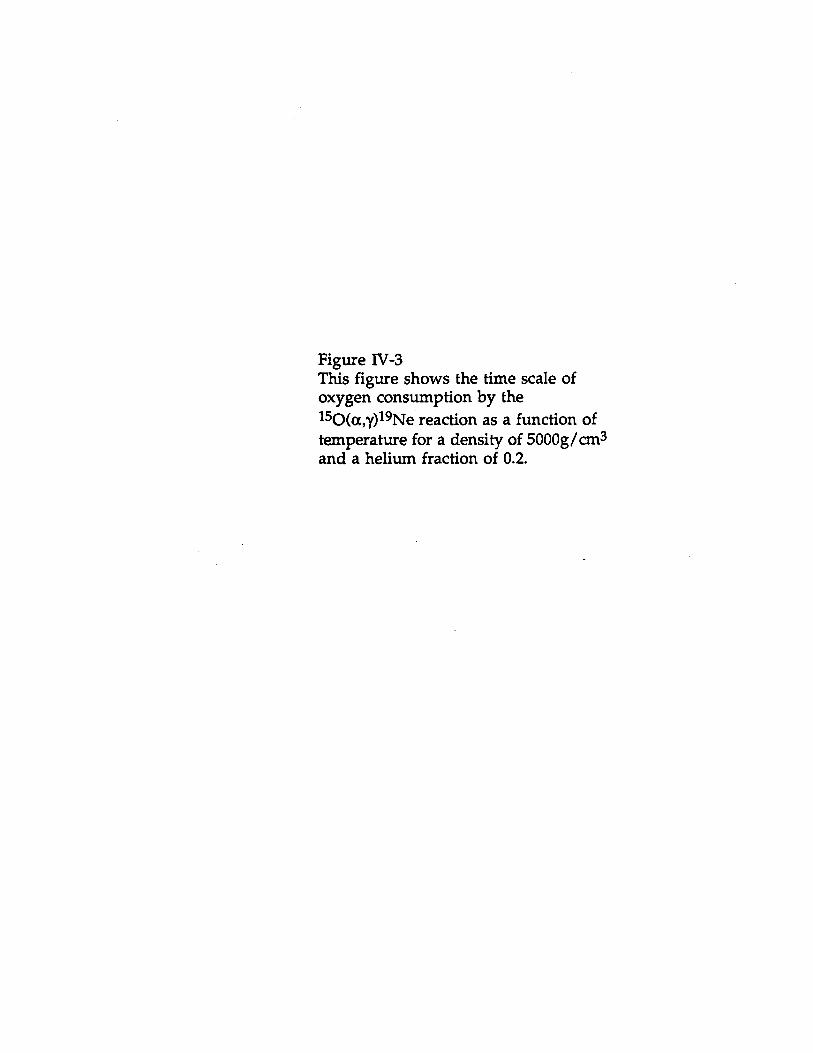
Figure IV-3This figure shows the time scale of oxygen consumption by the150(a,y)19Ne reaction as a function of temperature for a density of 5000g/cm3 and a helium fraction of 0.2.
log(
tlme)
T9
Figure IV-4This figure shows the T-p boundaryabove which the 150(a,y)19Ne reaction causes break out from the HCNO cycle for solar composition. Above the curve break out will occur and below the curve the HCNO cycle will operate.
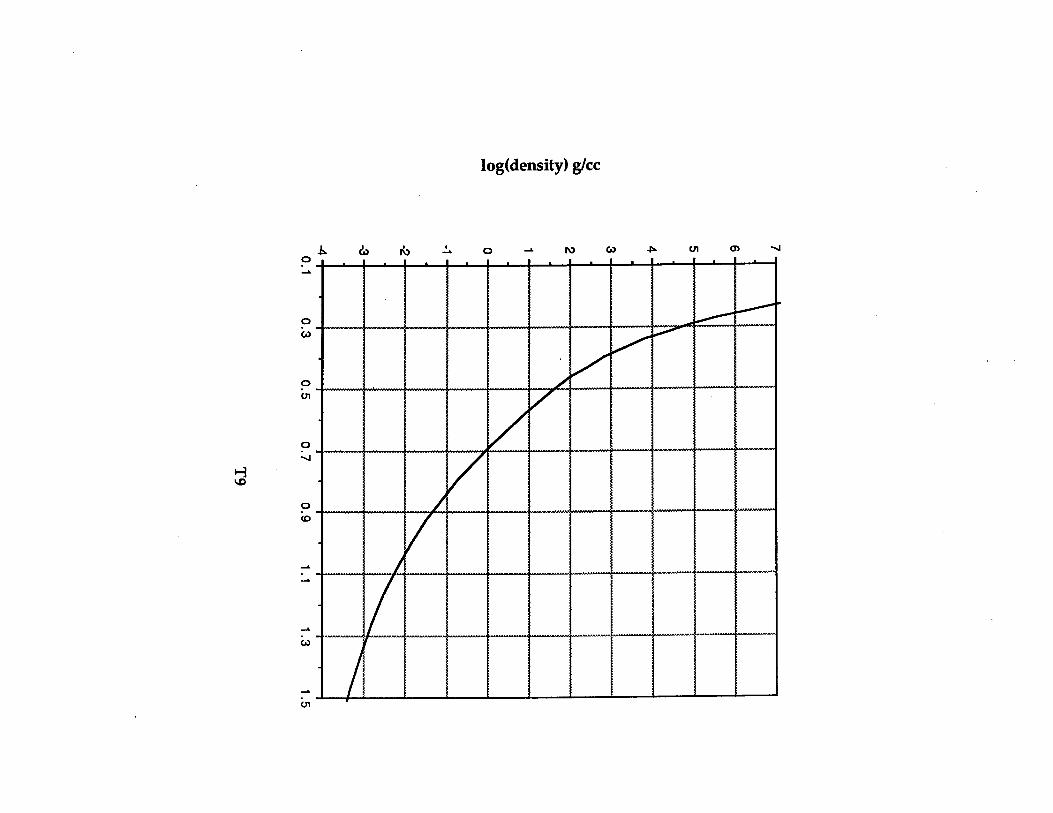
log(density) g/cc
Figure IV-5Experimental arrangement for proposed 19F(3He,t)19Ne*(lsO)a experiment.

Split PoleMagnetic Spectrom eter with hybrid gas counter at the focal plane.

REFERENCES
(Aj72) F. Ajzenberg-Selove, Nucl. Phys. A190 (1972) 1.
(Aj83) F. Ajzenberg-Selove, Nucl. Phys. A392 (1983) 1.
(A179) L. Alaerts, R.S. Lewis and E. Anders, in Lunar and Planetary Sci. X, (Houston: Lunar and Planetary Inst.), pl2
(An80) A. Anttila, S. Brandenburg, J. Keinonen, M. Bister Nucl. Phys. A334 (1980) 205
(Be39) H.A. Bethe Phys. Rev. 55 (1939) 434
(Bi71) H.G. Bingham, H.T. Fortune, J.D. Garrett and R.M. Middleton, Phys. Rev. Letters, 26 (1971) 1448
(B169) D.C. Black and R.O. Pepin, Earth Planet. Sd. Letters 6 (1969) 395
(B172) D.C. Black, Geochim. et Cosmochim. 36 (1972) 377
(Ca82) A. G. W. Cameron, Elemental and nudidic abundances in the solar system, in Essays in Nuclear Astrophysics. (Cambridge University Press, 1982).
(C183) D.D. Clayton, Principles of Stellar Evolution and Nucleosynthesis. (The University of Chicago Press, 1983).
(Di77) W.R. Dixon, T.J.M. Symons, A.A. Pilt, K.W. Allen, C.H. Zimmerman, F. Watt, and S.P. Dolan Phys. Lett. A62 (1977) 479
(Eb79) P. Eberhardt, M.H.A. Jungck, F. O. Meier, and F. Niederer, Ap. J. 234 (1979) LI 69
(Fe78) G.J. Ferland and G.A. Shields, Ap. T. 226 (1978) 172.
(Fo86) H.T. Fortune, private communication (1986)
(Fr74) K.J. Fricke, Ap. J. 189 (1974) 535
(Ge86) R. D. Gertz, G. L. Grasdalen, M. Greenhouse, J. A. Hackwoll, T. Hayward, and A. F. Bentley Ap. J. 308 (1986) L63
(Ko74) R.T. Kouses, Ph.D. Thesis, Princeton University, 1974
(Ib84) I. Iben Jr. and A. Tutukov, Ap. J. Suppl. 54 (1984) 335.

64
(La83) W.Y. Law and H. Ritter Astron. Astrophys. 123 (1983) 33.
(La86) K. Langanke, M. Wiescher, W.A. Fowler, and J. Gorres Ap. J. 301 (1986)
(Ma87) P. Magnus, M.S. Smith, P.D. Parker R.E. Azuma, C.Campbell, J.D.King, and J. Vise, Nucl. Phys. A470 (1987) 206
(Mi70) G. Michaud, and W.A. Fowler, Phys. Rev. C 2 (1970) 2041
(Ni77) F. Niederer and P. Eberhardt, Meteoritics 12 (1977) 327
(Ro72) D.W.O. Rogers, J.H. Aitken and A.E. Litherland, Can. J. Phys. 50 (1972) 268.
(Ro76) D.W.O. Rogers, A.L. Carter, T.J.M. Symons, S.P. Dolan, N. Anyas- Weiss, and K.W. Allen, Can. J. Phys. 54 (1976) 938
(Sa79) T. Sakuda and F. Nemoto, Prog. Thoer. Phys. 62 (1979) 1274.
(Sa80) G.R. Satchler, Introduction to Nuclear Reactions. (John Wiley and Sons, 1980)
(Sc83) D.N. Schramm, Nucleosynthetic Interpretations of Isotopic Anomalies, in Nucleosynthesis Challenges* and New Developments. (The University of Chicago Press, 1985), pl06.
(Sm78) S.P. Smith, J.C. Huneke and G.J. Wasserburg, Earth Planet. Sci. Lett. 39 (1978) 1
(Sn84) M.A.J. Snijders, T.J. Batt, M.J. Seaton, J.C. Blades and D.C. Morton,Mon. Not. R Astr. Soc. 211 (1984) 7P
(Sr78) B. Srinivasan and E. Anders, Science 201 (1978) 51
(St74) S. Starrfield, W.M. Sparks and J.W. Truran, Ap. J. Suppl. 28 (1974) 247
(Su52) H.E. Suess and H.C. Urey, Rev. Mod.Phys., 28 (1956) 53
(Su80) D. Sugimoto, M.Y. Fujimoto, K. Naraia and K. Nomoto, Proc. IAUColl. 53, eds. H.M. van Horn and V. Weidemann, Rochester University Press, 1980, p280
(Ta79) RE. Tamm and RE. Picklum, Ap. J. 233 (1979) 327

65
(Th75) K.S. Thome and A.N. Zytkow, Ap. J. 199 (1975) L19
(Tr83) J.W. Truran, Nucleosynthesis in Novae, in NucleosynthesisChallenges and New Developments. (The University of Chicago Press, 1985), p292.
(Tr85) J.W. Truran, Proceedings of the ESO Workshop on "Production and distribution of the CNO elements" (1985) 211
(Wa81) R.K. Wallace and S.E. Woosley, Ap. J. Suppl. 45 (1981) 389
(We38) C.F. von Weizsacker Phys. Z. 39 (1938) 633
(Wi82) M.E. Wiedenbeck, Cosmic Rays as a Possible Probe of the Composition of Interstellar Matter, in Nucleosynthesis Challenges and New Developments. (The University of Chicago Press, 1985), p89.
(Wi85) R.E Williams, E.P. Ney, W.M. Sparks, S.G. Starrfield, S. Wyckoff and J.W. Truran, Mon. Not. R. Astr. Soc. 212 (1985) 753
(Wi86) M. Wiescher, J. Gorres, F.-K. Thielemann and H. Ritter Astron. Astrophys., 160 (1986) 56.
(Wi87) M. Wiescher, J. Gorres, L.O. Lamm and C.P. Browne, preprint.
(Zi77) J.F. Ziegler, Helium stopping powers and ranges in all elemental matter. (Pergamon, N.Y.), 1977