Embed Size (px)
Citation preview
ABSTRACT
STEEL SURFACE OXIDATION AFTER PICKLINGBy Yume Gerenrot and David Leychkis
Ferrotech, Applied Research Center, Pittsburg, PA, U.S.A.
Oxidation of coIled rolled steels panels after pickling in different acids and rinsing with tapwater and in a beaker was investigated by Optically Stimulated Electron Emission technique.Exposed to ambient air steel surface after pickling, rinsing and blotting gains very quicklyoxide film.
PAGE 1 OF 6
STEEL SURFACE OXIDATION AFTER PICKLING
By Yume Gerenrot and David Leychkis
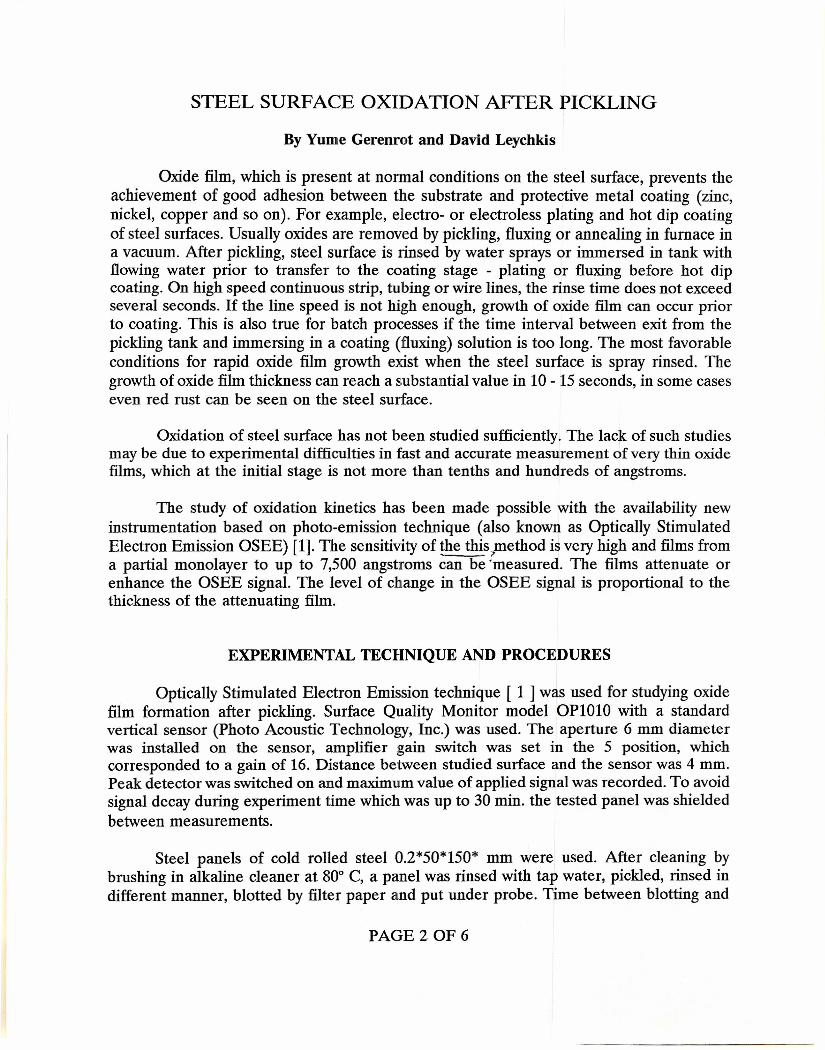
Oxide film, which is present at normal conditions on the steel surface, prevents theachievement of good adhesion between the substrate and protective metal coating (zinc,nickel, copper and so on). For example, electro- or electroless plating and hot dip coatingof steel surfaces. Usually oxides are removed by pickling, fluxing or annealing in furnace ina vacuum. After pickling, steel surface is rinsed by water sprays or immersed in tank withflowing water prior to transfer to the coating stage - plating or fluxing before hot dipcoating. On high speed continuous strip, tubing or wire lines, the rinse time does not exceedseveral seconds. If the line speed is not high enough, growth of oxide film can occur priorto coating. This is also true for batch processes if the time interval between exit from thepickling tank and immersing in a coating (fluxing) solution is too long. The most favorableconditions for rapid oxide film growth exist when the steel surface is spray rinsed. Thegrowth of oxide film thickness can reach a substantial value in 10 - 15 seconds, in some caseseven red rust can be seen on the steel surface.
Oxidation of steel surface has not been studied sufficiently. The lack of such studiesmay be due to experimental difficulties in fast and accurate measurement of very thin oxidefilms, which at the initial stage is not more than tenths and hundreds of angstroms.
The study of oxidation kinetics has been made possible with the availability newinstrumentation based on photo-emission technique (also known as Optically StimulatedElectron Emission OSEE) [1]. The sensitivity of the this"method is very high and films froma partial monolayer to up to 7,500 angstroms can be 'measured. The films attenuate orenhance the OSEE signal. The level of change in the OSEE signal is proportional to thethickness of the attenuating film.
EXPERIMENTAL TECHNIQUE AND PROCEDURES
Optically Stimulated Electron Emission technique [ 1] was used for studying oxidefilm formation after pickling. Surface Quality Monitor model OP1010 with a standardvertical sensor (Photo Acoustic Technology, Inc.) was used. The aperture 6 mm diameterwas installed on the sensor, amplifier gain switch was set in the 5 position, whichcorresponded to a gain of 16. Distance between studied surface and the sensor was 4 mm.Peak detector was switched on and maximum value of applied signal was recorded. To avoidsignal decay during experiment time which was up to 30 min. the tested panel was shieldedbetween measurements.
Steel panels of cold rolled steel 0.2*50*150* mm were used. After cleaning bybrushing in alkaline cleaner at 80° C, a panel was rinsed with tap water, pickled, rinsed indifferent manner, blotted by filter paper and put under probe. Time between blotting and
PAGE 2 OF6
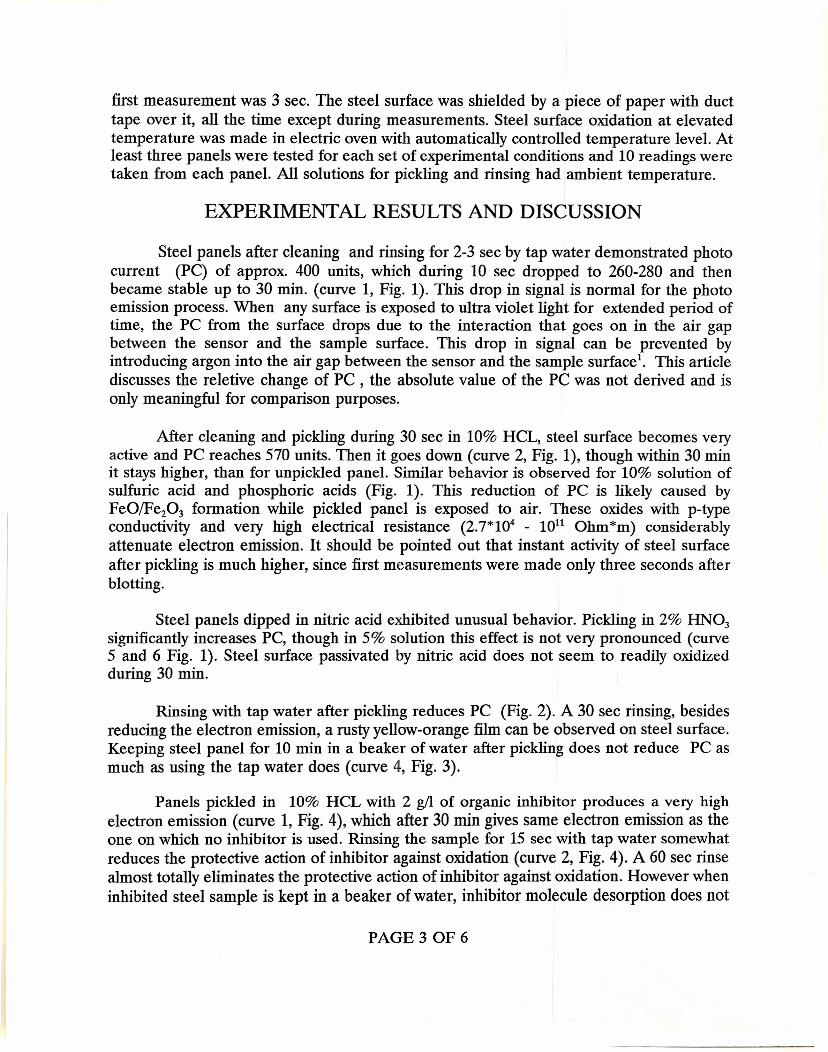
first measurement was 3 sec. The steel surface was shielded by a piece of paper with ducttape over it, all the time except during measurements. Steel surface oxidation at elevatedtemperature was made in electric oven with automatically controlled temperature level. Atleast three panels were tested for each set of experimental conditions and 10 readings weretaken from each panel. All solutions for pickling and rinsing had ambient temperature.
EXPERIMENTAL RESULTS AND DISCUSSION
Steel panels after cleaning and rinsing for 2-3 see by tap water demonstrated photocurrent (PC) of approx. 400 units, which during 10 see dropped to 260-280 and thenbecame stable up to 30 min. (curve 1, Fig. 1). This drop in signal is normal for the photoemission process. When any surface is exposed to ultra violet light for extended period oftime, the PC from the surface drops due to the interaction that goes on in the air gapbetween the sensor and the sample surface. This drop in signal can be prevented byintroducing argon into the air gap between the sensor and the sample surface'. This articlediscusses the reletive change of PC , the absolute value of the PC was not derived and isonly meaningful for comparison purposes.
After cleaning and pickling during 30 see in 10% HCL, steel surface becomes veryactive and PC reaches 570 units. Then it goes down (curve 2, Fig. 1), though within 30 minit stays higher, than for unpickled panel. Similar behavior is observed for 10% solution ofsulfuric acid and phosphoric acids (Fig. 1). This reduction of PC is likely caused byFeO/Fe203 formation while pickled panel is exposed to air. These oxides with p-typeconductivity and very high electrical resistance (2.7*104 - 1011 Ohm*m) considerablyattenuate electron emission. It should be pointed out that instant activity of steel surfaceafter pickling is much higher, since first measurements were made only three seconds afterblotting.
Steel panels dipped in nitric acid exhibited unusual behavior. Pickling in 2% HN03
significantly increases PC, though in 5% solution this effect is not very pronounced (curve5 and 6 Fig. 1). Steel surface passivated by nitric acid does not seem to readily oxidizedduring 30 min.
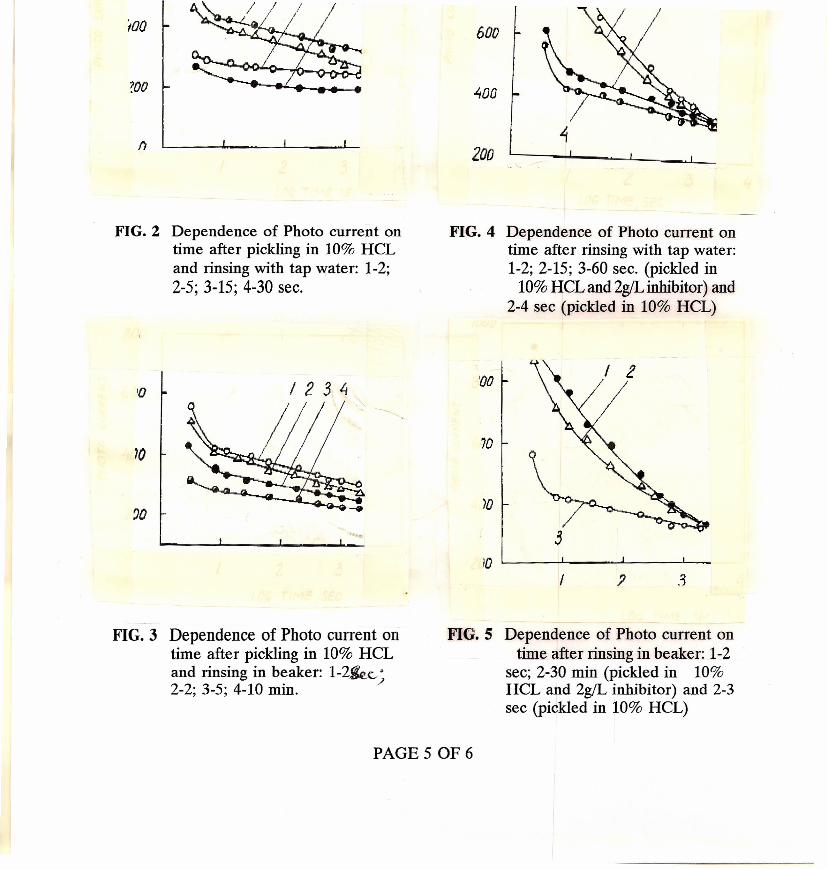
Rinsing with tap water after pickling reduces PC (Fig. 2). A 30 see rinsing, besidesreducing the electron emission, a rusty yellow-orange film can be observed on steel surface.Keeping steel panel for 10 min in a beaker of water after pickling does not reduce PC asmuch as using the tap water does (curve 4, Fig. 3).
Panels pickled in 10% HCL with 2 g!l of organic inhibitor produces a very highelectron emission (curve 1, Fig. 4), which after 30 min gives same electron emission as theone on which no inhibitor is used. Rinsing the sample for 15 see with tap water somewhatreduces the protective action of inhibitor against oxidation (curve 2, Fig. 4). A 60 see rinsealmost totally eliminates the protective action of inhibitor against oxidation. However wheninhibited steel sample is kept in a beaker of water, inhibitor molecule desorption does not
PAGE 3 OF6
occur even after 30 min period. (curve 2, Fig. 5)
Since PC reduction after pickling is attributed to iron oxide emerging, it wasinteresting to find out how artificially created oxide film will influence electron emission, Asteel panel after cleaning and rinsing, which gave a PC of 250-280, was heated in the ovento 2200 C. Heating the steel panel to this temperature produced a light yellow oxide film,approximately 4,000 Angstrom thick [3], on the surface. The electron emission from thissurface dropped to 100 - 120 units. Another panel was heated to 3000 C. This panelappeared blue in color and had an oxide film approximately 7,000 Angstroms thick [3]. Pcfrom this panel increased to 650 -700 units. It is possible that Fe304 oxide, which emergesat this temperature [2] is responsible for high electron emission. This oxide has n-typeconductivity and its electrical resistance does not exceed 5.2*10-5 Ohm*m [4].
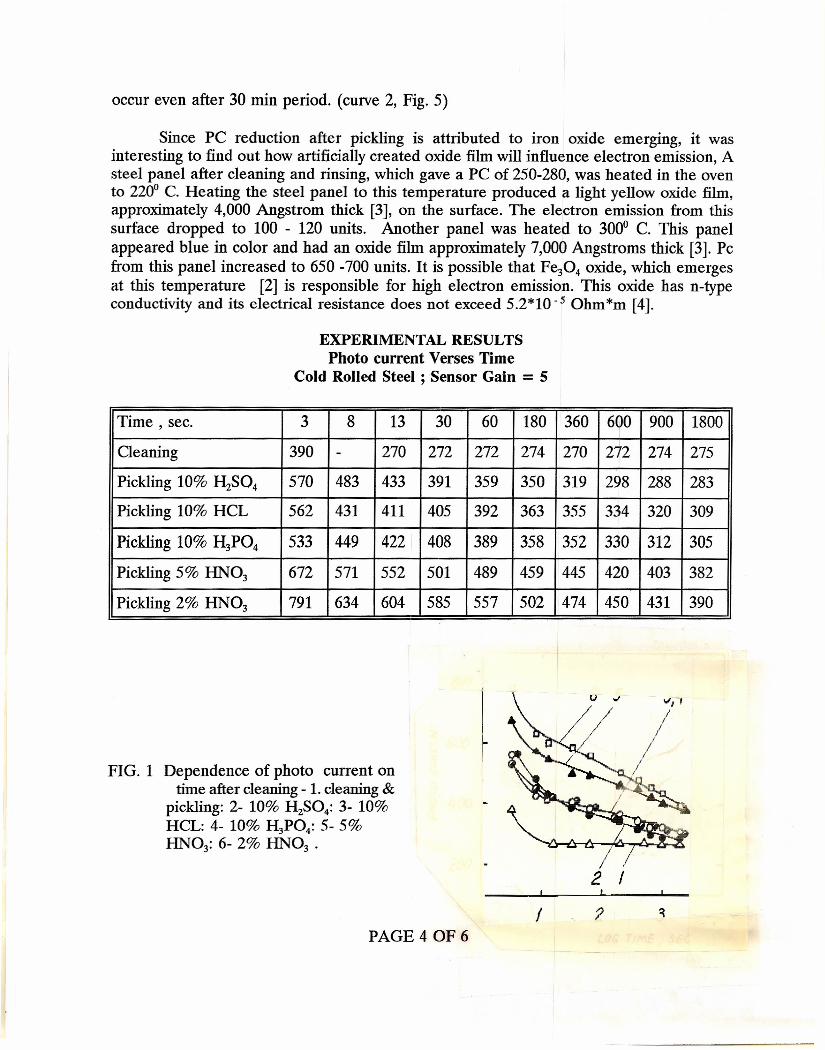
EXPERIMENTAL RESULTSPhoto current Verses Time
Cold Rolled Steel ; Sensor Gain = 5
Time, sec. 3 8 13 30 60 180 360 600 900 1800
Cleaning 390 - 270 272 272 274 270 272 274 275
Pickling 10% H2SO4 570 483 433 391 359 350 319 298 288 283
Pickling 10% HCL 562 431 411 405 392 363 355 334 320 309
Pickling 10% H3P04 533 449 422 408 389 358 352 330 312 305
Pickling 5% HN03 672 571 552 501 489 459 445 420 403 382
Pickling 2% HN03 791 634 604 585 557 502 474 450 431 390
FIG. 1 Dependence of photo current ontime after cleaning - 1. cleaning &
pickling: 2- 10% H2S04: 3- 10%HCL: 4- 10% H3P04: 5- 5%HN03: 6- 2% HN03 •
IPAGE 4 OF6

tOO
?OO
FIG. 2 Dependence of Photo current ontime after pickling in 10% HCLand rinsing with tap water: 1-2;2-5; 3-15; 4-30 sec.
600
~oa
200
FIG. 4 Dependence of Photo current ontime after rinsing with tap water:1-2; 2-15; 3-60 sec. (pickled in
10% HCL and 2gILinhibitor) and2-4 see (pickled in 10% HCL)
/ 2 3 4;00
10
70 70
)0')0
10 , J .3
FIG. 3 Dependence of Photo current ontime after pickling in 10% HCLand rinsing in beaker: 1-21kc...•2-2; 3-5; 4-10 min. /
FIG. 5 Dependence of Photo current ontime after rinsing in beaker: 1-2
see; 2-30 min (pickled in 10%HCL and 2g!L inhibitor) and 2-3see (pickled in 10% HCL)
PAGES OF6
REFERENCES1. Mantosh K. Chawla, Plating & Surface Finishing, p. 40, August 1990
2. Herbert H Uhlig, R. Winston Revie, Corrosion and Corrision Control. AnIntroduction to Corrosion Sciense and Engineering, John Wiley & Sons, NY, 1985
3. Evans, U. R., Corrosion and Oxidation of Metals, St. Martin's Press, NY, 1960
4. Handbook of Chemistry and Physics, 69 Edition, CRC Press Inc., Boca Raton, FL,1989, p. B-206
PAGE 6 OF6