Embed Size (px)
Citation preview
The fatigue behaviour of ZnO nano-particle
modified thermoplastics
K. Zuoa, B.R.K. Blackmana,*, J.G. Williamsa, H. Steiningerb
aDepartment of Mechanical Engineering, Imperial College London,
South Kensington Campus, London SW7 2AZ, UK
bBASF SE, GKP/R - G201, 67056 Ludwigshafen, Germany
Abstract
The present paper describes an investigation into the effects on the fatigue behaviour of
adding up to 1.00 vol.% ZnO nano-particles to two amorphous styrene acrylonitrile
copolymers. Two acrylonitrile contents, i.e. 24% and 34% respectively, were studied.
Fracture mechanics based fatigue tests were conducted on the various materials at 5 Hz and a
Paris Law analysis approach was followed. The fatigue threshold increased notably with the
addition of ZnO nano-particles. The increases in toughness were analysed using a model of
plastic void growth around the particles which gave surface energy per unit area values for the
debonding process. Good particle distribution was achieved only for very small volume
fractions (<0.3%) and large agglomerated particles and consequential toughness declines were
observed. In the fatigue threshold region, surface micrographs showed clear evidence of the
debonding and plastic voids and their average size (100 nm) agreed well with the analysis.
Keywords: ZnO nano-particles; Styrene acrylonitrile; Fatigue; Toughening
* Corresponding author:
B.R.K. Blackman, E-mail: [email protected]
Tel: +44 20 7594 7196; Fax: +44 20 7594 7017
1
1 Introduction
The increasing rate of application of thermoplastics in design and engineering components
which are subjected to repeated loadings, such as gears and bearings, has resulted in a demand
for an understanding of the behaviour in terms of the resistance to fatigue crack growth. The
addition of rigid nano-particles into polymers has been shown to impart a significant
improvement to the static mechanical properties of some polymers [1-5]. However, only
limited investigations [6-15] have been carried out to identify the effect of nano-particles on
the fatigue crack propagation (FCP) behaviour of polymers.
Blackman et al. [8] investigated the fracture and fatigue behaviour of epoxy polymers
modified by nano-silica particles. Silica nano-particles with an average size of approximately
20 nm were well dispersed into an epoxy polymer with weight fractions of up to 20 wt.%. The
Young’s modulus and fracture toughness were found to increase steadily with increasing
nano-contents. Significant improvements in the stress intensity factor range threshold, ,
were also observed with the epoxy based nano-composites. Manjunatha et al. [9, 10]
investigated the effects of micron sized rubber particles and nano-silica particles on the tensile
fatigue behaviour of epoxy polymer and a glass-fibre-reinforced epoxy composite. The
fatigue life of micron sized rubber modified and nano-silica modified epoxy was found to be
3 to 4 times longer than that of neat epoxy. The presence of both micron sized rubber and
nano-silica particles in the hybrid composite appeared to further enhance the fatigue life
significantly, i.e. by a factor of 6-10 times compared to the neat epoxy. Wetzel et al. [13] also
found that the addition of 13 nm alumina nano-particles to epoxy increased the stress intensity
range threshold significantly. Zhang et al. [14] dispersed multiwalled carbon nanotubes
(MWCNTs) with a mean diameter of 20 nm and length of 20 μm into epoxy, and showed that
the addition of 0.50 wt.% MWCNTs reduced the FCP rate by about one order of magnitude.
The results are not always consistent for the nano-particle modified polymer composites. For
example, Bellemare et al. [7] found that the addition of nano-clay particles to polyamide 6
(PA 6) decreased the fatigue resistance. Wang et al. [12] also found nano-sized rubber
particles decreased the fatigue life of epoxy. However, the mechanisms leading to the
reduction were not investigated by the authors.
2
The present paper discusses the effect of adding zinc oxide (ZnO) nano-particles to modified
styrene acrylonitrile (SAN) polymer composites on their fatigue behaviour. The fatigue
performance was evaluated by generating curves of the crack growth rate, , versus the
maximum fracture energy threshold, , on pre-cracked specimens. The mechanisms of
fatigue fracture have been characterised with the aid of scanning electron microscopy (SEM).
2 Experimental
2.1 Materials
Two amorphous styrene acrylonitrile (SAN) copolymers with the trade names of Luran VLN
and Luran VLP have been studied. The VLN contains 24% acrylonitrile and is referred to as
SAN-24 in the present work. The VLP contains 34% acrylonitrile and is referred to as SAN-
34 in the present work. The ZnO particles were short nano-rods, which had an average
diameter of 12 nm and an aspect ratio (length/diameter) of 3. These were previously referred
to as the B particles in [16]. All materials were manufactured by BASF SE, Germany. The
SAN/ZnO composites were prepared in a Werner & Pfleiderer ZSK-30 twin screw extruder at
a rotation speed of 150 rpm. The extruded plates were dried at 80 °C in vacuum for 36 hours,
and then compression moulded into 6 mm and 4 mm thick sheets using a hot compression
machine (DAKE, USA) at 200 °C and 5 MPa.
2.2 Fatigue testing
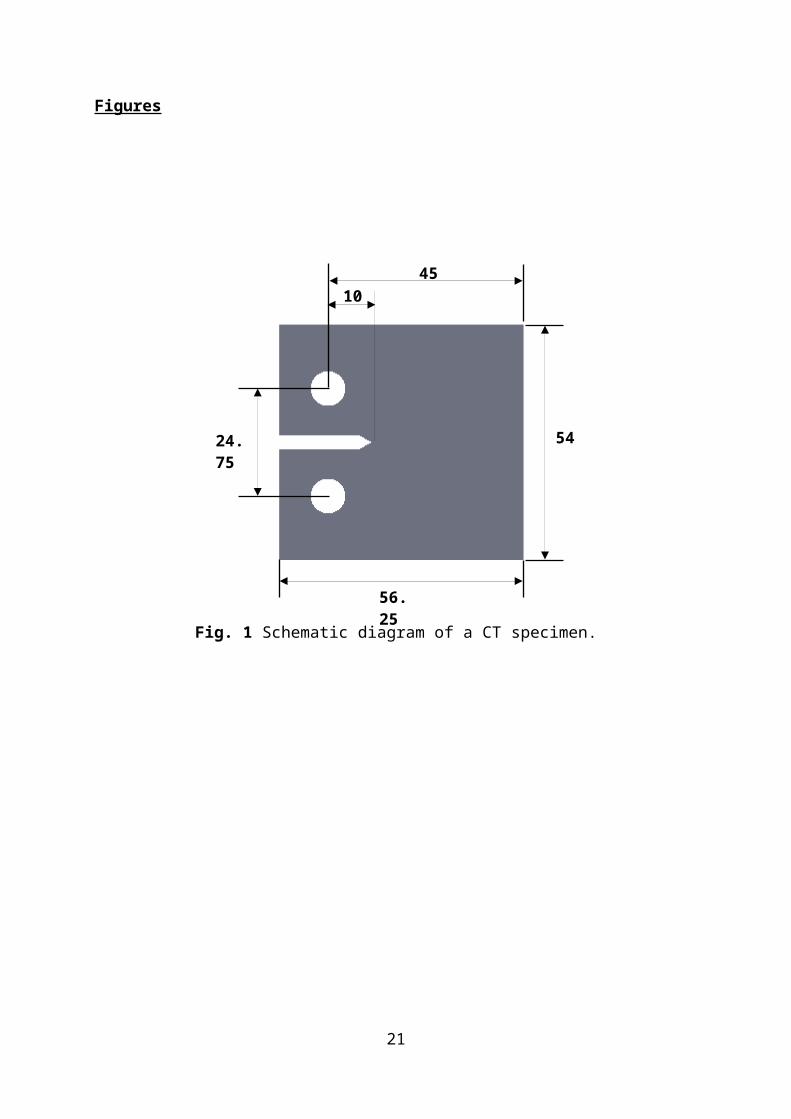
Compact tension (CT) specimens with a thickness of 6 mm and width of 45 mm were
manufactured, as specified in ASTM E647-08e1 [17] and ISO 15850 standards [18]. Fig. 1
shows the geometry of the CT specimens employed for the fatigue tests. The specimens were
pre-cracked via the crack tapping method with a new razor blade used for each specimen to
ensure the growth of a natural crack ahead of the machined notch. The fatigue tests were
carried out on a servo-hydraulic Instron machine (model 8872), coupled with a 1 kN load cell
to accommodate the relatively low loads measured. At least two repeat tests were carried out
for each formulation, in order to determine the threshold value, below which there was no
fatigue crack propagation.
3
The fatigue loading cycle applied was a tension-tension sinusoidal function with the
maximum and minimum displacements held constant. The displacement ratio ( )
was set to 0.5 and a test frequency of 5 Hz were employed. The maximum displacements,
, were chosen at the points where the loads corresponded to half of the fracture
toughness, .
The crack length was monitored using a Krak-gauge and Fractomat from Rumul (Neuhausen
am Rheinfall, Switzerland). The Krak-gauge consists of a thin (~5 m) constantan metal foil
which was bonded, much like a strain gauge, to one side of the CT specimen using standard
‘M-bond’ adhesive resin and a curing agent from Vishay (Selb, Germany). The Krak-gauge
was connected to a computer via a Fractomat, and was cracked simultaneously with the crack
in the test specimen. The load, crosshead position and the number of cycles was recorded by
‘Chart 4’ software (AD Instruments, New Zealand). The data collected by the software were
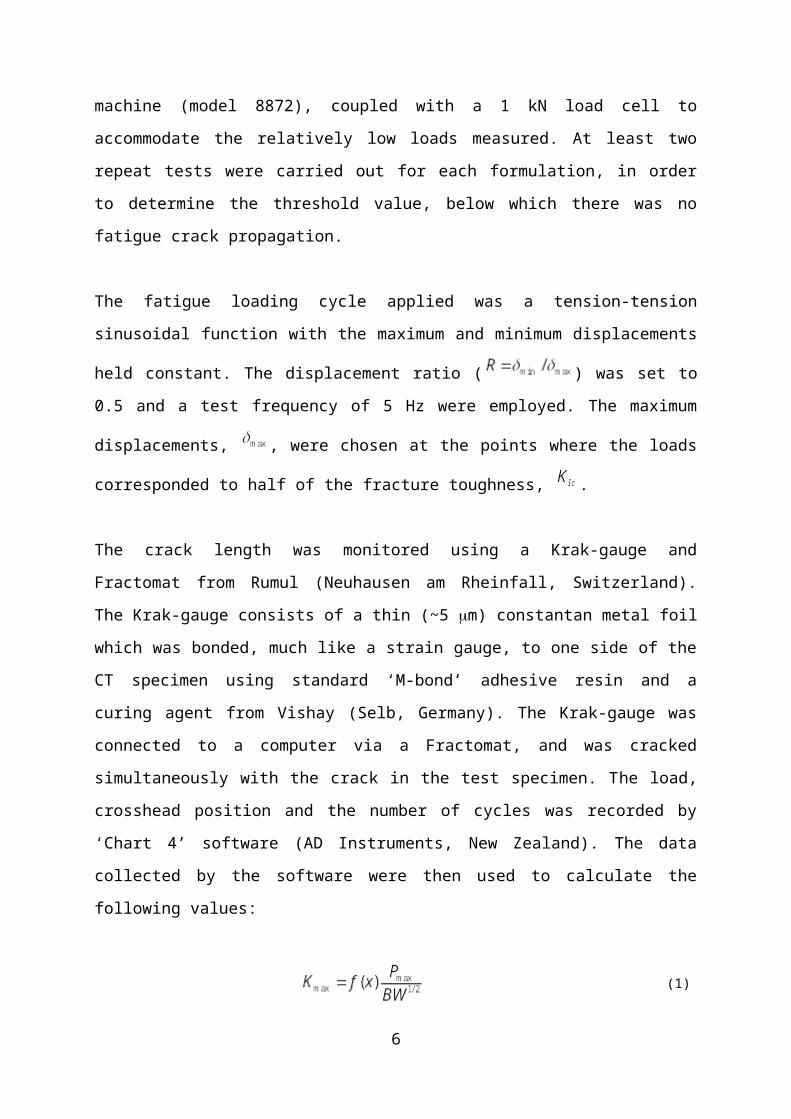
then used to calculate the following values:
(1)
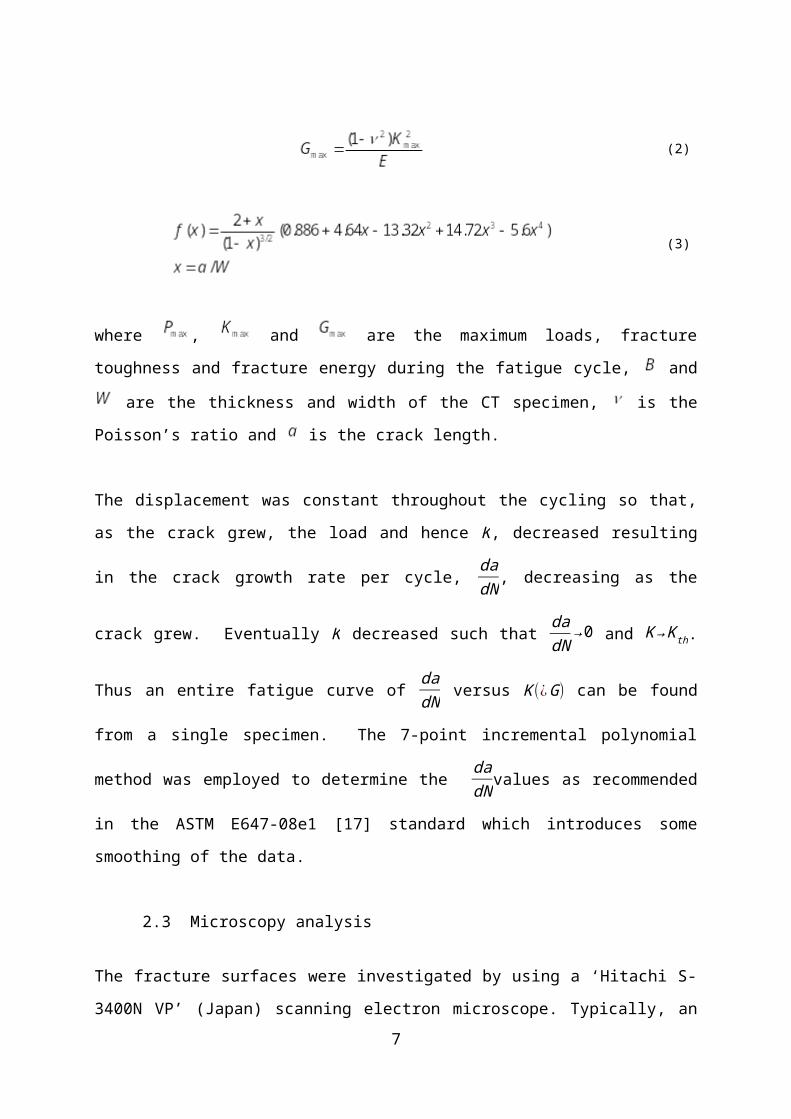
(2)
(3)
where , and are the maximum loads, fracture toughness and fracture energy
during the fatigue cycle, and are the thickness and width of the CT specimen, is the
Poisson’s ratio and is the crack length.
The displacement was constant throughout the cycling so that, as the crack grew, the load and
hence K , decreased resulting in the crack growth rate per cycle, dadN , decreasing as the crack
4
grew. Eventually K decreased such that dadN
→ 0 and K → K th. Thus an entire fatigue curve
of dadN versus K (¿G) can be found from a single specimen. The 7-point incremental
polynomial method was employed to determine the dadN values as recommended in the ASTM
E647-08e1 [17] standard which introduces some smoothing of the data.
2.3 Microscopy analysis
The fracture surfaces were investigated by using a ‘Hitachi S-3400N VP’ (Japan) scanning
electron microscope. Typically, an accelerating voltage of 15 kV was used, and the working
distance was around 10 mm. The fracture surfaces were sputter coated with gold to reduce the
charging effect prior to the SEM examinations.
3 Results and Discussion
3.1 Quasi-static test results
The dispersion of ZnO nano-rods in the matrix, the glass transition temperatures and results of
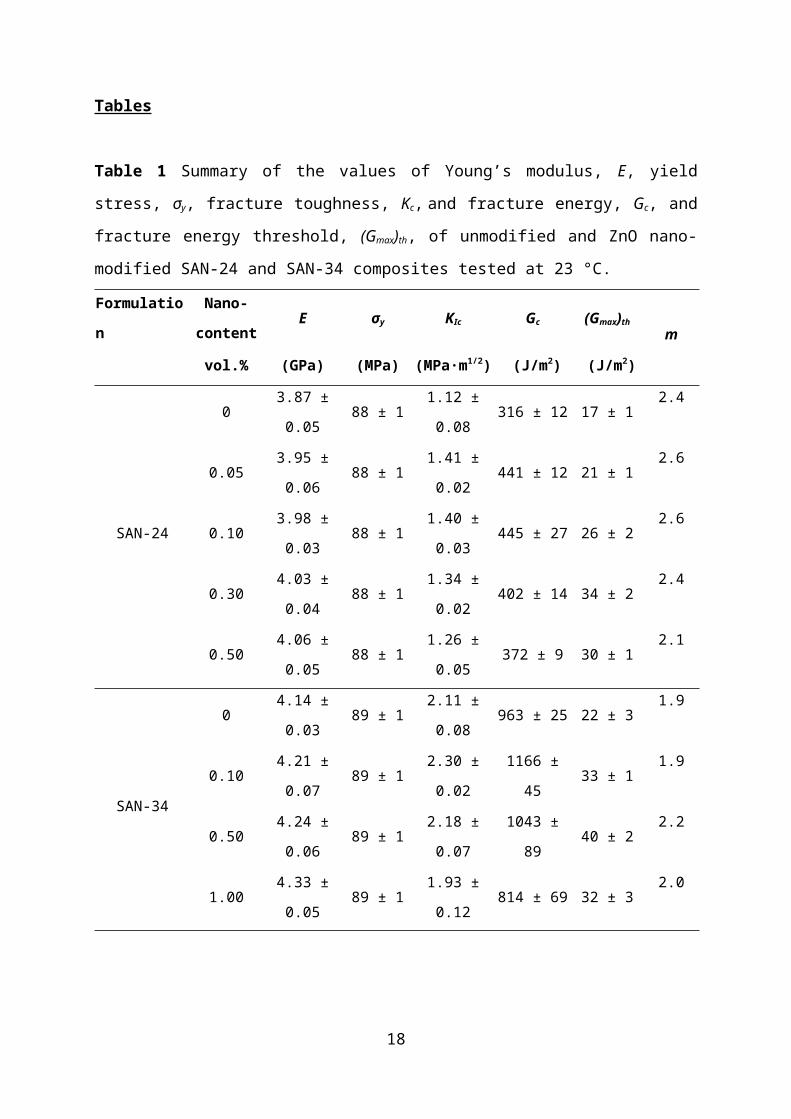
quasi-static tests at 23 °C (summarised in Table 1) were reported in [16]. The nano-rods were
observed to be relatively well dispersed in the matrix when present in concentrations of up to
0.30 vol.%. The addition of nano-rods had only a marginal effect on the glass transition
temperature and yield stress of the composites. The Young’s modulus of the SAN-24
composite increased from 3.87 GPa to 3.95 GPa at ϕ=0.05 % and to 3.98 GPa at ¿0.1 % . A
simple law of mixtures with adhesion between the particles and the matrix would give:
Ec=Em (1−ϕ )+Ep ϕ
where Ec is the composite modulus and Em and Ep are the matrix and particle modulus values
respectively. For very small ϕ values, as used here,
Ec
Em≈ 1+
E p
Emϕ
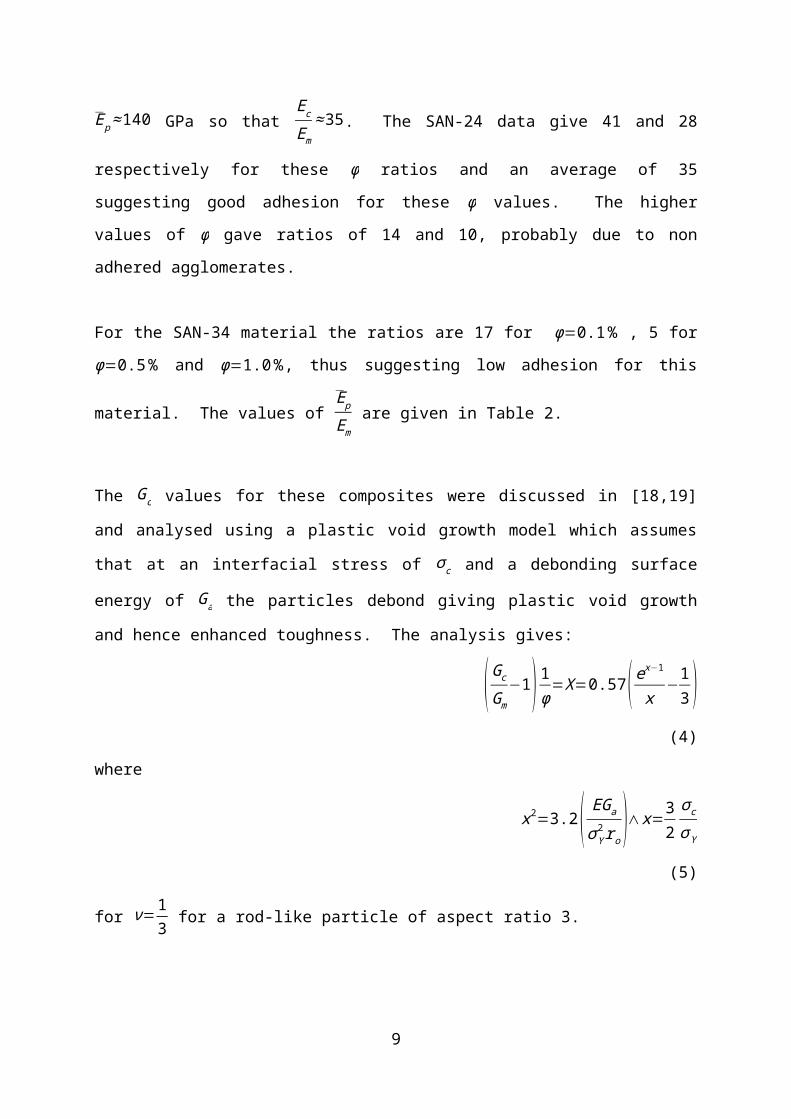
Ep ≈ 140 GPa so that Ec
Em≈ 35. The SAN-24 data give 41 and 28 respectively for these ϕ ratios
and an average of 35 suggesting good adhesion for these ϕ values. The higher values of ϕ
gave ratios of 14 and 10, probably due to non adhered agglomerates.
5
For the SAN-34 material the ratios are 17 for ϕ=0.1 % , 5 for ϕ=0.5% and ϕ=1.0%, thus
suggesting low adhesion for this material. The values of Ep
Em are given in Table 2.
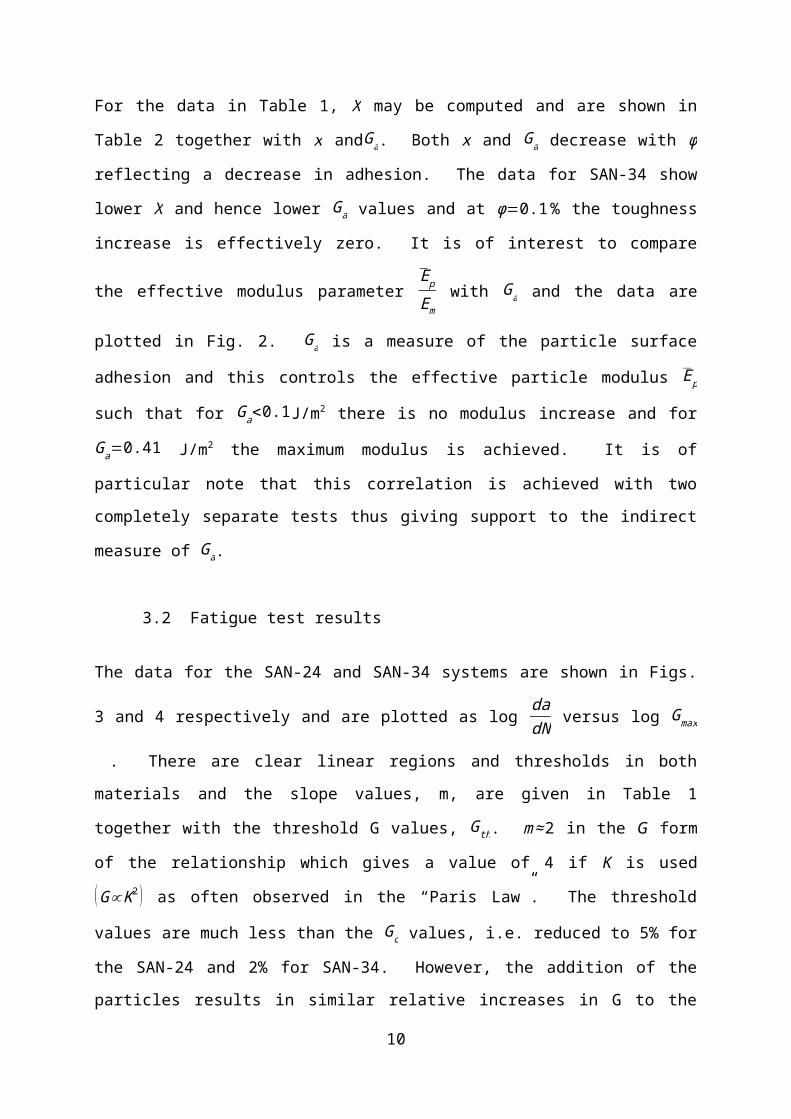
The Gc values for these composites were discussed in [18,19] and analysed using a plastic
void growth model which assumes that at an interfacial stress of σ c and a debonding surface
energy of Ga the particles debond giving plastic void growth and hence enhanced toughness.
The analysis gives:
( Gc
Gm−1) 1
ϕ=X=0.57( ex−1
x−1
3 ) (4)
where
x2=3.2( EGa
σY2 ro
)∧x=32
σc
σY (5)
for ν=13 for a rod-like particle of aspect ratio 3.
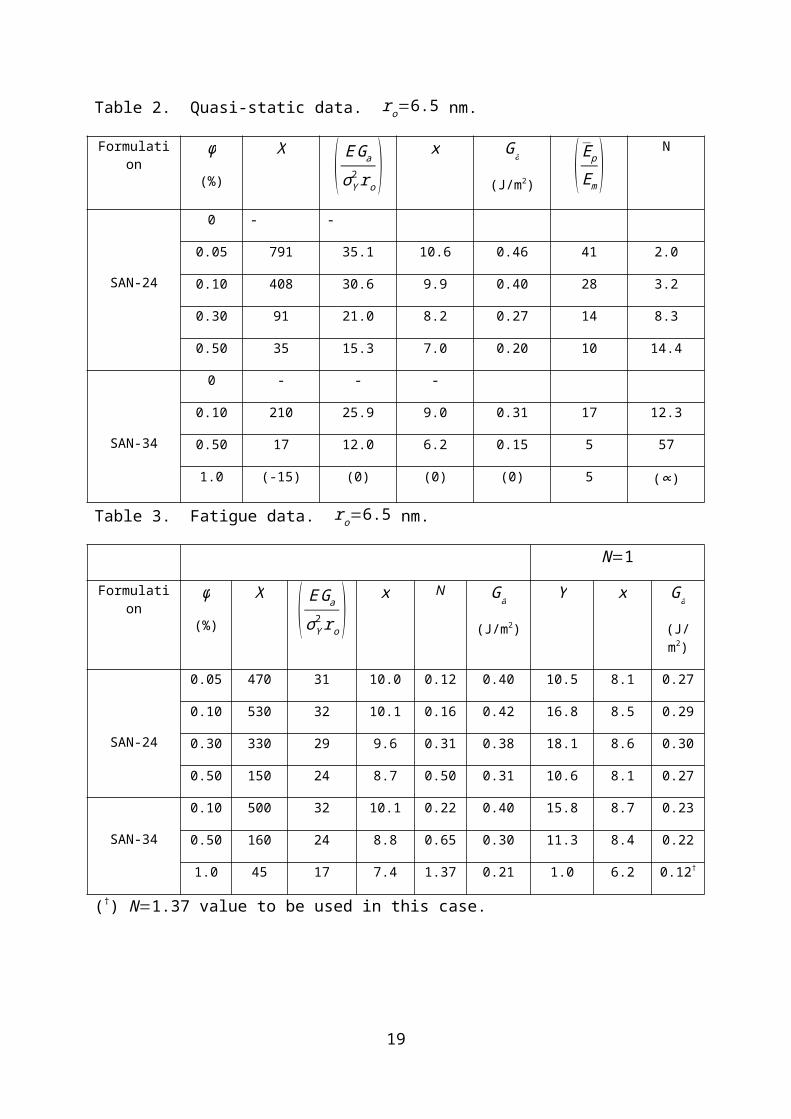
For the data in Table 1, X may be computed and are shown in Table 2 together with x andGa.
Both x and Ga decrease with ϕ reflecting a decrease in adhesion. The data for SAN-34 show
lower X and hence lower Ga values and at ϕ=0.1 % the toughness increase is effectively zero.
It is of interest to compare the effective modulus parameter Ep
Em with Ga and the data are
plotted in Fig. 2. Ga is a measure of the particle surface adhesion and this controls the
effective particle modulus Ep such that for Ga<0.1J/m2 there is no modulus increase and for
Ga=0.41 J/m2 the maximum modulus is achieved. It is of particular note that this correlation
is achieved with two completely separate tests thus giving support to the indirect measure of
Ga.
3.2 Fatigue test results
The data for the SAN-24 and SAN-34 systems are shown in Figs. 3 and 4 respectively and are
plotted as log dadN versus log Gmax . There are clear linear regions and thresholds in both
materials and the slope values, m, are given in Table 1 together with the threshold G values,
6
Gth. m ≈ 2 in the G form of the relationship which gives a value of 4 if K is used (G∝K 2 ) as
often observed in the “Paris Law”. The threshold values are much less than the Gc values, i.e.
reduced to 5% for the SAN-24 and 2% for SAN-34. However, the addition of the particles
results in similar relative increases in G to the quasi-static data and the toughening analysis
may be applied. The resulting X values are shown in Table 3 and are similar to the quasi-
static values. These are almost the same values for the two materials and show less decrease
with increasing ϕ. The Ga values are similar to those from quasi-static tests.
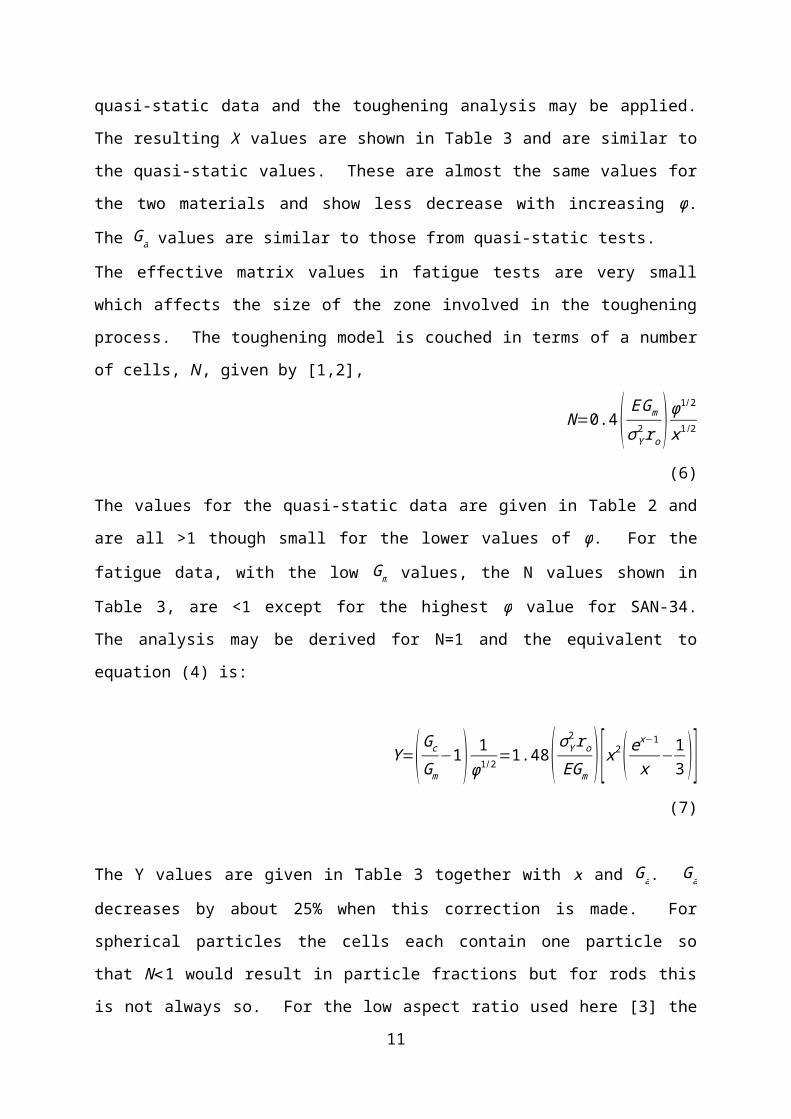
The effective matrix values in fatigue tests are very small which affects the size of the zone
involved in the toughening process. The toughening model is couched in terms of a number
of cells, N, given by [1,2],
N=0.4( E Gm
σY2 ro
) ϕ1/2
x1 /2 (6)
The values for the quasi-static data are given in Table 2 and are all >1 though small for the
lower values of ϕ. For the fatigue data, with the low Gm values, the N values shown in Table
3, are <1 except for the highest ϕ value for SAN-34. The analysis may be derived for N=1
and the equivalent to equation (4) is:
Y=( Gc
Gm−1) 1
ϕ1/2=1.48( σY2 r o
EGm)[ x2( ex−1
x−1
3 )] (7)
The Y values are given in Table 3 together with x and Ga. Ga decreases by about 25% when
this correction is made. For spherical particles the cells each contain one particle so that N<1
would result in particle fractions but for rods this is not always so. For the low aspect ratio
used here [3] the N=1 solution seems the most appropriate but for higher values N<1 may be
permissible. It is of interest that the N=1, Ga values are almost constant for each material
suggesting less sensitivity to agglomeration than the quasi-static data.
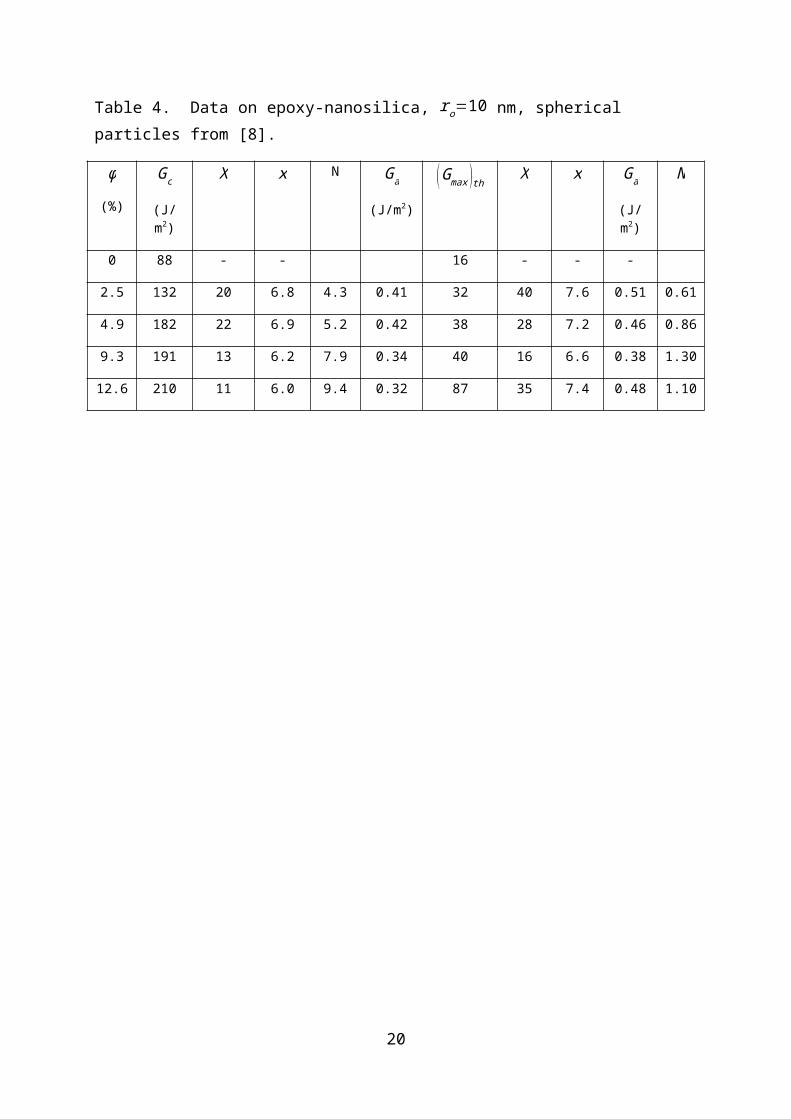
Table 4 gives data for nano-silica particles in epoxy taken from [8]. The volume fractions
achieved here without agglomeration are much higher, i.e. up to 13% and the X values in the
quasi-static data are much lower than for ZnO giving much smaller x values. The Ga values
of about 0.4 J/m2 are very similar. There is a much smaller drop in Gcat the fatigue threshold
here, i.e. Gth
Gc≈ 0.18 and fatigue data give slightly higher x and Ga values. N is around unity in
7
fatigue and there is no decline in the fatigue behaviour for higher volume fractions. Overall
the behaviour of this system is very similar to that of ZnO but is sustained to much higher
volume fractions because agglomeration is avoided.
3.3 Fractographic studies
Scanning electron microscopy (SEM) was carried out on the fracture surfaces of some of the
CT specimens after the fatigue tests. The fracture surfaces can be broadly divided into five
different regions as shown in Fig. 5. These are: the machined notch, precracking, crack
propagation, the fatigue threshold, and the unbroken regions. The characteristic regions and
their locations along the specimen are indicated in the figure.
The SEM micrographs in Fig. 6 show the fatigue fracture surface of unmodified SAN-24.
Three distinct regions: precracking region-II (Fig. 6 (a)), crack propagation region-III (Fig. 6
(a and b)) and the fatigue threshold region-IV (Fig. 6 (c) & (d)). Different scales were used
for each SEM image in Fig. 6 in order to show the features clearly. The crack propagation
region was relatively smooth and glassy, and no large scale plastic deformation could be seen
to have occurred during the fracture, which is typical for a brittle thermoplastic polymer [3].
There were some river markings in the crack propagation region, which were caused by crack
forking due to the excess of energy associated with the relatively fast crack growth. The
fatigue threshold region was very flat and devoid of any features, as is shown in Fig. 6 (c) &
(d). The hackle region observed in Fig. 8 (c) was a result of the CT specimen being opened
for inspection, after fatigue testing was completed. The fatigue fracture surface of unmodified
SAN-34 was similar to that for SAN-24.
With the addition of ZnO nano-rods, dramatic changes have been observed in the fatigue
fracture surface, especially in the threshold region. Figs. 7 and 8 show the SEM micrographs
of SAN-24 composite containing 0.30 vol.% nano-particles and SAN-34 composite
containing 0.50 vol.% nano-particles. At low magnification, the fatigue threshold region (Fig.
9 (c) & Fig. 10 (c)) was still very flat and featureless. However, the high resolution SEM
images in Fig. 9 (d) & Fig. 10 (d) show that numerous voids with the size of about 100 nm
were observed. The debonding model [16, 19] predicts the void diameter d as,
8
( d2 ro )
2
=1+ 32
σY
Eex−1
For E=4 GPa, σ Y=88 MPa and x=8.5 as in the modified Y analysis with ro=6.5 nm and
d=101 nm. These voids are caused by the debonding of ZnO nano-rods and subsequent void
growth in the matrix, which caused to the increase in fatigue resistance as in the model used
here. On the fracture surface of alumina nano-particle modified epoxy, Wetzel et al. [13]
observed numerous voids. Manjunatha et al. [9-11] also found that the nano-silica modified
epoxy exhibited a relative rough fracture surface with presence of voids due to debonding and
plastic void growth. They believed that the debonding of silica nano-particles and subsequent
void growth absorbed energy and contributed towards the enhanced fatigue life for the nano-
modified epoxy composites.
4 Conclusions
The two SAN copolymers with ZnO rod-like particles of diameter 13 nm and aspect ratio 3
were tested both quasi-statically and in fatigue. It was very difficult to achieve good
dispersions for volume fractions greater than about 0.5 %. At such values agglomerations of
up to 300 nm were observed in micrographs. For volume fractions of 0.1 % there were
Young’s modulus changes in reasonable agreement with well adhered particles but at higher
volume fractions the increases were much smaller, as expected when non adhering
agglomeration occurs. In the quasi-static tests the toughness data was analysed using a plastic
void growth analysis which gave particle debonding energies of about 0.4 J/m2 for the well
adhered particles. There was a good correlation with the decrease in Ga at higher volume
fractions with decreases in modulus.
The relative increases in fatigue threshold toughness with the volume fraction of the particles
as in the quasi-static tests though there was much less decrease in Ga due to agglomeration.
The very low matrix fatigue threshold toughness resulted in small process zones and gave
lower Ga values, 0.2-0.3 J/m2. Microscopy of the fatigue fracture surface revealed extensive
microvoiding for the composites and the void sizes, ≈ 100 nm, are close to the predictions of
the analysis.
It would appear that the plastic voiding mechanism around the nano-rods, as employed here,
is the main mechanism of toughening in both quasi-static and fatigue tests. Agglomeration
9
has a profound effect and can only be avoided at very low volume fractions. If good
dispersion could be achieved for high volume fractions there is a potential for very high
toughness.
Acknowledgement
The authors wish to thank BASF SE for financial support and the supply of materials.
References
1. Arimitsu, U., Masaya, K., Yoshitsugu, K., Akane, O., Toshio, K., Osami, K., Swelling behavior of montmorillonite cation exchanged for ω-amino acids by ε-caprolactam. Journal of materials research, 1993. 8(5): p. 1174-1178.
2. Hsieh, T.H., Kinloch, A.J., Masania, K., Sohn Lee, J., Taylor, A.C., Sprenger, S., The toughness of epoxy polymers and fibre composites modified with rubber microparticles and silica nanoparticles. Journal of materials science, 2010. 45(5): p. 1193-1210.
3. Johnsen, B.B., Kinloch, A.J., Mohammed, R.D., Taylor, A.C., Sprenger, S., Toughening mechanisms of nanoparticle-modified epoxy polymers. Polymer, 2007. 48(2): p. 530-541.
4. Kinloch, A.J., Taylor, A.C., The mechanical properties and fracture behaviour of epoxy-inorganic micro- and nano-composites. Journal of materials science, 2006. 41(11): p. 3271-3297.
5. Liang, Y.L. and R.A. Pearson, Toughening mechanisms in epoxy-silica nanocomposites (ESNs). Polymer, 2009. 50(20): p. 4895-4905.
6. Battistella, M., Cascione, M., Fiedler, B., Wichmann, M.H.G., Quaresimin, M., Schulte, K., Fracture behaviour of fumed silica/epoxy nanocomposites. Composites Part A: Applied Science and Manufacturing, 2008. 39(12): p. 1851-1858.
7. Bellemare, S.C., Bureau, M.N., Denault, J., Dickson, J.I., Fatigue crack initiation and propagation in polyamide-6 and in polyamide-6 nanocomposites. Polymer Composites, 2004. 25(4): p. 433-441.
8. Blackman, B.R.K., Kinloch, A.J., Sohn Lee, J., Taylor, A.C., Agarwal, R., Schueneman, G., Sprenger, S., The fracture and fatigue behaviour of nano-modified epoxy polymers. Journal of materials science, 2007. 42(16): p. 7049-7051.
9. Manjunatha, C.M., Taylor, A.C., Kinloch, A.J., Sprenger S., The cyclic-fatigue behaviour of an epoxy polymer modified with micro-rubber and nano-silica particles. Journal of materials science, 2009. 44: p. 4487-4490.
10
10. Manjunatha, C.M., Taylor, A.C., Kinloch, A.J., Sprenger S., The effect of rubber micro-particles and silica nano-particles on the tensile fatigue behaviour of a glass-fibre epoxy composite. Journal of materials science, 2009. 44(1): p. 342-345.
11. Manjunatha, C.M., Taylor, A.C., Kinloch, A.J., Sprenger S., The tensile fatigue behaviour of a silica nanoparticle-modified glass fibre reinforced epoxy composite. Composites Science and Technology, 2010. 70(1): p. 193-199.
12. Wang, G., Liu, H., Saintier, N., Mai, Y., Cyclic fatigue of polymer nanocomposites. Engineering Failure Analysis, 2009. 16(8): p. 2635-2645.
13. Wetzel, B., Rosso, P., Haupert, F., Friedrich, K., Epoxy nanocomposites - fracture and toughening mechanisms. Engineering Fracture Mechanics, 2006. 73(16): p. 2375-2398.
14. Zhang, W., Picu, R.C., Koratkar, N., Suppression of fatigue crack growth in carbon nanotube composites. Applied Physics Letters, 2007. 91: p. 193109
15. Zhang, W., Picu, R.C., Koratkar, N., The effect of carbon nanotube dimensions and dispersion on the fatigue behavior of epoxy nanocomposites. Nanotechnology, 2008. 19: p. 285709.
16. Williams, J.G., et al., The mechanical behaviour of ZnO nano-particle modified styrene acrylonitrile copolymers. to be submitted, 2013.
17. ASTM E647-08e1, Standard test methods for measurement of fatigue crack growth rates. 2008: ASTM, West Conshohocken.
18. ISO 15850, Plastics —Determination of tension-tension fatigue crack propagation — Linear elastic fracture mechanics (LEFM) approach. 2002: ISO, Geneva.
19. Williams, J.G., et al., Toughening by plastic cavitation around cylindrical particles and fibres. to be submitted, 2013.
11
Tables
Table 1 Summary of the values of Young’s modulus, E, yield stress, σy, fracture toughness,
Kc, and fracture energy, Gc, and fracture energy threshold, (Gmax)th, of unmodified and ZnO
nano-modified SAN-24 and SAN-34 composites tested at 23 °C.
FormulationNano-
contentE σy KIc Gc (Gmax)th
m
vol.% (GPa) (MPa) (MPa·m1/2) (J/m2) (J/m2)
SAN-24
0 3.87 ± 0.05 88 ± 1 1.12 ± 0.08 316 ± 12 17 ± 1 2.4
0.05 3.95 ± 0.06 88 ± 1 1.41 ± 0.02 441 ± 12 21 ± 1 2.6
0.10 3.98 ± 0.03 88 ± 1 1.40 ± 0.03 445 ± 27 26 ± 2 2.6
0.30 4.03 ± 0.04 88 ± 1 1.34 ± 0.02 402 ± 14 34 ± 2 2.4
0.50 4.06 ± 0.05 88 ± 1 1.26 ± 0.05 372 ± 9 30 ± 1 2.1
SAN-34
0 4.14 ± 0.03 89 ± 1 2.11 ± 0.08 963 ± 25 22 ± 3 1.9
0.10 4.21 ± 0.07 89 ± 1 2.30 ± 0.02 1166 ± 45 33 ± 1 1.9
0.50 4.24 ± 0.06 89 ± 1 2.18 ± 0.07 1043 ± 89 40 ± 2 2.2
1.00 4.33 ± 0.05 89 ± 1 1.93 ± 0.12 814 ± 69 32 ± 3 2.0
Table 2. Quasi-static data. ro=6.5 nm.
Formulation ϕ
(%)
X ( E Ga
σY2 ro
) x Ga
(J/m2)( E p
Em) N
SAN-24
0 - -
0.05 791 35.1 10.6 0.46 41 2.0
0.10 408 30.6 9.9 0.40 28 3.2
0.30 91 21.0 8.2 0.27 14 8.3
0.50 35 15.3 7.0 0.20 10 14.4
SAN-34
0 - - -
0.10 210 25.9 9.0 0.31 17 12.3
0.50 17 12.0 6.2 0.15 5 57
1.0 (-15) (0) (0) (0) 5 (∞)
Table 3. Fatigue data. ro=6.5 nm.
12
N=1
Formulation ϕ
(%)
X ( E Ga
σY2 ro
) x N Ga
(J/m2)
Y x Ga
(J/m2)
SAN-24
0.05 470 31 10.0 0.12 0.40 10.5 8.1 0.27
0.10 530 32 10.1 0.16 0.42 16.8 8.5 0.29
0.30 330 29 9.6 0.31 0.38 18.1 8.6 0.30
0.50 150 24 8.7 0.50 0.31 10.6 8.1 0.27
SAN-34
0.10 500 32 10.1 0.22 0.40 15.8 8.7 0.23
0.50 160 24 8.8 0.65 0.30 11.3 8.4 0.22
1.0 45 17 7.4 1.37 0.21 1.0 6.2 0.12†
(†) N=1.37 value to be used in this case.
Table 4. Data on epoxy-nanosilica, ro=10 nm, spherical particles from [8].
ϕ
(%)
Gc
(J/m2)
X x N Ga
(J/m2)
(Gmax )th X x Ga
(J/m2)
N
0 88 - - 16 - - -
2.5 132 20 6.8 4.3 0.41 32 40 7.6 0.51 0.61
4.9 182 22 6.9 5.2 0.42 38 28 7.2 0.46 0.86
9.3 191 13 6.2 7.9 0.34 40 16 6.6 0.38 1.30
12.6 210 11 6.0 9.4 0.32 87 35 7.4 0.48 1.10
13
56.25
54
4510
24.75
Figures
Fig. 1 Schematic diagram of a CT specimen.
14
Fig. 2 Quasi-static data for modulus as a function of debonding energy, Ga. .
15
-8.0
-7.0
-6.0
-5.0
-4.0
-3.0
0.8 1.2 1.6 2.0 2.4
log
(da/
dN/ m
m/c
ycle
)
log (Gmax / J/m2)
Unmodified0.05 vol.%0.10 vol.%0.30 vol.%0.50 vol.%
4.
Fig. 3 Double logarithmic plots of the crack growth rates, dadN , versus the maximum fracture
energies, Gmax, for the unmodified and ZnO nano-modified SAN-24 composites.
16
-8.0
-7.0
-6.0
-5.0
-4.0
-3.0
0.8 1.2 1.6 2.0 2.4
log
(da/
dN/ m
m/c
ycle
)
log (Gmax / J/m2)
Unmodified
0.10 vol.%
0.50 vol.%
1.00 vol.%
Fig. 4 Double logarithmic plots of the crack growth rates, dadN , versus the maximum fracture
energies, Gmax, for the unmodified and ZnO nano-modified SAN-34 composites.
17
Direction of crack propagation (G decreasing)
I II III IV VUnbroken material
Crack propagationInitial notchingMachined notch
Fig. 5 The Schematic plan view showing the fracture surface of a CT specimen
after fatigue testing.
18
Fatigue threshold region
(c) (d)
(a) (b)
Pre-crack
Threshold
Fig. 6 SEM images showing the fatigue fracture surface of unmodified SAN-24: (a) precrack
and crack propagation (b) the crack propagation (III) and (c) & (d) the threshold region (IV).
19
(c) (d)
(a) (b)
Pre-crack
Threshold
Fig. 7 SEM images showing the fatigue fracture surface of the modified SAN-24 composite
containing 0.30 vol.% ZnO nano-particles: (a) precrack and crack propagation II and III, (b)
crack propagation (III) and (c) & (d) the threshold regions(IV) (Selected voids are circled).
20
(c) (d)
(a) (b)
Pre-crack
Threshold
Fig. 8SEM images showing the fatigue fracture surface of the modified SAN-34 composite
containing 0.50 vol.% ZnO nano-particles: (a) precrack and crack propagation II and III, (b)
crack propagation (III) and (c) & (d) the threshold region (IV) (Selected voids are circled).
21