Embed Size (px)
Citation preview
Asian Economic and Financial Review, 2014, 4(10): 1298-1313
1298
THE TREND ANALYSIS OF ISLAMIZATION IN MALAYSIA USING
ISLAMIZATION INDEX AS INDICATOR
W. A. Wan Omar
Department of Economics, College of Business, Universiti Utara Malaysia
Fauzi Hussin
Department of Education and Modern Languages, Universiti Utara Malaysia
Asan Ali G. H.
Department of Economics, College of Business, Universiti Utara Malaysia
ABSTRACT
This paper empirically analyses the trend of Islamization in Malaysia using the Islamization Index
as an indicator to determine whether the time series dataset of the Islamization index possess
deterministic trends or stochastic properties. The result determines the appropriateness of the
employment of the Islamization index as a proxy of Islam in the empirical study of Islam and
economic performance such as economic growth and development, and not as a spurious relation
as in the case of the non-stationary stochastic trend.
© 2014 AESS Publications. All Rights Reserved.
Keywords: Islamization, Malaysia, Islamization index, Trend analysis, Root test, Diagnostic test.
JEL Classification: A130, C320.
Contribution/ Originality
This study originates the application of Islamization index as a plausible indicator of Islam
which passes all stationary and diagnostic tests as deterministic trend properties time series. The
index could be employed into other Muslim majority countries to monitor Islamization process and
to investigate its empirical effects on economic performance.
1. INTRODUCTION
There have been several attempts by Islamic scholars to measure the development of Islam in
Muslim-majority countries using an Islamic-based index on time series data (Ahmad Sarji, 2005;
Rehman and Askari, 2010). The Institute of Islamic Understanding Malaysia (IKIM) has proposed
an Ummah Development Index (UDI) to indicate the achievement of the Muslim population in
their economic development. The index was further developed into a comprehensive development
Asian Economic and Financial Review
journal homepage: http://www.aessweb.com/journals/5002
Asian Economic and Financial Review, 2014, 4(10): 1298-1313
1299
index known as the Malaysian Ummah Development Index (MUDI) as a new indicator to measure
the level of ummah development in Malaysia, as the existing economic and social development
indicators are not sufficient to comprehensively measure the development in Malaysia from the
Islamic perspective. Rehman and Askari (2010) propose an Economic Islamicity Index (EI2) to
indicate the degree of Islamicity of a country in adherence to the doctrines and teachings of Islam,
which encompasses measurements of four sub-indices: (a) economic Islamicity index (EI2), (b)
legal and good governance Islamicity index (LGI2), (c) human and political right Islamicity index
(HPI2) and (d) international relation Islamicity index (IRI
2). For non-Islamic countries, EI
2 is to
measure the economic performance from the Islamic perspective. Like MUDI, EI2 is also a
comprehensive index comprising 12 economic indicators and 32 sub-indicators, based on a
theoretical framework for investigating the effect of religion on economic activities.
The general religiosity index for each country in the world has been published by Gallup
International Association, Duke University, Pew Research Center and other organizations, based on
sampling values surveys conducted during particular periods in each country. The main difference
between the general religiosity index and the Islamic-based religiosity index is the nature of the
data. The general religiosity index is based on the values survey which was periodically conducted
in the selected states, while the Islamic-based religiosity index is a time series dataset which is
computed from the existing data on the Muslim population and Islamic-based economic activities.
The religiosity index has been used as a proxy for religion to investigate its effect on the economic
growth variables (Grier, 1997; Blum and Dudley, 2001; Barro and McCleary, 2003; Mangeloja,
2005).
Basically, a positive result on the effect of religion on economic growth was reported by the
researchers but the lack of significant robustness due to data heterogeneity problem between proxy
of religion, factors of economic growth and indicator of economic growth. Time series with
deterministic and stochastic trend components have been known as a plausible approach in
empirical research to study the economic relationship between variables. The problem of
robustness, therefore may be remedied through the introduction of time series data for the proxy of
religion. It may be effective to remedy the problem provided the proposed time series data of
religious proxy passes the trend-stationarity process or otherwise spurious regression exists
(Granger and Newbold, 1974).
Trends refer to persistent upward/downward movements of variables over time. Trend analysis
is often used to predict the future, and it could also be used to estimate uncertain events in the past.
In statistics, trend analysis refers to techniques for extracting an underlying pattern of behaviour in
a time series which would otherwise be partly or nearly completely hidden by noise. From the
econometric perspective, trend estimation is based upon the notion that a time series is composed
of several components of independent origin. Trends can threaten the consistency and asymptotic
normality of ordinary least square (OLS) due to auto-correlated error in regression analysis: (a)
estimates of the regression coefficients are inefficient, (b) forecasts based on the regression
equations are sub-optimal and (c) the usual significance tests on the coefficients are invalid
Asian Economic and Financial Review, 2014, 4(10): 1298-1313
1300
(Granger and Newbold, 1974). This paper concerns the introduction of the Islamization index as an
indicator of Islam and its capabilities to pass all the requirements in the trend analysis.
We propose a simple Islamization index to indicate the degree of Islamization trend which
occurs in Malaysia based on the adherence to Islamic faith, Islamic teachings and Islamic
economics; these are three of the five pillars of Islami. The index is basically a time series dataset
that could be employed for empirical investigation on the effect of Islam on economic performance
such as economic growth and development. The usage of time series data in empirical investigation
is subject to stationarity assumption, autocorrelation assumption if the data is not stationary, and
the problem of spurious or nonsense regression (Gujarati, 2003). If a time series is stationary, its
statistical mean, variance and auto-covariance (at various lags) remain constant over time. Such a
time series will tend to return to its mean if fluctuation occurs due to economic shock or other
short-run causes. Stationary time series tends to reach an equilibrium state in the long-run, which
we may use an econometric method to study or estimate the relationship between groups of time-
based variables. In contrast, if a time series is non-stationary, we can study its behaviour only for
the period under consideration (short-run) using the random walk model (RWM). Regression
between a non-stationary time series on other non-stationary time series is subject to spurious or
nonsense regression results – very high R2 albeit there is no meaningful relationship between the
variables, extremely low Durbin-Watson d-value, and R2 is more than Durbin-Watson d-value
(Gujarati, 2003). The existence of an equilibrium or stationary relationship among two or more
time series, or some linear combination of stationary and non-stationary series; that is, while the
component time-series may have moments such as means, variances, and covariances varying with
time, some linear combination of these series, which defines the equilibrium relationship, has time-
invariant linear properties, could be described through the concept of cointegration.
Cointegration refers to a meaningful (not spurious) long-run, or equilibrium relationship
between the two or more time series. Basically a series is said to be integrated if it accrues some
past effects; such a series is non-stationary because its future path depends upon all such past
effects, and is not tangled to some mean to which it must eventually return. To transform an
integrated series to achieve stationarity, we must difference it at least once. Therefore, a non-
stationary time series is called integrated by order 1 (I(1)) if it has to be differenced once in order to
make it stationary, or integrated by order d (I(d)) if it has to be differenced d times. However, a
linear combination of series may have a lower order of integration than any one of them has
individually. In this case, the variables are said to be co-integrated. Thus, for example, if {xt} and
{yt} are integrated of order 1 or I(1) and are also co-integrated, then {∆xt}, {∆yt}, and {xt+αyt}, for
some α, are all stationary series even though {xt+αyt} individually is integrated of order 0 or I(0)
(Banerjee et al., 2003). An integrated process specification for time series has several important
statistical implications: potential risk of misspecification of the generating mechanism,
inappropriate inference that the trend is significant, and detrended random walks will exhibit
spurious correlation (Durlauf and Phillips, 1987).
Asian Economic and Financial Review, 2014, 4(10): 1298-1313
1301
The purpose of this paper is to empirically study the trend of Islamization in Malaysia based on
the proposed Islamization index dataset collected from 1969 to 2011. The paper is structured into
four sections. The first section discusses the introduction of the subject matter. The second section
details out the data, model and trend analysis procedure. The third section discusses the empirical
results on unit root tests, diagnostic tests, hypothesis result and is followed by discussion and
implication. The fourth section concludes the study.
2. DATA AND METHODOLOGY
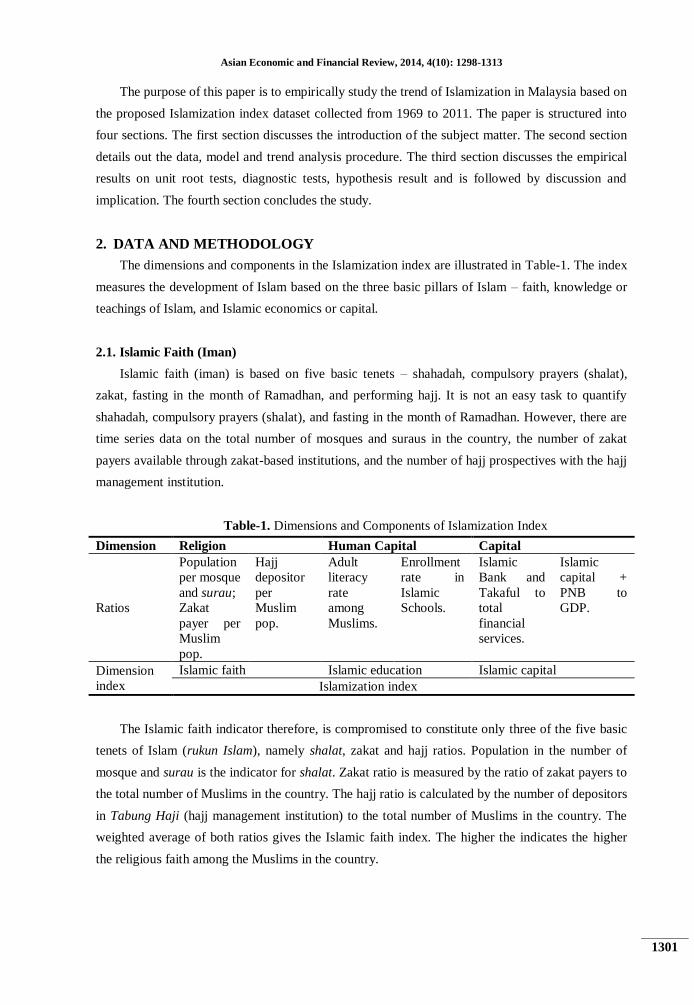
The dimensions and components in the Islamization index are illustrated in Table-1. The index
measures the development of Islam based on the three basic pillars of Islam – faith, knowledge or
teachings of Islam, and Islamic economics or capital.
2.1. Islamic Faith (Iman)
Islamic faith (iman) is based on five basic tenets – shahadah, compulsory prayers (shalat),
zakat, fasting in the month of Ramadhan, and performing hajj. It is not an easy task to quantify
shahadah, compulsory prayers (shalat), and fasting in the month of Ramadhan. However, there are
time series data on the total number of mosques and suraus in the country, the number of zakat
payers available through zakat-based institutions, and the number of hajj prospectives with the hajj
management institution.
Table-1. Dimensions and Components of Islamization Index
Dimension Religion Human Capital Capital
Ratios
Population
per mosque
and surau;
Zakat
payer per
Muslim
pop.
Hajj
depositor
per
Muslim
pop.
Adult
literacy
rate
among
Muslims.
Enrollment
rate in
Islamic
Schools.
Islamic
Bank and
Takaful to
total
financial
services.
Islamic
capital +
PNB to
GDP.
Dimension
index
Islamic faith Islamic education Islamic capital
Islamization index
The Islamic faith indicator therefore, is compromised to constitute only three of the five basic
tenets of Islam (rukun Islam), namely shalat, zakat and hajj ratios. Population in the number of
mosque and surau is the indicator for shalat. Zakat ratio is measured by the ratio of zakat payers to
the total number of Muslims in the country. The hajj ratio is calculated by the number of depositors
in Tabung Haji (hajj management institution) to the total number of Muslims in the country. The
weighted average of both ratios gives the Islamic faith index. The higher the indicates the higher
the religious faith among the Muslims in the country.
Asian Economic and Financial Review, 2014, 4(10): 1298-1313
1302
2.2. Islamic Education (‘Ilmu)
Literacy rate, enrollment rate and average years of schooling have been extensively used in
economic growth empirical investigation as proxies for education or investment in human capital
(Barro and Sala-i-Martin, 1995). Islamic education in Muslim countries, more so in Malaysia, plays
a lesser role compared to the secular system which becomes the backbone of the education system
in the country. Muslim parents send their children to Islamic schools because of their religious
belief that their children should have adequate knowledge in Islam.
The Islamic education indicator measures human capital development from the Islamic
perspective, which constitutes the weighted average of the adult literacy rate among Muslims and
the enrollment rate in Islamic schools and Islamic universities. The indicator shows the
contribution of Muslim and Islamic education in human capital development in Malaysia.
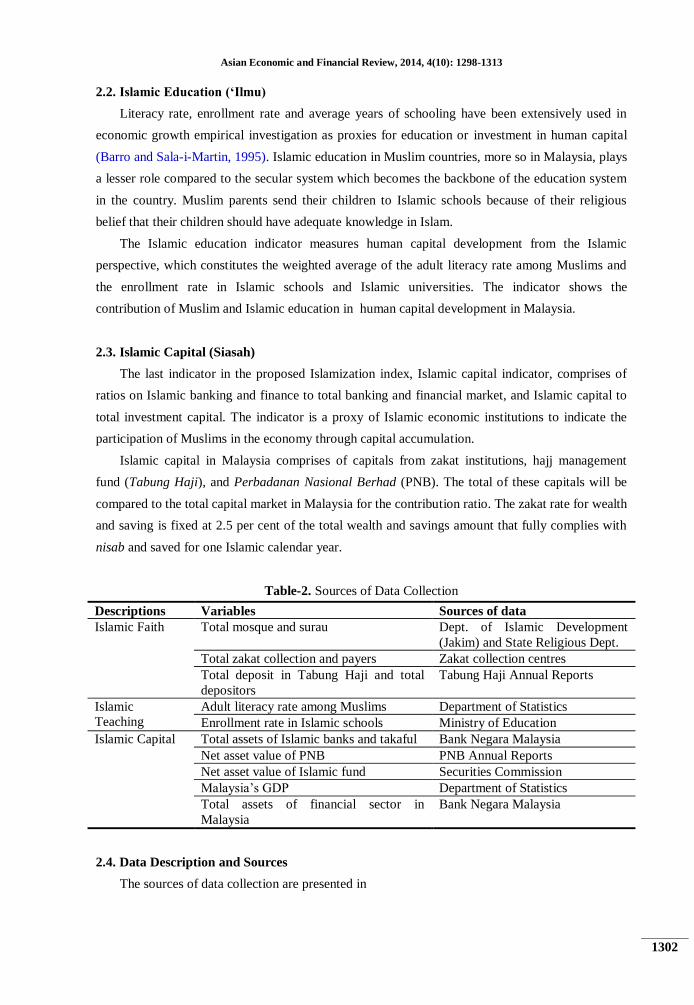
2.3. Islamic Capital (Siasah)
The last indicator in the proposed Islamization index, Islamic capital indicator, comprises of
ratios on Islamic banking and finance to total banking and financial market, and Islamic capital to
total investment capital. The indicator is a proxy of Islamic economic institutions to indicate the
participation of Muslims in the economy through capital accumulation.
Islamic capital in Malaysia comprises of capitals from zakat institutions, hajj management
fund (Tabung Haji), and Perbadanan Nasional Berhad (PNB). The total of these capitals will be
compared to the total capital market in Malaysia for the contribution ratio. The zakat rate for wealth
and saving is fixed at 2.5 per cent of the total wealth and savings amount that fully complies with
nisab and saved for one Islamic calendar year.
Table-2. Sources of Data Collection
Descriptions Variables Sources of data
Islamic Faith Total mosque and surau Dept. of Islamic Development
(Jakim) and State Religious Dept.
Total zakat collection and payers Zakat collection centres
Total deposit in Tabung Haji and total
depositors
Tabung Haji Annual Reports
Islamic
Teaching
Adult literacy rate among Muslims Department of Statistics
Enrollment rate in Islamic schools Ministry of Education
Islamic Capital Total assets of Islamic banks and takaful Bank Negara Malaysia
Net asset value of PNB PNB Annual Reports
Net asset value of Islamic fund Securities Commission
Malaysia’s GDP Department of Statistics
Total assets of financial sector in
Malaysia
Bank Negara Malaysia
2.4. Data Description and Sources
The sources of data collection are presented in
Asian Economic and Financial Review, 2014, 4(10): 1298-1313
1303
Table-2. Data on Islamic faith is collected from the Department of Islamic Development
(Jakim), State Religious Departments and Tabung Haji’s annual reports, Islamic teachings from
Department of Statistics and the Ministry of Education’s annual reports, and Islamic capital from
the annual reports published by Bank Negara Malaysia, Perbadanan Nasional Berhad (PNB),
Securities Commission and the Department of Statistics.
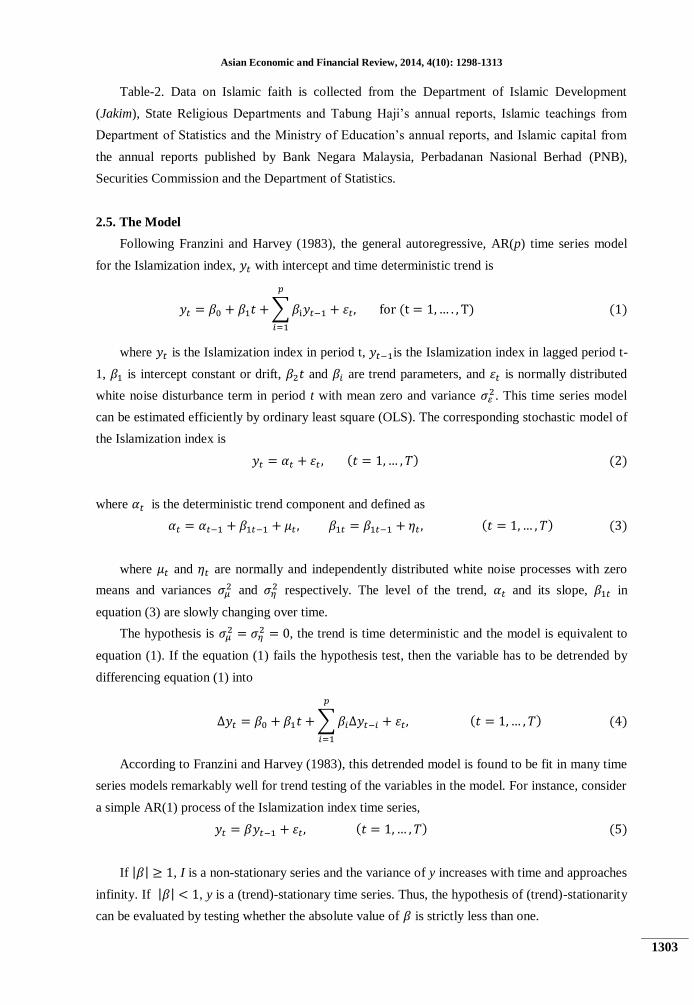
2.5. The Model
Following Franzini and Harvey (1983), the general autoregressive, AR(p) time series model
for the Islamization index, with intercept and time deterministic trend is
∑
where is the Islamization index in period t, is the Islamization index in lagged period t-
1, is intercept constant or drift, and are trend parameters, and is normally distributed
white noise disturbance term in period t with mean zero and variance . This time series model
can be estimated efficiently by ordinary least square (OLS). The corresponding stochastic model of
the Islamization index is
where is the deterministic trend component and defined as
where and are normally and independently distributed white noise processes with zero
means and variances and
respectively. The level of the trend, and its slope, in
equation (3) are slowly changing over time.
The hypothesis is
, the trend is time deterministic and the model is equivalent to
equation (1). If the equation (1) fails the hypothesis test, then the variable has to be detrended by
differencing equation (1) into
∑
According to Franzini and Harvey (1983), this detrended model is found to be fit in many time
series models remarkably well for trend testing of the variables in the model. For instance, consider
a simple AR(1) process of the Islamization index time series,
If | | , I is a non-stationary series and the variance of y increases with time and approaches
infinity. If | | , y is a (trend)-stationary time series. Thus, the hypothesis of (trend)-stationarity
can be evaluated by testing whether the absolute value of is strictly less than one.
Asian Economic and Financial Review, 2014, 4(10): 1298-1313
1304
2.6. Trend Analysis Procedure
The presence of stationary or non-stationary stochastic and deterministic trend in a variable
could be conducted by the unit root testing procedure, which assumes that the underlying time
series is stationary and its mean and variance do not vary systematically over time. We use three
different unit root tests for trend analysis: Augmented Dickey-Fuller (ADF); Phillips-Perron (P-P);
and Kwiatkowski, Phillips, Schmidt and Shin (KPSS) tests.
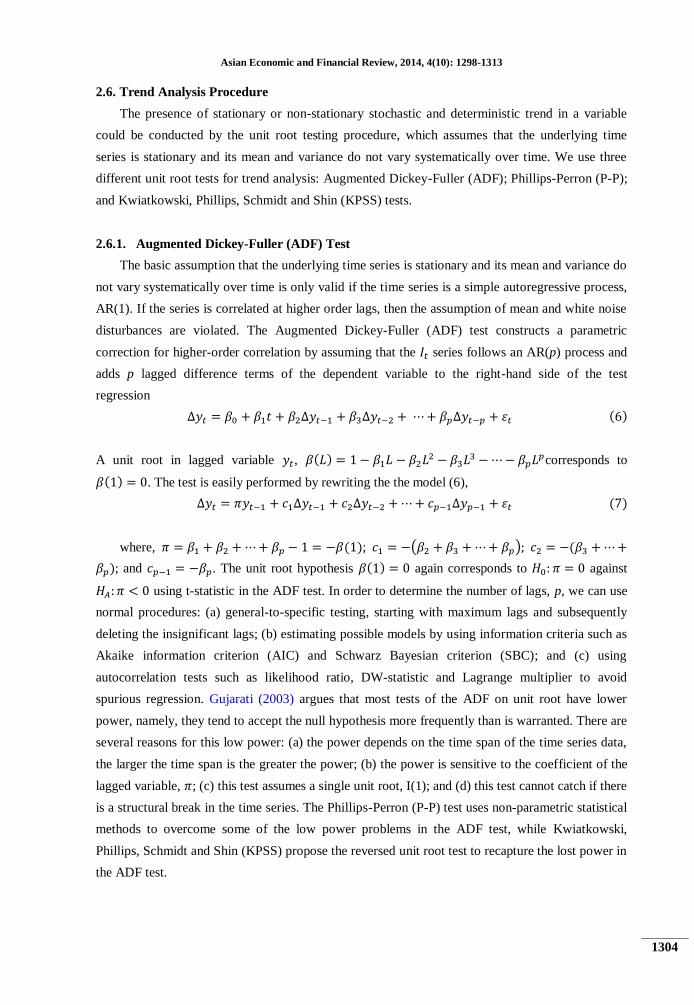
2.6.1. Augmented Dickey-Fuller (ADF) Test
The basic assumption that the underlying time series is stationary and its mean and variance do
not vary systematically over time is only valid if the time series is a simple autoregressive process,
AR(1). If the series is correlated at higher order lags, then the assumption of mean and white noise
disturbances are violated. The Augmented Dickey-Fuller (ADF) test constructs a parametric
correction for higher-order correlation by assuming that the series follows an AR(p) process and
adds p lagged difference terms of the dependent variable to the right-hand side of the test
regression
A unit root in lagged variable ,
corresponds to
. The test is easily performed by rewriting the the model (6),
where, ; ( )
; and . The unit root hypothesis again corresponds to against
using t-statistic in the ADF test. In order to determine the number of lags, p, we can use
normal procedures: (a) general-to-specific testing, starting with maximum lags and subsequently
deleting the insignificant lags; (b) estimating possible models by using information criteria such as
Akaike information criterion (AIC) and Schwarz Bayesian criterion (SBC); and (c) using
autocorrelation tests such as likelihood ratio, DW-statistic and Lagrange multiplier to avoid
spurious regression. Gujarati (2003) argues that most tests of the ADF on unit root have lower
power, namely, they tend to accept the null hypothesis more frequently than is warranted. There are
several reasons for this low power: (a) the power depends on the time span of the time series data,
the larger the time span is the greater the power; (b) the power is sensitive to the coefficient of the
lagged variable, ; (c) this test assumes a single unit root, I(1); and (d) this test cannot catch if there
is a structural break in the time series. The Phillips-Perron (P-P) test uses non-parametric statistical
methods to overcome some of the low power problems in the ADF test, while Kwiatkowski,
Phillips, Schmidt and Shin (KPSS) propose the reversed unit root test to recapture the lost power in
the ADF test.
Asian Economic and Financial Review, 2014, 4(10): 1298-1313
1305
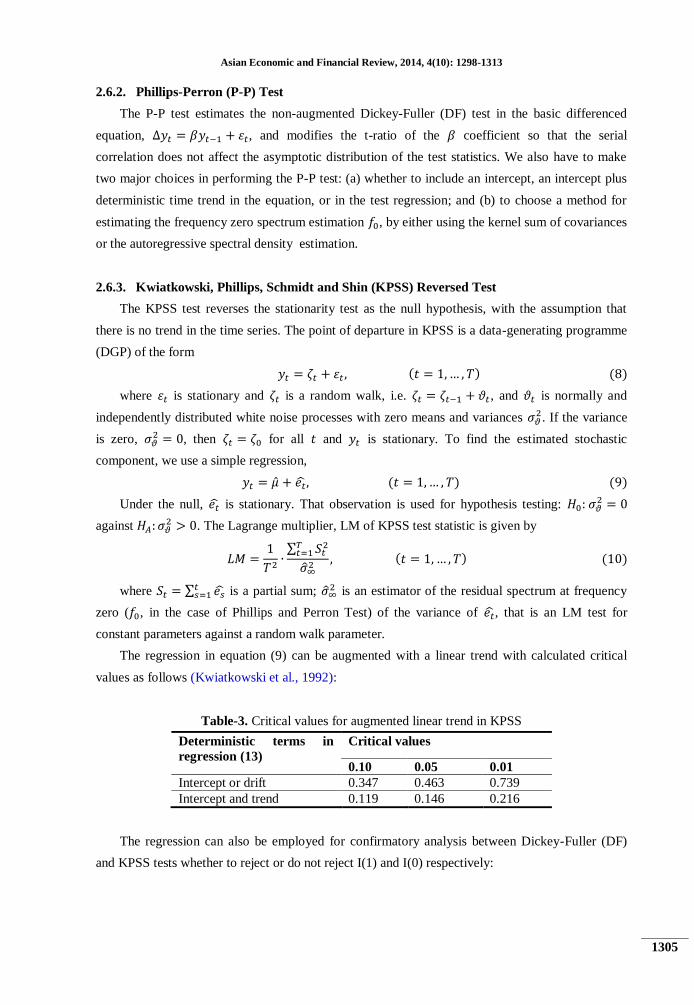
2.6.2. Phillips-Perron (P-P) Test
The P-P test estimates the non-augmented Dickey-Fuller (DF) test in the basic differenced
equation, , and modifies the t-ratio of the coefficient so that the serial
correlation does not affect the asymptotic distribution of the test statistics. We also have to make
two major choices in performing the P-P test: (a) whether to include an intercept, an intercept plus
deterministic time trend in the equation, or in the test regression; and (b) to choose a method for
estimating the frequency zero spectrum estimation , by either using the kernel sum of covariances
or the autoregressive spectral density estimation.
2.6.3. Kwiatkowski, Phillips, Schmidt and Shin (KPSS) Reversed Test
The KPSS test reverses the stationarity test as the null hypothesis, with the assumption that
there is no trend in the time series. The point of departure in KPSS is a data-generating programme
(DGP) of the form
where is stationary and is a random walk, i.e. , and is normally and
independently distributed white noise processes with zero means and variances . If the variance
is zero, , then for all and is stationary. To find the estimated stochastic
component, we use a simple regression,
Under the null, is stationary. That observation is used for hypothesis testing:
against . The Lagrange multiplier, LM of KPSS test statistic is given by
∑
where ∑ is a partial sum;
is an estimator of the residual spectrum at frequency
zero ( , in the case of Phillips and Perron Test) of the variance of , that is an LM test for
constant parameters against a random walk parameter.
The regression in equation (9) can be augmented with a linear trend with calculated critical
values as follows (Kwiatkowski et al., 1992):
Table-3. Critical values for augmented linear trend in KPSS
Deterministic terms in
regression (13)
Critical values
0.10 0.05 0.01
Intercept or drift 0.347 0.463 0.739
Intercept and trend 0.119 0.146 0.216
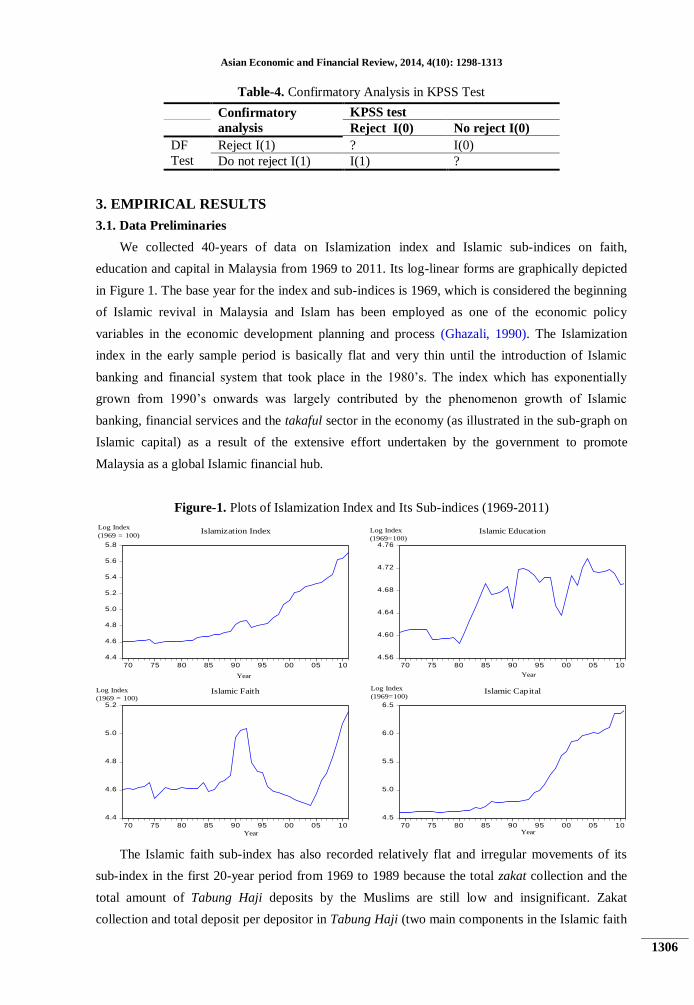
The regression can also be employed for confirmatory analysis between Dickey-Fuller (DF)
and KPSS tests whether to reject or do not reject I(1) and I(0) respectively:
Asian Economic and Financial Review, 2014, 4(10): 1298-1313
1306
Table-4. Confirmatory Analysis in KPSS Test
Confirmatory
analysis
KPSS test
Reject I(0) No reject I(0)
DF
Test
Reject I(1) ? I(0)
Do not reject I(1) I(1) ?
3. EMPIRICAL RESULTS
3.1. Data Preliminaries
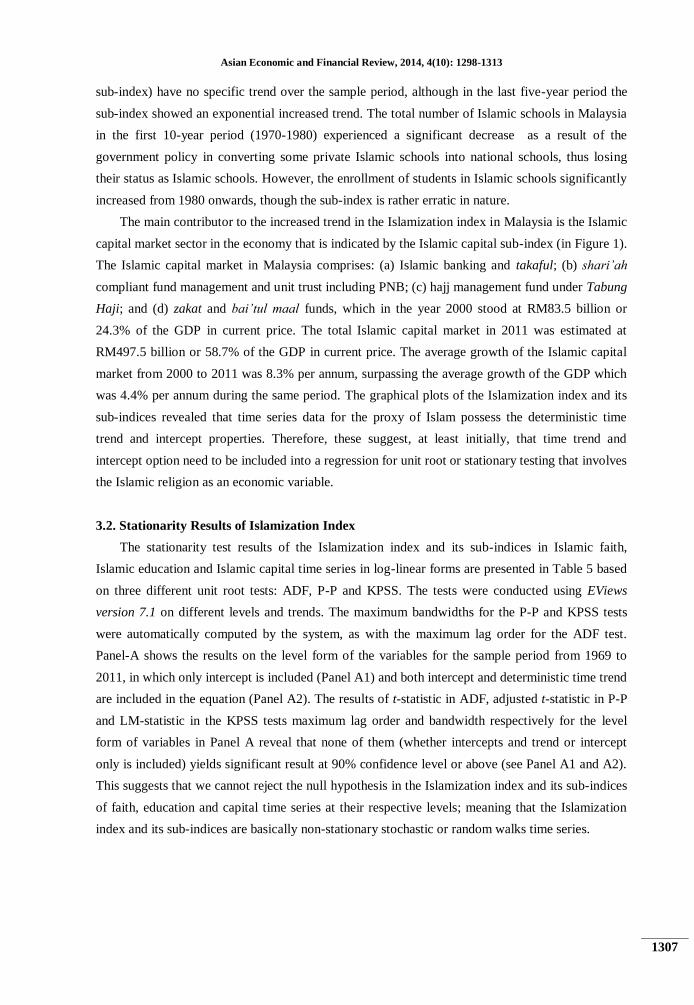
We collected 40-years of data on Islamization index and Islamic sub-indices on faith,
education and capital in Malaysia from 1969 to 2011. Its log-linear forms are graphically depicted
in Figure 1. The base year for the index and sub-indices is 1969, which is considered the beginning
of Islamic revival in Malaysia and Islam has been employed as one of the economic policy
variables in the economic development planning and process (Ghazali, 1990). The Islamization
index in the early sample period is basically flat and very thin until the introduction of Islamic
banking and financial system that took place in the 1980’s. The index which has exponentially
grown from 1990’s onwards was largely contributed by the phenomenon growth of Islamic
banking, financial services and the takaful sector in the economy (as illustrated in the sub-graph on
Islamic capital) as a result of the extensive effort undertaken by the government to promote
Malaysia as a global Islamic financial hub.
Figure-1. Plots of Islamization Index and Its Sub-indices (1969-2011)
The Islamic faith sub-index has also recorded relatively flat and irregular movements of its
sub-index in the first 20-year period from 1969 to 1989 because the total zakat collection and the
total amount of Tabung Haji deposits by the Muslims are still low and insignificant. Zakat
collection and total deposit per depositor in Tabung Haji (two main components in the Islamic faith
4.4
4.6
4.8
5.0
5.2
5.4
5.6
5.8
70 75 80 85 90 95 00 05 10
Islamization Index
4.56
4.60
4.64
4.68
4.72
4.76
70 75 80 85 90 95 00 05 10
Islamic Education
4.4
4.6
4.8
5.0
5.2
70 75 80 85 90 95 00 05 10
Islamic Faith
4.5
5.0
5.5
6.0
6.5
70 75 80 85 90 95 00 05 10
Islamic Capital
Log Index
(1969 = 100)
Year
Log Index
(1969 = 100)
Log Index
(1969=100)
Log Index
(1969=100)
Year
Year Year
Asian Economic and Financial Review, 2014, 4(10): 1298-1313
1307
sub-index) have no specific trend over the sample period, although in the last five-year period the
sub-index showed an exponential increased trend. The total number of Islamic schools in Malaysia
in the first 10-year period (1970-1980) experienced a significant decrease as a result of the
government policy in converting some private Islamic schools into national schools, thus losing
their status as Islamic schools. However, the enrollment of students in Islamic schools significantly
increased from 1980 onwards, though the sub-index is rather erratic in nature.
The main contributor to the increased trend in the Islamization index in Malaysia is the Islamic
capital market sector in the economy that is indicated by the Islamic capital sub-index (in Figure 1).
The Islamic capital market in Malaysia comprises: (a) Islamic banking and takaful; (b) shari’ah
compliant fund management and unit trust including PNB; (c) hajj management fund under Tabung
Haji; and (d) zakat and bai’tul maal funds, which in the year 2000 stood at RM83.5 billion or
24.3% of the GDP in current price. The total Islamic capital market in 2011 was estimated at
RM497.5 billion or 58.7% of the GDP in current price. The average growth of the Islamic capital
market from 2000 to 2011 was 8.3% per annum, surpassing the average growth of the GDP which
was 4.4% per annum during the same period. The graphical plots of the Islamization index and its
sub-indices revealed that time series data for the proxy of Islam possess the deterministic time
trend and intercept properties. Therefore, these suggest, at least initially, that time trend and
intercept option need to be included into a regression for unit root or stationary testing that involves
the Islamic religion as an economic variable.
3.2. Stationarity Results of Islamization Index
The stationarity test results of the Islamization index and its sub-indices in Islamic faith,
Islamic education and Islamic capital time series in log-linear forms are presented in Table 5 based
on three different unit root tests: ADF, P-P and KPSS. The tests were conducted using EViews
version 7.1 on different levels and trends. The maximum bandwidths for the P-P and KPSS tests
were automatically computed by the system, as with the maximum lag order for the ADF test.
Panel-A shows the results on the level form of the variables for the sample period from 1969 to
2011, in which only intercept is included (Panel A1) and both intercept and deterministic time trend
are included in the equation (Panel A2). The results of t-statistic in ADF, adjusted t-statistic in P-P
and LM-statistic in the KPSS tests maximum lag order and bandwidth respectively for the level
form of variables in Panel A reveal that none of them (whether intercepts and trend or intercept
only is included) yields significant result at 90% confidence level or above (see Panel A1 and A2).
This suggests that we cannot reject the null hypothesis in the Islamization index and its sub-indices
of faith, education and capital time series at their respective levels; meaning that the Islamization
index and its sub-indices are basically non-stationary stochastic or random walks time series.
Asian Economic and Financial Review, 2014, 4(10): 1298-1313
1308
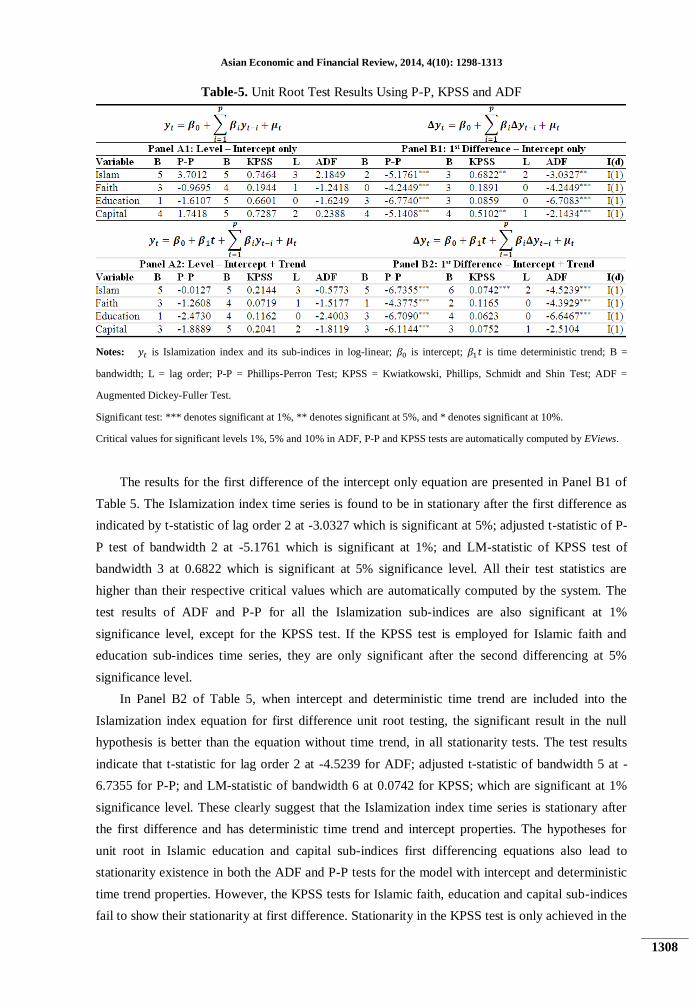
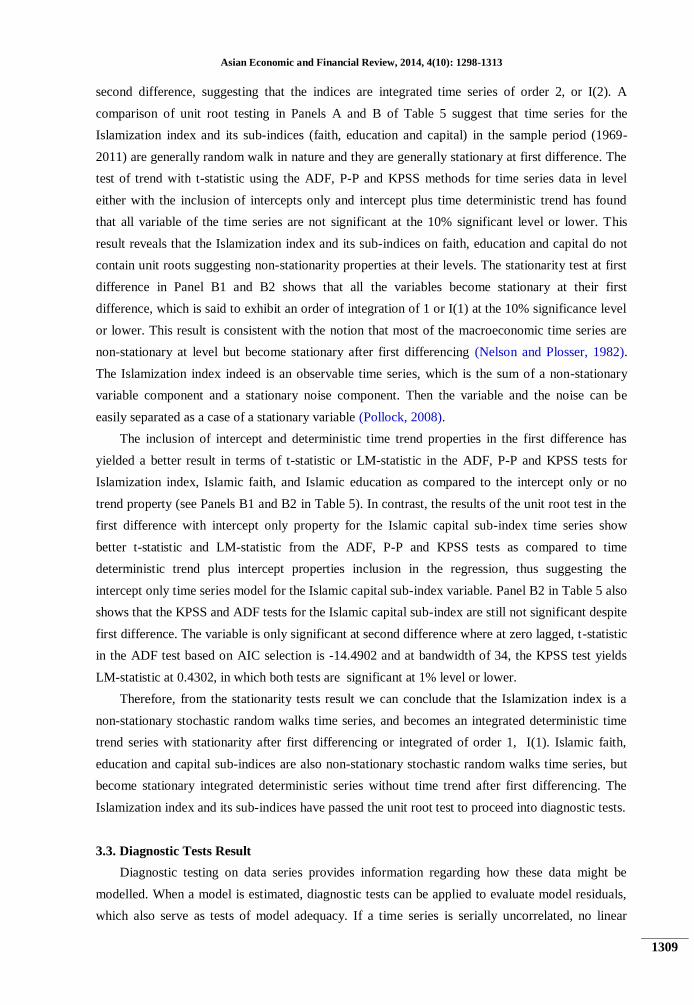
Table-5. Unit Root Test Results Using P-P, KPSS and ADF
Notes: is Islamization index and its sub-indices in log-linear; is intercept; is time deterministic trend; B =
bandwidth; L = lag order; P-P = Phillips-Perron Test; KPSS = Kwiatkowski, Phillips, Schmidt and Shin Test; ADF =
Augmented Dickey-Fuller Test.
Significant test: *** denotes significant at 1%, ** denotes significant at 5%, and * denotes significant at 10%.
Critical values for significant levels 1%, 5% and 10% in ADF, P-P and KPSS tests are automatically computed by EViews.
The results for the first difference of the intercept only equation are presented in Panel B1 of
Table 5. The Islamization index time series is found to be in stationary after the first difference as
indicated by t-statistic of lag order 2 at -3.0327 which is significant at 5%; adjusted t-statistic of P-
P test of bandwidth 2 at -5.1761 which is significant at 1%; and LM-statistic of KPSS test of
bandwidth 3 at 0.6822 which is significant at 5% significance level. All their test statistics are
higher than their respective critical values which are automatically computed by the system. The
test results of ADF and P-P for all the Islamization sub-indices are also significant at 1%
significance level, except for the KPSS test. If the KPSS test is employed for Islamic faith and
education sub-indices time series, they are only significant after the second differencing at 5%
significance level.
In Panel B2 of Table 5, when intercept and deterministic time trend are included into the
Islamization index equation for first difference unit root testing, the significant result in the null
hypothesis is better than the equation without time trend, in all stationarity tests. The test results
indicate that t-statistic for lag order 2 at -4.5239 for ADF; adjusted t-statistic of bandwidth 5 at -
6.7355 for P-P; and LM-statistic of bandwidth 6 at 0.0742 for KPSS; which are significant at 1%
significance level. These clearly suggest that the Islamization index time series is stationary after
the first difference and has deterministic time trend and intercept properties. The hypotheses for
unit root in Islamic education and capital sub-indices first differencing equations also lead to
stationarity existence in both the ADF and P-P tests for the model with intercept and deterministic
time trend properties. However, the KPSS tests for Islamic faith, education and capital sub-indices
fail to show their stationarity at first difference. Stationarity in the KPSS test is only achieved in the
Asian Economic and Financial Review, 2014, 4(10): 1298-1313
1309
second difference, suggesting that the indices are integrated time series of order 2, or I(2). A
comparison of unit root testing in Panels A and B of Table 5 suggest that time series for the
Islamization index and its sub-indices (faith, education and capital) in the sample period (1969-
2011) are generally random walk in nature and they are generally stationary at first difference. The
test of trend with t-statistic using the ADF, P-P and KPSS methods for time series data in level
either with the inclusion of intercepts only and intercept plus time deterministic trend has found
that all variable of the time series are not significant at the 10% significant level or lower. This
result reveals that the Islamization index and its sub-indices on faith, education and capital do not
contain unit roots suggesting non-stationarity properties at their levels. The stationarity test at first
difference in Panel B1 and B2 shows that all the variables become stationary at their first
difference, which is said to exhibit an order of integration of 1 or I(1) at the 10% significance level
or lower. This result is consistent with the notion that most of the macroeconomic time series are
non-stationary at level but become stationary after first differencing (Nelson and Plosser, 1982).
The Islamization index indeed is an observable time series, which is the sum of a non-stationary
variable component and a stationary noise component. Then the variable and the noise can be
easily separated as a case of a stationary variable (Pollock, 2008).
The inclusion of intercept and deterministic time trend properties in the first difference has
yielded a better result in terms of t-statistic or LM-statistic in the ADF, P-P and KPSS tests for
Islamization index, Islamic faith, and Islamic education as compared to the intercept only or no
trend property (see Panels B1 and B2 in Table 5). In contrast, the results of the unit root test in the
first difference with intercept only property for the Islamic capital sub-index time series show
better t-statistic and LM-statistic from the ADF, P-P and KPSS tests as compared to time
deterministic trend plus intercept properties inclusion in the regression, thus suggesting the
intercept only time series model for the Islamic capital sub-index variable. Panel B2 in Table 5 also
shows that the KPSS and ADF tests for the Islamic capital sub-index are still not significant despite
first difference. The variable is only significant at second difference where at zero lagged, t-statistic
in the ADF test based on AIC selection is -14.4902 and at bandwidth of 34, the KPSS test yields
LM-statistic at 0.4302, in which both tests are significant at 1% level or lower.
Therefore, from the stationarity tests result we can conclude that the Islamization index is a
non-stationary stochastic random walks time series, and becomes an integrated deterministic time
trend series with stationarity after first differencing or integrated of order 1, I(1). Islamic faith,
education and capital sub-indices are also non-stationary stochastic random walks time series, but
become stationary integrated deterministic series without time trend after first differencing. The
Islamization index and its sub-indices have passed the unit root test to proceed into diagnostic tests.
3.3. Diagnostic Tests Result
Diagnostic testing on data series provides information regarding how these data might be
modelled. When a model is estimated, diagnostic tests can be applied to evaluate model residuals,
which also serve as tests of model adequacy. If a time series is serially uncorrelated, no linear
Asian Economic and Financial Review, 2014, 4(10): 1298-1313
1310
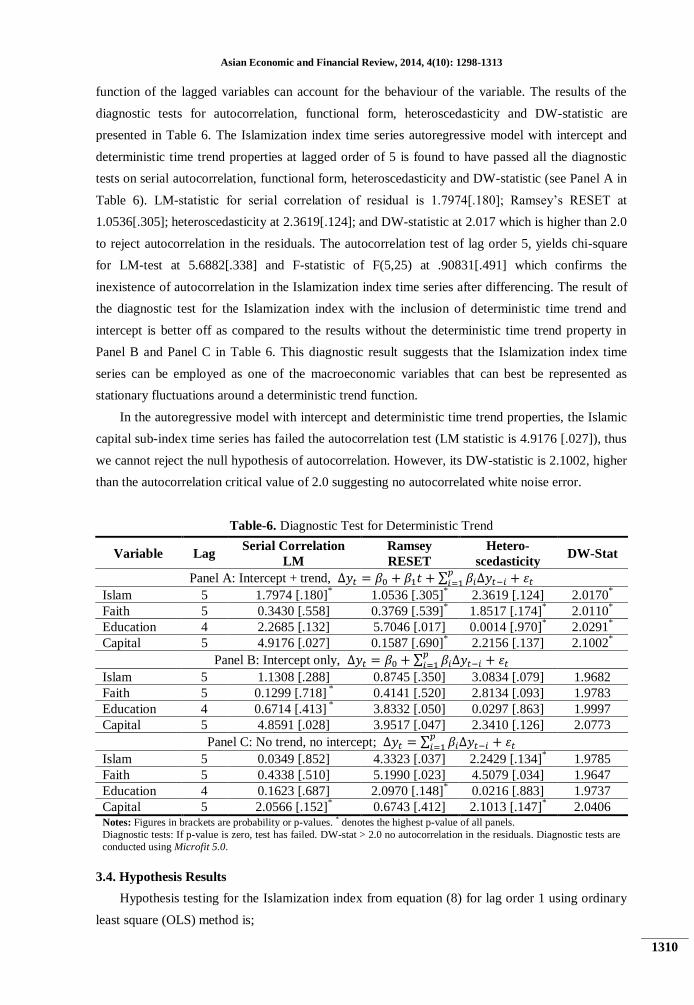
function of the lagged variables can account for the behaviour of the variable. The results of the
diagnostic tests for autocorrelation, functional form, heteroscedasticity and DW-statistic are
presented in Table 6. The Islamization index time series autoregressive model with intercept and
deterministic time trend properties at lagged order of 5 is found to have passed all the diagnostic
tests on serial autocorrelation, functional form, heteroscedasticity and DW-statistic (see Panel A in
Table 6). LM-statistic for serial correlation of residual is 1.7974[.180]; Ramsey’s RESET at
1.0536[.305]; heteroscedasticity at 2.3619[.124]; and DW-statistic at 2.017 which is higher than 2.0
to reject autocorrelation in the residuals. The autocorrelation test of lag order 5, yields chi-square
for LM-test at 5.6882[.338] and F-statistic of F(5,25) at .90831[.491] which confirms the
inexistence of autocorrelation in the Islamization index time series after differencing. The result of
the diagnostic test for the Islamization index with the inclusion of deterministic time trend and
intercept is better off as compared to the results without the deterministic time trend property in
Panel B and Panel C in Table 6. This diagnostic result suggests that the Islamization index time
series can be employed as one of the macroeconomic variables that can best be represented as
stationary fluctuations around a deterministic trend function.
In the autoregressive model with intercept and deterministic time trend properties, the Islamic
capital sub-index time series has failed the autocorrelation test (LM statistic is 4.9176 [.027]), thus
we cannot reject the null hypothesis of autocorrelation. However, its DW-statistic is 2.1002, higher
than the autocorrelation critical value of 2.0 suggesting no autocorrelated white noise error.
Table-6. Diagnostic Test for Deterministic Trend
Variable Lag Serial Correlation
LM
Ramsey
RESET
Hetero-
scedasticity DW-Stat
Panel A: Intercept + trend, ∑
Islam 5 1.7974 [.180]* 1.0536 [.305]
* 2.3619 [.124] 2.0170
*
Faith 5 0.3430 [.558] 0.3769 [.539]* 1.8517 [.174]
* 2.0110
*
Education 4 2.2685 [.132] 5.7046 [.017] 0.0014 [.970]* 2.0291
*
Capital 5 4.9176 [.027] 0.1587 [.690]* 2.2156 [.137] 2.1002
*
Panel B: Intercept only, ∑
Islam 5 1.1308 [.288] 0.8745 [.350] 3.0834 [.079] 1.9682
Faith 5 0.1299 [.718] * 0.4141 [.520] 2.8134 [.093] 1.9783
Education 4 0.6714 [.413] * 3.8332 [.050] 0.0297 [.863] 1.9997
Capital 5 4.8591 [.028] 3.9517 [.047] 2.3410 [.126] 2.0773
Panel C: No trend, no intercept; ∑
Islam 5 0.0349 [.852] 4.3323 [.037] 2.2429 [.134]* 1.9785
Faith 5 0.4338 [.510] 5.1990 [.023] 4.5079 [.034] 1.9647
Education 4 0.1623 [.687] 2.0970 [.148]* 0.0216 [.883] 1.9737
Capital 5 2.0566 [.152]* 0.6743 [.412] 2.1013 [.147]
* 2.0406
Notes: Figures in brackets are probability or p-values. * denotes the highest p-value of all panels.
Diagnostic tests: If p-value is zero, test has failed. DW-stat > 2.0 no autocorrelation in the residuals. Diagnostic tests are
conducted using Microfit 5.0.
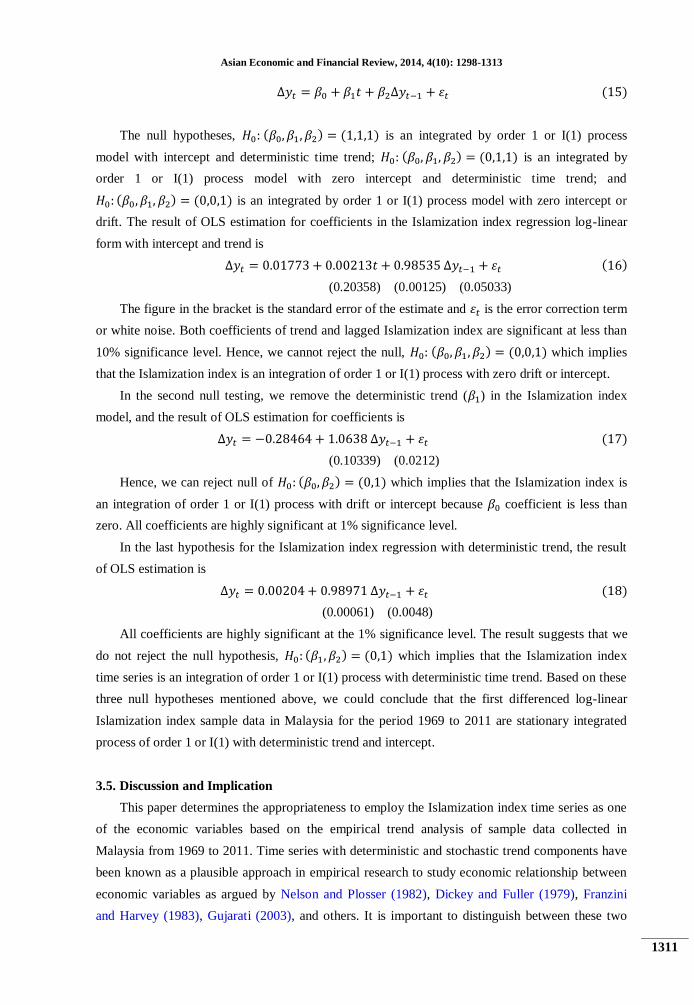
3.4. Hypothesis Results
Hypothesis testing for the Islamization index from equation (8) for lag order 1 using ordinary
least square (OLS) method is;
Asian Economic and Financial Review, 2014, 4(10): 1298-1313
1311
The null hypotheses, is an integrated by order 1 or I(1) process
model with intercept and deterministic time trend; is an integrated by
order 1 or I(1) process model with zero intercept and deterministic time trend; and
is an integrated by order 1 or I(1) process model with zero intercept or
drift. The result of OLS estimation for coefficients in the Islamization index regression log-linear
form with intercept and trend is
(0.20358) (0.00125) (0.05033)
The figure in the bracket is the standard error of the estimate and is the error correction term
or white noise. Both coefficients of trend and lagged Islamization index are significant at less than
10% significance level. Hence, we cannot reject the null, which implies
that the Islamization index is an integration of order 1 or I(1) process with zero drift or intercept.
In the second null testing, we remove the deterministic trend ( ) in the Islamization index
model, and the result of OLS estimation for coefficients is
(0.10339) (0.0212)
Hence, we can reject null of which implies that the Islamization index is
an integration of order 1 or I(1) process with drift or intercept because coefficient is less than
zero. All coefficients are highly significant at 1% significance level.
In the last hypothesis for the Islamization index regression with deterministic trend, the result
of OLS estimation is
(0.00061) (0.0048)
All coefficients are highly significant at the 1% significance level. The result suggests that we
do not reject the null hypothesis, which implies that the Islamization index
time series is an integration of order 1 or I(1) process with deterministic time trend. Based on these
three null hypotheses mentioned above, we could conclude that the first differenced log-linear
Islamization index sample data in Malaysia for the period 1969 to 2011 are stationary integrated
process of order 1 or I(1) with deterministic trend and intercept.
3.5. Discussion and Implication
This paper determines the appropriateness to employ the Islamization index time series as one
of the economic variables based on the empirical trend analysis of sample data collected in
Malaysia from 1969 to 2011. Time series with deterministic and stochastic trend components have
been known as a plausible approach in empirical research to study economic relationship between
economic variables as argued by Nelson and Plosser (1982), Dickey and Fuller (1979), Franzini
and Harvey (1983), Gujarati (2003), and others. It is important to distinguish between these two
Asian Economic and Financial Review, 2014, 4(10): 1298-1313
1312
important cases. In a stationary process with a deterministic trend, the shocks have transitory
effects. In contrast, for a process with a stochastic trend or a unit root, the shocks have permanent
effects.
Preliminary data and unit roots test results show that the Islamization index and its sub-indices
time series are basically random walks or stochastic trend with drift in nature, like other economic
performance variables. They become a stationary process after first differencing with the inclusion
of deterministic trend and intercept. The implications from the stationarity test are that the shocks
in the Islamization index have transitory effects; and satisfy a strong law of large numbers (SLLN)
and suitably standardized sums of elements of the time series obey a central limit theorem (CLT);
which are important to prevent the potential risk of misspecification of the data-generating
mechanism and exhibiting spurious correlation (Durlauf and Phillips, 1987).
4. CONCLUSION
This paper documents the appropriateness of the Islamization index to be employed as one of
the macroeconomic variables time series to overcome the problem of robustness in the study on the
effect of religion on economic performance. When deterministic trend and intercept are included in
the time series differencing model, the stationarity result is found to be better off as compared to
that without deterministic time trend. This suggests that deterministic time trend should be included
in the Islamization index and its sub-indices time series model. Stationary or unit root tests on the
Islamization index and its sub-indices have revealed that their time series variables are stationary
with time deterministic properties at first difference or integrated by the order 1, I(1), which is
consistent with the notion that most of the macroeconomic time series are non-stationary at level
but become stationary after first differencing.
Diagnostic tests for the various models of the Islamization index and its sub-indices indicate
that the autoregressive model with the inclusion of deterministic time trend and intercept yield
better passing marks as compared to those without time trend in terms of serial correlation of
residuals, Ramsey’s RESET test for functional form, heteroscedasticity test, and DW-statistic for
autocorrelation. Therefore, the Islamization index as a proxy of Islam can be employed in the
empirical study with other economic variables because time series with stationary deterministic and
stochastic trend components have been known as a plausible approach in empirical research to
study the economic relationship between variables.
REFERENCES
Ahmad Sarji, A.H., 2005. Indicators of development of the Muslim Ummah in Malaysia. In M. Kamal Hassan,
& Ghazali Basri (Eds.), The encyclopedia of Malaysia: Religions and beliefs. Singapore:
Archipelago Press, 10.
Banerjee, A., J. Dolado, J.W. Galbraith and D.F. Hendry, 2003. Co-integration, error correction and the
econometric analysis of non-stationary data. Oxford, UK: Oxford University Press.
Barro, R. and X. Sala-i-Martin, 1995. Economic growth. New York: McGraw-Hill.
Asian Economic and Financial Review, 2014, 4(10): 1298-1313
1313
Barro, R.J. and R. McCleary, 2003. Religion and economic growth. National Bureau of Economic Research
(NBER) Working Papers Series No.9682, Cambridge, USA.
Blum, U. and L. Dudley, 2001. Religion and economic growth: Was weber right? Centre for Inter-University
Research in Quantitative Economics (CIREQ) Working Paper No. 05-2001.
Dickey, D.A. and W.A. Fuller, 1979. Distribution of the estimators for autoregressive time series with a unit
root. Journal of the American Statistical Association, 74(366): 427-431.
Durlauf, S.N. and P.C. Phillips, 1987. Trends versus random walks in time series analysis. Econometrica,
Econometric Society, 56(6): 1333-1354.
Franzini, L. and A.C. Harvey, 1983. Testing for deterministic trend and seasonal components in time series
models. Biometrika, 70(3): 673-682.
Ghazali, A., 1990. Development: An islamic perspective. Petaling Jaya, Malaysia: Pelanduk Publication.
Granger, C.J. and P. Newbold, 1974. Spurious regressions in econometrics. Journal of Econometrics, 2: 111-
120.
Grier, R., 1997. The effect of religion on economic development: A cross national study of 63 former
colonies. KYKLOS, 1: 47-62.
Gujarati, D.N., 2003. Basic econometrics. 4th Edn., Singapore: McGraw-Hill Higher Education.
Kwiatkowski, D., P.B. Phillips, P. Schmidt and Y. Shin, 1992. Testing the null hypothesis of stationarity
against the alternative of a unit root: How sure are we that economic time series have a unit root?
Journal of Econometrics, 54: 159-178.
Mangeloja, E., 2005. Implications of the economics of religion to the empirical economic research. Working
Paper, School of Business and Economics, University of Jyvaskyla. Available from
http://gunston.doit.gmu.edu/../REC04 [Accessed Jul, 2009].
Nelson, C.R. and C.I. Plosser, 1982. Trends and random walks in macroeconomics time series. Journal of
Monetary Economics, 10: 139-162.
Pollock, D.G., 2008. Investigating economic trends and cycles. In T. C. Mills, & K. Patterson, Palgrave
handbook of econometrics. Applied econometrics. London: Palgrave Macmillan, 2.
Rehman, S.S. and H. Askari, 2010. An economic islamicity index (EII). Global Economy Journal, 10(3): 1-37.
i Prophet Muhammad s.a.w (peace be upon him) as narrated by Ibn Umar explains that Islam is based on five
pillars: shahadah, shalat, zakat, fasting in the month of Ramadhan, and performing hajj pilgrimage for those who have the
capability at least once in a life time (Shahih al-Bukhari 1:8 and Shahih al-Muslim 1:34).