Embed Size (px)
Citation preview
ABSTRACT
PROPERTIES OF TRANSITION METAL OXIDES FOR GAS SEPARATION AND OXYGEN STORAGE APPLICATIONS
Steven Remsen, Ph.D. Department of Physics
Northern Illinois University, 2011 Bogdan Dabrowski, Director
Ceramic oxide materials have been heavily researched for selective oxygen
separation, oxygen storage, chemical energy conversion, and related energy
applications. They exhibit a range of properties, such as large reversible changes in
oxygen content and enhanced electronic and oxygen ion conductivity that are
temperature and oxygen atmosphere dependent, which are ideal for such applications.
This work explores the application-related properties of new hexagonal (R = Dy, Y
and M = Mn) and perovskite (R = La, Sr and M = Mn, Fe, Co) RMO3+δ materials with
reversible oxygen storage/release capacities and mixed oxygen ion electronic
conductivity, respectively. These materials were achieved by special synthesis
techniques guided by the temperature and oxygen content dependence of the
Goldschmidt tolerance factor. Hexagonal P63cm Dy1-xYxMnO3+δ materials were found
to have reversible oxygen storage/release capacities in oxygen atmospheres
comparable to best-known materials (~2000 μmol-O/g) while operating at
considerably lower temperatures. Thermogravimetric measurements in oxygen
atmosphere and neutron and x-ray diffraction identified two new hexagonal phases
with δ ≈ 0.25 and 0.40. These large uptakes of oxygen at 200 – 300°C were observed
to completely release when materials were heated to 275 – 375°C or exposed to lower
oxygen partial-pressures. Oxygen non-stoichiometry was also found to have
considerable impact on the structural, thermal/chemical expansion, transport, and
magnetic properties of Dy1-xYxMnO3+δ materials. Several perovskite RMO3+δ materials
were discovered that displayed properties indicating their superior bulk oxygen ion
and electrical conductivity compared to other commonly used mixed oxygen ion
electronic conducting materials. Thermogravimetric, conductivity, and
electrochemical impedance measurements of La1-xSrxFe1-yCoyO3+δ, La.2Sr.8MnO3+δ,
and SrFe.7Mn.3O3+δ samples suggested these compounds to have large fractional
oxygen ion vacancies, high electric conductivity, and exceptionally low activation
energies of oxygen ion conductivity. These materials were also found to have
considerably high oxygen storage/release capacities (~3000 μmol-O/g) for hydrogen-
oxygen atmosphere cycling. Several La1-xSrxFe1-yCoyO3+δ samples showed the
remarkable ability to reabsorb oxygen at room temperature, making them excellent
candidates for application.
NORTHERN ILLINOIS UNIVERSITY DE KALB, ILLINOIS
MAY 2011
PROPERTIES OF TRANSITION METAL OXIDES FOR GAS SEPARATION
AND OXYGEN STORAGE APPLICATIONS
BY
STEVEN REMSEN ©2010 Steven Remsen
A DISSERATION SUBMITTED TO THE GRADUATE SCHOOL
IN PARTIAL FULFILMENT OF THE REQUIREMENTS
FOR THE DEGREE
DOCTOR OF PHILOSOPHY
DEPARTMENT OF PHYSICS
Dissertation Director: Bogdan Dabrowski
All rights reserved
INFORMATION TO ALL USERSThe quality of this reproduction is dependent on the quality of the copy submitted.
In the unlikely event that the author did not send a complete manuscriptand there are missing pages, these will be noted. Also, if material had to be removed,
a note will indicate the deletion.
All rights reserved. This edition of the work is protected againstunauthorized copying under Title 17, United States Code.
ProQuest LLC.789 East Eisenhower Parkway
P.O. Box 1346Ann Arbor, MI 48106 - 1346
UMI 3457804
Copyright 2011 by ProQuest LLC.
UMI Number: 3457804
ACKNOWLEDGEMENTS
I would like to thank, first and foremost, my advisor, Dr. Bogdan Dabrowski,
whose guidance, patience, and mentorship made this project possible and helped
transform a young man into a scientist. I also gained invaluable experience and
assistance throughout this project from Dr. Stanislaw Kolesnik, Dr. Omar Chmaissem,
Dr. Leopoldo Suescun, Dr. Konrad Świerczak, Dr. Andrzej Szewezyk, Dr. David
Carter, Dr. Brian Ingram, Dr. Terry Cruse, and James Mais. I am also indebted to my
fellow graduate students, Stephen Boona, Michael Himes, Dr. Sevda Avci, Manasa
Majjiga, Tim Maxwell, Donald Johnson, Seyed Ahmad Sabok-Sayr, Ben Stillwell,
Simon Murphy, and Nathan Styx, for their laboratory support, teamwork, and
friendship. I would like to thank Amber Remsen for her proofreading of this
dissertation. Finally, I would like to acknowledge the National Science Foundation for
funding this work (NSF-DMR 0706610).

To my father, mother, and wife, Amber,
whose constant love, support, and inspiration made this work possible.
TABLE OF CONTENTS
Page
LIST OF TABLES .................................................................................................... vi
LIST OF FIGURES .................................................................................................. vii
CHAPTER 1: INTRODUCTION ............................................................................... 1
1.1 Air Separation Methods, Past to Present ............................................................ 1
1.2 Elevated-Temperature Ceramic Materials for Air Separation and Oxygen Storage ................................................................................................................... 3
1.3 Other Applications of Ceramic Oxygen Sorbents and Mixed Electronic Ionic Conductors ............................................................................................................. 8
1.3.1 Chemical Looping Combustion .................................................................. 8
1.3.2 Solid Oxide Fuel Cells .............................................................................. 10
1.3.3 Oxygen Sensors ........................................................................................ 12
1.3.4 Waste Heat Air Separation for High-Temperature Systems ...................... 13
CHAPTER 2: EXPERIMENTAL METHODS ......................................................... 15
CHAPTER 3: STUDY OF HEXAGONAL Dy1-xYxMnO3+δ (-0.2 ≤ δ ≤ 0.4) MATERIALS FOR OSC APPLICATIONS ............................................................. 18
3.1 Introduction .................................................................................................... 18
3.2 Synthesis and Stability .................................................................................... 23
3.3 Oxygen Storage Measurements ....................................................................... 29
3.4 Crystal Structure ............................................................................................. 39
3.5 Thermal and Chemical Expansion ................................................................... 46
3.6 Transport Properties ........................................................................................ 52
v
Page
3.7 Magnetic Measurements of DyMnO3+δ (x = 0) ................................................ 59
3.8 Conclusions .................................................................................................... 62
CHAPTER 4: STUDY OF PEROVSKITE La1-xSrxFe1-yCoyO3+δ (x ≥ 0.5), La0.2Sr0.8MnO3+δ, AND SrFe0.7Mn0.3O3+δ MATERIALS FOR MIEC AND OXYGEN CARRIER APPLICATIONS .................................................................................... 65
4.1 Introduction .................................................................................................... 65
4.2 Synthesis and Stability .................................................................................... 71
4.3 Oxygen Storage and Oxygen Content Behavior Measurements ....................... 74
4.4 Electrical Conductivity ................................................................................... 83
4.5 Total Ionic Conductivity ................................................................................. 89
4.6 Thermal and Chemical Expansion ................................................................... 99
4.7 Conclusions ...................................................................................................104
REFERENCES ...................................................................................................... 107
APPENDIX: STRUCTURAL PARAMETERS AND AGREEMENT FACTORS FOR Dy1-xYxMnO3+δ ...................................................................................................... 117
vi
LIST OF TABLES
Page
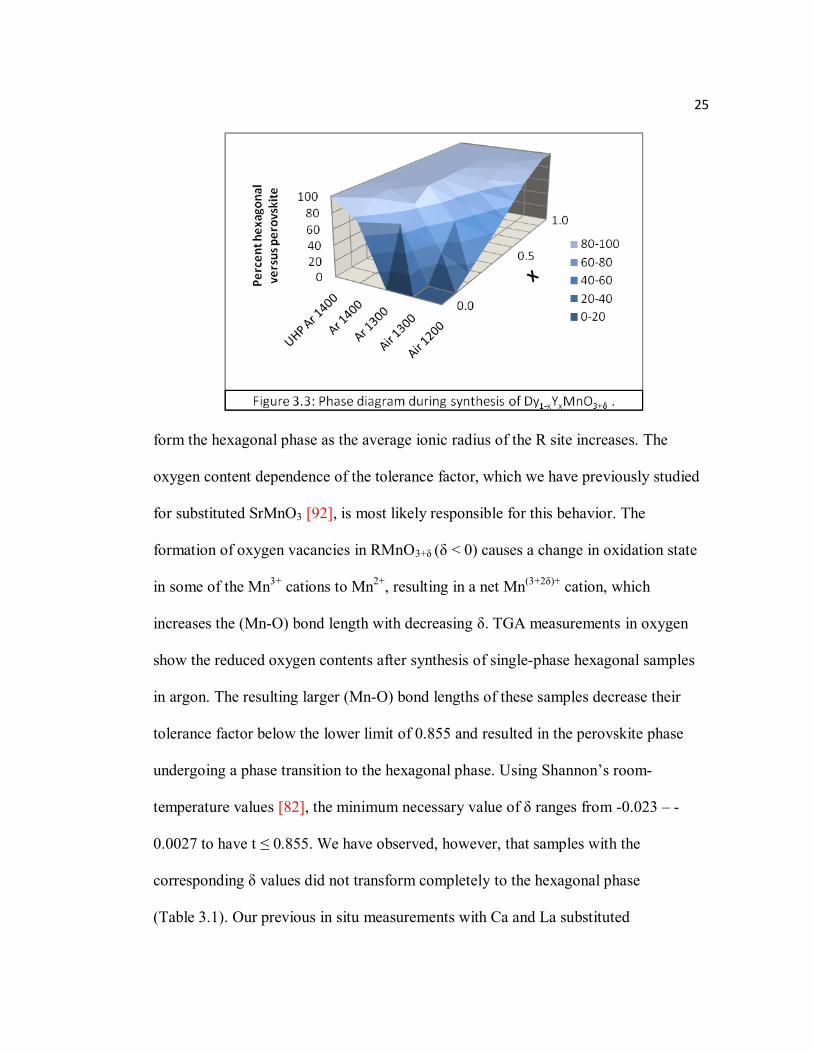
Table 3.1 Hexagonal-Perovskite transition δ-values: t(δTheo.) = 0.855, δobs. are observed values from TGA, and values of t are calculated with Shannon values……………………………………………………………………..26
Table 3.2 OSC (μmol-O/g) of Dy1-xYxMnO3+δ. …………………………………….30
Table 3.3 List of annealed DyMnO3+δ samples……………………………………...40
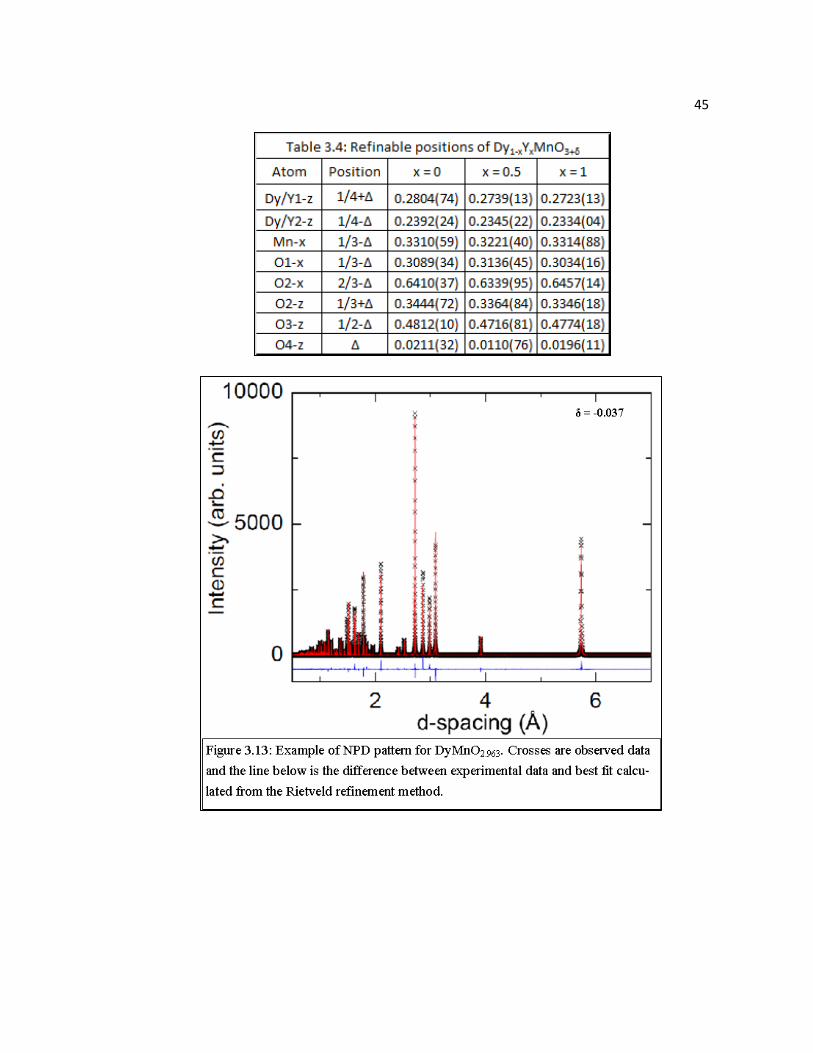
Table 3.4 Refinable positions of Dy1-xYxMnO3+δ…………….……………………..45
Table 3.5 Activation energies in their respective temperature ranges and coefficients of determination of linear fits based on the phonon assisted conduction……………………………………………………….54
Table 3.6 Activation energies in their respective temperature ranges and coefficients of determination of linear fits based on semiconductor behavior………...54
Table 4.1 Oxygenation temperatures (TOx, RT = room temperature) of samples after reduction at 300-400°C in 42% H2 and observed OSC and calculated OSC……………………………………………………….80
Table 4.2 Activation energies for electronic conduction and observed calculated transition temperatures (*referenced from text)…………………………..87
Table 4.3 Activation energies for total ionic conduction (*referenced in text).….....95
Table 4.4 TEC (*10-6 K-1) and CE (*10-2 mol-1) values and effective TEC is calculated without separating CE (*referenced in text)…………………101
Table A.1 Atomic coordinates, lattice parameters, oxygen site occupancies, thermal factors and agreement factors of P63cm DyMnO3+δ (*Deqv.) from IPNS data………………………………………………………………..117
Table A.2 Atomic coordinates, lattice parameters, oxygen site occupancies, thermal factors and agreement factors of P63cm Dy1-xYxMnO3+δ from Echidna data……………………………………………………….118
vii
LIST OF FIGURES
Page
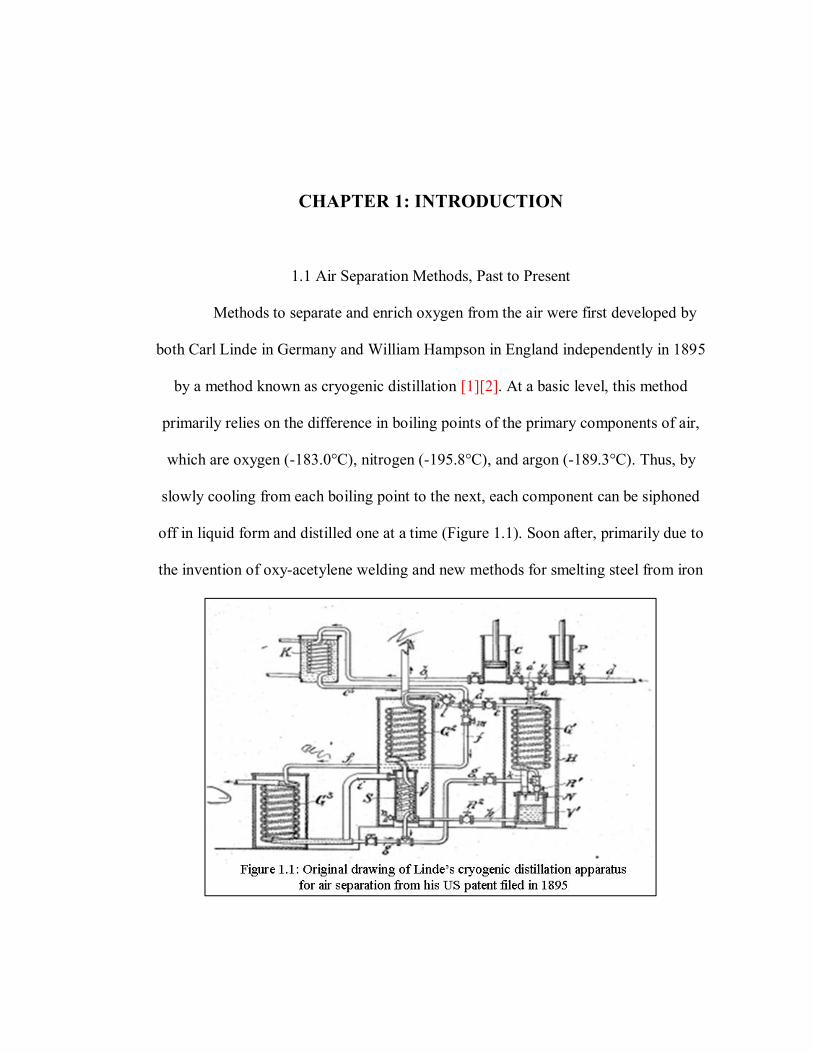
Figure 1.1 Original drawing of Linde’s cryogenic distillation apparatus for air separation from his US patent filed in 1895……………………………..1
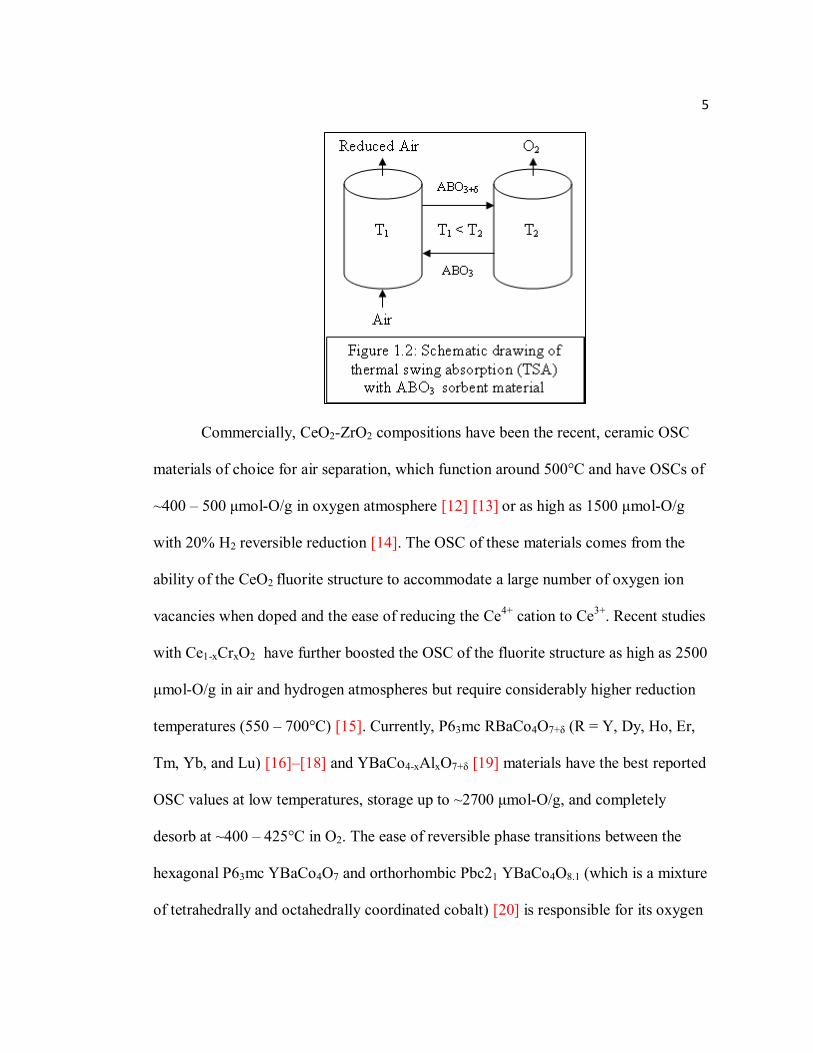
Figure 1.2 Schematic drawing of thermal swing absorption (TSA) with ABO3 sorbent material…………………………………………………………..5
Figure 1.3 Schematic drawings of oxygen separation membranes with solid oxide electrolyte (left) and mixed ionic electronic conductor (right)…………..8
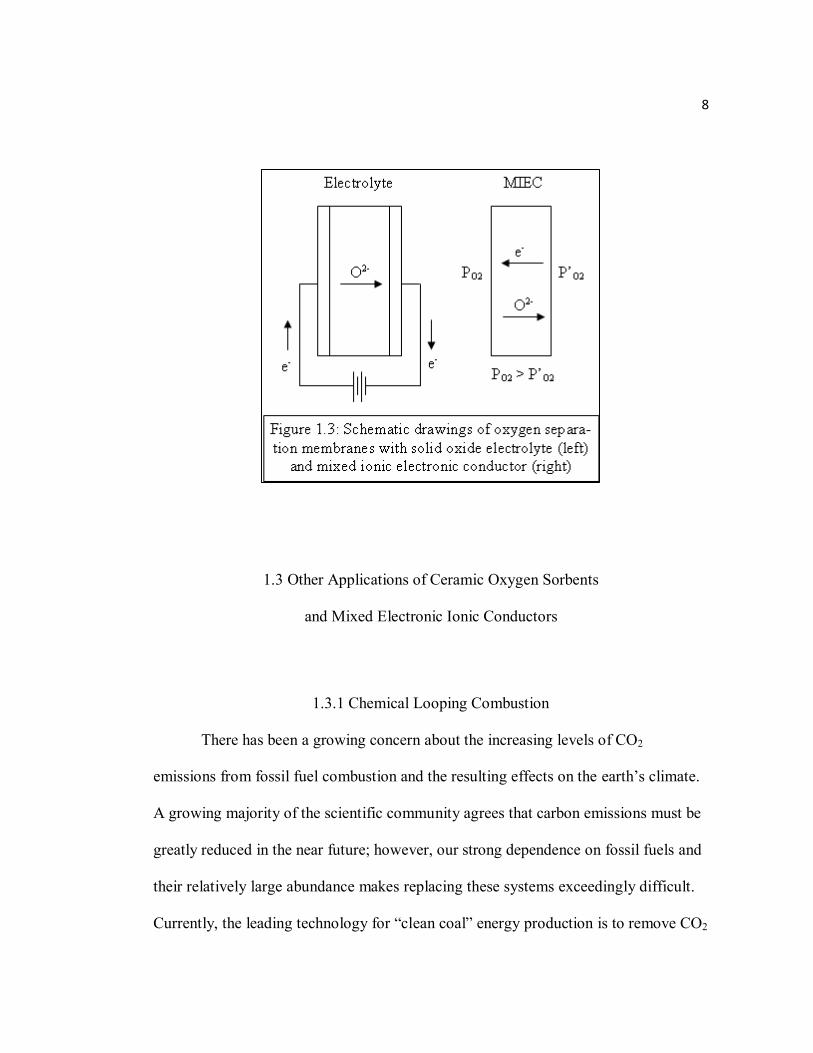
Figure 1.4 Schematic drawing of chemical looping combustion (CLC) with perovskite oxygen carrier……………………………………………….10
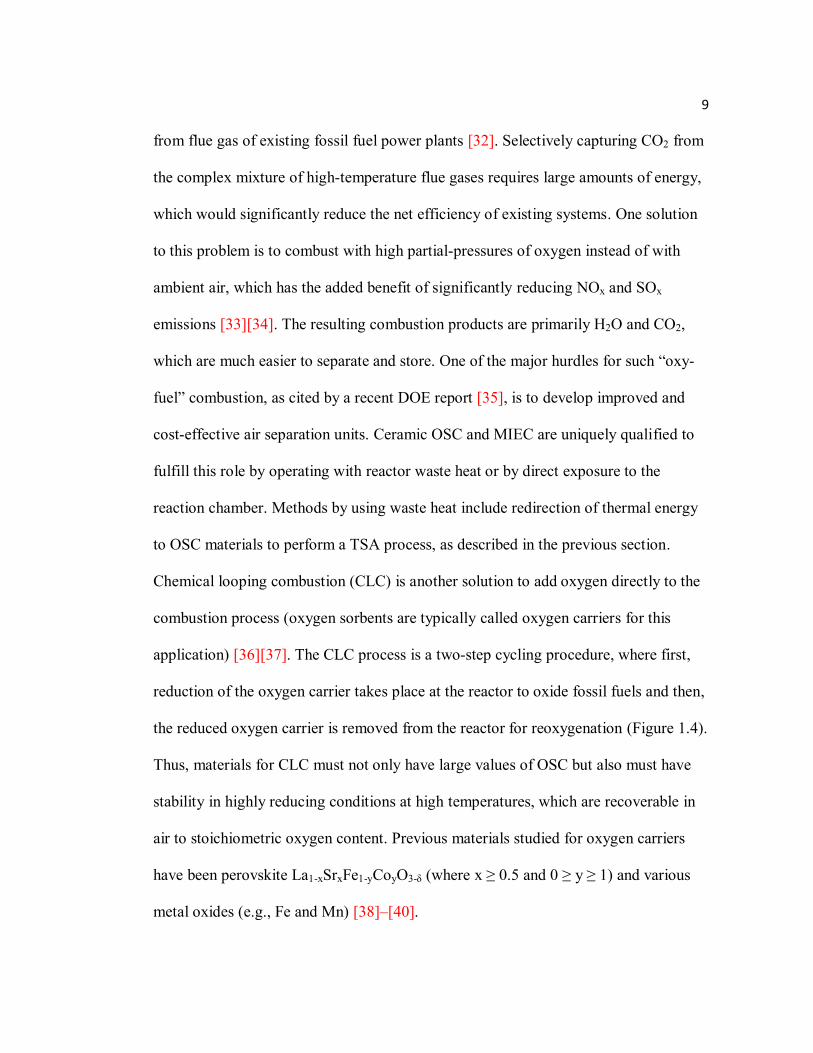
Figure 1.5 Schematic drawing of a solid oxide fuel cell (SOFC)………………….11
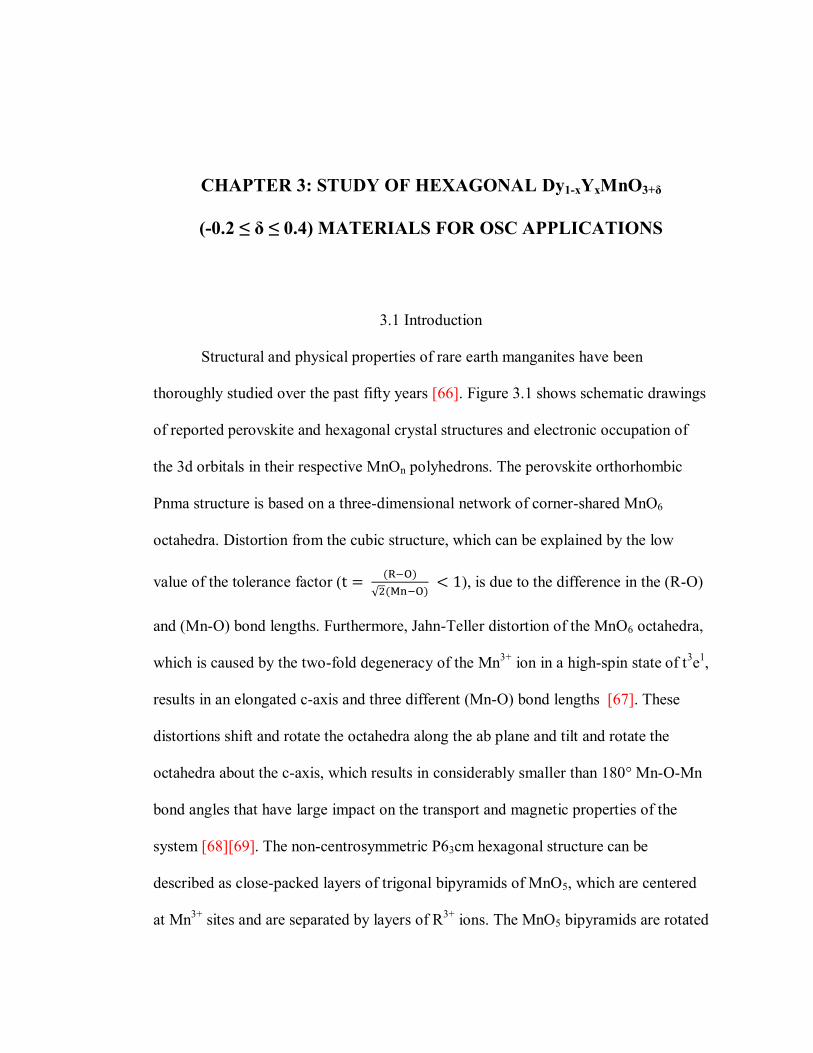
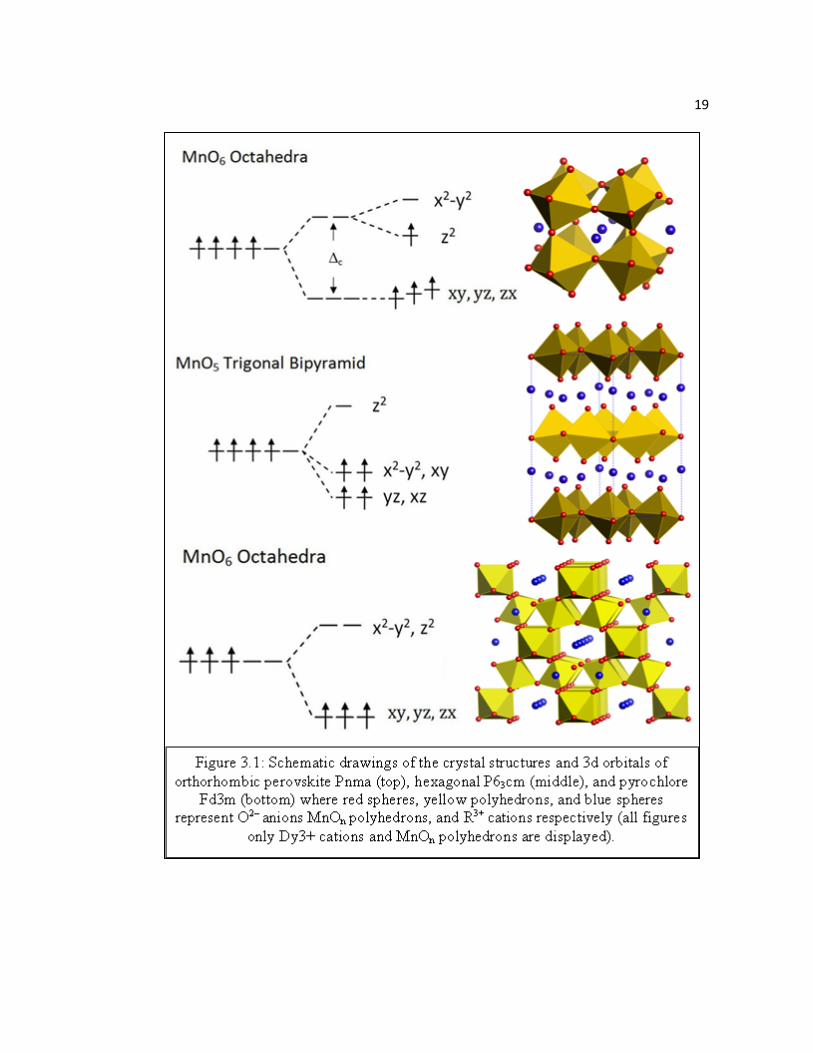
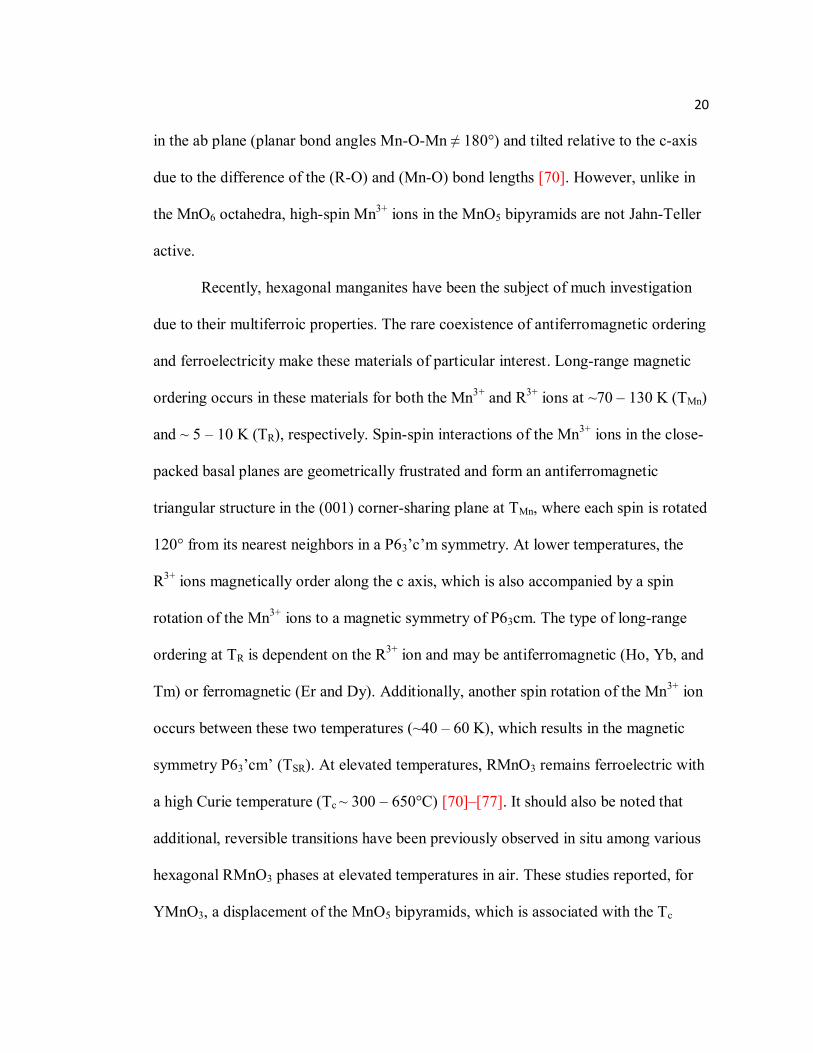
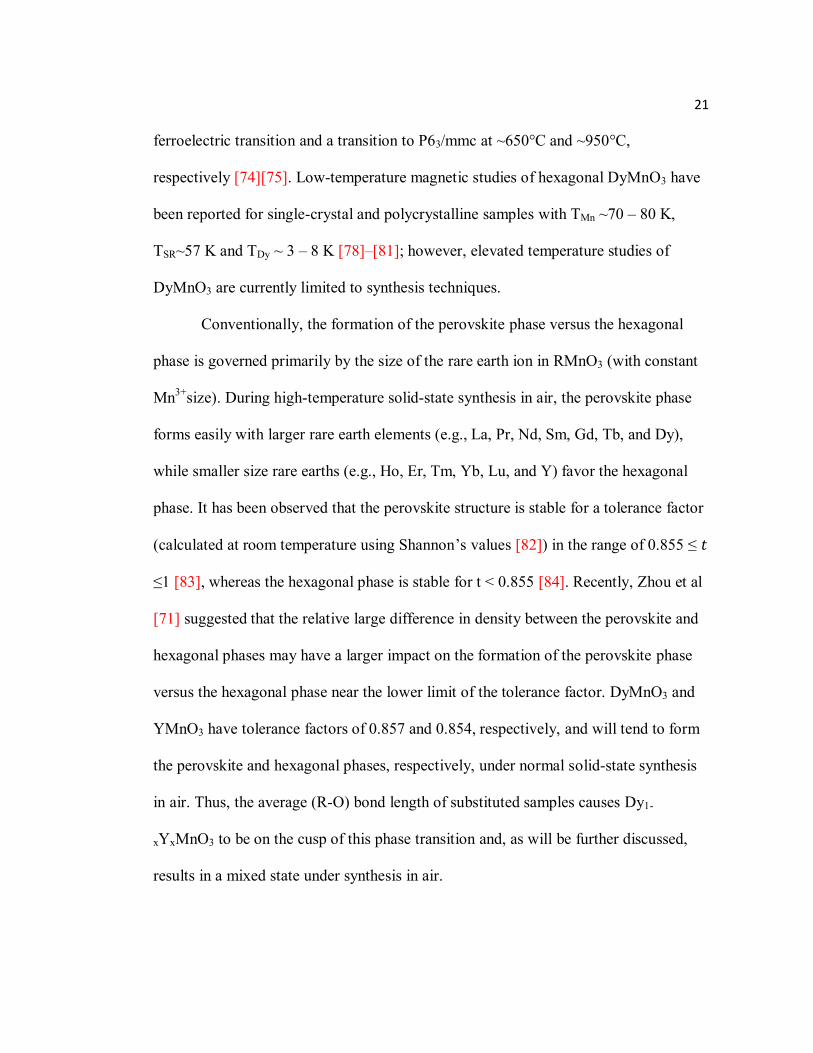
Figure 3.1 Schematic drawings of the crystal structures and 3d orbitals of orthorhombic perovskite Pnma (top), hexagonal P63cm (middle), and pyrochlore Fd3m (bottom) where red spheres, yellow polyhedrons, and blue spheres represent O2- anions, MnOn polyhedrons, and R3+ cations, respectively………………………….………………………………….19
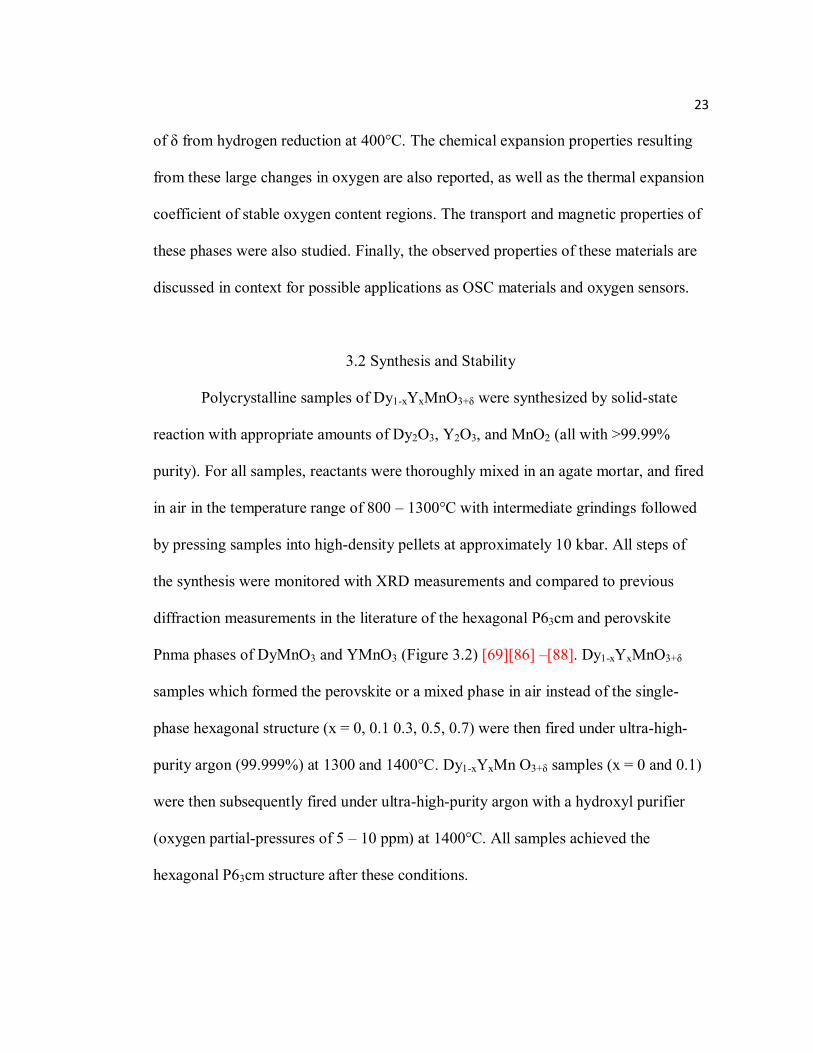
Figure 3.2 XRD patterns examples of hexagonal DyMnO2.963 and YMnO3.004 after initial synthesis………………………………………………………….24
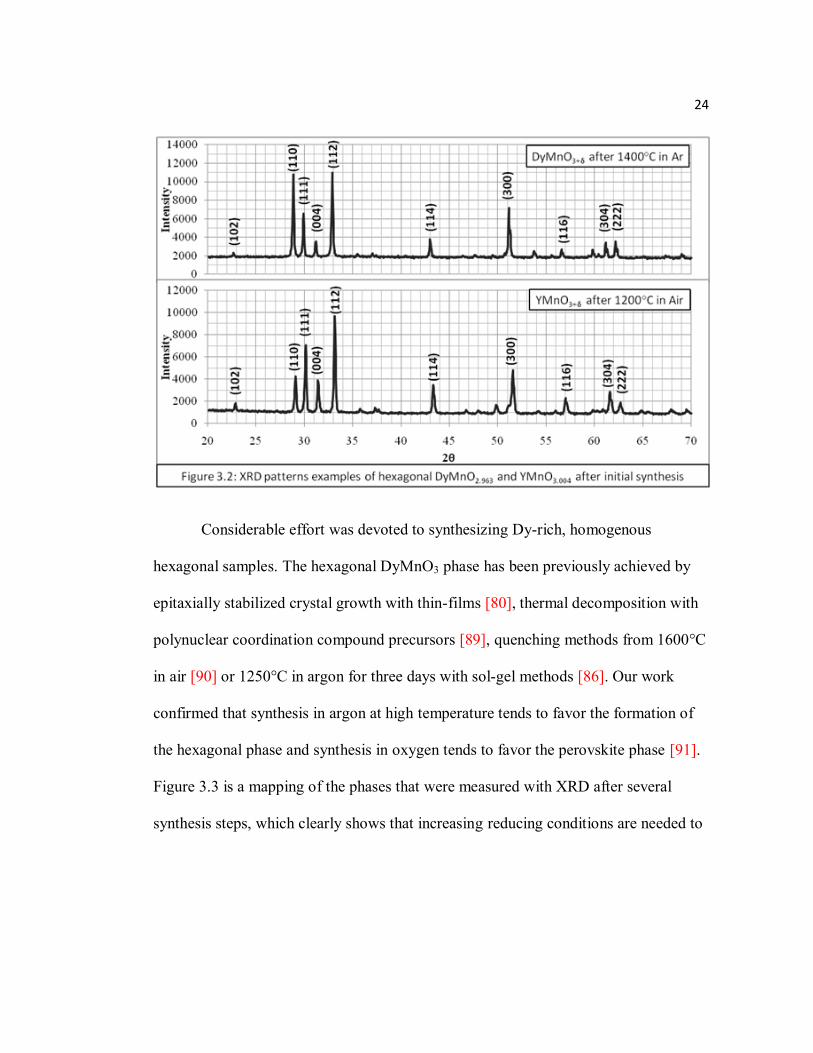
Figure 3.3 Phase diagram during synthesis of Dy1-xYxMnO3+δ…………………....25
Figure 3.4 TGA of annealing after initial synthesis in argon (curve 1) and subsequent reduction of DyMnO3+δ in 42%H2 to Dy2O3 and MnO…….29
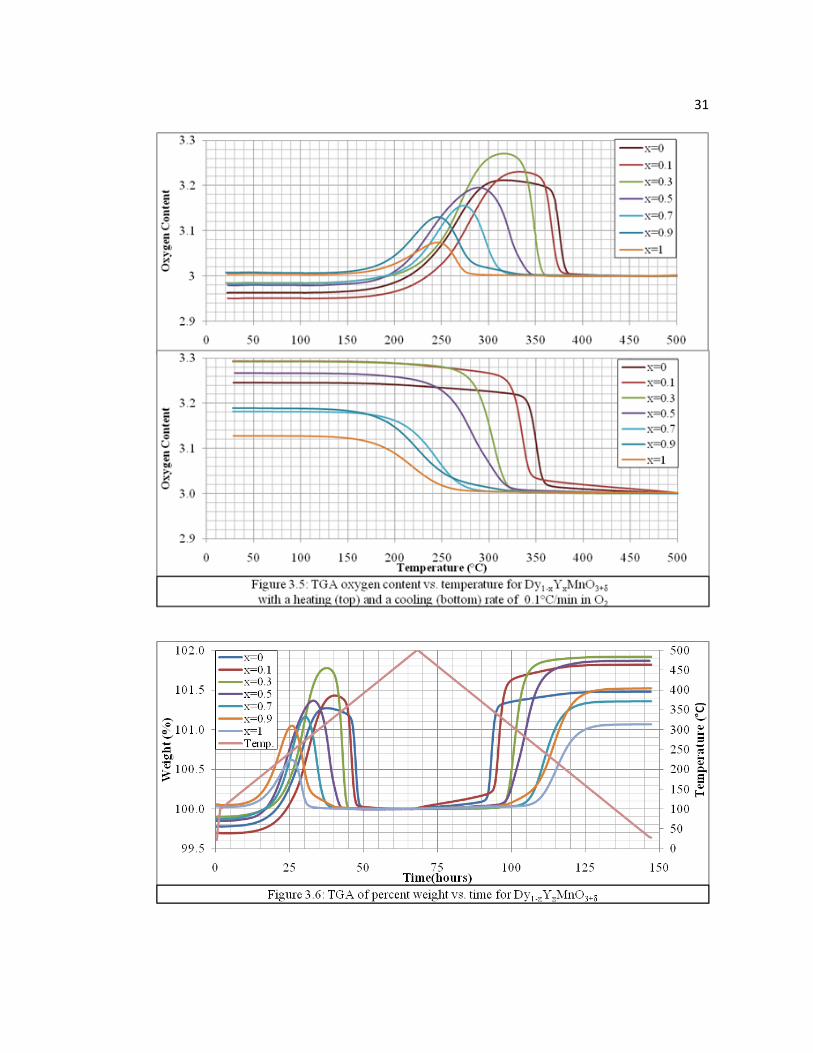
Figure 3.5 TGA oxygen content vs. temperature for Dy1-xYxMnO3+δ with a heating (top) and a cooling (bottom) rate of 0.1°C/min in O2………………….31
Figure 3.6 TGA of percent weight vs. time for Dy1-xYxMnO3+δ………...…………31
Figure 3.7 Dy1-xYxMnO3+δ TSA relevant temperatures……………………………32
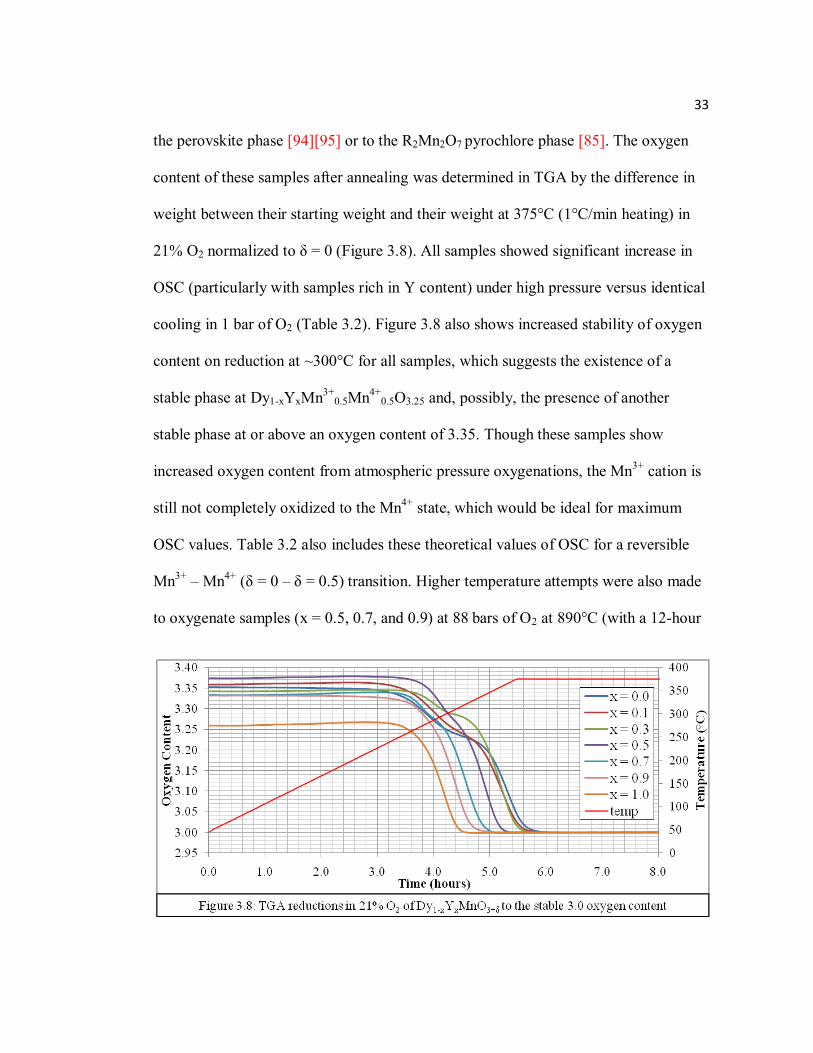
Figure 3.8 TGA reductions in 21% O2 of Dy1-xYxMnO3+δ to the stable 3.0 oxygen content…………………………………………………………………..33
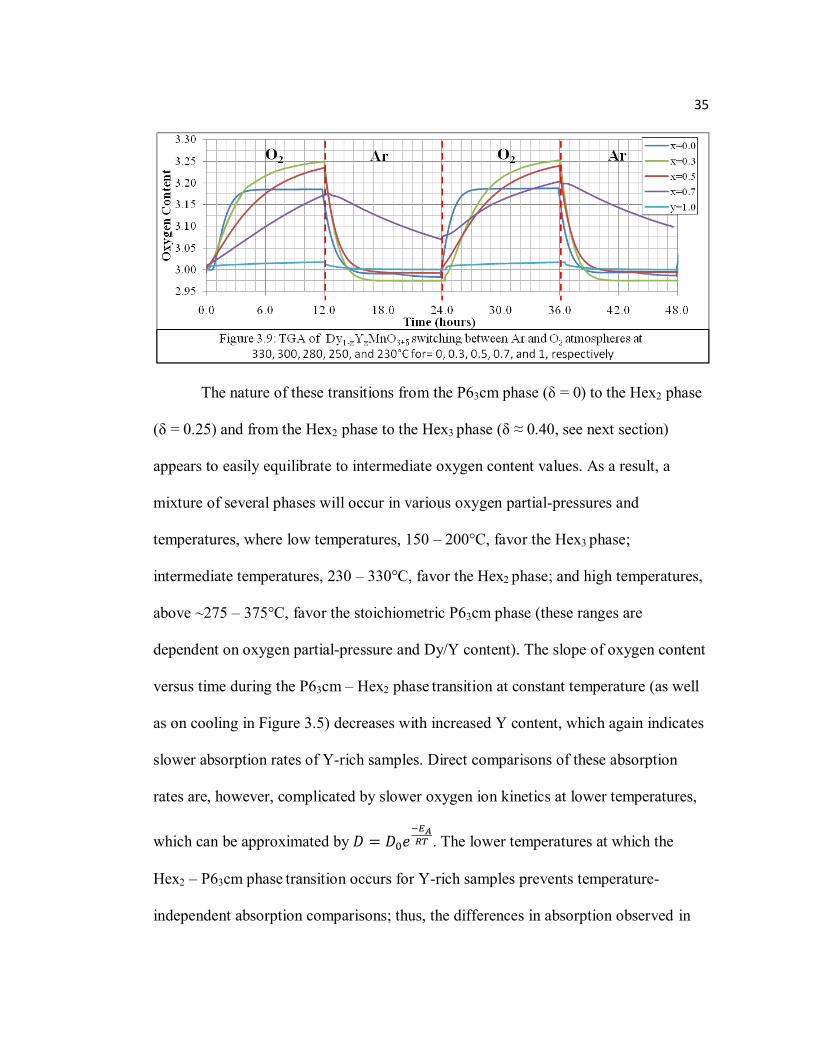
Figure 3.9 TGA of Dy1-xYxMnO3+δ switching between Ar and O2 atmospheres at 330, 300, 280, 250, and 230°C for x = 0, 0.3, 0.5, 0.7, and 1, respectively……………………………………………………………..35
viii
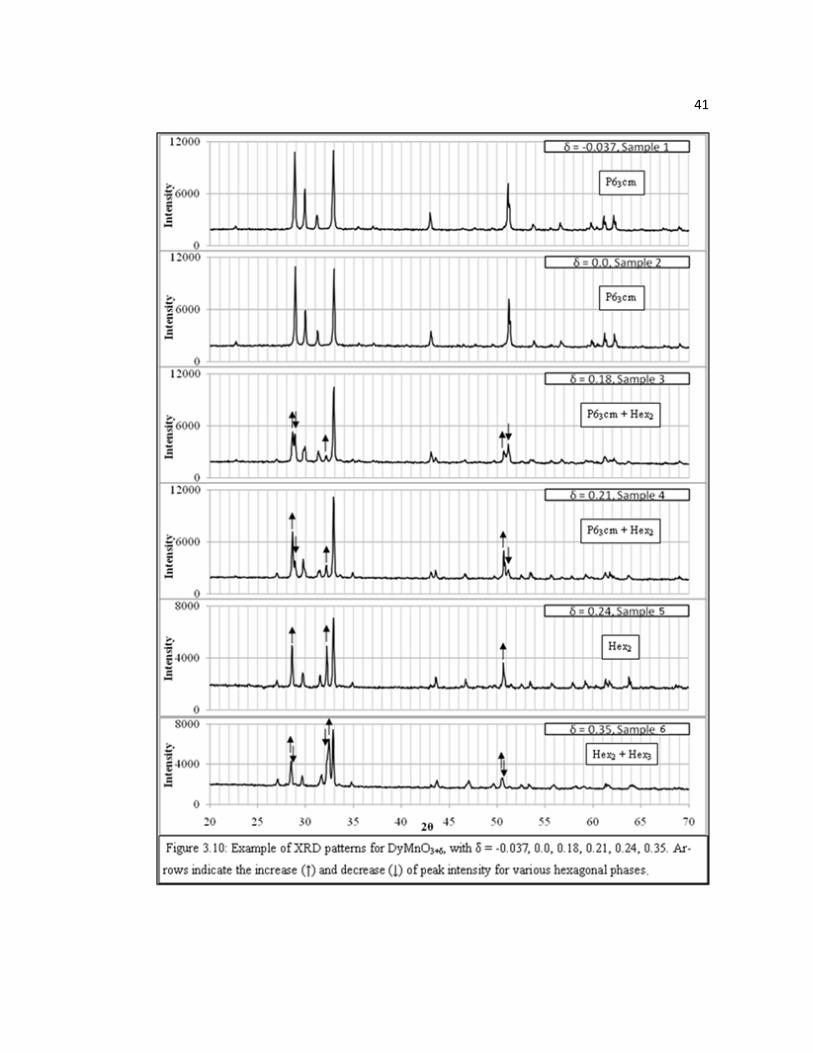
Page Figure 3.10 Example of XRD patterns for DyMnO3+δ, with δ = -0.037, 0.0, 0.18,
0.21, 0.24, 0.35.........................................................................................41
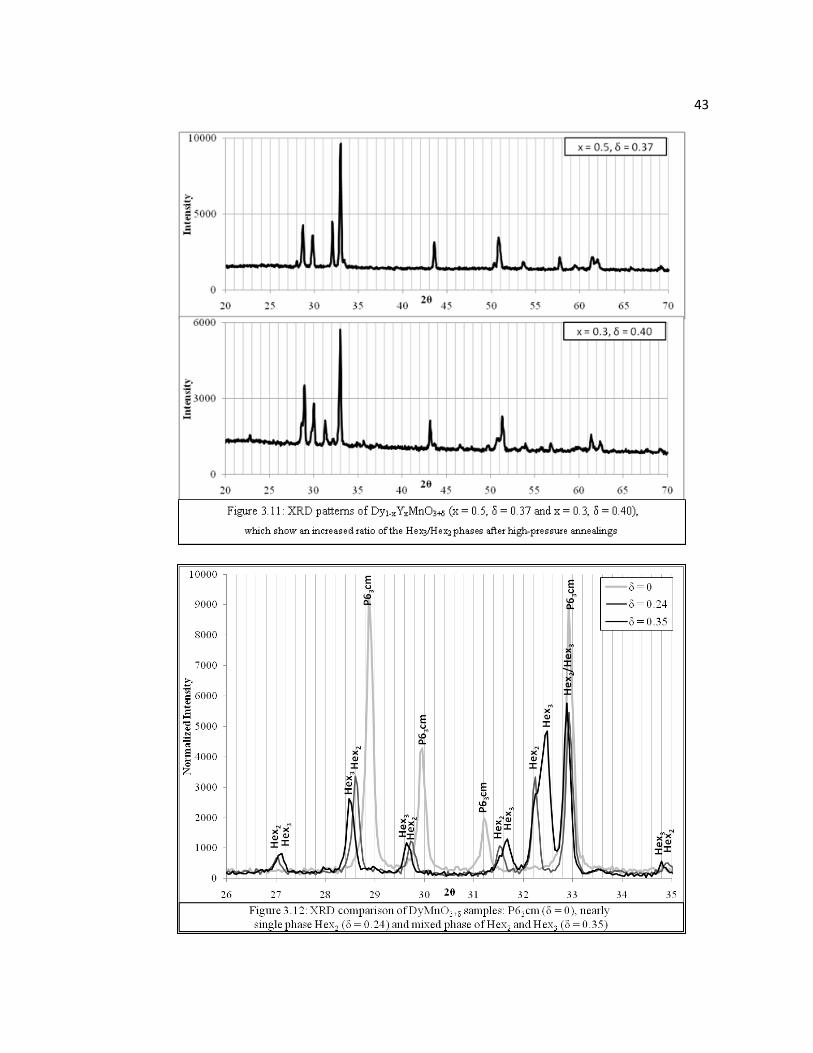
Figure 3.11 XRD patterns of Dy1-xYxMnO3+δ (x = 0.5, δ = 0.37 and x = 0.3, δ = 0.40), which show an increased ratio of the Hex3/Hex2 phases after high-pressure annealings………………………………………………..43
Figure 3.12 XRD comparison for DyMnO3+δ samples: P63cm (δ = 0), nearly single phase Hex2 (δ = 0.24), and mixed phase of Hex2 and Hex3 (δ = 0.35)………………………………………………………………..43
Figure 3.13 Example of NPD pattern for DyMnO2.963. Crosses are observed data and the line below is the difference between experimental data and best fit calculated from the Rietveld refinement method………………….……45
Figure 3.14 Dilatometry measurement of perovskite DyMnO3.0 in 21% O2………...48
Figure 3.15 TGA measurement of hexagonal DyMnO3+δ in 21% O2.………………49
Figure 3.16 Dilatometry measurement of hexagonal DyMnO3+δ in 21% O2………..50
Figure 3.17 TEC values for P63cm and Hex2 versus average R-site ionic radius…...50
Figure 3.18 Chemical expansion values for Dy1-xYxMnO3+δ….……………………50
Figure 3.19 a: Conductivity measurements of Dy1-xYxMnO3+δ in air, b: phonon-assisted conduction model, σT ~ e-Ea/kT, of P63cm (high temperature ) and Hex2 (low-temperature) phases, c: semiconductor conduction model, σ ~ e-Ea/kT, of P63cm (high-temperature) and Hex2 (low-temperature) phases……………………………………………….…………………..53
Figure 3.20 Resistivity measurements of DyMnO3+δ in cycling O2 and Ar atmospheres at 330°C…………………………………………………...58
Figure 3.21 Resistivity measurements of YMnO3+δ in cycling O2 and Ar atmospheres at 230°C…………………………………………………………………58
Figure 3.22 Inverse of DC susceptibility measurements of DyMnO3+δ, δ = -0.037 and 0.00 curves overlapping on top and δ = 0.22 curve on bottom…………59
Figure 3.23 Temperature derivative of inverse DC susceptibility of DyMnO3+δ where TN was found to be slightly lower for non-stoichiometric sample; insert of δ = 0.22………………………………………………………………61
ix
Page Figure 3.24 Temperature derivative of inverse DC susceptibility of DyMnO3+δ where
transition temperature was found to be lower for non-stoichiometric sample; insert of δ =0.22………………………………….……………61
Figure 4.1 Representational drawing of the Brownmillerite crystal structure……..70
Figure 4.2 XRD patterns of the perovskite a) La0.3Sr0.7Fe0.5Co0.5O3, b) La0.2Sr0.8MnO3, c) SrFe0.7Mn0.3O3 structures after initial synthesis……………………………………………………….………..72
Figure 4.3 Example of TGA hydrogen reduction for La0.3Sr0.7Fe0.5Co0.5O3+δ (1°C/min, 42% H2/Ar) to determine oxygen content after initial synthesis………………………………………………………………...72
Figure 4.4 Fraction of oxygen vacancies versus temperature in 21% O2/Ar for La0.2Sr0.8MnO3+δ, SrFe0.7Mn0.3O3+δ, and La0.3Sr0.7Fe0.5Co0.5O3+δ determined by TGA (δ < 0)……………………………………………..76
Figure 4.5 Oxygen vacancy-ordered phases of SrMnO3+δ: a) monoclinic Sr7Mn7O19 (SrMnO2.714), b) tetragonal Sr5Mn5O13 (SrMnO2.6), and c) orthorhombic Sr2Mn2O5 (SrMnO2.5)…………………………………………………...77
Figure 4.6 Example of TGA hydrogen reduction for La0.2Sr0.8MnO3+δ (0.1°C/min, 42% H2/Ar), which shows enhanced stability at δ = -0.4 and δ = -0.5 of vacancy-ordered phases...………………………………………………77
Figure 4.7 Representational drawing of the polyhedral network with oxygen ordered vacancies in Sr8Fe4Co4O23 sample……………………………………...77
Figure 4.8 Example of TGA reduction for La0.3Sr0.7Fe0.6Co0.4O3+δ to Fe3+/Co3+ (δ = -0.55) with 42% H2/Ar at 350°C (1°C/min heating/cooling), followed by room-temperature oxygenation in O2…………………………………...79
Figure 4.9 Example of TGA reduction for SrFe0.7Mn0.3O3+δ to Brownmillerite phase (δ ≈ -0.5) with 42% H2/Ar at 400°C (0.5°C/min heating and fast cooling), followed by heating 1°C/min in O2 to 500°C…………………………..79
Figure 4.10 Example of TGA reduction for La0.2Sr0.8MnO3+δ to (La0.2Sr0.8)5Mn5O13(δ ≈ -0.4) with 42% H2/Ar at 350°C (0.5°C/min heating and fast cooling), followed by heating 1°C/min in O2 to 500°C…………………………..79
Figure 4.11 Conductivity measurements of La1-xSrxFe1-yCoyO3+δ, SrFe0.7Mn0.3O3+δ, and La0.2Sr0.8MnO3+δ………………………………………………...….83
x
Page Figure 4.12 Logarithm of the product of conductivity and temperature versus inverse
temperature of La1-xSrxFe1-yCoyO3+δ, SrFe0.7Mn0.3O3+δ, and La0.2Sr0.8MnO3+δ to find electrical activation energies………………....86
Figure 4.13 Diagrams of half (left) and full (right) test cells for EIS measurements………………………………………………...…………91
Figure 4.14 Circuit diagram of a Randles cell and Nyquist plot of its response.........94
Figure 4.15 Nyquist plots of La0.3Sr0.7Fe0.5Co0.5O3+δ half cell at various temperatures.............................................................................................95
Figure 4.16 Arrhenius plots for La0.2Sr0.8MnO3+δ, SrFe0.7Mn0.3O3+δ, and La0.3Sr0.7Fe0.5Co0.5O3+δ half cells and La0.3Sr0.7Fe0.5Co0.5O3+δ full cell…95
Figure 4.17 Arrhenius plots for La0.2Sr0.8MnO3+δ (LSM* Stillwell data)…………...96
Figure 4.18 Arrhenius plots for SrFe0.7Mn0.3O3+δ (SFM* Stillwell data)…………...97
Figure 4.19 Dilatometry measurements of La1-xSrxFe1-yCoyO3+δ, SrFe0.7Mn0.3O3+δ, La0.2Sr0.8MnO3+δ, and reference La0.8Sr0.2MnO3+δ……………………100
Figure 4.20 Dilatometry measurement of La0.4Sr0.6Fe0.5Co0.5O3+δ during oxygenation from reduced state (δ = -0.19) to better determine chemical expansion……………………………………………………………...102
CHAPTER 1: INTRODUCTION
1.1 Air Separation Methods, Past to Present
Methods to separate and enrich oxygen from the air were first developed by
both Carl Linde in Germany and William Hampson in England independently in 1895
by a method known as cryogenic distillation [1][2]. At a basic level, this method
primarily relies on the difference in boiling points of the primary components of air,
which are oxygen (-183.0°C), nitrogen (-195.8°C), and argon (-189.3°C). Thus, by
slowly cooling from each boiling point to the next, each component can be siphoned
off in liquid form and distilled one at a time (Figure 1.1). Soon after, primarily due to
the invention of oxy-acetylene welding and new methods for smelting steel from iron
2
ore, the demand for large quantities of high-purity oxygen greatly increased. By the
end of World War II, new methods and technologies were put in place that
significantly improved upon Linde’s and Hampson’s original methods and made
oxygen separation and purification commercially viable. Improvements to the original
Linde-Hampson machine still continue today [3][4] and cryogenic distillation has
remained the technology of choice to meet the world’s demand for the production of
large volumes of high-purity oxygen, which in 2001 exceeded 100 Mtons/yr and
continues to be one of the top-ten traded elemental commodities worldwide today
[3][5]. In the past twenty-five years, pressure swing adsorption (PSA) and vacuum-
pressure swing adsorption (VPSA) have also become cost-effective methods to
produce oxygen of smaller volumes with lower purities (90 - 95%) [6]. These,
typically smaller systems, function at high pressure from low to room temperatures by
using a two high-pressure chamber system, each with nitrogen and oxygen sorbent
pressure-sensitive materials. Materials for oxygen and nitrogen sorbents have typically
been various zeolite compounds and carbon molecular sieves, respectively [7];
however, there has been recent work with porous, metal-organic frameworks that may
have the potential to replace zeolite materials as oxygen sorbents in these systems [8].
The need for high-purity oxygen for various industrial production processes (e.g.,
steel, glass, plastics, etc.), medical applications, welding methods, and a rocket fuel
component [9] will certainly insure a strong continued future demand for high-purity
oxygen and the need for the development of new materials and improved methods for
air separation and oxygen storage.
3
1.2 Elevated-Temperature Ceramic Materials for Air Separation
and Oxygen Storage
Recently, elevated-temperature ceramic materials have been increasingly
researched by the Department of Energy (DOE), the Linde Group, Air Products and
Chemicals, Praxair, and many small start-up companies for air separation and oxygen
storage methods. Compared to cryogenic distillation, these materials have great
potential to both significantly lower capital and operation costs (projected 30%
reduction), while also operating with considerably less power consumption [10].
Ceramic materials for elevated-temperature air separation come in two primary
varieties: materials with reversible oxygen storage and release capacities (OSC, OSC
materials) and oxygen-ion conductors.
OSC materials can reversibly and selectively absorb, store, and release oxygen.
The mechanism for oxygen sorption in these materials is, most commonly, dependent
on the creation of oxygen ion vacancies or interstitial sites at high temperatures, due to
changes in stoichiometry or intrinsic defects such as Schottky or Frenkel defects.
These changes in oxygen content are usually accommodated by the material’s crystal
structure, thus no structural phase transitions occur and the change in oxygen content
is easily reversible. The rate of oxygen ion diffusion for OSC materials can be
approximated by the Arrhenius equation (where D0 is diffusion rate at
infinite temperature, EA is activation energy, R is the gas constant, and T is
temperature). For application, ideal OSC materials must have large values of OSC
4
(typically measured in moles of oxygen per weight of material) and their
absorption/desorption of oxygen must occur over a narrow temperature range at near
atmospheric conditions. Additional properties, such as oxygen partial-pressure
dependence of absorption/desorption, exothermic absorption and endothermic
reduction, and stability/recoverability in strong reducing conditions (e.g., CO and H2
atmospheres at high temperatures), are also desired and being researched for various
applications (see next section). A common method for air separation, which relies on
temperature-dependent oxygen absorption/desorption, is thermal swing absorption
(TSA). In this method, multiple beds of sorbent cycle in between two chambers that
are at different temperatures. This creates oxygen-rich and oxygen-deficient
atmospheres in each chamber (Figure 1.2). More recently, Lin et al. patented a method
in 2000 for perovskite materials, which combines TSA and PSA techniques in a
process named ceramic autothermal recovery (CAR) [11]. Again, multiple beds filled
with sorbent are cycled through two chambers with a temperature gradient; however,
in this method the chambers are also maintained at different oxygen partial-pressures.
Again, this creates two chambers that are oxygen rich and deficient. Sorbents designed
for CAR also have strong endothermic reduction and exothermic absorption; therefore,
the process operates autothermally, needing little or no heat added once operational.
5
Commercially, CeO2-ZrO2 compositions have been the recent, ceramic OSC
materials of choice for air separation, which function around 500°C and have OSCs of
~400 – 500 μmol-O/g in oxygen atmosphere [12] [13] or as high as 1500 μmol-O/g
with 20% H2 reversible reduction [14]. The OSC of these materials comes from the
ability of the CeO2 fluorite structure to accommodate a large number of oxygen ion
vacancies when doped and the ease of reducing the Ce4+ cation to Ce3+. Recent studies
with Ce1-xCrxO2 have further boosted the OSC of the fluorite structure as high as 2500
μmol-O/g in air and hydrogen atmospheres but require considerably higher reduction
temperatures (550 – 700°C) [15]. Currently, P63mc RBaCo4O7+δ (R = Y, Dy, Ho, Er,
Tm, Yb, and Lu) [16]–[18] and YBaCo4-xAlxO7+δ [19] materials have the best reported
OSC values at low temperatures, storage up to ~2700 μmol-O/g, and completely
desorb at ~400 – 425°C in O2. The ease of reversible phase transitions between the
hexagonal P63mc YBaCo4O7 and orthorhombic Pbc21 YBaCo4O8.1 (which is a mixture
of tetrahedrally and octahedrally coordinated cobalt) [20] is responsible for its oxygen
6
storage behavior. Transition between stable phases with large differences in oxygen
content, as seen here, is a new mechanism for OSC materials and has great potential
for storage and operation temperatures, as will be further discussed in Chapter 3 and 4.
Unlike OSC materials, which are a relatively new topic of study, oxygen ion
conductors have been studied over a hundred years. In 1899, Nernst reported O2- anion
conduction in ZrO2+9%Y2O3 (9YSZ) [21]. Oxygen ion conduction is directly related
to oxygen ion diffusion and can be approximated by the Arrhenius relation:
(where σ0 is a function of occupied ionic sites in the lattice); thus, bulk oxygen
ion conduction is mainly attributed by two material properties: the activation energy of
oxygen ion migration and the fraction of oxygen vacancies [22]. Typically, oxygen ion
conductors for air separation can be divided into two basic types: solid oxide
electrolytes, which have high O2- conductivity but are electrically insulating, and
mixed ionic electronic conductors (MIEC), which have both high electric and O2-
conductivity. If an oxygen ion conductor (of either type) is used to separate two
different partial-pressures of oxygen, a measurable potential difference arises, which is
governed by the Nernst potential:
(where Ɛ is electromotive
force, F is the Faraday constant, and PO2/ P’O2 is the ratio of partial-pressures of
oxygen). Assuming that lattice diffusion of oxygen determines the overall rate of O2-
permeation, the oxygen flux through such a membrane can be approximated by
σ
σ
σ σ
by Wagner’s derivation [23] (where L is the
thickness of the membrane). Thus, oxygen can be “pumped” by transporting O2- ions
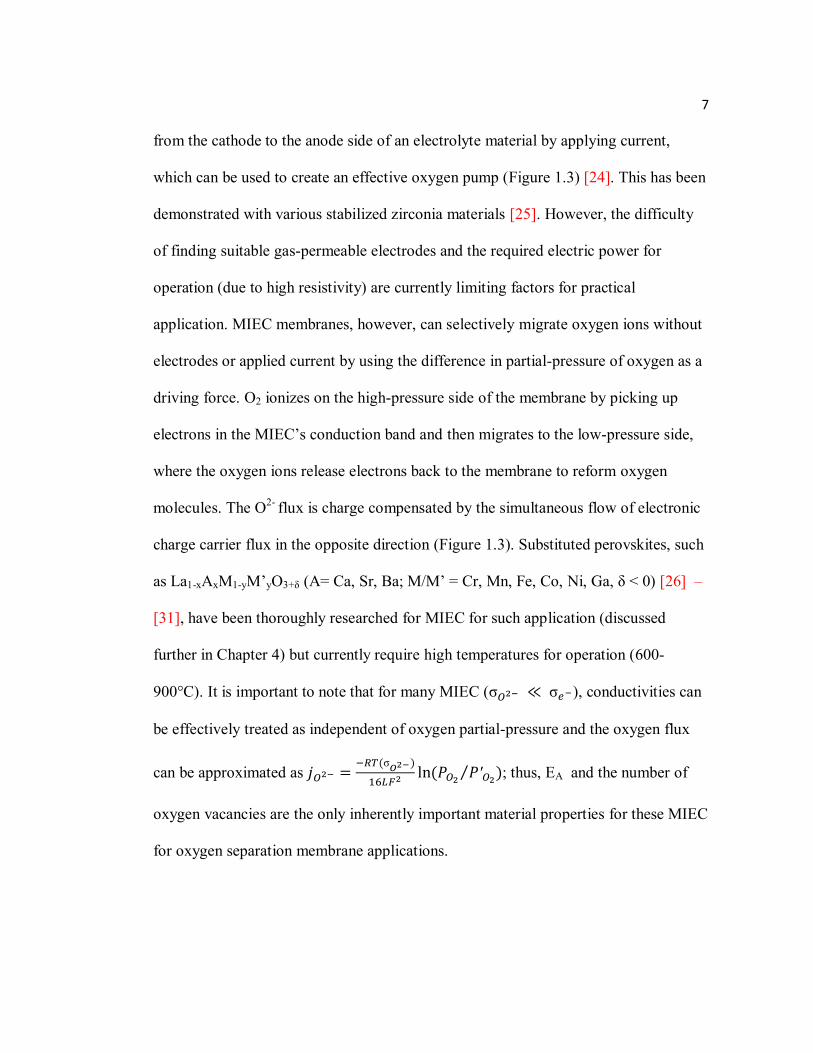
7
from the cathode to the anode side of an electrolyte material by applying current,
which can be used to create an effective oxygen pump (Figure 1.3) [24]. This has been
demonstrated with various stabilized zirconia materials [25]. However, the difficulty
of finding suitable gas-permeable electrodes and the required electric power for
operation (due to high resistivity) are currently limiting factors for practical
application. MIEC membranes, however, can selectively migrate oxygen ions without
electrodes or applied current by using the difference in partial-pressure of oxygen as a
driving force. O2 ionizes on the high-pressure side of the membrane by picking up
electrons in the MIEC’s conduction band and then migrates to the low-pressure side,
where the oxygen ions release electrons back to the membrane to reform oxygen
molecules. The O2- flux is charge compensated by the simultaneous flow of electronic
charge carrier flux in the opposite direction (Figure 1.3). Substituted perovskites, such
as La1-xAxM1-yM’yO3+δ (A= Ca, Sr, Ba; M/M’ = Cr, Mn, Fe, Co, Ni, Ga, δ < 0) [26] –
[31], have been thoroughly researched for MIEC for such application (discussed
further in Chapter 4) but currently require high temperatures for operation (600-
900°C). It is important to note that for many MIEC (σ σ ), conductivities can
be effectively treated as independent of oxygen partial-pressure and the oxygen flux
can be approximated as σ
; thus, EA and the number of
oxygen vacancies are the only inherently important material properties for these MIEC
for oxygen separation membrane applications.
8
1.3 Other Applications of Ceramic Oxygen Sorbents
and Mixed Electronic Ionic Conductors
1.3.1 Chemical Looping Combustion
There has been a growing concern about the increasing levels of CO2
emissions from fossil fuel combustion and the resulting effects on the earth’s climate.
A growing majority of the scientific community agrees that carbon emissions must be
greatly reduced in the near future; however, our strong dependence on fossil fuels and
their relatively large abundance makes replacing these systems exceedingly difficult.
Currently, the leading technology for “clean coal” energy production is to remove CO2
9
from flue gas of existing fossil fuel power plants [32]. Selectively capturing CO2 from
the complex mixture of high-temperature flue gases requires large amounts of energy,
which would significantly reduce the net efficiency of existing systems. One solution
to this problem is to combust with high partial-pressures of oxygen instead of with
ambient air, which has the added benefit of significantly reducing NOx and SOx
emissions [33][34]. The resulting combustion products are primarily H2O and CO2,
which are much easier to separate and store. One of the major hurdles for such “oxy-
fuel” combustion, as cited by a recent DOE report [35], is to develop improved and
cost-effective air separation units. Ceramic OSC and MIEC are uniquely qualified to
fulfill this role by operating with reactor waste heat or by direct exposure to the
reaction chamber. Methods by using waste heat include redirection of thermal energy
to OSC materials to perform a TSA process, as described in the previous section.
Chemical looping combustion (CLC) is another solution to add oxygen directly to the
combustion process (oxygen sorbents are typically called oxygen carriers for this
application) [36][37]. The CLC process is a two-step cycling procedure, where first,
reduction of the oxygen carrier takes place at the reactor to oxide fossil fuels and then,
the reduced oxygen carrier is removed from the reactor for reoxygenation (Figure 1.4).
Thus, materials for CLC must not only have large values of OSC but also must have
stability in highly reducing conditions at high temperatures, which are recoverable in
air to stoichiometric oxygen content. Previous materials studied for oxygen carriers
have been perovskite La1-xSrxFe1-yCoyO3-δ (where x ≥ 0.5 and 0 ≥ y ≥ 1) and various
metal oxides (e.g., Fe and Mn) [38]–[40].
10
1.3.2 Solid Oxide Fuel Cells
The first functional solid oxide fuel cells (SOFC) were demonstrated with
current densities of ~1 mA/cm2 at 1000°C by Baur and Preis in 1937, which were
largely based on the Nernst glower from the early 1900’s [41]. In the 1960’s,
significant progress toward commercial production was done by Westinghouse in the
U.S and by Brown, Boveri, and Cie in Germany, which achieved current densities up
to 100 mA/cm2 [42]. SOFC are multilayer, ceramic electrochemical conversion
devices that generate electricity using gaseous fuels and an oxidant at high
temperatures (600 – 1000°C). SOFC consist of an interconnect and three basic layered
components: a cathode, an electrolyte, and an anode (Figure 1.5). Oxygen is reduced
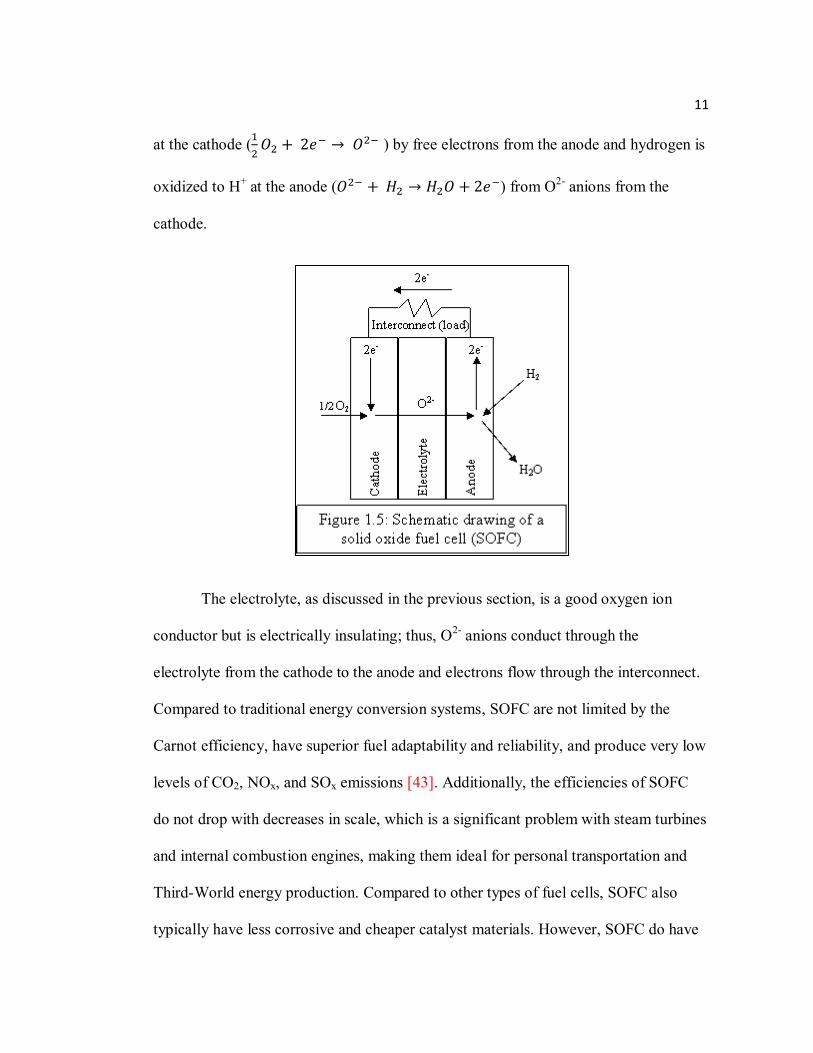
11
at the cathode ( ) by free electrons from the anode and hydrogen is
oxidized to H+ at the anode ( ) from O2- anions from the
cathode.
The electrolyte, as discussed in the previous section, is a good oxygen ion
conductor but is electrically insulating; thus, O2- anions conduct through the
electrolyte from the cathode to the anode and electrons flow through the interconnect.
Compared to traditional energy conversion systems, SOFC are not limited by the
Carnot efficiency, have superior fuel adaptability and reliability, and produce very low
levels of CO2, NOx, and SOx emissions [43]. Additionally, the efficiencies of SOFC
do not drop with decreases in scale, which is a significant problem with steam turbines
and internal combustion engines, making them ideal for personal transportation and
Third-World energy production. Compared to other types of fuel cells, SOFC also
typically have less corrosive and cheaper catalyst materials. However, SOFC do have
12
several major drawbacks, which have limited their development for wide-scale
application: high operation temperature, electrode over-potential, chemical reaction
between layers, thermal expansion mismatch of components, and ideal SOFC
materials are typically brittle in nature.
MIEC are ideal materials for cathodes in SOFC due to their high electronic and
oxygen ion conductivity. However, there are several other required properties for an
ideal cathode: chemical stability with the electrolyte, the interconnect, operation
environments, and manufacturing process; similar thermal expansion coefficients with
other cell materials; low-as-possible operation temperature; and reasonably high
porosity, as not to limit the triple phase boundary reaction. Again, as with separation
membranes, substituted perovskites, such as La1-xAxM1-yM’y (A= Ca, Sr, Ba; M/M’ =
Cr, Mn, Fe, Co, Ga) [44] – [54], have been thoroughly researched for cathode
materials (discussed further in Chapter 4) and, with clever design, have achieved
power densities above 1 W/cm2 at 600°C.
1.3.3 Oxygen Sensors
Electrolyte gas separation membranes, as described in the previous section, can
also be used as “reverse oxygen pumps” to generate a small electric difference in the
presence of different partial-pressures of oxygen, which is again governed by the
relation
. Commercial oxygen sensors of this type have
frequently been various types of stabilized zirconia and zeolites and are still actively
13
researched as a component for oxygen sensors [55]. Transition metal–oxides, such as
perovskite and hexagonal ABO3+δ, that are prone to oxygen non-stoichiometry under
different oxygen partial-pressures are also potential materials for oxygen sensing
applications. This is because changes in oxygen content of these materials typically
also results in noticeable changes in electric conductivity (due to changes in structure,
d-shell occupancy and spin state, exchange interaction, etc.). Though not yet
commercially practical, proof of principle of this method has been demonstrated with
perovskite LaMnO3-δ with various levels Sr hole doping and SrFeO3-δ at temperatures
above 500°C [56] – [59].
1.3.4 Waste Heat Air Separation for High-Temperature Systems
Currently, roughly over 80% of commercially produced oxygen is used in
high-temperature industrial productions process [9]: smelting steel from iron ore, glass
production, creating ethylene oxide from ethylene for ethylene glycol production, etc.
Furthermore, potential uses of ceramic OSC and MIEC materials currently being
researched operate at or have components that operate at elevated temperatures. In
addition to the previous applications discussed here, OSC materials are also being
researched for components to improve automotive exhaust catalysts [60], solar water
splitting [61], non-solid oxide hydrogen fuel cells [62], various non-aerobic oxidation
processes [63], and the production of syngas (H2, CO) by partial oxidation of methane
[64]. For any of these current and potential systems, the redirection of the large
14
amounts of waste heat generated from all these methods to ceramic OSC or MIEC
materials for onsite air separation would undoubtedly have potential net energy,
economic, and waste advantages versus air separation by high-pressure (zeolites or
metal-organic frameworks) or low-temperature (cryogenic distillation) methods.
15
CHAPTER 2: EXPERIMENTAL METHODS
Synthesis methods were done by solid-state reaction (see Sections 3.2 and 4.2
for details). X-ray powder diffraction (XRD) measurements were made with a Rigaku
D/MAX powder diffractometer in the 2θ = 20-70° range with CuKα radiation. Room-
temperature neutron powder diffraction (NPD) data were collected both with time-of-
flight measurements, conducted at Argonne National Laboratory’s former Special
Environment Powder Diffractometer (SEPD) and General Purpose Powder
Diffractometer (GPPD) at the Intense Pulsed Neutron Source (IPNS), and with a
wavelength of 2.4395Å, carried out on the Echidna High-Resolution Powder
Diffractometer at the Bragg Institute. Structural refinements of diffraction data were
performed by the Rietveld method with GSAS/EXPGUI suite programs [65];
theoretical XRD patterns were generated with PowderCell v.2.4 and representational
drawings of crystal structures were made with the assistance of DRAWxtl v.5.1.
Thermogravimetric analysis (TGA) measurements were made with Cahn TG171 and
Cahn TherMax700 thermobalances. TGA reaction gases consisted of several different
mixtures of ultra-high-purity (99.999%) oxygen, hydrogen, and argon gasses and were
flowed at a rate of 100ccm using a MKS flow controller. TGA measurements were
done up to 1100°C at heating and cooling rates of 0.1 – 1.0°/min and were measured
16
with a 5 μg precision. TGA samples were approximately 1 g and were suspended in an
alumina crucible with a Pt, Au, or Mo wire (Au and Mo for hydrogen firings).
Response from the wire and crucible were subtracted from the raw data by conducting
empty runs with identical conditions. Dilatometry measurements were made with a
Linseis Differential Dilatometer L75 and samples were measured with a 1 μm
precision. Reaction gases consisted of ultra-high-purity (99.999%) oxygen and argon
and 21% oxygen balanced with argon. These gases were flowed at an approximate rate
of roughly 100ccm. Thermal behavior of the dilatometer’s alumina piston and sample
holder were subtracted from the raw data by conducting runs with a piece of alumina
that was close in length to sample lengths in identical temperature and atmosphere
profiles. DC susceptibility was measured on cooling in a 1 kOe magnetic field using a
Quantum Design Physical Property Measurement System 6000. Resistivity
measurements were made on a homemade apparatus by the four-point probe technique
with Pt electrodes embedded in dense bars of sample. This method provided superior
response at high temperature versus standard methods that make use of metallic paints
(e.g., Ag) due to reduced contact resistance and paint’s tendency to delaminate or melt
at higher temperatures. This apparatus was fitted into a tube furnace and heated up to
1100°C in different partial-pressures of oxygen. Electrochemical impedance
spectroscopy (EIS) measurements of half cells and full cells were conducted with a
Princeton Applied Research model 273 potentiostat/galvanostat and a Solartron model
1255 analyzer with a frequency range, AC current amplitude, and DC bias of 1 –
65535 Hz, 4 mA, and -4.1 mA, respectively. Section 4.5 contains further discussion on
17
EIS measurements of layered oxygen ion conductors and fabrication of test cells. EIS
measurements were supported by ZPlot and ZView software packages by Scribner
Associates.
18
CHAPTER 3: STUDY OF HEXAGONAL Dy1-xYxMnO3+δ
(-0.2 ≤ δ ≤ 0.4) MATERIALS FOR OSC APPLICATIONS
3.1 Introduction
Structural and physical properties of rare earth manganites have been
thoroughly studied over the past fifty years [66]. Figure 3.1 shows schematic drawings
of reported perovskite and hexagonal crystal structures and electronic occupation of
the 3d orbitals in their respective MnOn polyhedrons. The perovskite orthorhombic
Pnma structure is based on a three-dimensional network of corner-shared MnO6
octahedra. Distortion from the cubic structure, which can be explained by the low
value of the tolerance factor (
), is due to the difference in the (R-O)
and (Mn-O) bond lengths. Furthermore, Jahn-Teller distortion of the MnO6 octahedra,
which is caused by the two-fold degeneracy of the Mn3+ ion in a high-spin state of t3e1,
results in an elongated c-axis and three different (Mn-O) bond lengths [67]. These
distortions shift and rotate the octahedra along the ab plane and tilt and rotate the
octahedra about the c-axis, which results in considerably smaller than 180° Mn-O-Mn
bond angles that have large impact on the transport and magnetic properties of the
system [68][69]. The non-centrosymmetric P63cm hexagonal structure can be
described as close-packed layers of trigonal bipyramids of MnO5, which are centered
at Mn3+ sites and are separated by layers of R3+ ions. The MnO5 bipyramids are rotated
19
20
in the ab plane (planar bond angles Mn-O-Mn ≠ 180°) and tilted relative to the c-axis
due to the difference of the (R-O) and (Mn-O) bond lengths [70]. However, unlike in
the MnO6 octahedra, high-spin Mn3+ ions in the MnO5 bipyramids are not Jahn-Teller
active.
Recently, hexagonal manganites have been the subject of much investigation
due to their multiferroic properties. The rare coexistence of antiferromagnetic ordering
and ferroelectricity make these materials of particular interest. Long-range magnetic
ordering occurs in these materials for both the Mn3+ and R3+ ions at ~70 – 130 K (TMn)
and ~ 5 – 10 K (TR), respectively. Spin-spin interactions of the Mn3+ ions in the close-
packed basal planes are geometrically frustrated and form an antiferromagnetic
triangular structure in the (001) corner-sharing plane at TMn, where each spin is rotated
120° from its nearest neighbors in a P63’c’m symmetry. At lower temperatures, the
R3+ ions magnetically order along the c axis, which is also accompanied by a spin
rotation of the Mn3+ ions to a magnetic symmetry of P63cm. The type of long-range
ordering at TR is dependent on the R3+ ion and may be antiferromagnetic (Ho, Yb, and
Tm) or ferromagnetic (Er and Dy). Additionally, another spin rotation of the Mn3+ ion
occurs between these two temperatures (~40 – 60 K), which results in the magnetic
symmetry P63’cm’ (TSR). At elevated temperatures, RMnO3 remains ferroelectric with
a high Curie temperature (Tc ~ 300 – 650°C) [70]–[77]. It should also be noted that
additional, reversible transitions have been previously observed in situ among various
hexagonal RMnO3 phases at elevated temperatures in air. These studies reported, for
YMnO3, a displacement of the MnO5 bipyramids, which is associated with the Tc
21
ferroelectric transition and a transition to P63/mmc at ~650°C and ~950°C,
respectively [74][75]. Low-temperature magnetic studies of hexagonal DyMnO3 have
been reported for single-crystal and polycrystalline samples with TMn ~70 – 80 K,
TSR~57 K and TDy ~ 3 – 8 K [78]–[81]; however, elevated temperature studies of
DyMnO3 are currently limited to synthesis techniques.
Conventionally, the formation of the perovskite phase versus the hexagonal
phase is governed primarily by the size of the rare earth ion in RMnO3 (with constant
Mn3+size). During high-temperature solid-state synthesis in air, the perovskite phase
forms easily with larger rare earth elements (e.g., La, Pr, Nd, Sm, Gd, Tb, and Dy),
while smaller size rare earths (e.g., Ho, Er, Tm, Yb, Lu, and Y) favor the hexagonal
phase. It has been observed that the perovskite structure is stable for a tolerance factor
(calculated at room temperature using Shannon’s values [82]) in the range of 0.855 ≤
≤1 [83], whereas the hexagonal phase is stable for t < 0.855 [84]. Recently, Zhou et al
[71] suggested that the relative large difference in density between the perovskite and
hexagonal phases may have a larger impact on the formation of the perovskite phase
versus the hexagonal phase near the lower limit of the tolerance factor. DyMnO3 and
YMnO3 have tolerance factors of 0.857 and 0.854, respectively, and will tend to form
the perovskite and hexagonal phases, respectively, under normal solid-state synthesis
in air. Thus, the average (R-O) bond length of substituted samples causes Dy1-
xYxMnO3 to be on the cusp of this phase transition and, as will be further discussed,
results in a mixed state under synthesis in air.
22
Finally, hydrothermal synthesis in 3 kbar at 500°C has been shown to favor the
oxidation state of Mn4+, which results in the formation of Fd3m Dy2Mn2O7 pyrochlore
[85] (Figure 3.1, with Dy in 16d, Mn in 16c, O1 in 48f and O2 in 8b). Mn4+ octahedral
coordination is not a Jahn-Teller ion; therefore, the MnO6 octahedra in the pyrochlore
phase are not subject to the same distortions as in the perovskite phase. Though
transition to this state from the P63cm phase was not observed in our work here, it is a
reasonable assumption that such a transition would occur under high-pressure
conditions similar to this previous study. A transition of this nature, from Mn3+ to
Mn4+, would be ideal for achieving high OSC values.
Chapter 3 describes the synthesis of the P63cm hexagonal Dy1-xYxMnO3+δ in
Ar from its competing Pnma perovskite phase, which was guided by our previous
work on the temperature and oxygen vacancy dependence of the tolerance factor of
manganites. Hexagonal manganites have been largely believed to remain
stoichiometric in oxygen content at elevated temperatures; however, our
thermogravimetric measurements of oxygen-annealed hexagonal samples indicated
unusually large oxygen absorption over a narrow temperature range ~200 – 300°C,
which return to stoichiometric behavior above 275 – 375°C in O2 atmosphere. The
structures of these phases were studied with NPD and XRD. In addition to temperature
dependence, we have also found the oxygen content of Dy1-xYxMnO3+δ to be sensitive
to changes in partial-pressures of oxygen in these temperature ranges. Furthermore,
the hexagonal phase of this system was found to have considerable stability at high
temperature in partial-pressures of oxygen and to be recoverable from negative values
23
of δ from hydrogen reduction at 400°C. The chemical expansion properties resulting
from these large changes in oxygen are also reported, as well as the thermal expansion
coefficient of stable oxygen content regions. The transport and magnetic properties of
these phases were also studied. Finally, the observed properties of these materials are
discussed in context for possible applications as OSC materials and oxygen sensors.
3.2 Synthesis and Stability
Polycrystalline samples of Dy1-xYxMnO3+δ were synthesized by solid-state
reaction with appropriate amounts of Dy2O3, Y2O3, and MnO2 (all with >99.99%
purity). For all samples, reactants were thoroughly mixed in an agate mortar, and fired
in air in the temperature range of 800 – 1300°C with intermediate grindings followed
by pressing samples into high-density pellets at approximately 10 kbar. All steps of
the synthesis were monitored with XRD measurements and compared to previous
diffraction measurements in the literature of the hexagonal P63cm and perovskite
Pnma phases of DyMnO3 and YMnO3 (Figure 3.2) [69][86] –[88]. Dy1-xYxMnO3+δ
samples which formed the perovskite or a mixed phase in air instead of the single-
phase hexagonal structure (x = 0, 0.1 0.3, 0.5, 0.7) were then fired under ultra-high-
purity argon (99.999%) at 1300 and 1400°C. Dy1-xYxMn O3+δ samples (x = 0 and 0.1)
were then subsequently fired under ultra-high-purity argon with a hydroxyl purifier
(oxygen partial-pressures of 5 – 10 ppm) at 1400°C. All samples achieved the
hexagonal P63cm structure after these conditions.
24
Considerable effort was devoted to synthesizing Dy-rich, homogenous
hexagonal samples. The hexagonal DyMnO3 phase has been previously achieved by
epitaxially stabilized crystal growth with thin-films [80], thermal decomposition with
polynuclear coordination compound precursors [89], quenching methods from 1600°C
in air [90] or 1250°C in argon for three days with sol-gel methods [86]. Our work
confirmed that synthesis in argon at high temperature tends to favor the formation of
the hexagonal phase and synthesis in oxygen tends to favor the perovskite phase [91].
Figure 3.3 is a mapping of the phases that were measured with XRD after several
synthesis steps, which clearly shows that increasing reducing conditions are needed to
25
form the hexagonal phase as the average ionic radius of the R site increases. The
oxygen content dependence of the tolerance factor, which we have previously studied
for substituted SrMnO3 [92], is most likely responsible for this behavior. The
formation of oxygen vacancies in RMnO3+δ (δ < 0) causes a change in oxidation state
in some of the Mn3+ cations to Mn2+, resulting in a net Mn(3+2δ)+ cation, which
increases the (Mn-O) bond length with decreasing δ. TGA measurements in oxygen
show the reduced oxygen contents after synthesis of single-phase hexagonal samples
in argon. The resulting larger (Mn-O) bond lengths of these samples decrease their
tolerance factor below the lower limit of 0.855 and resulted in the perovskite phase
undergoing a phase transition to the hexagonal phase. Using Shannon’s room-
temperature values [82], the minimum necessary value of δ ranges from -0.023 – -
0.0027 to have t ≤ 0.855. We have observed, however, that samples with the
corresponding δ values did not transform completely to the hexagonal phase
(Table 3.1). Our previous in situ measurements with Ca and La substituted
26
SrMnO3[92][93] have shown that both (Ca,Sr,La-O) and (Mn-O) bond lengths
increase with temperature in a manner which increases the value of the tolerance
factor. Therefore, the transition from the perovskite phase to the hexagonal phase will
most likely occur in various oxygen pressures at δ, which is a function of temperature,
that occurs for DyMnO3+δ, for example, in ~10ppm O2 at 1400°C as we observed here
or in air at 1600°C as previously reported [90]. Further high-temperature in situ
structural measurements would be needed to completely substantiate this assertion;
however, the combination of our previous in situ measurements with similar
manganites and our XRD and NPD measurements of various oxygen contents after
progressive increased reducing conditions strongly support this conclusion. This
transition may also be enhanced by the difficultly of maintaining the twelvefold
coordination of R required for the perovskite phase in a high-temperature, oxygen
deficient atmosphere; thus, an eightfold coordination with hexagonal symmetry
results.
In any case, the reducing conditions needed for production of bulk
polycrystalline samples of hexagonal DyMnO3 and Dy0.1Y0.9MnO3 by standard firing
methods were very near to decomposition to simple oxides and many attempts were
27
needed to find the most favorable temperature and length of the firings. Increased
substitution of Y in DyMnO3 considerably eased the necessary reducing conditions to
synthesize the hexagonal phase.
The stability of hexagonal Dy1-xYxMnO3+δ compounds was also tested by
firing samples at high temperatures, 1100 – 1400°C, in oxygen. As reducing
conditions favor the hexagonal phase, atmospheres that allow samples to remain near
stoichiometric in oxygen content (or yield excess oxygen content δ > 0) at high
temperature will promote the perovskite over the hexagonal phase, due to the smaller
size of the Mn(3+2δ)+ cation in oxygen versus argon. Dy-rich samples (x = 0, 0.1) began
slight decomposition back to the perovskite phase at 1100°C and completely
transformed back to the perovskite phase at 1400°C. The remaining samples (x = 0.7,
0.5, 0.3, 0.1, 0) remained in the hexagonal structure with no signs of decomposition
back to the perovskite phase up to 1400°C, which suggests these materials may form
the hexagonal phase at high temperatures in air after a long duration in these
conditions (>3 days). These results are in agreement with the presented tolerance
factor arguments and may also explain why small rare earth manganites (R = Y, Ho,
Er, Tm, Yb, and Lu) have been observed to transition to the perovskite phase under
high-pressure oxygen [94][95], while smaller A-site cations (R = Sc and In) will not
transform to the perovskite phase under similar conditions [96].
Finally, many attempts were made to synthesize the hexagonal P63cm phase
with substitutions on the B-site for DyMn1-yMyO3+δ with M = Cr, Fe, Co, Ni and Al
(0.16 ≤ y ≤ 0.5); however, none were able to form single-phase hexagonal from the
28
perovskite phase with reducing conditions. The perovskite structure is stable to lower
values of the t-factor for these transition metals when compared to RMnO3, which is
most likely due to the absence of Jahn-Teller distortions in these non-degenerate
cations. Doping hexagonal YMnO3 with Cr, Fe, Co, and Ni under synthesis in air
causes a transition to the perovskite phase at approximately 20 – 30% substitution
levels [97] – [100]. These systems with higher levels of doping can however be
transitioned back to the hexagonal phase with reducing conditions. Furthermore,
hexagonal YFeO3 (synthesized by sol-gel methods with metal nitrate precursors and
careful pH control with citric acid) has been reported to transition back to the
perovskite phase at ~930°C in air [101], which is very similar in behavior as we
observed with DyMnO3+δ. We had particularly hoped that similar reducing conditions
for M = Co, which reduces more readily when compared to the Mn cation (M3+ to
M2+), would sufficiently increase the (B-O) bond lengths to form the hexagonal
DyMO3, but only perovskite and impurity phases were obtained. Low substitution was
also recently reported in single phase for hexagonal P63cm in YMn0.9M0.1O3 (M = Al,
Ru, and Zn) [102] and, subsequently, YMn0.9Re0.1O3+δ and YMn0.9Ru0.1O3+δ were
synthesized by similar methods as YMnO3+δ; however, we found these samples to
have unfavorable OSC and oxygenation/reduction behavior when compared to pure
YMnO3+δ. The 2+, 3+, and 4+ oxidation states easily available to the Mn cation may
make it ideal for the desired behaviors for synthesis and oxygen storage applications
and any substitution to the B-site may not be fruitful for enhancing OSC values.
29
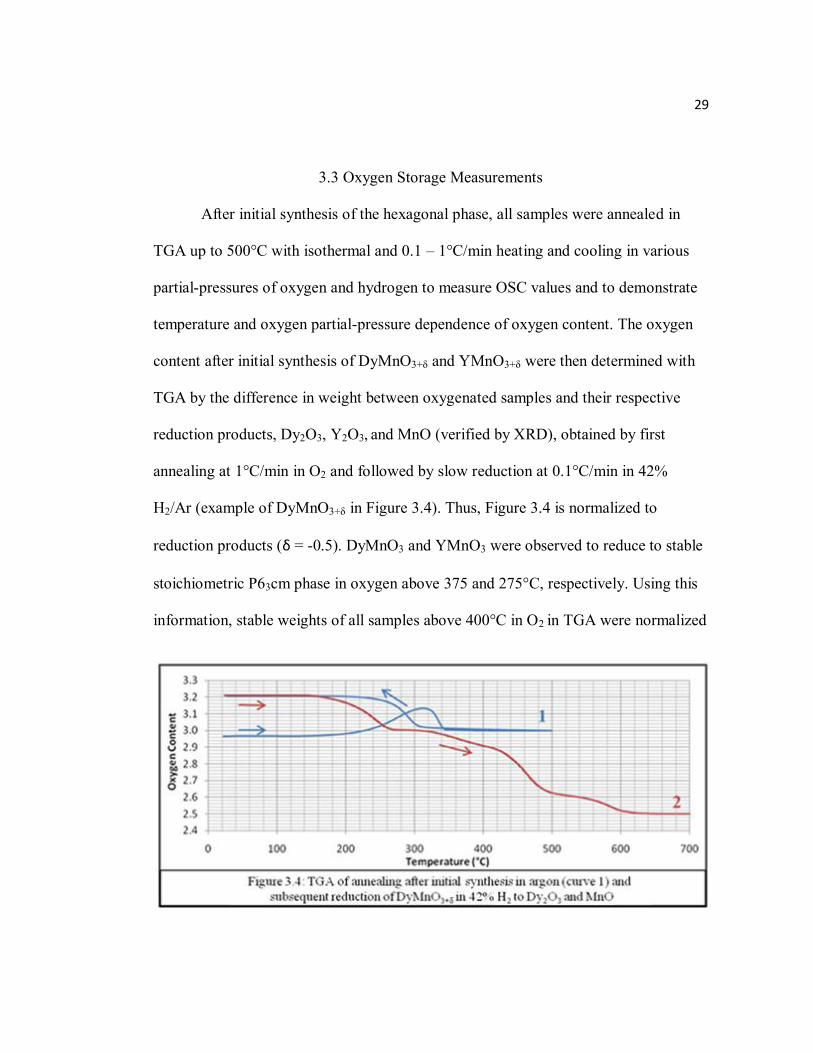
3.3 Oxygen Storage Measurements
After initial synthesis of the hexagonal phase, all samples were annealed in
TGA up to 500°C with isothermal and 0.1 – 1°C/min heating and cooling in various
partial-pressures of oxygen and hydrogen to measure OSC values and to demonstrate
temperature and oxygen partial-pressure dependence of oxygen content. The oxygen
content after initial synthesis of DyMnO3+δ and YMnO3+δ were then determined with
TGA by the difference in weight between oxygenated samples and their respective
reduction products, Dy2O3, Y2O3, and MnO (verified by XRD), obtained by first
annealing at 1°C/min in O2 and followed by slow reduction at 0.1°C/min in 42%
H2/Ar (example of DyMnO3+δ in Figure 3.4). Thus, Figure 3.4 is normalized to
reduction products (δ = -0.5). DyMnO3 and YMnO3 were observed to reduce to stable
stoichiometric P63cm phase in oxygen above 375 and 275°C, respectively. Using this
information, stable weights of all samples above 400°C in O2 in TGA were normalized
30
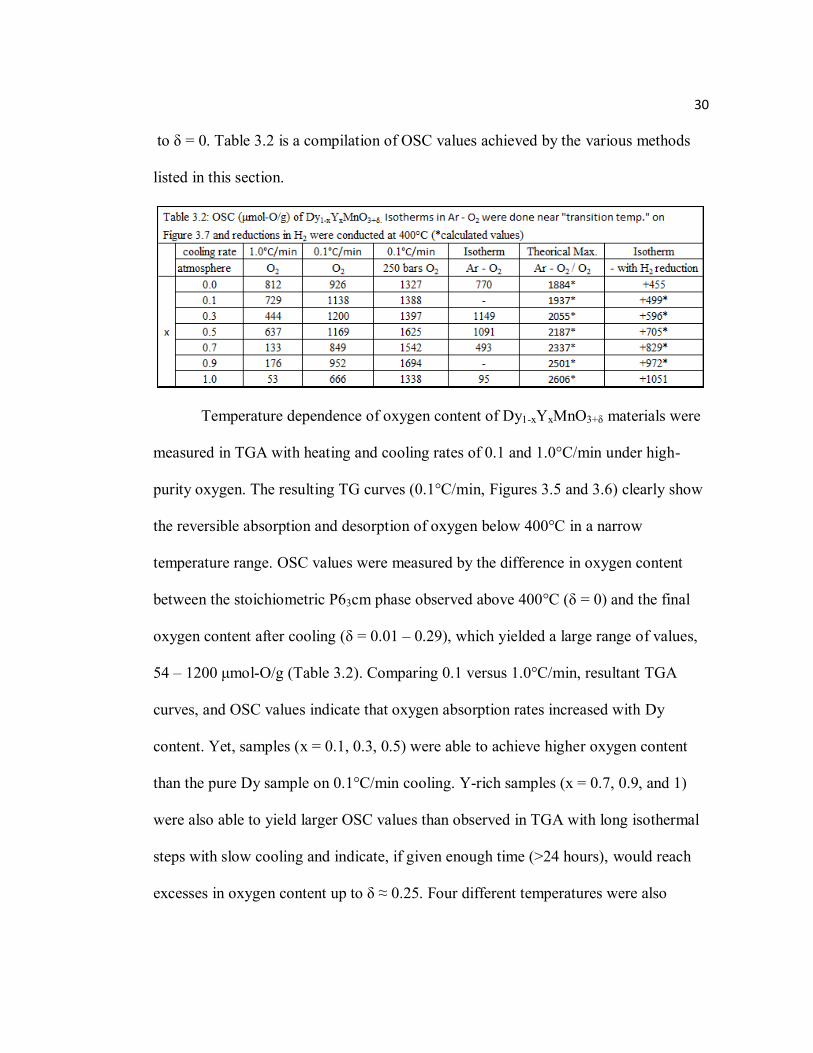
to δ = 0. Table 3.2 is a compilation of OSC values achieved by the various methods
listed in this section.
Temperature dependence of oxygen content of Dy1-xYxMnO3+δ materials were
measured in TGA with heating and cooling rates of 0.1 and 1.0°C/min under high-
purity oxygen. The resulting TG curves (0.1°C/min, Figures 3.5 and 3.6) clearly show
the reversible absorption and desorption of oxygen below 400°C in a narrow
temperature range. OSC values were measured by the difference in oxygen content
between the stoichiometric P63cm phase observed above 400°C (δ = 0) and the final
oxygen content after cooling (δ = 0.01 – 0.29), which yielded a large range of values,
54 – 1200 μmol-O/g (Table 3.2). Comparing 0.1 versus 1.0°C/min, resultant TGA
curves, and OSC values indicate that oxygen absorption rates increased with Dy
content. Yet, samples (x = 0.1, 0.3, 0.5) were able to achieve higher oxygen content
than the pure Dy sample on 0.1°C/min cooling. Y-rich samples (x = 0.7, 0.9, and 1)
were also able to yield larger OSC values than observed in TGA with long isothermal
steps with slow cooling and indicate, if given enough time (>24 hours), would reach
excesses in oxygen content up to δ ≈ 0.25. Four different temperatures were also
31
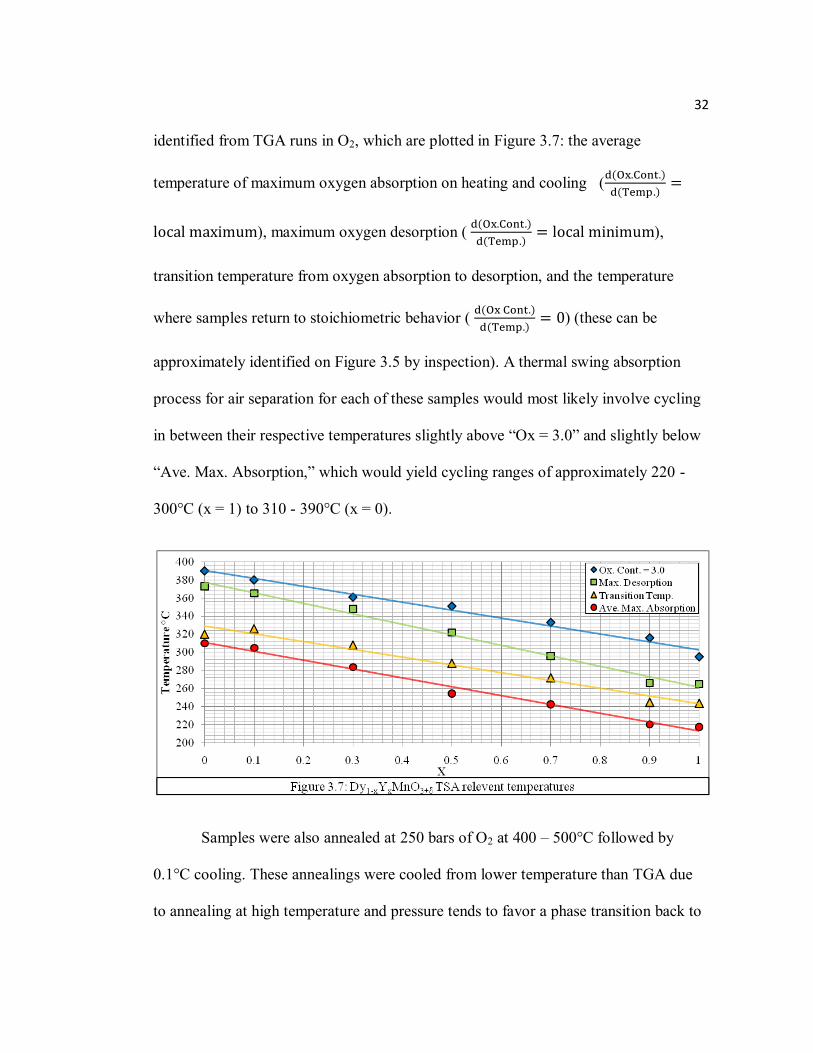
32
identified from TGA runs in O2, which are plotted in Figure 3.7: the average
temperature of maximum oxygen absorption on heating and cooling (
), maximum oxygen desorption (
),
transition temperature from oxygen absorption to desorption, and the temperature
where samples return to stoichiometric behavior (
) (these can be
approximately identified on Figure 3.5 by inspection). A thermal swing absorption
process for air separation for each of these samples would most likely involve cycling
in between their respective temperatures slightly above “Ox = 3.0” and slightly below
“Ave. Max. Absorption,” which would yield cycling ranges of approximately 220 -
300°C (x = 1) to 310 - 390°C (x = 0).
Samples were also annealed at 250 bars of O2 at 400 – 500°C followed by
0.1°C cooling. These annealings were cooled from lower temperature than TGA due
to annealing at high temperature and pressure tends to favor a phase transition back to
33
the perovskite phase [94][95] or to the R2Mn2O7 pyrochlore phase [85]. The oxygen
content of these samples after annealing was determined in TGA by the difference in
weight between their starting weight and their weight at 375°C (1°C/min heating) in
21% O2 normalized to δ = 0 (Figure 3.8). All samples showed significant increase in
OSC (particularly with samples rich in Y content) under high pressure versus identical
cooling in 1 bar of O2 (Table 3.2). Figure 3.8 also shows increased stability of oxygen
content on reduction at ~300°C for all samples, which suggests the existence of a
stable phase at Dy1-xYxMn3+0.5Mn4+
0.5O3.25 and, possibly, the presence of another
stable phase at or above an oxygen content of 3.35. Though these samples show
increased oxygen content from atmospheric pressure oxygenations, the Mn3+ cation is
still not completely oxidized to the Mn4+ state, which would be ideal for maximum
OSC values. Table 3.2 also includes these theoretical values of OSC for a reversible
Mn3+ – Mn4+ (δ = 0 – δ = 0.5) transition. Higher temperature attempts were also made
to oxygenate samples (x = 0.5, 0.7, and 0.9) at 88 bars of O2 at 890°C (with a 12-hour
34
hold followed 10°C/min cooling), but these annealings yielded similar oxygen
contents and Hex2/Hex3 mixed phases as high pressure runs at 400 – 500°C at
comparable pressures.
Oxygen partial-pressure dependence of oxygen content of Dy1-xYxMnO3+δ and
absorption/desorption reversibility were demonstrated with TGA measurements at
isotherm in cycling O2 and Ar atmospheres every ~12 hours (Figure 3.9). Samples
were held at temperatures near their respective “transition temperatures” defined from
Figure 3.7 (for x = 0, 0.3, 0.5, 0.7, and 1; T = 330, 300, 280, 250, and 230°C,
respectively) and yielded OSC values of 95 – 1149 μmol-O/g (Table 3.2). Besides
DyMnO3+δ, which clearly comes to equilibrium in O2, these OSC values are
comparisons of absorption of 12 hours. Given more time, these samples can achieve
higher oxygen content; for example, δ ≈ 0.28 was obtained for Dy.3Y.7MnO3+δ after
~60 hours. Isothermal measurements also show oxygen content to have asymptotic
behavior significantly lower than achieved upon cooling (most noticeably for x = 1
and 0). Further isothermal TGA measurements at various temperatures have also
shown this kinetically oxygen-content limiting behavior, which increases equilibration
time at lower temperatures (this limiting behavior accounts for the significant
differences in absorption rates of Figures 3.5 and 3.9). Therefore, the OSC of samples
(x = 0 and 1) would probably improve at lower isothermal temperatures and the
desorption rate of x = 0.7 would most likely improve at slightly higher temperatures.
35
The nature of these transitions from the P63cm phase (δ = 0) to the Hex2 phase
(δ = 0.25) and from the Hex2 phase to the Hex3 phase (δ ≈ 0.40, see next section)
appears to easily equilibrate to intermediate oxygen content values. As a result, a
mixture of several phases will occur in various oxygen partial-pressures and
temperatures, where low temperatures, 150 – 200°C, favor the Hex3 phase;
intermediate temperatures, 230 – 330°C, favor the Hex2 phase; and high temperatures,
above ~275 – 375°C, favor the stoichiometric P63cm phase (these ranges are
dependent on oxygen partial-pressure and Dy/Y content). The slope of oxygen content
versus time during the P63cm – Hex2 phase transition at constant temperature (as well
as on cooling in Figure 3.5) decreases with increased Y content, which again indicates
slower absorption rates of Y-rich samples. Direct comparisons of these absorption
rates are, however, complicated by slower oxygen ion kinetics at lower temperatures,
which can be approximated by . The lower temperatures at which the
Hex2 – P63cm phase transition occurs for Y-rich samples prevents temperature-
independent absorption comparisons; thus, the differences in absorption observed in
36
Figure 3.9 are due to both differences in activation energy and temperature. This
increased rate of transition from the P63cm to the Hex2 phase may also be due to
increased distortion to the P63cm structure caused by larger average R-site anions. On
the other hand, the transition from the Hex2 to Hex3 phase (δ ≥ ~0.25) appears to favor
Y-doped DyMnO3.25 samples (x = 0.1, 0.3, 0.5) over pure DyMnO3.25, as seen on
cooling in Figure 3.5.
Hydrogen reductions in TGA for DyMnO3+δ and YMnO3+δ, which were
initially done to determine oxygen content, showed to have increased stability on
reduction at δ = -0.12 and -0.20, respectively (Figure 3.4). To test for recoverability of
the P63cm phase of DyMnO3+δ and YMnO3+δ, materials were heated to and held at
400°C in 42%H2/Ar in TGA until these respective values of δ were reached. These
samples were then cooled in Ar to 330 and 230°C, respectively, and held at these
temperatures under O2. Samples quickly returned to stoichiometric oxygen content (>1
hour) and continued to absorb oxygen, as seen during oxygen cycles in Figure 3.9.
XRD measurements after this process confirmed that samples did not decompose to
simple oxides. Thus, the addition of cycling to 400°C in hydrogen to either thermal or
oxygen partial-pressure cycling would yield an additional ~450 – 1050 μmol-O/g (for
x = 0 – 1) and would place these materials up to near-record levels of OSC, ranging
from 1150 – 2650 μmol-O/g (Table 3.2, where calculated values assume the stabilities
seen at δ = -0.12 to δ = -0.20 changes proportionally with x for intermediate samples).
While the values measured here do not surpass the best observed OSC in the
literature and the slow oxygen kinetics of Y-rich samples (x = 0.7, 0.9, 1) may be a
37
limiting factor for their potential use for OSC application, the Dy1-xYxMnO3+δ system
does have several key advantages for application over these other candidates. First and
foremost, the Dy1-xYxMnO3+δ system has the lowest reported reduction temperature,
being approximately 25 – 125°C lower than the record reduction temperature of
YBaCo4-xAlxO7+δ (with significant OSC values). On further comparison to YBaCo4-
xAlxO7+δ, which decomposes at 550 – 700°C, Dy1-xYxMnO3+δ has far superior stability,
remaining stable up to 1100 – 1400°C. Additionally, from a hazardous waste and cost
standpoint, mass production of manganese oxides is much preferable to that of cobalt
or chromium oxides. Finally, there is great potential for the Mn cation in hexagonal
RMnO3+δ to have large changes in oxidation state because, unlike the majority of OSC
materials, which depend on the creation of oxygen ion vacancies or interstitial sites at
high temperatures, the hexagonal Dy1-xYxMnO3+δ (as seen also with YBaCo4-xAlxO7+δ)
relies on reversible phase transitions between several structures containing transition
metal ions in variable coordination. The potential OSC of related hexagonal
manganites could easily surpass the current highest reported values, if they can be
modified to easily and reversibly transition in between phases with large amounts of
Mn2+ and Mn4+ at low temperatures.
Finally, apart from any possible OSC application, it should be noted that
hexagonal manganites have been largely believed, to the best of our knowledge, to
remain stoichiometric in oxygen content at elevated temperatures. In situ structural
measurements at high temperatures have reported a displacement of the MnO5
bipyramids and a transition to P63/mmc, which occur for YMnO3 at ~650°C and
38
~950°C, respectively [74][75]. Slight excesses of oxygen content (δ ≈ 0.01) have been
reported at 1200°C for YMnO3+δ and ErMnO3+δ [103] but did not show the non-
stoichiometric oxygen content behavior or the associated structural changes at lower
temperatures as we have observed with thermogravimetric and XRD measurements.
This behavior may not have been previously observed in other hexagonal manganites
due to the narrow range of temperature (~200 – 350°C) these new phases exist during
heating before returning back to δ = 0 above ~350°C and the slow cooling or high
oxygen partial-pressures they require. As discussed in the introduction, this
temperature range has not been of particular interest for structural studies of RMnO3,
as most of this work has been done at either low temperature to study magnetic
ordering (≤ 200 K) or high temperature to measure the rattling behavior of the MnO5
bipyramids or structural transitions (≥ 500°C). Our results indicate that the hexagonal
RMnO3+δ family is most likely prone to considerable oxygen non-stoichiometry and
also suggest a direct relation between reduction temperature and sorption rates of
oxygen to the average ionic size of R. If this is the case, other hexagonal RMnO3+δ
materials with rare earths that are close in ionic size to that of Y (e.g., Ho and Er) will
have similar non-stoichiometric behavior. It should be noted that our synthesis of
YMnO3+δ under fast cooling to room temperature yielded small, but measurable,
excesses in oxygen content (δ = 0.004). Many studies of RMnO3+δ use samples
prepared at elevated temperature followed by various cooling rates, which would yield
slightly non-stoichiometric samples for low-temperature measurements. Properties
associated with excess oxygen content (e.g., disruptions to the exchange interaction or
39
the presence of Mn4+) may very well have had a significant impact on the multiferroic
properties of these samples, as we have observed that even slight oxygen and cation
non-stoichiometry can have profound effects on magnetic and transport properties of
perovskite manganites [104][105]. In the following sections, we will show this effect
has a considerable impact of the structural, thermal/chemical expansion, transport, and
magnetic properties of Dy1-xYxMnO3+δ.
3.4 Crystal Structure
To study the structure of hexagonal oxygen-enriched phases (0 ≤ δ ≤ 0.4, x = 0
– 1), all samples were annealed after initial synthesis in varying conditions (in addition
to the TGA and high-pressure runs of the previous section) to achieve a large range of
oxygen contents. The oxygen content behavior of the DyMnO3+δ hexagonal sample
during annealing in oxygen (TGA, curve 1 of Figure 3.4) shows it to have stable
stoichiometric behavior above 350°C. Using this information, a stoichiometric P63cm
sample of DyMnO3 was synthesized by quenching in air from 420°C to liquid nitrogen
(verified by change in weight). Samples with δ > 0 were obtained on TGA by heating
to 400 – 500°C and then slow cooling to room temperature at 0.1 – 1.0°C/min in 21 –
100% O2 at ambient pressure. The final oxygen content of these samples was
determined by normalizing to stable weights above 400°C.
XRD measurements were made to verify the P63cm hexagonal structure after
synthesis and to obtain a preliminary structural understanding of annealed samples
before NPD measurements were conducted. Figure 3.10 is a compilation of XRD
40
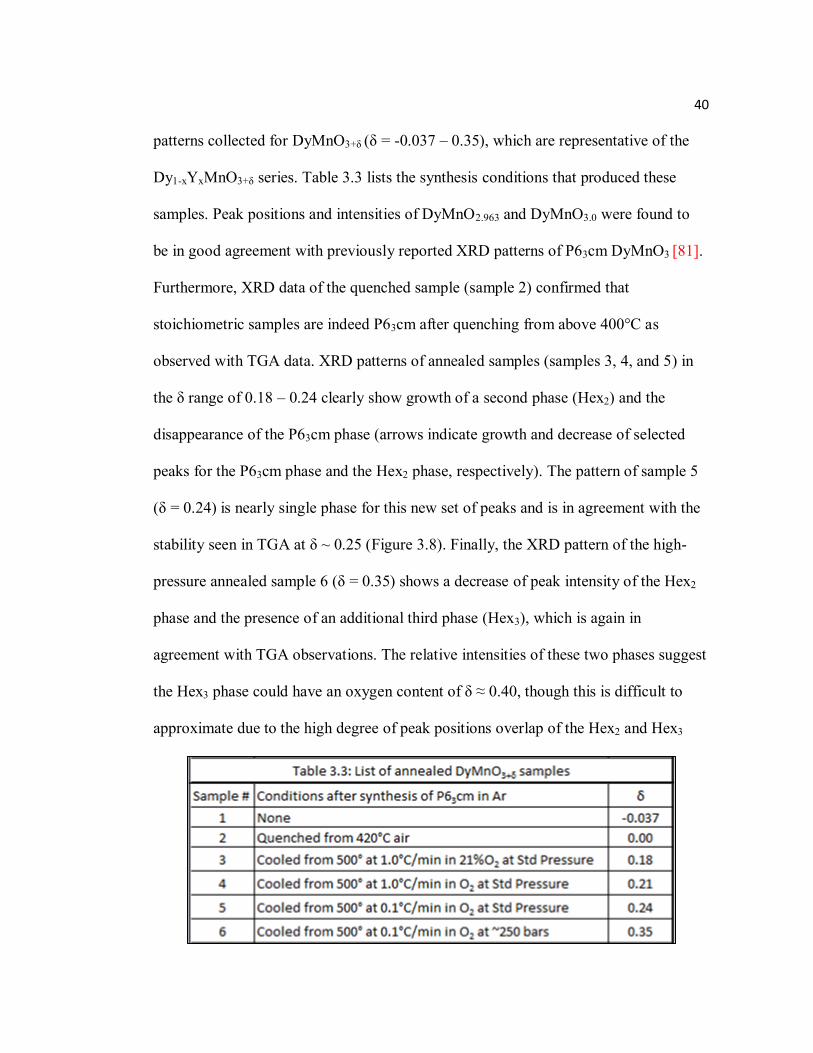
patterns collected for DyMnO3+δ (δ = -0.037 – 0.35), which are representative of the
Dy1-xYxMnO3+δ series. Table 3.3 lists the synthesis conditions that produced these
samples. Peak positions and intensities of DyMnO2.963 and DyMnO3.0 were found to
be in good agreement with previously reported XRD patterns of P63cm DyMnO3 [81].
Furthermore, XRD data of the quenched sample (sample 2) confirmed that
stoichiometric samples are indeed P63cm after quenching from above 400°C as
observed with TGA data. XRD patterns of annealed samples (samples 3, 4, and 5) in
the δ range of 0.18 – 0.24 clearly show growth of a second phase (Hex2) and the
disappearance of the P63cm phase (arrows indicate growth and decrease of selected
peaks for the P63cm phase and the Hex2 phase, respectively). The pattern of sample 5
(δ = 0.24) is nearly single phase for this new set of peaks and is in agreement with the
stability seen in TGA at δ ~ 0.25 (Figure 3.8). Finally, the XRD pattern of the high-
pressure annealed sample 6 (δ = 0.35) shows a decrease of peak intensity of the Hex2
phase and the presence of an additional third phase (Hex3), which is again in
agreement with TGA observations. The relative intensities of these two phases suggest
the Hex3 phase could have an oxygen content of δ ≈ 0.40, though this is difficult to
approximate due to the high degree of peak positions overlap of the Hex2 and Hex3
41
42
phases. However, samples x = 0.3 and 0.5 achieved higher oxygen contents than x = 0
after high-pressure annealings (δ = 0.40 and 0.37, respectively) and their XRD
patterns showed increased ratio of the Hex3/Hex2 phases (Figure 3.11). To help clarify
the development of new peaks and peak overlap, Figure 3.12 shows an overlay of
XRD patterns of samples 2, 5, and 6 (δ = 0.0, 0.24, and 0.35) in the 2θ range of 26 –
35° (phases associated with δ = ~0.25 and ~0.40 in Figure 3.12 are referred to as Hex2
and Hex3, respectively). Figures 3.10 – 3.12 show similarities in the diffraction
patterns of the Hex2, Hex3, and P63cm phases, which suggest that the Hex2 and Hex3
phases are structurally similar to the P63cm phase. Furthermore, the increased number
of peaks in the Hex2 and Hex3 phases suggests a lowering of symmetry or the
formation of a superstructure. Finally, it should also be noted, though these
transformations involving rearrangement of cation-oxygen networks are unlikely at
these low temperatures under O2, that the Hex2 and Hex3 phases were compared to
patterns of other known RxMny4+Mny-1
3+O3+δ systems (e.g., pyrochlore R2Mn2O7,
perovskite R-3c, R2MnO4 and RMn2O5) and oxides (Mn2O3, MnO2), which could
account for the increase in oxygen content. No traces of these structures were
observed.
Guided by our initial XRD investigation, NPD measurements were conducted
for P63cm samples. High-resolution, backscattering data (2θ = 144°, Bank 1 of SEPD)
were collected for DyMnO2.963 and DyMnO3.0. High-resolution, backscattering data
(2θ = 164°, Bank 1 of Echidna) were also collected at room temperature for x = 0.5
and 1 after synthesis of the P63cm phase. Raw data for these samples were analyzed
43
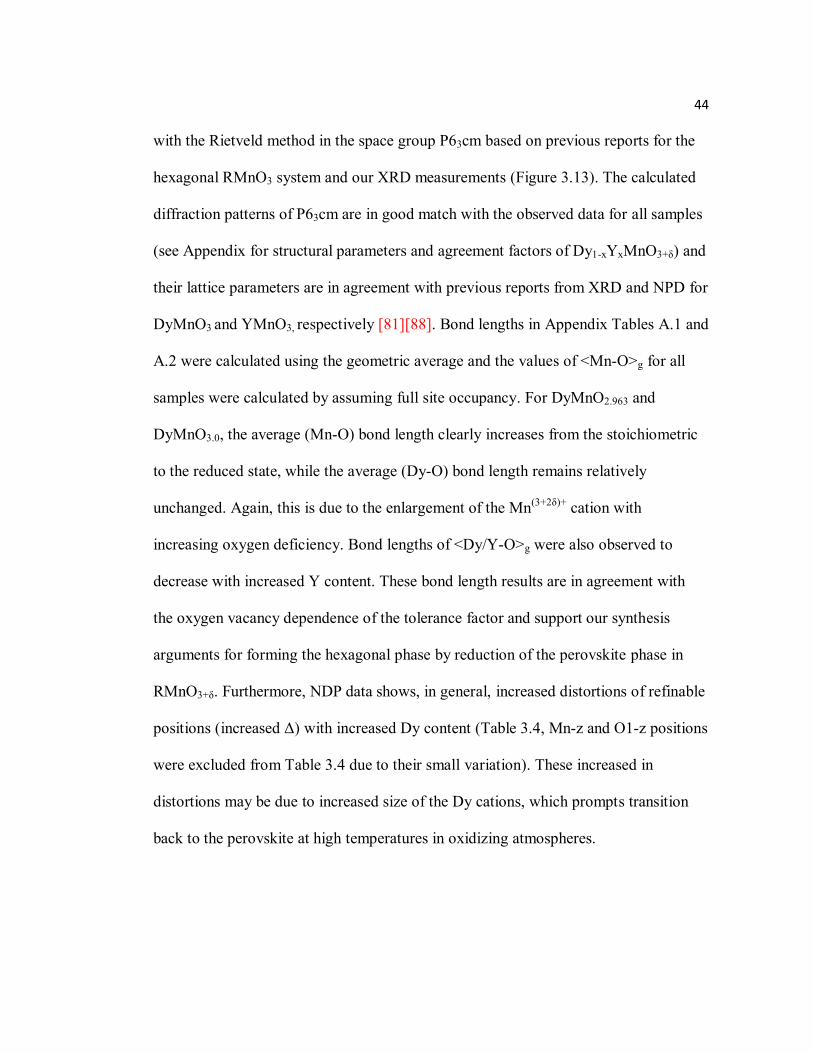
44
with the Rietveld method in the space group P63cm based on previous reports for the
hexagonal RMnO3 system and our XRD measurements (Figure 3.13). The calculated
diffraction patterns of P63cm are in good match with the observed data for all samples
(see Appendix for structural parameters and agreement factors of Dy1-xYxMnO3+δ) and
their lattice parameters are in agreement with previous reports from XRD and NPD for
DyMnO3 and YMnO3, respectively [81][88]. Bond lengths in Appendix Tables A.1 and
A.2 were calculated using the geometric average and the values of <Mn-O>g for all
samples were calculated by assuming full site occupancy. For DyMnO2.963 and
DyMnO3.0, the average (Mn-O) bond length clearly increases from the stoichiometric
to the reduced state, while the average (Dy-O) bond length remains relatively
unchanged. Again, this is due to the enlargement of the Mn(3+2δ)+ cation with
increasing oxygen deficiency. Bond lengths of <Dy/Y-O>g were also observed to
decrease with increased Y content. These bond length results are in agreement with
the oxygen vacancy dependence of the tolerance factor and support our synthesis
arguments for forming the hexagonal phase by reduction of the perovskite phase in
RMnO3+δ. Furthermore, NDP data shows, in general, increased distortions of refinable
positions (increased Δ) with increased Dy content (Table 3.4, Mn-z and O1-z positions
were excluded from Table 3.4 due to their small variation). These increased in
distortions may be due to increased size of the Dy cations, which prompts transition
back to the perovskite at high temperatures in oxidizing atmospheres.
45
46
3.5 Thermal and Chemical Expansion
Expansion of the crystal lattice, in both the hexagonal and perovskite RMnO3
phases, can occur through two mechanisms: thermal and chemical expansion. Thermal
expansion (TE), as discussed in tolerance factor arguments, is caused by expansion of
the (R-O) and (Mn-O) bond lengths due to increased thermal energy at elevated
temperature. This effect has been extensively studied with both in situ structural
measurements and dilatometry for both the RMnO3 perovskite and hexagonal systems
and can have a large impact on their magnetic, transport, and structural properties
[69][70][74][75] [92][93][106]–[108]. Chemical expansion (CE) is expansion of the
lattice due to changes in oxygen stoichiometry. The effect of CE has also been heavily
studied for changes in structural properties and has great importance on the macro-
scale for applications such as films, coatings, and layer materials [109]–[113] . On the
other hand, CE measurements for the hexagonal manganites are currently nonexistent,
due to the belief that the system remains stoichiometric in oxygen content at elevated
temperatures in argon and oxygen atmospheres. It should also be noted that in some
cases the thermal expansion coefficient (TEC) is considered to be the net result of both
CE and TE; here we consider these to be separate effects, thus TEC in this report is
only attributed to TE.
Measurements of CE typically must be measured separately from TE with
RMnO3+δ perovskites, because both CE and TE change at similar rates as a function of
temperature. Absorption occurs in the RMnO3+δ perovskite phase during a Pnma – R-
47
3c transition, which creates equal number of A and B site vacancies while absorbing
oxygen to remain stoichiometric [114]. These changes in oxygen content are usually
relatively small (δ ≤ 0.15), and occur slowly over a wide range of temperatures (~500
– 1000°C) [69]. Thus, investigations of CE must be done at constant temperature over
long lengths of time (≥ 72 hours) with changes in oxygen partial-pressure to change
oxygen content and make it possible to separate the effects of TE from CE. However,
our TGA measurements for hexagonal DyMnO3+δ phase have shown large changes in
oxygen stoichiometry between two stable oxygen content regions, which occur over a
relatively short time scale (≤ 2 hours) and narrow range of temperatures (~100°C).
These characteristics allow us to measure the effective CE over a narrow range of
temperature by simply subtracting the relatively small value of TE from the observed
value of CE. Similarly precise measurements of TE, without any effect from CE, were
possible in temperature regions of stable oxygen content. The following equations
were used to calculate TE and CE:
, measured in K-1,
where L0, ΔL, and T are the sample starting length, the change in length, and
temperature, respectively, and m-n are the sets from the measured temperature ranges,
and
, measured in (moles of O)-1, where Δδ is the
absolute change in oxygen content from stoichiometric 3.0 and <TEC> is the average
TEC of the two oxygen content stable regions.
A perovskite sample of DyMnO3 for dilatometry was cut from a dense pellet
after initial synthesis in air of the perovskite phase (~ 5x3x2 mm in shape) and was
measured in 21% O2/Ar atmosphere with heating rates of 0.5°C/min to 900°C (Figure
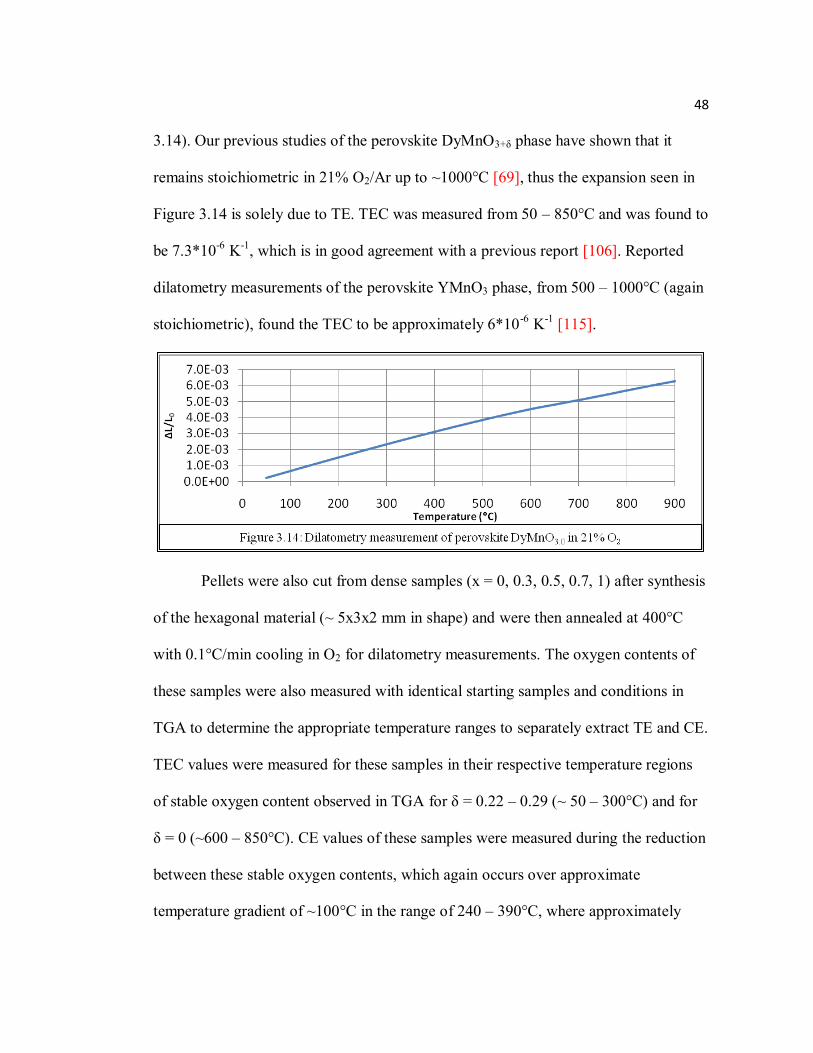
48
3.14). Our previous studies of the perovskite DyMnO3+δ phase have shown that it
remains stoichiometric in 21% O2/Ar up to ~1000°C [69], thus the expansion seen in
Figure 3.14 is solely due to TE. TEC was measured from 50 – 850°C and was found to
be 7.3*10-6 K-1, which is in good agreement with a previous report [106]. Reported
dilatometry measurements of the perovskite YMnO3 phase, from 500 – 1000°C (again
stoichiometric), found the TEC to be approximately 6*10-6 K-1 [115].
Pellets were also cut from dense samples (x = 0, 0.3, 0.5, 0.7, 1) after synthesis
of the hexagonal material (~ 5x3x2 mm in shape) and were then annealed at 400°C
with 0.1°C/min cooling in O2 for dilatometry measurements. The oxygen contents of
these samples were also measured with identical starting samples and conditions in
TGA to determine the appropriate temperature ranges to separately extract TE and CE.
TEC values were measured for these samples in their respective temperature regions
of stable oxygen content observed in TGA for δ = 0.22 – 0.29 (~ 50 – 300°C) and for
δ = 0 (~600 – 850°C). CE values of these samples were measured during the reduction
between these stable oxygen contents, which again occurs over approximate
temperature gradient of ~100°C in the range of 240 – 390°C, where approximately
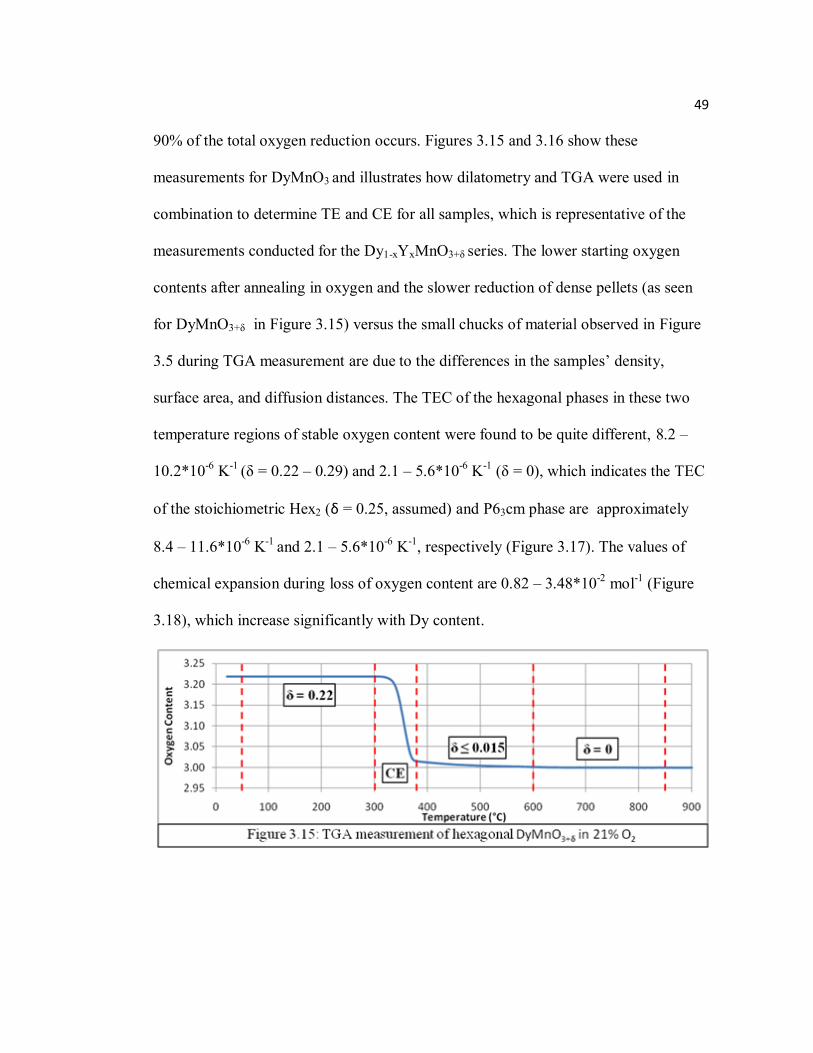
49
90% of the total oxygen reduction occurs. Figures 3.15 and 3.16 show these
measurements for DyMnO3 and illustrates how dilatometry and TGA were used in
combination to determine TE and CE for all samples, which is representative of the
measurements conducted for the Dy1-xYxMnO3+δ series. The lower starting oxygen
contents after annealing in oxygen and the slower reduction of dense pellets (as seen
for DyMnO3+δ in Figure 3.15) versus the small chucks of material observed in Figure
3.5 during TGA measurement are due to the differences in the samples’ density,
surface area, and diffusion distances. The TEC of the hexagonal phases in these two
temperature regions of stable oxygen content were found to be quite different, 8.2 –
10.2*10-6 K-1 (δ = 0.22 – 0.29) and 2.1 – 5.6*10-6 K-1 (δ = 0), which indicates the TEC
of the stoichiometric Hex2 (δ = 0.25, assumed) and P63cm phase are approximately
8.4 – 11.6*10-6 K-1 and 2.1 – 5.6*10-6 K-1, respectively (Figure 3.17). The values of
chemical expansion during loss of oxygen content are 0.82 – 3.48*10-2 mol-1 (Figure
3.18), which increase significantly with Dy content.
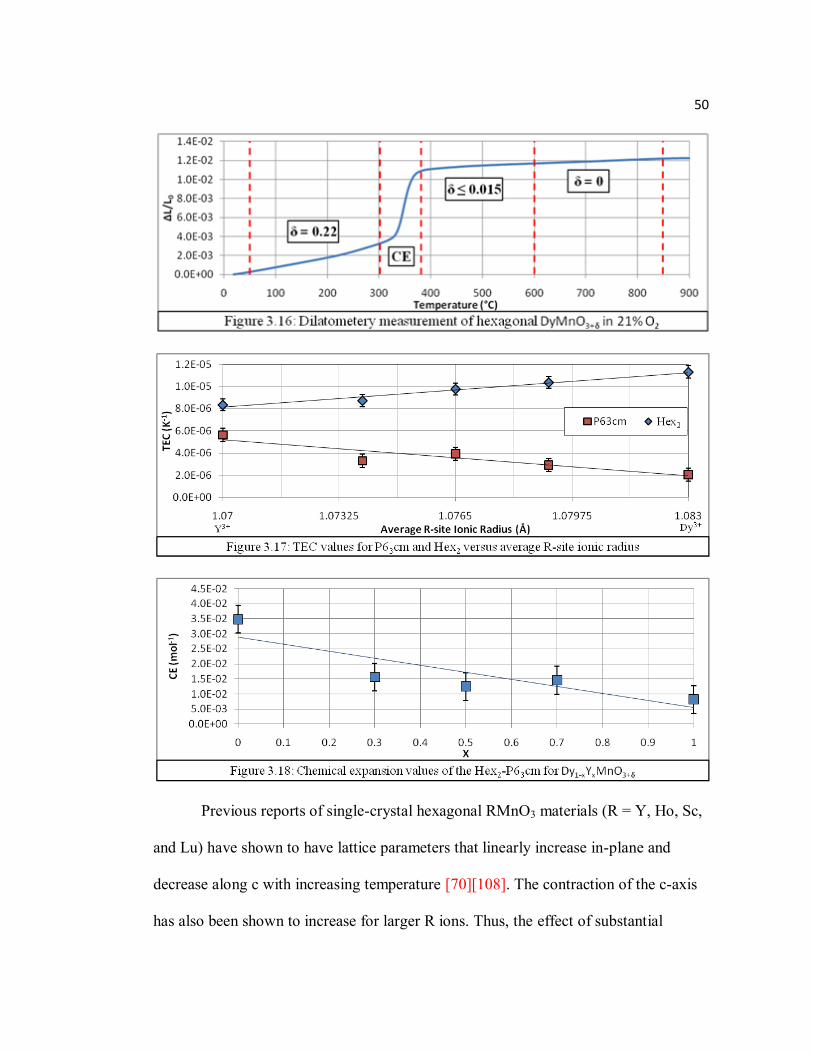
50
Previous reports of single-crystal hexagonal RMnO3 materials (R = Y, Ho, Sc,
and Lu) have shown to have lattice parameters that linearly increase in-plane and
decrease along c with increasing temperature [70][108]. The contraction of the c-axis
has also been shown to increase for larger R ions. Thus, the effect of substantial
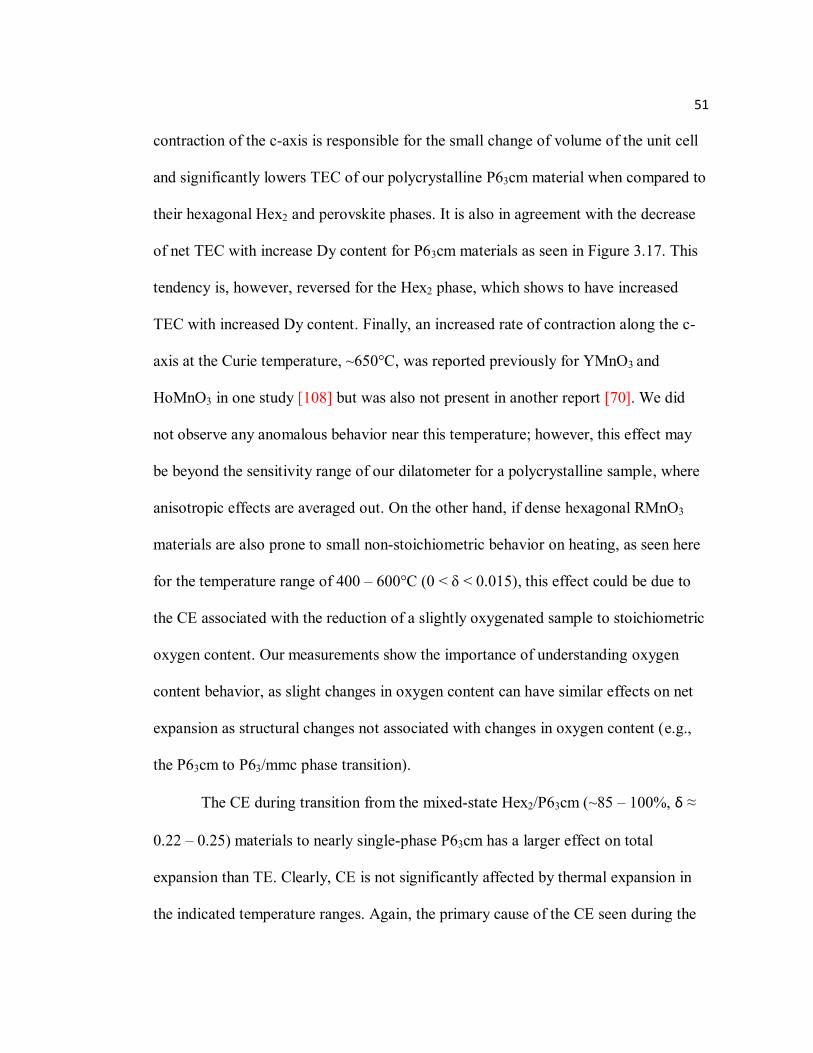
51
contraction of the c-axis is responsible for the small change of volume of the unit cell
and significantly lowers TEC of our polycrystalline P63cm material when compared to
their hexagonal Hex2 and perovskite phases. It is also in agreement with the decrease
of net TEC with increase Dy content for P63cm materials as seen in Figure 3.17. This
tendency is, however, reversed for the Hex2 phase, which shows to have increased
TEC with increased Dy content. Finally, an increased rate of contraction along the c-
axis at the Curie temperature, ~650°C, was reported previously for YMnO3 and
HoMnO3 in one study [108] but was also not present in another report [70]. We did
not observe any anomalous behavior near this temperature; however, this effect may
be beyond the sensitivity range of our dilatometer for a polycrystalline sample, where
anisotropic effects are averaged out. On the other hand, if dense hexagonal RMnO3
materials are also prone to small non-stoichiometric behavior on heating, as seen here
for the temperature range of 400 – 600°C (0 < δ < 0.015), this effect could be due to
the CE associated with the reduction of a slightly oxygenated sample to stoichiometric
oxygen content. Our measurements show the importance of understanding oxygen
content behavior, as slight changes in oxygen content can have similar effects on net
expansion as structural changes not associated with changes in oxygen content (e.g.,
the P63cm to P63/mmc phase transition).
The CE during transition from the mixed-state Hex2/P63cm (~85 – 100%, δ ≈
0.22 – 0.25) materials to nearly single-phase P63cm has a larger effect on total
expansion than TE. Clearly, CE is not significantly affected by thermal expansion in
the indicated temperature ranges. Again, the primary cause of the CE seen during the
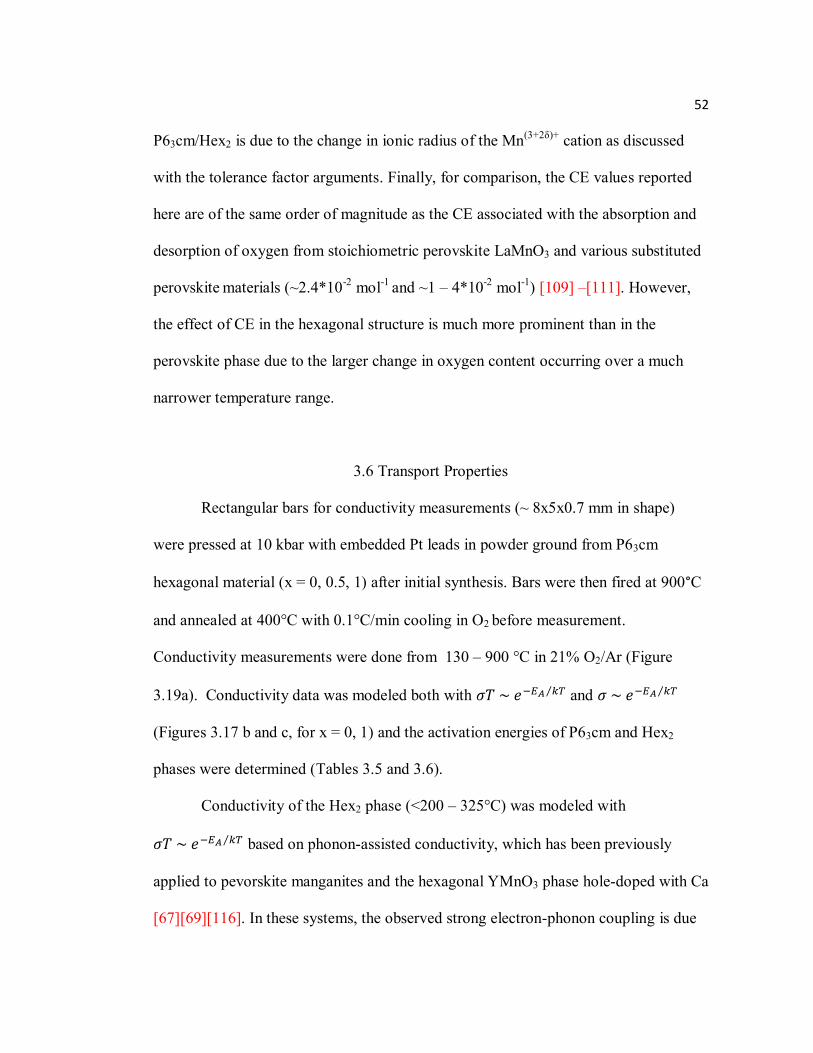
52
P63cm/Hex2 is due to the change in ionic radius of the Mn(3+2δ)+ cation as discussed
with the tolerance factor arguments. Finally, for comparison, the CE values reported
here are of the same order of magnitude as the CE associated with the absorption and
desorption of oxygen from stoichiometric perovskite LaMnO3 and various substituted
perovskite materials (~2.4*10-2 mol-1 and ~1 – 4*10-2 mol-1) [109] –[111]. However,
the effect of CE in the hexagonal structure is much more prominent than in the
perovskite phase due to the larger change in oxygen content occurring over a much
narrower temperature range.
3.6 Transport Properties
Rectangular bars for conductivity measurements (~ 8x5x0.7 mm in shape)
were pressed at 10 kbar with embedded Pt leads in powder ground from P63cm
hexagonal material (x = 0, 0.5, 1) after initial synthesis. Bars were then fired at 900°C
and annealed at 400°C with 0.1°C/min cooling in O2 before measurement.
Conductivity measurements were done from 130 – 900 °C in 21% O2/Ar (Figure
3.19a). Conductivity data was modeled both with and
(Figures 3.17 b and c, for x = 0, 1) and the activation energies of P63cm and Hex2
phases were determined (Tables 3.5 and 3.6).
Conductivity of the Hex2 phase (<200 – 325°C) was modeled with
based on phonon-assisted conductivity, which has been previously
applied to pevorskite manganites and the hexagonal YMnO3 phase hole-doped with Ca
[67][69][116]. In these systems, the observed strong electron-phonon coupling is due
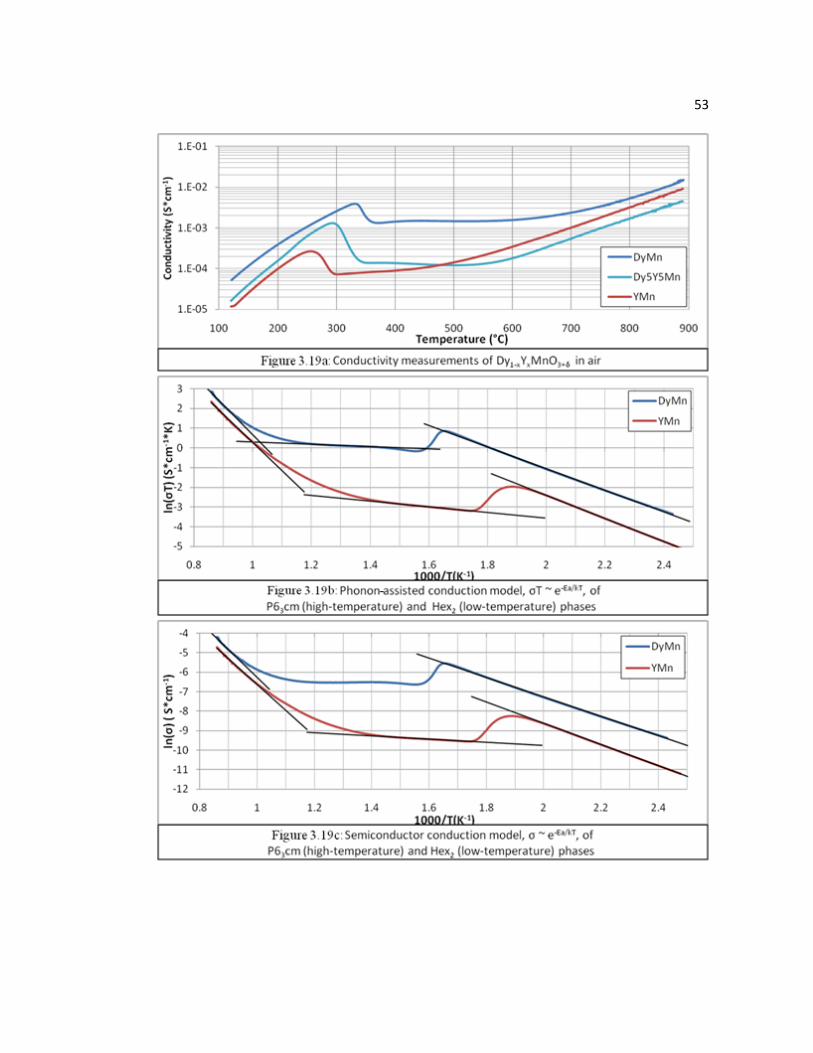
53
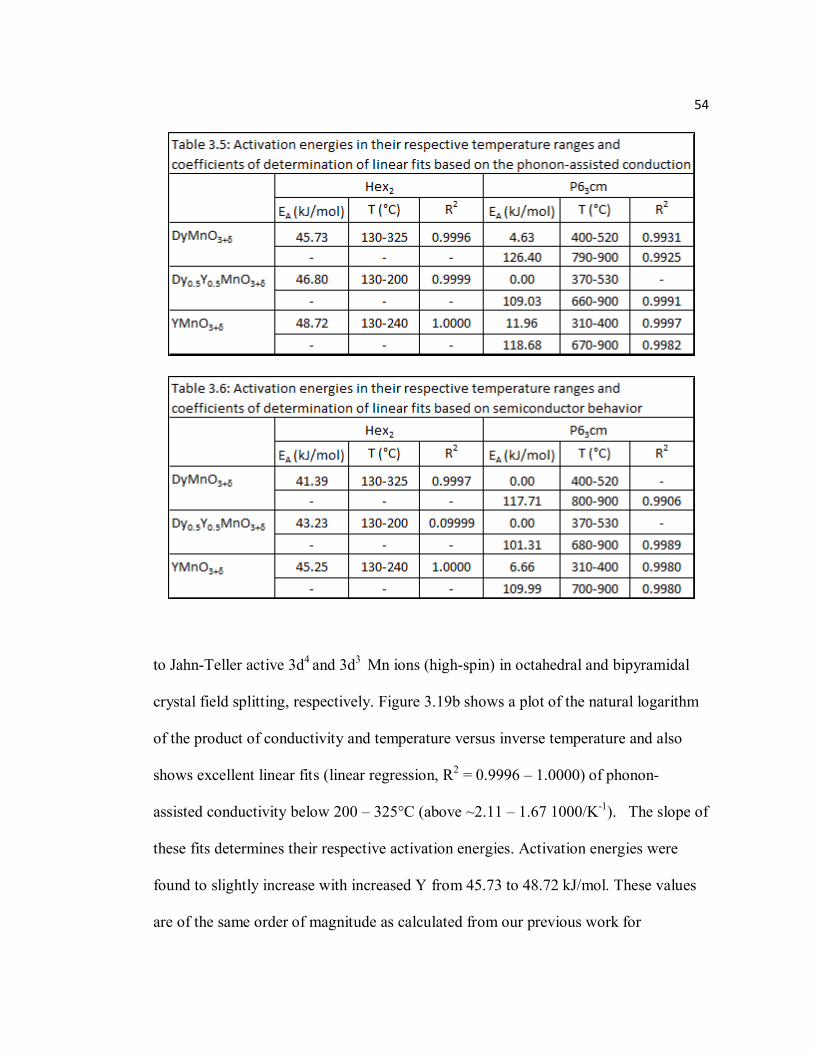
54
to Jahn-Teller active 3d4 and 3d3 Mn ions (high-spin) in octahedral and bipyramidal
crystal field splitting, respectively. Figure 3.19b shows a plot of the natural logarithm
of the product of conductivity and temperature versus inverse temperature and also
shows excellent linear fits (linear regression, R2 = 0.9996 – 1.0000) of phonon-
assisted conductivity below 200 – 325°C (above ~2.11 – 1.67 1000/K-1). The slope of
these fits determines their respective activation energies. Activation energies were
found to slightly increase with increased Y from 45.73 to 48.72 kJ/mol. These values
are of the same order of magnitude as calculated from our previous work for
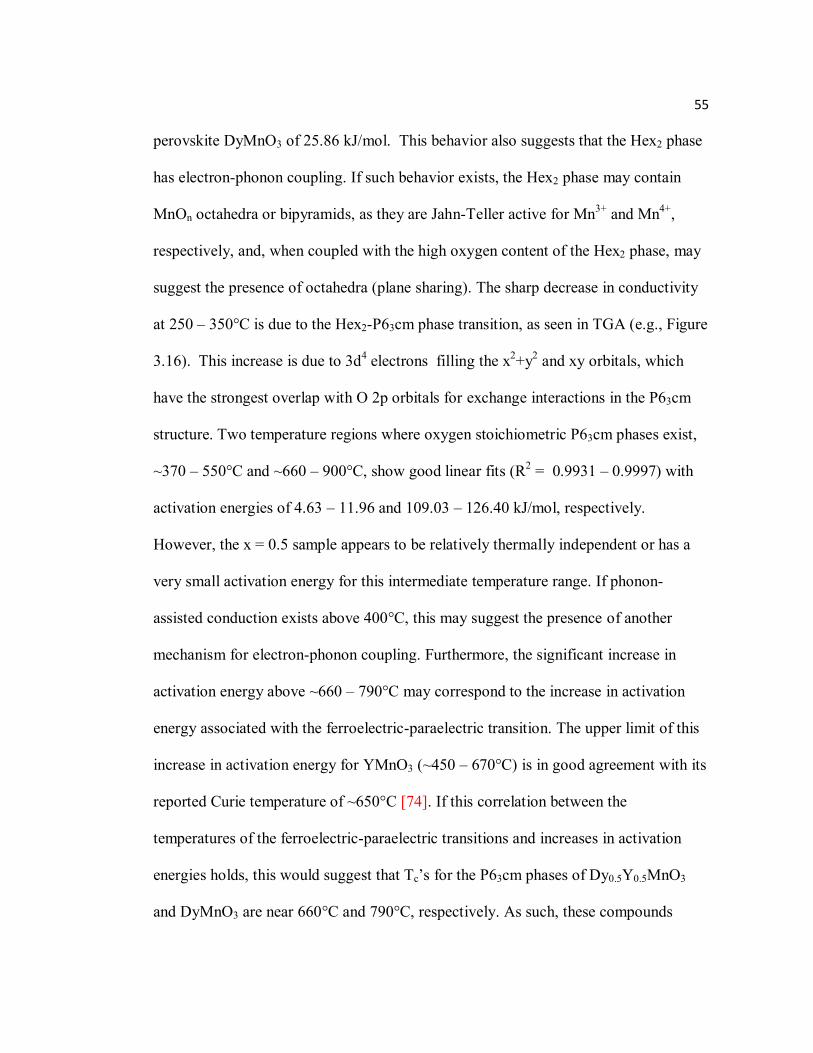
55
perovskite DyMnO3 of 25.86 kJ/mol. This behavior also suggests that the Hex2 phase
has electron-phonon coupling. If such behavior exists, the Hex2 phase may contain
MnOn octahedra or bipyramids, as they are Jahn-Teller active for Mn3+ and Mn4+,
respectively, and, when coupled with the high oxygen content of the Hex2 phase, may
suggest the presence of octahedra (plane sharing). The sharp decrease in conductivity
at 250 – 350°C is due to the Hex2-P63cm phase transition, as seen in TGA (e.g., Figure
3.16). This increase is due to 3d4 electrons filling the x2+y2 and xy orbitals, which
have the strongest overlap with O 2p orbitals for exchange interactions in the P63cm
structure. Two temperature regions where oxygen stoichiometric P63cm phases exist,
~370 – 550°C and ~660 – 900°C, show good linear fits (R2 = 0.9931 – 0.9997) with
activation energies of 4.63 – 11.96 and 109.03 – 126.40 kJ/mol, respectively.
However, the x = 0.5 sample appears to be relatively thermally independent or has a
very small activation energy for this intermediate temperature range. If phonon-
assisted conduction exists above 400°C, this may suggest the presence of another
mechanism for electron-phonon coupling. Furthermore, the significant increase in
activation energy above ~660 – 790°C may correspond to the increase in activation
energy associated with the ferroelectric-paraelectric transition. The upper limit of this
increase in activation energy for YMnO3 (~450 – 670°C) is in good agreement with its
reported Curie temperature of ~650°C [74]. If this correlation between the
temperatures of the ferroelectric-paraelectric transitions and increases in activation
energies holds, this would suggest that Tc’s for the P63cm phases of Dy0.5Y0.5MnO3
and DyMnO3 are near 660°C and 790°C, respectively. As such, these compounds
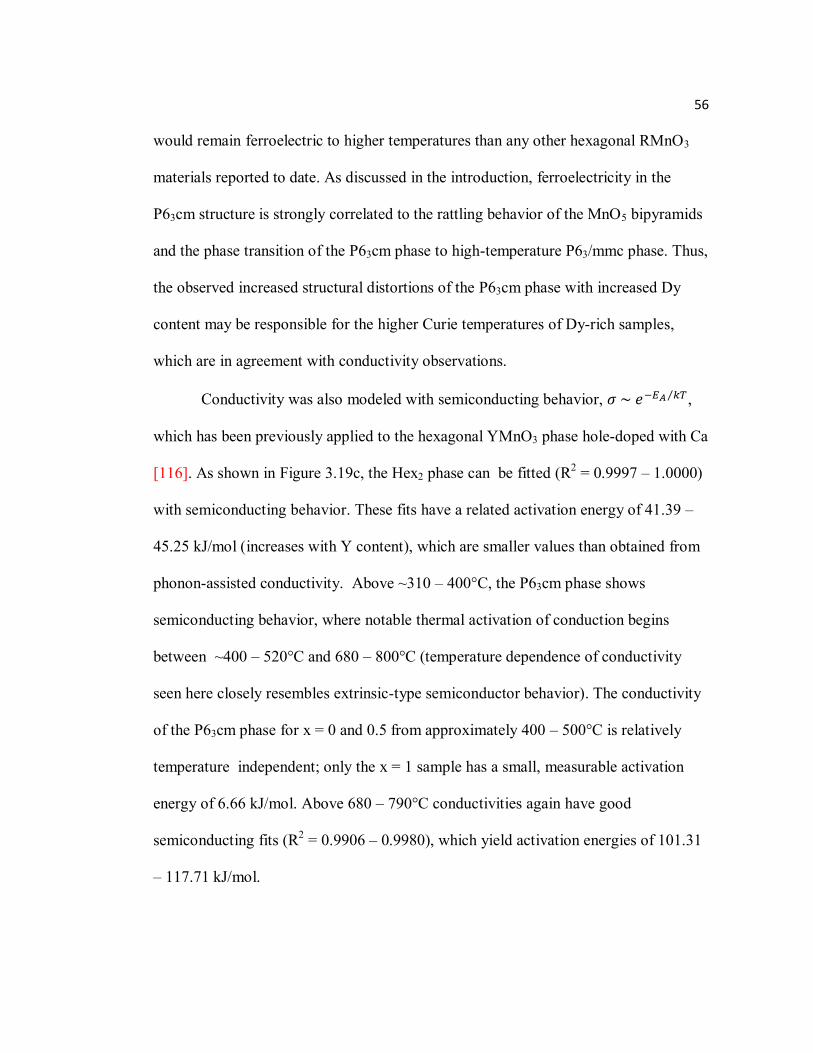
56
would remain ferroelectric to higher temperatures than any other hexagonal RMnO3
materials reported to date. As discussed in the introduction, ferroelectricity in the
P63cm structure is strongly correlated to the rattling behavior of the MnO5 bipyramids
and the phase transition of the P63cm phase to high-temperature P63/mmc phase. Thus,
the observed increased structural distortions of the P63cm phase with increased Dy
content may be responsible for the higher Curie temperatures of Dy-rich samples,
which are in agreement with conductivity observations.
Conductivity was also modeled with semiconducting behavior, ,
which has been previously applied to the hexagonal YMnO3 phase hole-doped with Ca
[116]. As shown in Figure 3.19c, the Hex2 phase can be fitted (R2 = 0.9997 – 1.0000)
with semiconducting behavior. These fits have a related activation energy of 41.39 –
45.25 kJ/mol (increases with Y content), which are smaller values than obtained from
phonon-assisted conductivity. Above ~310 – 400°C, the P63cm phase shows
semiconducting behavior, where notable thermal activation of conduction begins
between ~400 – 520°C and 680 – 800°C (temperature dependence of conductivity
seen here closely resembles extrinsic-type semiconductor behavior). The conductivity
of the P63cm phase for x = 0 and 0.5 from approximately 400 – 500°C is relatively
temperature independent; only the x = 1 sample has a small, measurable activation
energy of 6.66 kJ/mol. Above 680 – 790°C conductivities again have good
semiconducting fits (R2 = 0.9906 – 0.9980), which yield activation energies of 101.31
– 117.71 kJ/mol.
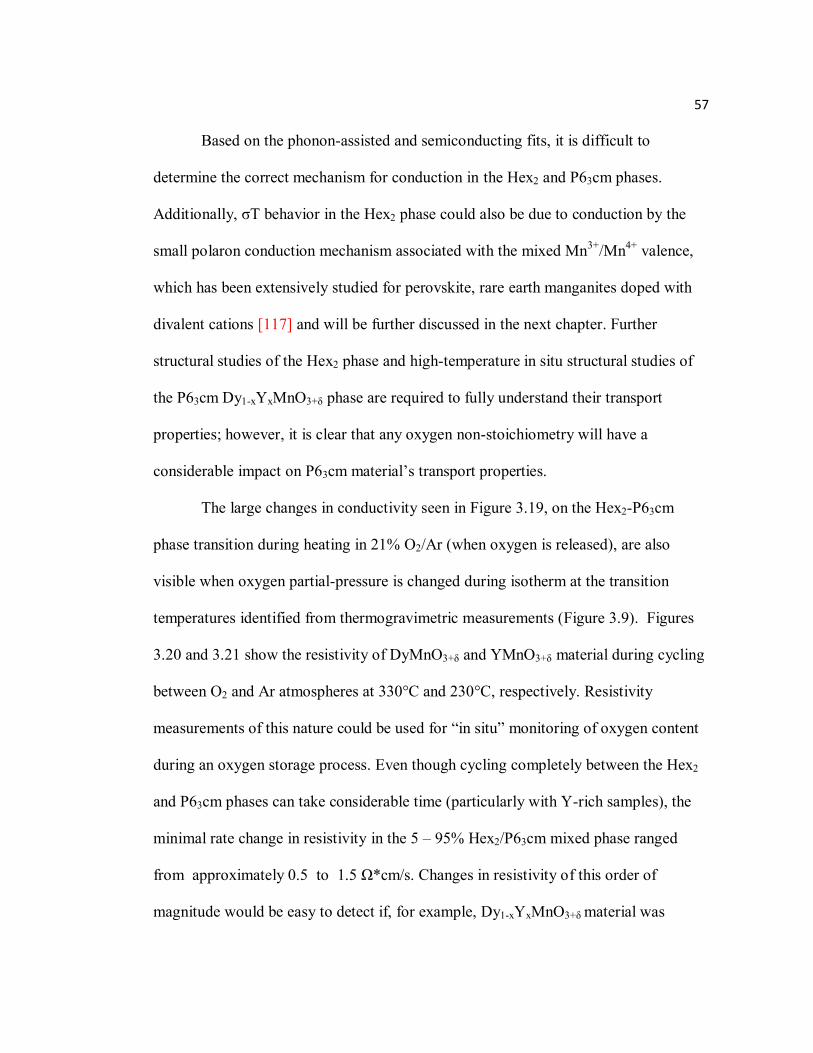
57
Based on the phonon-assisted and semiconducting fits, it is difficult to
determine the correct mechanism for conduction in the Hex2 and P63cm phases.
Additionally, σT behavior in the Hex2 phase could also be due to conduction by the
small polaron conduction mechanism associated with the mixed Mn3+/Mn4+ valence,
which has been extensively studied for perovskite, rare earth manganites doped with
divalent cations [117] and will be further discussed in the next chapter. Further
structural studies of the Hex2 phase and high-temperature in situ structural studies of
the P63cm Dy1-xYxMnO3+δ phase are required to fully understand their transport
properties; however, it is clear that any oxygen non-stoichiometry will have a
considerable impact on P63cm material’s transport properties.
The large changes in conductivity seen in Figure 3.19, on the Hex2-P63cm
phase transition during heating in 21% O2/Ar (when oxygen is released), are also
visible when oxygen partial-pressure is changed during isotherm at the transition
temperatures identified from thermogravimetric measurements (Figure 3.9). Figures
3.20 and 3.21 show the resistivity of DyMnO3+δ and YMnO3+δ material during cycling
between O2 and Ar atmospheres at 330°C and 230°C, respectively. Resistivity
measurements of this nature could be used for “in situ” monitoring of oxygen content
during an oxygen storage process. Even though cycling completely between the Hex2
and P63cm phases can take considerable time (particularly with Y-rich samples), the
minimal rate change in resistivity in the 5 – 95% Hex2/P63cm mixed phase ranged
from approximately 0.5 to 1.5 Ω*cm/s. Changes in resistivity of this order of
magnitude would be easy to detect if, for example, Dy1-xYxMnO3+δ material was
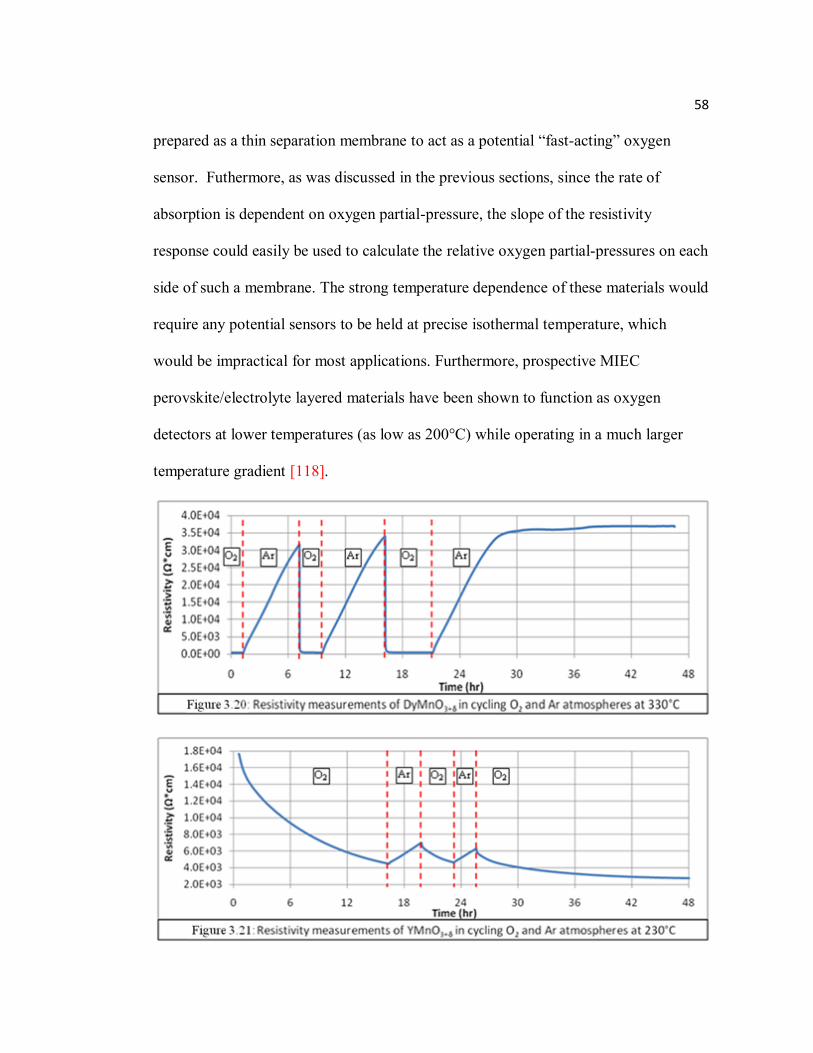
58
prepared as a thin separation membrane to act as a potential “fast-acting” oxygen
sensor. Futhermore, as was discussed in the previous sections, since the rate of
absorption is dependent on oxygen partial-pressure, the slope of the resistivity
response could easily be used to calculate the relative oxygen partial-pressures on each
side of such a membrane. The strong temperature dependence of these materials would
require any potential sensors to be held at precise isothermal temperature, which
would be impractical for most applications. Furthermore, prospective MIEC
perovskite/electrolyte layered materials have been shown to function as oxygen
detectors at lower temperatures (as low as 200°C) while operating in a much larger
temperature gradient [118].
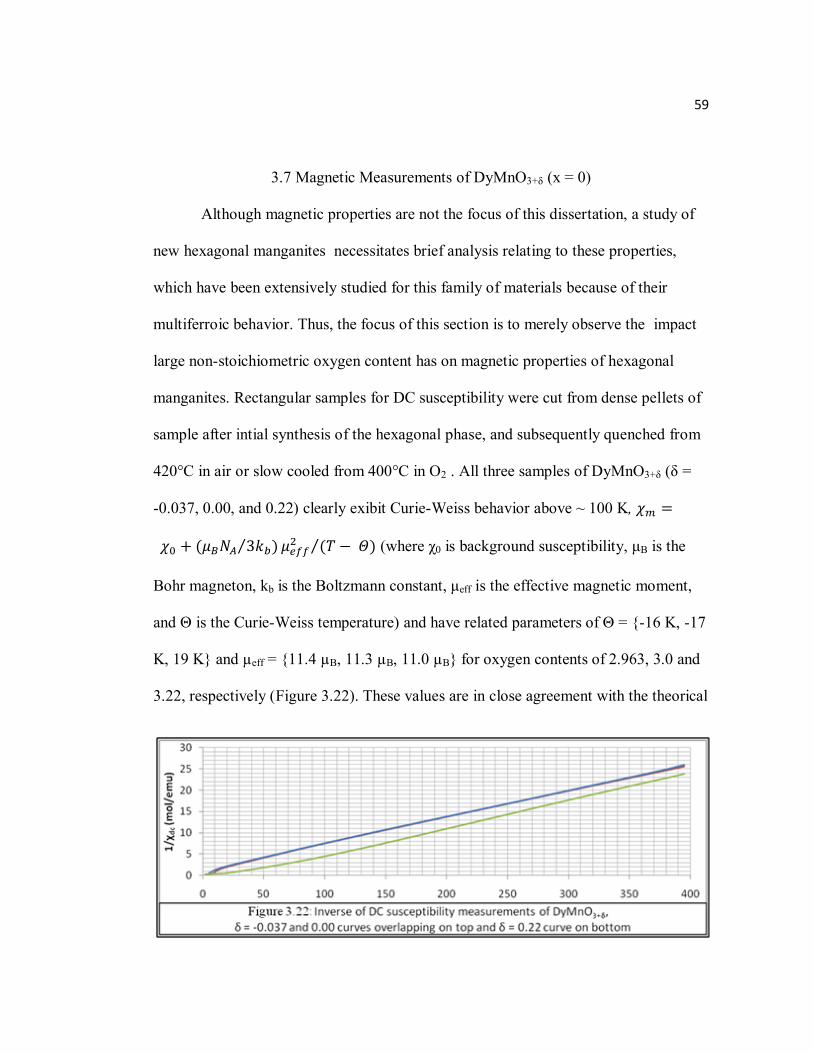
59
3.7 Magnetic Measurements of DyMnO3+δ (x = 0)
Although magnetic properties are not the focus of this dissertation, a study of
new hexagonal manganites necessitates brief analysis relating to these properties,
which have been extensively studied for this family of materials because of their
multiferroic behavior. Thus, the focus of this section is to merely observe the impact
large non-stoichiometric oxygen content has on magnetic properties of hexagonal
manganites. Rectangular samples for DC susceptibility were cut from dense pellets of
sample after intial synthesis of the hexagonal phase, and subsequently quenched from
420°C in air or slow cooled from 400°C in O2 . All three samples of DyMnO3+δ (δ =
-0.037, 0.00, and 0.22) clearly exibit Curie-Weiss behavior above ~ 100 K,
(where χ0 is background susceptibility, μB is the
Bohr magneton, kb is the Boltzmann constant, μeff is the effective magnetic moment,
and Θ is the Curie-Weiss temperature) and have related parameters of Θ = {-16 K, -17
K, 19 K} and µeff = {11.4 µB, 11.3 µB, 11.0 µB} for oxygen contents of 2.963, 3.0 and
3.22, respectively (Figure 3.22). These values are in close agreement with the theorical
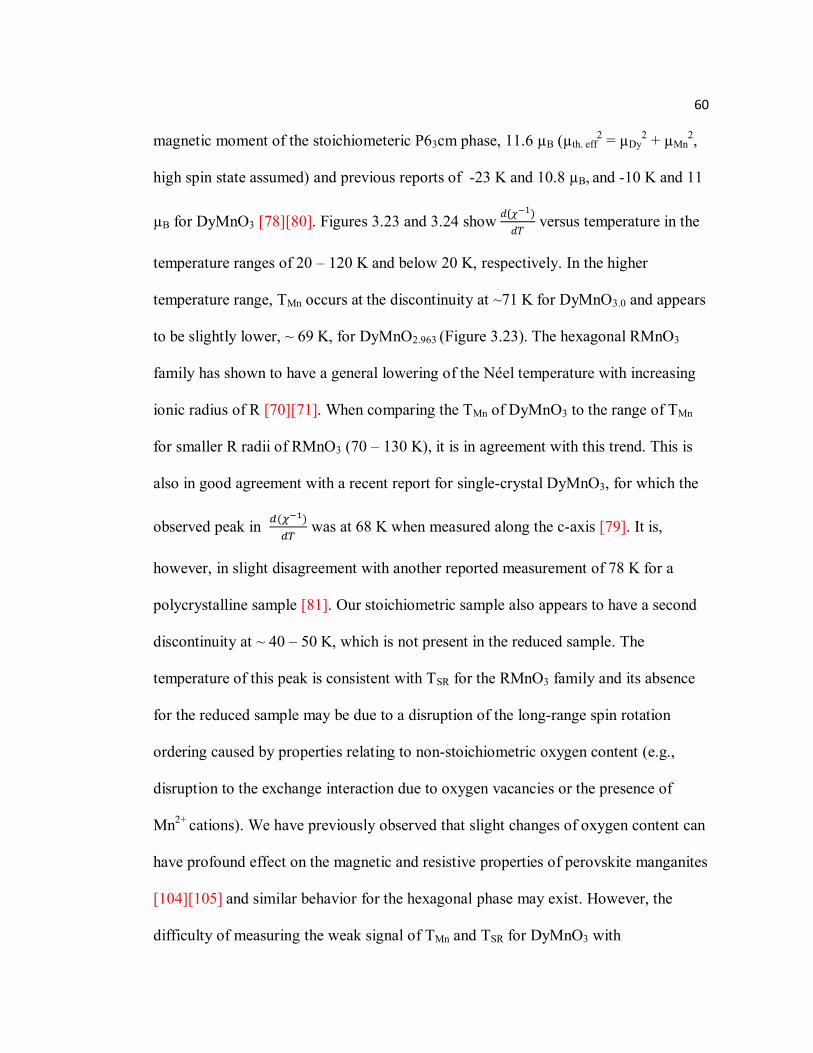
60
magnetic moment of the stoichiometeric P63cm phase, 11.6 µB (µth. eff2 = µDy
2 + µMn2,
high spin state assumed) and previous reports of -23 K and 10.8 µB, and -10 K and 11
µB for DyMnO3 [78][80]. Figures 3.23 and 3.24 show
versus temperature in the
temperature ranges of 20 – 120 K and below 20 K, respectively. In the higher
temperature range, TMn occurs at the discontinuity at ~71 K for DyMnO3.0 and appears
to be slightly lower, ~ 69 K, for DyMnO2.963 (Figure 3.23). The hexagonal RMnO3
family has shown to have a general lowering of the Néel temperature with increasing
ionic radius of R [70][71]. When comparing the TMn of DyMnO3 to the range of TMn
for smaller R radii of RMnO3 (70 – 130 K), it is in agreement with this trend. This is
also in good agreement with a recent report for single-crystal DyMnO3, for which the
observed peak in
was at 68 K when measured along the c-axis [79]. It is,
however, in slight disagreement with another reported measurement of 78 K for a
polycrystalline sample [81]. Our stoichiometric sample also appears to have a second
discontinuity at ~ 40 – 50 K, which is not present in the reduced sample. The
temperature of this peak is consistent with TSR for the RMnO3 family and its absence
for the reduced sample may be due to a disruption of the long-range spin rotation
ordering caused by properties relating to non-stoichiometric oxygen content (e.g.,
disruption to the exchange interaction due to oxygen vacancies or the presence of
Mn2+ cations). We have previously observed that slight changes of oxygen content can
have profound effect on the magnetic and resistive properties of perovskite manganites
[104][105] and similar behavior for the hexagonal phase may exist. However, the
difficulty of measuring the weak signal of TMn and TSR for DyMnO3 with
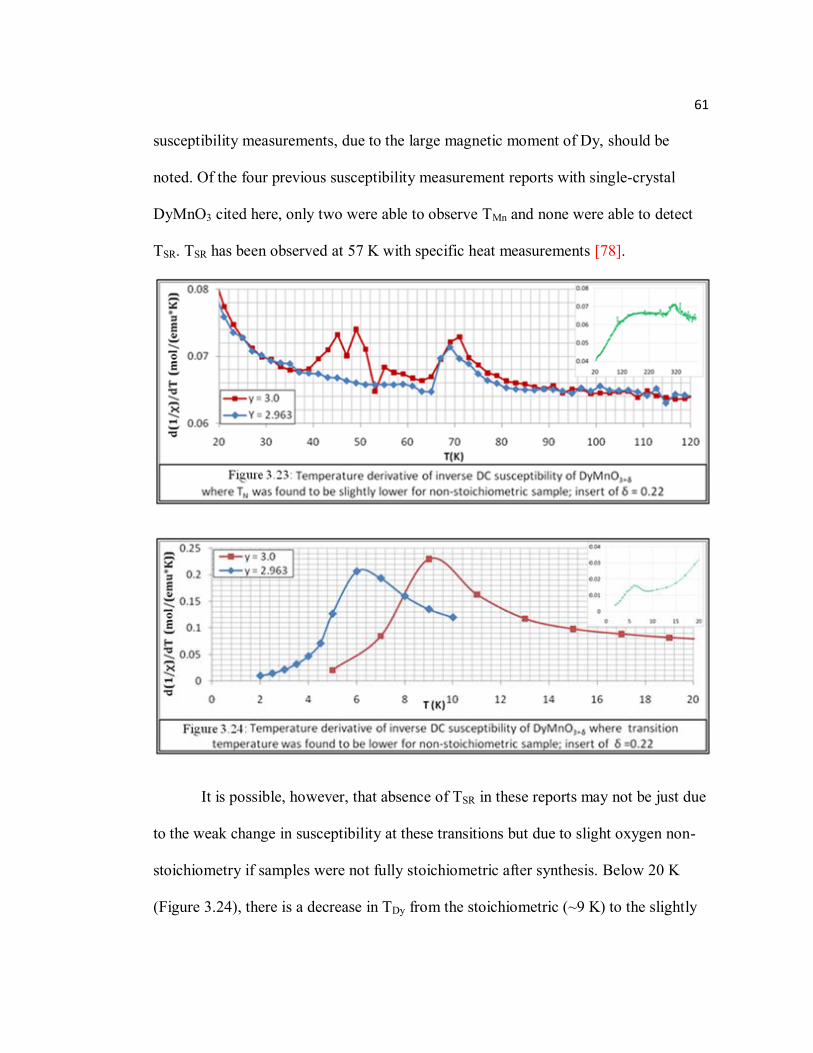
61
susceptibility measurements, due to the large magnetic moment of Dy, should be
noted. Of the four previous susceptibility measurement reports with single-crystal
DyMnO3 cited here, only two were able to observe TMn and none were able to detect
TSR. TSR has been observed at 57 K with specific heat measurements [78].
It is possible, however, that absence of TSR in these reports may not be just due
to the weak change in susceptibility at these transitions but due to slight oxygen non-
stoichiometry if samples were not fully stoichiometric after synthesis. Below 20 K
(Figure 3.24), there is a decrease in TDy from the stoichiometric (~9 K) to the slightly
62
reduced sample (~6 K). Previous reported values of TDy for single-crystal DyMnO3
have shown significant variation, 3 – 8 K [78] – [80], which could indicate that these
samples, which were synthesized by epitaxial thin film growth, are indeed subject to
large oxygen non-stoichiometry. Finally, measurements of the DyMnO3.22 sample,
with its positive Curie temperature, indicate slightly ferromagnetic behavior. Peaks in
occur at 6 and 310 k (Figures 3.22 – 3.24, inserts), suggesting that
antiferromagnetic and some other type of ordering are occurring below 6 and 310 K,
respectively. Clearly, the magnetic properties of the Hex2 phase differ significantly
from the P63cm phase and presence of any oxygen non-stoichiometry in the P63cm
structure will have considerable impact on these properties as well.
3.8 Conclusions
Our synthesis and structural measurements are in agreement with previous
work on perovskite manganites and suggest that the increased reducing conditions are
needed to form hexagonal Dy1-xYxMnO3+δ with decreasing x. This is in agreement
with previous reports of the perovskite forming from the hexagonal with smaller rare
earths (Ho, Er, and Y) under high pressure and support that the relative stability of
hexagonal and perovskite phases is due to the temperature, oxygen non-stoichiometry,
and compressibility dependence of the (R-O) and (Mn-O) bonds. Hexagonal
Dy1-xYxMnO3+δ materials were observed to reversibly absorb large amounts of oxygen
at ~200 – 300°C and to sharply desorb oxygen during transition back to the
63
stoichiometric P63cm phase above ~275 – 375°C or at lower temperatures in lower
partial-pressures of oxygen. Larger, reversible changes in oxygen content were
achieved by annealing at high pressures (δ = 0.25 – 0.38) and with hydrogen reduction
at 400°C (δ = -0.12 – -0.20), which, if combined, can yield OSC values up to ~2650
μmol-O/g. Rates of oxygen absorption were also observed to significantly decrease
with increasing Y content. However, regardless of any OSC potential applications, the
non-stoichiometric behavior of these hexagonal manganites’ oxygen content is, to the
best of our knowledge, newly reported for the RMnO3 family and was found to have
significant impact on the structural, thermal/chemical expansion, transport, and
magnetic properties. The TEC of the Hex2 and P63cm phases were determined to be
quite different, 8.4 – 11.6*10-6 K-1 and 2.1 – 5.6*10-6 K-1, respectively, and the
chemical expansion associated with the transition between these phases was found to
be 0.82 – 3.48*10-2 mol-1. Conductivity measurements at elevated temperatures
displayed thermal conduction of the Hex2 and the P63cm phases based either on
phonon-assisted conductivity or semiconducting behavior. The activation energies of
the Hex2 and the P63cm phase were found to be rather dissimilar, 43 – 47 and 105 –
120 kJ/mol, respectively. Proof of principle was also demonstrated that the large
changes in resistivity during the Hex2-P63cm transition could be coupled with oxygen
partial-pressure dependence of Dy1-xYxMnO3+δ to be used as a low elevated-
temperature oxygen sensor (230 – 330°C). Additionally, our conductivity
measurements of DyMnO3+δ may also suggest the P63cm phase of DyMnO3 has a Tc as
high as ~790°C, which may be due to the increased distortion of the P63cm structure
64
with increased Dy content. Finally, the magnetic properties of DyMnO3+δ were
demonstrated to change significantly with oxygen content. Strong oxygen content
dependence of the structural, magnetic, transport properties of Dy1-xYxMnO3+δ suggest
that the multiferroic properties of similar hexagonal RMnO3+δ manganites will change
significantly with oxygen stoichiometry.
65
CHAPTER 4: STUDY OF PEROVSKITE La1-xSrxFe1-yCoyO3+δ
(x ≥ 0.5), La0.2Sr0.8MnO3+δ, AND SrFe0.7Mn0.3O3+δ MATERIALS FOR
MIEC AND OXYGEN CARRIER APPLICATIONS
4.1 Introduction
As discussed in Section 1.2, the perovskite phases of La1-xAxM1-yM’yO3+δ (A=
Ca, Sr, Ba; M/M’ = Cr, Mn, Fe, Co, Ni, Ga) have been thoroughly studied for MIEC
applications. Traditionally, LaMnO3+δ doped with lower valance cations (such as Ca,
Sr, Ba) have been preferred materials for gas separation membranes and SOFC
cathodes applications. More recently, doped LaFeO3, and LaCoO3 materials have also
been extensively studied for MIEC applications due to their relatively higher oxygen
ion and electronic conductivities and faster surface exchange kinetics compared to
doped LaMnO3+δ compounds, but they also have large thermal expansion mismatch
and poor stability with YSZ and other common electrolytes for SOFC applications.
For most studies of these materials, cation doping is frequently less than 50% and
La.8Sr.2MnO3+δ and La.6Sr.4Fe.8Co.2O3+δ materials have been generally considered to
have the superior combination of properties (e.g., total ionic conductivity, TEC, and
stability) for application. At room temperature, LaMnO3+δ and LaFeO3 materials have
distorted orthorhombic perovskite structures (where this distortion, again, is larger for
LaMnO3+δ due to Jahn-Teller distortions). Both of these materials also have an
66
orthorhombic-rhombohedral phase transition at elevated temperatures (>400°C for Mn
and >900°C for Fe) and in general have been observed to transition to higher
symmetries with increased Sr substitutions [119]–[121]. The structure of LaCoO3
material is rhombohedrally distorted from the cubic perovskite; however, at high
temperatures or with increasing Sr substitution becomes increasingly cubic in
symmetry [122][123]. LaMnO3+δ material has p-type conductivity at high
temperatures (>1000°C) in air due to the formation of cation vacancies, as discussed in
Chapter 3 for RMnO3+δ (δ > 0) materials, and electronic conduction occurs by the
hopping of electron holes between the 2+ and 3+ states of the metal cations. LaFeO3
and LaCoO3 materials, however, remain nearly stoichiometric in such conditions. Hole
doping with divalent cations (Ba, Sr, Ca) can significantly improve electronic
conductivity for all of these materials over a wide range of temperatures. This
enhanced conduction is due to their mixed 4+/3+ valance state, which results in
electronic conduction by the small polaron conduction or metallic mechanisms
[119][124][125]. Substitutions with Sr have usually been preferred to other alkaline
earth metals because of its relatively good ionic size match with La and high
electronic conductivity. Sr substituted materials also show the best stability in
atmospheres containing H2O and CO2 and are able to accommodate large non-
stoichiometric oxygen contents at high temperatures in oxidizing and reducing
atmospheres [126]. Substitutions on the B-site can also increase the mixed valance
state and may further improve electronic conduction. In addition to the ratio of 4+/3+
B-site ion, the electronic conduction for substituted manganites, ferrites, and cobaltites
67
materials depends on several other factors, especially at elevated temperatures, such as
structural changes, oxygen non-stoichiometry, changes to the 3d-2p overlap with
structural distortions, band structure and filling, magnetic ordering, changes in the 3d
spin state, cation charge and size ordering, oxygen vacancy ordering, cation charge
disproportionation, etc. Experimentally, LaCoO3 material has shown to have better
electronic conductivity by comparison with LaMnO3+δ and LaFeO3 materials [127],
and studies of La.8Sr.2MxM’yM’’zO3+δ (M/M’/M’’ = Mn, Fe, Co; x+y+z = 1) and La1-
xSrxFe1-yCoyO3+δ (x = 0.2 and 0.4, 0 ≤ y ≤ 1) substituted compounds have also shown
pure Co samples to have considerably higher electronic conductivity (and
considerably higher thermal expansion) than Fe, Mn, or intermediate materials [128]–
[130]. The increased conductivity of Co-rich materials in these studies are primarily
attributed to charge disproportionation of Co3+ (2Co3+ → Co2+ + Co4+) at elevated
temperatures and increased 3d-2p overlap due to the higher electronegativity of Co.
However, the relative ease of reducing Co4+ compared to Mn4+ and Fe4+ can decrease
the mixed 4+/3+ valance ratio significantly below 50% (noting, 50% is considered
ideal for maximum conductivity) of Co-rich samples and hinder conduction at
elevated temperatures or in reducing atmospheres.
The ease of reduction of the metal cations is inherently not only important to
electrical conductivity but it is also extremely important to oxygen ion conduction as
well. Increased reduction increases fractional content of oxygen ion vacancies by the
need to charge balance and can result in enhanced oxygen ion conductivity (increased
σ0 in the Arrhenius relation). The ease of reducing from the 4+ to the 3+ valance states
68
with these cations increases with atomic number (Co > Fe > Mn); however, reduction
from the 3+ to the 2+ state changes to Co > Mn > Fe due to the stability of Fe3+ ion’s
3d5 high-spin configuration [131]. The ease of reducing from the 4+ to the 3+ state, in
the case for La1-xSrxFe1-yCoyO3+δ (x = 0.2 and 0.4, 0 ≤ y ≤ 1) materials, also results in
higher oxygen ion conductivity in Co-rich samples; however, oxygen ion conduction
has been shown to remain relatively high with significant Fe content for increased Sr
content (up to approximately an 80/20 Fe/Co ratio). Yet, the ease of reducing Co
samples also results in its poor stability and materials with large levels of Co tend to
begin decomposition to simple oxides at high temperatures in low partial-pressures of
oxygen (>1000°C), which occurs at lower temperatures with increased Sr content.
This behavior is especially undesirable for practical SOFC applications, which require
stability in low partial-pressures of hydrogen gas. Additionally, Co-rich samples have
comparatively higher TEC values, which can lead to thermal expansion mismatch for
layer material applications. Studies of La1-xSrxFe1-yCoyO3+δ materials have also shown
oxygen ion conductivity to improve significantly with increased Sr content, which
again can be partially attributed to it having higher fractional oxygen vacancies
[132][133]. However, for all these materials, oxygen ion vacancies must be disordered
in the crystal lattice to increase oxygen ion conductivity [134]. The resulting larger
decreases in oxygen content for high levels of Sr substitution significantly increases
the possibility of vacancy-ordered phases to occur (though vacancy ordering also
occurs in the in La-rich samples, e.g., LaMnO2.875 and LaMnO2.75 structures [135]).
For example, the case of the transition during reduction from the perovskite phase to
69
the Brownmillerite A2B2O5 (ABO2.5) structure, which occurs when the oxygen-
deficient perovskite structure begins vacancy ordering along the [101] direction at δ ≈
-0.5, has been frequently studied [136][137]. The Brownmillerite structure has an
orthorhombic unit cell and can be described as alternating sheets of corner-shared
octahedra and tetrahedral (MOn) along the c-axis (Figure 4.1). The vacancy ordering
of the Brownmillerite phase causes it to have significantly lower oxygen ion
conductivity than the reduced perovskite phase, despite the larger amount of oxygen
vacant-sites available for diffusion of the Brownmillerite structure [138]. The
Brownmillerite-type structure has been observed to occur the in large range of La1-
xSrxFe1-yCoyO2.5 compositions and it is generally believed to exist for its entire phase
diagram [139]–[141]. The Brownmillerite phase has also been observed in La-rich
La1-xSrxMnO2.5 (x = 0.2, 0.25, and 0.4) materials [142]. The Sr2Mn2O5 (SrMnO2.5)
structure, on the other hand, has the Ca2Mn2O5 structure type [143], which has ordered
Mn3+ pyramids instead of the alternating octahedra and tetrahedra layers as seen in the
Brownmillerite phase. This orthorhombic 225 structure (δ ≈ 0.5) has also been
previously observed for substituted La1-xSrxMnO2.5 samples (x = 0.8 and 0.9) [144].
Our previous work and other recent studies with related Sr-rich materials have found
additional vacancy-ordered phases between the stoichiometric perovskite phase and δ
= -0.5 and will be discussed further in Section 4.3.
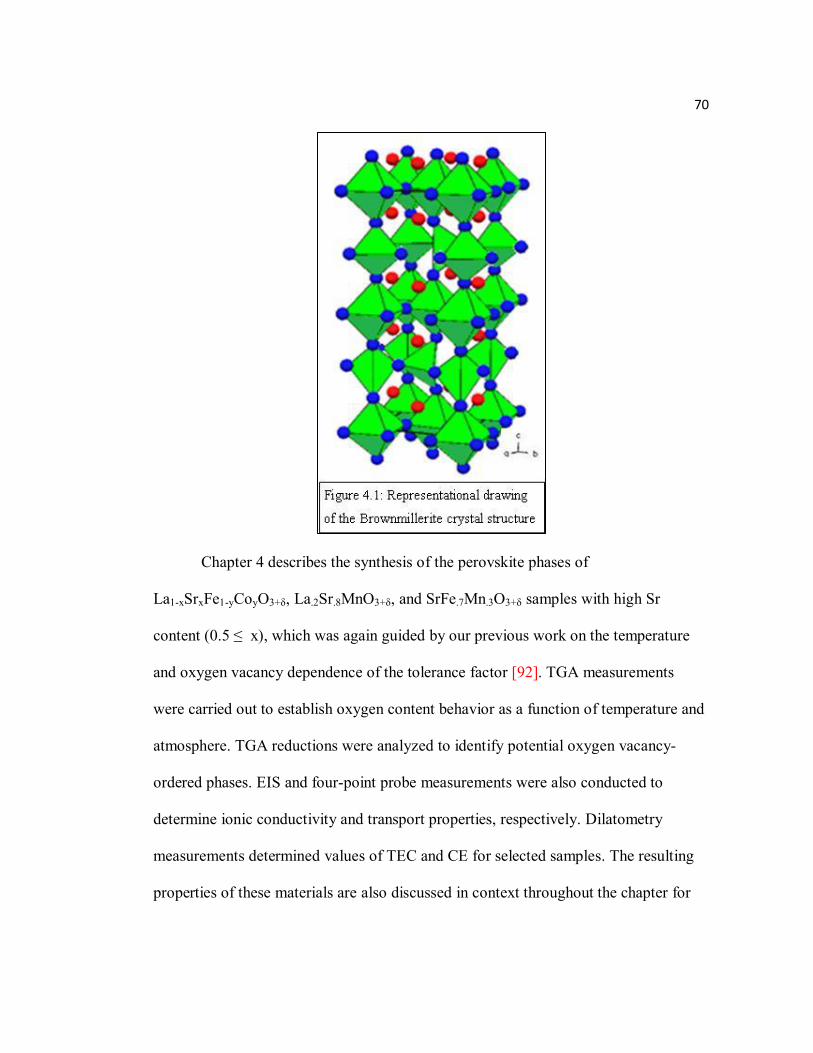
70
Chapter 4 describes the synthesis of the perovskite phases of
La1-xSrxFe1-yCoyO3+δ, La.2Sr.8MnO3+δ, and SrFe.7Mn.3O3+δ samples with high Sr
content (0.5 ≤ x), which was again guided by our previous work on the temperature
and oxygen vacancy dependence of the tolerance factor [92]. TGA measurements
were carried out to establish oxygen content behavior as a function of temperature and
atmosphere. TGA reductions were analyzed to identify potential oxygen vacancy-
ordered phases. EIS and four-point probe measurements were also conducted to
determine ionic conductivity and transport properties, respectively. Dilatometry
measurements determined values of TEC and CE for selected samples. The resulting
properties of these materials are also discussed in context throughout the chapter for
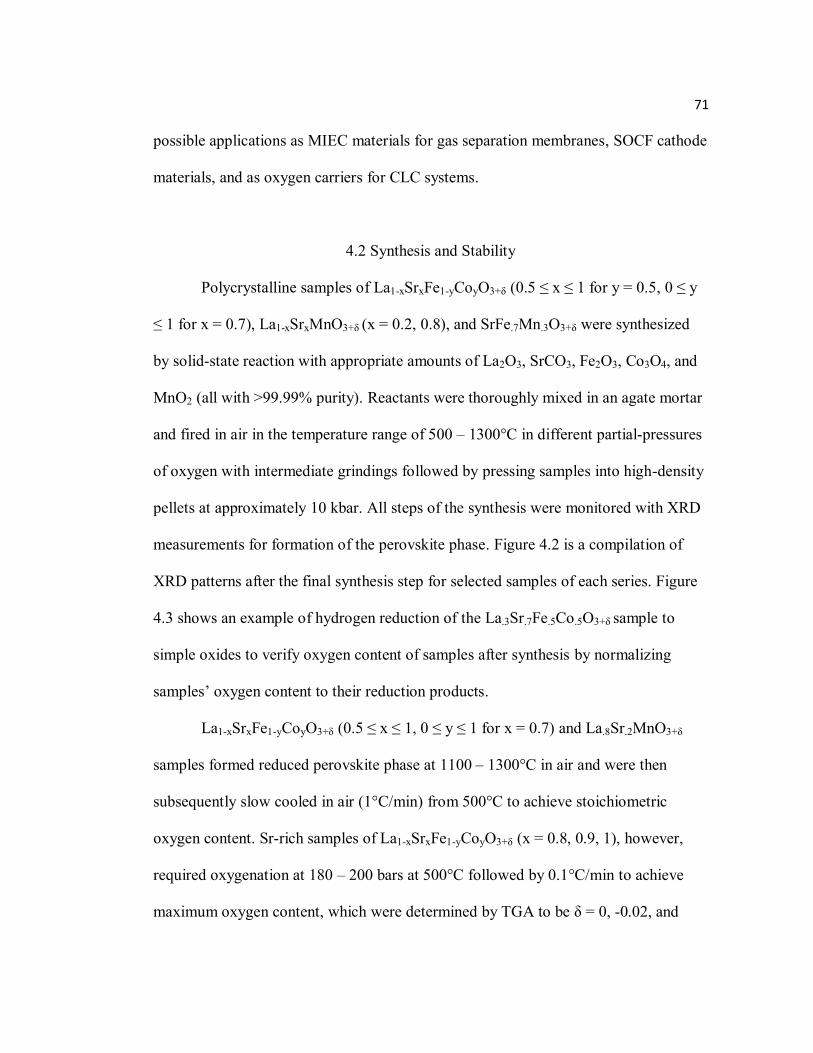
71
possible applications as MIEC materials for gas separation membranes, SOCF cathode
materials, and as oxygen carriers for CLC systems.
4.2 Synthesis and Stability
Polycrystalline samples of La1-xSrxFe1-yCoyO3+δ (0.5 ≤ x ≤ 1 for y = 0.5, 0 ≤ y
≤ 1 for x = 0.7), La1-xSrxMnO3+δ (x = 0.2, 0.8), and SrFe.7Mn.3O3+δ were synthesized
by solid-state reaction with appropriate amounts of La2O3, SrCO3, Fe2O3, Co3O4, and
MnO2 (all with >99.99% purity). Reactants were thoroughly mixed in an agate mortar
and fired in air in the temperature range of 500 – 1300°C in different partial-pressures
of oxygen with intermediate grindings followed by pressing samples into high-density
pellets at approximately 10 kbar. All steps of the synthesis were monitored with XRD
measurements for formation of the perovskite phase. Figure 4.2 is a compilation of
XRD patterns after the final synthesis step for selected samples of each series. Figure
4.3 shows an example of hydrogen reduction of the La.3Sr.7Fe.5Co.5O3+δ sample to
simple oxides to verify oxygen content of samples after synthesis by normalizing
samples’ oxygen content to their reduction products.
La1-xSrxFe1-yCoyO3+δ (0.5 ≤ x ≤ 1, 0 ≤ y ≤ 1 for x = 0.7) and La.8Sr.2MnO3+δ
samples formed reduced perovskite phase at 1100 – 1300°C in air and were then
subsequently slow cooled in air (1°C/min) from 500°C to achieve stoichiometric
oxygen content. Sr-rich samples of La1-xSrxFe1-yCoyO3+δ (x = 0.8, 0.9, 1), however,
required oxygenation at 180 – 200 bars at 500°C followed by 0.1°C/min to achieve
maximum oxygen content, which were determined by TGA to be δ = 0, -0.02, and
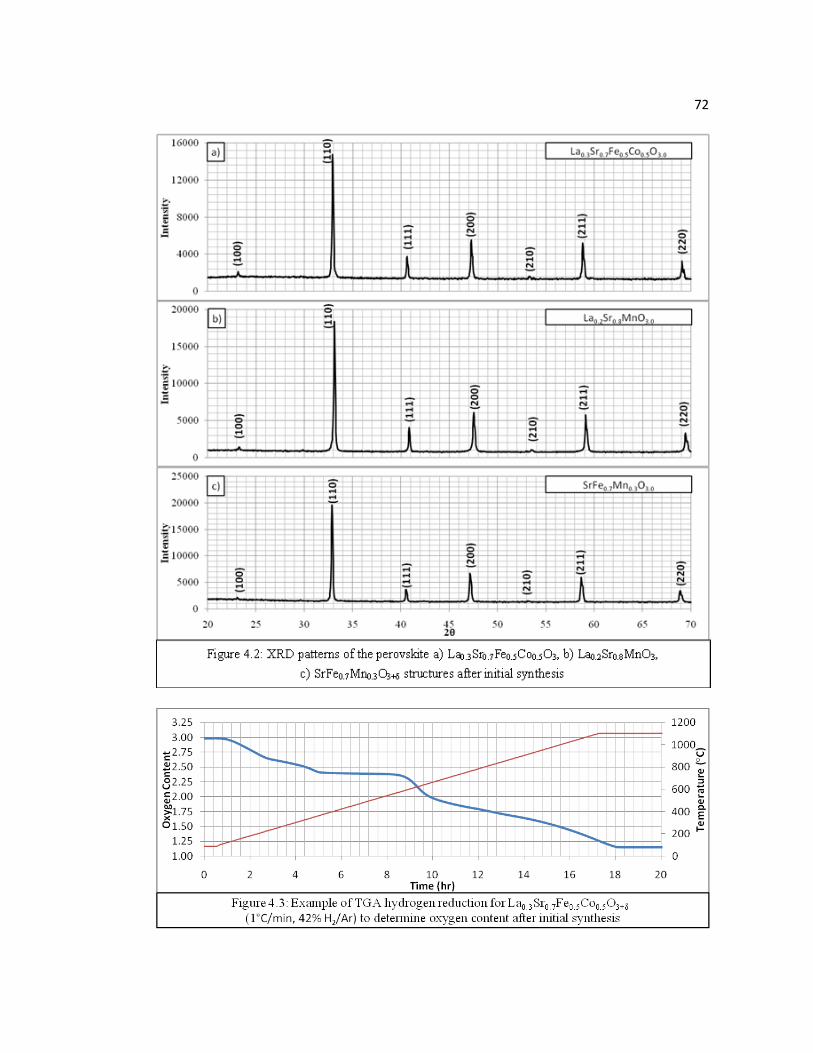
72
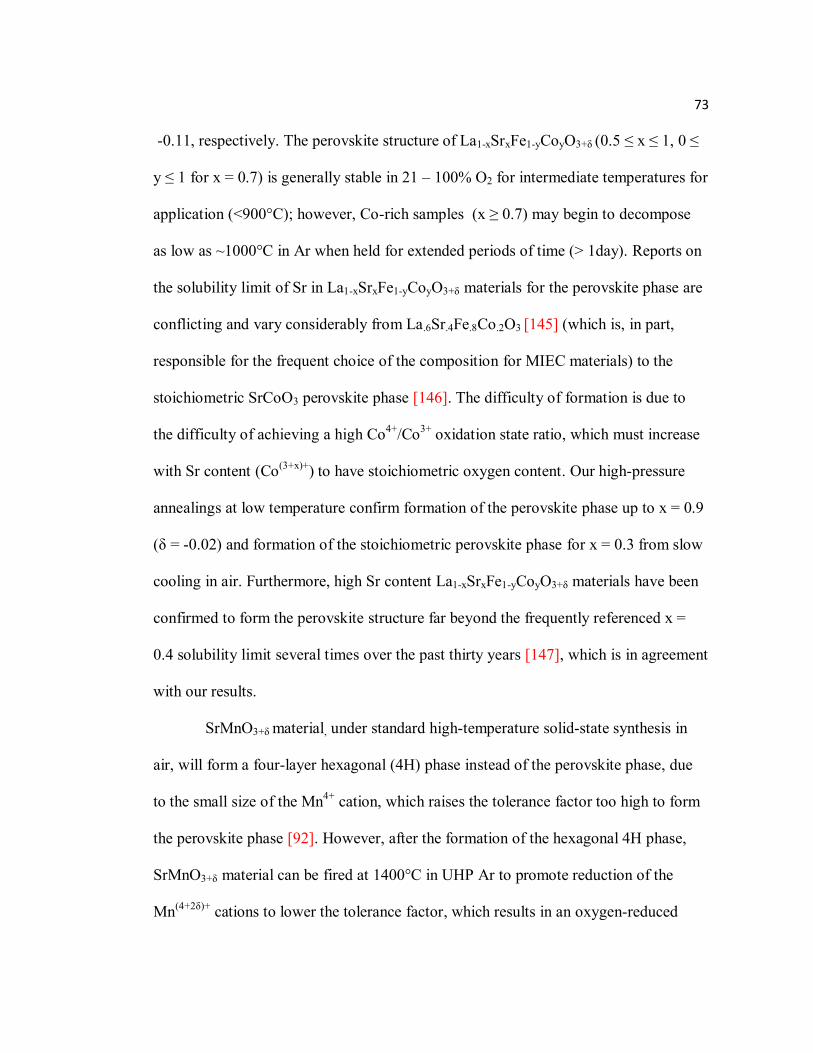
73
-0.11, respectively. The perovskite structure of La1-xSrxFe1-yCoyO3+δ (0.5 ≤ x ≤ 1, 0 ≤
y ≤ 1 for x = 0.7) is generally stable in 21 – 100% O2 for intermediate temperatures for
application (<900°C); however, Co-rich samples (x ≥ 0.7) may begin to decompose
as low as ~1000°C in Ar when held for extended periods of time (> 1day). Reports on
the solubility limit of Sr in La1-xSrxFe1-yCoyO3+δ materials for the perovskite phase are
conflicting and vary considerably from La.6Sr.4Fe.8Co.2O3 [145] (which is, in part,
responsible for the frequent choice of the composition for MIEC materials) to the
stoichiometric SrCoO3 perovskite phase [146]. The difficulty of formation is due to
the difficulty of achieving a high Co4+/Co3+ oxidation state ratio, which must increase
with Sr content (Co(3+x)+) to have stoichiometric oxygen content. Our high-pressure
annealings at low temperature confirm formation of the perovskite phase up to x = 0.9
(δ = -0.02) and formation of the stoichiometric perovskite phase for x = 0.3 from slow
cooling in air. Furthermore, high Sr content La1-xSrxFe1-yCoyO3+δ materials have been
confirmed to form the perovskite structure far beyond the frequently referenced x =
0.4 solubility limit several times over the past thirty years [147], which is in agreement
with our results.
SrMnO3+δ material, under standard high-temperature solid-state synthesis in
air, will form a four-layer hexagonal (4H) phase instead of the perovskite phase, due
to the small size of the Mn4+ cation, which raises the tolerance factor too high to form
the perovskite phase [92]. However, after the formation of the hexagonal 4H phase,
SrMnO3+δ material can be fired at 1400°C in UHP Ar to promote reduction of the
Mn(4+2δ)+ cations to lower the tolerance factor, which results in an oxygen-reduced
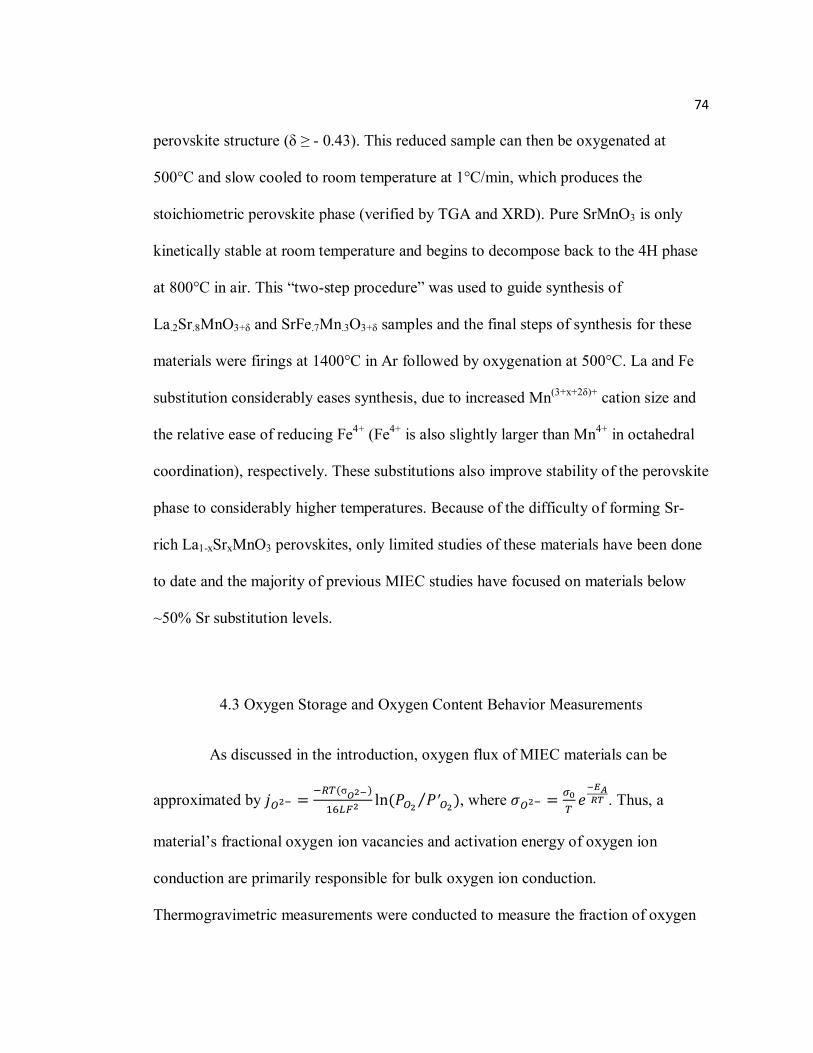
74
perovskite structure (δ ≥ - 0.43). This reduced sample can then be oxygenated at
500°C and slow cooled to room temperature at 1°C/min, which produces the
stoichiometric perovskite phase (verified by TGA and XRD). Pure SrMnO3 is only
kinetically stable at room temperature and begins to decompose back to the 4H phase
at 800°C in air. This “two-step procedure” was used to guide synthesis of
La.2Sr.8MnO3+δ and SrFe.7Mn.3O3+δ samples and the final steps of synthesis for these
materials were firings at 1400°C in Ar followed by oxygenation at 500°C. La and Fe
substitution considerably eases synthesis, due to increased Mn(3+x+2δ)+ cation size and
the relative ease of reducing Fe4+ (Fe4+ is also slightly larger than Mn4+ in octahedral
coordination), respectively. These substitutions also improve stability of the perovskite
phase to considerably higher temperatures. Because of the difficulty of forming Sr-
rich La1-xSrxMnO3 perovskites, only limited studies of these materials have been done
to date and the majority of previous MIEC studies have focused on materials below
~50% Sr substitution levels.
4.3 Oxygen Storage and Oxygen Content Behavior Measurements
As discussed in the introduction, oxygen flux of MIEC materials can be
approximated by σ
, where
. Thus, a
material’s fractional oxygen ion vacancies and activation energy of oxygen ion
conduction are primarily responsible for bulk oxygen ion conduction.
Thermogravimetric measurements were conducted to measure the fraction of oxygen
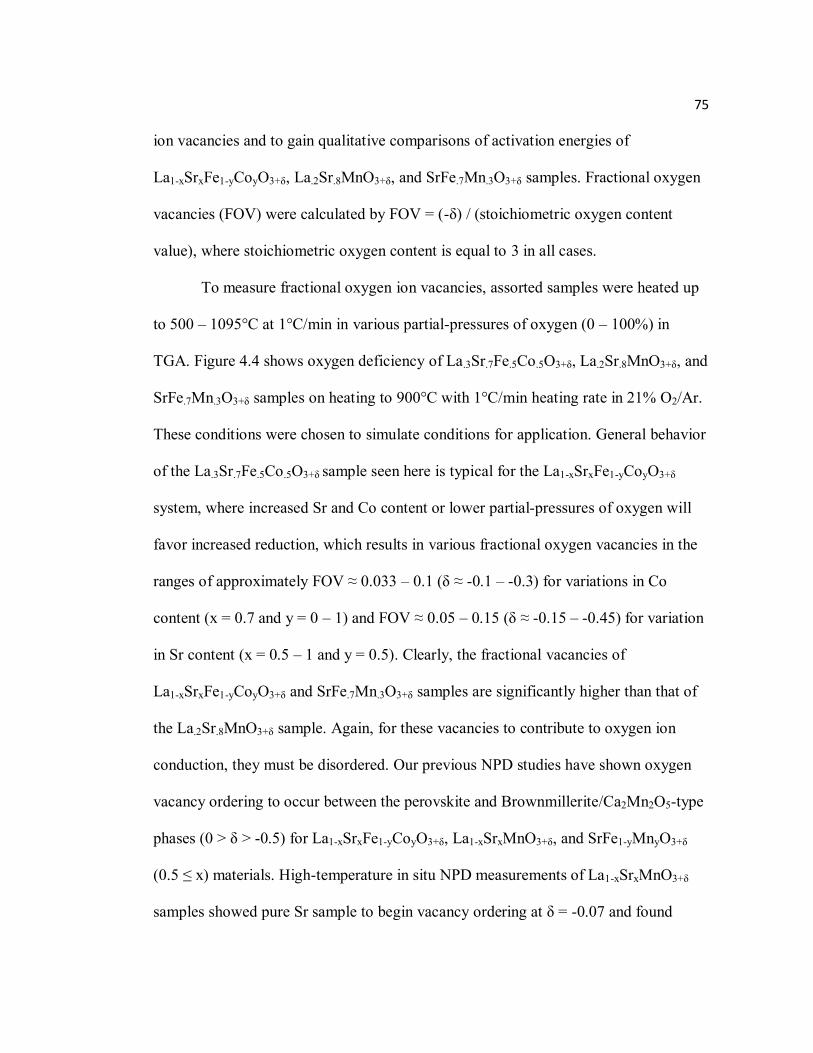
75
ion vacancies and to gain qualitative comparisons of activation energies of
La1-xSrxFe1-yCoyO3+δ, La.2Sr.8MnO3+δ, and SrFe.7Mn.3O3+δ samples. Fractional oxygen
vacancies (FOV) were calculated by FOV = (-δ) / (stoichiometric oxygen content
value), where stoichiometric oxygen content is equal to 3 in all cases.
To measure fractional oxygen ion vacancies, assorted samples were heated up
to 500 – 1095°C at 1°C/min in various partial-pressures of oxygen (0 – 100%) in
TGA. Figure 4.4 shows oxygen deficiency of La.3Sr.7Fe.5Co.5O3+δ, La.2Sr.8MnO3+δ, and
SrFe.7Mn.3O3+δ samples on heating to 900°C with 1°C/min heating rate in 21% O2/Ar.
These conditions were chosen to simulate conditions for application. General behavior
of the La.3Sr.7Fe.5Co.5O3+δ sample seen here is typical for the La1-xSrxFe1-yCoyO3+δ
system, where increased Sr and Co content or lower partial-pressures of oxygen will
favor increased reduction, which results in various fractional oxygen vacancies in the
ranges of approximately FOV ≈ 0.033 – 0.1 (δ ≈ -0.1 – -0.3) for variations in Co
content (x = 0.7 and y = 0 – 1) and FOV ≈ 0.05 – 0.15 (δ ≈ -0.15 – -0.45) for variation
in Sr content (x = 0.5 – 1 and y = 0.5). Clearly, the fractional vacancies of
La1-xSrxFe1-yCoyO3+δ and SrFe.7Mn.3O3+δ samples are significantly higher than that of
the La.2Sr.8MnO3+δ sample. Again, for these vacancies to contribute to oxygen ion
conduction, they must be disordered. Our previous NPD studies have shown oxygen
vacancy ordering to occur between the perovskite and Brownmillerite/Ca2Mn2O5-type
phases (0 > δ > -0.5) for La1-xSrxFe1-yCoyO3+δ, La1-xSrxMnO3+δ, and SrFe1-yMnyO3+δ
(0.5 ≤ x) materials. High-temperature in situ NPD measurements of La1-xSrxMnO3+δ
samples showed pure Sr sample to begin vacancy ordering at δ = -0.07 and found
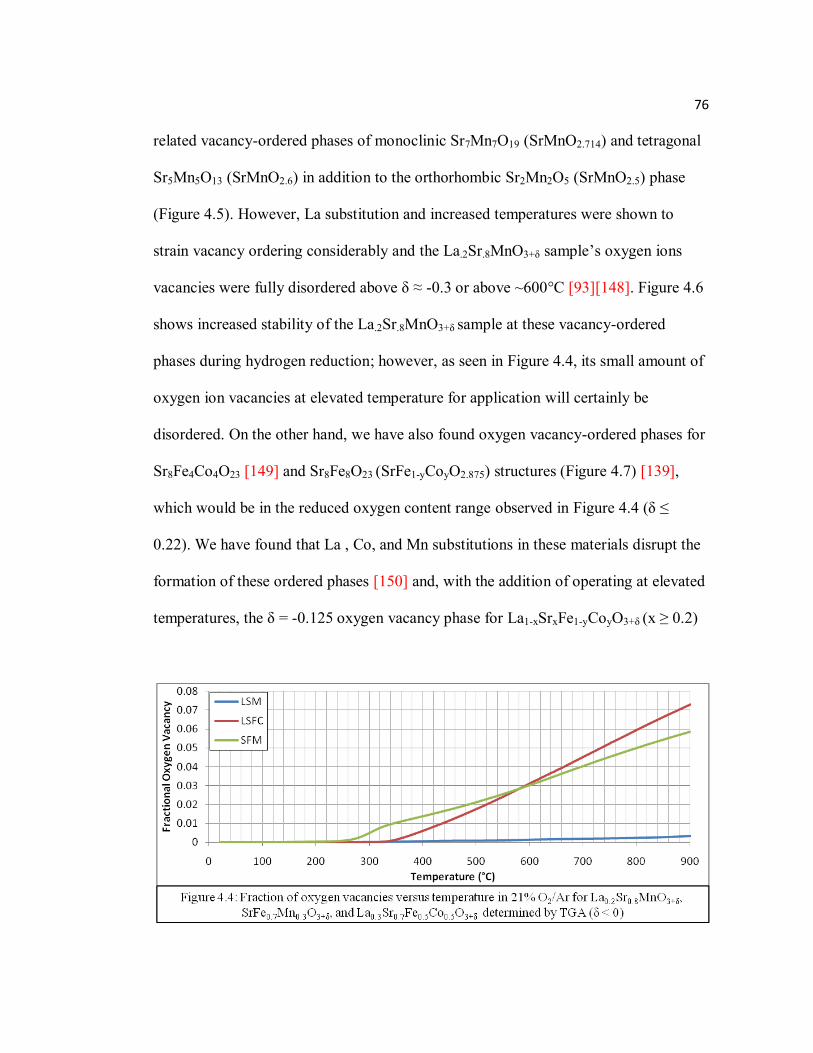
76
related vacancy-ordered phases of monoclinic Sr7Mn7O19 (SrMnO2.714) and tetragonal
Sr5Mn5O13 (SrMnO2.6) in addition to the orthorhombic Sr2Mn2O5 (SrMnO2.5) phase
(Figure 4.5). However, La substitution and increased temperatures were shown to
strain vacancy ordering considerably and the La.2Sr.8MnO3+δ sample’s oxygen ions
vacancies were fully disordered above δ ≈ -0.3 or above ~600°C [93][148]. Figure 4.6
shows increased stability of the La.2Sr.8MnO3+δ sample at these vacancy-ordered
phases during hydrogen reduction; however, as seen in Figure 4.4, its small amount of
oxygen ion vacancies at elevated temperature for application will certainly be
disordered. On the other hand, we have also found oxygen vacancy-ordered phases for
Sr8Fe4Co4O23 [149] and Sr8Fe8O23 (SrFe1-yCoyO2.875) structures (Figure 4.7) [139],
which would be in the reduced oxygen content range observed in Figure 4.4 (δ ≤
0.22). We have found that La , Co, and Mn substitutions in these materials disrupt the
formation of these ordered phases [150] and, with the addition of operating at elevated
temperatures, the δ = -0.125 oxygen vacancy phase for La1-xSrxFe1-yCoyO3+δ (x ≥ 0.2)
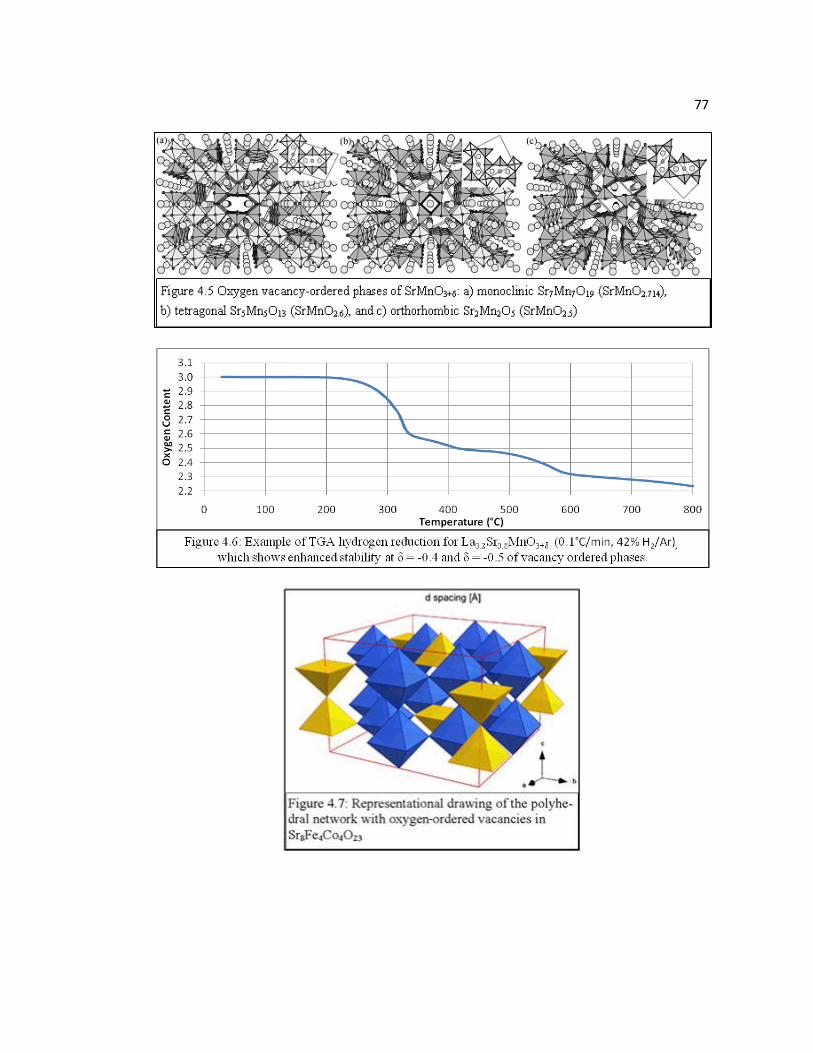
77
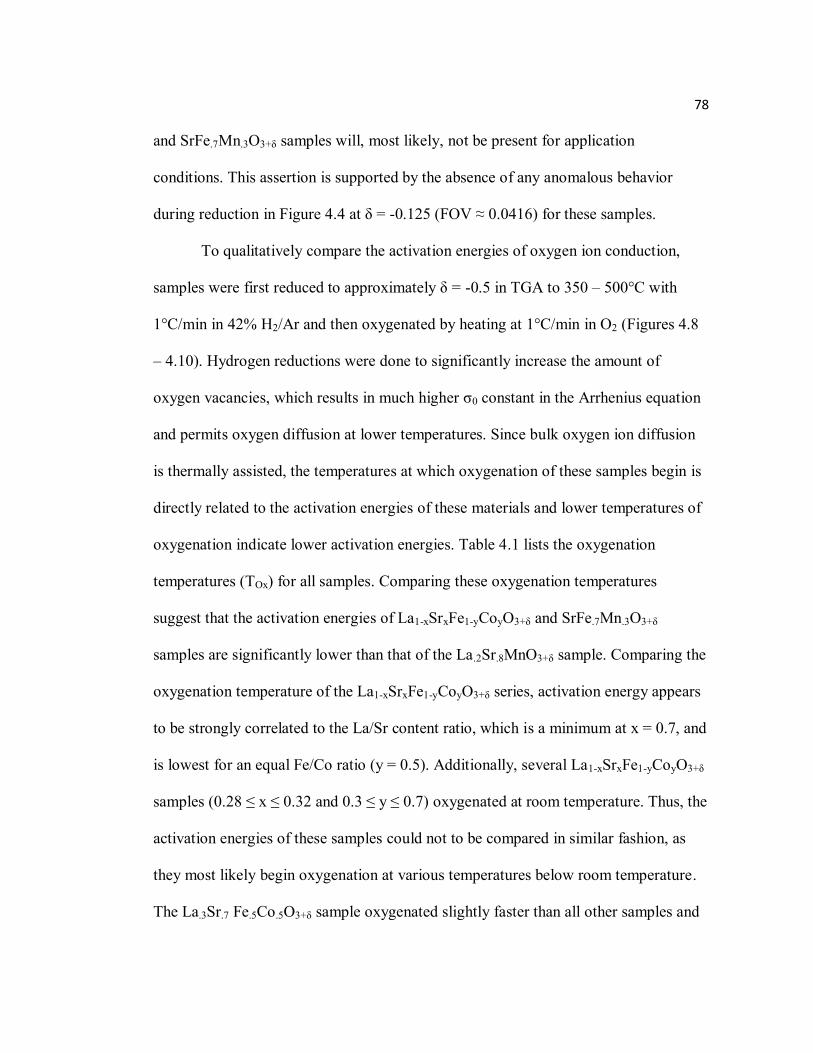
78
and SrFe.7Mn.3O3+δ samples will, most likely, not be present for application
conditions. This assertion is supported by the absence of any anomalous behavior
during reduction in Figure 4.4 at δ = -0.125 (FOV ≈ 0.0416) for these samples.
To qualitatively compare the activation energies of oxygen ion conduction,
samples were first reduced to approximately δ = -0.5 in TGA to 350 – 500°C with
1°C/min in 42% H2/Ar and then oxygenated by heating at 1°C/min in O2 (Figures 4.8
– 4.10). Hydrogen reductions were done to significantly increase the amount of
oxygen vacancies, which results in much higher σ0 constant in the Arrhenius equation
and permits oxygen diffusion at lower temperatures. Since bulk oxygen ion diffusion
is thermally assisted, the temperatures at which oxygenation of these samples begin is
directly related to the activation energies of these materials and lower temperatures of
oxygenation indicate lower activation energies. Table 4.1 lists the oxygenation
temperatures (TOx) for all samples. Comparing these oxygenation temperatures
suggest that the activation energies of La1-xSrxFe1-yCoyO3+δ and SrFe.7Mn.3O3+δ
samples are significantly lower than that of the La.2Sr.8MnO3+δ sample. Comparing the
oxygenation temperature of the La1-xSrxFe1-yCoyO3+δ series, activation energy appears
to be strongly correlated to the La/Sr content ratio, which is a minimum at x = 0.7, and
is lowest for an equal Fe/Co ratio (y = 0.5). Additionally, several La1-xSrxFe1-yCoyO3+δ
samples (0.28 ≤ x ≤ 0.32 and 0.3 ≤ y ≤ 0.7) oxygenated at room temperature. Thus, the
activation energies of these samples could not to be compared in similar fashion, as
they most likely begin oxygenation at various temperatures below room temperature.
The La.3Sr.7 Fe.5Co.5O3+δ sample oxygenated slightly faster than all other samples and
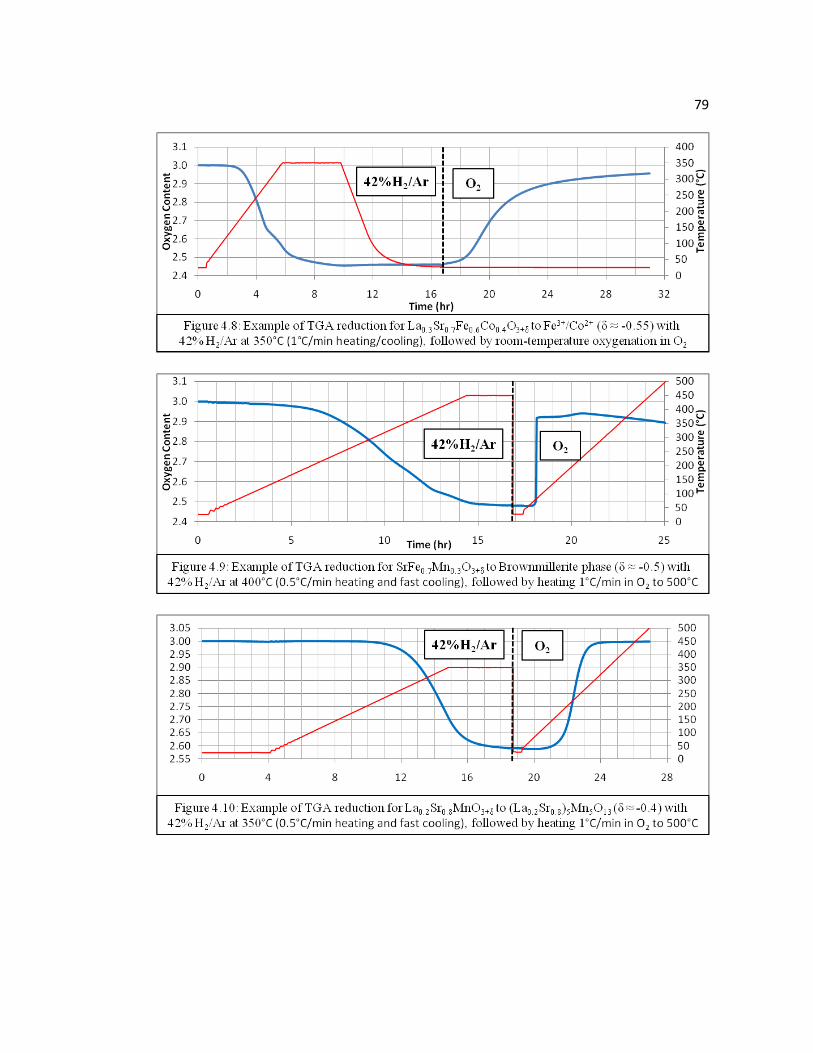
79
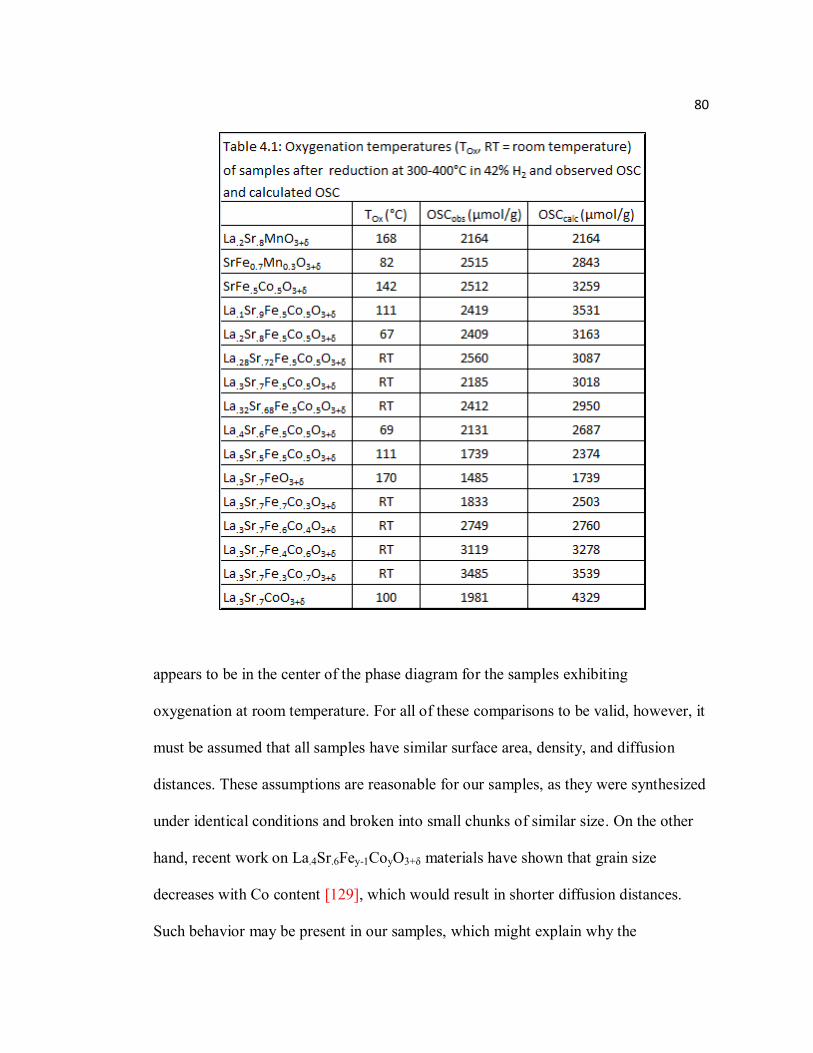
80
appears to be in the center of the phase diagram for the samples exhibiting
oxygenation at room temperature. For all of these comparisons to be valid, however, it
must be assumed that all samples have similar surface area, density, and diffusion
distances. These assumptions are reasonable for our samples, as they were synthesized
under identical conditions and broken into small chunks of similar size. On the other
hand, recent work on La.4Sr.6Fey-1CoyO3+δ materials have shown that grain size
decreases with Co content [129], which would result in shorter diffusion distances.
Such behavior may be present in our samples, which might explain why the
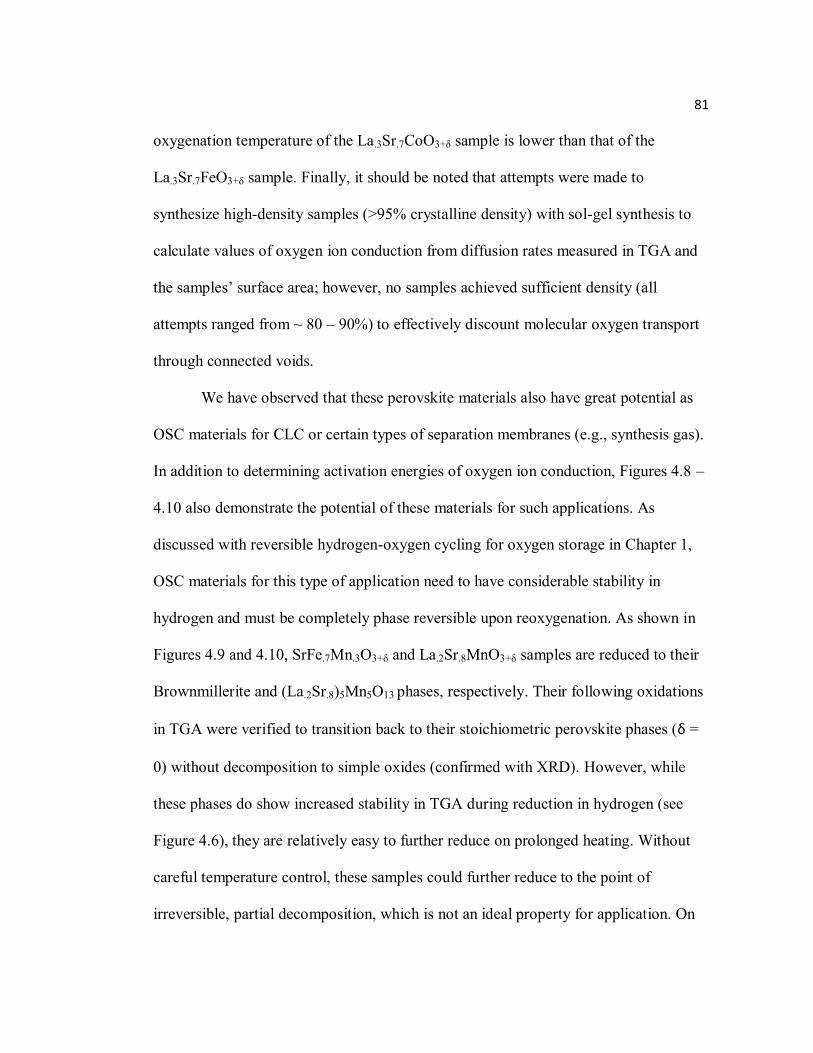
81
oxygenation temperature of the La.3Sr.7CoO3+δ sample is lower than that of the
La.3Sr.7FeO3+δ sample. Finally, it should be noted that attempts were made to
synthesize high-density samples (>95% crystalline density) with sol-gel synthesis to
calculate values of oxygen ion conduction from diffusion rates measured in TGA and
the samples’ surface area; however, no samples achieved sufficient density (all
attempts ranged from ~ 80 – 90%) to effectively discount molecular oxygen transport
through connected voids.
We have observed that these perovskite materials also have great potential as
OSC materials for CLC or certain types of separation membranes (e.g., synthesis gas).
In addition to determining activation energies of oxygen ion conduction, Figures 4.8 –
4.10 also demonstrate the potential of these materials for such applications. As
discussed with reversible hydrogen-oxygen cycling for oxygen storage in Chapter 1,
OSC materials for this type of application need to have considerable stability in
hydrogen and must be completely phase reversible upon reoxygenation. As shown in
Figures 4.9 and 4.10, SrFe.7Mn.3O3+δ and La.2Sr.8MnO3+δ samples are reduced to their
Brownmillerite and (La.2Sr.8)5Mn5O13 phases, respectively. Their following oxidations
in TGA were verified to transition back to their stoichiometric perovskite phases (δ =
0) without decomposition to simple oxides (confirmed with XRD). However, while
these phases do show increased stability in TGA during reduction in hydrogen (see
Figure 4.6), they are relatively easy to further reduce on prolonged heating. Without
careful temperature control, these samples could further reduce to the point of
irreversible, partial decomposition, which is not an ideal property for application. On
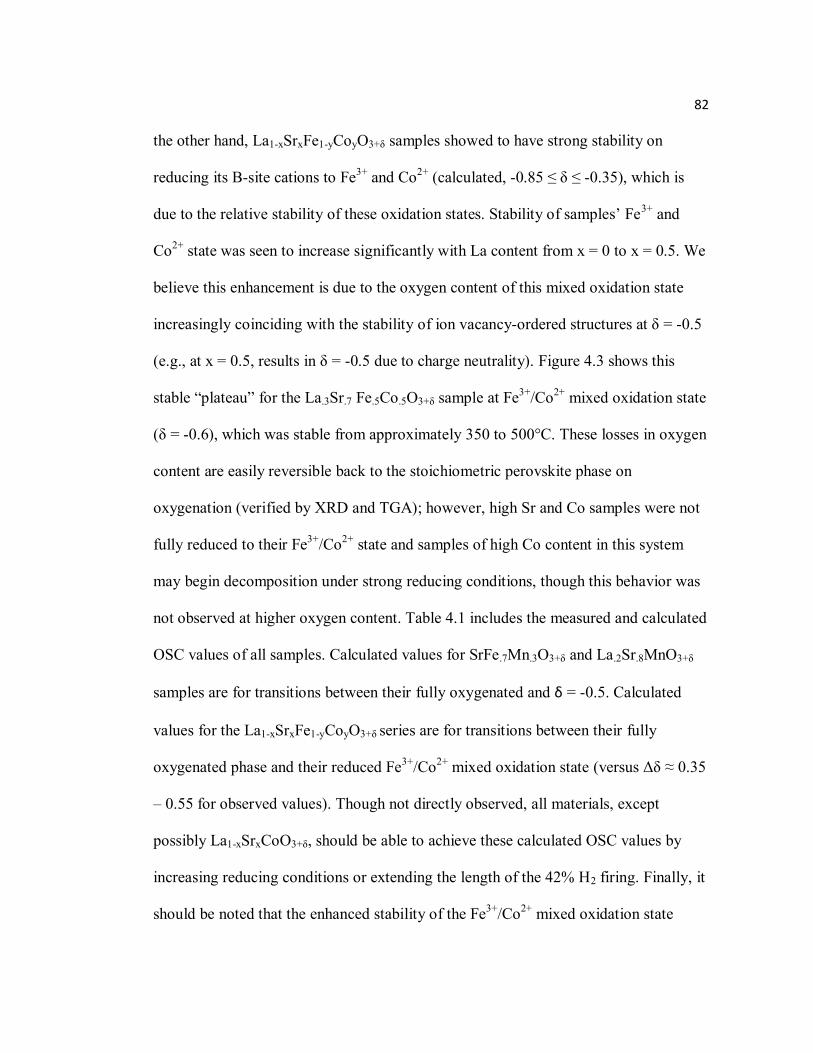
82
the other hand, La1-xSrxFe1-yCoyO3+δ samples showed to have strong stability on
reducing its B-site cations to Fe3+ and Co2+ (calculated, -0.85 ≤ δ ≤ -0.35), which is
due to the relative stability of these oxidation states. Stability of samples’ Fe3+ and
Co2+ state was seen to increase significantly with La content from x = 0 to x = 0.5. We
believe this enhancement is due to the oxygen content of this mixed oxidation state
increasingly coinciding with the stability of ion vacancy-ordered structures at δ = -0.5
(e.g., at x = 0.5, results in δ = -0.5 due to charge neutrality). Figure 4.3 shows this
stable “plateau” for the La.3Sr.7 Fe.5Co.5O3+δ sample at Fe3+/Co2+ mixed oxidation state
(δ = -0.6), which was stable from approximately 350 to 500°C. These losses in oxygen
content are easily reversible back to the stoichiometric perovskite phase on
oxygenation (verified by XRD and TGA); however, high Sr and Co samples were not
fully reduced to their Fe3+/Co2+ state and samples of high Co content in this system
may begin decomposition under strong reducing conditions, though this behavior was
not observed at higher oxygen content. Table 4.1 includes the measured and calculated
OSC values of all samples. Calculated values for SrFe.7Mn.3O3+δ and La.2Sr.8MnO3+δ
samples are for transitions between their fully oxygenated and δ = -0.5. Calculated
values for the La1-xSrxFe1-yCoyO3+δ series are for transitions between their fully
oxygenated phase and their reduced Fe3+/Co2+ mixed oxidation state (versus Δδ ≈ 0.35
– 0.55 for observed values). Though not directly observed, all materials, except
possibly La1-xSrxCoO3+δ, should be able to achieve these calculated OSC values by
increasing reducing conditions or extending the length of the 42% H2 firing. Finally, it
should be noted that the enhanced stability of the Fe3+/Co2+ mixed oxidation state
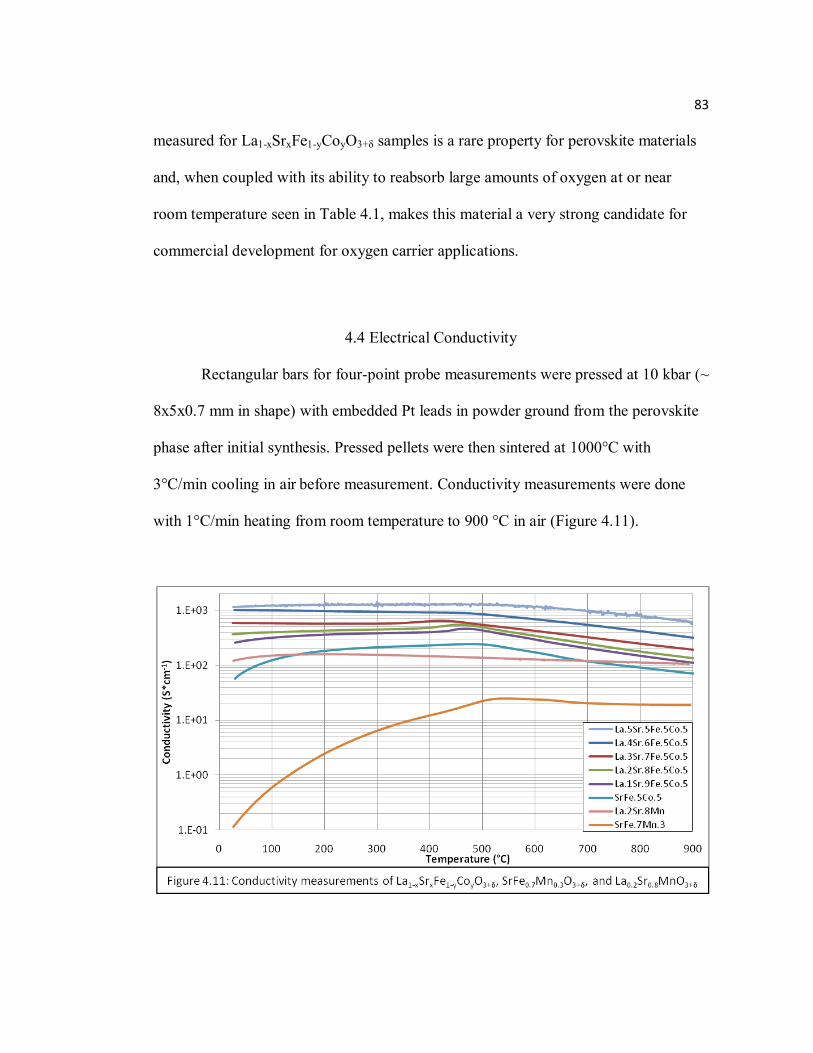
83
measured for La1-xSrxFe1-yCoyO3+δ samples is a rare property for perovskite materials
and, when coupled with its ability to reabsorb large amounts of oxygen at or near
room temperature seen in Table 4.1, makes this material a very strong candidate for
commercial development for oxygen carrier applications.
4.4 Electrical Conductivity
Rectangular bars for four-point probe measurements were pressed at 10 kbar (~
8x5x0.7 mm in shape) with embedded Pt leads in powder ground from the perovskite
phase after initial synthesis. Pressed pellets were then sintered at 1000°C with
3°C/min cooling in air before measurement. Conductivity measurements were done
with 1°C/min heating from room temperature to 900 °C in air (Figure 4.11).
84
As discussed in the introduction, the root causes of the temperature
dependence of La1-xSrxMO3+δ (M = Mn, Fe, and Co) materials’ conductivity are
extremely complex. Thus, the primary purpose of this section is to experimentally
compare the electrical conductivities of La1-xSrxFe.5Co.5O3+δ (x = 0, 0.1, 0.2, 0.3, 0.4,
and 0.5), La.2Sr.8MnO3+δ, and SrFe.7Mn.3 O3+δ samples with one another and with
previous reports of commonly cited MIEC materials. Activation energies of electrical
conduction were also attempted to be calculated based on small polaron conduction,
, which has been frequently used to model these systems as discussed in
the introduction. However, as will be shown, this model clearly fails for several
La1-xSrxFe.5Co.5O3+δ samples as these compositions become increasingly metallic with
La content.
La1-xSrxFe.5Co.5O3+δ samples were found to have higher conductivity, ranging
from ~200 – 1300 S/cm at 500°C with increased La content, compared to
La.2Sr.8MnO3+δ and SrFe.7Mn.3 O3+δ samples, which were found to be ~140 and 25
S/cm at 500°C, respectively. Previous reports of La1-xSrxFe1-yCoyO3+δ materials (0 ≤ x
≤ 0.4), when compared, show conductivity to generally increase with Sr content
[129][130][145][151] and reported conductivities of ~240 and 650 S/cm at 500°C for
La.8Sr.2Fe.5Co.5O3+δ and La.6Sr.4Fe.5Co.5O3+δ samples, respectively. Thus, the
maximum conductivity for the La1-xSrxFe.5Co.5O3+δ series appears to be at x ≈ 0.5,
which is in agreement with the ideal carrier concentration of a mixed 50/50 - 4+/3+
cation valance (for δ = 0) for polaron hopping and is also in agreement with a previous
report of the La1-xSrxFeO3+δ system [121]. Yet Sr-rich samples have increased oxygen
85
non-stoichiometry at elevated temperatures (e.g., x = 0.9 and 1 have oxygen
deficiencies of δ ≈ 0.35 and 0.45, respectively, at 900°C in 21% O2/Ar) which will
result in significant reduction of the 4+/3+ oxidation state below a one to one ratio.
Any such reduced samples should lower conductivity based on carrier concentration.
Thus, the high conductivity of Sr-rich versus La-rich samples suggests that other
mechanisms are enhancing the conductivity of x > 0.5 samples. Our previous NDP
studies of La1-xSrxFe.5Co.5O3+δ materials (0.5 ≤ x ≤ 1) have shown the system to
become increasingly cubic with Fe/Co-O-Fe/Co bond angles approaching 180° with
increased Sr content [149]. These structural changes may account for the increased
conductivity of Sr-rich samples, due to increased 3d-2p overlap, versus La-rich
samples with distorted perovskite phases of similar or increased carrier concentration.
Figure 4.12 shows conductivity data for all materials fitted with
based on small polaron conduction. Activation energies of these materials were
determined by the slope of this fit and are compared with common materials for MIEC
related applications in Table 4.2. La1-xSrxFe.5Co.5O3+δ samples (0.5 ≤ x ≤ 1) showed
decreasing activation energies up to x = 0.6 and slight increases from x = 0.6 to x =
1.0 (ranging 3.16 – 9.49 kJ/mol), which were notably lower than samples previously
reported with high La content and with similar Fe/Co ratio. However, it is clear on
inspection of Figure 4.11 that the conductivity of La1-xSrxFe.5Co.5O3+δ samples became
increasingly metallic in behavior with increased La content. This may be due to their
higher conductivities, and the activation energies for these samples may be less
accurate with increased La content. For the SrFe1-yMnyO3+δ system (0.1 ≤ y ≤ 1),
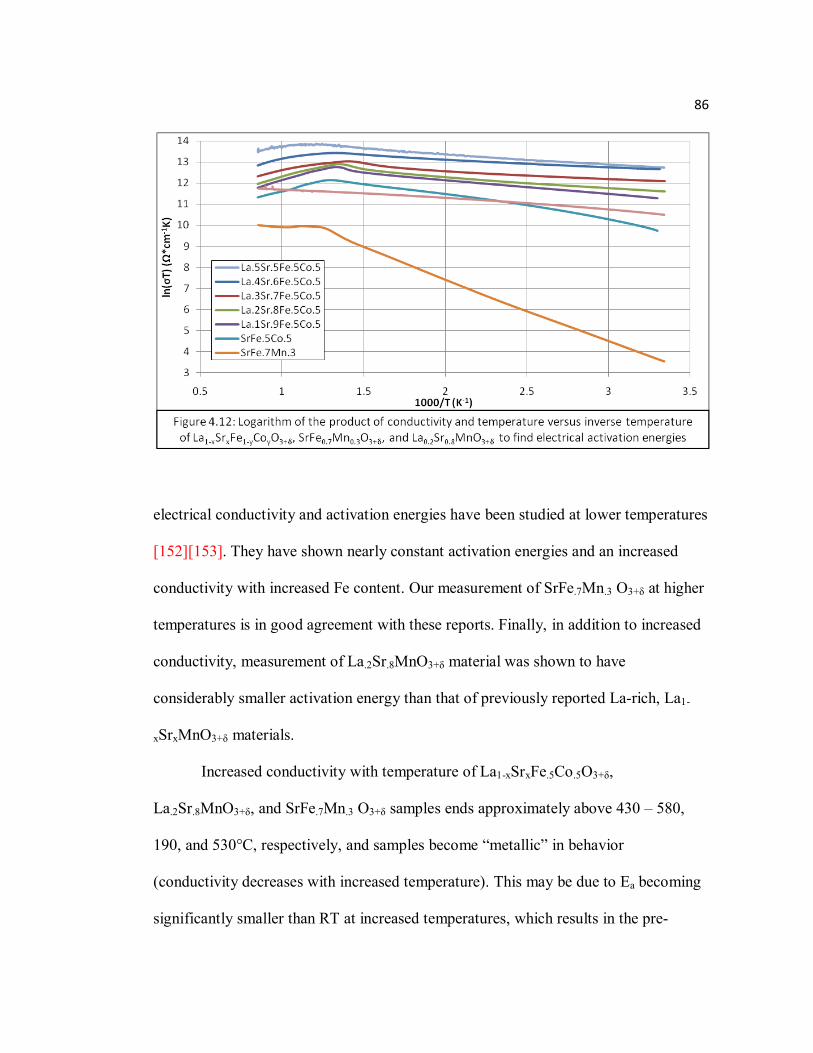
86
electrical conductivity and activation energies have been studied at lower temperatures
[152][153]. They have shown nearly constant activation energies and an increased
conductivity with increased Fe content. Our measurement of SrFe.7Mn.3 O3+δ at higher
temperatures is in good agreement with these reports. Finally, in addition to increased
conductivity, measurement of La.2Sr.8MnO3+δ material was shown to have
considerably smaller activation energy than that of previously reported La-rich, La1-
xSrxMnO3+δ materials.
Increased conductivity with temperature of La1-xSrxFe.5Co.5O3+δ,
La.2Sr.8MnO3+δ, and SrFe.7Mn.3 O3+δ samples ends approximately above 430 – 580,
190, and 530°C, respectively, and samples become “metallic” in behavior
(conductivity decreases with increased temperature). This may be due to Ea becoming
significantly smaller than RT at increased temperatures, which results in the pre-
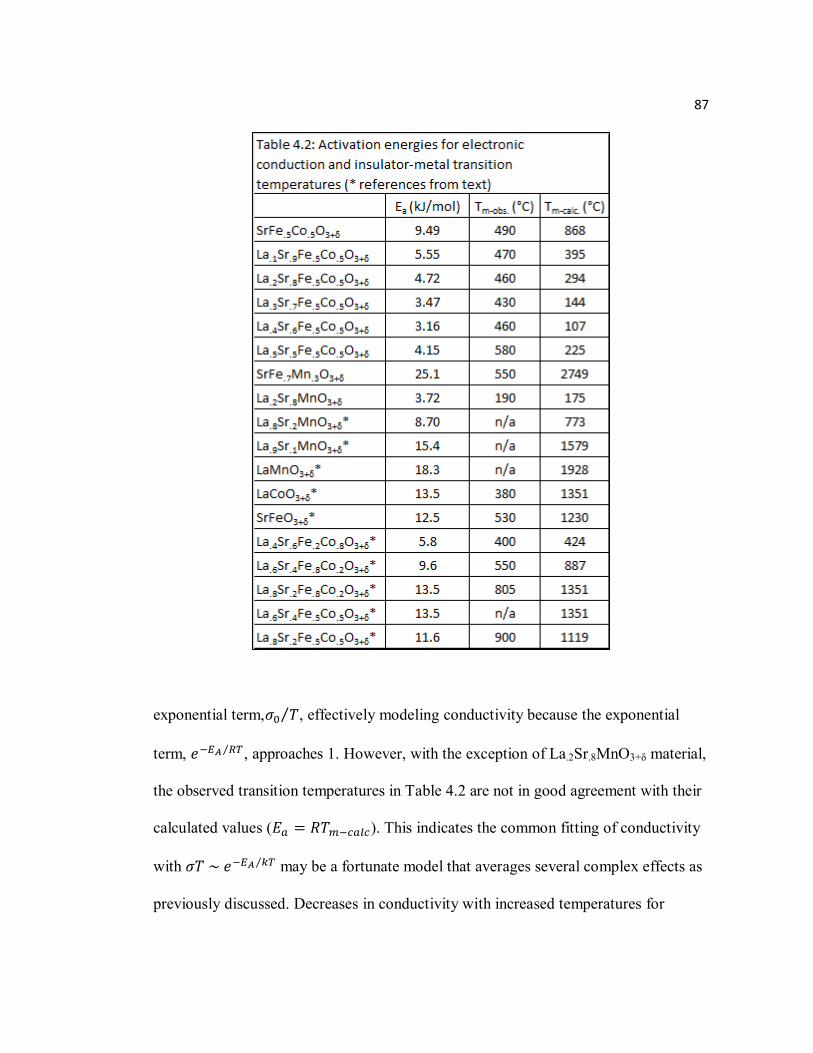
87
exponential term, , effectively modeling conductivity because the exponential
term, , approaches 1. However, with the exception of La.2Sr.8MnO3+δ material,
the observed transition temperatures in Table 4.2 are not in good agreement with their
calculated values ( ). This indicates the common fitting of conductivity
with may be a fortunate model that averages several complex effects as
previously discussed. Decreases in conductivity with increased temperatures for
88
SrFeO3+δ material have been attributed to increased oxygen vacancies, which results in
a lower 4+/3+ oxidation state ratio [154]. Another possible mechanism of this
transition could be associated with spin transitions or magnetic ordering. Such
transition has been observed in LaCoO3, which is very similar in nature and
temperature to the change in the temperature dependence of conductivity seen in
Figure 4.11 for La1-xSrxFe.5Co.5O3+δ and SrFe.7Mn.3 O3+δ samples. This transition, at
380°C for LaCoO3 changes from thermally assisted semiconductor to thermally
impeded metallic behavior (noting there is no “jump” in conductivity as seen, for
example, with metal-insulator transitions for RMnO3 perovskites) is due to changes in
spin state that results from an ordered array of alternating high-spin (S = 2) and
intermediate-spin (S = 1) states of Co3+ [155]. Though the mechanism for thermal
conduction is different for undoped LaCoO3 (semiconducting), any such ordering
would also interfere with hole-doped polaron-assisted conduction. However, doping
LaCoO3 with Sr has shown to significantly complicate the spin structure at elevated
temperatures, due to the addition of mixed spin states and possible disproportionation
of Co3+, and continues to be an active area of debate [156]–[158]. The further addition
of Fe substitutions to this system naturally results in La1-xSrxFe.5Co.5O3+δ having
extremely complex high-temperature transport properties. Thus, the failure of thermal-
assisted behavior for SrFe.5Co.5O3+δ and SrFe.7Mn.3 O3+δ at 430 – 580°C may be
attributed to magnetic ordering due to spin-state transitions as seen with LaCoO3,
properties related to increased oxygen vacancies as seen in SrFeO3+δ or other changes
at elevated temperatures such as charge localization, band filling associated with a
89
spin transition, structural changes, etc. The disproportionation of Co3+, as discussed in
the introduction, may enhance conductivity and could possibly result in Tm-obs being
slightly greater than Tm-calc.
Deviation of La1-xSrxFe.5Co.5O3+δ (x = 0.2 – 0.5) samples from
behavior is interesting, as other studies with La-rich samples (x = 0.2 and y = 0 – 1,
and x = 0 – 0.4 and y = 0.2) have been shown to have reasonable agreement with this
model (though not with much justification) [130][145]. Clearly, Sr substitution in the
range of 0.5 ≤ x ≤ 0.8 has a strong impact on the temperature dependence of
conductivity. Conductivity data was also attempted to be fitted with
based on semiconducting (n = 0) and non-adiabatic polar hopping (n = 3/2); however,
these attempts yielded slightly worse linear fits and stronger disagreement of Tm-obs
and Tm-calc by comparison with the n = 1 case. It would seem the temperature behavior
of conductivity in these samples is on the cusp of metallic and semiconducting
behavior. Ultimately, however, the high electrical conductivity of Sr-rich samples at
elevated temperature is the most important property for application, no matter how
thermal conductivity is chosen to be modeled. Figure 4.11 gives a clear comparison of
conductivities at elevated temperatures of all samples for possible application.
4.5 Total Ionic Conductivity
Activation energies of total ionic conductivity of selected samples deposited on
YSZ were determined by EIS measurements by fabricating half and full cells, which
are common methods to test electrodes for separation membranes or for cathode
90
materials for SOFC applications. La.3Sr.7Fe.5Co.5O3+δ sample was chosen for EIS
measurements based on its relatively high electrical conductivity and TGA
measurements, which suggests it may have the system’s highest oxygen ion
conductivity. The methodologies of conducting half-cell measurements were largely a
continuation of former group member Stillwell’s M.S. thesis project [159]. Data from
this work for half cells with La.2Sr.8MnO3+δ and SrFe.7Mn.3O3+δ cathodes are compared
to these cells re-measured (in addition to La.3Sr.7Fe.5Co.5O3+δ) with the following
attempted improvements: sample inks were screen printed instead of drop evaporated
or brush painted, which created more uniform film thickness and planarity; the
addition of a thin spray-evaporated Ce.8Gd.2O2+δ (20CGO, δ < 0) buffer layer to
prevent Sr reactivity with YSZ, which were observed to have high reactivity in
stability experiments; replacing 8YSZ with 3YSZ electrolyte, to increase TEC of the
electrolyte to match higher TEC of samples (see Section 4.6); and the addition of a
Faraday cage around electrodes and the repositioning of electrode leads, which
significantly reduced signal noise observed in previous data. In addition to half-cell
measurements, La.3Sr.7Fe.5Co.5O3+δ material was also prepared as a full cell to function
as an operational SOFC. Prefabricated NiO-backed 3YSZ (0.55 mm thickness) was
first coated with a thin layer of CGO, which was deposited by spray evaporation at
~250°C and then sintered at 1000°C for 12 hours. La.3Sr.7Fe.5Co.5O3+δ material
suspended in ethanol/zirconia (ink) was screen printed on top of the CGO buffer layer
and then sintered again at 900°C for 12 hours. The cell was then secured between two
alumina cylindrical enclosures with alumina paste and high-temperature epoxy, which
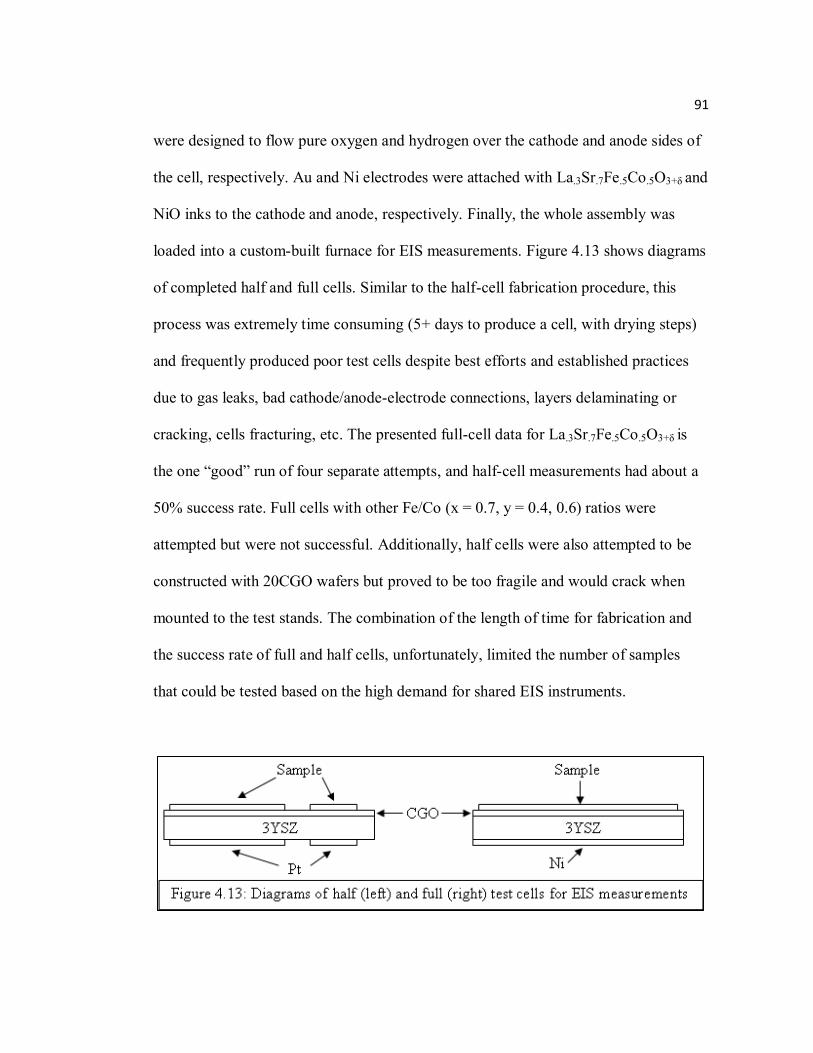
91
were designed to flow pure oxygen and hydrogen over the cathode and anode sides of
the cell, respectively. Au and Ni electrodes were attached with La.3Sr.7Fe.5Co.5O3+δ and
NiO inks to the cathode and anode, respectively. Finally, the whole assembly was
loaded into a custom-built furnace for EIS measurements. Figure 4.13 shows diagrams
of completed half and full cells. Similar to the half-cell fabrication procedure, this
process was extremely time consuming (5+ days to produce a cell, with drying steps)
and frequently produced poor test cells despite best efforts and established practices
due to gas leaks, bad cathode/anode-electrode connections, layers delaminating or
cracking, cells fracturing, etc. The presented full-cell data for La.3Sr.7Fe.5Co.5O3+δ is
the one “good” run of four separate attempts, and half-cell measurements had about a
50% success rate. Full cells with other Fe/Co (x = 0.7, y = 0.4, 0.6) ratios were
attempted but were not successful. Additionally, half cells were also attempted to be
constructed with 20CGO wafers but proved to be too fragile and would crack when
mounted to the test stands. The combination of the length of time for fabrication and
the success rate of full and half cells, unfortunately, limited the number of samples
that could be tested based on the high demand for shared EIS instruments.
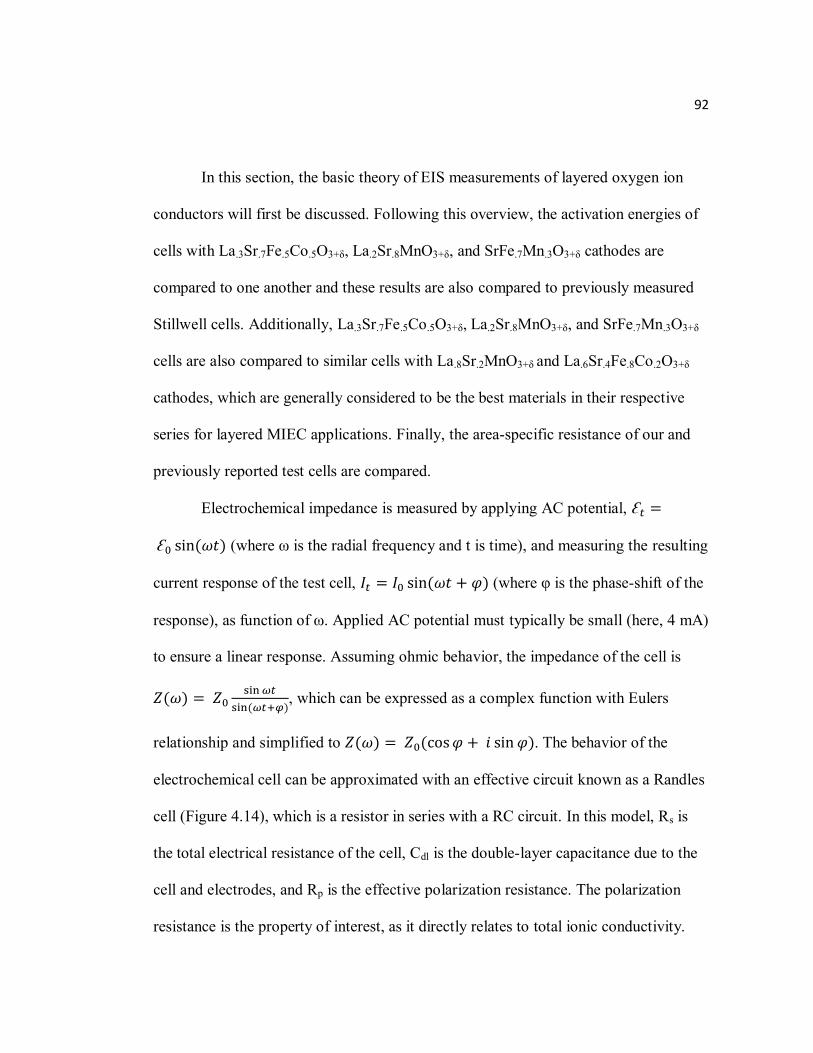
92
In this section, the basic theory of EIS measurements of layered oxygen ion
conductors will first be discussed. Following this overview, the activation energies of
cells with La.3Sr.7Fe.5Co.5O3+δ, La.2Sr.8MnO3+δ, and SrFe.7Mn.3O3+δ cathodes are
compared to one another and these results are also compared to previously measured
Stillwell cells. Additionally, La.3Sr.7Fe.5Co.5O3+δ, La.2Sr.8MnO3+δ, and SrFe.7Mn.3O3+δ
cells are also compared to similar cells with La.8Sr.2MnO3+δ and La.6Sr.4Fe.8Co.2O3+δ
cathodes, which are generally considered to be the best materials in their respective
series for layered MIEC applications. Finally, the area-specific resistance of our and
previously reported test cells are compared.
Electrochemical impedance is measured by applying AC potential,
(where ω is the radial frequency and t is time), and measuring the resulting
current response of the test cell, (where φ is the phase-shift of the
response), as function of ω. Applied AC potential must typically be small (here, 4 mA)
to ensure a linear response. Assuming ohmic behavior, the impedance of the cell is
, which can be expressed as a complex function with Eulers
relationship and simplified to . The behavior of the
electrochemical cell can be approximated with an effective circuit known as a Randles
cell (Figure 4.14), which is a resistor in series with a RC circuit. In this model, Rs is
the total electrical resistance of the cell, Cdl is the double-layer capacitance due to the
cell and electrodes, and Rp is the effective polarization resistance. The polarization
resistance is the property of interest, as it directly relates to total ionic conductivity.
93
Using this model and the derived expression for Z(ω), Zo (Rp is equivalent to Z0) can
be easily determined by plotting the real and complex impedance of the cell
(commonly referred to as a Nyquist plot). The effective diameter of the circular
response impedance yields the value of Z0. This parameter is typically multiplied by
the area of the active electrode (because the result is independent of electrode size)
and is referred to as the area-specific resistance (ASR) of the cell. The ASR is
inversely proportional to the Arrhenius relation: (where C is an arbitrary
constant). Thus, by plotting the natural log of ASR versus inverse temperature
(
), which is frequently called an Arrhenius plot, the
activation energy of the cell can be found by multiplying the slope of this line by the
gas constant R. Arrhenius plots are also useful for observing changes to the ideal
Arrhenius model (nonlinear behavior) and to quickly compare activation energies of
multiple materials. ASR is also an important Figure of merit for SOFC applications,
and should be less than 0.5 ohm*cm2 to achieve the common benchmark goal of
1kW/kg [160].
EIS half- and full-cell measurements were made at approximately 500 – 900°C
at 50 – 100°C intervals. Figure 4.15 is an example of a Nyquist plot for a “good” half
cell with La.3Sr.7Fe.5Co.5O3+δ material, which displays Randles cell-type behavior, and
is representative of the data collected for “good” cells. The resulting Arrhenius plots
for half-cell measurements with La.3Sr.7Fe.5Co.5O3+δ, La.2Sr.8MnO3+δ, and
SrFe.7Mn.3O3+δ cathodes and the full-cell measurement with La.3Sr.7Fe.5Co.5O3+δ
94
cathode are shown in Figure 4.16. Calculated activation energies from Arrhenius plots
are shown in Table 4.3. Activation energies decreased, in the order of largest to
smallest, for SrFe.7Mn.3O3+δ (128 kJ/mol), La.2Sr.8MnO3+δ (124 kJ/mol), and
La.3Sr.7Fe.5Co.5O3+δ (85.1 kJ/mol) half cells and ASR values were also observed to
decrease in the same order. The activation energy of the full-cell measurement of
La.3Sr.7Fe.5Co.5O3+δ is in good agreement with its half-cell measurement. Its increase
in ASR, seen in Figure 4.16, is mostly likely due to the full cell’s significantly larger
thickness than the half cell. The value of total ionic conductivity of
La.3Sr.7Fe.5Co.5O3+δ in comparison with the other two samples is in agreement with its
excepted lower value based on its comparative lower electronic conductivity and its
qualitative lower oxygen ion conduction determined from four-point probe and TGA
measurements, respectively. Furthermore, upon comparing the total ionic conductivity
of SrFe.7Mn.3O3+δ and La.2Sr.8MnO3+δ cells, their close values are not surprising due to
the higher electrical conductivity of La.2Sr.8MnO3+δ (and its better TEC match with
20CGO and 3YSZ; see next section) and the implied, higher oxygen ion conductivity
of SrFe.7Mn.3O3+δ.
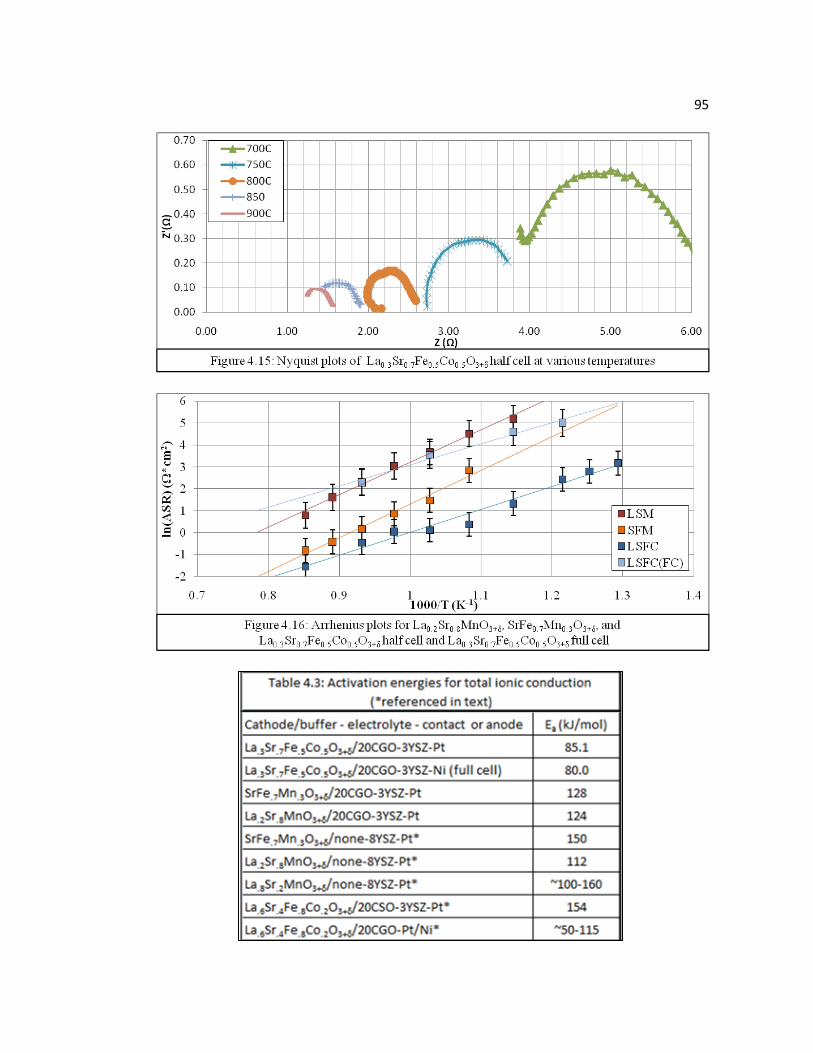
95
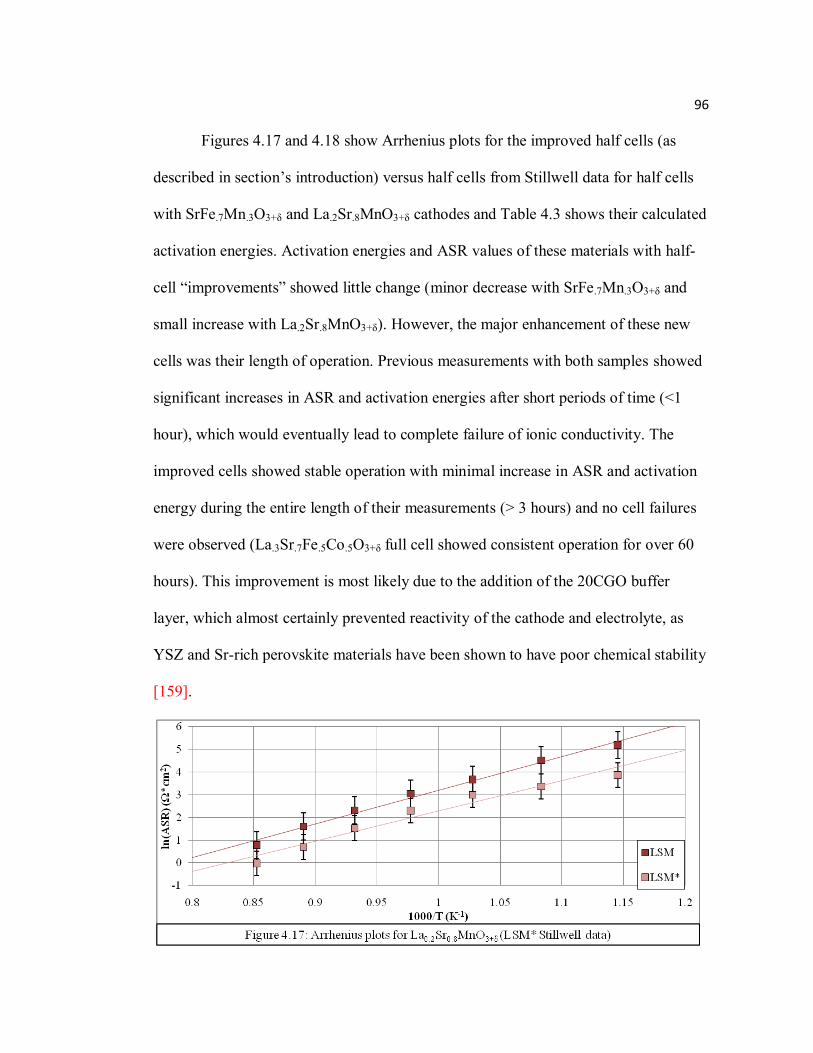
96
Figures 4.17 and 4.18 show Arrhenius plots for the improved half cells (as
described in section’s introduction) versus half cells from Stillwell data for half cells
with SrFe.7Mn.3O3+δ and La.2Sr.8MnO3+δ cathodes and Table 4.3 shows their calculated
activation energies. Activation energies and ASR values of these materials with half-
cell “improvements” showed little change (minor decrease with SrFe.7Mn.3O3+δ and
small increase with La.2Sr.8MnO3+δ). However, the major enhancement of these new
cells was their length of operation. Previous measurements with both samples showed
significant increases in ASR and activation energies after short periods of time (<1
hour), which would eventually lead to complete failure of ionic conductivity. The
improved cells showed stable operation with minimal increase in ASR and activation
energy during the entire length of their measurements (> 3 hours) and no cell failures
were observed (La.3Sr.7Fe.5Co.5O3+δ full cell showed consistent operation for over 60
hours). This improvement is most likely due to the addition of the 20CGO buffer
layer, which almost certainly prevented reactivity of the cathode and electrolyte, as
YSZ and Sr-rich perovskite materials have been shown to have poor chemical stability
[159].
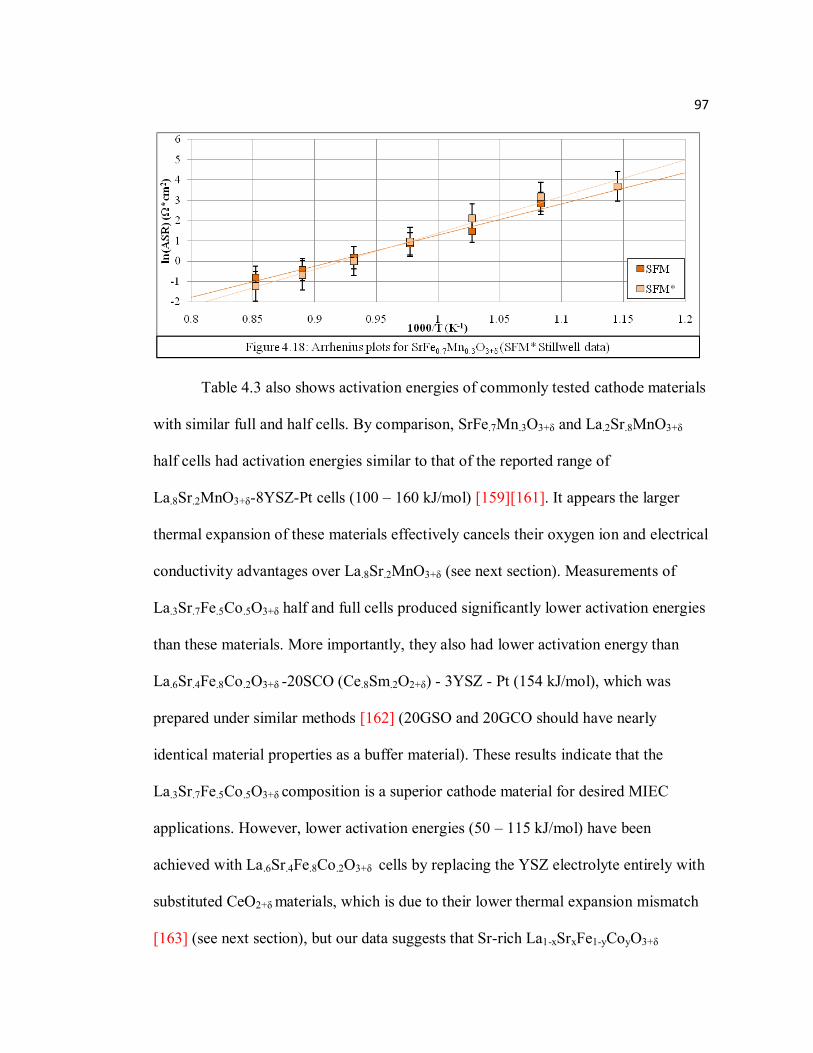
97
Table 4.3 also shows activation energies of commonly tested cathode materials
with similar full and half cells. By comparison, SrFe.7Mn.3O3+δ and La.2Sr.8MnO3+δ
half cells had activation energies similar to that of the reported range of
La.8Sr.2MnO3+δ-8YSZ-Pt cells (100 – 160 kJ/mol) [159][161]. It appears the larger
thermal expansion of these materials effectively cancels their oxygen ion and electrical
conductivity advantages over La.8Sr.2MnO3+δ (see next section). Measurements of
La.3Sr.7Fe.5Co.5O3+δ half and full cells produced significantly lower activation energies
than these materials. More importantly, they also had lower activation energy than
La.6Sr.4Fe.8Co.2O3+δ -20SCO (Ce.8Sm.2O2+δ) - 3YSZ - Pt (154 kJ/mol), which was
prepared under similar methods [162] (20GSO and 20GCO should have nearly
identical material properties as a buffer material). These results indicate that the
La.3Sr.7Fe.5Co.5O3+δ composition is a superior cathode material for desired MIEC
applications. However, lower activation energies (50 – 115 kJ/mol) have been
achieved with La.6Sr.4Fe.8Co.2O3+δ cells by replacing the YSZ electrolyte entirely with
substituted CeO2+δ materials, which is due to their lower thermal expansion mismatch
[163] (see next section), but our data suggests that Sr-rich La1-xSrxFe1-yCoyO3+δ
98
cathodes in similar cells could have even lower activation energies with such
electrolytes.
Despite having improved or similar activation energies, the observed ASR
values of our cells are much higher than previous reports of various test cells with
La.8Sr.2MnO3+δ and La.6Sr.4Fe.8Co.2O3+δ materials. Our lowest measurement of ASR
was 0.21 Ω*cm2 at 900°C with a La.3Sr.7Fe.5Co.5O3+δ half cell. Similar ASR values
have been achieved with La.6Sr.4Fe.8Co.2O3+δ -20GCO -20ScSZ (20% Sc stabilized
ZrO2) - Ni/20ScSZ at 600°C (versus 3.74 Ω*cm2 at this temperature with
La.3Sr.7Fe.5Co.5O3+δ half cell) [54]; however, this improvement is principally due to
careful engineering of the cell and of the designed microstructure of the Ni/20ScSZ
anode. Measurements on ANL equipment of previously reported cathode-YSZ-Pt cells
(e.g., La.8Sr.2MnO3+δ) show them to have significantly larger ASRs (approximately an
order of magnitude) while having similar activation energies [164]. These results
indicate that the cells and test stand are poorly engineered by comparison with these
other reports (e.g., bad interconnects, larger thickness of cells, poor material
deposition methods, layers delaminating, etc.). The large values of Rs and its
temperature dependence seen in Figure 4.15 (which are typically < 0.1 Ω*cm2 and
nearly thermally independent for ideal behavior) are signs of deviation from ideal
Randles cell behavior. This type of behavior, though, can be modeled with a modified
Randles cell by adding another resistor in series with the effective polarization
resistance (ASR). Using this modified model, calculated activation energies seen here
are still valid and ASR of our cells can be compared qualitatively to one another.
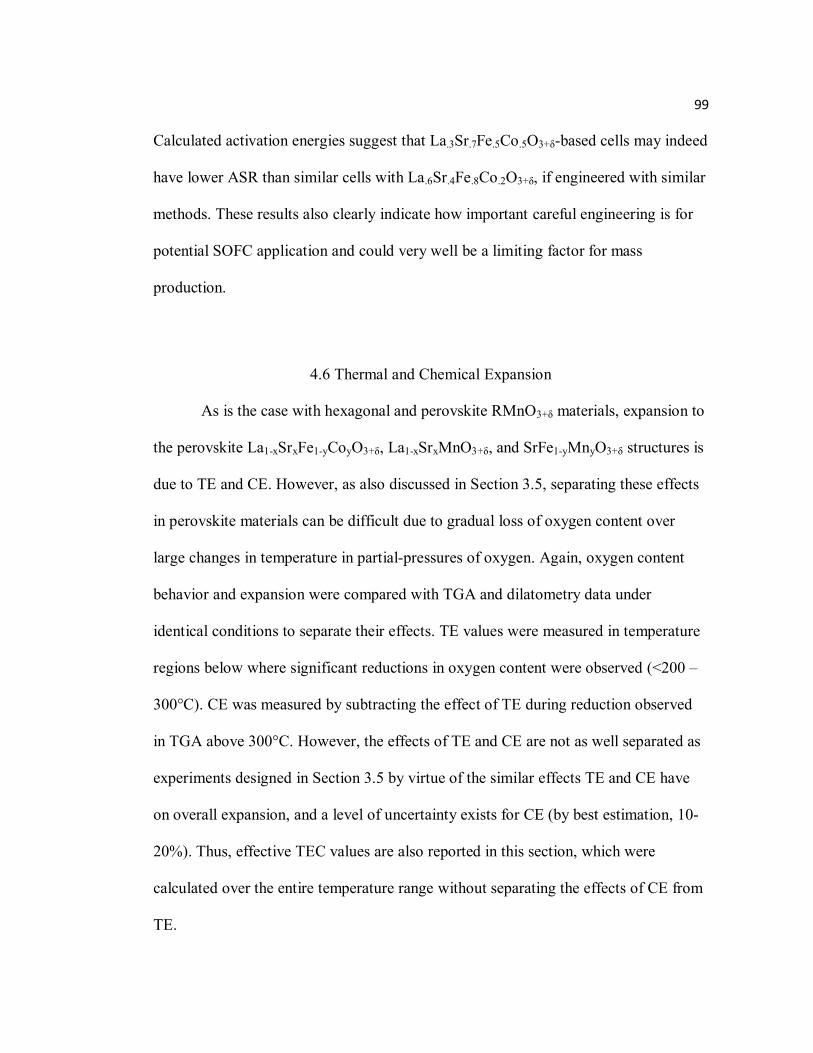
99
Calculated activation energies suggest that La.3Sr.7Fe.5Co.5O3+δ-based cells may indeed
have lower ASR than similar cells with La.6Sr.4Fe.8Co.2O3+δ, if engineered with similar
methods. These results also clearly indicate how important careful engineering is for
potential SOFC application and could very well be a limiting factor for mass
production.
4.6 Thermal and Chemical Expansion
As is the case with hexagonal and perovskite RMnO3+δ materials, expansion to
the perovskite La1-xSrxFe1-yCoyO3+δ, La1-xSrxMnO3+δ, and SrFe1-yMnyO3+δ structures is
due to TE and CE. However, as also discussed in Section 3.5, separating these effects
in perovskite materials can be difficult due to gradual loss of oxygen content over
large changes in temperature in partial-pressures of oxygen. Again, oxygen content
behavior and expansion were compared with TGA and dilatometry data under
identical conditions to separate their effects. TE values were measured in temperature
regions below where significant reductions in oxygen content were observed (<200 –
300°C). CE was measured by subtracting the effect of TE during reduction observed
in TGA above 300°C. However, the effects of TE and CE are not as well separated as
experiments designed in Section 3.5 by virtue of the similar effects TE and CE have
on overall expansion, and a level of uncertainty exists for CE (by best estimation, 10-
20%). Thus, effective TEC values are also reported in this section, which were
calculated over the entire temperature range without separating the effects of CE from
TE.
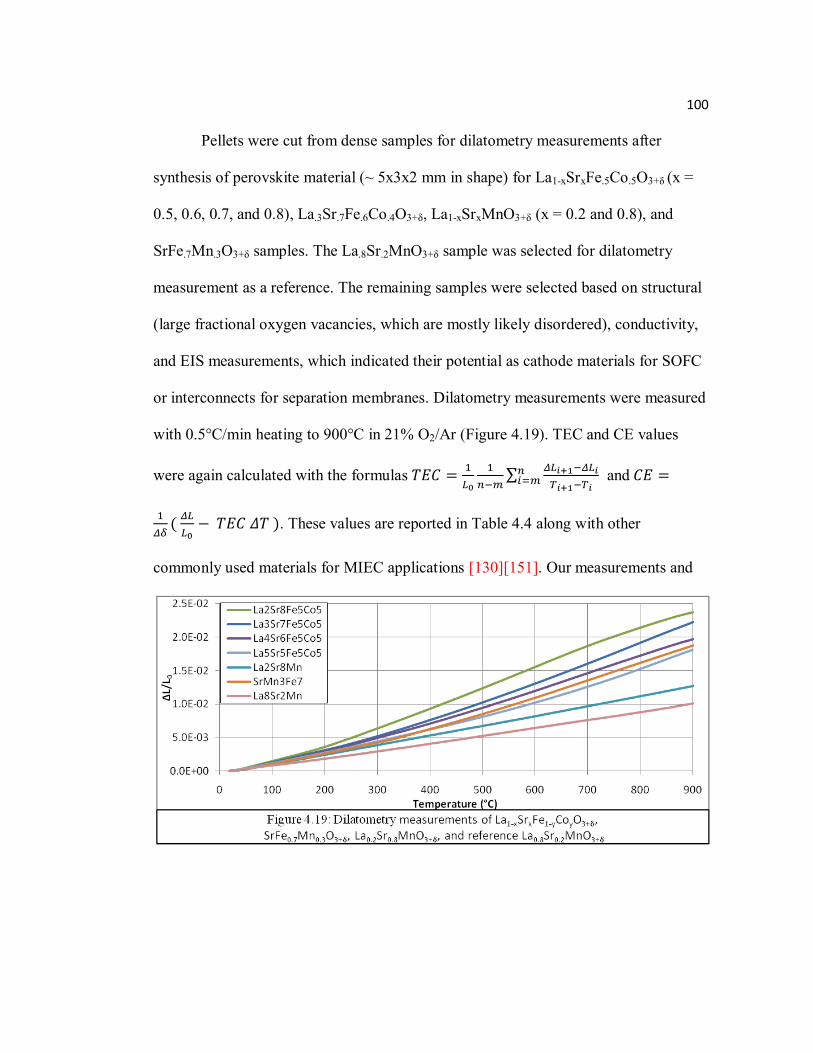
100
Pellets were cut from dense samples for dilatometry measurements after
synthesis of perovskite material (~ 5x3x2 mm in shape) for La1-xSrxFe.5Co.5O3+δ (x =
0.5, 0.6, 0.7, and 0.8), La.3Sr.7Fe.6Co.4O3+δ, La1-xSrxMnO3+δ (x = 0.2 and 0.8), and
SrFe.7Mn.3O3+δ samples. The La.8Sr.2MnO3+δ sample was selected for dilatometry
measurement as a reference. The remaining samples were selected based on structural
(large fractional oxygen vacancies, which are mostly likely disordered), conductivity,
and EIS measurements, which indicated their potential as cathode materials for SOFC
or interconnects for separation membranes. Dilatometry measurements were measured
with 0.5°C/min heating to 900°C in 21% O2/Ar (Figure 4.19). TEC and CE values
were again calculated with the formulas
and
. These values are reported in Table 4.4 along with other
commonly used materials for MIEC applications [130][151]. Our measurements and
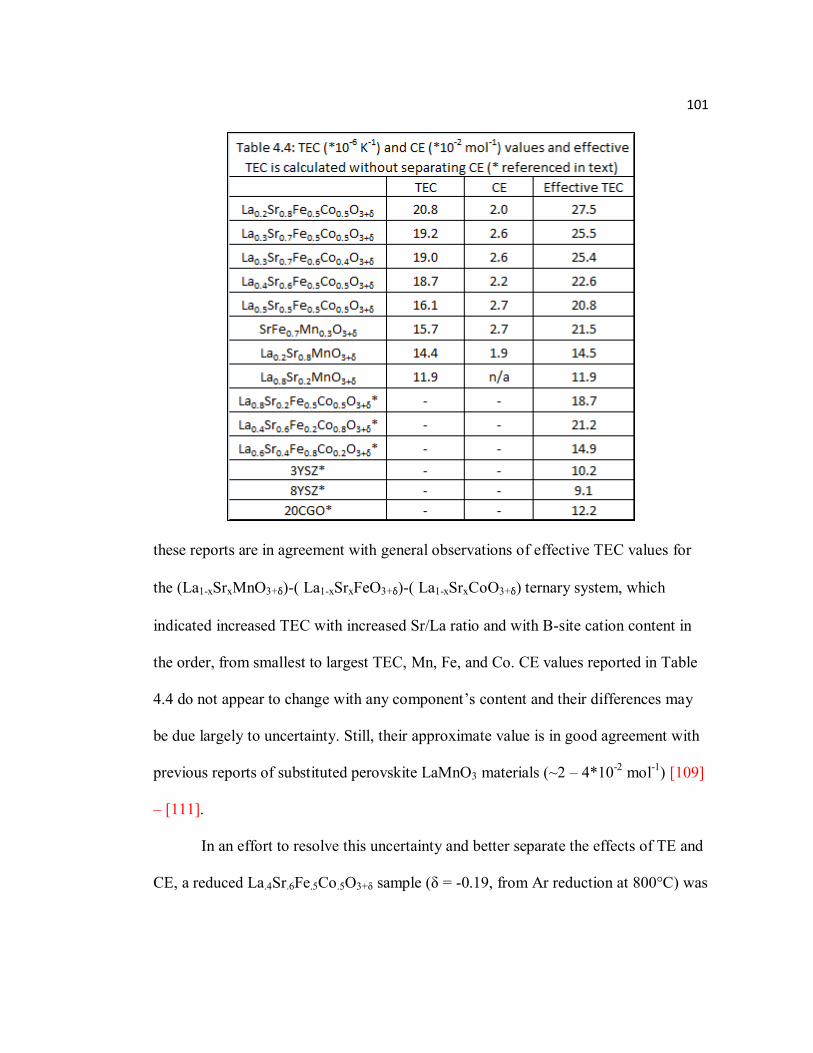
101
these reports are in agreement with general observations of effective TEC values for
the (La1-xSrxMnO3+δ)-( La1-xSrxFeO3+δ)-( La1-xSrxCoO3+δ) ternary system, which
indicated increased TEC with increased Sr/La ratio and with B-site cation content in
the order, from smallest to largest TEC, Mn, Fe, and Co. CE values reported in Table
4.4 do not appear to change with any component’s content and their differences may
be due largely to uncertainty. Still, their approximate value is in good agreement with
previous reports of substituted perovskite LaMnO3 materials (~2 – 4*10-2 mol-1) [109]
– [111].
In an effort to resolve this uncertainty and better separate the effects of TE and
CE, a reduced La.4Sr.6Fe.5Co.5O3+δ sample (δ = -0.19, from Ar reduction at 800°C) was
102
also oxygenated during dilatometry and TGA measurements under identical conditions
(Figure 4.20). Comparing Figures 4.19 and 4.20, the larger change in oxygen content
over a smaller temperature gradient of the reduced sample oxygenating versus the
previous dilatometry measurements of slight reduction in 21% O2/Ar is clearly
apparent on inspection. Thus, the CE calculated from oxygenation measurement was
more accurate, and yielded a CE of 1.83*10-2 mol-1 (which is in the estimated
uncertainty range of the 21% O2/Ar run’s value of 2.2*10-2 mol-1). This result may
suggest that the series has generally smaller CEs than values typically found in
perovskite manganites; however, it is important to remember that the larger changes in
oxygen content of the La1-xSrxFe.5Co.5O3+δ system in oxygen atmospheres results in
CE having a larger net effect on overall expansion than observed in most perovskite
manganites.
As previously discussed, thermal mismatch of expansion of layered materials
for separation membranes and SOFC application can severely limit total ionic
conductivity and cause a total failure in ionic conduction. Table 4.4 includes the TEC
values of typical electrolytes for separation membranes and SOFC applications
103
[165][166]. Clearly, the TEC values of our Sr-rich samples are much higher than these
materials and will be a limiting factor in their combined total ionic conductivity. The
small thermal expansion mismatch between La.6Sr.4Fe.8Co.2O3+δ and 20CGO, and
between La.8Sr.2MnO3+δ and 8YSZ materials (as seen in Table 4.4) is, in part,
responsible for their low activation energies of total ionic conductivity reported in
Section 4.5. However, as was also discussed in Section 4.5, our measurements of
La.3Sr.7Fe.5Co.5O3+δ material showed lower activation energies of total ionic
conductivity than reported measurements of La.6Sr.4Fe.8Co.2O3+δ with nearly identical
cell components and fabrication, despite the La.3Sr.7Fe.5Co.5O3+δ material’s increased
TEC. Clearly, the common choice of La.6Sr.4Fe.8Co.2O3+δ as the “premier” MIEC
material in the La1-xSrxFe1-yCoyO3+δ system for layered MIEC applications has
overcompensated for lower values of TEC (or because of the incorrectly reported
solubility limit of x = 0.4, as discussed in Section 4.2). Measurements of
La.3Sr.7Fe.5Co.5O3+δ material suggest that samples of higher Sr content can yield lower
activation energies of total conductivity, due to their significantly higher oxygen ion
and electrical conductivity, despite increased thermal mismatch with desired
electrolyte materials. However, comparing the similar activation energies of
SrFe.7Mn.3O3+δ and La.2Sr.8MnO3+δ cells to La.8Sr.2MnO3+δ cells, it appears any
advantage of increased oxygen ion conductivity of these Sr-rich materials is
effectively negated by their larger thermal mismatch with YSZ materials. Clearly,
ideal MIEC materials for layered applications must balance the advantages (increased
104
oxygen ion conductivity) and disadvantages (increased CE) of having increased
fractional oxygen ion vacancies.
It is possible that thermal mismatch is also partially responsible for the
significant increase in ASR we observed with our samples, which ultimately is the
most important factor in the cell’s total power density for SOFC application.
Unfortunately, the quality of cell and test stand engineering also has a large impact on
ASR, which makes it extremely difficult to isolate the impact of cathode-electrolyte
thermal mismatch on ASR. Repeated temperature cycling of the La.3Sr.7Fe.5Co.5O3+δ
full cell did not show decreases in performance over time, which may be an indicator
that engineering, and not thermal mismatch, is principally responsible for increased
ASR.
4.7 Conclusions
TGA measurements indicated that La1-xSrxFe1-yCoyO3+δ and SrFe.7Mn.3O3+δ
samples have large oxygen ion conductivity based on their high fractional oxygen ion
vacancies in air and their ability to oxygenate at low temperatures (<100°C) when
highly reduced (δ ≈ -0.5). TGA measurements also demonstrated
La1-xSrxFe1-yCoyO3+δ, La.2Sr.8MnO3+δ, and SrFe.7Mn.3O3+δ samples have considerable
OSC (1500 – 3500 μmol-O/g) with hydrogen-oxygen cycling. Several La1-xSrxFe1-
yCoyO3+δ samples, with stoichiometries near x = 0.7 and y = 0.5, were able to reabsorb
oxygen at room temperature, making them excellent candidates for chemical looping
combustion or related air separation applications. Four-point probe measurements of
105
La1-xSrxFe.5Co.5O3+δ, La.2Sr.8MnO3+δ, and SrFe.7Mn.3O3+δ samples found electrical
conductivities of ~ 200 – 1300, 140 and 25 S/cm at 500°C, respectively. The
conductivity of La.2Sr.8MnO3+δ and SrFe.7Mn.3O3+δ samples showed temperature
dependence, , which would nominally indicate thermally assisted
behavior. EIS measurements of 3YSZ-20CGO-Pt/Ni cells with La.3Sr.7Fe.5Co.5O3+δ,
La.2Sr.8MnO3+δ, and SrFe.7Mn.3O3+δ cathode materials yielded activation energies of
total ionic conductivity of ~ 82.5, 128, and 125 kJ/mol, respectively. The activation
energy of cells with La.3Sr.7Fe.5Co.5O3+δ cathode material was considerably lower
(approximately 50%) than previously reported in similar cells with
La.6Sr.4Fe.8Co.2O3+δ cathode material, which has generally been considered to be the
superior MIEC material for air separation and SOFC applications in the
La1-xSrxFe1-yCoyO3+δ system. On the other hand, cells with La.2Sr.8MnO3+δ and
SrFe.7Mn.3O3+δ materials were found to have comparable activation energies with
previously reported similar cells with the commonly cited La1-xSrxMnO3+δ cathode
material, La.8Sr.2MnO3+δ, despite our measurements which indicate their higher
oxygen ion and electronic conductivity. All measured cells had ASR values
significantly greater than previously reported similar cells with La.6Sr.4Fe.8Co.2O3+δ
and La.8Sr.2MnO3+δ cathodes primarily due to poor cell and test stand engineering.
Dilatometry measurements agreed with previously reported trends of La1-xSrxMnO3+δ,
La1-xSrxFeO3+δ, and La1-xSrxCoO3+δ systems, which showed that effective TEC
increases significantly with increased Sr content. These measurements also found
effective TECs of 20.8 – 27.5, 21.5, and 14.5*10-6 K-1 for La1-xSrxFe1-yCoyO3+δ (0.2 ≤
106
x ≤ 0.5), SrFe.7Mn.3O3+δ, and La.2Sr.8MnO3+δ samples, respectively. While our results
suggest that the increased ASR values of our materials are mainly due to their inferior
cell design and engineering, some of the increase in ASR is also undoubtedly due to
increase thermal expansion mismatch from the higher TEC of our materials with
3YSZ. The similar activation energies of total ionic conductivity of cells with
La.2Sr.8MnO3+δ and SrFe.7Mn.3O3+δ materials compared to La.8Sr.2MnO3+δ material
may also be due to the relatively higher thermal expansion mismatch of our samples
with 3YSZ. Nevertheless, our results clearly indicate that Sr-rich La1-xSrxFe1-yCoyO3+δ
materials can yield superior activation energies of total ionic conductivity, despite its
thermal mismatch with 3YSZ, and are strong candidates for SOFC and layered
material applications. The performance of all measured and related Sr-rich materials
would also most likely improve significantly when supported by better electrolyte
materials (e.g., CGO and CSO) designed for use with the La1-xSrxFe1-yCoyO3+δ system,
which have similar thermal expansion and better chemical stability.
107
REFERENCES
[1] C. Linde US Patent 727650 1903
[2] M. Davies, History of Science 22 (1989)
[3] M. Kanoglu, I. Dincer, M.A. Rosen, I.J. of Energy Research 32 (2008) 35
[4] B.Z. Maytal, Cryogenics 46 (2006) 49
[5] N. Greenwood, A. Earnshaw, Chemistry of the Elements 2nd
ed., Butterworth Heinemann (2002) 604
[6] Compressed Gases Association, Handbook of Compressed Gases, Van Nostrand Reinhold Co, 1990
[7] S.P. Nandi, P.L. Walker Jr., Sep. Sci. and Tech. 11 (1976) 441
[8] L. Murray, M. Dinca, J. Yano, S. Chavan, S. Bordiga, C. Brown, J. Long, Amer. Chem. Soc. 132 (2010) 7856
[9] J. Emsley, Nature’s Building Blocks: An A-Z Guide to the Elements, Oxford University Press 2001
[10] S. Shelley, CEP 105 (2009) 6
[11] Y. Lin, D. MacLean, Y. Zeng US Patent 6059858 2000.
[12] H. He, H.X. Dai, C.T. Au, Catal. Today 90 (2004) 245
[13] R. DiMonte, P. Fornasiero, M. Graziani, J. Kašpar, Alloys and Comp. 275 (1998) 887
[14] Y. Nagai, T. Yamamoto, T. Tanaka, S. Yoshida, T. Nonaka, T. Okamoto, A. Suda, M. Sugiura, Catal. Today 74 (2002) 225
[15] P. Singh, M. Hegde, J. Gopalakrishnan, Chem. Mater. 20 (2008) 7268
[16] M. Karppinen, H. Yamauchi, S. Otani, T. Fujita, T. Motohashi, Y. Huang, M. Valkeapää, H. Fjellvag, Chem. Mater. (2006) 490
108
[17] T. Motohashi, S. Kadota, H. Fjellvag, M. Karppinen, H. Yamauchi, Mater. Sci.
Eng. B 148 (2008) 196
[18] S. Kadota, M. Karppinen, T. Motohashi, H. Yamauchi, Chem. Mater. 20 (2008) 6378
[19] S. Räsänen, T. Motohashi, H. Yamauchi, M Karppinen, Solid State Chem. 183 (2010) 692
[20] O. Chmaissem, H. Zhen, A. Huq, P. Stephens, J. Mitchell, Solid State Chem.
181 (2008) 664
[21] W. Nernst, Z. Elektrochem. 6 (1899) 41
[22] J. Kilner, Solid State Ionics 129 (2000) 13
[23] C. Wagner, Prog. Solid State Chem. 10 (1975) 3
[24] P. Gellings, H.J.M. Bouwmeester, The CRC Handbook of Solid State
Electrochemistry 1997
[25] D. Yuan, F. Kroger, Electrochem. Soc. 116 (1969) 594
[26] Y. Teraoka, H. Zhang, S. Furukawa, N. Yamazoe, Chem. Lett. (1985) 1743
[27] H. Dong, Z. Shao, G. Xiong, J. Tong, S. Sheng, W. Yang, Cata. Today 67 (2001) 3
[28] C. Tsai, A. Dixon, W. Moser, Y. Ma, Ceram. Process. 43 (1997) 2741
[29] S. Badwal, F. Ciacchi, Int. Ion. 6 (2000) 1
[30] V. Kharton, A. Yaremchenkop, A. Kovalevsky, A. Viskup, E. Naumovich, P. Kerko, Membr. Sci. 163 (1999) 307
[31] T. Ishihara, T. Yamada, H. Arikawa, H. Nishiguchi, Y. Takita, Solid State
Ionics 135 (2000) 631
[32] C.L. Mariz, Can. Petrol. Tech. 37 (1998) 42
[33] B. Buhre, L. Elliott, C. Sheng, P. Gupta, T. Wall, Prog. Energy Combust. Sci. 31(2005) 283
[34] M. Kanniche, R. Grosbonnivard, P. Jaud, J. Valle-Marcos, J.M. Amann, C. Bouallou, C. Appl. Therm. Eng. 30 (2009) 53
109
[35] J. Ciferno, et al. DOE/NETL-2007/1291 2007
[36] J. Figueroa, T. Fout, S. Plasynski, H. McIlvried, R. Srivastava, I. J. of
Greenhouse Gas Control 2 (2008) 21
[37] J. Klara, et al. DOE/NETL-2008/1307 2007
[38] M. Rydén, A. Lyngfelt, T. Mattisson, D. Chen, A. Holmen, E. Bjørgum, I. J.
Greenhouse Gas Control 2 (2008) 21
[39] A. Abad, T. Mattisson, A. Lyngfelt, M. Rydén, Fuel 85 (2006)1174
[40] J. Readman, A. Olafsen, Y. Larring, R. Blom, Mater. Chem. 15 (2005) 1937
[41] E. Baur, H. Preis, Elektrochem. 43 (1937) 727
[42] A. Appleby, F. Foulkes, Fuel Cell Handbook, Van Nostrand Reinhold, 1989
[43] S. Singal, Solid State Ionics, 135 (2000) 305
[44] O. Yamamoto, Y. Takeda, R. Kanno, T. Kojima, Solid State Ionics 22 (1987) 241
[45] K. Huang, M. Feng, J. Goodenough, M. Schmerling, Electrochem. 143 (1996) 3630
[46] S. Adler, Chem. Rev. 104 (2004) 10
[47] K. Chang, B. Ingram, B. Kavaipatti, B. Yildiz, D. Hennessy, P. Salvador, N. Leyarovska, H. You, Mat. Res. Soc. Symp. Prec. 1126 (2009) 27
[48] V. Dusastre, J.A. Kilner, Solid State Ionics 126 (1999) 163
[49] J. Yan, H. Matsumoto, M. Enoki, T. Ishihara, Electrochem. Solid State 8 (2005) A389
[50] A. Esquirol, N. Brandon, J. Kilner, M. Mogensen, Electrochem. 151 (2004) A1847
[51] M. Rozumek, P. Majewski, T. Maldener, F. Aldinger Mater. Werkst. 33 (2002) 348
[52] T. Jardiel, M. Caldes, F. Moser, J. Hamon, G. Gauthier, O. Joubert, Solid State
Ionics 181 (2010) 894
[53] S. Li, Z. Lü, X. Huang, W. Su, Solid State Ionics, 178 (2008) 1853
110
[54] T. Suzuki, A. Hasan, Y. Funahashi, T. Yamaguchi, Y. Fujishiro, M. Awano, Science 325 (2009) 852
[55] N. Izu, W. Shin, I. Matsubara, T. Itoh, M. Nishibori, N. Murayama, Ceram.
Soc. Jap. 118 (2010) 175
[56] Y. Shimizu, Y. Fukuyama, H. Arai, T. Seiyama, ACS Symp. Series 309 (1987) 83
[57] M. Post, B. Sanders, P. Kennepohl, Sens. Act. B: Chem. 13 (1993) 272
[58] J. Ramirez-Salgado, P. Fabry, Sens. Act. B: Chem. 82 (2002) 34
[59] N. Izu, N. Oh-hori, W. Shin, I. Matsubara, N. Murayama, M. Itou, Sens. Act.
B: Chem. 130 (2008) 105
[60] J. Kašpar, P. Fornasiero, N. Hickey, Catal. Today 77 (2003) 419
[61] T. Kodama, N. Gokon, Chem. Rev. 107 (2007) 4048
[62] Z. Xu, Z. Qi, A. Kaufman, Power Sources 115 (2003) 40
[63] B. Sakakini, Y. Taufig-Yap, K. Waugh, J. Catal. 189 (200) 253
[64] S. Pei, M. Kleefisch, T. Kobylinski, J. Faber, C. Udovich, V. Zhang-McCoy, B. Dabrowski, U. Balachandran, R. Mieville, R. Poeppel, Cata. Lett. 30 (1995) 201
[65] C. Larson and R.B. Von Dreele, Los Alamos National Laboratory Reports LAUR 86-748, 1994.
[66] H.L. Yakel, W. Koehler, E. Bertaut, E. Forrat, Acta. Cryst. 16 (1962) 957
[67] J.S. Zhou, J.B. Goodenough, Phys. Rev. B 68 (2003) 144406
[68] J.B. Goodenough, Phys. Rev. 100 (1955) 564
[69] B. Dabrowski, S. Kolesnik, A. Baszczuk, O. Chmaissem, T. Maxwell, J. Mais, Solid State Chem. 178 (2005) 629
[70] T. Katsufuji, M. Masaki, A. Machida, M. Moritomo, K. Kato, E. Nishibori, M. Takata, M. Sakata, K. Ohoyama, K. Kitazawa, H. Takagi, Phys. Rev. B 66 (2002) 134434
[71] J.S. Zhou, J.B. Goodenough, J.M. Gallardo-Amores, E. Morán, M.A. Alario-Franco, R. Caudillo, Phys. Rev. B 74 (2006) 014422
111
[72] M. Fiebig, T Lottermoser, R.V. Pisarev, Appl. Phys. 93 (2003) 8194
[73] O.P. Vajik, M. Kenzelmann, J.W. Lynn, S.B. Kim, S.W. Cheong, Phys. Rev.
Lett. 94 (2005) 087601
[74] Th. Lonkai, D.G. Tomuta, U. Amann, J. Ihringer, R.W.A. Hendrikx, D.M. Többens, J.A. Mydosh, Phys. Rev. B 69 (2004) 134108
[75] I. Jeong, N. Hur, T. Proffen, App. Cryst. 40 (2007) 730
[76] C.N.R. Rao, C.R. Serrao, Mater. Chem. 17 (2007) 4931
[77] W.S. Choi, D.G. Kim, S.S.A. Seo, S.J. Moon, D. Lee, J.H. Lee, H.S. Lee, D.Y. Cho, Y.S. Lee, P. Murugavel, J. Yu, T.W. Noh, Phys. Rev. B 77 (2008) 045137
[78] S. Harikrishnan, S. Rößler, C.M.Naveen Kumar, H.L. Bhat, U.K. Rößler, S. Wirth, F. Steglich, S. Elizabeth, J. of Phys: Condens. Matter 21 (2009) 096002
[79] S. Nandi, A. Kreyssig, J.Q. Yan, M.D. Vannette, J.C. Lang, L. Tan, J.W. Kim, R. Prozorov, T.A. Lograsso, R.J. McQueeney, A.I. Goldman, Phys. Rev. B 78 (2008) 075118
[80] V.Y. Ivanov, A.A. Mukhin, A.S. Prokhorov, A.M. Balbashov, L.D. Iskhakova, Phys. of Solid State 48 (2006) 1726
[81] N. Kamegashira, H. Satoh, S. Ashizuka, Mater. Sci. Forum 449 (2004) 1045
[82] R.D. Shannon, Acta. Cryst. A 32 (1976) 751
[83] H.L. Yakel, Acta. Cryst. 8 (1955) 394
[84] H.L Yakel, W.C. Koehler, E.F. Bertaut, E.F. Forrat, Acta. Cryst. 16 (1963) 957
[85] M.A. Subramanian, C.C. Torardi, D.C. Johnson, J. Pannetier, A.W. Sleight, Solid State Chem. 72 (1988) 24
[86] N. Kamegashira, H. Satoh, S. Ashizuka, Mater. Sci. Forum 449 (2004) 1045
[87] J. Park, J.G. Park, G.S. Jeon, H.Y. Choi, C. Lee, W. Jo, R. Bewley. K.A. McEwen, T.G. Perring, Phys. Rev. B 68 (2003) 104426
[88] S. Lee, A. Pirogov, J.H. Han, J.G. Park, A. Hoshikawa, T. Kamiyama, Phys.
Rev. B 71 (2005) 180413(R)
[89] O. Carp, L. Patron, A. Ianculescu, J. Pasuk, R. Olar, Alloys and Comp. 351 (2003) 314
112
[90] G. Szabo, R.A. Paris, Seances Academy Sci. C 268 (1969) 517
[91] H.W. Brinks, H. Fjellvág, A. Kjekshus, Solid State Chem. 129 (1997) 334
[92] B. Dabrowski, O. Chmaissem, J. Mais, S. Kolesnik, J.D. Jorgensen, S. Short, Solid State Chem. 170 (2003) 154
[93] L. Suescun, B. Dabrowski, J. Mais, S. Remsen, J.W. Richardson Jr., E.R. Maxey, J.D. Jorgensen, Chem. Mater. 4 (2008) 1636
[94] A. Waintal, J. Chenavas, Mater. Res. Bull. 2 (1967) 819
[95] M. Tachibana, T. Shimoyama, H. Kawaji, T. Atake, E. Takayama-Muromachi, Phys. Rev. B 75 (2007) 144425
[96] K. Uusi-Esko, J. Malm, N. Imamura, H. Yanauchi, M. Karppinen, Mat. Chem.
Phys. 112 (2008) 1029
[97] C. Nivot, J. Bernard, C. Lelievre, J. Haussonne, D. Houivet, Ceram. Internat. 36 (2010) 929
[98] S. Samal, W. Green, S. Lofland, K. Ramanujachary, D. Das, A. Ganguli, Solid
State Chem. 181 (2008) 61
[99] D. Gutierrez, O. Peña, P. Duran, C. Moure, Euro. Ceram. Soc. 22 (2002) 1257
[100] D. Gutierrez, O. Peña, P. Duran, C. Moure, Euro. Ceram. Soc. 22 (2002) 567
[101] O. Yamaguchi, H. Takemura, M. Yamashita, Electrochem. Soc. 138 (1991) 1492
[102] J. Park, M. Kang, J. Kim, Phys. Rev. B 79 (2009) 064417
[103] K. Kamata, T. Nakajima, T. Nakamura, Mater. Res. Bull. 14 (1979) 1007
[104] B. Dabrowski, P.W. Klamut, Z. Bukowski, R. Dybzinski, J.E. Siewenie, Solid
State Chem. 144 (1999) 461
[105] Z. Bukowski, B. Dabrowski, J. Mais, P.W. Klamut, S. Kolesnik, O. Chmaissem, App. Phys. 9 (2000) 5031
[106] I.O. Troyanchuk, A.I. Akimov, L.A. Bliznjuk, N.V. Kasper, Alloys and Comp.
228 (1995) 83
[107] J. Rodríguez-Carvajal, M. Hennion, F. Moussa, A. H. Moudden, L. Pinsard, A. Revcolevschi, Phys. Rev. B 57 (1998) R3189
113
[108] H.D. Zhou, J.C. Denyszyn, J.B. Goodenough, Phys. Rev. B 72 (2005) 224401
[109] X. Chen, J. Yu, S.B. Adler, Chem. Mater. 17 (2005) 4537
[110] S. Miyoshi, J. Hong, K. Yashiro, A. Kaimai, Y. Nigara, K. Kawamura, T. Kawada, J. Mizusaki, Solid State Ionics, 161 (2003) 209
[111] S. McIntosh, J.F. Vente, W.G. Haije, D. Blank, H. Bouwmeester, Chem.
Mater. 18 (2006) 2187
[112] S. Pei, M. Kleefisch, T. Kobylinski, J. Faber, C. Udovich, V. Zhang-McCoy, B. Dabrowski, U. Balachandran, R. Mieville, R.Poeppel, Catal. Lett. 30 (1994) 201
[113] A. Atkinson, T. Ramos, Solid State Ionics 129 (2000) 259
[114] J. Van Roosmalen, E. Cordfunke, R. Helmhodt. H. Zandbergen, Solid State
Chem. 110 (1994) 100
[115] B. Fu, W. Huebner, Mater. Res. 9 (1994) 2645
[116] C. Moure, M. Villegas, J. Fernandez, J. Tartaj, P. Duran, Mat. Sci. 34 (1999) 2565
[117] G. Subba Rao, B. Wanklyn, C. Rao, Phys. Chem. Solids 32 (1971) 345
[118] T. Inoue, N. Seki, K. Eguchi, H. Arai, Electrochem. Soc. 137 (1990) 2523
[119] J. Kao, O. Anderson, D. Spartin, Solid State Chem. 87 (1990)
[120] A. Fossdal, M. Einarsrud, T. Grande, Euro. Ceram. Soc. 25 (2005) 927
[121] M. Patrakeev, J. Bahteeva, E. Mitberg, I. Leonidov, V. Kozhevnikov, K. Poepelmeier, Solid State Chem. 172 (2003) 219
[122] R. Raccah, J Goodenough, Phys. Rev. 155 (1967) 932
[123] A. Mineshige, M. Inaba, T. Yao, Z. Ogumi, K. Kikuchi, M. Kawase, Solid
State Chem. 121 (1996) 423
[124] M. Senarís-Rodríguez, J. Goodenough, Solid State Chem. 116 (1995) 224
[125] W.H Jung, Physica B 299 (2001) 120
[126] A. Hammouche, E. Schouler, M. Henault, Solid State Ionics 28 (1988) 1205
114
[127] O. Yamamoto, Y. Takeda, R. Kanno, M. Noda, Solid State Ionics 22 (1987) 241
[128] F. Tietz, I. Raj, M. Zahid, A. Mai, D. Stöver, Prog. Solid State Chem. 35 (2007) 539
[129] D. Huang, Q. XU, F. Zhang, W. Chen, H. Liu, J. Zhou, Wuhan Uni. Tech.
Mater. Sci. 23 (2007) 80
[130] L. Tai, M. Nasrallah, H. Anderson, Solid State Ionics, 76 (1995) 259
[131] T. Nakamura, G. Petzow, L. GAukler, Mat. Res. Bull. 14 (1979) 649
[132] Y. Teraoka, H. Zhang, N. Yamazoe, Chem. Letters (1985) 1743
[133] Y. Teraoka, T. Nobunaga, N. Yamazoe, Chem. Letters (1988) 503
[134] B. Dabrowski, J. Greedan, M. Greenblat, C. Grey, A. Jacobson, D. Keszleer, J. Li, M. Subramanian, Y. Xia, Prog. Solid State Chem. 36 (2007) 1
[135] M. Ruiz-Gonzalez, R. Cortes-Gil, J. Alonso, A. Hernando, M. Vallet-Regi, J. Gonzalez-Calbet, Chem. Mater. 18 (2006) 5756
[136] V. Caignaert, N. Nguyen, M. Hervieu, B. Raveau, Mater. Res. Bull. 20 (1985) 479
[137] P. Gallaher, J. MacChesney, D Buchanan, Chem. Phys. 41 (1964) 2429
[138] J. Goodenough, J. Ruiz-Diaz, Y. Zhen, Solid State Ionics, 44 (1995) 21
[139] J. Hodges, S. Short, J. Jorgensen, X. Xiong, B. Dabrowski, S. Mini, C. Kimball, Solid State Chem. 151 (2000) 190
[140] P. Battle, T. Gibb, P. Lightfoot, Solid State Chem. 76 (1998) 334
[141] O. Hansteen, H. Fjellvag, B Hauback, Solid State Chem. 141 (1998) 411
[142] P. Casey, D. Barker, M. Hayward, Solid State Chem. 179 (2006) 1375
[143] K. Poeppelmeier, M. Leonowicz, J. Scanlon, J. Longo,W.B. Yelon, Solid State
Chem. 45 (1982) 71
[144] T. Mori, N. Kamegashira, Alloys and Comp. 408–412 (2006) 1210
[145] L. Tai, M. Nasrallah, H. Anderson, Solid State Ionics, 76 (1995) 273
115
[146] S. Balamurugan, K. Yamaura, A. Karki, D. Young, M. Aria, E. Takayama-Muromachi, Phys. Rev. B 74 (2006) 172406
[147] Y. Teraoka, H. Zhang, S. Furukawa, N. Yamazoe, Chem Letters Chem. Soc.
Jap. (1985) 1743
[148] L. Suescun, B. Dabrowski, S. Remsen, J. Mais, Solid State Chem. 182 (2009) 187
[149] K. Swierczek, B. Dabrowski, L. Suescun, S. Kolenik, Solid State Chem. 182 (2009) 280
[150] K. Swierczek, B. Dabrowski, L. Suescun, S. Kolenik, S. Remsen, J. Mais, unpublished data.
[151] H. Tu, Y. Takeda, N. Imanishi, O. Yamamoto, Solid State Ionics 117 (1999) 277
[152] S. Kolesnik, B. Dabrowski, J. Mais, D. Brown, R. Feng, O. Chmassiem, R. Kruk, C. Kimball, Phys. Rev B 67 (2003) 144402
[153] I. Fawcett, G. Veith, M. Greenblatt, M. Croft, I. Nowik, Solid State Sci. 2 (2000) 821
[154] C. Solís. M. Rossell, G. Garcia, A. Figueras, G. Tendeloo, J. Santiso, Solid
State Ionics 179 (2008) 1996
[155] M. Senarís-Rodríguez and J. Goodenough, Solid State Chem. 116 (1995) 224
[156] T. Takami, J. Zhou, J. Goodenough, H. Ikuta, Comb. Sci. Tech. 19 (1981) 124
[157] J. Burley, J. Mitchell, S. Short, Phys. Rev. B 69 (2004) 054401
[158] S. Kolesnik, B. Dabrowski, J. Mais, M. Maijiga, O. Chmaissem, Phys. Rev. B 73 (2006) 214440
[159] B. Stillwell, “Evaluation of Potential Cathode Materials for Reduced-
Temperature Solid Oxide Fuel Cells,” Northern Illinois University, Dept. of Physics M.S. Thesis (2007)
[160] B. Steele, A. Heinzel, Nature 414 (2001) 345
[161] A. Barbucci, R. Bozzo, G. Cerisola, P. Costamagna, Electrochimica Acta 47 (2002) 2183
[162] S. Jiang, Solid State Ionics 146 (2002) 1
116
[163] A. Mai, V. Haanappel, F. Tietz, I. Vinke, D. Stöver, Electrochem. Soc. Proc. 7 (2003) 525
[164] D. Carter, B. Dabrowski, B. Stillwell, unpublished data.
[165] H. Hayashi, T. Saitou, N. Maruyama, H. Inaba, K. Kawamura, M. Mori, Solid
State Ionics 176 (2005) 613
[166] H. Hayashi, M. Kanoh, C. Quan, H. Inaba, S. Wang, M. Dokiya, H. Tagawa, Solid State Ionics 132 (2000) 227
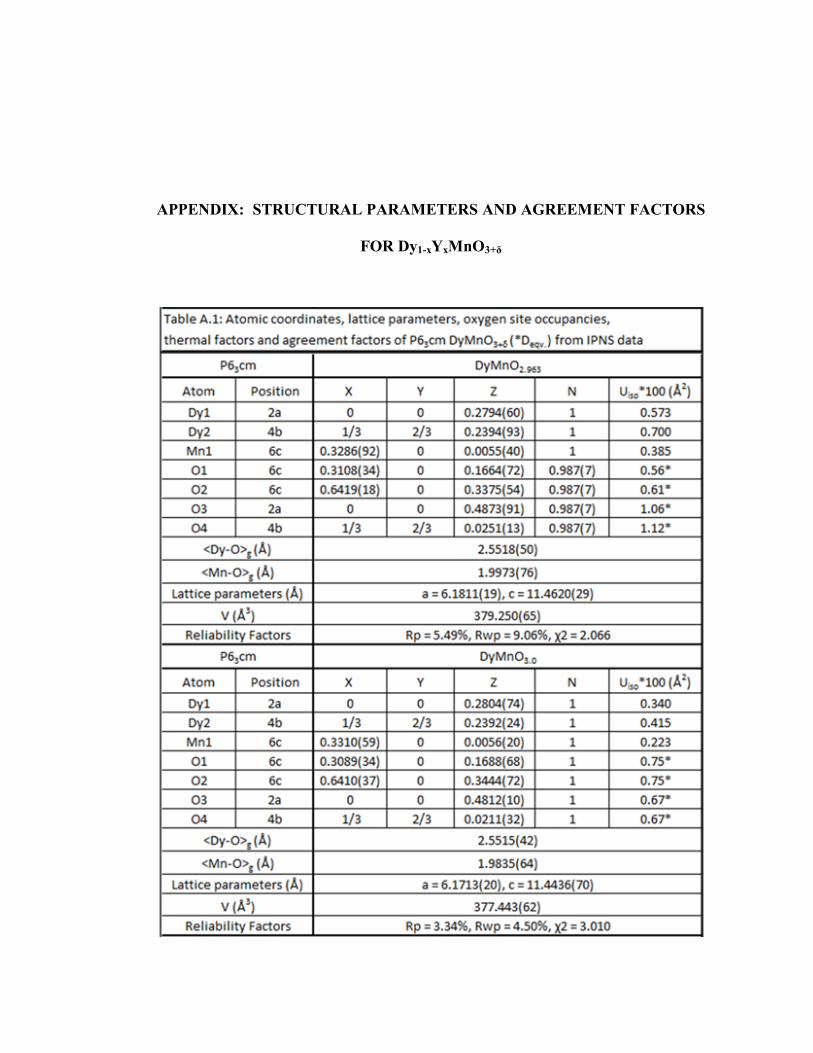
117
APPENDIX: STRUCTURAL PARAMETERS AND AGREEMENT FACTORS
FOR Dy1-xYxMnO3+δ
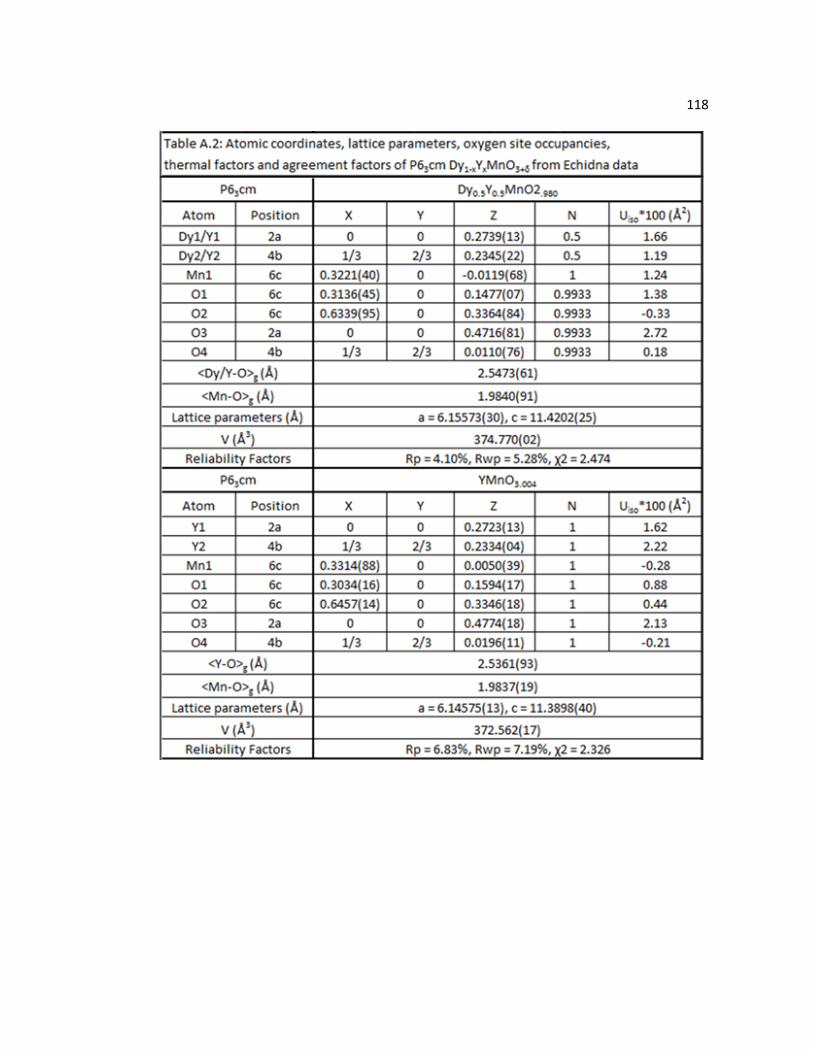
118