Embed Size (px)
Citation preview
ABSTRACT
GARDNER, GRANT EAN. Biotechnology Risks and Benefits: Science Instructor Perspectives and Practices. (Under the direction of M. Gail Jones.)
Developing scientifically literate students who understand the socially contextualized
nature of science and technology is a national focus of science education reform.
Understanding teachers’ views on this topic is of equal importance. This document focuses
on the topic of risks and benefits posed by science and technology as an important topic for
which the socially contextualized nature of science and technology readily emerges.
Following introduction of a theoretical model and a review of the literature, two research
studies are described that examined teachers’ perceptions of the risks posed by biotechnology
and the role of risk topics in an undergraduate science course.
The first research study examines four groups of science educators; pre-service
science teachers, in-service science teachers, science graduate teaching assistants, and
science professors (n = 91). The participants completed a survey and card sort task to
determine their perceptions of the risks of biotechnology. The results show that teacher
perceptions were shaped by the risk severity, regulation processes, public acceptance, fear,
reciprocal benefits, and whether the applications would impact humans or the environment.
Factors determining risk perception included personal worldviews, trust in communicating
institutions, and personal experiences with biotechnology. The different types of science
teachers were compared and contrasted in light of these factors and the implications of
instructor perceptions on science pedagogy are discussed.
The second research manuscript describes a case study in which six biology graduate
teaching assistants (GTAs) were observed teaching as lesson on the potential risks and
benefits of biotechnology. The data sources included classroom observations and semi-
structured interviews. Qualitative analysis reveals that GTAs framed the instruction of risk in
one of three ways: analytical, focus on perspectives and biases, and promotion of individual
reflection. Interview results suggest that GTAs had a much richer understanding of the
importance of the teaching of social aspects of science and technology than emerged in their
teaching. Results are discussed in the context of the disconnect between the GTA’s teaching
practice and perspectives.
Biotechnology Risks and Benefits: Science Instructor Perspectives and Practices
by Grant Ean Gardner
A dissertation submitted to the Graduate Faculty of North Carolina State University
In partial fulfillment of the requirements for the degree of
Doctor of Philosophy
Science Education
Raleigh, North Carolina
2009
APPROVED BY:
_______________________________ ______________________________ Dr. M. Gail Jones Dr. James Minogue Committee Chair ________________________________ ______________________________ Dr. Eric Wiebe Dr. Miriam Ferzli
ii
BIOGRAPHY
Grant was born in Corpus Christi, Texas on November 21st, 1978 and has lived a
nomadic lifestyle with residences in Texas, Ohio, Pennsylvania, New Jersey, Germany,
Tennessee, and North Carolina. Although he currently considers North Carolina home, he
will always be a Texan at heart.
His academic training includes an undergraduate degree in Biology (B.S. 2001) from
Vanderbilt University and a graduate degree in Zoology (M.S. 2004) from North Carolina
State University. Amidst all the schooling, he has also worked as a science researcher,
science teacher, and (non-science) waiter
iii
ACKNOWLEDGMENTS
To my committee chair and mentor Dr. Gail Jones: Thank you for knowing what I
needed to do to better myself as an academic and as a researcher when I often was not aware
of it myself. Your support, leadership, and (most of all) patience have given me the
confidence to find my niche.
To my committee: Dr. Eric Wiebe, thank you for challenging me to go places with
my thinking and writing that were sometimes uncomfortable but always made me learn
something new. Dr. Miriam Ferzli, thank you for knowing where I am coming from and
where I want to go, and doing what was needed to help me get there. Dr. James Minogue,
thank you for being willing to come in at the bottom of the ninth to help out. Dr. Meg
Blanchard, thank you for being a steadying voice among the chaos.
To our research group: Dr. Amy Taylor, Jennifer Forrester, Laura Robertson, and
Denise Krebs, you all made the journey through this doctoral degree worth it. Thanks for
running the race with me.
To others who helped move this research along: Thanks go to Dr. Nietfeld who
helped in designing and refining many of the instruments in this study. Thanks also go to
Patty Aune who was integral in organizing and preparing my entry into the biology
laboratories.
To my family: Heather, you continue to surprise me in the lengths you are willing to
go to help me find my way in life. You really are my best friend. Aylee, you are a goober.
But, no matter how stressed or upset I am, you always make me smile. I love you both.
iv
TABLE OF CONTENTS LIST OF TABLES ........................................................................................................ vi LIST OF FIGURES ......................................................................................................vii INTRODUCTION. RISK, SCIENCE, AND TECHNOLOGY EDUCATION ................ 1 Science, Technology, and Society .............................................................................. 2 STS and Risk Perception ........................................................................................... 3 Document Context and Organization ......................................................................... 8 References ............................................................................................................... 10 BACKGROUND. RESEARCH TRENDS IN RISK PERCEPTION OF SCIENCE AND TECHNOLOGY .......................................................................................................... 13 Introduction ............................................................................................................. 14 Defining Risk .......................................................................................................... 15 Risk Research Frameworks ..................................................................................... 18 The Psychometric Paradigm .................................................................................... 19 History and Theory ............................................................................................. 19 Assumptions and Limitations .............................................................................. 27 Cultural Theory ....................................................................................................... 28 History and Theory ............................................................................................. 28 Assumptions and Limitations .............................................................................. 32 Integrated Approaches ............................................................................................. 33 Conclusions and Implications .................................................................................. 34 References ............................................................................................................... 36
RESEARCH STUDY I. SCIENCE INSTRUCTORS’ RISK PERCEPTION OF BIOTECHNOLOGY: IMPLICATIONS FOR SCIENCE INSTRUCTION .................. 43 Introduction ............................................................................................................. 44 Attitudes and Risk Perception .................................................................................. 46 Risk Perception and Biotechnology ......................................................................... 48 Students Studying Science Content ..................................................................... 49 Science Teachers ................................................................................................ 50 Risk Perception Research Frameworks .................................................................... 51 Psychometric Paradigm ...................................................................................... 52 Cultural Theory .................................................................................................. 54 Study Description .................................................................................................... 56 Participants ......................................................................................................... 57 Instruments ......................................................................................................... 59 Data Analysis .......................................................................................................... 64 Risk Perception ................................................................................................... 64 Factors Contributing to Risk Perception .............................................................. 65
v
Results .................................................................................................................... 66 Risk Perception ................................................................................................... 66 Factors Contributing to Risk Perception .............................................................. 73 Discussion ............................................................................................................... 81 Implications for Science Education .......................................................................... 88 References ............................................................................................................... 90 Appendices............................................................................................................... 98 Appendix A. Teacher Risk Perception Survey ..................................................... 99 Appendix B. Card Sort Items ............................................................................ 105 RESEARCH STUDY II. GRADUATE TEACHING ASSISTANTS AND THE RISKS AND BENEFITS OF BIOTECHNOLOGY: PRACTICE AND PERSPECTIVES ............... 106 Introduction ........................................................................................................... 107 GTAs and STS ...................................................................................................... 108 Methods ................................................................................................................ 111 Contexts and Participants .................................................................................. 111 Instructional Content ........................................................................................ 112 Data Collection ................................................................................................. 113 Data Analysis ................................................................................................... 114 Results .................................................................................................................. 115 Instructional Frames ......................................................................................... 115 Interview Themes ............................................................................................. 119 Discussion ............................................................................................................. 126 References ............................................................................................................. 130 Appendices............................................................................................................. 134 Appendix A. Outline Format of Power-Point Lecture Template ........................ 135 Appendix B. Interview Protocol ........................................................................ 136
vi
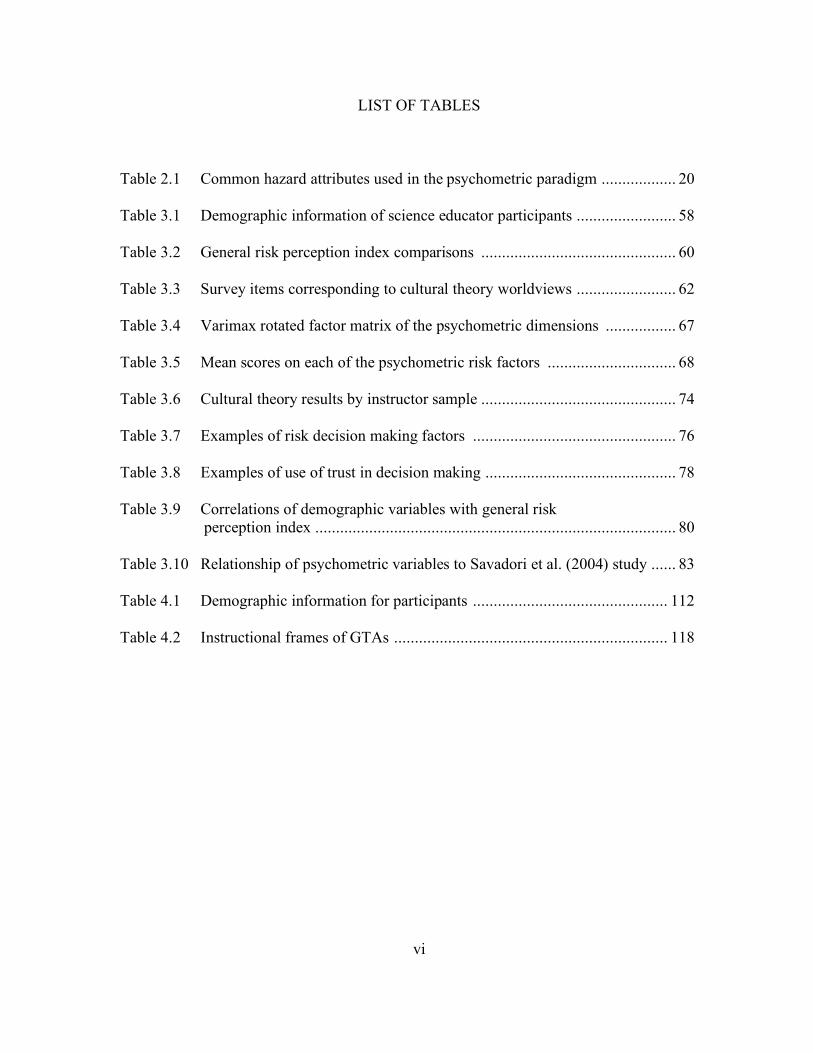
LIST OF TABLES Table 2.1 Common hazard attributes used in the psychometric paradigm .................. 20 Table 3.1 Demographic information of science educator participants ........................ 58 Table 3.2 General risk perception index comparisons ............................................... 60 Table 3.3 Survey items corresponding to cultural theory worldviews ........................ 62 Table 3.4 Varimax rotated factor matrix of the psychometric dimensions ................. 67 Table 3.5 Mean scores on each of the psychometric risk factors ............................... 68 Table 3.6 Cultural theory results by instructor sample ............................................... 74 Table 3.7 Examples of risk decision making factors ................................................. 76 Table 3.8 Examples of use of trust in decision making .............................................. 78 Table 3.9 Correlations of demographic variables with general risk perception index ....................................................................................... 80 Table 3.10 Relationship of psychometric variables to Savadori et al. (2004) study ...... 83 Table 4.1 Demographic information for participants ............................................... 112 Table 4.2 Instructional frames of GTAs .................................................................. 118
vii
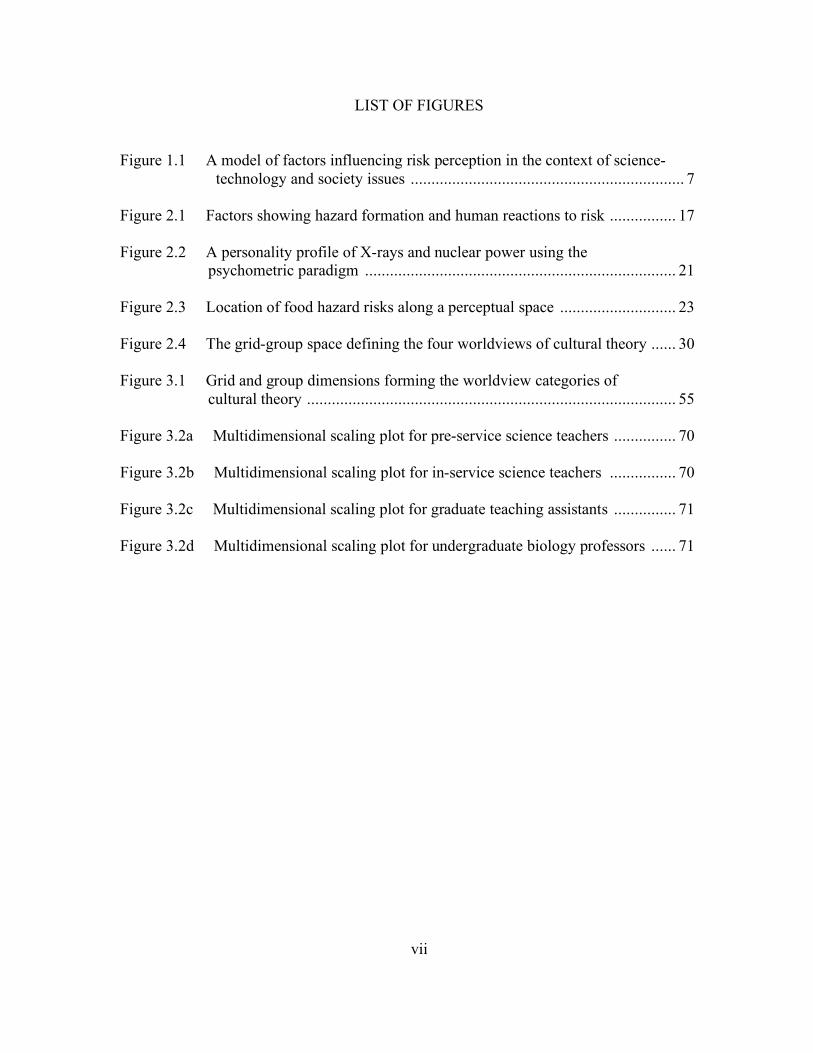
LIST OF FIGURES
Figure 1.1 A model of factors influencing risk perception in the context of science-
technology and society issues .................................................................. 7 Figure 2.1 Factors showing hazard formation and human reactions to risk ................ 17 Figure 2.2 A personality profile of X-rays and nuclear power using the psychometric paradigm ........................................................................... 21 Figure 2.3 Location of food hazard risks along a perceptual space ............................ 23 Figure 2.4 The grid-group space defining the four worldviews of cultural theory ...... 30 Figure 3.1 Grid and group dimensions forming the worldview categories of cultural theory ......................................................................................... 55 Figure 3.2a Multidimensional scaling plot for pre-service science teachers ............... 70 Figure 3.2b Multidimensional scaling plot for in-service science teachers ................ 70 Figure 3.2c Multidimensional scaling plot for graduate teaching assistants ............... 71 Figure 3.2d Multidimensional scaling plot for undergraduate biology professors ...... 71

1
INTRODUCTION
Risk, Science, and Technology Education
2
Science, Technology, and Society
The pursuit of scientific and technological innovation has a long history in American
culture. For example, breakthroughs in military technology applicable to civilian life have
arisen during our nations’ global conflicts. More recently, the United States has been at the
forefront of research and development in information technology as well as in areas of
health-care and pharmaceuticals. Scaffolding and maintaining national interest in innovative
science and technology are science educators at all levels who have the responsibility of
preparing informed citizens to participate and work in modern society (DeBoer, 1991).
Research and development in science and technology continues to advance at an
exponential rate. Many of these technologies are considered “emergent” in that much of the
theoretical science behind them is understood but practical applications are either limited or
are still in the process of development. Some examples of current emergent technologies
include advances in nanotechnology, information technology, and biotechnology (Trefil,
2008).
The novelty of emergent technologies means that many of the greater impacts of
derived applications on society are uncertain (ESTO, 2001). Scientific uncertainty can result
in public opposition to development of new technologies, largely due to a lack of personal
knowledge or heightened fear surrounding human health risks (Slovic, Fischoff, &
Lichtenstein, 1979). For example, genetically modified (GM) foods have met with opposition
in the United Kingdom despite expert reassurance of their safety (Gaskell, Bauer, Durant, &
Allum, 1999). How are science educators to deal with the uncertainties surrounding the risks
3
of emergent technologies in order to prepare future citizens for public participation in this
critical discourse?
In order to negotiate the complex challenges posed by the development of emergent
technologies, future citizens need a certain level of science literacy. Promotion of science
literacy has been recognized as a goal of formal science education that should be nurtured as
early as possible (Bybee, 1997; Trefil, 2008). However, definitions of science literacy remain
a source of vigorous debate (Roberts, 2007). Trefil (2008) offers a definition for science
literacy as, “the matrix of knowledge needed to understand enough about the physical
universe to deal with issues that come across our horizon, in the news or elsewhere (p. 28).”
Although broad, this definition is intuitively appealing and will be the conceptualization used
for the remainder of this discussion.
STS and Risk Perception
In the context of emergent science and technology, student understanding of the
interactions of science-technology-society (STS) is one component of science literacy that
could be especially relevant. In its simplest form, objectives of STS curricula involve an
understanding of the interactions of science and technology within a social context.
Aikenhead (1994) describes STS approaches as those that focus on:
[A] technological artifact, process or expertise; the interaction between technology
and society; a societal issue related to science or technology; social science content
that sheds light on a societal issue related to science and technology; a philosophical,
historical, or social issue within the scientific or technological community (p. 52-53).
4
A mature understanding of issues in STS requires not only an understanding of the relevant
content and theory, but also of the nature of science and technology and the science processes
required to produce the technology (Hodson, 1988). This is not to imply that understanding
issues of STS are more important than ideas such as the nature of science and technology in
general. The interaction and importance of these concepts is admittedly complex within the
greater framework of science literacy.
One of the primary objectives of STS education is to evoke positive affective
responses in students to science and technology. By highlighting the relevance of science and
technology to students’ daily lives, the argument is that students will develop more positive
attitudes toward STS issues (Bennett, Lubben, & Hogarth, 2007). Attitudes can be broadly
defined as the degree of positive or negative emotive or behavioral responses toward a
particular object or event. The magnitude and direction of an attitude can affect intentions,
behavioral responses, and decision-making regarding STS issues (Dawson & Soames, 2006).
Outside of the classroom, one of the most prevalent STS contexts that students
encounter related to emergent technologies is the risk to society posed by their development.
This is often the focus of the popular news media (Jarman & McClune, 2007). Risks of
emergent technologies can be directed toward human health, the environment, cultural
worldviews, and numerous other foci. Both the Benchmarks for science literacy (AAAS,
1993) and the National science education standards (NRC, 1996) suggest that students
should learn about risk, risk analysis, the need for trade-offs among risks and benefits,
thinking critically about risks and benefits, and how risk perception influences individual
5
decision-making. For example, the Benchmarks for science literacy (AAAS, 1993) section
discussing the nature of technology suggests that high school students should:
… realize that analyzing risk entails looking at probabilities of events and at how bad
the events would be if they were to happen. Through surveys and interviews, students
can learn that comparing risks is difficult because people vary greatly in their
perception of risk, which tends to be influenced by such matters as whether the risk is
gradual or instantaneous (global warming versus plane crashes), how much control
people think they have over the risk (cigarette smoking versus being struck by
lightning), and how the risk is expressed (the number of people affected versus the
proportion affected) (section 3.B).
These goals are further supported by both risk (Biscoe, 1992) and education researchers
(Riechard, 1993) who call for a focus on risk literacy in public education.
In the formation of attitudes toward emerging technologies, understanding issues of
risk and how they might be perceived are extremely important (Sjöberg, 2002). Risk
perception is a broad concept that refers to how individuals choose to process and interpret
information about risk. Constructing perceptions about the risks surrounding the research and
development of emergent technologies is one of the critical factors in swaying attitudes in
one direction along the positive-negative continuum. For example, if you perceive an
application as particularly risky to your health or the health of your family your attitude
toward that application will be affected. Additionally, individuals have been found to form
generalized attitudes about science and technology that are consistent across science contexts
even when considering issues that they know very little about (Cobb & Macoubrie, 2004;
Gardner et al., 2008). Behavioral responses due to perceptions of risk can include such things
6
avoidance of products, managing personal and social risks, information seeking behavior,
and willingness to participate in discourses and decision making about risk issues.
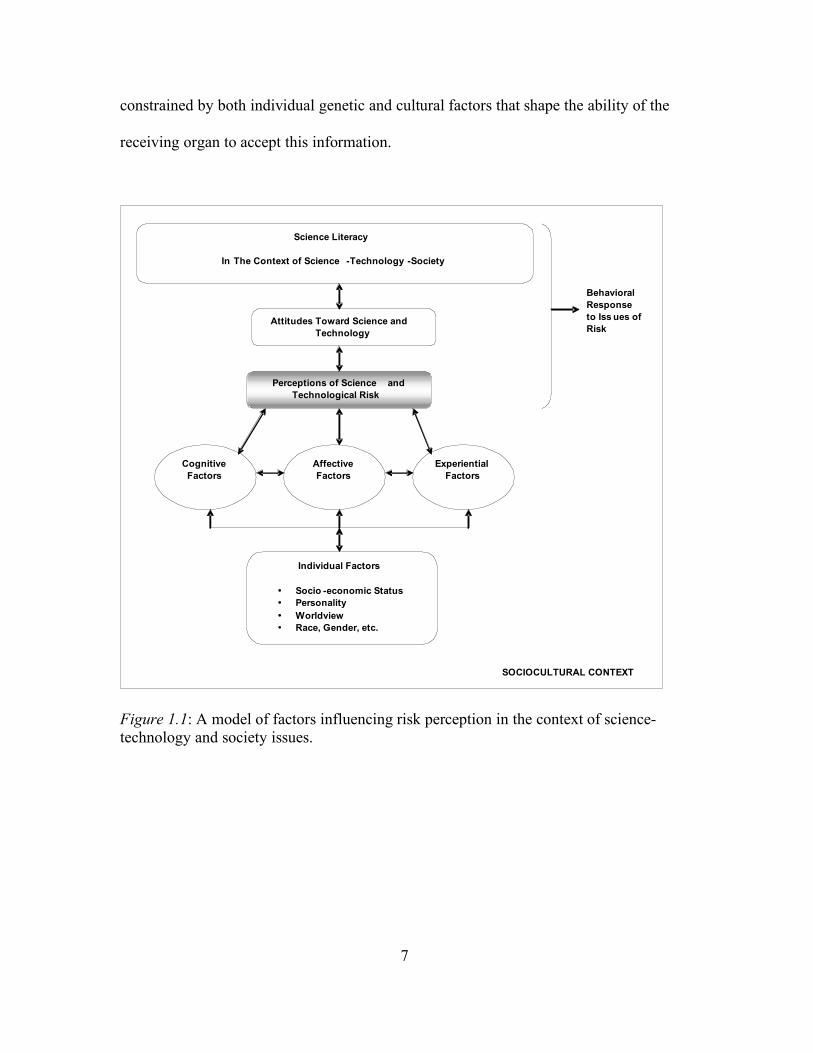
The perception of risks associated with science and technology can be influenced by
numerous factors (Sjöberg, 2008). In response to this complexity, a model developed by the
researchers is presented below. Factors directly contributing to perceptions of science and
technological risk can be broadly delineated into cognitive, affective, and experiential
(Figure 1.1). These are the lenses through which individuals filter issues of risk and which
shape their perceptions. These factors are not independent; each one affects and mediates the
others. Cognitive factors refer to the ways that individuals use conscious thought to mentally
manipulate information. Examples of cognitive factors include how individuals rationally
deal with factual information or their reflective judgment about controversial issues. Affective
factors are emotional and visceral responses to risk such as fear associated with a particularly
tragic incident (i.e. the 911 attacks). Finally, experiential factors are the personal interactions
that individuals have had with science and technology, including formal education. All of
these factors are dynamic, in that they are variable between contexts and across time (they
have a developmental component) and exist within a larger sociocultural context.
The perception of the risks associated with science and technology are also
constrained by individual factors. Sociocultural characteristics such as personality,
worldview, gender, race and socio-economic status all limit how an individual views
information through the cognitive, affective, and experiential lenses. To extend a metaphor,
risk perception is the construction and interpretation of risk information much like visual
perception is the construction and interpretation of visual information. Visual perception is
7
constrained by both individual genetic and cultural factors that shape the ability of the
receiving organ to accept this information.
!
Science Literacy
In The Context of Science -Technology -Society
Attitudes Toward Science and
Technology
Perceptions of Science and
Technological Risk
Behavioral
Response
to Iss ues of
Risk
Cognitive
Factors
Affective
Factors
Experiential
Factors
Individual Factors
• Socio -economic Status
• Personality
• Worldview
• Race, Gender, etc.
SOCIOCULTURAL CONTEXT
Figure 1.1: A model of factors influencing risk perception in the context of science-technology and society issues.
8
Document Context and Organization
Few studies examine students’ understanding and perceptions of the risks of science
and technology specifically (Covitt, Gomez-Schmidt, & Zint, 2005; Gardner et al., 2008),
although some have evaluated attitudes from a general perspective (Lamanauskas &
Makarskaité-Petkeviciené, 2008; Prokop, Leskova, Kubiatko, & Diran, 2007; Sáez, Niño, &
Carretaro, 2008). In addition, there are no known studies that specifically examine teachers’
perceptions of the risks of science and technology. An understanding of instructors’ risk
perceptions is important, because reflective knowledge of this topic will likely influence their
beliefs about the social intersection of emergent science and technology as well as their
subsequent pedagogical practice when addressing STS themes. The following study has two
goals: (a) assess the risk perception of an emergent technology (biotechnology) of various
groups of science educators, and (b) examine how a specific group of science teachers
(science graduate teaching assistants) view the role of risk in the teaching of STS-related
issues.
The document that follows is organized into three chapters addressing the research
conducted in partial fulfillment of requirements for a doctorate in Science Education. The
first chapter provides an overview of research in the risk perception of science and
technology and is intended to provide the reader with a global view of the frameworks
utilized in the study. The discussion covers the history and usage of risk research frameworks
in the context of science and technology and further provides a justification for their use in
educational contexts.
9
The second chapter consists of a research manuscript that describes phase one of the
dissertation research in which four samples of science educators (pre-service science
teachers, in-service science teachers, biology graduate teaching assistants, and undergraduate
professors of biology) were surveyed to determine their perceptions of the risks of
biotechnology. Quantitative and qualitative data were analyzed using established risk
perception frameworks to understand what aspects of biotechnology instructors found
particularly risky and what factors might explain these formed perceptions. Differential risk
perception is compared and contrasted for the four teacher groups as well. Implications of
teacher perceptions and attitudes toward the teaching of emergent are discussed.
The third chapter is a research manuscript that details phase two of the study. In this
phase, biology graduate teaching assistants were provided with a lecture outline regarding
genetically modified crops and their potential social and environmental risks and benefits.
Data sources consisted of teacher observations and post-lecture semi-structured interviews.
An interpretive approach was used to analyze the qualitative data sources. Topics of concern
consisted of science graduate teaching assistants’ views of the role of risk in STS curricula.
10
References
Aikenhead, G. (1994). What is STS teaching? In J. Solomon & G. Aikenhead (Eds.), STS
education: International perspectives on reform. New York, NY: Teachers College
Press.
American Association for the Advancement of Science (AAAS). (1993). Benchmarks for
science literacy. New York, NY: Oxford University Press.
Bennett, J., Lubben, F., & Hogarth, S. (2007). Bringing science to life: A synthesis of the
research evidence on the effects of context-based and STS approaches to science
teaching. Science Education, 91, 347-370.
Biscoe, G. J. (1992). Need for risk standards and education. Risk Analysis, 12, 331.
Bybee, R. W. (1997). Achieving scientific literacy—from purpose to practices. Portsmouth,
NH: Heinemann.
Cobb, M. D., & Macoubrie, J. (2004). Public perceptions about nanotechnology: Risks,
benefits, and trust. Journal of Nanoparticle Research, 6, 395-405.
Covitt, B. A., Gomez-Schmidt, C., & Zint, M. T. (2005). An evaluation of the risk education
module. Journal of Environmental Education, 36(2), 3-13.
Dawson, V. & Soames, C. (2006). The effect of biotechnology education on Australian high
school students’ understanding and attitudes about biotechnology processes. Research
in Science & Technological Education, 24, 183-198.
DeBoer, G. E. (1991). A history of ideas in science education: Implications for practice. New
York, NY: Teachers College Press.
11
ESTO. (2001). On science and precaution in the management of technological risk. In A.
Stirling (Ed.), European Commission Joint Research Center and European Science
and Technology Observatory (EUR 19056/EN/2).
Gardner, G. E., Jones, M. G., Taylor, A. R., Forrester, J. H., Krebs, D., & Robertson, L.
(2008). Undergraduate engineering students’ perceptions of the risks and benefits
associated with nanotechnology. Manuscript submitted for publication.
Gaskell, G., Bauer, M. W., Durant, J., & Allum, N. C. (1999). Worlds apart? The reception
of genetically modified foods in Europe and the U.S. Science, 285, 384-387.
Hodson, D. (1988). Toward a philosophically more valid science curriculum. Science
Education, 72, 19-40.
Jarman, R., & McClune, B. (2007). Developing scientific literacy: Using news media in the
classroom. New York, NY: Open University Press.
Lamanauskas, V., & Makarskaité-Petkeviciené, R. (2008). Lithuanian university students’
knowledge of biotechnology and their attitudes toward the taught subject. Eurasia
Journal of Mathematics, Science, & Technology Education, 4, 269-277.
National Research Council (NRC). (1996). National science education standards.
Washington, DC: National Academy Press.
Prokop, P., Leskova, A., Kubiatko, M., & Diran, C. (2007). Slovakian students’ knowledge
and attitudes toward biotechnology. International Journal of Science Education, 29,
895-907.
12
Riechard, D. E. (1993). Risk literacy: Is it the missing link in environmental education?
Journal of Environmental Education, 25(1), 8-12.
Roberts, D. A. (2007). Scientific literacy/science literacy. In S. K. Abell & N. G. Lederman
(Eds.) Handbook of research on science education (pp. 729-780). Mahwah, NJ:
Lawrence Erlbaum Associates.
Sáez, M. J., Niño, A. G., & Carretero, A. (2008). Matching society values: Students’ views of
biotechnology. International Journal of Science Education, 30, 167-183.
Sjöberg, L. (2002). Attitudes toward technology and risk: Going beyond what is immediately
given. Policy Sciences, 35, 379-400.
Sjöberg, L. (2008). Genetically modified food in the eyes of the public and experts. Risk
Management, 10, 168-193.
Slovic, P., Fischoff, B., & Lichtenstein, S. (1979). Rating the risks. Environment, 21(3), 14-
20, 36-39.
Trefil, J. (2008). Why Science? Arlington, VA: NSTA Press.

13
BACKGROUND
Research Trends in the Risk Perception of Science and Technology
14
Introduction
On a daily basis, individuals make a multitude of seemingly unimportant and often
unconscious decisions about the risks and benefits of their actions. In a somewhat satirical
introduction to his manuscript, Wilson (1979) states, “from the moment I climb out of bed I
start taking risks” (p. 41). He then proceeds to analyze risk decisions that he makes in a
single day: from turning on a light in his house (risk of electrocution due to out-dated wiring)
to his choice of drinking water (risk of chloroform poisoning due to hyper-concentration of
anti-microbial chlorine). The conclusion is apparent: risk is ubiquitous and unavoidable, yet
individuals frequently take for granted many of the common risks associated with day-to-day
life.
People typically notice low probability/high consequence (LP/HC) risks. Many of
these LP/HC hazard concerns are applications associated with science and technology. For
example, risks associated with the fracturing of nuclear reactors or a toxic chemical spill in a
populated area are examples that spark conversation and gain media attention much more
than the risk of death from a single automobile accident (Waller & Covello, 1984). In
addition, the media often features risks and benefits of emergent technologies as important to
the discourse of innovative science (Jarman & McClune, 2007).
The science supporting emergent technologies is often uncertain because of a lack of
extensive longitudinal research. The general public tends to view uncertainty with fear, and
fear garners people’s attention. Examples of emergent research that people view as risky due
to high levels of uncertainty include carbon capture and storage technology, genetically
modified organisms, and nanotechnology (Flynn, 2006). Why do low probability/high
15
consequence events and the uncertainty associated with emergent science and technology
monopolize the publics’ attention? The challenge lies in understanding the perception of risk
of emergent science and technology.
Defining Risk
In order to better understand the construct of risk, it is necessary to define the term
“hazard” which refers to negative or undesired impacts of a particular event (Wachbroit,
1991). Risk is defined as the probability or likelihood of the occurrence of a hazard. This
scientific-technical or rationalist perspective numerically quantifies risk through values, such
as the number of people the hazard effects or thresholds of toxicity for particular harmful
agents (Renn, 1992). Depending on the hazard, these numbers can vary dramatically.
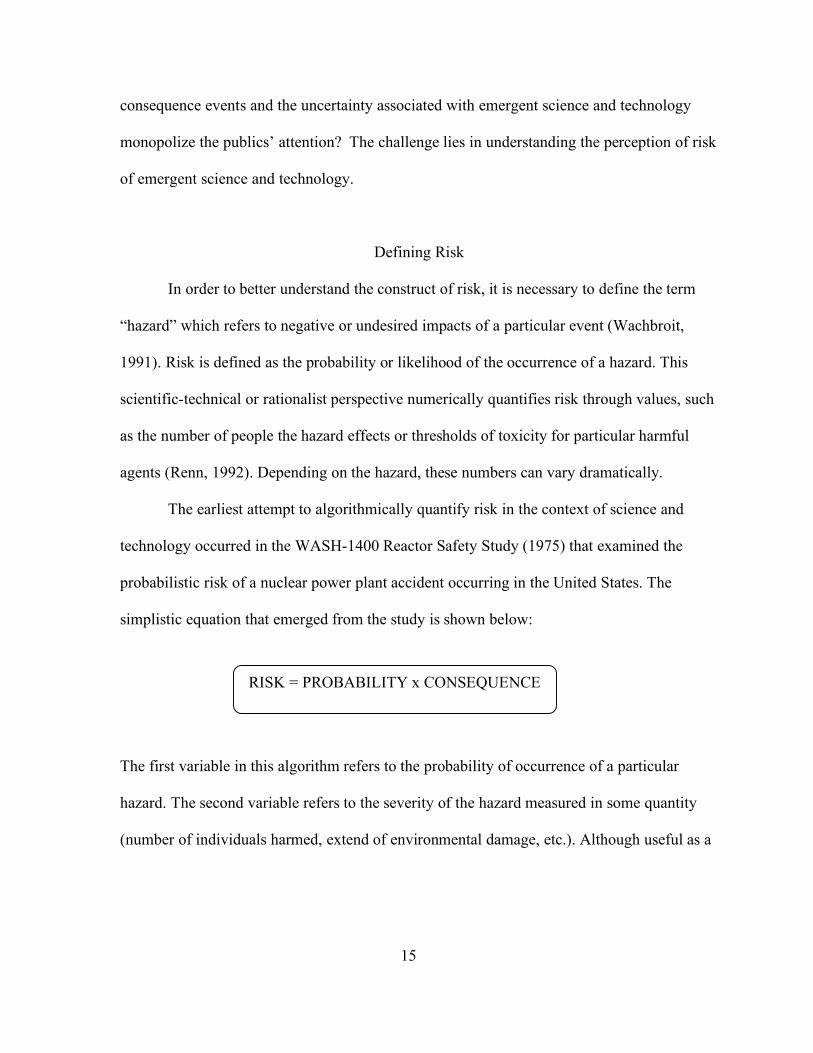
The earliest attempt to algorithmically quantify risk in the context of science and
technology occurred in the WASH-1400 Reactor Safety Study (1975) that examined the
probabilistic risk of a nuclear power plant accident occurring in the United States. The
simplistic equation that emerged from the study is shown below:
The first variable in this algorithm refers to the probability of occurrence of a particular
hazard. The second variable refers to the severity of the hazard measured in some quantity
(number of individuals harmed, extend of environmental damage, etc.). Although useful as a
RISK = PROBABILITY x CONSEQUENCE
16
heuristic, this two-dimensional definition of risk is nothing more than a simplification for a
construct that is in reality multi-dimensional (Kaplan & Garrick, 1981).
To further complicate the definition, a rationalist perspective is only one way to
define risk within a sociocultural context. For example, why are there more people afraid to
fly than drive when data shows auto accidents kill far more people than plane crashes every
year? This has to do with how people use and interpret numerical risk data. Individuals do
not necessarily use technical probabilities as the most relevant information in decision-
making regarding issues of risk, but instead often rely on cognitive short-cuts (heuristics) and
biases born of personal experience and other cognitive and affective factors (Tversky &
Kahneman, 1974). According to Slovic, Fischoff, and Lichtenstein (1979), “the hard facts
only go so far and then human judgment is needed to interpret the findings and determine
their relevance for the future (p. 14).”
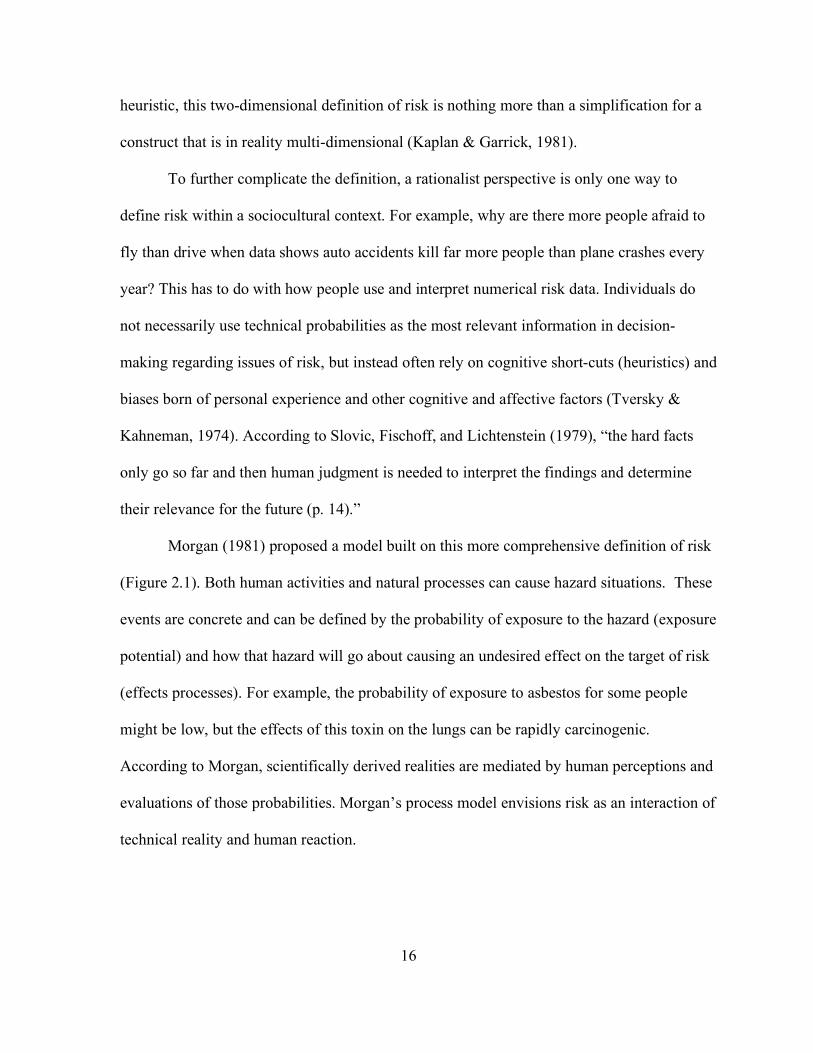
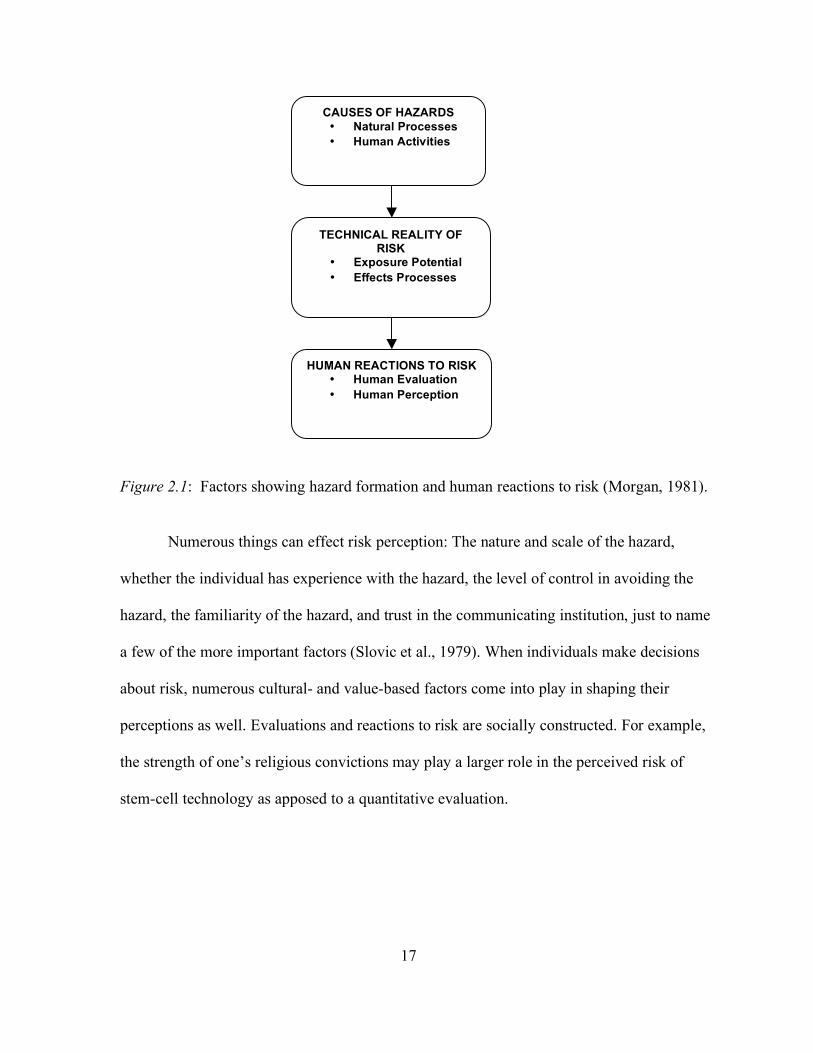
Morgan (1981) proposed a model built on this more comprehensive definition of risk
(Figure 2.1). Both human activities and natural processes can cause hazard situations. These
events are concrete and can be defined by the probability of exposure to the hazard (exposure
potential) and how that hazard will go about causing an undesired effect on the target of risk
(effects processes). For example, the probability of exposure to asbestos for some people
might be low, but the effects of this toxin on the lungs can be rapidly carcinogenic.
According to Morgan, scientifically derived realities are mediated by human perceptions and
evaluations of those probabilities. Morgan’s process model envisions risk as an interaction of
technical reality and human reaction.
17
Figure 2.1: Factors showing hazard formation and human reactions to risk (Morgan, 1981). Numerous things can effect risk perception: The nature and scale of the hazard,
whether the individual has experience with the hazard, the level of control in avoiding the
hazard, the familiarity of the hazard, and trust in the communicating institution, just to name
a few of the more important factors (Slovic et al., 1979). When individuals make decisions
about risk, numerous cultural- and value-based factors come into play in shaping their
perceptions as well. Evaluations and reactions to risk are socially constructed. For example,
the strength of one’s religious convictions may play a larger role in the perceived risk of
stem-cell technology as apposed to a quantitative evaluation.
CAUSES OF HAZARDS • Natural Processes • Human Activities
TECHNICAL REALITY OF RISK
• Exposure Potential • Effects Processes
HUMAN REACTIONS TO RISK • Human Evaluation • Human Perception
18
How then is risk to be conceptualized? Is it strictly numerical and probabilistic or a
social construction of those who must evaluate its significance? Many risk researchers prefer
to envision the risk construct as lying along a continuum (Bradbury, 1989; Lupton, 1999). At
one end of the scale is a consideration of risk as purely quantifiable and at the other end is the
conceptualization of risk as a purely social construct. This becomes a useful tool depending
upon the goal of the research agenda and helps situate risk research frameworks.
Risk Research Frameworks
Renn (1992) reviewed and synthesized the common frameworks and methodologies
used in risk analysis. He classified risk frameworks in terms of their common contextual uses
and analytical methods. Those frameworks that lie mostly on the scientific-technical end of
the risk spectrum included: actuarial approaches involving methods of statistical prediction
and inferential extrapolation, epidemiological-toxicological approaches involving the
analysis of health impacts on communities, engineering approaches involving probabilistic
event analysis, and economic approaches involving cost-benefit analyses.
Those frameworks that rely more heavily on socially constructed views of risk
included: social theories involving case study analyses of complex social interactions with
and reaction to risk events, cultural theories involving grid-group analyses, and psychological
theories involving psychometric analyses. Although distinct, all of these frameworks have
yielded significant insights in the field of risk research (Marris, Langford, & O’Riordan,
19
1996). The psychometric paradigm of risk and the cultural theory of risk will be discussed
below.
The Psychometric Paradigm
History and Theory
The psychometric paradigm grew out of critiques of a paper by Starr (1969) who
attempted to quantify how societies decide the acceptability of risky activities. His
conclusions were as follows: a) acceptability of risk is roughly proportional to the third
power of the potential benefits, b) the general public will accept voluntary risks that are
roughly 1,000 times greater than involuntary risks if benefits are held constant, and c)
acceptability of risk is inversely proportional to the number of persons exposed. The
assumptions and generalizability of Starr’s work have been critiqued extensively (Fischoff,
Slovic, & Lichtenstein, 1979). However, limitations of these studies led to subsequent
research that attempted to quantify hazard characteristics and reveal a more complete picture
of how risk is being perceived. Some of these limitations will be discussed later in this
section.
Slovic and colleagues who developed the psychometric paradigm of risk perception,
borrowed from personality theory and asked participants to rate various qualities of hazards
along a Likert scale. Over the history of psychometric research, numerous (sometimes
upwards of 18) hazard “personality” characteristics have been identified and examined, with
the most widely used of these listed below (Table 2.1). From this data researchers quantify
characteristics and create “personality profiles” of specific hazards (Figure 2.2). These
20
psychometric analyses then allow for comparisons between various characteristics of hazards
that are often useful in determining policy decisions (Slovic et al., 1979).
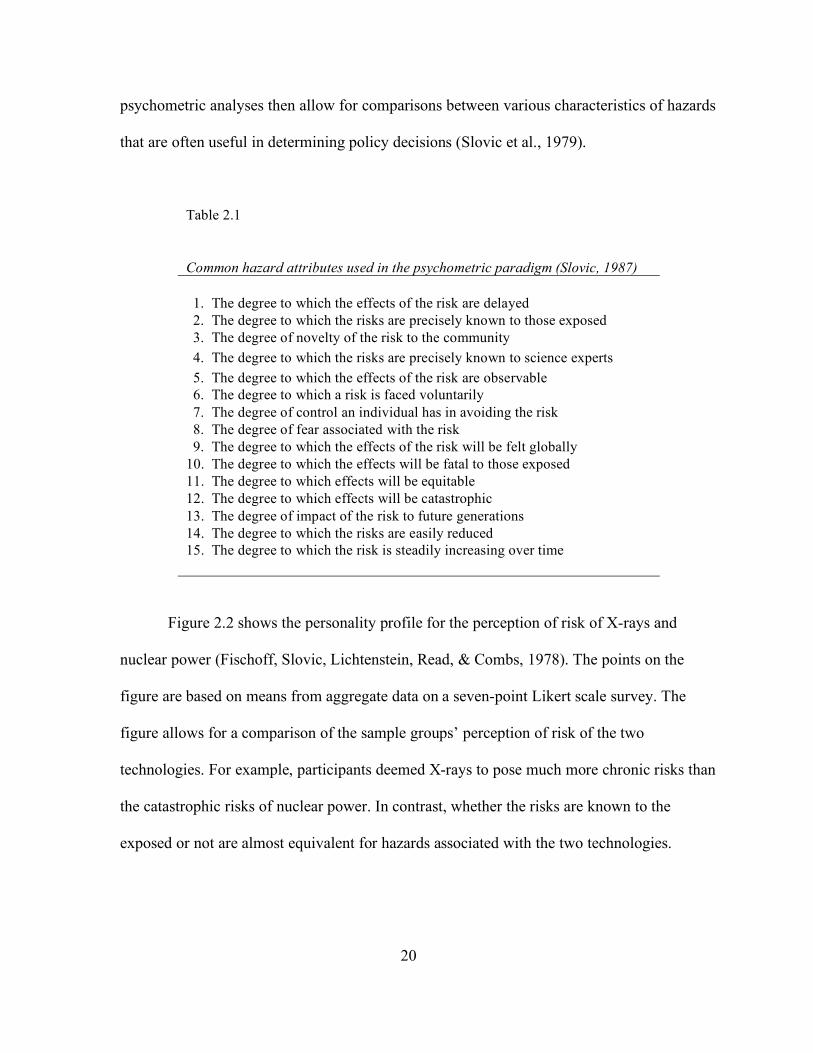
Table 2.1
Common hazard attributes used in the psychometric paradigm (Slovic, 1987) 1. The degree to which the effects of the risk are delayed 2. The degree to which the risks are precisely known to those exposed 3. The degree of novelty of the risk to the community 4. The degree to which the risks are precisely known to science experts 5. The degree to which the effects of the risk are observable 6. The degree to which a risk is faced voluntarily 7. The degree of control an individual has in avoiding the risk 8. The degree of fear associated with the risk 9. The degree to which the effects of the risk will be felt globally 10. The degree to which the effects will be fatal to those exposed 11. The degree to which effects will be equitable 12. The degree to which effects will be catastrophic 13. The degree of impact of the risk to future generations 14. The degree to which the risks are easily reduced 15. The degree to which the risk is steadily increasing over time
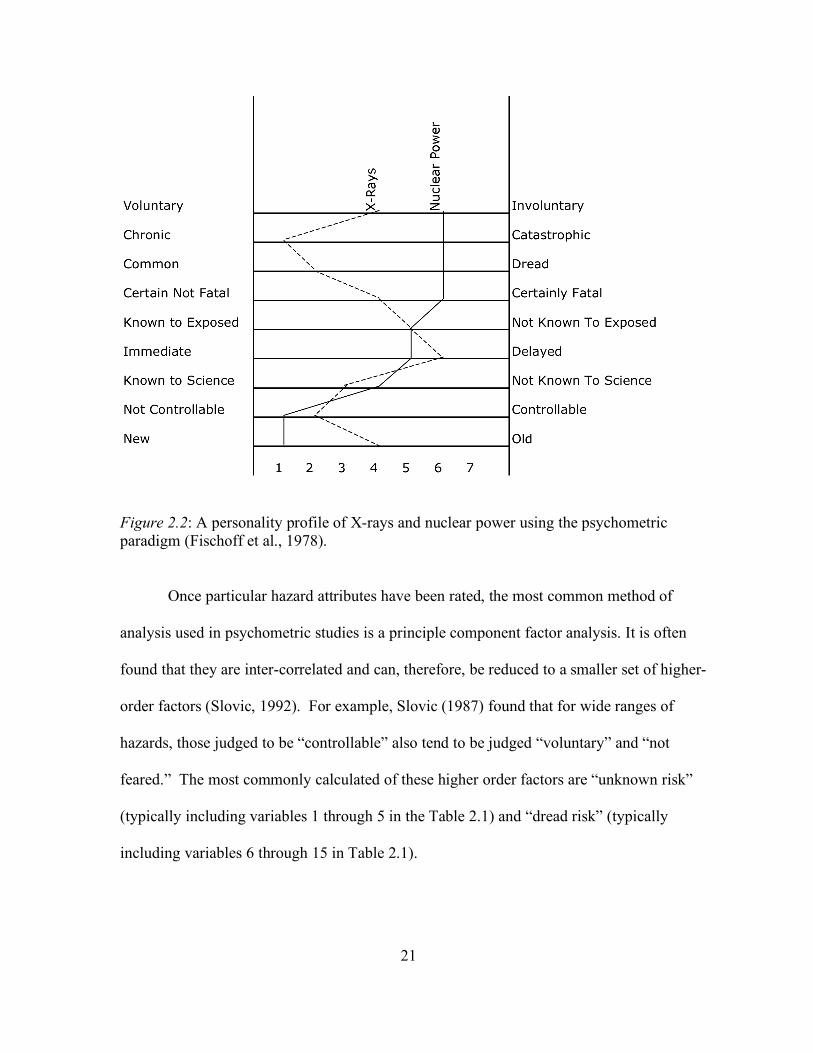
Figure 2.2 shows the personality profile for the perception of risk of X-rays and
nuclear power (Fischoff, Slovic, Lichtenstein, Read, & Combs, 1978). The points on the
figure are based on means from aggregate data on a seven-point Likert scale survey. The
figure allows for a comparison of the sample groups’ perception of risk of the two
technologies. For example, participants deemed X-rays to pose much more chronic risks than
the catastrophic risks of nuclear power. In contrast, whether the risks are known to the
exposed or not are almost equivalent for hazards associated with the two technologies.
21
Figure 2.2: A personality profile of X-rays and nuclear power using the psychometric paradigm (Fischoff et al., 1978). Once particular hazard attributes have been rated, the most common method of
analysis used in psychometric studies is a principle component factor analysis. It is often
found that they are inter-correlated and can, therefore, be reduced to a smaller set of higher-
order factors (Slovic, 1992). For example, Slovic (1987) found that for wide ranges of
hazards, those judged to be “controllable” also tend to be judged “voluntary” and “not
feared.” The most commonly calculated of these higher order factors are “unknown risk”
(typically including variables 1 through 5 in the Table 2.1) and “dread risk” (typically
including variables 6 through 15 in Table 2.1).
22
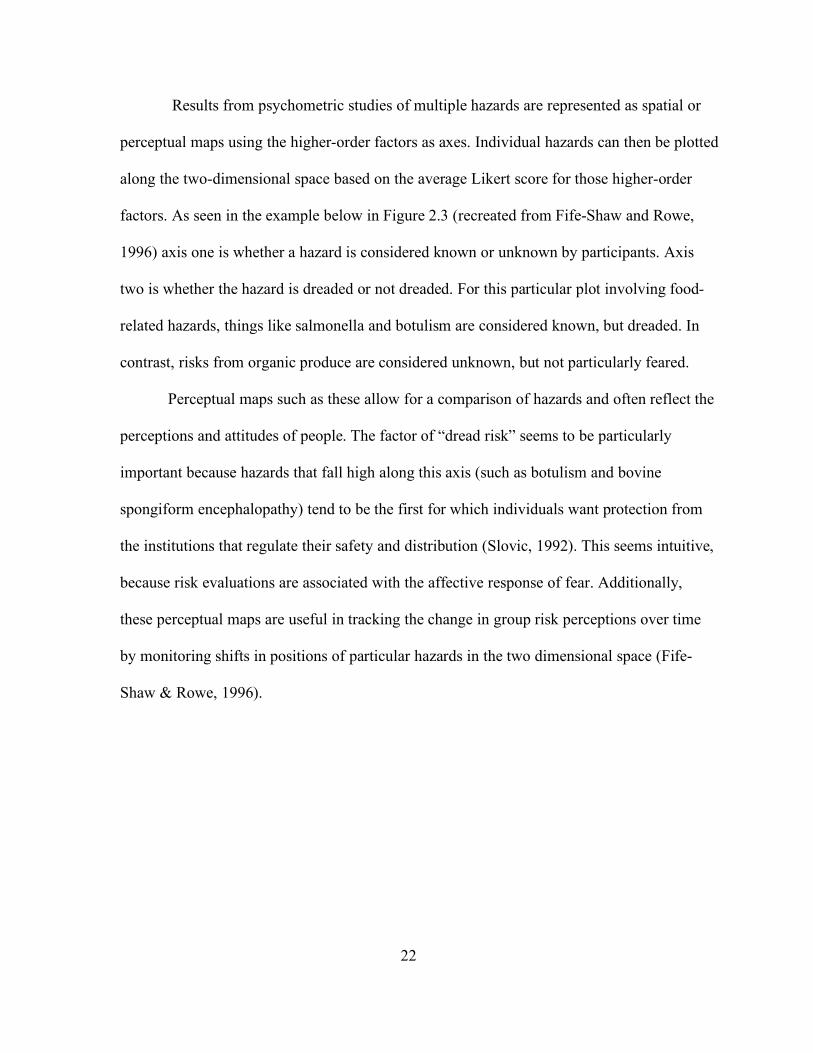
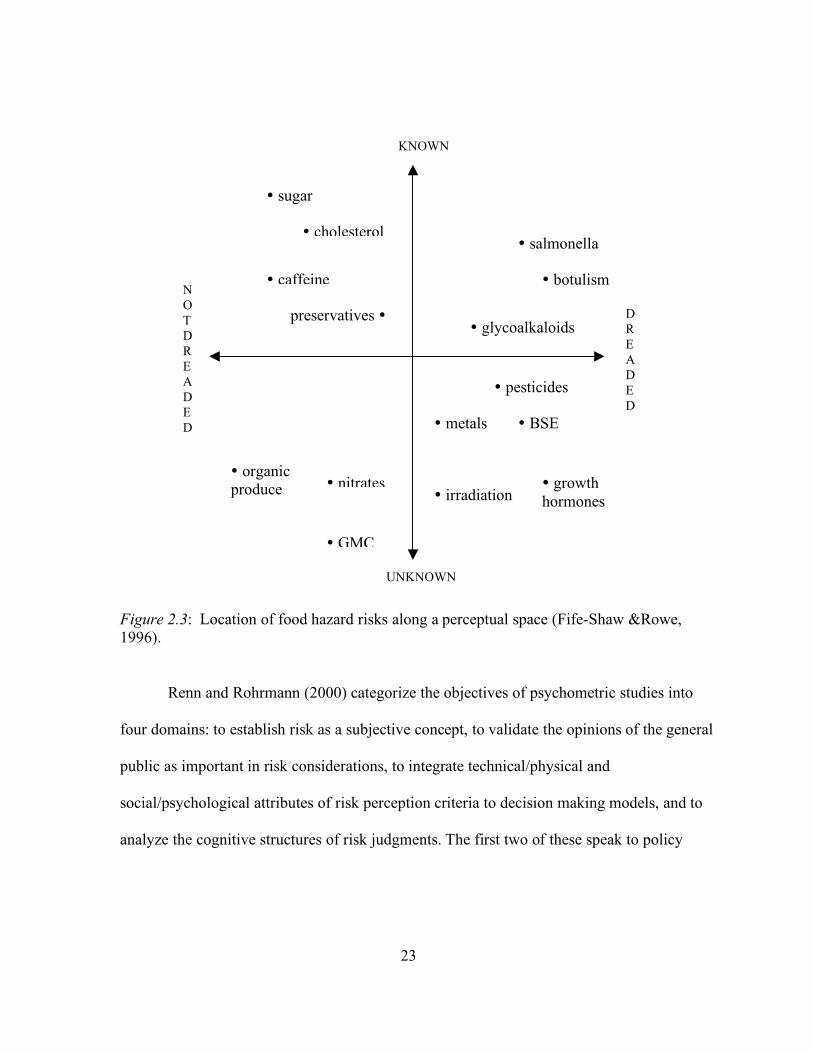
Results from psychometric studies of multiple hazards are represented as spatial or
perceptual maps using the higher-order factors as axes. Individual hazards can then be plotted
along the two-dimensional space based on the average Likert score for those higher-order
factors. As seen in the example below in Figure 2.3 (recreated from Fife-Shaw and Rowe,
1996) axis one is whether a hazard is considered known or unknown by participants. Axis
two is whether the hazard is dreaded or not dreaded. For this particular plot involving food-
related hazards, things like salmonella and botulism are considered known, but dreaded. In
contrast, risks from organic produce are considered unknown, but not particularly feared.
Perceptual maps such as these allow for a comparison of hazards and often reflect the
perceptions and attitudes of people. The factor of “dread risk” seems to be particularly
important because hazards that fall high along this axis (such as botulism and bovine
spongiform encephalopathy) tend to be the first for which individuals want protection from
the institutions that regulate their safety and distribution (Slovic, 1992). This seems intuitive,
because risk evaluations are associated with the affective response of fear. Additionally,
these perceptual maps are useful in tracking the change in group risk perceptions over time
by monitoring shifts in positions of particular hazards in the two dimensional space (Fife-
Shaw & Rowe, 1996).
23
Figure 2.3: Location of food hazard risks along a perceptual space (Fife-Shaw &Rowe, 1996).
Renn and Rohrmann (2000) categorize the objectives of psychometric studies into
four domains: to establish risk as a subjective concept, to validate the opinions of the general
public as important in risk considerations, to integrate technical/physical and
social/psychological attributes of risk perception criteria to decision making models, and to
analyze the cognitive structures of risk judgments. The first two of these speak to policy
KNOWN
UNKNOWN
NOT DREADED
DREADED
sugar
salmonella
botulism
organic produce
BSE
caffeine
cholesterol
preservatives glycoalkaloids
pesticides
metals
growth hormones irradiation
GMC
nitrates
24
agendas of risk researchers in response to scientific experts’ technical risk assessments and
their subsequent devaluing of public opinion on issues of policy.
In general, one of the major objectives of psychometric research has been to
understand the structural differences in risk perception between different samples of
individuals. Studies utilizing the psychometric paradigm have found that differences in risk
perception exist between cultures (Savadori, Rumiati, & Bonini, 1998; Slovic, 1992), races
(Flynn, Slovic, & Mertz, 1994), and genders (Gustafson, 1998). For example, men and
women tend to worry about the same aspects of risk, but men systematically worry less. This
has been explained as a result of the social construction of gender roles and how these roles
reflect the focus of concern for particular genders (Gustafoson, 1998). Although interesting,
research along this strand has not been as common in the past decade.
The most commonly emphasized difference between groups in psychometric studies
is that of science experts and what are commonly called “laypersons” (this term is not meant
to be perjorative and has become an accepted vernacular to refer to members of the general
public in this research strand).
Experts are seen as purveying risk assessments characterized as objective, analytic,
wise, and rational – based upon the real risks. In contrast, the public is seen to rely
upon perceptions of risk that are subjective, often hypothetical, emotionally foolish,
and irrational (Slovic, 1997, p. 278).
If there is an expert-lay gap in risk perception, the implications for public support of research
and development of science and technology as well as science education are significant.
25
Many of the studies of risk are based on the assumption that an expert-lay gap exists,
but the empirical evidence needed to make this assumption is limited. In a recent manuscript,
Rowe and Wright (2001) reviewed this body of literature to answer whether the quantitative,
“differences in expert and lay judgment [are] a myth or a reality?” Areas of science and
technology addressed in this review included the areas of chemical toxicology (Kraus,
Malmfors, & Slovic, 1992; Slovic, Malmfors, Krewski, Niel, & Barlett, 1995), nuclear waste
(Barke & Jenkins-Smith, 1993; Flynn, Slovic, & Mertz, 1993), ecological aquatic toxicology
(McDaniels, Axelrod, Cavanagh, & Slovic, 1997), oil and gas production (Wright, Pearman,
& Yardley, 2000), and global climate change (Lazo, Kinnell, & Fisher, 2000). Rowe and
Wright (2001) concluded that there is not enough evidence to determine if lay and expert
perceptions of risk are truly different. They assert that limitations in research designs of
many of these studies do not allow for definitive conclusions. Furthermore, expert and lay
samples rarely are defined explicitly and demographic factors often are not controlled for.
Despite these methodological concerns, research in this strand continues with little
resolution to the debate. In a more recent study, Savadori et al. (2004) examined the
perceptions of the risks of biotechnology of fifty-eight doctoral students in biology
(considered the expert sample) as compared to fifty-eight members of the general public. The
two samples differed, with experts perceiving less risk overall from biotechnology especially
in areas of food and medical related applications. Siegrist, Keller, Kastenholz, Frey, and
Wiek (2007) examined individuals’ risk perception of nanotechnology using psychometric
scales. They concluded that several perceptual variables were similar in experts and
laypersons. However, differences persisted with experts viewing nanotechnology as less
26
risky than the general public. Experts also had more trust in governing institutions to manage
nanotechnology risks equitably.
Sjöberg (2008) recently examined public and expert perceptions of genetically
modified foods (GMFs) partially within the psychometric framework. This research
differentiated between personal risk and general risk and found that experts judge personal
risk very similarly to how it is judged by the the general public. However, when the discourse
is shifted to general risk, experts seem to rely less on the subjective factors posed by the
psychometric paradigm and rely more on numerical probability and rationalistic evaluation.
An additional recent challenge to the psychometric paradigm is that it ignores “the
possibility of social, cultural and institutional factors [that] might affect the way in which
risks are understood and evaluated by individual members of the public” (Marris, Langford,
Saunderson, & O’Riordan, 1997, p. 304). When studies were conducted on individuals,
significant variability in risk perceptions appeared that are not apparent in analyses with
aggregate samples (Gardner & Gould, 1989). In other words, aggregate analyses tend to
over-estimate the similarities between members of the general public, when they are really a
widely heterogenous group. These variables included trust in the information-giving
institution or individual (Siegrist & Cvetkovich, 2000), the perceived benefits of the hazard
(Alhakami & Slovic, 1994), training in science (Karpowicz-Lazreg & Mullet, 1993),
personal experience with the hazard (Barnett & Breakwell, 2001) and numerous other
personality factors such as risk aversion (Chauvin, Hermand, & Mullet, 2007).
Studies utilizing the psychometric paradigm have confirmed that risk perception, like
any psychological construct, is complex and multi-faceted. The strength of the research
27
framework is that it allows for the risk construct to be fragmented into more useable chunks.
These chunks can then be quantified for comparing and contrasting risk perceptions of
individuals or groups. Research has provided a deeper understanding about why experts and
the general public may perceive risks differently on issues of science and technology.
Finally, individual variability will always be present, but carefully defined sample groups and
an awareness of potentially confounding individual factors will likely limit this variability in
aggregate studies.
Assumptions and Limitations
The psychometric paradigm is based on several assumptions, not the least of which is
that individuals can provide meaningful answers to difficult questions on survey forms. The
results also depend on the hazards studied, which characteristics are ascribed to the hazards,
and the method of data analysis. Additionally, these studies assess perceptions and not
behaviors (Slovic, 1992). Finally, studies utilizing the psychometric paradigm tend to focus
on what individuals use to rate hazards and how they distribute the value along hazard
characteristics. They do not tend to examine why people have those perceptions or why they
place value on specific attributes (Renn, 1992). In other words, psychometric studies are
answering questions as to the structure of risk perception and not the factors that might cause
it.
The use of the psychometric paradigm is not without its critics. Sjöberg (2000) argues
that researchers often attribute too much interpretive power to factor analytic methods. The
intention of factor analysis is reduction of complex multi-variate data, and researchers should
not be surprised when there is “semantic overlap” of many of these risk attributes. Second,
28
many of the analyses are based on the limited number of variables initially made popular by
Starr (1969). Other additional variables (such as risks potentially perceived as immoral and
unnatural) might also be important in individuals’ assessment of risk (Slovic, 1992). Finally,
the psychometric paradigm tends to take into account mean data and not raw data and,
therefore, likely neglects much of the inherent variability that occurs between individuals.
Despite these concerns, the continuing prevalence of the psychometric paradigm in
the literature suggests that it maintains its utility as research tool for understanding how
groups and individual perceive potential science and technological risks. Modified and
updated forms of analysis have been used to examine various research strands of risk
perception of science and technological hazards.
Cultural Theory
History and Theory
As opposed to the psychometric paradigm, cultural theory approaches to risk analysis
emerged from the field of anthropology (Douglas & Wildavsky, 1982). Douglas and
Wildavsky describe attitudes and perceptions of social groups as constructed based on shared
values and beliefs (worldviews). Cultural theory is unique in drawing a distinction between
patterns of social relations and worldviews. In cultural theory analyses, possession of a
particular worldview (fatalist, hierarchist, egalitarian, and individualist) is defined by two
variables known as “grid” and “group.” These variables described below define the scope of
social interactions for individuals and are believed to influence how an individual perceives
risks from particular objects or events.
29
The group variable measures the range of interactions that an individual chooses to
have in larger social units. “Weak” group individuals tend to have open-ended social
networks, frequent interactions with differing social groups, tend to fend for themselves, and
are competitive. On the other hand, “strong” group individuals frequently interact with the
same social group for a variety of activities, depend on one-another for support and
validation, and promote group solidarity (Rayner, 1992).
The grid variable measures the nature of social interactions and typically indicates the
extent to which individuals consider themselves bound by the rules and norms of the larger
social unit. Low grid individuals tend to believe that opportunities should be available for
anyone regardless of social status, kinship, race, gender, age, etc. High grid individuals on
the other hand, believe that the rules are established to maintain specific people within their
prescribed social role (Rayner, 1992).
If axes are created from the intersection of the two variables, they create a four
quadrant grid-group space within which four worldviews are defined (Figure 2.4).
Characteristics of each of these worldviews were recently reviewed by Tsohou, Karyda,
Kokolakis, and Kiountouzis (2006). Fatalists (high grid-low group) believe they are
constrained by social rules, yet feel like “outsiders” that have little influence to change those
rules or control over their personal lives. Heirarchists (high grid-high group) strongly define
their identities by their membership to a particular social group and feel the rules of that
group supersede any other. Individualists (low grid-low group) strongly dissociate
themselves from being defined by particular social group and believe that all socially
imposed boundaries are subject to debate. Finally, egalitarians (low grid-high group) believe
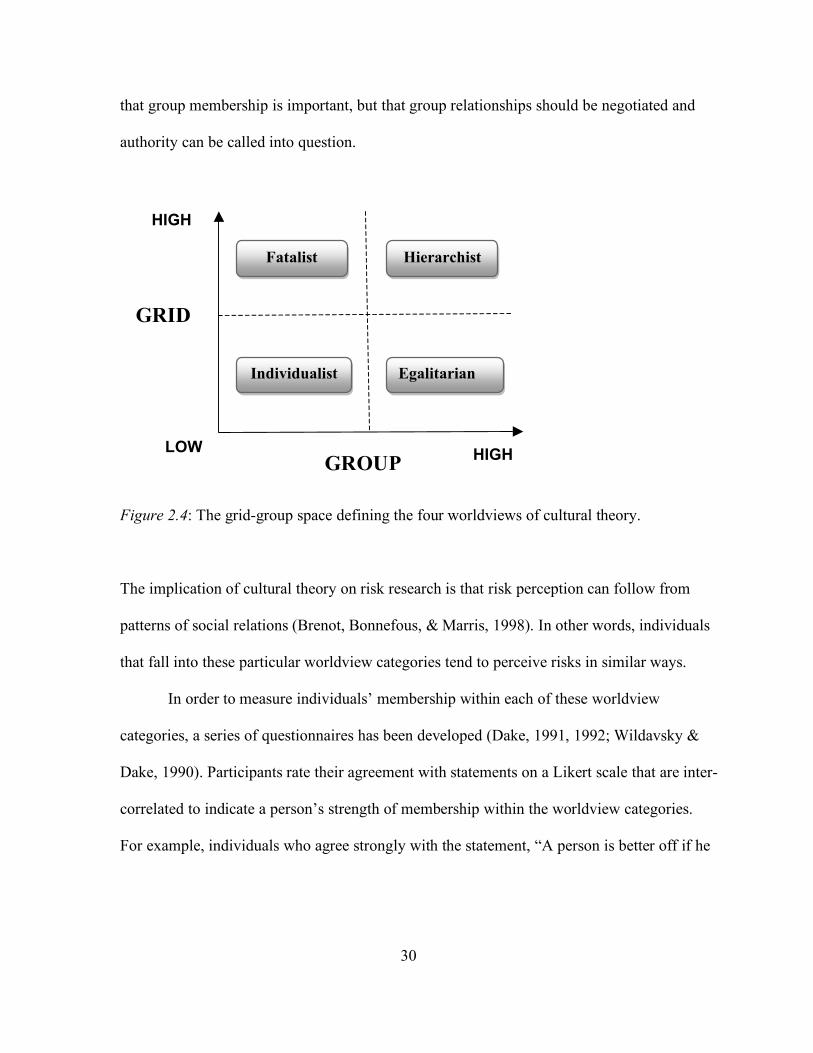
30
that group membership is important, but that group relationships should be negotiated and
authority can be called into question.
Figure 2.4: The grid-group space defining the four worldviews of cultural theory.
The implication of cultural theory on risk research is that risk perception can follow from
patterns of social relations (Brenot, Bonnefous, & Marris, 1998). In other words, individuals
that fall into these particular worldview categories tend to perceive risks in similar ways.
In order to measure individuals’ membership within each of these worldview
categories, a series of questionnaires has been developed (Dake, 1991, 1992; Wildavsky &
Dake, 1990). Participants rate their agreement with statements on a Likert scale that are inter-
correlated to indicate a person’s strength of membership within the worldview categories.
For example, individuals who agree strongly with the statement, “A person is better off if he
LOW HIGH
HIGH
GROUP
GRID
Fatalist
Individualist
Hierarchist
Egalitarian
31
or she doesn’t trust anyone” is considered a fatalist. Examples of statements in each category
are shown below.
• Fatalism: There is no use in doing things for people; you only get it in the back in the
long run.
• Hierarchy: People should be rewarded according to their position in society.
• Individualism: In a fair system, people with more ability should earn more money.
• Egalitarianism: If people in this country were treated more equally, we would have
fewer problems.
Based on these categories, how do individuals in each worldview expected to
perceive the risks of science and technology? For fatalists, others largely determine what is
risky, since they feel that they have little role to play in the decision-making process. These
individuals often prefer to be unaware of danger since they feel it is unavoidable.
Hierarchists fear technology that disrupts the “natural order” of things. However, when it
comes time for decisions to be made, this group trusts the experts or leaders of their social
group to make the correct decisions for the universal good (Oltedal, Moen, Klempe, &
Rundmo, 2004). Individualists are especially sensitive to risks that impinge on an
individuals’ personal freedom. However, they often feel that regardless of the acceptability of
the risk decided on by the group at large, it is up to the individual to avoid it (Langford,
Georgiou, Bateman, Day, & Turner, 2000). Egalitarians reject risks that would lead to
unequal distribution of repercussions (such as developing nuclear technology when the waste
will be buried next to a poor neighborhood). This group also tends to be distrustful of expert
32
opinion, because they fear that the strong institutional ties of experts may lead abuse of
power (Oltedal et al., 2004).
Initial results utilizing this framework reported that cultural worldviews correlated
well to risk perceptions (Dake & Wildavsky, 1991). However, additional studies have not
obtained results with as high levels of reliability (Marris et al, 1996; Seifert & Togersen,
1995; Sjöberg, 1995). In a recent study of the correlation of risk perception and cultural
theory, Bouyer, Bagdassarian, Chaabanne, and Mullet (2001) found only a weak association
between worldviews and risk perception. Cultural theory typically explains only small
portions of the variance in individual risk perception, however it is a useful tool because
unlike the psychometric paradigm it seeks to answer why risk is perceived as it is.
Assumptions and Limitations
Can four worldviews realistically explain perceptions of risk across all individuals?
Certainly, cultural theory limits itself in making such claims (Boholm, 1996; Johnson, 1991).
Douglas responded to this criticism in a recently revised version of her theory:
Why four? Not because four types are all that there are, but for the sake of having a
parsimonious model of organizations, in two dimensions only. If any one protests
that there are really five hundred or two thousand types, or six or eight dimensions,
they mistake the nature of the exercise. Eleven thousand or a million would NOT be
enough to cover the variety that is out there. But for explanatory value, three, four or
five types of social environment are enough to generate three, four, or five
cosmologies, which stabilize four or five kinds of organization (Douglas, 1999).
33
Douglas asserts that simplicity and utility are the goals of grid-group analysis and not a
representation of every individual’s reality.
The worldview constructs are measured with quantitative measures that, if interpreted
as continuous, allow researchers to place individuals along a degree of worldviews. An
individual may not be wholly fatalist, but might fall along a continuum of this worldview. If
results are interpreted in this manner, it allows for a more fluid interpretation of which
worldview category individuals might fall into. However, results are rarely interpreted in this
manner, which likely weakens some of the assertions of the theory.
Another criticism of cultural theory is that worldviews appear static (Boholm, 1996;
Johnson, 1991). Although some researchers, such as Douglas hold to this view, others have
adopted a mobility hypothesis in which cultural theory predicts perceptions only in specified
contexts. Depending on the social interaction, individuals can exist in multiple worldview
quadrants at different times (Rayner, 1992). This implies that studies in risk perception
should not attempt to generalize obtained worldviews to contexts outside the scope of the
study as some have attempted. An interesting question then becomes, how limited are these
contexts? Do individuals fall into worldviews categories when making decisions about the
risks of science and technology in general, or are worldview biases only consistent for very
specific applications or their potential hazardous outcomes?
Integrated Approaches
Integrative approaches to the analysis of risk perception have been suggested
(Rayner, 1992). Marris, Langford, and O’Riordan (1996) conducted a study using both
34
cultural theory and psychometric approaches. Their conclusions are: a) cultural theory
effectively classifies groups into worldview categories but not individuals, b) the
psychometric paradigm explains the variance in risk perception more effectively than either
cultural theory or demographic variables, c) cultural theory predicts risk perception only in
certain hazard contexts (supporting the mobility hypothesis), d) groups that hold certain
worldviews interpret psychometric risk characteristics in similar ways, and, e) worldviews
correlate with distinct views on trust, liability, and consent in the context of risk.
Integrative approaches to risk perception using these frameworks can be useful, as
long as one understands their assumptions and limitations. The psychometric paradigm can
reveal how individuals or groups define particular hazards cognitively. Cultural theory
provides a single perspective on why individuals perceive risk the way they do. If measures
from these two theories are bolstered with interviews, in which an individual is allowed to
expound on his or her understanding of risk, then a relatively clear picture of risk perception
can be painted.
Conclusions and Implications
Understanding risk perceptions of the general public, particularly associated with
science and technology, has implications for public policy and regulation. The psychometric
paradigm provides a means for researchers to understand the critical characteristics of a
potential hazard that individuals perceive as risky. Cultural theory provides a framework
through which to understand why certain groups of individuals might respond to risk posed
by science and technology in different ways. Knowing about risk perceptions can assist in the
35
design of effective and targeted communication strategies that could potentially reduce
public resistance to the research and development of new technologies.
What is less obvious is the role that risk perception research frameworks play in
formal and informal science education. Science educators are not only responsible for
providing their students with the appropriate content knowledge to understand science, but
also for developing mature attitudes and perceptions of this field. Negative attitudes coupled
with high perceptions of risk could increase student resistance to learning. This correlation is
seen when students (or their parents) resist learning about such technological innovations as
reproductive cloning or stem cell research due to the perceived risk it poses to their cultural
and religious views. In addition, understanding how instructors view the risks posed by
various applications in science and technology could have a part to play in their pedagogical
practice.
36
References
Alhakami, A. S., & Slovic, P. (1994). A psychological study of the inverse relationship
between perceived risk and perceived benefit. Risk Analysis, 14, 1085-1096.
Barke, R. P., & Jenkins-Smith, H. C. (1993). Politics and scientific expertise: Scientists, risk
perception, and nuclear waste policy. Risk Analysis, 13, 425-439.
Barnett, J., & Breakwell, G. M. (2001). Risk perception and experience: Hazard personality
profiles and individual differences. Risk Analysis, 21, 171-178.
Boholm, A. (1996). Risk perception and social anthropology: Critique of cultural theory.
Ethnos, 61, 64-84.
Bouyer, M., Bagdassarian, S., Chabanne, S, & Mullet, E. (2001). Personality correlates of
risk perception. Risk Analysis, 21, 457-465.
Bradbury, J. A. (1989). The policy implications of differing concepts of risk. Science,
Technology, and Human Values, 14, 380-399.
Chauvin, B., Hermand, D., & Mullet, E. (2007). Risk perception and personality facets. Risk
Analysis, 27, 171-185.
Dake, K. (1991). Myths of nature: Cultural and social construction of risk. Journal of Social
Issues, 48, 21-37.
Dake, K. (1992). Orienting dispositions in the perception of risk: An anlaysis of
contemporary worldviews and cultural biases. Journal of Cross-Cultural Psychology,
22, 61-82.
Douglas, M. (1999). Four cultures: The evolution of a parsimonious model. GeoJournal, 47,
411-415.
37
Douglas, M., & Wildavsky, A. (1982). Risk and culture: An essay on the selection of
technological and environmental dangers. Berkeley, CA: University of California
Press.
Fife-Shaw, C. R., & Rowe, G. (1996). Public perceptions of everyday food hazards: A
psychometric study. Risk Analysis, 16, 487-500.
Fischoff, B., Slovic, P., & Lichtenstein, S. (1979). Weighing the risk. Environment, 21(4),
17-38.
Fischoff, B., Slovic, P., Lichtenstein, S., Read, S., & Combs, B. (1978). How safe is safe
enough? A psychometric study of attitudes toward technological risks and benefits.
Policy Sciences, 9, 127-152.
Flynn, J., Slovic, P., & Mertz, C. K. (1993). Decidedly different: Expert and public views of
risks from a radioactive waste repository. Risk Analysis, 13, 643-648.
Flynn, R., Bellaby, P., & Ricci, M. (2006). Risk perception of an emergent technology: The
case of hydrogen energy. Forum: Qualitative Social Research, 7(1). Article 19. 25
pp.
Flynn, J., Slovic, P., & Mertz, C. K. (1994). Gender, race, and perception of environmental
health risks. Risk Analysis, 14, 1101-1108.
Gardner, G. T., & Gould, L. C. (1989). Public perception of the risks and benefits of
technology. Risk Analysis, 9, 225-242.
Gustafson, P. E. (1998). Gender differences in risk perception: Theoretical and
methodological perspectives. Risk Analysis, 18, 805-811.
38
Jarman, R., & McClune, B. (2007). Developing scientific literacy: Using news media in the
classroom. New York, NY: Open University Press.
Johnson, B. B. (1991). Risk and culture research: Some cautions. Journal of Cross-Cultural
Psychology, 22, 141-149.
Kaplan, S., & Garrick, B. J. (1981). On the quantitative definition of risk. Risk Analysis, 1,
11-27.
Karpowicz-Lazre, C., & Mullet, E. (1993). Societal risk as seen by the French public. Risk
Analysis, 13, 252-258.
Kraus, N. N., Malfors, T., & Slovic, P. (1992). Intuitive toxicology: Expert and lay
judgments of chemical risks. Risk Analysis, 12, 215-231.
Langford, I., Georgiou, S., Bateman, I., Day, R., & Turner, R. (2000). Public perceptions of
health risks from polluted coastal bathing waters: A mixed methodological analysis
using cultural theory. Risk Analysis, 20, 691-705.
Lazo, J. K., Kinnell, J. C., & Fisher, A. (2000). Expert and layperson perceptions of
ecosystem risk. Risk Analysis, 20, 179-193.
Lupton, D. (1999). Risk. London, England: Routledge.
Marris, C., Langford, I., & O’Riordan, T. (1996). Integrating sociological and psychological
approaches to public perception of environmental risks: Detailed results from a
questionnaire survey. CSERGE Working Paper GEC 96-07. University of East
Anglia, UK: Centre for Social and Economic Research on the Global Environment.
39
Marris, C., Langford, I., Saunderson, T., & O’Riordan, T. (1997). Exploring the
“psychometric paradigm”: Comparisons between aggregate and individual analyses.
Risk Analysis, 17, 303-311.
McDaniels, T. L., Axelrod, L. J., Cavanagh, N. S., & Slovic, P. (1997). Perception of
ecological risk to water environments. Risk Analysis, 17, 341-352.
Oltedal, S., Moen, B.-E., Klempe, H., & Rundmo, T. (2004). Explaining risk perception: An
evaluation of cultural theory. Norwegian University of Science and Technology,
Department of Psychology, Trondheim, Rotunde Paper Volume 85.
Rayner, S. (1992). Cultural Theory and Risk Analysis. In S. Krimsky & D. Golding (Eds.),
Social Theories of Risk (pp. 83-115). Westport, CT: Praeger
Renn, O. (1992). Concepts of risk: A classification. In S. Krimsky & D. Golding (Eds.),
Social Theories of Risk (pp. 53-79). Westport, CT: Praeger.
Renn, O., & Rohrmann, B. (2000). Cross-cultural risk perception: A survey of empirical
studies. Dordrecht, Netherlands: Kluwer Academic.
Rowe, G. & Wright, G. (2001). Differences in expert and lay judgment of risk: Myth or
reality? Risk Analysis, 21, 341-356.
Savadori, L., Rumiati, R., & Bonini, N. (1998). Expertise and regional differences in risk
perception: The case of Italy. Swiss Journal of Psychology, 57, 101-113.
Savadori, L., Savio, S., Nicotra, E., Rumiati, R., Finucane, M., & Slovic, P. (2004). Expert
and public perception of risk from biotechnology. Risk Analysis, 24, 1289-1299.
Siegrist, M., & Cvetkovich, G. (2000). Perception of hazards: The role of social trust and
knowledge. Risk Analysis, 23, 713-720.
40
Siegrist, M., Keller, C., Kastenholz, H., Frey, S., & Wiek, A. (2007). Laypeople’s and
experts’ perception of nanotechnology hazards. Risk Analysis, 27, 59-69.
Sjöberg, L. (1995). Explaining risk perception: An empirical and quantitative evaluation of
cultural theory. Rhizikon: Risk Research Reports, No. 14. Center for Risk Research,
Stockholm, Sweden.
Sjöberg, L. (2000). Factors in risk perception. Risk Analysis, 20, 1-11.
Sjöberg, L. (2008). Genetically modified food in the eyes of the public and experts. Risk
Management, 10, 168-193.
Slovic, P. (1987). Perception of risk. Science. 236, 280-285.
Slovic, P. (1992). Perception of risk: Reflections on the psychometric paradigm. In S.
Krimsky & D. Golding (Eds.), Social Theories of Risk (pp. 117-152). Westport, CT:
Praeger.
Slovic, P. (1997). Trust, emotion, sex, politics and science. Surveying the risk assessment
battlefield. In M. Bazerman, D. Messick. A. Tenbrunsel, & K. Wade-Benzoni (Eds.),
Environment, ethics, and behavior (pp. 277-313). San Francisco, CA: New Lexington
Press.
Slovic, P., Fischoff, B., & Lichtenstein, S. (1979). Rating the risks. Environment, 21(3),14-
20, 36-39.
Slovic, P., Malmfors, T., Krewski, D., Mertz, C. K., Neil, N., & Bartlett, S. (1997). Intuitive
toxicology II: Expert and lay judgments of chemical risks in Canada. Risk Analysis,
15, 661-675.
41
Starr, C. (1969). Social benefit versus technological risk: What is our society willing to pay
for safety? Science, 165, 1232-1238.
Tsohou, A., Karyda, M., Kokolakis, S., & Kiountouzis, E. (2006). Formulating information
systems risk management strategies through cultural theory. Information
Management & Computer Security, 14(3), 198-217.
Tversky, A., & Kahneman, D. (1974). Judgment under uncertainty: Heuristics and biases.
Science, 185, 1124-1131.
Wachbroit, R. (1991). Describing risk. In M. A. Levin & H. S. Strauss (Eds.), Risk
Assessment in Genetic Engineering. Environmental Release of Organisms (pp. 368-
377). New York, NY: McGraw-Hill.
Waller, R. A. & Covello, V. T. (1984). Low Probability / High Consequence Risk Analysis.
New York, NY: Plenum.
WASH-1400. (1975). Reactor Safety Study—An Assessment of Accident Risks in U.S.
Commercial Nuclear Power Plants. NUREG-75/014, Washington, D.C.: Nuclear
Regulatory Commission.
Wildavsky, A., & Dake, K. (1990). Theories of risk perception: Who fears what and why?
Daedalus, 119, 41-60.
Wilson, R. (1979). Analyzing the daily risks of life. Technology Review, 81(4), 41-46.

42
Wright, G., Pearman, A., & Yardley, K. (2000). Risk perception in the U.K. oil and gas
production industry: Are expert loss-prevention managers’ perceptions different from
those of members of the public? Risk Analysis, 20, 681-690.

43
RESEARCH STUDY I
Science Instructors’ Risk Perception of Biotechnology:
Implications for Science Instruction
44
Introduction
Preparing students to enter into public life as scientifically literate citizens remains an
important goal of science education (Laugksch, 2000). One factor that will greatly influence
student development of scientific literacy is their attitudes toward science and technology and
the subsequent behaviors that result from these attitudes (Dawson & Schibeci, 2003; Prokop,
Leskova, Kubiatko, & Diran, 2007). Attitudes can have a significant influence on future
acceptance of new advances in science and technology (Lee, Scheufele, & Lewenstein,
2005). The interaction of attitudes toward technology and its acceptance is especially
important in the area of biotechnology, an area of science that will play an increasingly larger
role in students’ lives in the coming years (Bal, Samanci, & Bozkurt, 2007).
Attitudes toward science and technology are mediated by a number of factors (Prokop
et al., 2007). One of the most critical factors is the perception of the risks and benefits
associated with research and development of biotechnology applications (Fischoff, Slovic, &
Lichtenstein, 1978; Sjöberg, 2002). Biotechnology is an emergent science which many in the
general public perceive as risky to society in general (Slovic, 1987; Savadori et al., 2004).
For example, the development of genetically modified (GM) food has met with public
resistance in the United Kingdom despite expert reassurance of product safety (Gaskell,
Bauer, Durant, & Allum, 1999).
Due to its importance to the public dialogues surrounding biotechnology, risk is an
important theme in scientific literacy education. The topic of risk in science education has
been addressed only briefly in the literature in the context of environmental science
instruction (Covitt, Gomez-Schmidt, & Zint, 2005; Zint, 2001; Zint & Peyton, 2001). This is
45
not surprising because environmental education grew out of the environmental protection
movement begun in the 1960s. Although inherent in research about attitudes, examinations of
risk perception have yet to explicitly arise in the educational discourse related to emergent
technologies. This is perplexing, because not only is risk perception a critical component of
science-technology-society (STS) interactions (Zint, 2001) but it is also one of the most
common themes addressed in the news media when discussing new technologies (Jarman &
McClune, 2007). In addition, the ability to make decisions about technological risk has been
recognized by the American Association for the Advancement of Science as a critical
component of the nature of technological literacy (1993).
Given calls for scientific literacy in national reform documents, science educators
have an important role in the development of mature attitudes and the shaping of perceptions
of risks related to biotechnology. If this attitudinal component is important for students, it is
even more so for the educators that will be instructing them. Like teacher beliefs, perceptions
of the risks of biotechnology will likely emerge in teacher instructional dialogue and
pedagogical practice. Despite this, research focusing on teacher attitudes (for which risk
perception is a component) toward emergent technologies has been limited. Little attention
has been paid to the perceptions of educators currently in the field, with the majority of
research samples consisting of pre-service instructors (Chin, 2005). Understanding science
educators’ perceptions of the risks associated with biotechnology can be helpful in unpacking
the influence of both pedagogical and content knowledge on the development of teachers’
risk perceptions. Doing so will likely inform teaching practice.
46
This study examines the risk perceptions’ of four teacher groups; pre-service science
teachers, in-service science teachers, graduate teaching assistants, and university professors.
Risk perception was analyzed utilizing several established frameworks in order to gain a
holistic view and to serve as a baseline for future studies.
Attitudes and Risk Perception
An attitude describes the degree of positive or negative reactions of an individual
toward a target object, idea, or event. One perspective is that attitudes are constructed of
three domains (commonly called the ABC model): affective, behavioral, and cognitive
(Bagozzi & Burnkrant, 1979). The affective component of attitude consists of the emotional
reaction to a particular target. The behavioral component is a verbal or physical reaction that
is directed toward the target. Finally, the cognitive domain is a mental evaluation of the
target (Breckler, 1984). In this model, the magnitude and direction of attitudes (positive or
negative) are driven by emotional and cognitive evaluations and can be visualized through
behavioral responses.
In the formation of attitudes toward emerging technologies, risk perception is
considered to be of “paramount importance” (Sjöberg, 2002, p. 380). This is because
attitudes that lead to acceptance of, or resistance to, new technologies are highly influenced
by perceptions of the risks or benefits of these technologies (Moon & Balasubramanian,
2004; Sjöberg, 1999). Risk perception is how individuals choose to interpret and define what
they perceive as risky about particular objects or events. Formation of conscious or
47
unconscious perceptions about the risks contributes to the magnitude and direction of attitude
polarization.
Like attitudes, perceiving the riskiness of a particular technology involves both
cognitive and affective evaluations. Cognitive evaluations of risk may consist of purely
rationalistic and probabilistic calculations of the likelihood of a hazard’s occurrence or the
expected severity of its impacts (WASH-1400, 1975). For most, these cognitive evaluations
typically are thought to consist of mental short cuts (heuristics) fueled by personal biases
(Tversky & Kahneman, 1974). Affective components such as fear of a hazard can be equally
important in defining what is considered risky (Finucane, Alhakami, Slovic, & Johnson,
2000). Integration of affective and cognitive evaluations of risk, in addition to the
experiences of an individual, contribute to the perceptual boundaries that then can engender
behavioral responses such as participation in activism for or against the development of new
technologies (Gardner, 2009).
For science educators, the most significant concern is whether attitudes and
perceptions of the risks of technology are subject to maturation over time and how this will
influence student behavior and decision making on science and technology issues (Dawson &
Schibeci, 2003). The answer to this question is not at all clear. It is known that the absence of
knowledge about a particular technology does not prevent the formation of attitudes or
perceptions (Lee et al., 2005). However, Ried’s (2006) psychometric evaluation suggests that
attitudes are open to some change and development. On the other hand, attitudes and
perceptions that are linked with strong beliefs and personal values (often associated with
controversial technologies) seem particularly resistant to change (Dawson & Schibeci, 2003).
48
Little is known about the current status of both science students’ and instructors’ attitudes
and perceptions of risk.
Risk Perception and Biotechnology
Biotechnology is an example of an emergent technology that often is viewed by the
general public as being particularly risky (Slovic, 1987). However, this high perception of
risk is variable for different demographic sectors of society and different cultures. For
example, women generally are less accepting of biotechnology applications than men
(Mangusson & Hursti, 2002; Moerbeek & Casimir, 2005; Siegrist, 1998). Also, due to its
more widespread use, individuals in the United States tend to have more favorable attitudes
toward biotechnology than people in the United Kingdom (Gaskell, et al., 1999; Moon &
Balasubramanian, 2004). Numerous other factors shape perceived risk and subsequent
acceptance of biotechnology. These factors include age (Dawson & Schibeci, 2003; Hamstra
& Smink, 1996), education and expertise in science (Dawson & Schibeci, 2003; Savadori et
al., 2004), cultural worldview (Siegrist, 1999), morality (Tanaka, 2004), and trust in the
regulating institutions (Siegrist, 2000).
Examining the perception of the risks and benefits of biotechnology is further
complicated by the fact that it is not a singular technology, but consists of a diversity of
applications. Public acceptance is dependent on the nature of the application such as whether
it is intended for medical use or human consumption (Savadori et al., 2004; Zechendorf,
1994). Positive attitudes toward medical applications of gene technology are common
because the benefits are perceived by many to outweigh the risks (Berth, Balck, & Dinkel,
49
2002; Savadori et al., 2004; Zechendorf, 1994). For example, the target of gene transfer is
another factor of biotechnology applications that can affect risk perception. Typically genetic
manipulation in microorganisms and plants is viewed as less risky than the same processes
being applied to humans and other mammals (Frewer, Howard, & Shepard, 1997).
Students Studying Science Content
Although there are studies focused on the perceptions of risks and benefits of the
general public, much less is known about how these perceptions manifest themselves in
school-aged children. Of the research that exists, most focuses on the link between student
knowledge of and related attitudes toward biotechnology. The majority of studies use the
term “attitude”, but it is apparent that considerations of risk and benefit are playing a large
role in polarizing these attitudes.
Dawson conducted a series of studies examining Australian students’ knowledge and
attitudes surrounding different applications of biotechnology that seem to mirror results
found in the general public (Dawson & Soames, 2006; Dawson & Schibeci, 2003). Medical
applications were seen as more acceptable than applications involving genetic modification
for food production (Dawson & Soames, 2006; Massarani & Moreira, 2005). In addition,
Massarani and Moreira (2005) found that this relationship of risk perception to applications
is even more complex when more specificity of particular applications is used. Genetic
testing to detect disease was viewed by high school students as more favorable and less
morally unacceptable than others, such as biopharmaceuticals and therapeutic cloning.
In accordance with studies of the general public, students also differentiate risks
depending on the source and target of the gene transfer. For example, the transfer of genes
50
between microorganisms and plants is seen as more acceptable than genetic transfer with
humans (Dawson & Schibeci, 2006; Gunter, Kinderlerer, & Beyleveld, 1998). Like the
general public, student perceptions of the risk seem to correlate to the perceived kinship of an
organism to humans (Sáez, Niño, and Carretero et al., 2008). For example, manipulation of
bacterial genomes is viewed as much less risky than manipulation of mammalian genomes.
Other studies have confirmed these observations, with students having different attitudes
toward different applications of biotechnology. What is most significant about these studies
is they indicate a distinctive link between knowledge and attitudes of biotechnology (Chen &
Raffan, 1999; Lock & Miles, 1993). In other words, students tend to have more positive
attitudes toward biotechnologies that they are more knowledgeable about.
The aforementioned studies tended to use short survey questions to elucidate
students’ perceptions of the risks and benefits of biotechnology. In addition, Massarani and
Moreira (2005) used focus groups and student interviews to better understand student
conceptions of the risks and benefits of biotechnology and their reasoning behind acceptance
of particular applications. The two most important methodological considerations the
Massarani and Moriera study revealed were that: 1) students tend to be much more cautious
about risks in face-to-face interview situations than on anonymous surveys, and 2) when
cases of biotechnology risk are framed in personal terms as opposed to societal terms,
students become much less willing to accept biotechnology applications.
Science Teachers
Most previous research on teacher attitudes has focused on pre-service teachers. Two
studies compared responses on surveys of biology undergraduates with pre-service science
51
teachers (Bal et al., 2007; Lamanauskas and Makarskaité-Petkeviciené, 2008). The results of
these studies were very similar to those of students in other majors with a few distinct
differences. Pre-service teachers seemed to feel that the public is not sufficiently informed
about the risks of certain biotechnology applications, such as those associated with GM
foods. General uncertainty regarding risk is also common in these participants. Pre-service
teachers in the study by Prokop et al. (2007) also expressed concerns that biotechnology was
not sufficiently regulated.
Practicing teachers’ attitudes and perceptions toward biotechnology have been
examined (Boone, Gartin, Boone, & Hughes, 2006). The participants were a group of
agricultural education teachers. Results from a questionnaire completed by the teachers
showed that there were high levels of support for the research and development of
biotechnology applications. These educators did not express any significant moral concerns
about the development of biotechnology. In addition the study found no significant
differences in attitudes between those teachers holding Masters and Bachelors degrees.
Risk Perception Research Frameworks
There are two conceptual frameworks from previous research on risk analysis and
risk perception that are applied in the present study: the psychometric paradigm of risk and
the cultural theory of risk. Both frameworks are based on the assumption that hazards are real
events, but that the perception of these hazards is socially constructed. This means that risk
evaluations of a particular object or event are dependent on individual cultural factors and
perceived characteristics of the object or event.
52
Each of the frameworks has an established research history in risk perception. Both
were chosen for this particular study (as opposed to a single framework) because each has
strengths and limitations that can be bolstered by the use of the other. In addition, both
frameworks ask very different questions about the structure and causation of risk perception.
Utilizing both of these frameworks in an integrated approach allowed for a more holistic
analysis of science teacher risk perception.
Psychometric Paradigm
The psychometric paradigm was primarily developed by Slovic and colleagues in the
late 1970s borrowing from psychological personality theory (Slovic et al., 1979).
Psychometric studies ask participants to rate various dimensions of hazards along a Likert
scale. Numerous hazard “personality” dimensions have been identified and used over the
course of this framework’s research history. These include the degree to which the effects of
the risk are delayed, the knowledge about the risk by the general public and science experts,
how new the risk is, how voluntary the risk is to the general public, and numerous others
(Slovic, 1987).
Once particular hazard attributes have been rated by participants, the most typical
method of analysis is a principle component factor analysis to reduce the dimensions into a
more manageable cluster of factors. For example, Slovic (1987) found that for a wide range
of hazards, those judged to be “controllable” also tended to be judged as “voluntary” and
“not feared.” The most commonly realized of these higher order factors that are qualitatively
categorized include “unknown risk” and “dread risk.”
53
In a recent study, Savadori and colleagues (2004) employed a psychometric analysis
to explore experts’ and the general publics’ perceptions of medical and food related
biotechnology applications on sixteen hazard dimensions. For food-related applications, the
factor analytic model described 72% of the overall variance and reduced it to four factors:
harmful and dread risk, usefulness of application, scientists’ knowledge about risks, and
newness of the hazard. For the medical applications, factor analysis revealed five important
factors explaining 70% of the overall variance. These factors were the usefulness and
harmlessness of the applications, the exposure to potential risks, unknown risk factors,
potential damage to the environment, and observable and voluntary nature of biotechnology
risks.
The usefulness the psychometric paradigm is that multiple technologies can be
compared using quantitative measures across multiple dimensions of risk. However, these
studies are limited in that they assess perceptions and not behaviors, and they focus on what
individuals use to rate hazards and not why they perceive them as they do (Renn, 1992). In
addition, interpretation of psychometric data should be met with caution because factor
analysis is principally a data reduction tool and not interpretive. In addition, by providing risk
dimensions to participants, researchers limit the potential dimensions for which a hazard may
be perceived. Finally, the psychometric paradigm examines aggregate means that might hide
much of the inherent variability in individuals’ perceptions of risk (Sjöberg, 2000).
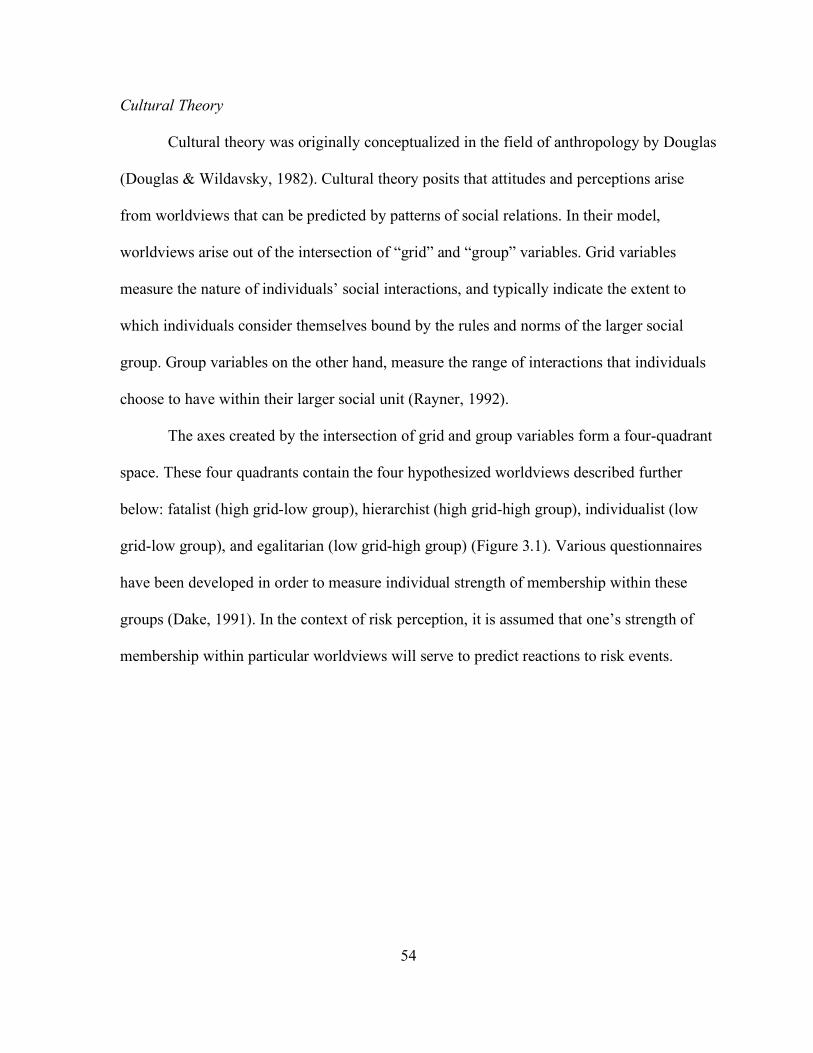
54
Cultural Theory
Cultural theory was originally conceptualized in the field of anthropology by Douglas
(Douglas & Wildavsky, 1982). Cultural theory posits that attitudes and perceptions arise
from worldviews that can be predicted by patterns of social relations. In their model,
worldviews arise out of the intersection of “grid” and “group” variables. Grid variables
measure the nature of individuals’ social interactions, and typically indicate the extent to
which individuals consider themselves bound by the rules and norms of the larger social
group. Group variables on the other hand, measure the range of interactions that individuals
choose to have within their larger social unit (Rayner, 1992).
The axes created by the intersection of grid and group variables form a four-quadrant
space. These four quadrants contain the four hypothesized worldviews described further
below: fatalist (high grid-low group), hierarchist (high grid-high group), individualist (low
grid-low group), and egalitarian (low grid-high group) (Figure 3.1). Various questionnaires
have been developed in order to measure individual strength of membership within these
groups (Dake, 1991). In the context of risk perception, it is assumed that one’s strength of
membership within particular worldviews will serve to predict reactions to risk events.
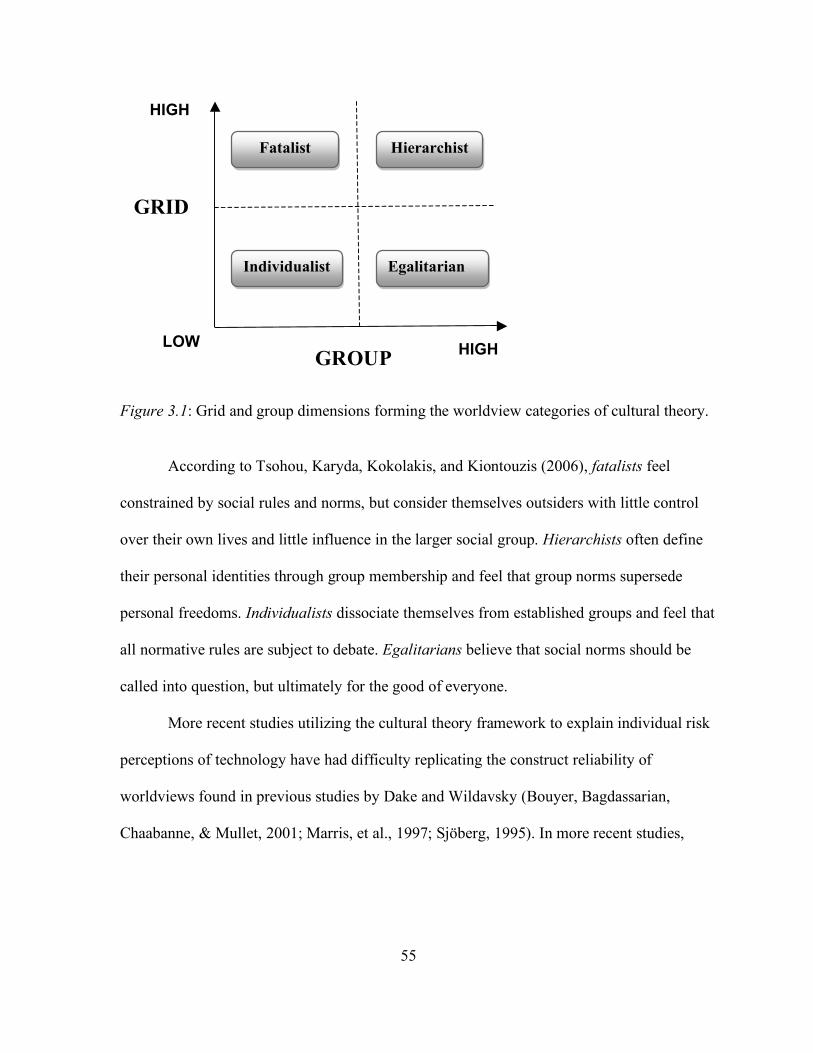
55
Figure 3.1: Grid and group dimensions forming the worldview categories of cultural theory.
According to Tsohou, Karyda, Kokolakis, and Kiontouzis (2006), fatalists feel
constrained by social rules and norms, but consider themselves outsiders with little control
over their own lives and little influence in the larger social group. Hierarchists often define
their personal identities through group membership and feel that group norms supersede
personal freedoms. Individualists dissociate themselves from established groups and feel that
all normative rules are subject to debate. Egalitarians believe that social norms should be
called into question, but ultimately for the good of everyone.
More recent studies utilizing the cultural theory framework to explain individual risk
perceptions of technology have had difficulty replicating the construct reliability of
worldviews found in previous studies by Dake and Wildavsky (Bouyer, Bagdassarian,
Chaabanne, & Mullet, 2001; Marris, et al., 1997; Sjöberg, 1995). In more recent studies,
LOW HIGH
HIGH
GROUP
GRID
Fatalist
Individualist
Hierarchist
Egalitarian
56
cultural theory explains only a small portion of the variance in risk perception. However, it
remains a useful tool for understanding why individuals might perceive risks of technology
as they do.
Thus, there are limitations to cultural theory as a framework for analyzing risk
perception. First, using only four worldview constructs is parsimonious, but limiting. There
likely are other cultural groupings defined by social interactions than just these four
(Douglas, 1999). Secondly, one should be careful to interpret the strength of worldview
results. It is likely that individuals are not wholly members in one worldview but exist in a
continuum that encompasses varying degrees of each worldview. Finally, worldviews are not
static, but can change depending on the context of the risk object or event (Boholm, 1996;
Johnson, 1991).
Study Description
This study examines the perceptions of the risk of biotechnology of four samples of
science educators: pre-service science teachers, in-service science teachers, biology graduate
teaching assistants, and university biology professors. A total of ninety-one science educators
participated in this study. Demographic information is shown in Table 3.1 and discussed in
more detail below. Two assessments were designed based on psychometric paradigm and
cultural theory frameworks. These assessments were used to compare and contrast how
individuals perceived the risk of biotechnology and some factors that might explain their
perceptions of risk and were guided by the following research questions:
57
1. What are science educators’ perceptions of the risks of biotechnology?
2. What factors contribute to science educators’ perceptions of the risks of
biotechnology?
3. Do perceptions of the risks of biotechnology and its contributing factors differ
for different types of science educators?
Participants
Pre-service science teachers (n = 31) were volunteers from two undergraduate science
education methods courses at a large southeastern university. All students in both courses
participated. The majority of the students were in the process of obtaining their
undergraduate degrees in science education and two held Associates degrees (unrelated to
science or education). Only two students reported having classroom teaching experience, and
for both it was less than a year.
In-service science teachers (n = 20) were recruited at two science education workshop
sessions. One session was a science teacher professional development institute for a
southeastern county. The other session was at a regional science teachers’ educational
conference. All members of this sample had completed an undergraduate degree (ten in
science and ten in science education). All but six of this group also had completed a Masters
degree in science or education. The in-service teachers had a mean of 10.88 years (SD =
9.44) teaching experience.
Graduate teaching assistants (n = 23) taught laboratories at a large southeastern
university and were recruited at two departmental teaching workshops. All graduate teaching
assistants had received undergraduate degrees in biology-related areas and were working
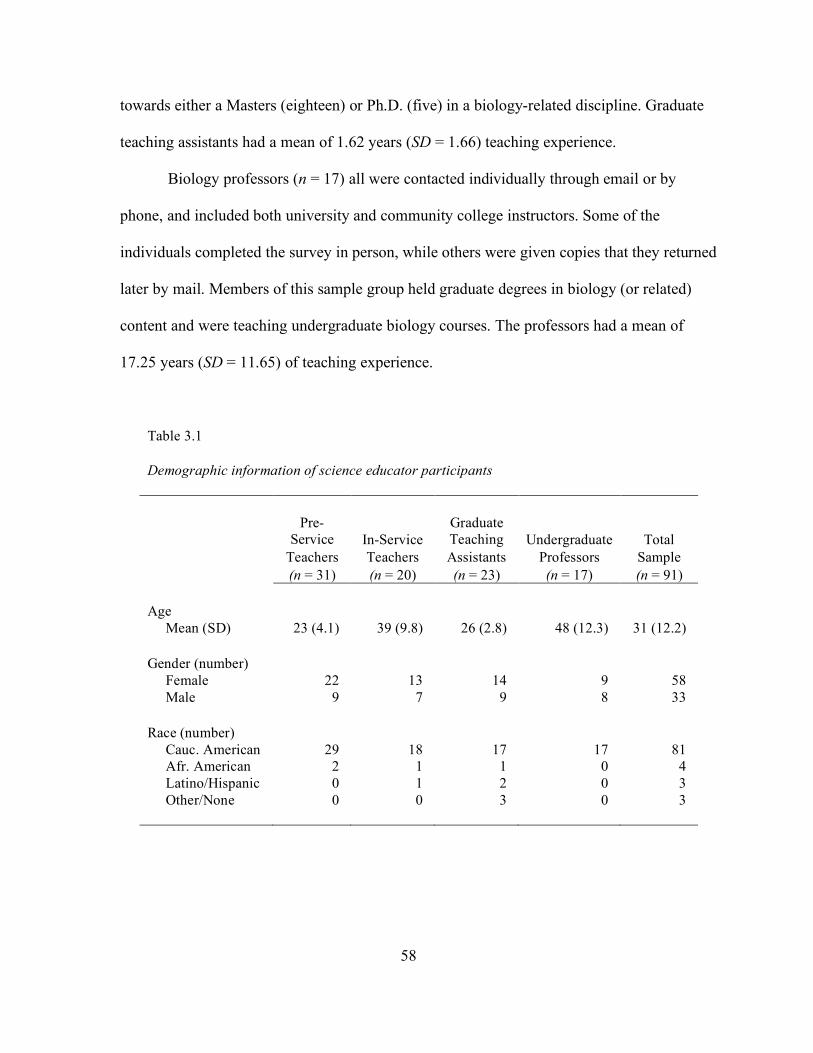
58
towards either a Masters (eighteen) or Ph.D. (five) in a biology-related discipline. Graduate
teaching assistants had a mean of 1.62 years (SD = 1.66) teaching experience.
Biology professors (n = 17) all were contacted individually through email or by
phone, and included both university and community college instructors. Some of the
individuals completed the survey in person, while others were given copies that they returned
later by mail. Members of this sample group held graduate degrees in biology (or related)
content and were teaching undergraduate biology courses. The professors had a mean of
17.25 years (SD = 11.65) of teaching experience.
Table 3.1 Demographic information of science educator participants
Pre-
Service In-Service Graduate Teaching Undergraduate Total
Teachers Teachers Assistants Professors Sample (n = 31) (n = 20) (n = 23) (n = 17) (n = 91) Age Mean (SD) 23 (4.1) 39 (9.8) 26 (2.8) 48 (12.3) 31 (12.2) Gender (number) Female 22 13 14 9 58 Male 9 7 9 8 33 Race (number) Cauc. American 29 18 17 17 81 Afr. American 2 1 1 0 4 Latino/Hispanic 0 1 2 0 3 Other/None 0 0 3 0 3
59
Instruments
Each participant in the study completed two instruments: the Risk Perception Survey
(RPS) (Appendix A) and the Risk Card Sort Task (Appendix B). The RPS was divided into
four assessments: general risk perception assessment, psychometric paradigm assessment,
cultural theory assessment, and open-ended questions. Each assessment as well as the Card
Sort Task is discussed in further detail below.
RPS: General Risk Perception Assessment. Eight Likert-type items measured risk
perception as a generalized construct and were adapted from instruments designed by
O’Conner et al. (1998) and Marris and O’Riordan (1996). Risk is a multi-dimensional
construct and multiple survey items more fully capture holistic risk perception than a single
item (Leiserowitz, 2003). The items addressed different potential interpretations of risk:
general concern, human fatalities, human injuries, ecosystem harm, risk acceptability, risk as
negative consequences, present risks, and future risks.
Following an analysis on the general risk perception items, it was found that all but
one of them had a reliability score greater than .70 (the in-service teacher sub-group had an
α = .68. Reliability increased significantly once number five was removed (Table 3.2). This
question asked, “How acceptable do you feel the current risk of biotechnology is?” It
consistently correlated negatively with the rest of the risk items for all sample groups. For
most individuals, the risks of biotechnology are distant and individuals consider them as a
occurring at some point in the future (Huang & Ruan, 2008). However, when the term
“current” is stressed in the statement, it is likely individuals do not consider their present
situation risky, especially from emergent technologies still in development. Based on this
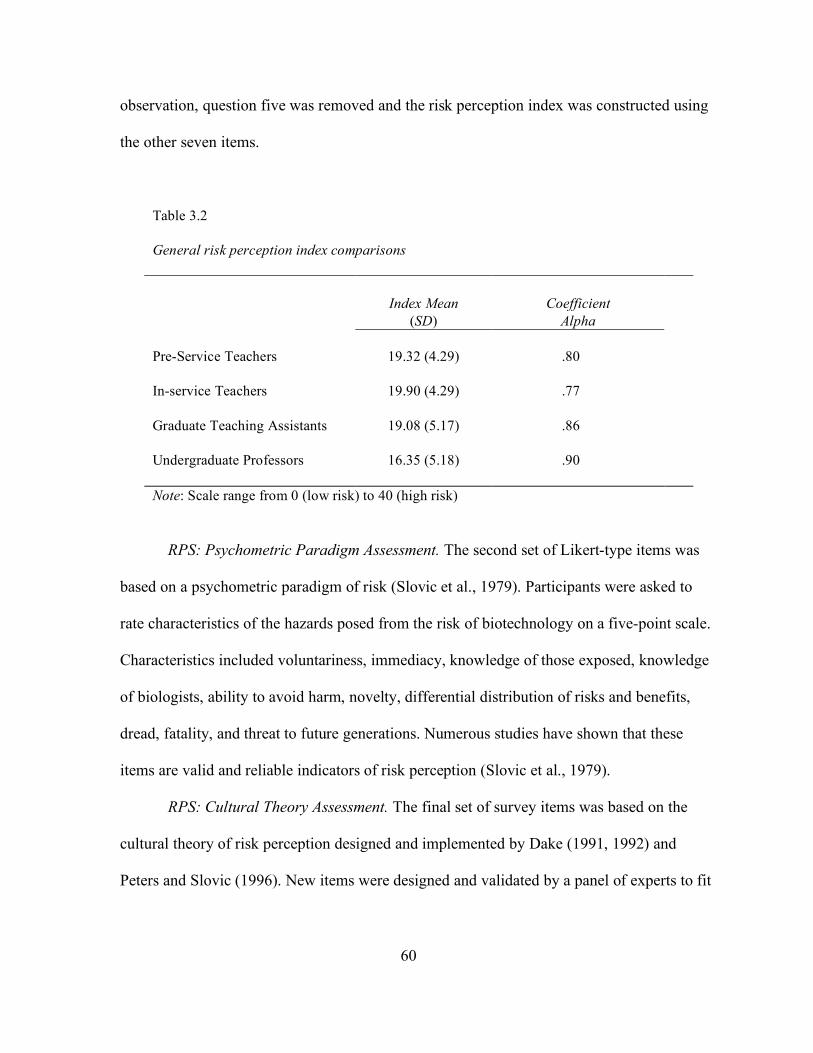
60
observation, question five was removed and the risk perception index was constructed using
the other seven items.
Table 3.2 General risk perception index comparisons Index Mean Coefficient (SD) Alpha Pre-Service Teachers 19.32 (4.29) .80 In-service Teachers 19.90 (4.29) .77 Graduate Teaching Assistants 19.08 (5.17) .86 Undergraduate Professors 16.35 (5.18) .90 Note: Scale range from 0 (low risk) to 40 (high risk)
RPS: Psychometric Paradigm Assessment. The second set of Likert-type items was
based on a psychometric paradigm of risk (Slovic et al., 1979). Participants were asked to
rate characteristics of the hazards posed from the risk of biotechnology on a five-point scale.
Characteristics included voluntariness, immediacy, knowledge of those exposed, knowledge
of biologists, ability to avoid harm, novelty, differential distribution of risks and benefits,
dread, fatality, and threat to future generations. Numerous studies have shown that these
items are valid and reliable indicators of risk perception (Slovic et al., 1979).
RPS: Cultural Theory Assessment. The final set of survey items was based on the
cultural theory of risk perception designed and implemented by Dake (1991, 1992) and
Peters and Slovic (1996). New items were designed and validated by a panel of experts to fit
61
within the theme of emerging technology because research indicates that worldviews many
vary between contexts (Rayner, 1992). Newly designed items were piloted with a group of
undergraduate engineering students at a large southeastern university (n = 19) in the fall of
2007 in order to determine instrument reliability by inter-correlation with previous indices
(Brenot et al., 1998). Items were revised and re-evaluated following the pilot test. Particular
survey items that corresponded to each worldview category are listed in Table 3.3.
Construct reliability of each worldview for the administration of this assessment
during this particular study are shown in Table 3.7. What is immediately obvious is that the
egalitarian worldview construct did not have a high coefficient alpha of reliability for any of
the teacher groups. Correlations between all items for the entire sample were run to attempt
to determine the source of this variability, and it was found that some individual items did
not perform as intended. For example, item number thirty-one asked individuals to rank “the
short-term benefits that I will receive from biotechnology are worth any long-term risks it
might pose to society in general” and was supposed to indicate an egalitarian worldview.
However, this particular item did not correlate with two of the three other egalitarian items (r
< .10) and correlated significantly with all but five of the other worldview items (r > .23).
The only other construct that showed a poor coefficient alpha within a particular teacher
group was the individualist construct within the pre-service science teacher group.
The remaining coefficient alphas within sub-samples were greater than .55. Although
this assessment had a relatively low coefficient alpha, these scores may reflect a small
number of items or may reflect a weakness in the cultural theory in general. Construct
reliabilities often vary in risk perception studies and researchers have struggled to match the
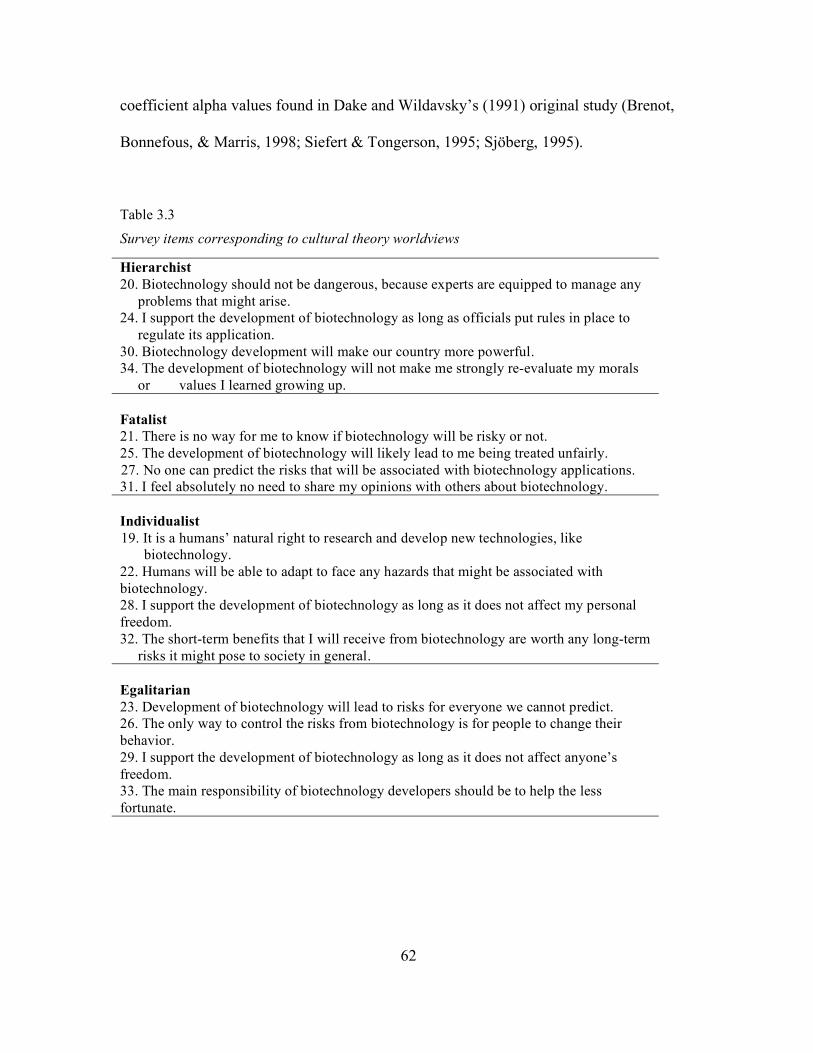
62
coefficient alpha values found in Dake and Wildavsky’s (1991) original study (Brenot,
Bonnefous, & Marris, 1998; Siefert & Tongerson, 1995; Sjöberg, 1995).
Table 3.3
Survey items corresponding to cultural theory worldviews
Hierarchist 20. Biotechnology should not be dangerous, because experts are equipped to manage any
problems that might arise. 24. I support the development of biotechnology as long as officials put rules in place to
regulate its application. 30. Biotechnology development will make our country more powerful. 34. The development of biotechnology will not make me strongly re-evaluate my morals
or values I learned growing up. Fatalist 21. There is no way for me to know if biotechnology will be risky or not. 25. The development of biotechnology will likely lead to me being treated unfairly.
27. No one can predict the risks that will be associated with biotechnology applications. 31. I feel absolutely no need to share my opinions with others about biotechnology. Individualist
19. It is a humans’ natural right to research and develop new technologies, like biotechnology.
22. Humans will be able to adapt to face any hazards that might be associated with biotechnology. 28. I support the development of biotechnology as long as it does not affect my personal freedom. 32. The short-term benefits that I will receive from biotechnology are worth any long-term
risks it might pose to society in general. Egalitarian 23. Development of biotechnology will lead to risks for everyone we cannot predict. 26. The only way to control the risks from biotechnology is for people to change their behavior. 29. I support the development of biotechnology as long as it does not affect anyone’s freedom. 33. The main responsibility of biotechnology developers should be to help the less fortunate.
63
RPS: Open Ended Questions. Open-ended questions were created based on prior
research that has shown other factors might be important in risk perception in addition to
those covered by traditional risk research frameworks (such as experience and institutional
trust) (Barnett & Breakwell, 2001; Siegrist & Gutscher, 2005; Slovic, 1999). Each open
ended question was reviewed by a panel of experts for validity and thoroughness.
Open-ended questions allowed respondents to give more in-depth, personal concerns
related to biotechnology. These items asked participants to expound more on factors used in
making decisions regarding biotechnology risks, the role of trust in communicating
institutions and benefits in risk decision making, perceived differences in expert and novice
risk perceptions of biotechnology, and personal experiences with biotechnology and its
potential risks and benefits.
Card Sort Task. The card sort task required respondents to sort various biotechnology
applications by similarity of risk. It was created for this study to analyze how individuals
grouped particular applications of biotechnology based on risk using multi-dimensional
scaling analyses (Kruskal & Wish, 1991). Representativeness of these applications to
biotechnology in general were confirmed by a panel of biology experts.
Participants were given thirteen index cards that had the name of a specific
biotechnology application and brief description of that application written on it (Appendix
B). These applications were intended to be a broad representation of the numerous
applications of biotechnology currently in existence. Participants were asked to sort the cards
into piles according to similarity based on some aspect of risk. They were instructed that they
64
could create as many or as few piles as desired and that the number of cards in each pile did
not have to be equivalent.
Data Analysis
Risk Perception
Risk perception was analyzed using three of the item sets: the RPS general risk
perception assessment, the RPS psychometric paradigm assessment, and the card sort task.
General risk perception items were used to create a singular index of risk perception.
Psychometric items described what characteristics of biotechnology individuals identify as
risky. Finally, the card sort task determined how individuals grouped biotechnology
applications based on aspects of risk. For all of these items, comparative analyses were run
between teacher groups to determine if significant differences existed between samples.
Explicit protocol for analysis of the psychometric paradigm assessment was adopted
from Savadori et al. (2004). In the tradition of the psychometric paradigm, principle
component factor analyses were used to analyze the aggregate data set with a matrix of
ninety-one subjects by ten psychometric hazard dimensions. The purpose of this analysis was
to reduce the number of psychometric dimensions to fewer related factors. Comparisons then
were made between the science teacher groups to determine if the groups deemed different
risk factors as more or less important in the determination of the risks of biotechnology.
Data from the card sort task were analyzed using multi-dimensional scaling methods.
The output of multi-dimensional scaling analyses is a spatial representation of the similarity
of the biotechnology applications in n-dimensional space with each point corresponding to a
65
particular application. The clusters of applications in space can be analyzed qualitatively in
order to interpret relationships between the perceived risks of the applications. Points that
appear closer together in the output space are deemed more similar. Analysis of multi-
dimensional scaling results is an interpretive exercise that requires researchers to determine
emergent relationships between variables.
Factors Contributing to Risk Perception
Three data sources were used to analyze factors contributing to participants
perceptions of the risk of biotechnology: the RPS cultural theory assessment, the RPS open-
ended questions, and an integrated regression model. Cultural theory items were analyzed by
comparing the means for individual worldviews both between and within participant
samples.
The open-ended questions were analyzed using modified grounded theory by first
reading through each of the questions individually and constructing a list of themes that arose
within each question (Glasser & Strauss, 1967). Evidence that indicated how individuals
perceived the risk of biotechnology were coded and nested into conceptual groups. Also
coded were factors that contributed to participants’ perception of biotechnology risk. These
themes were entered into a spreadsheet and open-ended responses were read multiple times.
A frequency count for each of the concepts that arose within each teacher sub-sample was
obtained. These themes were then used to compare and contrast responses to individual
questions for each sample group.
To conclude the analysis, an integrated model of risk perception was used in order to
predict the important components of teacher’s risk perception within each sample group. The
66
general risk perception index was used as the dependent variable in a linear regression
model. Independent variables were demographic variables, psychometric paradigm variables,
and cultural theory variables that were determined significant in the original analysis.
Differences between participant groups for the regression analysis were also examined.
Results
Risk Perception
RPS: General Risk Perception Assessment. Table 3.2 shows the means and standard
deviation for the risk perception index of all four teacher sub-samples. A one-way ANOVA
showed that there were no significant differences in risk perception index means between the
teacher groups (F[3,87] = 2.06, p = .112).
RPS: Psychometric Paradigm Assessment. The principle component factor analysis of
the psychometric paradigm data reduced to a four-factor solution that accounted for 65.53%
of the total variation (Table 3.4). The first factor was labeled “extreme threat” because the
dimensions loaded heavily on this component were involved with degree of fatality and
threat to future generations. The second factor was labeled “risk regulation” because the
dimensions had to do with expert knowledge and how this would lead to equity of risks and
benefits among the population, especially in the case of new risks of biotechnology. The
value for the “public knowledge” factor was negative. Factor three was labeled “public
acceptance” that included dimensions such as the voluntary nature of the risk, the public’s
knowledge of the risk, and the immediacy of the threat. Finally, the last factor was labeled
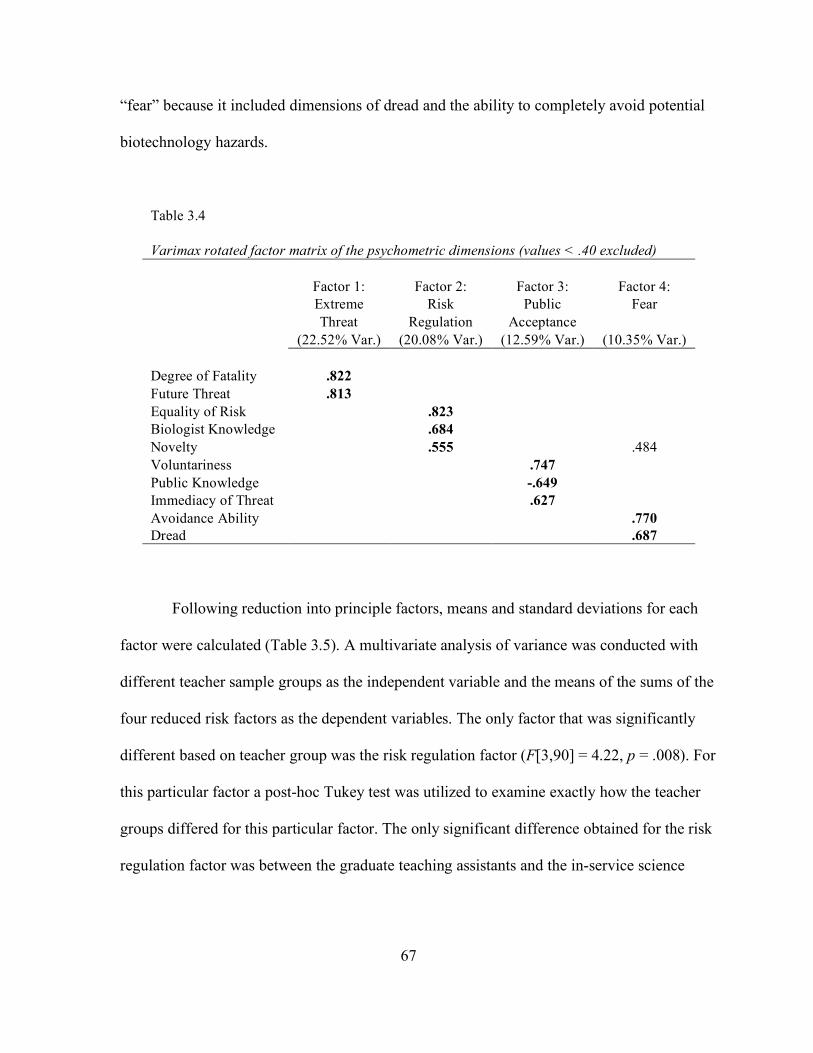
67
“fear” because it included dimensions of dread and the ability to completely avoid potential
biotechnology hazards.
Table 3.4 Varimax rotated factor matrix of the psychometric dimensions (values < .40 excluded) Factor 1: Factor 2: Factor 3: Factor 4: Extreme Risk Public Fear Threat Regulation Acceptance (22.52% Var.) (20.08% Var.) (12.59% Var.) (10.35% Var.) Degree of Fatality .822 Future Threat .813 Equality of Risk .823 Biologist Knowledge .684 Novelty .555 .484 Voluntariness .747 Public Knowledge -.649 Immediacy of Threat .627 Avoidance Ability .770 Dread .687
Following reduction into principle factors, means and standard deviations for each
factor were calculated (Table 3.5). A multivariate analysis of variance was conducted with
different teacher sample groups as the independent variable and the means of the sums of the
four reduced risk factors as the dependent variables. The only factor that was significantly
different based on teacher group was the risk regulation factor (F[3,90] = 4.22, p = .008). For
this particular factor a post-hoc Tukey test was utilized to examine exactly how the teacher
groups differed for this particular factor. The only significant difference obtained for the risk
regulation factor was between the graduate teaching assistants and the in-service science
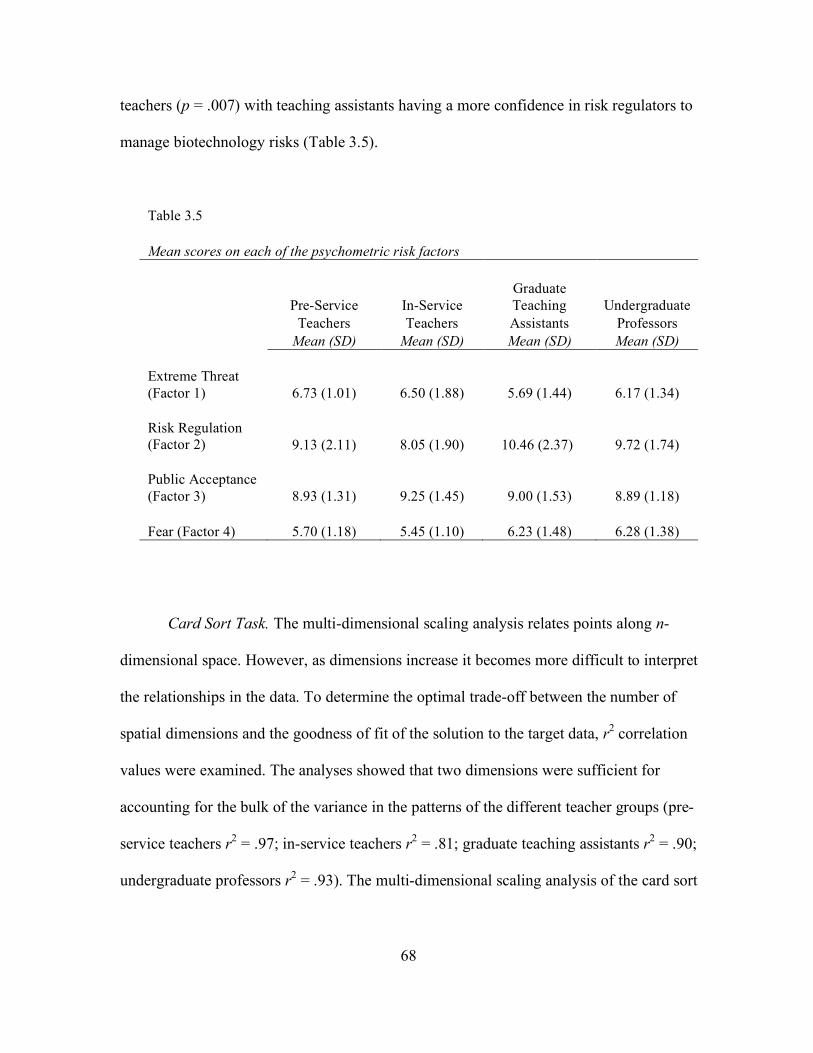
68
teachers (p = .007) with teaching assistants having a more confidence in risk regulators to
manage biotechnology risks (Table 3.5).
Table 3.5 Mean scores on each of the psychometric risk factors
Pre-Service In-Service Graduate Teaching Undergraduate
Teachers Teachers Assistants Professors Mean (SD) Mean (SD) Mean (SD) Mean (SD) Extreme Threat (Factor 1) 6.73 (1.01) 6.50 (1.88) 5.69 (1.44) 6.17 (1.34) Risk Regulation (Factor 2) 9.13 (2.11) 8.05 (1.90) 10.46 (2.37) 9.72 (1.74) Public Acceptance (Factor 3) 8.93 (1.31) 9.25 (1.45) 9.00 (1.53) 8.89 (1.18) Fear (Factor 4) 5.70 (1.18) 5.45 (1.10) 6.23 (1.48) 6.28 (1.38)
Card Sort Task. The multi-dimensional scaling analysis relates points along n-
dimensional space. However, as dimensions increase it becomes more difficult to interpret
the relationships in the data. To determine the optimal trade-off between the number of
spatial dimensions and the goodness of fit of the solution to the target data, r2 correlation
values were examined. The analyses showed that two dimensions were sufficient for
accounting for the bulk of the variance in the patterns of the different teacher groups (pre-
service teachers r2 = .97; in-service teachers r2 = .81; graduate teaching assistants r2 = .90;
undergraduate professors r2 = .93). The multi-dimensional scaling analysis of the card sort
69
data revealed the patterns in relatedness of perceived risk for the different teacher groups
shown in Figures 3.2a – d. Kruskal stress values less than .15 are considered “good”. Values
between .15 and .20 are acceptable. The key for each of the applications on the multi-
dimensional scaling figure is as follows:
Drug = Biotechnology Drug production
Pharma = Pharmacogenomics
GenTst = Genetic testing
MolBio = Biomimetics
GenThpy = Gene therapy
ThpClon = Therapeutic cloning
Repro = Reproductive cloning
BioWpn = Weapon production
Indstr = Industrial biotechnology
Leach = Bioleaching
Degrad = Biodegradation
Biorem = Bioremediation
AgBio = Agricultural biotechnology
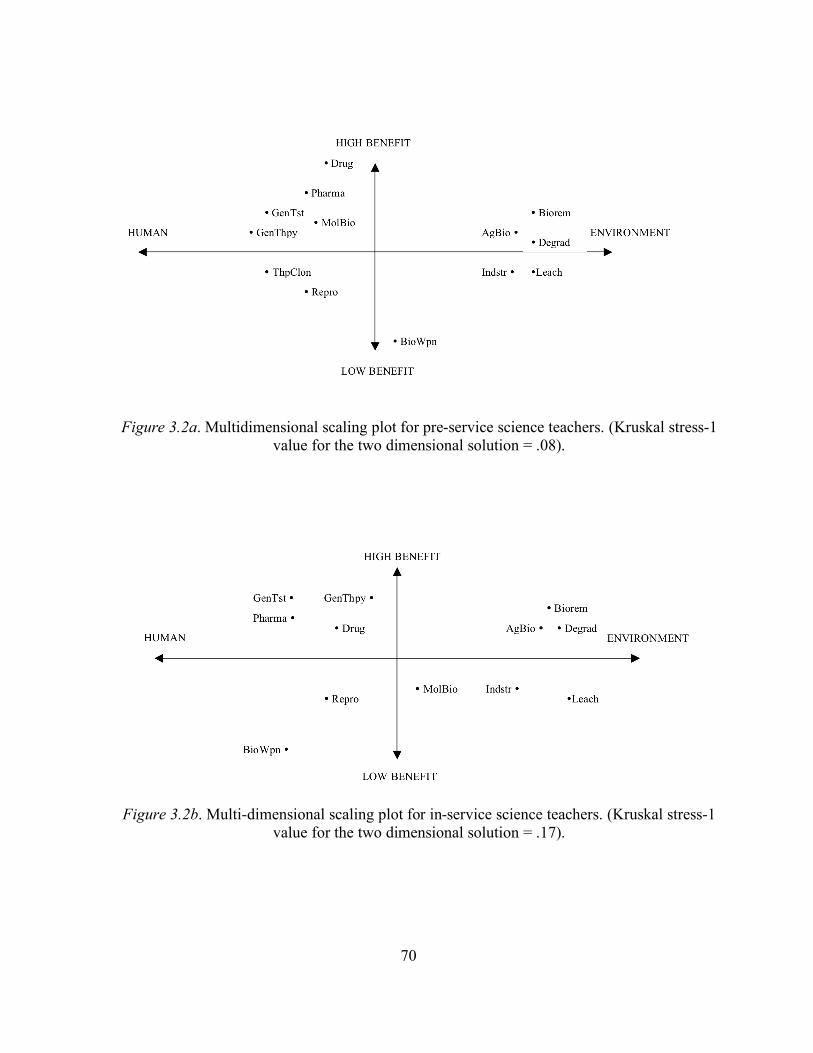
70
Figure 3.2a. Multidimensional scaling plot for pre-service science teachers. (Kruskal stress-1 value for the two dimensional solution = .08).
Figure 3.2b. Multi-dimensional scaling plot for in-service science teachers. (Kruskal stress-1 value for the two dimensional solution = .17).
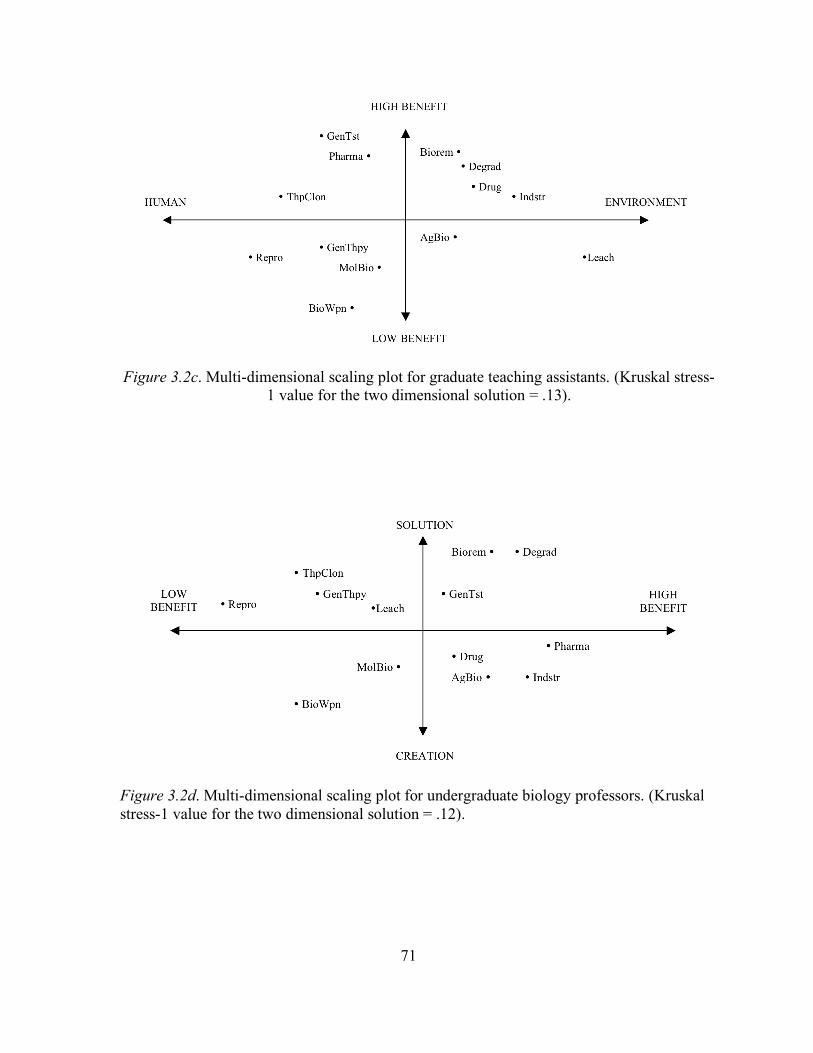
71
Figure 3.2c. Multi-dimensional scaling plot for graduate teaching assistants. (Kruskal stress-1 value for the two dimensional solution = .13).
Figure 3.2d. Multi-dimensional scaling plot for undergraduate biology professors. (Kruskal stress-1 value for the two dimensional solution = .12).
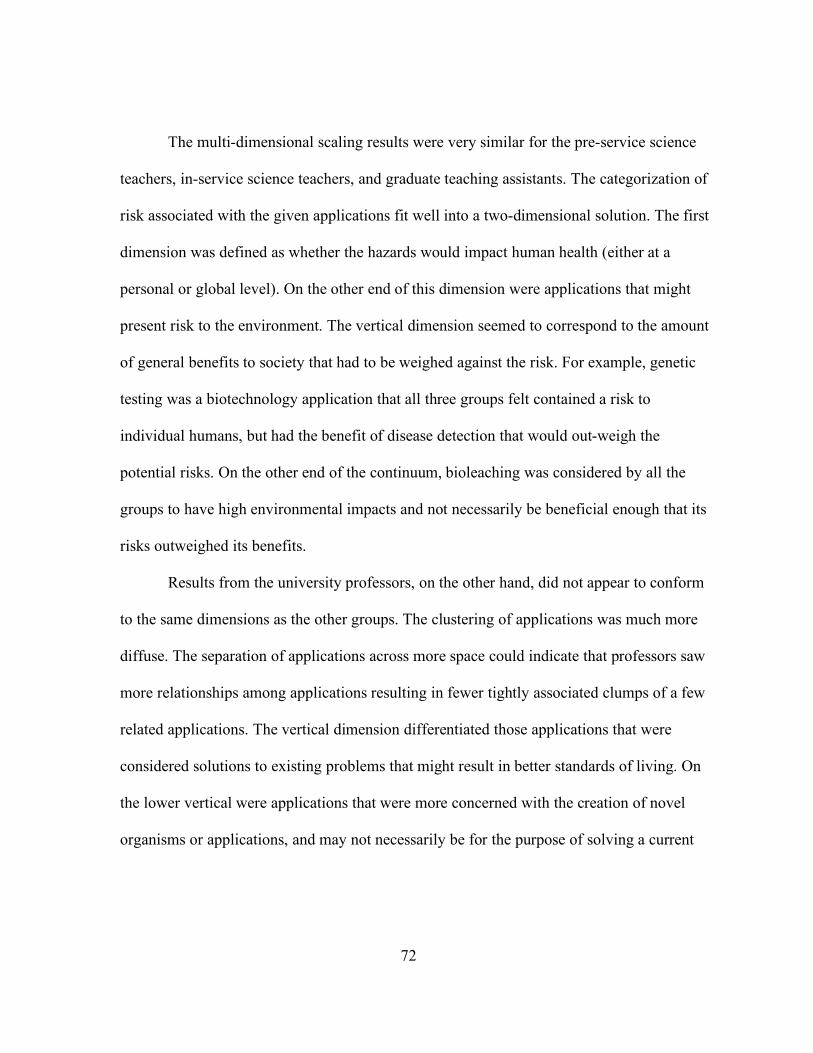
72
The multi-dimensional scaling results were very similar for the pre-service science
teachers, in-service science teachers, and graduate teaching assistants. The categorization of
risk associated with the given applications fit well into a two-dimensional solution. The first
dimension was defined as whether the hazards would impact human health (either at a
personal or global level). On the other end of this dimension were applications that might
present risk to the environment. The vertical dimension seemed to correspond to the amount
of general benefits to society that had to be weighed against the risk. For example, genetic
testing was a biotechnology application that all three groups felt contained a risk to
individual humans, but had the benefit of disease detection that would out-weigh the
potential risks. On the other end of the continuum, bioleaching was considered by all the
groups to have high environmental impacts and not necessarily be beneficial enough that its
risks outweighed its benefits.
Results from the university professors, on the other hand, did not appear to conform
to the same dimensions as the other groups. The clustering of applications was much more
diffuse. The separation of applications across more space could indicate that professors saw
more relationships among applications resulting in fewer tightly associated clumps of a few
related applications. The vertical dimension differentiated those applications that were
considered solutions to existing problems that might result in better standards of living. On
the lower vertical were applications that were more concerned with the creation of novel
organisms or applications, and may not necessarily be for the purpose of solving a current
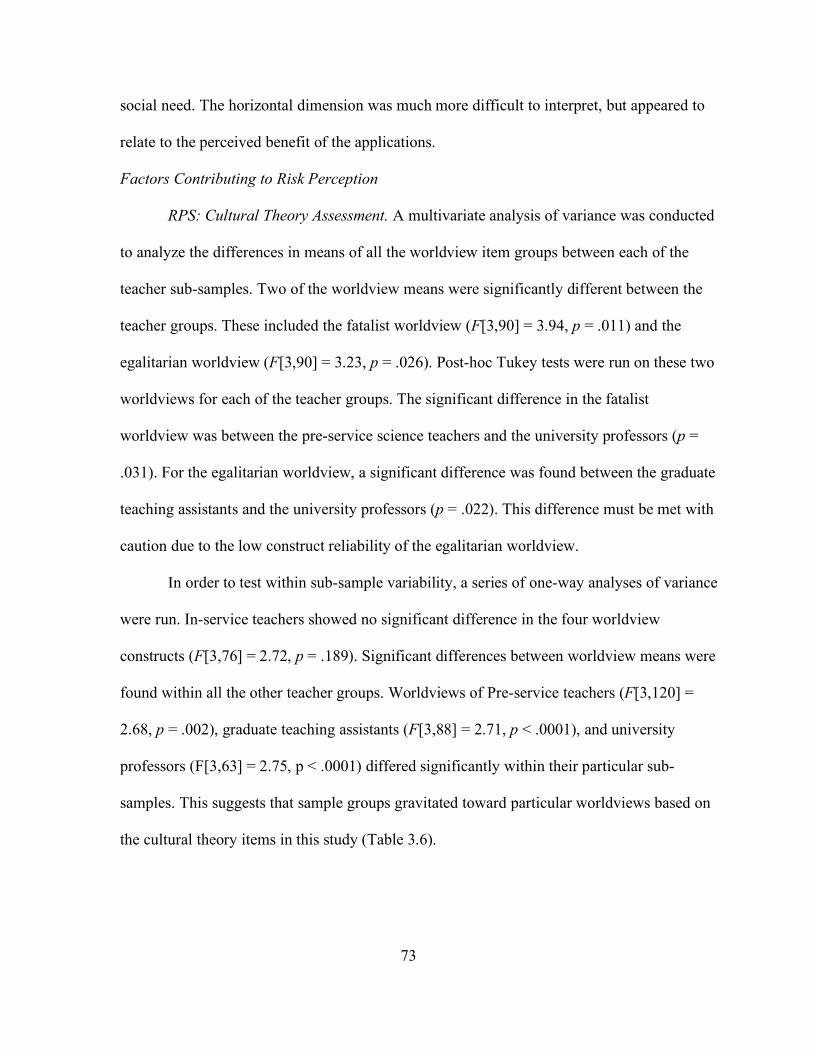
73
social need. The horizontal dimension was much more difficult to interpret, but appeared to
relate to the perceived benefit of the applications.
Factors Contributing to Risk Perception
RPS: Cultural Theory Assessment. A multivariate analysis of variance was conducted
to analyze the differences in means of all the worldview item groups between each of the
teacher sub-samples. Two of the worldview means were significantly different between the
teacher groups. These included the fatalist worldview (F[3,90] = 3.94, p = .011) and the
egalitarian worldview (F[3,90] = 3.23, p = .026). Post-hoc Tukey tests were run on these two
worldviews for each of the teacher groups. The significant difference in the fatalist
worldview was between the pre-service science teachers and the university professors (p =
.031). For the egalitarian worldview, a significant difference was found between the graduate
teaching assistants and the university professors (p = .022). This difference must be met with
caution due to the low construct reliability of the egalitarian worldview.
In order to test within sub-sample variability, a series of one-way analyses of variance
were run. In-service teachers showed no significant difference in the four worldview
constructs (F[3,76] = 2.72, p = .189). Significant differences between worldview means were
found within all the other teacher groups. Worldviews of Pre-service teachers (F[3,120] =
2.68, p = .002), graduate teaching assistants (F[3,88] = 2.71, p < .0001), and university
professors (F[3,63] = 2.75, p < .0001) differed significantly within their particular sub-
samples. This suggests that sample groups gravitated toward particular worldviews based on
the cultural theory items in this study (Table 3.6).
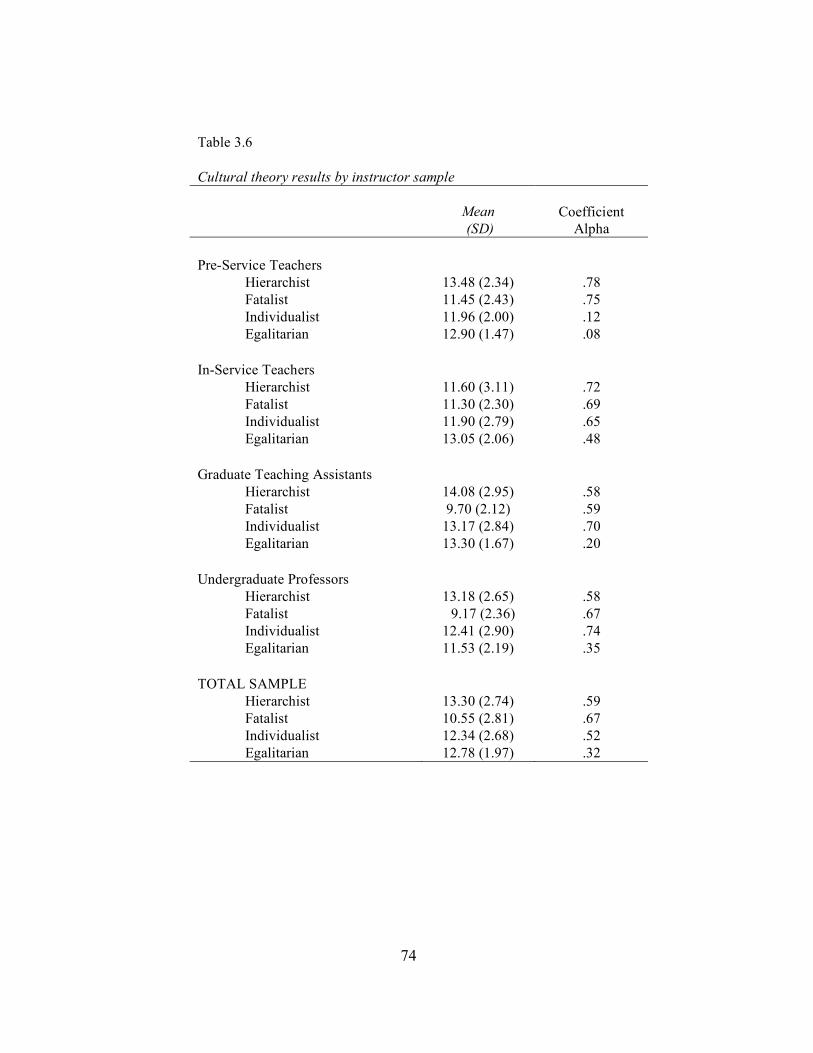
74
Table 3.6 Cultural theory results by instructor sample
Mean Coefficient (SD) Alpha Pre-Service Teachers
Hierarchist 13.48 (2.34) .78 Fatalist 11.45 (2.43) .75 Individualist 11.96 (2.00) .12 Egalitarian 12.90 (1.47) .08
In-Service Teachers
Hierarchist 11.60 (3.11) .72 Fatalist 11.30 (2.30) .69 Individualist 11.90 (2.79) .65 Egalitarian 13.05 (2.06) .48
Graduate Teaching Assistants
Hierarchist 14.08 (2.95) .58 Fatalist 9.70 (2.12) .59 Individualist 13.17 (2.84) .70 Egalitarian 13.30 (1.67) .20
Undergraduate Professors
Hierarchist 13.18 (2.65) .58 Fatalist 9.17 (2.36) .67 Individualist 12.41 (2.90) .74 Egalitarian 11.53 (2.19) .35
TOTAL SAMPLE
Hierarchist 13.30 (2.74) .59 Fatalist 10.55 (2.81) .67 Individualist 12.34 (2.68) .52 Egalitarian 12.78 (1.97) .32
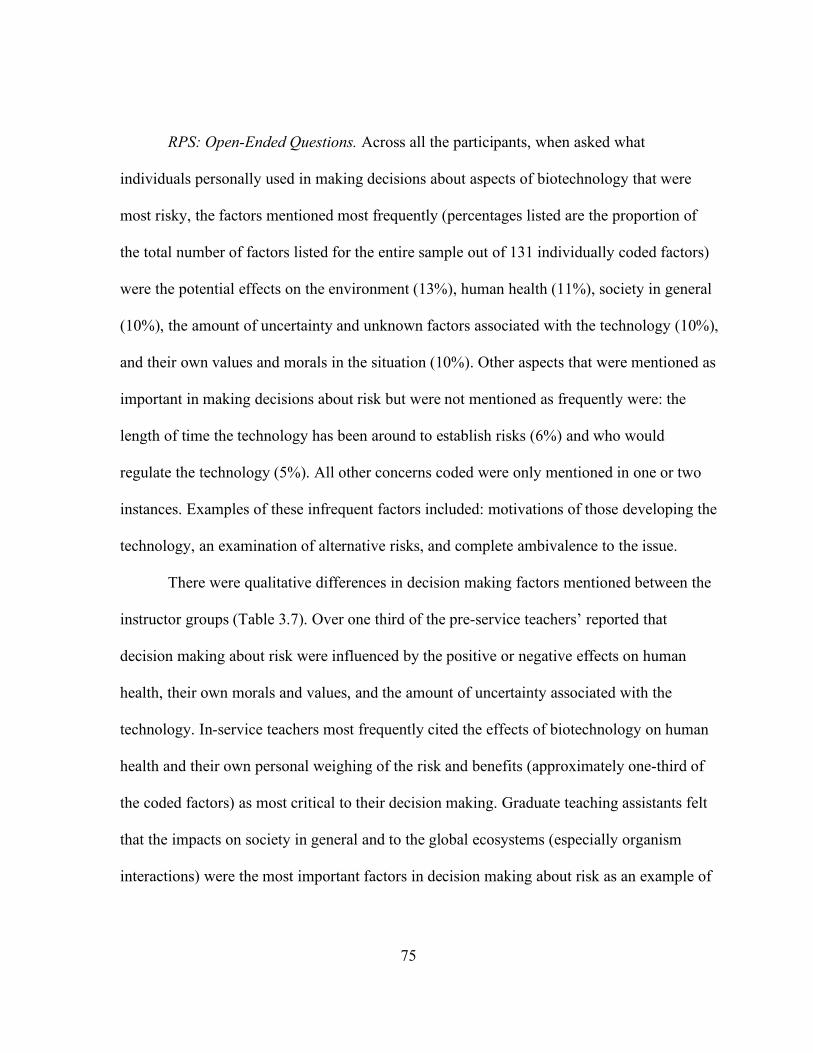
75
RPS: Open-Ended Questions. Across all the participants, when asked what
individuals personally used in making decisions about aspects of biotechnology that were
most risky, the factors mentioned most frequently (percentages listed are the proportion of
the total number of factors listed for the entire sample out of 131 individually coded factors)
were the potential effects on the environment (13%), human health (11%), society in general
(10%), the amount of uncertainty and unknown factors associated with the technology (10%),
and their own values and morals in the situation (10%). Other aspects that were mentioned as
important in making decisions about risk but were not mentioned as frequently were: the
length of time the technology has been around to establish risks (6%) and who would
regulate the technology (5%). All other concerns coded were only mentioned in one or two
instances. Examples of these infrequent factors included: motivations of those developing the
technology, an examination of alternative risks, and complete ambivalence to the issue.
There were qualitative differences in decision making factors mentioned between the
instructor groups (Table 3.7). Over one third of the pre-service teachers’ reported that
decision making about risk were influenced by the positive or negative effects on human
health, their own morals and values, and the amount of uncertainty associated with the
technology. In-service teachers most frequently cited the effects of biotechnology on human
health and their own personal weighing of the risk and benefits (approximately one-third of
the coded factors) as most critical to their decision making. Graduate teaching assistants felt
that the impacts on society in general and to the global ecosystems (especially organism
interactions) were the most important factors in decision making about risk as an example of
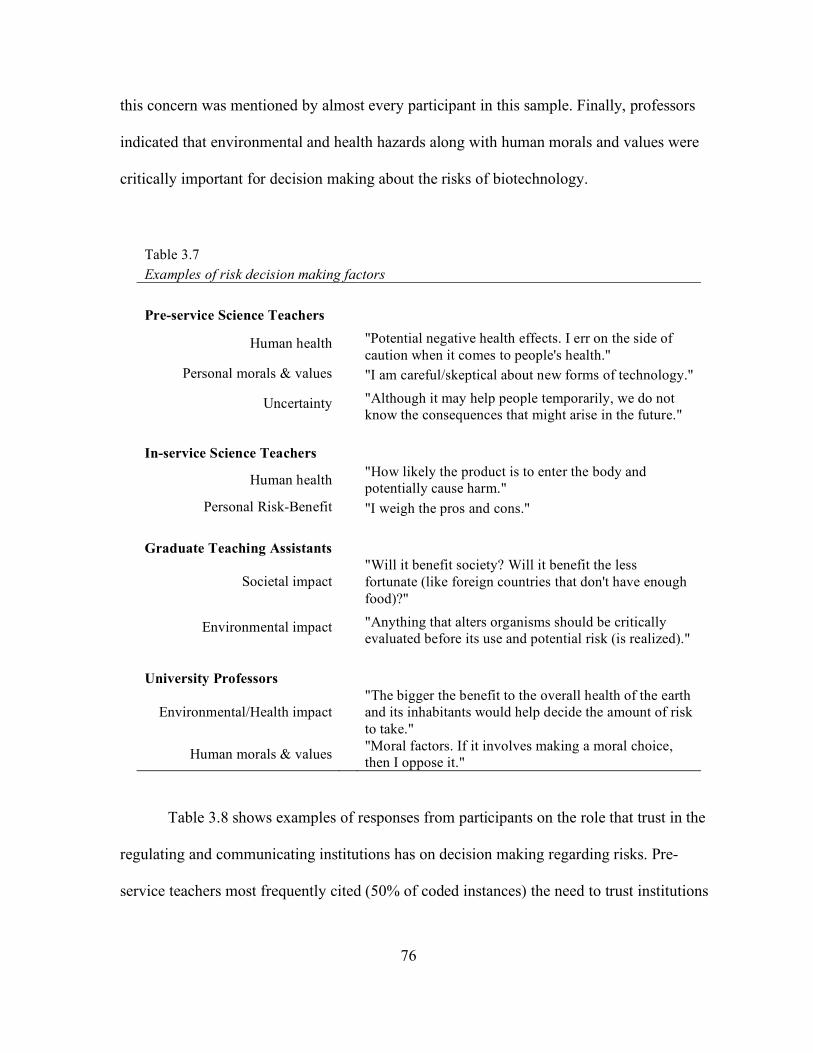
76
this concern was mentioned by almost every participant in this sample. Finally, professors
indicated that environmental and health hazards along with human morals and values were
critically important for decision making about the risks of biotechnology.
Table 3.7 Examples of risk decision making factors Pre-service Science Teachers
Human health
"Potential negative health effects. I err on the side of caution when it comes to people's health."
Personal morals & values "I am careful/skeptical about new forms of technology."
Uncertainty
"Although it may help people temporarily, we do not know the consequences that might arise in the future."
In-service Science Teachers
Human health "How likely the product is to enter the body and potentially cause harm."
Personal Risk-Benefit "I weigh the pros and cons." Graduate Teaching Assistants
Societal impact
"Will it benefit society? Will it benefit the less fortunate (like foreign countries that don't have enough food)?"
Environmental impact
"Anything that alters organisms should be critically evaluated before its use and potential risk (is realized)."
University Professors
Environmental/Health impact
"The bigger the benefit to the overall health of the earth and its inhabitants would help decide the amount of risk to take."
Human morals & values "Moral factors. If it involves making a moral choice, then I oppose it."
Table 3.8 shows examples of responses from participants on the role that trust in the
regulating and communicating institutions has on decision making regarding risks. Pre-
service teachers most frequently cited (50% of coded instances) the need to trust institutions
77
that had an established and reliable track record and the need to be wary of institutions with
agendas. In addition, this teacher group stressed that trust is not a substitute for personal
experience or moral values. For example, one teacher stated that trust, “does have an affect
(in decision making about risk), but it will not change my morals I already have instilled in
me.” In-service teachers also stated that reliable institutions should be trusted over those with
an agenda. Graduate teaching assistants (one third of the coded instances) were concerned
with understanding more about who was communicating the information. One teaching
assistant stated that, “with more information about the communicating agent, more trust can
be established.” Professors unanimously (over half of the coded instances) cited established
institutions as the most trustworthy in issues of risk negotiation.
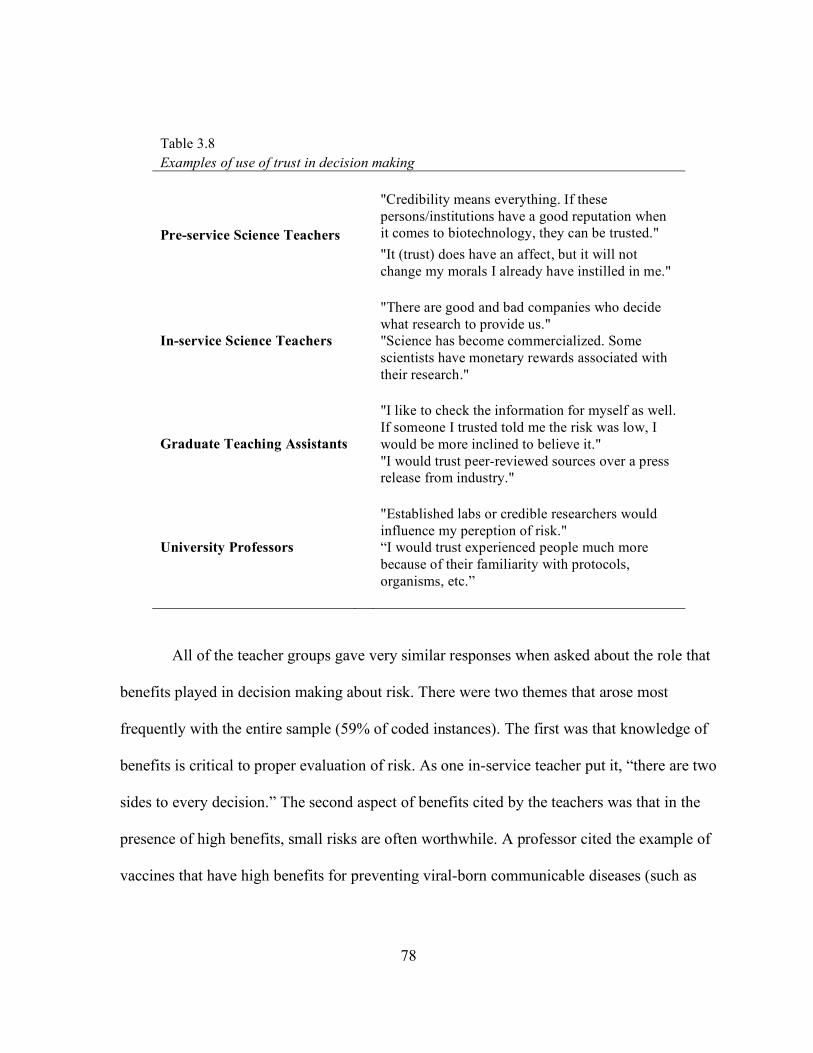
78
Table 3.8 Examples of use of trust in decision making
"Credibility means everything. If these persons/institutions have a good reputation when it comes to biotechnology, they can be trusted." Pre-service Science Teachers
"It (trust) does have an affect, but it will not change my morals I already have instilled in me."
"There are good and bad companies who decide what research to provide us."
In-service Science Teachers
"Science has become commercialized. Some scientists have monetary rewards associated with their research."
"I like to check the information for myself as well. If someone I trusted told me the risk was low, I would be more inclined to believe it." Graduate Teaching Assistants
"I would trust peer-reviewed sources over a press release from industry."
"Established labs or credible researchers would influence my pereption of risk."
University Professors
“I would trust experienced people much more because of their familiarity with protocols, organisms, etc.”
All of the teacher groups gave very similar responses when asked about the role that
benefits played in decision making about risk. There were two themes that arose most
frequently with the entire sample (59% of coded instances). The first was that knowledge of
benefits is critical to proper evaluation of risk. As one in-service teacher put it, “there are two
sides to every decision.” The second aspect of benefits cited by the teachers was that in the
presence of high benefits, small risks are often worthwhile. A professor cited the example of
vaccines that have high benefits for preventing viral-born communicable diseases (such as
79
smallpox) in the United States, and the recent scare that these vaccines might be causing
autism. The professor stated that this small and uncertain risk of autism is worth the universal
benefits that vaccines have had on wiping out many deadly diseases.
When asked how one’s education prepares one to deal with issues surrounding the
risks of biotechnology, pre-service teachers stressed that increased knowledge leads to
decision making that is more “enlightened” and can lead to “deeper thinking.” Both graduate
teaching assistants and professors noted that knowledge reduces fear because it reduces
uncertainty. One graduate teaching assistant stated that because of their extensive knowledge
they are less likely to, “buy into the fear and sensationalism of certain risks reported by the
media.” There were no themes that arose consistently in the in-service teacher group.
By and large, the professors had the most experiences with biotechnology, with every
participant citing at least one instance of biotechnology experience through employment or
laboratory work, academic coursework, and/or personal experience. In-service teachers and
graduate teaching assistants had also had experience with biotechnology but it was most
often cited as with work in an academic laboratory or through a biotechnology-associated
company. Half of the graduate teaching assistants and approximately a third of the in-service
teachers mentioned instances of this nature. Experiences with biotechnology of pre-service
teachers were extremely rare, with only four instances mentioned from a total of twenty-three
participants.
Integrated Model of Risk Perception. Correlation analyses were run to determine if
individual risk perception related to any of the demographic variables. It was found that
participant age, gender, and race were not correlated with risk perception of biotechnology as
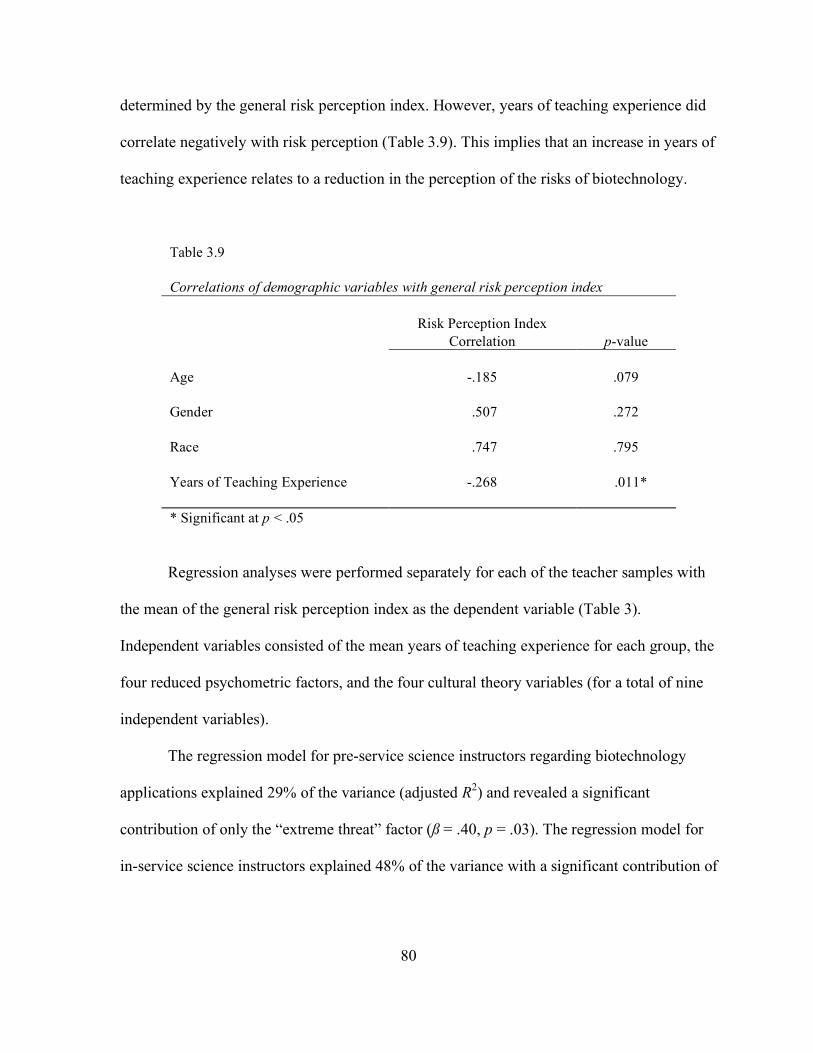
80
determined by the general risk perception index. However, years of teaching experience did
correlate negatively with risk perception (Table 3.9). This implies that an increase in years of
teaching experience relates to a reduction in the perception of the risks of biotechnology.
Table 3.9 Correlations of demographic variables with general risk perception index Risk Perception Index Correlation p-value Age -.185 .079 Gender .507 .272 Race .747 .795 Years of Teaching Experience -.268 .011* * Significant at p < .05
Regression analyses were performed separately for each of the teacher samples with
the mean of the general risk perception index as the dependent variable (Table 3).
Independent variables consisted of the mean years of teaching experience for each group, the
four reduced psychometric factors, and the four cultural theory variables (for a total of nine
independent variables).
The regression model for pre-service science instructors regarding biotechnology
applications explained 29% of the variance (adjusted R2) and revealed a significant
contribution of only the “extreme threat” factor (ß = .40, p = .03). The regression model for
in-service science instructors explained 48% of the variance with a significant contribution of
81
the individualist worldview index (ß = -.50, p = .032). Regression models for graduate
teaching assistants explained 62% of the variance and indicated significant contribution of
only the “extreme threat” factor (ß = .42, p = .041). Finally, regression models for professors
showed that none of the factors provided contributed to the variance in a significant way.
Discussion
The results from the general risk perception assessment of the RPS show that overall,
the different samples of science teachers held similar perceptions of the risks of
biotechnology. This result is surprising in light of the literature in risk analysis that implies
that there is a perceptual gap between experts and novices when considering issues of risk
(Rowe & Wright, 2001). These four groups had varying levels of expertise in both science
content and pedagogical knowledge, but for many of the measures in this particular study, no
differences were found.
Most studies of risk perception attempt to impose categories of “expert” and
“layperson” upon samples that often are ill defined (Rowe & Wright, 2001). The results of
the present study show that expertise is likely not a categorical variable (as implied in many
studies) but continuous. For this study, expertise emerged as a continuous variable as years
teaching a particular subject correlated negatively with the perception of risk of
biotechnology (Table 3.9). The results raise questions for future research regarding the
relationship of cognitive development to risk perception. How does content knowledge
correlate with risk perception? How do content and pedagogical knowledge interact to
mediate risk perception and attitudes toward science and technology?
82
The psychometric paradigm derives a “personality” rating of the particular hazard to
explain what aspects of biotechnology hazards are of particular concern. The psychometric
paradigm assessment of the current study showed that overall, instructors tended to define the
risk of biotechnology in four distinct ways. The first of these had to do with the number of
potential fatalities and the potential of posing a future threat to individuals. The second
corresponded to expert knowledge (including its relative novelty) of the risks and how this
would influence the equality of the distribution of the effects of the risk. Third was a concern
for public acceptance; how voluntary would the risks be and how immediate was the threat.
Finally, there was a general concern born out of fear.
Many of the instructor’s variables are congruent with variables that emerged from
Savadori and colleagues’ (2004) psychometric study of biotechnology risks, especially in the
context of food related applications (as apposed to medical applications), shown in Table
3.10. This study also found four factors that explained the structure of the perception of risk
from biotechnology applications: harmful and dread applications, useful applications, a
science knowledge factor, and new applications. However, there were differences in how
these factors clustered.
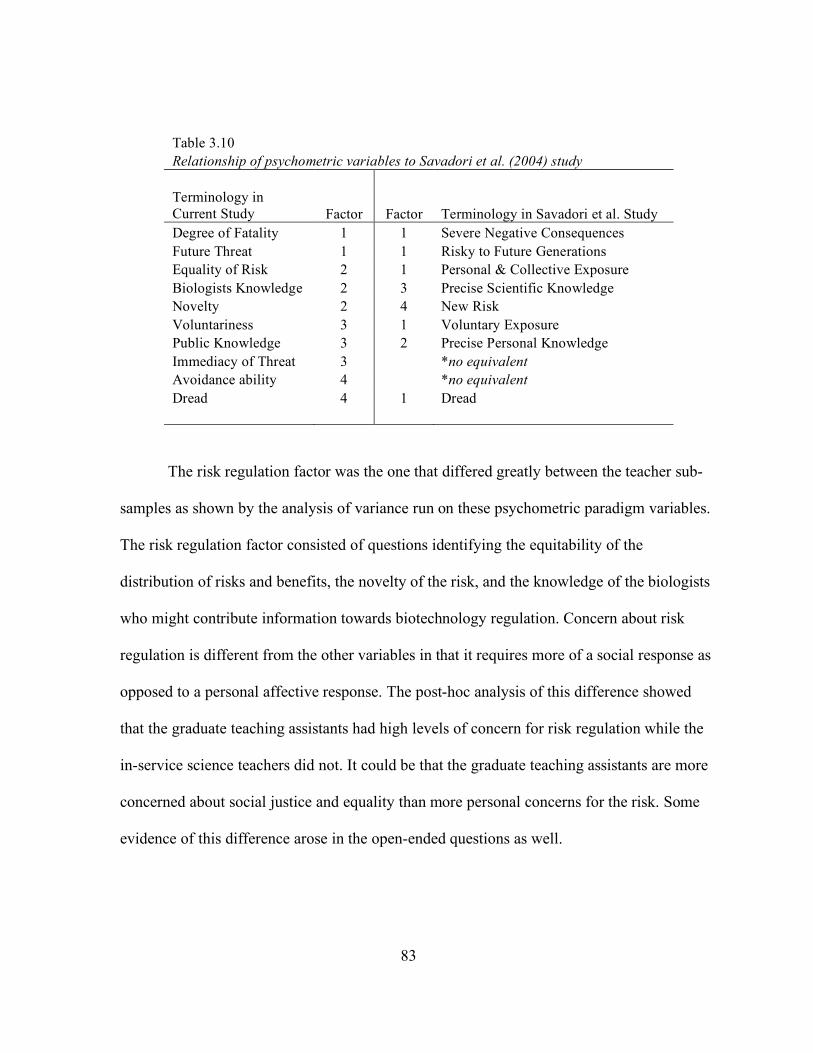
83
Table 3.10 Relationship of psychometric variables to Savadori et al. (2004) study Terminology in Current Study Factor Factor Terminology in Savadori et al. Study Degree of Fatality 1 1 Severe Negative Consequences Future Threat 1 1 Risky to Future Generations Equality of Risk 2 1 Personal & Collective Exposure Biologists Knowledge 2 3 Precise Scientific Knowledge Novelty 2 4 New Risk Voluntariness 3 1 Voluntary Exposure Public Knowledge 3 2 Precise Personal Knowledge Immediacy of Threat 3 *no equivalent Avoidance ability 4 *no equivalent Dread 4 1 Dread
The risk regulation factor was the one that differed greatly between the teacher sub-
samples as shown by the analysis of variance run on these psychometric paradigm variables.
The risk regulation factor consisted of questions identifying the equitability of the
distribution of risks and benefits, the novelty of the risk, and the knowledge of the biologists
who might contribute information towards biotechnology regulation. Concern about risk
regulation is different from the other variables in that it requires more of a social response as
opposed to a personal affective response. The post-hoc analysis of this difference showed
that the graduate teaching assistants had high levels of concern for risk regulation while the
in-service science teachers did not. It could be that the graduate teaching assistants are more
concerned about social justice and equality than more personal concerns for the risk. Some
evidence of this difference arose in the open-ended questions as well.
84
For both pre-service science teachers and graduate teaching assistants, the extreme
threat factors was important in predicting the degree of their risk perception (as measured by
the general risk perception index) in the integrated regression model. This factor consisted of
the dimensions of the degree of fatality of a particular risk and the threat to future generations
of this particular risk. These groups share two demographic characteristics in that they are
relatively young (averaging in their mid- to late-twenties) and they have relatively little
teaching experience (most between zero and one year). It is possible that the demographic
similarity of these groups leads to similar outlooks on what is perceived as risky for
biotechnology.
Studies have shown that risks perception can be different for technologies that span
numerous applications such as biotechnology (Savadori et al., 2004). In order to address this
concern, the biotechnology card sort task was employed to understand how individuals might
differentiate the risks of different biotechnology applications. Pre-service science teachers,
in-service science teachers, and graduate teaching assistants tended to view risks of
applications similarly along a continuum. They also were concerned with the target of the
impact of the technology, whether human health related or environmental. They were also
concerned about how the benefits for the particular application might mediate the risks.
The importance of benefits was evident in the card sort clusters of the professors,
although the categorization of risks did not cluster as much as that of the other teacher
groups. This may be due to the fact that with higher content knowledge comes a more
complete understanding of the subtleties of the applications, and relationships among
applications, subsequently the risks associated with them. The professors tended to make a
85
distinction between biotechnology that was oriented toward solving a previous social concern
versus those that were involving the creation of new biological material.
All groups except the in-service teachers showed significant within-group differences
between cultural worldviews on the cultural theory assessment of the RPS. These within-
group differences showed that the pre-service teachers’, graduate teaching assistants’, and
undergraduate professors’ worldviews tended to be more hierarchical and less fatalist. Based
on cultural theory, hierarchists fear technology that disrupts the “natural order” of things.
However, when it comes time for decisions to be made, hierarchists trust the experts to make
correct decisions for the good of everyone.
Results from the cultural theory items seem surprising especially in the case of the
university professors who might be expected to be more individualistic or egalitarian in their
views. There are two possible explanations for why the hierarchy worldview was so
prevalent in all of the science teacher sample groups having to do with a need for social order
and appreciation for authority in decision making. First, since the questions were created
with the focus on science and technology, for these educators there may be a “natural order”
to science research that transcends a concept of the social norm in general. Another
possibility is that in the case of biotechnology, individuals who teach science may view
themselves as experts and subsequently tend to answer items linked to a heirarchist
worldview that defer to the power of authority (themselves and their peers) in decision
making.
In the between-group analysis, pre-service teachers were significantly more fatalistic
than the professors, and the graduate teaching assistants were more egalitarian than the
86
professors. This may reflect particular worldview dispositions within these groups. In the
integrated regression analysis, the only cultural predisposition that predicted the general risk
perception index was the individualist worldview of the in-service teacher group.
The worldview classification categories were further elucidated in the open-ended
question portion of the survey. The three factors that arose most frequently to describe what
aspects of biotechnology individuals use when making decisions about risk were: a) the
potential frequency and severity of effects to the environment, human health, and society, b)
uncertainty associated with the technology, and c) their own morals and values. Individuals
appeared to be claiming a type of quantitative cost-benefit analysis when explaining why
they consider something as risky. However, the pre-service teachers were much more likely
to claim personal morals and values as critical in risk perception formation. In-service
teachers mentioned conducting cost-benefit analysis, but claimed their personal evaluations
and not data were more important in the considerations. Both graduate teaching assistants
and professors claimed a more quantitative evaluation of the risks and benefits. These
findings resonate with research that claims that an increase in expertise in a particular area
biases one to a more rationalistic evaluation of risk (Slovic, 1987). There may be an
underlying developmental component of science expertise that is contributing to the decision
making of these groups.
Another component of risk perception that has been proposed previously is the role
that trust in the communicating institutions has in forming perceptions (Siegrist, 2005). Trust
appeared to play a large role in decision making surrounding risk. Since all the instructors
were trained in some aspect of science, and they frequently cited the need for peer-reviewed
87
information and an understanding of the motivations behind whomever is communicating the
information regarding risk. Interestingly, several individuals in the pre-service teacher group
mentioned that trust in information sources was never a substitute for personal moral values.
One limitation that has been suggested for risk perception analysis (especially in the
context of the psychometric paradigm) is that an aggregation of participants may mask
individual variability (Langford et al., 1999; Marris, Langford, Saunderson, & O’Riordan,
1997). In this case, aggregate sub-samples were grouped by instructional type. This seems
logical in the sense that these different groups have differing levels of content and
pedagogical knowledge. This study implies that years of teaching experience may play a role
in mediating risk perception, but there are likely other variables besides knowledge that may
play a large role and could vary highly between individuals. For example, personal
experiences with biotechnology can vary highly between individuals independent of their
knowledge and can have large impact on perception of risk. Based on the locations data was
collected and the high density of advanced degrees in the in-service teacher sample, it is
likely biased towards instructors who were highly driven in their personal and professional
development. The analysis of the open-ended questions allowed for individual voices to
emerge in this study.
Another limitation is the variability in knowledge of the different biotechnology
applications used with the card sort task. Although, each card carried with it a brief
description of the application, this descriptor might not have been sufficient for instructors to
construct a holistic view of the application and therefore make accurate conceptualization of
the risks associated with it. It is possible that linguistic cues might have been a powerful
88
factor in influencing the card sort. For example, several of the cards used the term “bio-
engineered organisms”, and these might have been perceived as similarly risky because of
the term and not because of any risk dimension.
Implications for Science Education
Within the context of emergent technologies such as biotechnology, one component
of student attitude formation will be their perceptions of the risks and benefits associated
with that technology. Teacher perceptions are equally important to understand because
instructors will provide one of the critical frameworks through which science students will
mediate their perceptions of risk when making decisions regarding emergent technology
issues in the future. Additionally, it is likely that instructor attitudes, beliefs, worldviews, and
perceptions all impact pedagogical practice. Understanding how various groups of science
instructors perceive risk and the factors that impact this perception could shape the teaching
of emergent technologies in the context of STS curricula. Do instructors’ risk perceptions (as
indicated by the psychometric paradigm) determine what they choose to focus on in socially
contextualized science and technology lessons? Do instructor worldviews shape how they
choose to frame STS lessons?
This study provides evidence that various groups of instructors similarly perceive the
aspects of biotechnology that must be considered in risk evaluation. However, differences
begin to arise when examining how the individual groups attach significance to these
biotechnology risk factors. As with any controversial issue, personal experience, morals, and
89
values often play a large role in attitude formation and risk perception. In addition, factors
contributing to the perception of risk likely extent beyond those suggested in this manuscript.
Most important is the role that science educators play in preparing students to
participate in an increasingly technological society. If teachers’ classroom message of the
social impacts of emergent technologies includes precaution where it is not due and promotes
fear in the face of uncertainty, then this message is co-constructed in students’ future
encounters with emergent technologies. If technological growth and development is forever
linked to risk, fear, precaution, and uncertainty then future innovation or its acceptance is
stifled. Science education should not promote fear and precaution, but teach students to be,
“more disappointed by the things that [they] didn’t do than the ones [they] did.” Science
education should inspire students to, “throw off the bowlines. Sail away from the safe harbor.
Catch the trade wind in [their] sails. Explore. Dream. Discover (Mark Twain).”
90
References
American Association for the Advancement of Science (AAAS). (1990). Science for all
Americans. New York: Oxford University Press.
American Association for the Advancement of Science (AAAS). (1993). Benchmarks for
science literacy. New York, NY: Oxford University Press.
Bagozzi, R. P., & Burnkrant, R. E. (1979). Attitude organization and the attitude-behaviour
relationship. Journal of Personality and Social Psychology, 37, 913-929.
Bal, S., Samanci, N., & Bozkurt, O. (2007). University students’ knowledge and attitude
about genetic engineering. Eurasian Journal of Mathematics, Science, and
Technology Education, 3, 119-126.
Barnett, J., & Breakwell, G. M. (2001). Risk perception and experience: Hazard personality
profiles and individual differences. Risk Analysis, 21, 171-177.
Berth, H., Balck, F., & Dinkel, A. (2002). Attitudes toward genetic testing in patients at risk
for Hnpcc/Fap and the German population. Genetic Testing, 6, 273-280.
Boholm, A. (1996). Risk perception and social anthropology: Critique for cultural theory.
Ethnos, 61, 64-84.
Boone, H. N., Gartin, S. A., Boone, D. A., & Hughes, J. E. (2006). Modernizing the
agricultural education curriculum: An analysis of agricultural education teachers’
attitudes, knowledge, and understanding of biotechnology. Journal of Agricultural
Education, 47, 78-89.
91
Bouyer, M. Bagdassarian, S., Chaabanne, S., & Mullet, E. (2001). Personality correlates of
risk perception. Risk Analysis, 21, 457-465.
Breckler, S. J. (1984). Empirical validation of affect, behavior, and cognition as distinct
components of attitude. Journal of Personality & Social Psychology, 47, 1191-1205.
Brenot, J., Bonnefous, S., & Marris, C. (1998). Testing the cultural theory of risk in France.
Risk Analysis, 18, 729-739.
Chen, S. Y., & Raffan, J. (1999). Biotechnology: Students’ knowledge and attitudes in the
U.K. and Taiwan. Journal of Biological Education, 38, 7-12.
Chin, C.-C. (2005). First-year pre-service teachers in Taiwan-Do they enter the teacher
program with satisfactory scientific literacy and attitudes toward science?
International Journal of Science Education, 27, 1549-1570.
Covitt, B. A., Gomez-Schmidt, C., & Zint, M. T. (2005). An evaluation of the risk education
module. Journal of Environmental Education, 36(2), 3-13.
Dake, K. (1991). Myths of nature: Cultural and social construction of risk. Journal of Social
Issues, 48, 21-37.
Dake, K. (1992). Orienting dispositions in the perception of risk: An analysis of
contemporary worldviews and cultural biases. Journal of Cross-Cultural Psychology,
22, 61-82.
Dake, K. & Wildavsky, A. (1991). Individual differences in risk perception and risk-taking
preferences. In B. J. Garrick & W. C. Gekler, (Eds.), The analysis, communication,
and perception of risk (pp. 15-24). New York, NY. Plenum Press.
92
Dawson, V. & Schibeci, R. (2003). Western Australian high school students’ attitudes toward
biotechnology processes. Journal of Biological Education, 38, 7-12.
Dawson, V., & Soams, C. (2006). The effect of biotechnology education on Australian high
school students’ understanding and attitudes about biotechnology processes. Research
in Science & Technological Education, 24, 183-198.
Douglas, M. (1999). Four cultures: The evolution of a parsimonious model. GeoJournal, 47,
411-415.
Douglas, M. & Wildavsky, A. (1982). Risk and culture: An essay on the selection of
technological and environmental dangers. Berkley, CA: University of California
Press.
Finucane, M. L., Alhakami, A., Slovic, P., & Johnson, S. M. (2000). The affect heuristic in
judgment of risks and benefits. Journal of Behavioral Decision-Making, 13, 1-17.
Fischoff, B., Slovic, P., & Lichtenstein, S. (1978). How safe is safe enough? A psychometric
study of attitudes toward technological risks and benefits. Policy Sciences, 9, 127-
152.
Frewer, L. J., Howard, C., & Shepard, R. (1997). Public concerns in the United Kingdom
about general and specific applications of genetic engineering: Risk, benefit and
ethics. Science, Technology, & Human Values, 22, 98-124.
Gaskell, G., Bauer, M. W., Durant, J., & Allum, N. C. (1999). Worlds apart? The reception
of genetically modified foods in Europe and the U.S.. Science, 285, 384-387.
Glaser, B. G., & Strauss, A. (1967). Discovery of grounded theory: Strategies for qualitative
research. Mill Valley, CA: Sociology Press.
93
Gunter, B., Kinderlerer, J., & Beyleveld, D. (1998). Teenagers and biotechnology: A survey
of understanding and opinion in Britain, Studies in Science Education, 32, 81-112.
Huang, C., & Ruan, D. (2008). Fuzzy risks and an updating algorithm with new observations.
Risk Analysis, 28, 681-694.
Jarman, R., & McClune, B. (2007). Developing scientific literacy: Using news media in the
classroom. New York, NY: Open University Press.
Johnson, B. B. (1991). Risk and culture research: Some cautions. Journal of Cross-Cultural
Psychology, 22, 141-149.
Kruskal, J. B., & Wish, M. (1991). Multidimensional scaling. Series: Quantitative
Applications in the Social Sciences. Sage Publications: Newbury Park, England.
Lamanauskas, V., & Makarskaité-Petkeviciené, R. (2008). Lithuanian university students’
knowledge of biotechnology and their attitudes to the taught subject. Eurasia Journal
of Mathematics, Science, & Technology Education, 4, 269-277.
Langford, I. H., Marris, C., McDonald, A.-L., Goldstein, H., Rasbash, J., & O’Riordan, T.
(1999). Simultaneous analysis of individual and aggregate responses in psychometric
data using multilevel modeling. Risk Analysis, 19, 675-683.
Lappan, G. (2000). A vision of learning to teach for the 21st century. School Science and
Mathematics, 100, 319-325.
Laugksch, R. C. (2000). Scientific literacy: A conceptual view. Science Education, 84, 71-94.
Lee, C.-J., Scheufele, D. A., & Lewenstein, B. V. (2005). Public attitudes toward emerging
technologies: Examining the interactive effects of cognitions and affect on public
attitudes toward nanotechnology. Science Communication, 27, 240-267.
94
Leiserowitz, A. A. (2003). Global warming in the American mind: The roles of affect,
imagery, and worldviews in risk perception, policy preferences and behavior.
Unpublished doctoral dissertation, University of Oregon, Eugene.
Lock, R., & Miles, C. (1993). Biotechnology and genetic engineering: Students knowledge
and attitudes. Journal of Biological Education, 27, 267-273.
Mangusson, M. K., & Hursti, U. K. (2002). Consumer attitudes toward genetically modified
foods. Appetite, 39, 9-24.
Marris, C., Langford, I., & O’Riordan, T. (1996). Integrating sociological and psychological
approaches to public perception of environmental risks: Detailed results from a
questionnaire survey. CSERGE Working Paper GEC 96-07. University of East
Anglia, UK: Centre for Social and Economic Research on the Global Environment.
Marris, C., Langford, I., Saunderson, T., O’Riordan, T. (1997). Exploring the psychometric
paradigm: Comparisons between aggregate and individual analyses. Risk Analysis,
17, 303-312.
Massarani, L., & Moreira, I. C. (2005). Attitudes toward genetics: A case study among
Brazilian high school students. Public Understanding of Science, 14, 201-212.
Moerbeek, H., & Casimier, G. (2005). Gender differences in consumers’ acceptance of
genetically modified foods. International Journal of Consumer Studies, 29, 308-318.
Moon, W., & Balasubramaian, S. K. (2004). Public attitudes toward biotechnology: The
mediating role of risk perceptions on the impact of trust, awareness, and outrage.
Review of Agricultural Economics, 26, 186-208.
95
National Research Council (NRC). (1995). National science education standards.
Alexandria, VA: National Academy Press.
O’Conner, R. E., Bord, R. J., & Fisher, A. (1998). The curious impact of knowledge about
climate change on risk perceptions and willingness to address climate change. Risk
Analysis, 19, 461-471.
Peters, E., & Slovic, P. (1996). The role of affect and worldviews on orienting dispositions in
the perception and acceptance of nuclear power. Journal of Applied Social
Psychology, 26, 1427-1453.
Prokop, P., Leskova, A., Kubiatko, M., & Diran, C. (2008). Slovakian students’ knowledge
of and attitudes toward biotechnology. International Journal of Science Education.
29, 895-907.
Rayner, S. (1992). Cultural Theory and Risk Analysis. In S. Krimsky & D. Golding (Eds.),
Social Theories of Risk (pp. 83-115). Westport, CT: Praeger.
Reid, N. (2006). Thoughts on attitude measurement. Research in Science & Technological
Education, 24, 3-27.
Rowe, G., & Wright, G. (2001). Differences in expert and lay judgments of risk: myth or
reality? Risk Analysis, 21, 341-356.
Sáez, M. J., Niño, A. G., & Carretero, A. (2008). Matching society values: Students’ views of
biotechnology. International Journal of Science Education, 30, 167-183.
Savadori, L., Savio, S., Nicotra, E., Rumiati, R., Finucane, M., & Slovic, P. (2004). Expert
and public perception of risk from biotechnology. Risk Analysis, 24, 1289-1299.
96
Siefert, F, & Torgenson, H. (1995). Attitudes towards biotechnology in Austria: Can cultural
theory explain empirical data? Discussion paper, Institute of Technology Assessment,
Vienna, Austria.
Siegrist, M. (1998). Beliefs in gene technology: The influence of environmental attitudes and
gender. Personality and Individual Differences, 24, 861-866.
Siegrist, M. (1999). A causal model explaining the perception and acceptance of gene
technology. Journal of Applied Social Psychology, 29, 2093-2106.
Siegrist, M. (2000). The influence of trust and perceptions of risks and benefits on the
acceptance of gene technology. Risk Analysis, 20, 195-204.
Siegrist, M. (2005). Perception of risk: The influence of general trust and general confidence.
Journal of Risk Research, 8, 145-156.
Sjöberg, L. (1995). Explaining risk perception: An empirical and quantitative evaluation of
cultural theory. Rhizikon: Risk Research Reports, No. 22. Center for Risk Research,
Stockholm, Sweden.
Sjöberg, L. (2000). Factors in risk perception. Risk Analysis, 20, 1-11.
Sjöberg, L. (2002). Attitudes toward technology and risk: Going beyond what is immediately
given. Policy Sciences, 35, 379-400.
Slovic, P. (1987). Perception of risk. Science, 236, 280-285.
Slovic, P. (1999). Trust, emotion, sex, politics, and science. Surveying the risk-assessment
battlefield. Risk Analysis, 19, 689-701.
Slovic, P., Fischoff, B., & Lichtenstein, S. (1979). Rating the risks. Environment, 21(3),14-
20, 36-39.
97
Tanaka, Y. (2004). Major psychological factors effecting acceptance of gene-recombination
technology. Risk Analysis, 24, 1575-1583.
Trefil, J. (2008). Why Science? Arlington, VA: NSTA Press.
Tsohou, A., Karyda, M., Kokolakis, S., & Kiountouzis, E. (2006). Formulating information
systems risk management strategies through cultural theory. Information
Management & Computer Security, 14(3), 198-217.
Tversky, A., & Kahneman, D. (1974). Judgment under uncertainty: Heuristics and biases.
Science, 185, 1124.
WASH-1400. (1975). Reactor Safety Study—An Assessment of Accident Risks in U.S.
Commercial Nuclear Power Plants. NUREG-75/014, Washington, D.C.: Nuclear
Regulatory Commission.
Zechendorf, B. (1994). What the public thinks about biotechnology. Bio/Technology, 12,
870-875.
Zint, M. T. (2001). Advancing environmental risk education. Risk Analysis, 21, 417-426.
Zint, M. T., & Peyton, R. B. (2001). Improving risk education in grades 6-12: A needs
assessment of Michigan, Ohio, and Wisconsin science teachers. Journal of
Environmental Education, 32(2), 46-54.

98
APPENDICES
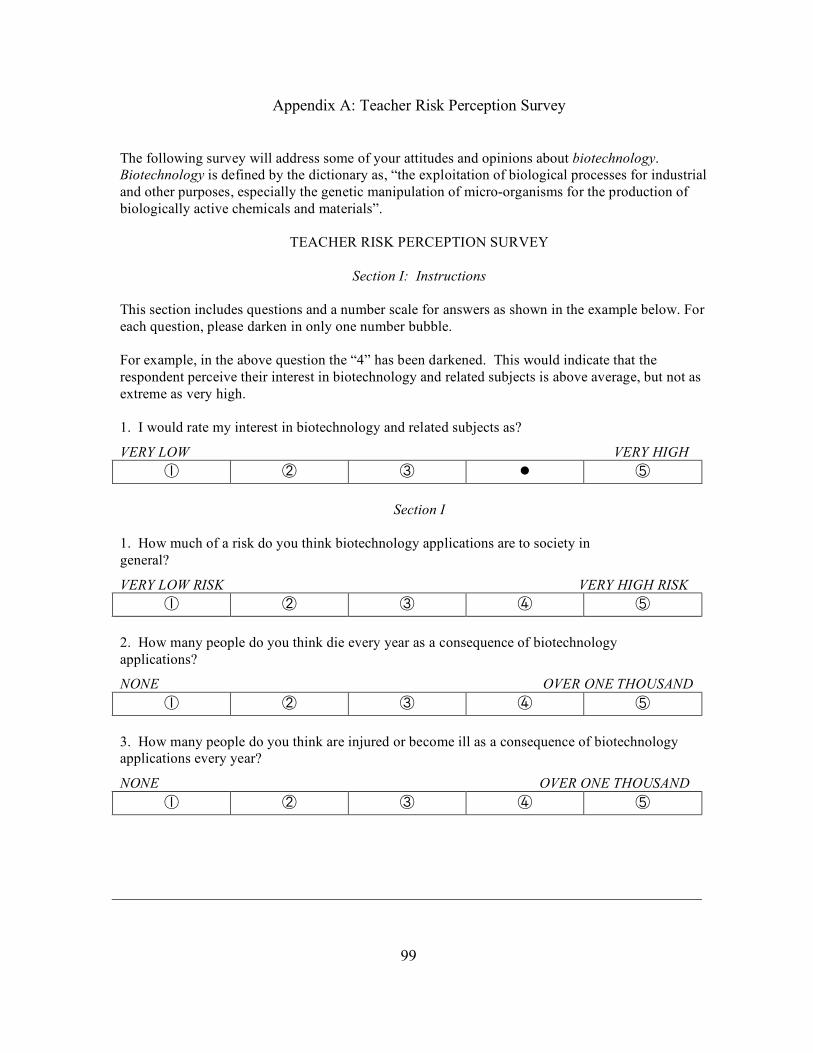
99
Appendix A: Teacher Risk Perception Survey
The following survey will address some of your attitudes and opinions about biotechnology. Biotechnology is defined by the dictionary as, “the exploitation of biological processes for industrial and other purposes, especially the genetic manipulation of micro-organisms for the production of biologically active chemicals and materials”.
TEACHER RISK PERCEPTION SURVEY
Section I: Instructions This section includes questions and a number scale for answers as shown in the example below. For each question, please darken in only one number bubble. For example, in the above question the “4” has been darkened. This would indicate that the respondent perceive their interest in biotechnology and related subjects is above average, but not as extreme as very high. 1. I would rate my interest in biotechnology and related subjects as?
VERY LOW VERY HIGH ① ② ③ ● ⑤
Section I
1. How much of a risk do you think biotechnology applications are to society in general?
VERY LOW RISK VERY HIGH RISK ① ② ③ ④ ⑤
2. How many people do you think die every year as a consequence of biotechnology applications?
NONE OVER ONE THOUSAND ① ② ③ ④ ⑤
3. How many people do you think are injured or become ill as a consequence of biotechnology applications every year?
NONE OVER ONE THOUSAND ① ② ③ ④ ⑤
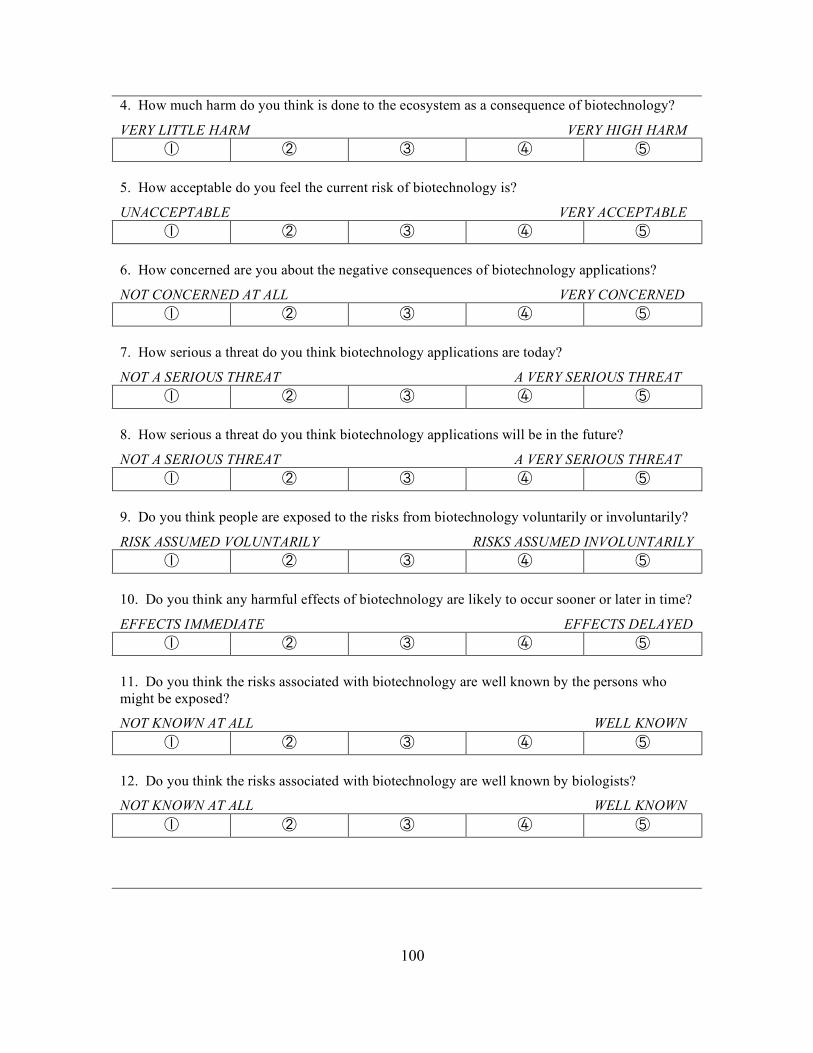
100
4. How much harm do you think is done to the ecosystem as a consequence of biotechnology?
VERY LITTLE HARM VERY HIGH HARM ① ② ③ ④ ⑤
5. How acceptable do you feel the current risk of biotechnology is?
UNACCEPTABLE VERY ACCEPTABLE ① ② ③ ④ ⑤
6. How concerned are you about the negative consequences of biotechnology applications?
NOT CONCERNED AT ALL VERY CONCERNED ① ② ③ ④ ⑤
7. How serious a threat do you think biotechnology applications are today?
NOT A SERIOUS THREAT A VERY SERIOUS THREAT ① ② ③ ④ ⑤
8. How serious a threat do you think biotechnology applications will be in the future?
NOT A SERIOUS THREAT A VERY SERIOUS THREAT ① ② ③ ④ ⑤
9. Do you think people are exposed to the risks from biotechnology voluntarily or involuntarily?
RISK ASSUMED VOLUNTARILY RISKS ASSUMED INVOLUNTARILY ① ② ③ ④ ⑤
10. Do you think any harmful effects of biotechnology are likely to occur sooner or later in time?
EFFECTS IMMEDIATE EFFECTS DELAYED ① ② ③ ④ ⑤
11. Do you think the risks associated with biotechnology are well known by the persons who might be exposed?
NOT KNOWN AT ALL WELL KNOWN ① ② ③ ④ ⑤
12. Do you think the risks associated with biotechnology are well known by biologists?
NOT KNOWN AT ALL WELL KNOWN ① ② ③ ④ ⑤
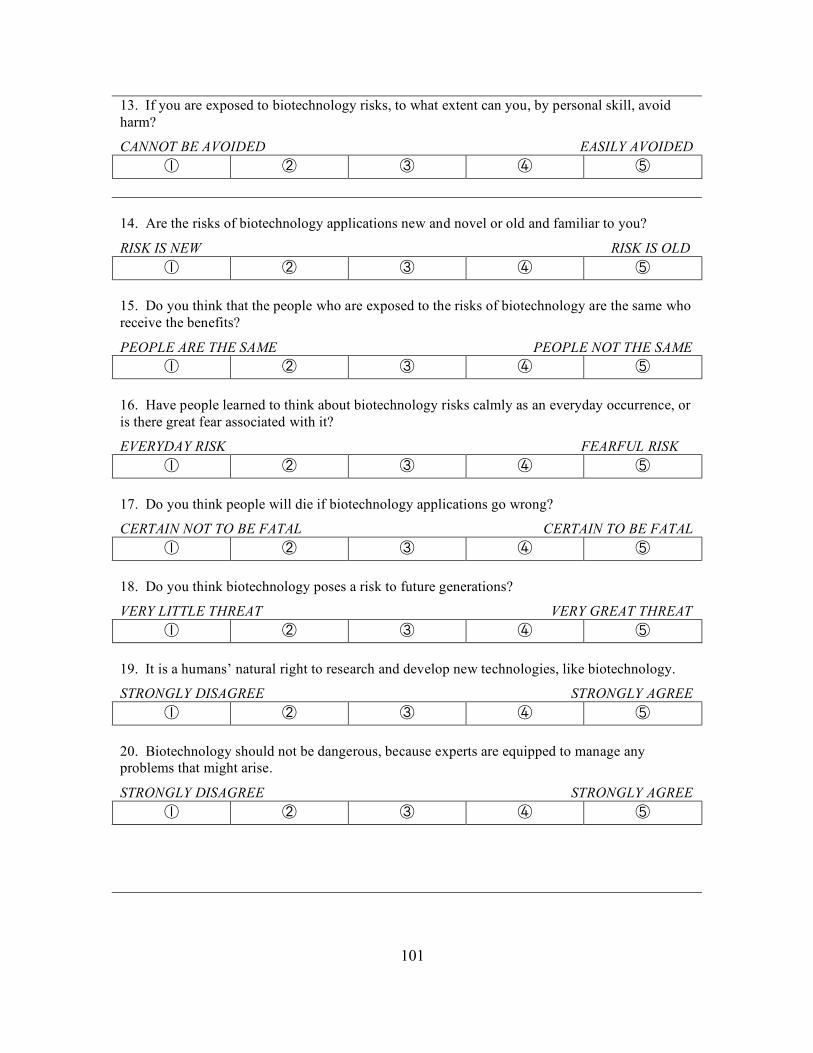
101
13. If you are exposed to biotechnology risks, to what extent can you, by personal skill, avoid harm?
CANNOT BE AVOIDED EASILY AVOIDED ① ② ③ ④ ⑤
14. Are the risks of biotechnology applications new and novel or old and familiar to you?
RISK IS NEW RISK IS OLD ① ② ③ ④ ⑤
15. Do you think that the people who are exposed to the risks of biotechnology are the same who receive the benefits?
PEOPLE ARE THE SAME PEOPLE NOT THE SAME ① ② ③ ④ ⑤
16. Have people learned to think about biotechnology risks calmly as an everyday occurrence, or is there great fear associated with it?
EVERYDAY RISK FEARFUL RISK ① ② ③ ④ ⑤
17. Do you think people will die if biotechnology applications go wrong?
CERTAIN NOT TO BE FATAL CERTAIN TO BE FATAL ① ② ③ ④ ⑤
18. Do you think biotechnology poses a risk to future generations?
VERY LITTLE THREAT VERY GREAT THREAT ① ② ③ ④ ⑤
19. It is a humans’ natural right to research and develop new technologies, like biotechnology.
STRONGLY DISAGREE STRONGLY AGREE ① ② ③ ④ ⑤
20. Biotechnology should not be dangerous, because experts are equipped to manage any problems that might arise.
STRONGLY DISAGREE STRONGLY AGREE ① ② ③ ④ ⑤
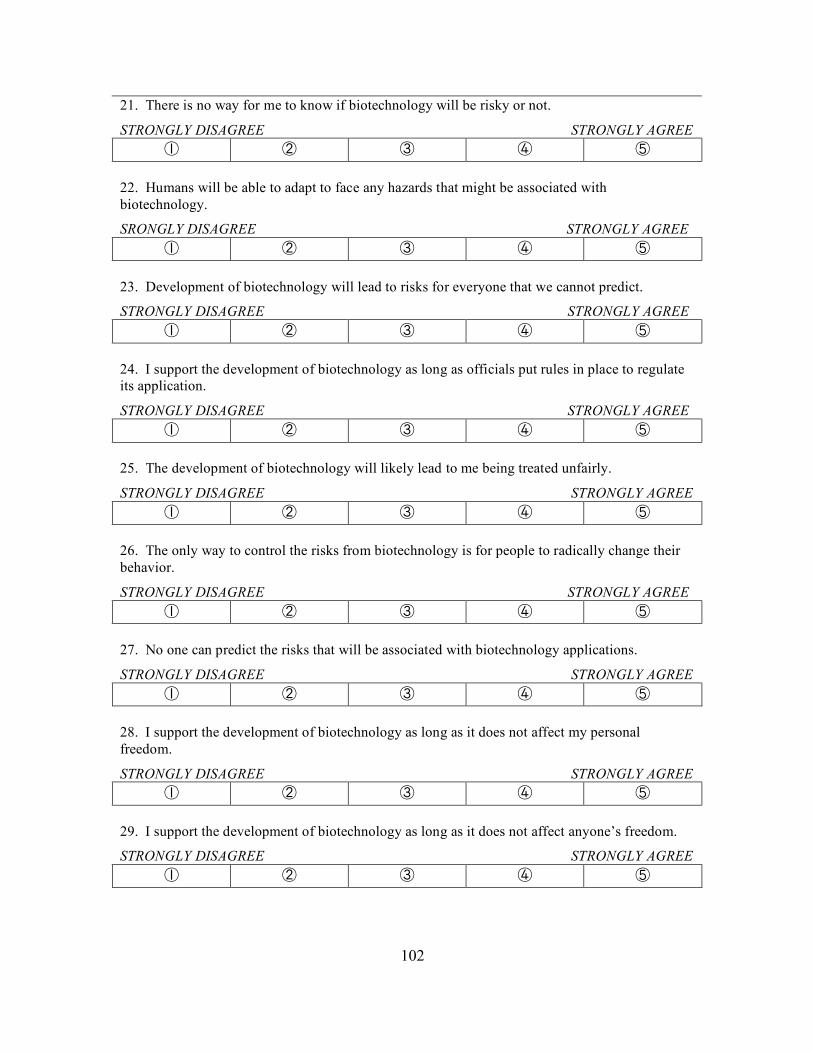
102
21. There is no way for me to know if biotechnology will be risky or not.
STRONGLY DISAGREE STRONGLY AGREE ① ② ③ ④ ⑤
22. Humans will be able to adapt to face any hazards that might be associated with biotechnology.
SRONGLY DISAGREE STRONGLY AGREE ① ② ③ ④ ⑤
23. Development of biotechnology will lead to risks for everyone that we cannot predict.
STRONGLY DISAGREE STRONGLY AGREE ① ② ③ ④ ⑤
24. I support the development of biotechnology as long as officials put rules in place to regulate its application.
STRONGLY DISAGREE STRONGLY AGREE ① ② ③ ④ ⑤
25. The development of biotechnology will likely lead to me being treated unfairly.
STRONGLY DISAGREE STRONGLY AGREE ① ② ③ ④ ⑤
26. The only way to control the risks from biotechnology is for people to radically change their behavior.
STRONGLY DISAGREE STRONGLY AGREE ① ② ③ ④ ⑤
27. No one can predict the risks that will be associated with biotechnology applications.
STRONGLY DISAGREE STRONGLY AGREE ① ② ③ ④ ⑤
28. I support the development of biotechnology as long as it does not affect my personal freedom.
STRONGLY DISAGREE STRONGLY AGREE ① ② ③ ④ ⑤
29. I support the development of biotechnology as long as it does not affect anyone’s freedom.
STRONGLY DISAGREE STRONGLY AGREE ① ② ③ ④ ⑤
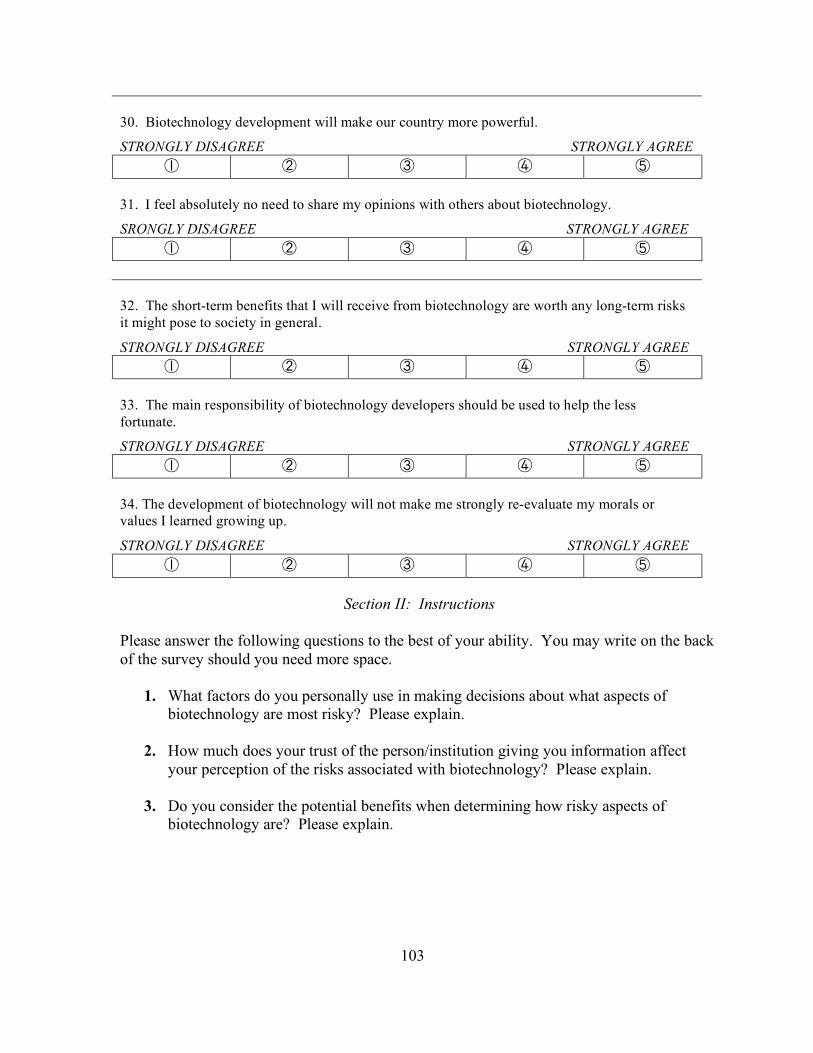
103
30. Biotechnology development will make our country more powerful.
STRONGLY DISAGREE STRONGLY AGREE ① ② ③ ④ ⑤
31. I feel absolutely no need to share my opinions with others about biotechnology.
SRONGLY DISAGREE STRONGLY AGREE ① ② ③ ④ ⑤
32. The short-term benefits that I will receive from biotechnology are worth any long-term risks it might pose to society in general.
STRONGLY DISAGREE STRONGLY AGREE ① ② ③ ④ ⑤
33. The main responsibility of biotechnology developers should be used to help the less fortunate.
STRONGLY DISAGREE STRONGLY AGREE ① ② ③ ④ ⑤
34. The development of biotechnology will not make me strongly re-evaluate my morals or values I learned growing up.
STRONGLY DISAGREE STRONGLY AGREE ① ② ③ ④ ⑤
Section II: Instructions
Please answer the following questions to the best of your ability. You may write on the back of the survey should you need more space.
1. What factors do you personally use in making decisions about what aspects of biotechnology are most risky? Please explain.
2. How much does your trust of the person/institution giving you information affect
your perception of the risks associated with biotechnology? Please explain.
3. Do you consider the potential benefits when determining how risky aspects of biotechnology are? Please explain.

104
4. Do you think your education in science content and research has affected how you perceive the risks of science and technology as apposed to others who do not have that training? Why do you think there are similarities/differences?
5. Do you think your personal experiences have affected how you perceive the risks of
biotechnology? If you do not mind, please list and explain specific experiences that have shaped your understanding of the risk of biotechnology.
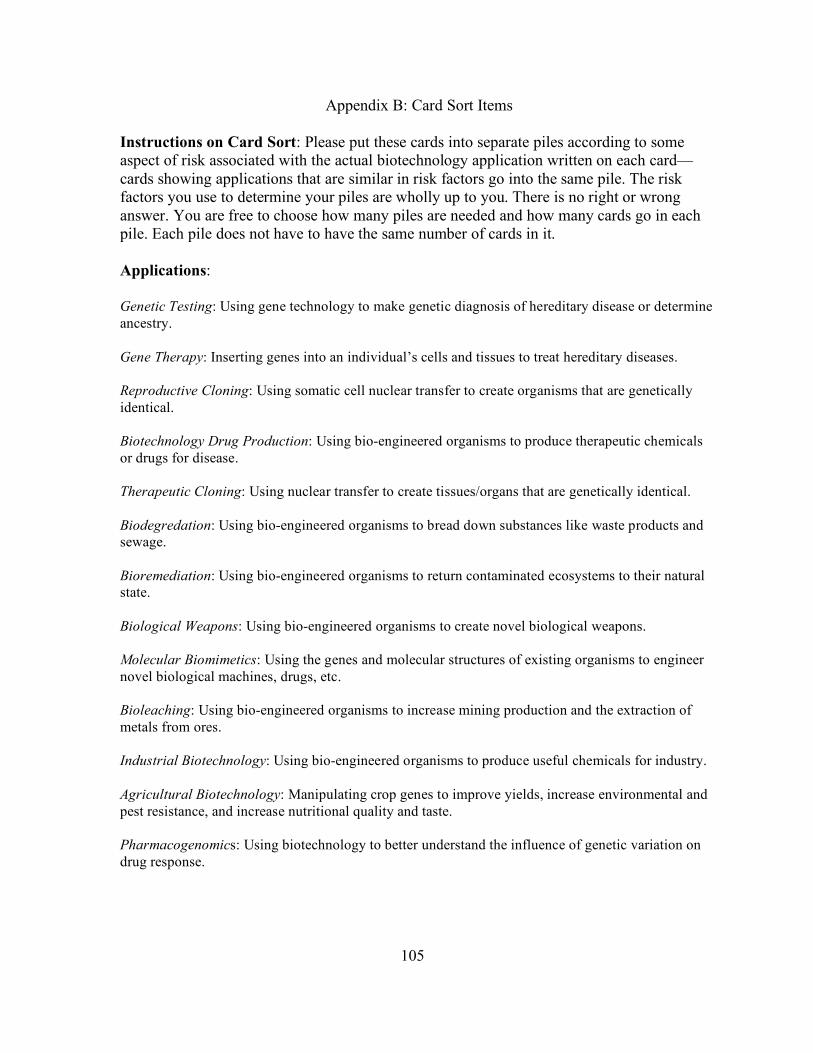
105
Appendix B: Card Sort Items
Instructions on Card Sort: Please put these cards into separate piles according to some aspect of risk associated with the actual biotechnology application written on each card—cards showing applications that are similar in risk factors go into the same pile. The risk factors you use to determine your piles are wholly up to you. There is no right or wrong answer. You are free to choose how many piles are needed and how many cards go in each pile. Each pile does not have to have the same number of cards in it. Applications: Genetic Testing: Using gene technology to make genetic diagnosis of hereditary disease or determine ancestry. Gene Therapy: Inserting genes into an individual’s cells and tissues to treat hereditary diseases. Reproductive Cloning: Using somatic cell nuclear transfer to create organisms that are genetically identical. Biotechnology Drug Production: Using bio-engineered organisms to produce therapeutic chemicals or drugs for disease. Therapeutic Cloning: Using nuclear transfer to create tissues/organs that are genetically identical. Biodegredation: Using bio-engineered organisms to bread down substances like waste products and sewage. Bioremediation: Using bio-engineered organisms to return contaminated ecosystems to their natural state. Biological Weapons: Using bio-engineered organisms to create novel biological weapons. Molecular Biomimetics: Using the genes and molecular structures of existing organisms to engineer novel biological machines, drugs, etc. Bioleaching: Using bio-engineered organisms to increase mining production and the extraction of metals from ores. Industrial Biotechnology: Using bio-engineered organisms to produce useful chemicals for industry. Agricultural Biotechnology: Manipulating crop genes to improve yields, increase environmental and pest resistance, and increase nutritional quality and taste. Pharmacogenomics: Using biotechnology to better understand the influence of genetic variation on drug response.

106
RESEARCH STUDY II
Graduate Teaching Assistants and the Risks and Benefits of Biotechnology:
Practice and Perspectives
107
Introduction
Promoting and nurturing the development of scientific literacy in students from
kindergarten to postsecondary institutions is a primary objective of science education
(Laugksch, 2000). This includes having students learn a matrix of knowledge about the
physical world that is needed to make well-informed decisions within a society increasingly
permeated with science issues (Trefil, 2008). To be scientific literate one needs an
understanding of the practice of science and its reciprocal interactions with society (AAAS,
1993). This intersection of science and society has defined a body of educational curricula
known as science-technology-society (STS) education (Aikenhead, 1992).
Much of the education research into instructors’ views of STS topics has focused on
K-12 pre-service and in-service science teachers. However, within the universal objective of
science literacy for all students, a focus on the intersection of science, technology, and
society is equally important in postsecondary education. Institutions of higher education have
begun to adopt STS objectives that have traditionally been found at the pre-college level
(Leslie, 1999). However, little is known of the views and beliefs of postsecondary educators
(professors or teaching assistants) about science-technology-society based education
(BouJaoude, 1996). This study examines the views of biology graduate teaching assistants
(GTAs) on the intersection of science and technology in the context of a lesson on
controversy surrounding the risks and benefits of biotechnology applications.
Understanding the interdependence of science and technology with society is crucial
in preparing students to function in a highly industrialized society (Trefil, 2008). Yet many
members of the general public possess only limited knowledge and skills to function in this
108
society, even as the rapid emergence of innovative science and technology increasingly
impacts their daily lives (Ogawa, 1998). One of the primary objectives of science education
is to develop informed citizens that can participate in the democratic discourse and decision
making surrounding science and technology through critical evaluation of socially relevant
issues (Yalvac, Tekkaya, Cakiroglu, & Kahyaoglu, 2007).
A promising avenue to providing an understanding of the interactions of science and
technology to society is educating teachers, who are tasked with implementing this form of
instruction. Teachers need to have appropriate scientific and technological literacy as well as
an understanding of the views and goals of social themes related themes related to science
and technology. Understanding views related to STS issues is especially important for young
teaching assistants because they will be the instructors who will pioneer science education
within the coming years (Yalvac et al., 2007).
GTAs and STS
Science instructors in the K-12 arena often feel that a contextualized science
education experience is of the utmost importance for promoting social responsibility
(Pedretti, 2003; Sadler, Amirshokoohi, Kazempour, & Allspaw, 2006). However, they do not
frequently integrate STS topics into their curriculum because these topics often are perceived
of as too controversial to teach, are time consuming, or require additional resources (Cross &
Price, 1996; McGinnis & Simmons, 1998). In fact, despite its perceived importance, socially
relevant science topics are often met with aggressive resistance (Pedretti, 2003).
109
The present study focuses particularly graduate teaching assistants. These novice
teachers have gained increasing responsibility for instruction in postsecondary education over
the past decades (Luo, Bellow, & Grady, 2000). As an example, Sundberg, Armstrong and
Wichusen (2005) found that over 91% of biology labs in a sample of thirty-four college and
universities were taught solely by GTAs. In general, GTAs increasingly are responsible for
lecturing, conducting review sessions, advising students, designing and grading assessments,
and facilitating discussions (Jacobs, 2002; Peterson, 1990). In addition, science has more
teaching assistants delivering content than most other educational domains and should
therefore view this educator group as particularly significant to undergraduate education
(National Center for Educational Statistics, 2000).
If pre-service science teachers are the pioneers for social responsibility in the K-12
setting, then GTAs likely are their equivalent in postsecondary education. Both groups are
receiving instruction for their future careers as educators. However, whereas pre-service
teachers are receiving explicit pedagogical content knowledge in the current trends in science
education, teaching assistants rarely get such professional development (Gardner & Jones,
2009). And yet, GTAs are responsible for a large portion of the education of future scientists
in their later years as professors. Despite this, much of their pedagogical training is a result of
personal experience with education, with little support to back up the efficacy of their
methods (Volkmann, Abell, & Zgagacz, 2005).
Little is known about science GTA’s beliefs concerning the teaching and learning of
science. Studies that do exist show that GTAs often hold traditional conceptions of pedagogy
where knowledge can be transferred and student learning of large volumes of content
110
knowledge is more important than science process skills (Luft, Kurdziel, Roehrig, & Turner,
2004). In addition, most GTAs seem to feel that learning to teach well is a result of high
levels of science content knowledge, practice, and experience, and has little to do with
obtaining any pedagogical content knowledge (Luft, et al., 2004; Volkmann, et al., 2005).
For most, learning to teach involves a trial and error approach that often is reinforced by
previous experience and not supported by professional training or research in effective
practice (Gardner & Jones, 2009). However, there is a dearth of research that examines
science GTA’s views on issues in science, technology, and society contexts specifically. One
recent study suggests that GTAs may benefit from professional development that focuses on
pedagogy (Addey & Blanchard, in press).
In light of the limited of research on science GTA’s beliefs about science pedagogy,
this study examined the views of GTAs about socially relevant science issues using the topic
of the potential risks and benefits of biotechnology. The reason for choosing the topic of
potential risks and benefits of biotechnology was that these discourses have been shown to be
important social concerns for many students in previous studies (Aikenhead, 1987; Ryan,
1987). Risk as an important topic in science education is also supported by science
curriculum design and education reform documents (AAAS, 1993; Zint, 2001). The objective
of the study was to further the discourse on the role of STS instruction in postsecondary
education and to better understand views of GTAs regarding socially relevant science
instruction in the context of risks and benefits.
111
Methods
Context and Participants
This study involved six GTAs who were instructors in an introductory biology
laboratory at a large southeastern university. Topics covered in the course included ecology,
evolution, and biodiversity. The official description of the course from the university course
catalogue is below.
Emphasis on interactions of organisms with their environments, evolutionary change
and role of natural selection in the evolution of life forms, biological diversity in the
context of form and function of organisms, and on critical thinking, problem solving,
and effective communication.
The six participants represented 23% of the GTAs employed to teach biology
laboratory sections at the time of the study. All participants were volunteers from a general
request sent out to the teaching assistant email contact list and given pseudonyms for the
purpose of anonymity (Table 4.1). The participant sample consisted of three males and three
females all in their mid to late twenties. All participants were in the process of obtaining an
advanced degree in biology or a related field. The mean number of years of teaching
experience for the total population of GTAs was 1.62 years (SD = 1.66).
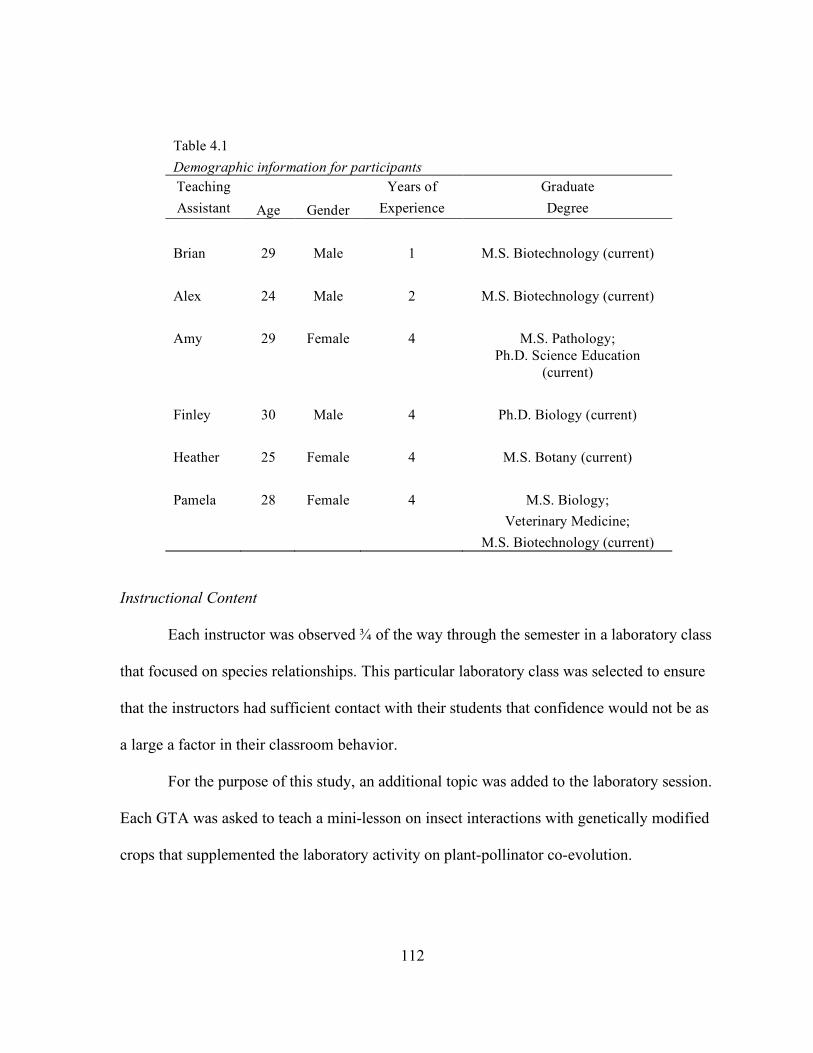
112
Table 4.1 Demographic information for participants Teaching Years of Graduate Assistant Age Gender Experience Degree
Brian 29 Male 1 M.S. Biotechnology (current) Alex 24 Male 2 M.S. Biotechnology (current) Amy 29 Female 4 M.S. Pathology;
Ph.D. Science Education
(current) Finley 30 Male 4 Ph.D. Biology (current) Heather 25 Female 4 M.S. Botany (current) Pamela 28 Female 4 M.S. Biology; Veterinary Medicine; M.S. Biotechnology (current)
Instructional Content
Each instructor was observed ¾ of the way through the semester in a laboratory class
that focused on species relationships. This particular laboratory class was selected to ensure
that the instructors had sufficient contact with their students that confidence would not be as
a large a factor in their classroom behavior.
For the purpose of this study, an additional topic was added to the laboratory session.
Each GTA was asked to teach a mini-lesson on insect interactions with genetically modified
crops that supplemented the laboratory activity on plant-pollinator co-evolution.
113
Each participant was given a packet one week prior to their laboratory session that
contained: a) paper and digital copies of a Power-point presentation outline template that
included basic information about genetically modified crops (Appendix A), and b) one of
three primary scientific articles on genetically modified crops and their potential impacts on
insect pollinators (Conner, Glare, & Nap, 2003; Losey, Raynor, & Carter, 1999; Morandin,
2008; Niiler, 1999). Participants were asked to teach the lesson for approximately fifteen
minutes in any manner that they felt appropriate. They also were informed that the Power-
point outline was merely a set of guiding topics for the lecture and they were encouraged to
alter the presentation media and mode of delivery to their preferences.
The science articles were provided for two reasons. They provided background
information on the topic of biotechnology and the material provided case examples that the
participants could use if they so chose. Participants were told they were not required to read
or utilize this information.
Data Collection
There were two sources of data. First, each instructor was observed and the lesson
was video-recorded. Each GTA also participated in a semi-structured interview (Appendix B)
that was held immediately upon completion of the laboratory lesson and was audio-recorded
and transcribed. Interviews consisted of questions regarding the design of their lesson and
beliefs about the teaching and learning of STS themes in the context of the risks and benefits
of biotechnology.
114
Data Analysis
Both data sources were analyzed within a naturalistic paradigm that allows themes
and conclusions to emerge from contextualized situations (Lincoln & Guba, 1985). The
primary approach was inductive, with the issues of concern being those that recurred with
high frequency and were clustered thematically (Cresswell, 1998). Both teaching
observations and interviews were transcribed and analyzed qualitatively.
For the teaching observations, two aspects of the lesson were the foci of analyses.
First, each GTA’s lesson presentation was compared and contrasted to the original lesson
template in order to determine what was added and what was removed. Second, GTA’s
method of presentation and choice of language were examined to document this instruction
in relation to the risks and benefits of biotechnology. Comprehensively, teaching assistant
choices of template modification, presentation format, and language comprised the
instructional frame from which they chose to teach about the risks and benefits of
biotechnology.
Interviews were examined in multiple qualitative iterations. In the first round of
analysis, transcripts were read and textual passages indicating emergent themes were coded
and collected in a database. These themes were then re-read in order to determine any
thematic overlap that followed. Codes were then reduced to a parsimonious set cluster of
qualitative themes that were used to discuss the richness of GTA’s views of the risks and
benefits of biotechnology in the context of STS educational objectives.
115
The results of the current study are not intended to be generalizable, due to the small
sample size, but do offer an in-depth glimpse at particular cases to further open the door to
research on this population of science educators.
Results
The following section describes the results from the teaching observations as well as
the semi-structured interviews. Data from the teaching observations were compared and
contrasted for each individual GTA in order to understand instructors’ pedagogical stances
on the risks posed by biotechnology. Results for the interviews are categorized by emergent
responses to STS curriculum that included themes such as definitions of science and
technology, the reciprocal interactions of science with society, the internal characteristics of
science, and the epistemology of science.
Instructional Frames
Teaching observations revealed that the GTAs utilized one of three instructional
frames when presenting information about the risks and benefits of biotechnology.
Instructional frames were profiles that emerged during the observations in how GTAs chose
to approach communication and teaching of this controversial issue. These frames included
risk/benefit analysis (such as a balancing the relative importance of risks and benefits),
perspectives and biases (such as views of risk presented by the media), and individual
reflection (such as how one personally negotiates risk decisions) (Table 4.2).
Brian and Finley selected a conservative approach to communicating the potential
controversy surrounding the risks and benefits of biotechnology. Their analytic point of view
116
emerged in their focus on facts, which they communicated in a teacher-centered lecture
format. Finley did not modify the original lesson template at all and Brian’s modifications
included the addition of figures and graphs indicating the process and prevalence of
biotechnology in today’s society. Although they acknowledged that controversy over the use
of biotechnology exists, much of their language indicated that “practical benefits”
outweighed any risks. In fact, Finley commented that in some locations, the negative
response to biotechnology is due to, “cultural taboos with people not wanting to mess with
genetic material.”
Pamela and Heather were less conservative in integrating the social controversy
surrounding risks and benefits into their lesson. This was demonstrated by the frequent
discussion questions they added to the lesson template and posed to their students throughout
the discussion. Their instructional frame stemmed from their desire for their students to
understand that social controversies over science and technology issues often stem from
multiple perspectives and biases of different individuals and groups. This was reflected in
their teaching styles in which they asked for individual opinions from their students and
validated students’ perspectives with statements such as, “I don’t want you to get nervous
about this because these things aren’t proven. There are individual concerns however
(Heather).” These two GTAs also noted that there might be biases that arise in media
presentations of the controversy as well as online information from public interest groups.
The focus of the lesson for Alex and Amy was one of personal reflection. To these
instructors, students’ opinions about the controversy were most important and practice in
negotiating issues was central. Both instructors held student-centered activities during their
117
lessons in which they encouraged students to discuss differing perspectives of the
controversy regarding the risks and benefits of biotechnology. In Amy’s class, she assigned
half of the class to a pro-biotechnology stance and the other half to an anti-biotechnology
stance and then challenged them to come up with valid arguments either for or against. She
then collected these arguments on the board to encourage an open debate. The other teacher,
Alex brought in an article from a recent edition of the New York Times in which there was a
discussion about regulating genetically modified organisms. He read portions of the article
and then challenged his students to support or deny the potential regulatory legislation.
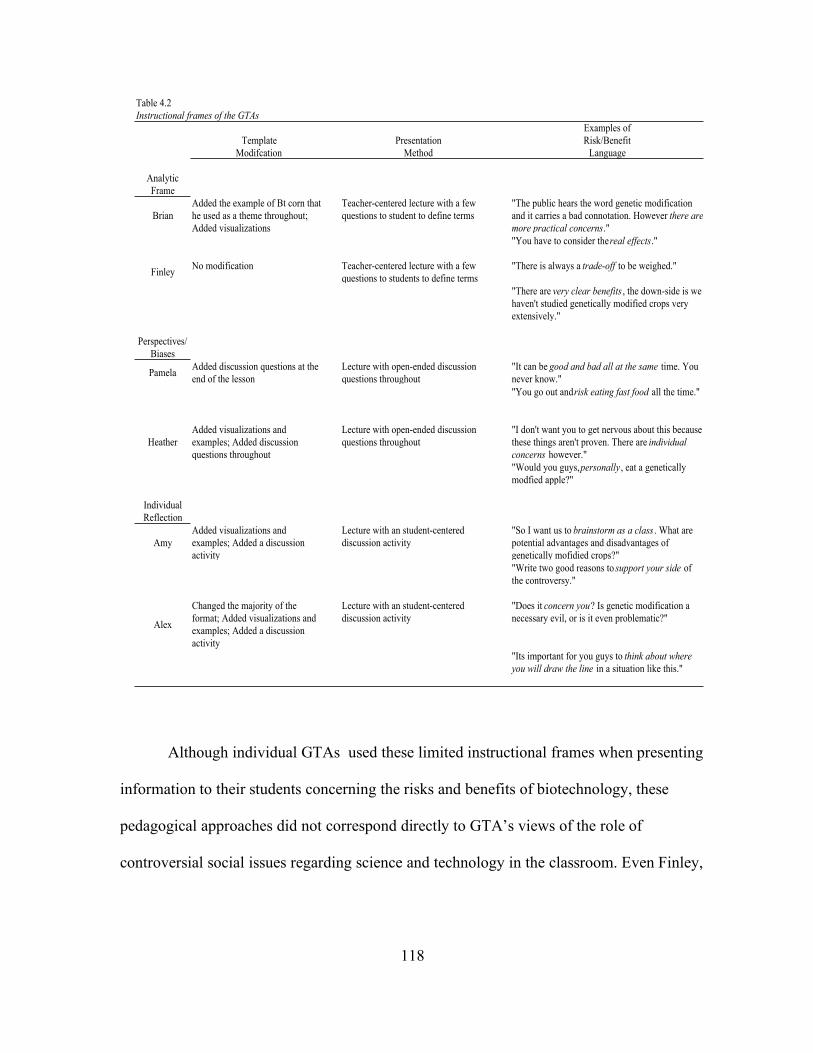
118
Table 4.2
Instructional frames of the GTAs
Examples of
Template Presentation Risk/Benefit
Modifcation Method Language
Analytic
Frame
Brian
Added the example of Bt corn that
he used as a theme throughout;
Added visualizations
Teacher-centered lecture with a few
questions to student to define terms
"The public hears the word genetic modification
and it carries a bad connotation. However there are
more practical concerns."
"You have to consider the real effects."
FinleyNo modification Teacher-centered lecture with a few
questions to students to define terms
"There is always a trade-off to be weighed."
"There are very clear benefits , the down-side is we
haven't studied genetically modified crops very
extensively."
Perspectives/
Biases
PamelaAdded discussion questions at the
end of the lesson
Lecture with open-ended discussion
questions throughout
"It can be good and bad all at the same time. You
never know."
"You go out and risk eating fast food all the time."
Heather
Added visualizations and
examples; Added discussion
questions throughout
Lecture with open-ended discussion
questions throughout
"I don't want you to get nervous about this because
these things aren't proven. There are individual
concerns however."
"Would you guys, personally , eat a genetically
modfied apple?"
Individual
Reflection
Amy
Added visualizations and
examples; Added a discussion
activity
Lecture with an student-centered
discussion activity
"So I want us to brainstorm as a class . What are
potential advantages and disadvantages of
genetically mofidied crops?"
"Write two good reasons to support your side of
the controversy."
Alex
Changed the majority of the
format; Added visualizations and
examples; Added a discussion
activity
Lecture with an student-centered
discussion activity
"Does it concern you? Is genetic modification a
necessary evil, or is it even problematic?"
"Its important for you guys to think about where
you will draw the line in a situation like this."
Although individual GTAs used these limited instructional frames when presenting
information to their students concerning the risks and benefits of biotechnology, these
pedagogical approaches did not correspond directly to GTA’s views of the role of
controversial social issues regarding science and technology in the classroom. Even Finley,
119
who presented probably the most conservative discussion of risk controversies in his lesson
offered a rich description of the role of risk discourses in science and technology and the
importance for science instruction to promote such issues. The disconnect between the
instructional frames exhibited in the teaching assistants practice is discussed further, below,
following an analysis of the important themes that arose during the interviews.
Interview Themes
Basic Definitions: “A Personal Set of Rules”. When asked about what aspects of
science were critical for student understanding of the risks and benefits of biotechnology,
Brian mentioned that students needed to have a grasp of the dynamic nature of science and
technology:
What you learn today, some of that may be obsolete even five or ten years from now.
A lot of it is just a snap-shot with what’s going on right now [in biotechnology
research]. So, it’s up to us [teachers] to keep them informed of emerging technology
in general and also to apply it to what and why this is important.
Other GTAs also expressed concerns about students possessing a concrete understanding of
definitions of science (in general) or biotechnology (specifically). However, every teaching
assistant made an effort to explicitly yet briefly (many admitted this was due to time
constraints) define biotechnology in their lessons.
When asked explicitly what students needed to know about biotechnology risks,
GTAs stated that they needed a mature conceptualization of what risk means in the context of
science and technology. Themes that arose in GTA definitions of risk included statements
that risks were just a quantitative weighing of costs and benefits and that regulators must
120
evaluate a threshold of what risks are deemed acceptable for society as a whole. Brian said
that technological risk is a weighing of the “greater [social] benefit” against the “sense of
severity and detriment to others.” Finley, Pamela, and Amy offered similar explicit
definitions of the role of weighing of costs and benefits in the context of biotechnology risks.
Brian, Finley, and Alex noted the importance of having students be able to set their
own personal threshold for whether a risk posed by a particular science applications was
acceptable or not. More specifically, Finley mentioned the concept of the precautionary
principle as an important concept for students to understand about risk where, “in the absence
of evidence to the contrary, it might be a good idea not to do something that might have
really bad consequences.” Precaution to the development of emergent science and technology
is a common response by the general public and it is often fed by fear and uncertainty
(Foster, Vecchia, & Repacholi, 2000).
Alex also mentioned that the threshold for risk is not set by regulators, but is
determined through a, “personal set of rules. You determine for yourself where you want to
draw a line on an issue.” This theme also was seen in many of the GTAs’ lessons, as well.
During instruction, Amy and Alex promoted the need for personal decision making by
allotting time for their students to have small-group discussions about the risks and benefits
of biotechnology. Pamela and Heather led their classes in discussions that involved the entire
group. Although they did not open the floor to either small- or large-group discussion, Brian
and Finley brought up issues of weighing the risks and benefits of biotechnology in a
discussion about Bt corn. This is a corn crop that is genetically-modified to be toxic to the
121
European corn-borer (a large agricultural pest). In his lecture, Brian engaged his students
with the following comments:
Look at the corn borer. If we remove it from that community, what impact does it
have on the ecosystem? Maybe it is an important food source for another organism.
You have to consider the [environmental] effects of what you’re doing. There are
also concerns about possible risks from potential unknown toxins or allergens that
might be introduced into food through the production of these crops. Should we be
worried about the effects on human populations? Do the benefits of these crops
outweigh the potential harm to the environment and people?
Despite the questions, Brian did not wait for responses from his students. All the teaching
assistants believed that no matter the science behind the risk, ultimately, personal evaluations
are required to determine the acceptance of biotechnology products.
Science and Society Interactions: “Permeating Many Layers of Society”. This theme
refers to GTAs’ acknowledgement of the roles that various societal groups such as
government agencies, industry, education, special interest groups, and the public have on
influencing the direction and development of science and technology. In the context of
biotechnology risk, this theme includes what GTAs thought students should know about how
perceptions of risk magnitude can shape the interactions between scientists and social groups.
Teaching assistants’ statements were categorized as relating to science and society
interactions such as how science and technology are embedded in society, how non-scientist
special interest groups can spread fear about science and technology, and how trust plays a
role in personal and public decision making about risk issues.
122
Brian exemplified many of the teaching assistants’ concerns about conveying the
socially embedded nature of science in a comment he made about his own teaching
objectives:
I try to connect to everyday life experiences and real-world applications. I want to
drive home the fact that it [biotechnology] is really affecting you. It isn’t just abstract
stuff we’re talking about. This is permeating through many layers of society.
All the teaching assistants noted the need for students to understand the social intersection of
science because, as Heather said, “they will go out in the world and read things, newspapers
and stuff and they [the newspapers] talk about GMOs [genetically modified organisms] and
what effects they might be having on people.” Even though it did not emerge in their
practice, the GTAs appeared to recognize the importance of teaching students specifically
about the social embeddedness of science.
Heather, Pamela and Finley mentioned their concerns that students be made aware of
the many special interest groups that are attempting to discredit the development of
biotechnology through the language of fear. Heather said, “I would want them [students] to
understand that there’s a lot of people out there who are really blasting GMOs, and they’re
really not scientists. All you hear is the scary stuff people are hypothesizing about.” When
probed about such topics as risk perception and public decision making, these three teaching
assistants felt that it was especially important to understand the distinction between evidence-
based arguments and fear-stimulating opinions. Pamela said, “I want them to be able to
realize that some literature is someone’s opinion and some literature is actual fact.” Finley
returned a similar educational goal when he said, “people need to understand the distinction
123
between simply having an opinion and having an opinion that is well-informed and based on
accumulated knowledge.”
All of the teaching assistants were concerned not only with how students would
access and interpret information, but also wanted students to understand that many social
concerns come into play when making decisions about the acceptability of the risks and
benefits regarding biotechnology. Heather noted that it was important for students to
understand both the scientific and social perspectives of any decision. “They need to be able
to objectively look at both sides be able to make decisions for themselves.” Alex, when asked
what he felt students should learn about decision making on issues or risk, mentioned that it
often requires trust in the governing institutions:
How do I think people should make decisions about risk? It’s a mental process for
me. I’m going to look at information and then I’m going to make a personal
judgment on it, and then I’ll re-judge. In the end, I just have faith in the people we
put in line to make those decisions to know what they’re doing, well, maybe not the
politicians up on Capitol Hill, but hopefully their science advisors.
Alex highlighted the fact that trust in governing officials requires an individual with content
knowledge about the topic under discussion. He implored his students to make this
distinction, as well.
Characteristics of Science and Scientists: “Real science-speak”. Within this study,
teaching assistants discussed three themes that fall under the category of characteristics of
science and scientists that they hoped to convey to their students. The first was debunking
student misconceptions of scientists. The second was helping students better understand how
124
scientists think and speak. Finally, teaching assistants wanted students to understand that
scientists debate issues but ultimately come to a consensus for the purpose of moving the
enterprise of science forward.
When asked about what they felt students should know about science and scientists,
Pamela, Finley, and Heather all mentioned misconceptions students hold about scientists and
that these needed to be corrected. The biggest of these misconceptions had to do with the
motivations of scientists in their work. Heather wanted her students to know that scientists
are primarily motivated by the good of mankind and that they are not just, “putting
[genetically modified] plants out willy-nilly.” She asserted that there is a greater social
reason for why scientists choose to follow the research path that they do. Finley reinforced
this notion with the comment that scientists are, “not just sitting around with idle hands,
thinking of ways to complicate matters and ways to screw things up in strange fashions.”
Such concepts were reinforced in student lessons where GTAs spent more time discussing
the benefits (as opposed to risks) of many of the applications that they chose as case studies.
The second concept mentioned by the GTAs was that scientists had their own internal
“science-speak” and ways of approaching problems when thinking about the risks and
benefits of developing biotechnology applications. Heather said that her students should be
able to look at and identify what is “real science speak.” For Amy, students’ understandings
of science thinking were more important for her students than pure content. She said, “I don’t
care if you memorize what a mitochondria is. It’s how can I think about the process of
science and apply it to daily life.” GTAs felt that it was very important for students to
understand that scientists have their own method of communication with prescribed rules.
125
When prompted about the uncertainty associated with the risks of many emergent
technologies, several of the teaching assistants referred to the fact that science is a
community that has debate, but builds consensus through this debate. Brian it put most
explicitly:
A lot of science involves consensus building. It is not just one lone-wolf scientist out
there just going it alone. Hopefully, that is the idea behind scientists coming together
at symposiums and conferences to build a consensus about an idea.
Heather also noted that the more socially controversial the theme, as was seen with
biotechnology, the more likely scientists are going to have differing views and have to come
to some sort of consensus. Finley also had a good interpretation of the need for the scientific
process leading to a consensus.
The way we [scientists] try to approach things is to make clear and testable
predictions, examine data that tests those predictions, and then refine our ideas based
on whether data was consistent with our prior hypothesis and can hold up to others
scientists’ scrutiny.
Promoting an appreciation for who scientists are, what they do, and how they think was very
evident in the GTAs’ lessons as well, when discussing why biotechnology is controversial.
Science Epistemology: Use your Common Sense. GTAs concentrated on the ideas of
scientific knowledge as tentative, emperical, and often uncertain. There was evidence that
understandings of scientific knowledge were correlated with understandings of the risks of
biotechnology. All of the teaching assistants made comments about various aspects of
scientific thought that they expect their students to understand. One of the most unique
126
perspectives on how scientific thinking proceeds came from Pamela. She pointed out that for
all the information and all the rigorous methods that scientists have, their knowledge remains
tentative and uncertain at times. Because of this, she hoped her students would grasp this idea
of tentativeness, and like scientists, learn to make decisions based on “common sense.”
Each of the rest of the teaching assistants took a unique slant on what the nature of
science meant for them and what their students should know about this concept. For example,
Finley stated a more traditional conceptualization that his students should have an,
“appreciation for the scientific method.” He felt that if students understood the process of
how science generates information, students could appreciate science perspectives. Brian
thought it was especially important for students to be able to view and interpret data in the
context of biotechnology. His argument was that if students could, “get information, then
they could make a conclusion.”
This study was limited by the small number of participants that constrains its
generalizability. Good STS instruction typically requires more time and effort than other
teaching methods and the limitations of time within the context of this study might have
stifled some otherwise emergent instructional practice or emergent reflection. Although
several of the teaching assistants took time for student discussion and debate, the richness of
the experience was limited by the time available for instruction.
Discussion
The data reveal that there is a disconnect between what teaching assistants claim that
it is important for students to know about the risks and benefits of biotechnology and how
127
this emerged in their pedagogical practice. As scientists themselves, all the instructors
revealed in the interviews that there were several aspects of the social intersections of science
and technology (such as basic definitions, reciprocal interactions between science and
society, characteristics of scientists, and the epistemology of science) that they felt were
critically important for students to know in depth. In addition, it was clear that the discourse
on risks and benefits is tangled up in their beliefs about science and society issues, but this
doesn’t emerge in their teaching.
When teaching students, the participants constrained themselves and their teaching
within a particular instructional frame even though they were given interpretive freedom. The
more conservative instructors mentioned the controversy surrounding genetically modified
foods, but presented data with little discussion how students might use these facts. On the
other hand, several of the teaching assistants opened opportunities for students to pose
questions and think about this controversy, actively participate in an activity to practice the
weighing of these social concerns. This raises the question of why GTA perspectives on the
importance of certain social issues are not reflected in their practice?
The answer to this question might mirror the results found in previous studies with
pre-service science teachers. Like pre-service science teachers in past studies on science
education, the GTAs in this study insisted that there was great value and importance in
informing undergraduate students about the social concerns in science but this did not
emerge in their practice. In a case study of pre-service teachers in Canada, Pedretti, Bencze,
Hewitt, Romkey, and Jivraj (2008) examined this paradox. They found five challenges that
pre-service teachers faced in implementing STS topics in the classroom: a) they require
128
teachers to relinquish classroom control and promote student autonomy which is traditionally
difficult for beginning teachers, b) they feel like outsiders in a community that promotes a
focus on de-contextualized science content, c) they have limitations both in time and in their
own personal knowledge of STS, d) they question how active a role they should play in
engaging students in social action, and e) they have concerns about interjecting their own
biases into the lesson.
Several of the above issues mentioned in the Pedretti et al. (2008) study seems to
apply to the graduate teaching assistants in the present study. As novice instructors they are
likely to have concerns with control and autonomy, time and knowledge limitations, curbing
their own personal biases, and concern for their role in promoting social activism in the
classroom. In an era of standards and pacing guides, it is likely that pre-service teachers may
find more limitations on teaching about risks and benefits than GTAs. However, the freedom
of graduate teaching assistants in the classroom can be highly variable depending on the
supervisor’s role, rigidity of the taught curriculum, and the academic culture. Further
research is needed to compare and contrast these concerns of pre-service teachers with
graduate teaching assistants.
More research also is needed in understanding how GTAs make the pedagogical
choices that they do. Aspects such as cultural background, worldview, experiences with
teaching, experiences with the content, and beliefs likely play out in their instructional
framing of controversial STS issues. Additionally, teaching assistants in this study had high
content knowledge, but limited pedagogical content knowledge. How might the educational
differences in GTAs and pre-service teachers affect pedagogical choices? It is also unknown
129
how instructional frames (like those used in this study) might influence student perceptions
and positions on these controversial issues.
This study is only the first step in a series of questions that need to be addressed
regarding graduate teaching assistants’ attitudes, understanding, and pedagogical practices in
the context of controversial science and technology issues in general, and the classroom
discourses related to risk, specifically. What is clear is that science graduate teaching
assistants are a population of science instructors that have a large proportion of responsibility
for training future scientists and non-scientists about the social intersections of science and
technology. Yet, their pedagogical training often is limited and they are forced to learn
through experience or by basing their decisions on their own education, much of which is not
up to current education standards. This creates a cycle for which under-developed teaching
practices are reproduced from generation to generation the academy is preparing future
citizens.
Socially controversial issues in science are likely to become more prevalent as
emergent technologies like information technology, robotics, nanotechnology, and
biotechnology continue to ingrain themselves more deeply into our cultural milieu. The pace
of future research and development will be checked by consumer acceptance or resistance
based on perceived risk, as well as scientists’ abilities to properly evaluate the potential risks
of such technologies being introduced into mainstream science. With the risk discourse
playing such a large role in the progress of emergent technologies, a more concrete
understanding of the evolution and development of individual’s perceptions of risk from their
formal science education will impact policy and public decision making in the future.
130
References
American Association for the Advancement of Science (AAAS). (1993). Benchmarks for
science literacy. New York, NY: Oxford University Press.
Aikenhead, G. S. (1987). High school graduates beliefs about science-technology-society III:
Characteristics and limitations of scientific knowledge. Science Education, 71, 459-
487.
BouJaoude, S. (1996, April). Epistemology and sociology of science according to Lebanese
educators and students. Paper presented at the annual meeting of the National
Association for Research in Science Teaching, St. Louis, MO.
Conner, A. J., Glare, T. R., & Nap, J.-P. (2003). The release of genetically modified crops
into the environment. Part II. Overview of ecological risk assessment. The Plant
Journal, 33, 19-46.
Cresswell, J. W. (1998). Qualitative inquiry and research design: Choosing among five
traditions. Thousand Oaks, CA: Sage.
Cross, R. T., & Price, R. F. (1996). Science teachers’ social conscience and the role of
controversial issues in the teaching of science. Journal of Research in Science
Teaching, 33, 319-333.
Foster, K. R., Vecchia, P., & Repacholi, M. H. (2000). Science and the precautionary
principle. Science, 288, 979-980.
Gardner, G. E., & Jones, M. G. (2009). Graduate teaching assistant preparation: Challenges
and implications for college science teaching. Manuscript in review.
131
Jacobs, W. (2002). Using lower-division developmental education students as teaching
assistants. Research and Teaching in Developmental Education, 19, 41-48.
Laugksch, R. C. (2000). Scientific literacy: A conceptual view. Science Education, 84, 71-94.
Leslie, S. W. (1999). Reestablishing a conversation in STS: Who’s talking? Who’s listening?
Who cares? Bulletin of Science, Technology, & Society, 19, 271-280.
Lincoln, Y. S. & Guba, E. G. (1985). Naturalistic inquiry. Newbury Park, CA: Sage
Publications.
Losey, J. E., Rayor, L. S., & Carter, M. E. (1999). Transgenic pollen harms monarch larvae.
Nature, 399, 214.
Luft, J. A., Kurdziel, J. P., Roehrig, G. H., & Turner, J. (2004). Growing a garden without
water: Graduate teaching assistants in introductory science laboratories at a
doctoral/research university. Journal of Research in Science Teaching, 41, 211-233.
Luo, J., Bellow, L., & Grady, M. (2000). Classroom management issues for teaching
assistants. Research in Higher Education, 41, 353-383.
McGinnis, J. R., & Simmons, P. (1998). Teachers’ perspectives of teaching science-
technology-society in local cultures: A sociocultural analysis. Science Education, 83,
179-211.
Morandin, L. A. (2008). Effects of bees and pollination. In R. R. James & T. L. Pitts-Singer
(Eds.), Bee Pollination in Agricultural Ecosystems (pp. 203-218). Oxford, England:
Oxford University Press.
National Center for Educational Statistics. (2000). National postsecondary student aid study,
1999-2000. Washington, DC: National Center for Educational Statistics.
132
Niiler, E. (1999). GM corn poses little threat to monarch. Nature Biotechnology, 17, 1154.
Ogawa, M. (1998). Under the noble flag of developing scientific and technological literacy.
Studies in Science Education, 31, 102-111.
Pedretti, E. (2003). Teaching science, technology, society, and environment (STSE)
education: Preservice teachers’ philosophical and pedagogical landscapes. In D.
Zeidler (Ed.), The role of moral reasoning and socioscientific discourse in science
education. (pp. 219-239). Dortrecht, The Netherlands: Kluwer.
Pedretti, E. G., Bencze, L., Hewitt, J., Romkey, L., & Jivraj, A. (2008). Promoting issues-
based STSE perspectives in science teacher education: Problems of identity and
ideology. Science & Education, 17, 941-960.
Peterson, E. (1990). Helping TAs teach holistically. Anthropology and Education Quarterly,
21, 179-185.
Ryan, A. G. (1987). High school graduates beliefs about science-technology-society IV: The
characteristics of scientists. Science Education, 71, 489-510.
Sadler, T. D., Amirshokoohi, A., Kazempour, M., & Allspaw, K. M. (2006). Socioscience
and ethics in science classrooms: Teacher perspectives and strategies. Journal of
Research in Science Teaching, 43, 353-376.
Sundberg, M. D., Armstrong, J. E., & Wichusen, E. W. (2005). A reappraisal of the status of
introductory biology laboratory education in U.S. colleges and universities. The
American Biology Teacher, 67, 526-529.
Trefil, J. (2008). Why Science? Arlington, VA: NSTA Press.
133
Volkmann, M. J., Abell, S. K., & Zgagacz, M. (2005). The challenges to teaching physics to
preservice elementary teachers: Orientations of the professor, teaching assistant, and
students. Science Education, 89, 847-869.
Yalvac, B., Tekkaya, C., Cakiroglu, J., & Kahyaoglu, E. (2007). Turkish pre-service science
teachers’ views on science-technology-society issues. International Journal of
Science Education, 29, 331-348.
Zint, M. T. (2001). Advancing environmental risk education. Risk Analysis, 21, 417-426.

134
APPENDICES
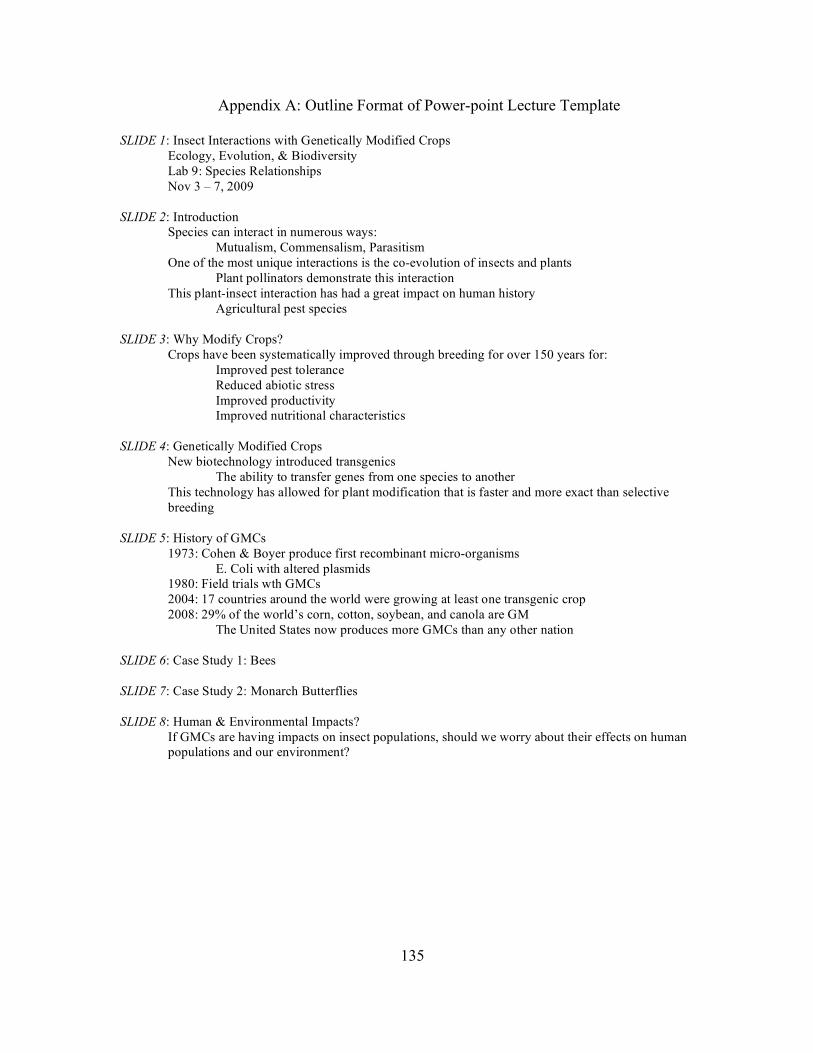
135
Appendix A: Outline Format of Power-point Lecture Template
SLIDE 1: Insect Interactions with Genetically Modified Crops Ecology, Evolution, & Biodiversity Lab 9: Species Relationships Nov 3 – 7, 2009 SLIDE 2: Introduction Species can interact in numerous ways: Mutualism, Commensalism, Parasitism One of the most unique interactions is the co-evolution of insects and plants Plant pollinators demonstrate this interaction This plant-insect interaction has had a great impact on human history Agricultural pest species SLIDE 3: Why Modify Crops?
Crops have been systematically improved through breeding for over 150 years for: Improved pest tolerance Reduced abiotic stress Improved productivity Improved nutritional characteristics SLIDE 4: Genetically Modified Crops New biotechnology introduced transgenics The ability to transfer genes from one species to another
This technology has allowed for plant modification that is faster and more exact than selective breeding
SLIDE 5: History of GMCs 1973: Cohen & Boyer produce first recombinant micro-organisms E. Coli with altered plasmids 1980: Field trials wth GMCs 2004: 17 countries around the world were growing at least one transgenic crop 2008: 29% of the world’s corn, cotton, soybean, and canola are GM The United States now produces more GMCs than any other nation SLIDE 6: Case Study 1: Bees SLIDE 7: Case Study 2: Monarch Butterflies SLIDE 8: Human & Environmental Impacts?
If GMCs are having impacts on insect populations, should we worry about their effects on human populations and our environment?
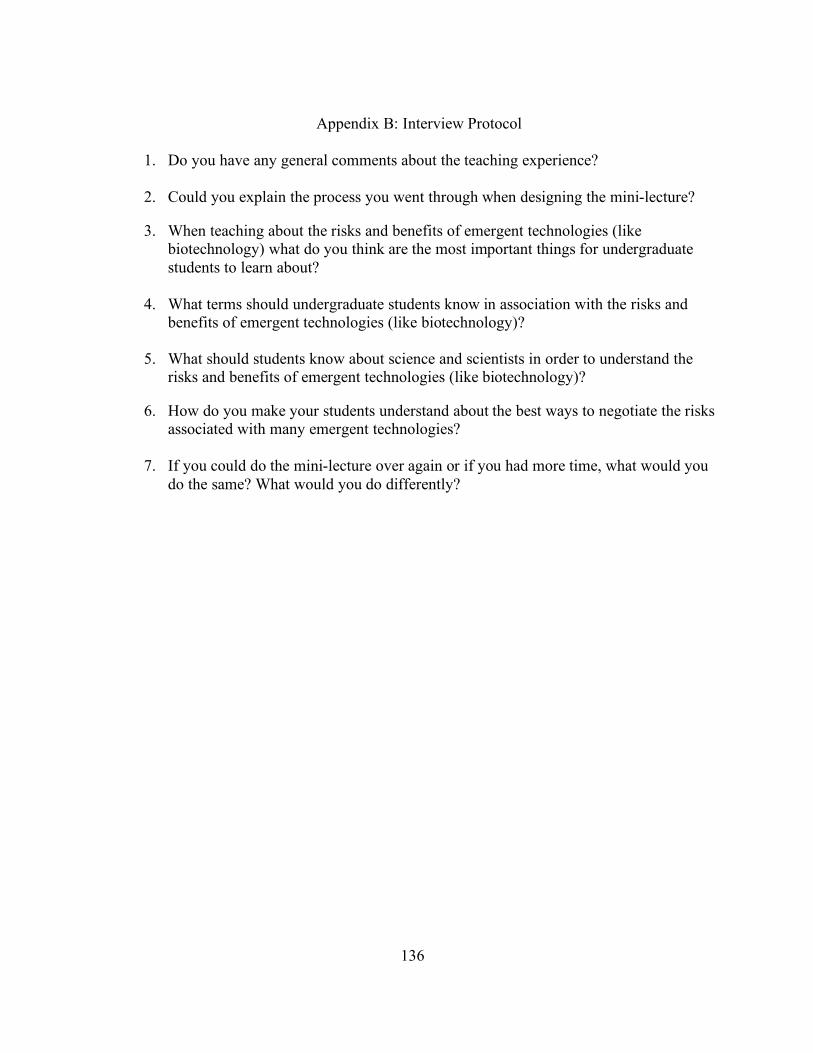
136
Appendix B: Interview Protocol
1. Do you have any general comments about the teaching experience?
2. Could you explain the process you went through when designing the mini-lecture?
3. When teaching about the risks and benefits of emergent technologies (like
biotechnology) what do you think are the most important things for undergraduate students to learn about?
4. What terms should undergraduate students know in association with the risks and
benefits of emergent technologies (like biotechnology)?
5. What should students know about science and scientists in order to understand the risks and benefits of emergent technologies (like biotechnology)?
6. How do you make your students understand about the best ways to negotiate the risks
associated with many emergent technologies?
7. If you could do the mini-lecture over again or if you had more time, what would you do the same? What would you do differently?