Embed Size (px)
Citation preview
Excerpts From:
MOTIVATING CRITICAL COMPUTER SYSTEMS OPERATORS:JOB CHARACTERISTICS, CONTROLS, AND RELATIONSHIPS
A THESIS SUBMITTED TO THE FACULTY OF THE GRADUATE SCHOOL
OF THE UNIVERSITY OF MINNESOTABY
DALE HARRISON MCKNIGHT
IN PARTIAL FULFILLMENT OF THE REQUIREMENTS FOR THE DEGREE OF
DOCTOR OF PHILOSOPHY
Chair: Gordon B. Davis Co-Advisors: Norman L. Chervany and Fred D. DavisCommittee Members: Frank Miller, Akbar Zaheer
December, 1997
Note -- These excerpts include:--The first in-depth examination of the Critical Information Systems Operator job--Incrementing the Job Characteristics Model with Relationships/Trust --Incrementing Management Contols theory with Relationships/Trust--New Grounded Theory validity methods--Demonstrations of thorough survey Construct Validity methods--Empirical results that explain what motivates critical systems operators--An explanation of the paradoxical results found for managerial controls

Copyright Dale Harrison McKnight 1997All Rights Reserved

MOTIVATING CRITICAL COMPUTER SYSTEMS OPERATORS:JOB CHARACTERISTICS, CONTROLS, AND RELATIONSHIPS
ABSTRACT
This study expands the explanatory power of two theories of motivation: the
Hackman and Oldham Job Characteristics Model (JCM) and the economics-based
Management Controls model (MCM). The JCM predicts worker motivation as a
function of the worker’s job characteristics (e.g., skill variety), while the MCM predicts
motivation as a function of managerial controls (e.g., incentives). These motivation
theories each omit an explicit account of the roles of: a) supervisor/subordinate
relationships, and b) workplace fairness perceptions, relying instead on how the job or its
incentives are structured. This study adds explanatory power to these theories through
two constructs: ‘Relationships’ (worker trust and liking towards the supervisor) and
‘System Trust’ (worker beliefs about the fairness structures of the workplace). The
target application of this research is the critical computer systems operator. ‘Critical’
means the extent to which business transactions are interrupted when these systems are
not available to their users.
This research was conducted in two phases at one site. Phase I explored factors
important to keeping critical computer systems available to users almost 100% of the
time. “Grounded theory” methods were used to analyze the semi-structured interviews.
In Phase II, a questionnaire was administered to eighty-six operators to test the extent to
which adding Relationships and System Trust to the JCM and MCM helped these models
predict operator motivation.
i
The study contributes to research in four ways. First, Relationships and System
Trust added predictive power to the JCM. Second, Relationships and System Trust
added predictive power to the MCM. Relationships and System Trust supplement
traditional views that job characteristics or management controls alone produce
motivated workers. Third, the study validates measures for two newly conceptualized
constructs: Relationships and System Trust. Fourth, it describes the highly motivating
nature of the critical computer systems operator job.
This study also contributes to practice. Two paradigms have dominated recent
corporate motivation practices: worker empowerment (based on the JCM) and incentive
pay (based on the MCM). This research suggests that these paradigms will yield
inadequate results unless worker/manager relationships and workplace fairness are also
considered.
ii
MOTIVATING CRITICAL COMPUTER SYSTEMS OPERATORS:
JOB CHARACTERISTICS, CONTROLS, AND RELATIONSHIPS
TABLE OF CONTENTS
PageAbstract ii
Chapter One: Introduction and Overview 1
Overview and Research Question 1
The Nature of the Critical Systems Operator Job 4
Advancing the Job Characteristics Model 6
Advancing the Management Controls Model 9
Summary and Contributions 12
Roadmap for the Study 13
Chapter Two: Methodology and Construct Validation 15
Approach of the Study 15Phase I Conceptual Model Building Methodology
20 Grounded Theory 20 Phase I Research Framework 22
Phase II Model Building and Testing Methodology 24
Measurable Constructs Used 25 Instrument Pretest 27 Instrument Pilot 31
Construct Validation Results 33
Hypothesis Testing Methodology 45
Research Site for the Study 49
iii
Chapter Three: Nature of the Critical Systems Operator Job 55
Theory Building 56 Nature and Importance of the Critical Computer System
56 Management Information Systems Literature 59 Management of Technology Literature 62 Conceptual Model Building 64 Hypotheses 66
Methodology Detail 76
Results of Hypothesis Testing 79Discussion of Results
84
iv
TABLE OF CONTENTS (continued)
Chapter Four: Job Characteristic Model--Adding Relationships 88
Theory Building 89 JCM Related Research 89 JCM Hypotheses 90 Relationships and System Trust Related Hypotheses
91Methodology Detail
96Results of Hypothesis Testing 96Discussion of Results
100
Chapter Five: Incentive Controls--Adding Relationships 103
Theory Building 104
Definitions 104 Controls Theory Overview 105 Conceptual Model Building-Incentives 107 Scientific Model Building-Incentives 110 Hypotheses-Incentives 119
Methodology Detail 123
Results of Hypothesis Testing 125Discussion of Results
127
Chapter Six: Other Controls--Adding Relationships 133
Theory Building 134
Conceptual Model Building-Accountability 134 Scientific Model Building-Accountability 135
v
Conceptual Model Building-Feedback 137 Scientific Model Building-Feedback 137 Conceptual Model Building-Micromanagement 140 Scientific Model Building- Micromanagement 141 Conceptual Model Building-Autonomy 142 Scientific Model Building- Autonomy 142 Scientific Model Building-Work Outcomes
143 System Trust’s Impact on Motivation 145
Methodology Detail 145
Results of Hypothesis Testing 146Discussion of Results
153
vi
TABLE OF CONTENTS (continued)
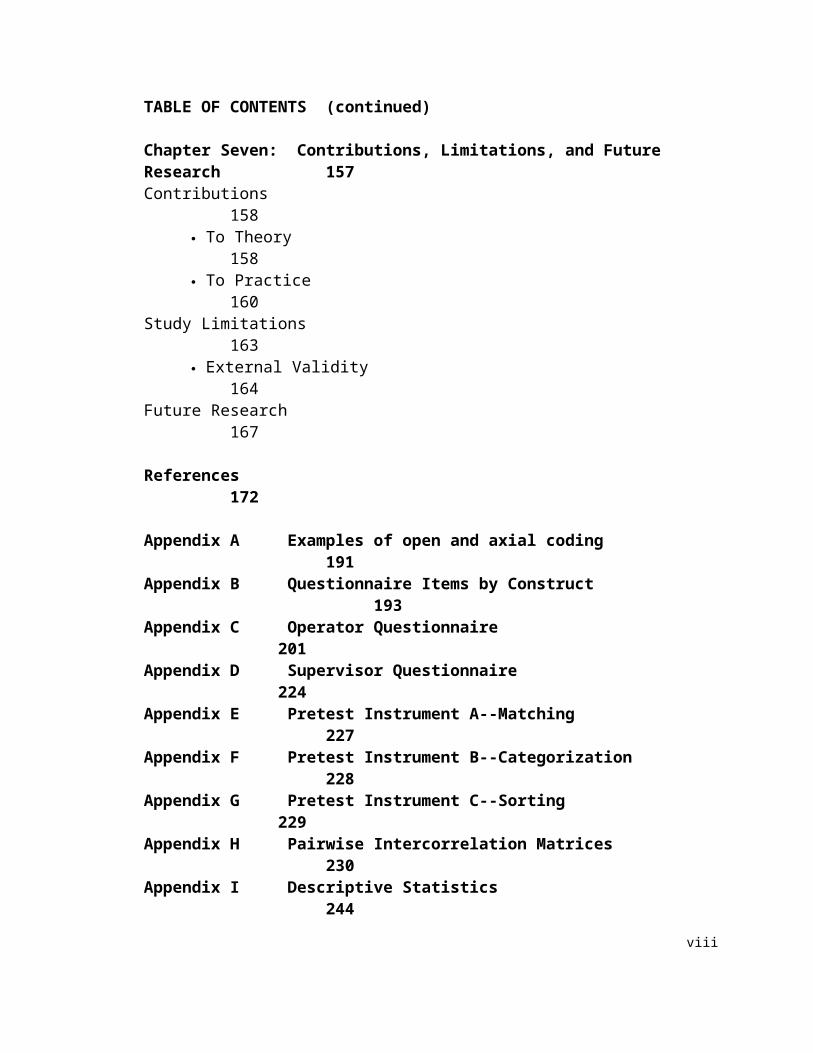
Chapter Seven: Contributions, Limitations, and Future Research 157Contributions
158 To Theory
158 To Practice 160
Study Limitations 163
External Validity 164Future Research 167
References 172
Appendix A Examples of open and axial coding 191
Appendix B Questionnaire Items by Construct 193
Appendix C Operator Questionnaire 201
Appendix D Supervisor Questionnaire 224
Appendix E Pretest Instrument A--Matching 227
Appendix F Pretest Instrument B--Categorization 228
Appendix G Pretest Instrument C--Sorting 229
Appendix H Pairwise Intercorrelation Matrices 230
Appendix I Descriptive Statistics 244
Appendix J Pairwise Intercorrelation Matrices--High Level Concepts 245
vii
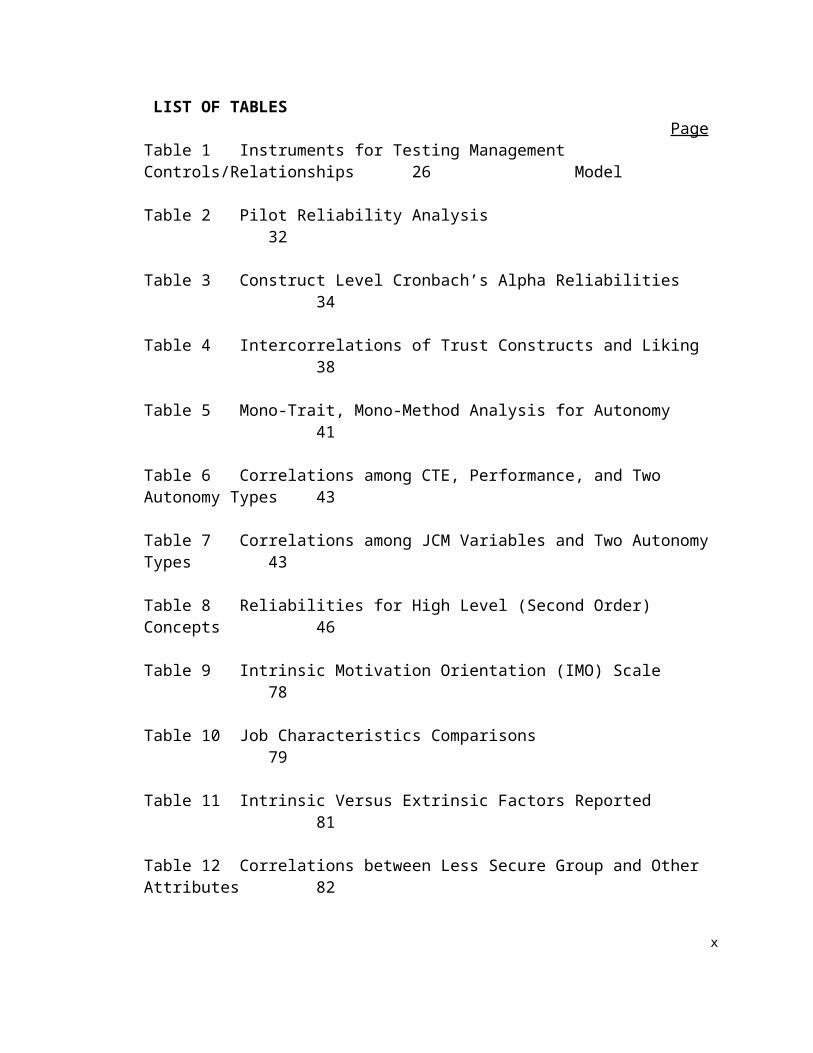
LIST OF TABLESPage
Table 1 Instruments for Testing Management Controls/Relationships 26 Model
Table 2 Pilot Reliability Analysis 32
Table 3 Construct Level Cronbach’s Alpha Reliabilities 34
Table 4 Intercorrelations of Trust Constructs and Liking 38
Table 5 Mono-Trait, Mono-Method Analysis for Autonomy 41
Table 6 Correlations among CTE, Performance, and Two Autonomy Types 43
Table 7 Correlations among JCM Variables and Two Autonomy Types 43
Table 8 Reliabilities for High Level (Second Order) Concepts 46
Table 9 Intrinsic Motivation Orientation (IMO) Scale 78
Table 10 Job Characteristics Comparisons 79
Table 11 Intrinsic Versus Extrinsic Factors Reported 81
Table 12 Correlations between Less Secure Group and Other Attributes 82
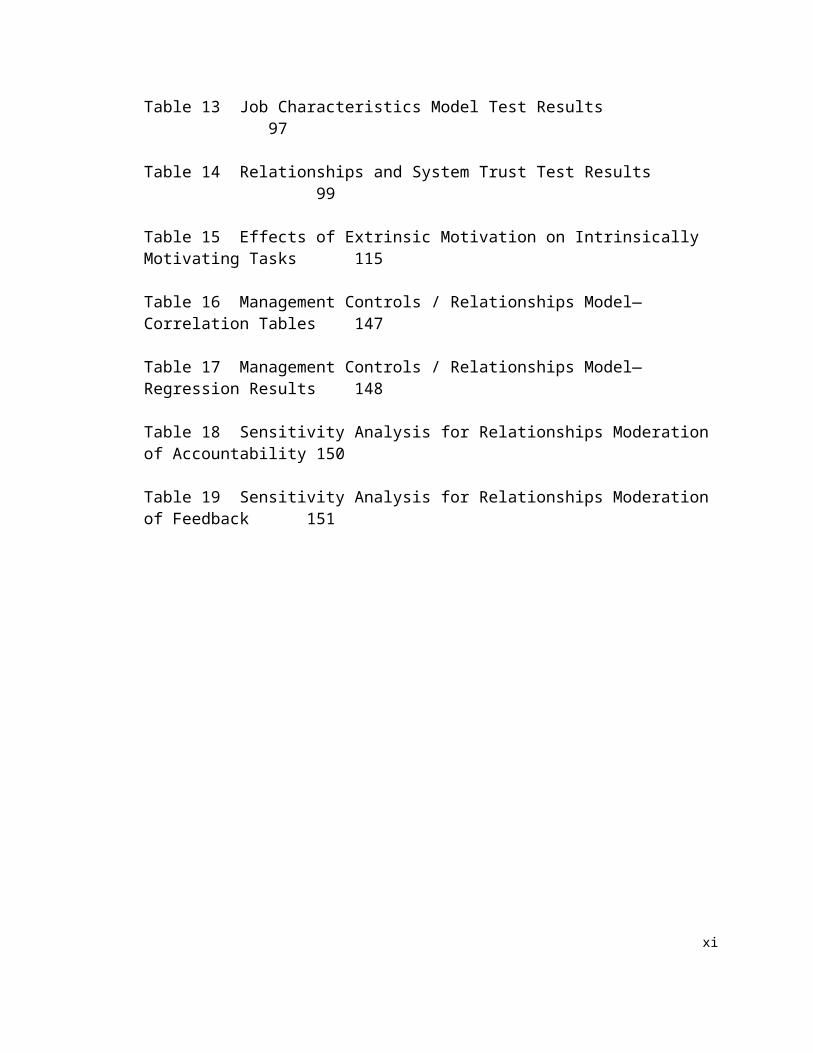
Table 13 Job Characteristics Model Test Results 97
Table 14 Relationships and System Trust Test Results 99
Table 15 Effects of Extrinsic Motivation on Intrinsically Motivating Tasks 115
Table 16 Management Controls / Relationships Model—Correlation Tables 147
Table 17 Management Controls / Relationships Model—Regression Results 148
Table 18 Sensitivity Analysis for Relationships Moderation of Accountability 150
Table 19 Sensitivity Analysis for Relationships Moderation of Feedback 151
viii
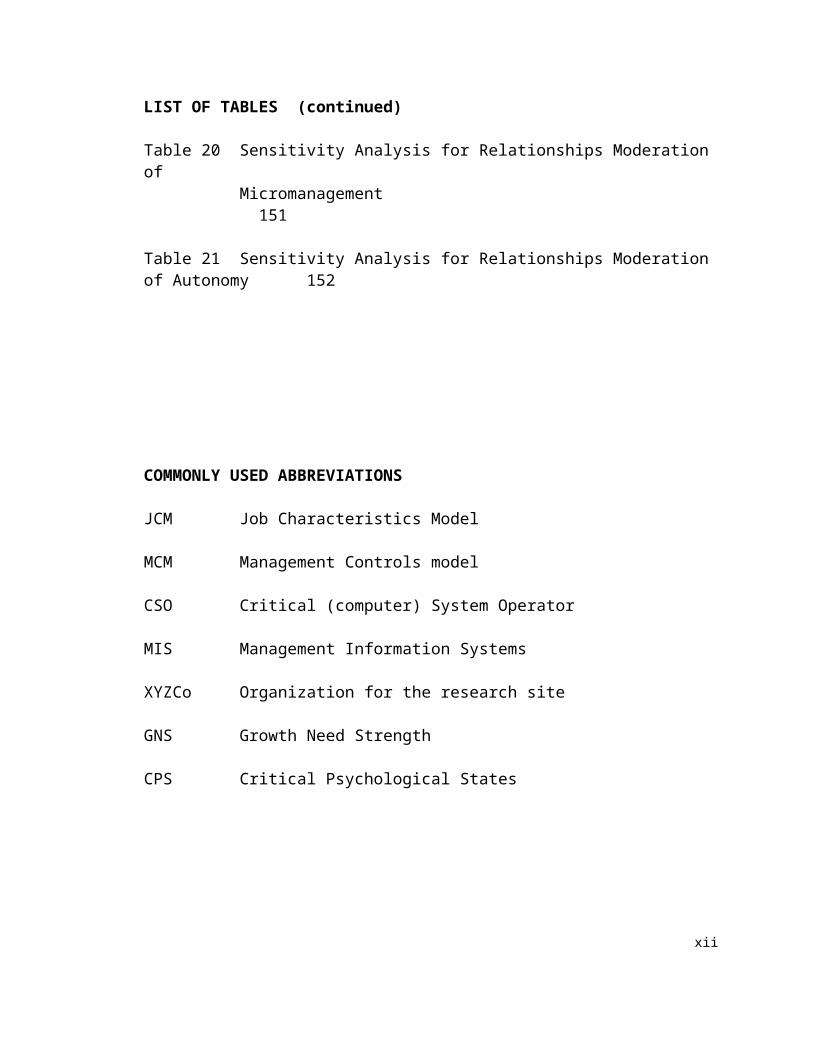
LIST OF TABLES (continued)
Table 20 Sensitivity Analysis for Relationships Moderation of Micromanagement 151
Table 21 Sensitivity Analysis for Relationships Moderation of Autonomy 152
COMMONLY USED ABBREVIATIONS
JCM Job Characteristics Model
MCM Management Controls model
CSO Critical (computer) System Operator
MIS Management Information Systems
XYZCo Organization for the research site
GNS Growth Need Strength
CPS Critical Psychological States
ix

LIST OF FIGURES
PageFigure 1 Job Characteristics Model (JCM) 2
Figure 2 Motivating Nature of the Critical Systems Operator Job 6
Figure 3 Expanding the Job Characteristics Model 9
Figure 4 Management Controls Model 10
Figure 5 Advancing the Management Controls Model 12
Figure 6 Roadmap for the Study 14
Figure 7 The Operations Research Model 19
Figure 8 Phase I Research Framework 23
Figure 9 Management Controls / Relationships Model—Detailed Level 25
Figure 10 Job Characteristics Model (JCM)—Detailed Level 27
Figure 11 Nomological Network for Trust Constructs 37
Figure 12 Model of Construct Creation 192
Figure 13 Model of Construct Linkages 192
x
CHAPTER ONE: INTRODUCTION AND OVERVIEW
This chapter previews the topic, propositions, general
methodology, and contributions of the study. It begins with a research
overview that introduces the research question. Then it creates the
broad propositions that later chapters will test in detail. Finally, it
summarizes the contributions of the study and presents a guide that
organizes the contents of later chapters.
OVERVIEW AND RESEARCH QUESTION
This study introduces two constructs, Relationships and System
Trust, that improve the predictive power of the Job Characteristics
Model (JCM) and the Management Controls model (MCM) of worker
motivation. System Trust means the belief that proper impersonal
structures are in place to enable one to anticipate a successful
endeavor (Lewis & Weigert, 1985; Shapiro, 1987; Zucker, 1986). In
this study, the Systems Trust construct was operationalized as the
worker’s belief that structures (i.e., processes, procedures) support or
encourage fairness in one’s work environment. Relationships means
the extent to which one holds positive feelings, beliefs and intentions
towards another person. The Relationships construct was
operationalized as trust in, and liking of, one’s supervisor. The
Relationships definition carries a quality-of-relation focus that differs
from the traditional definitions of relationships in: a) sociology, which
focus more on behavioral and role interdependence (e.g., Blau, 1964), 1
and b) social psychology, which focuses more on the ability of parties
to influence each other (e.g., Berscheid, 1983).
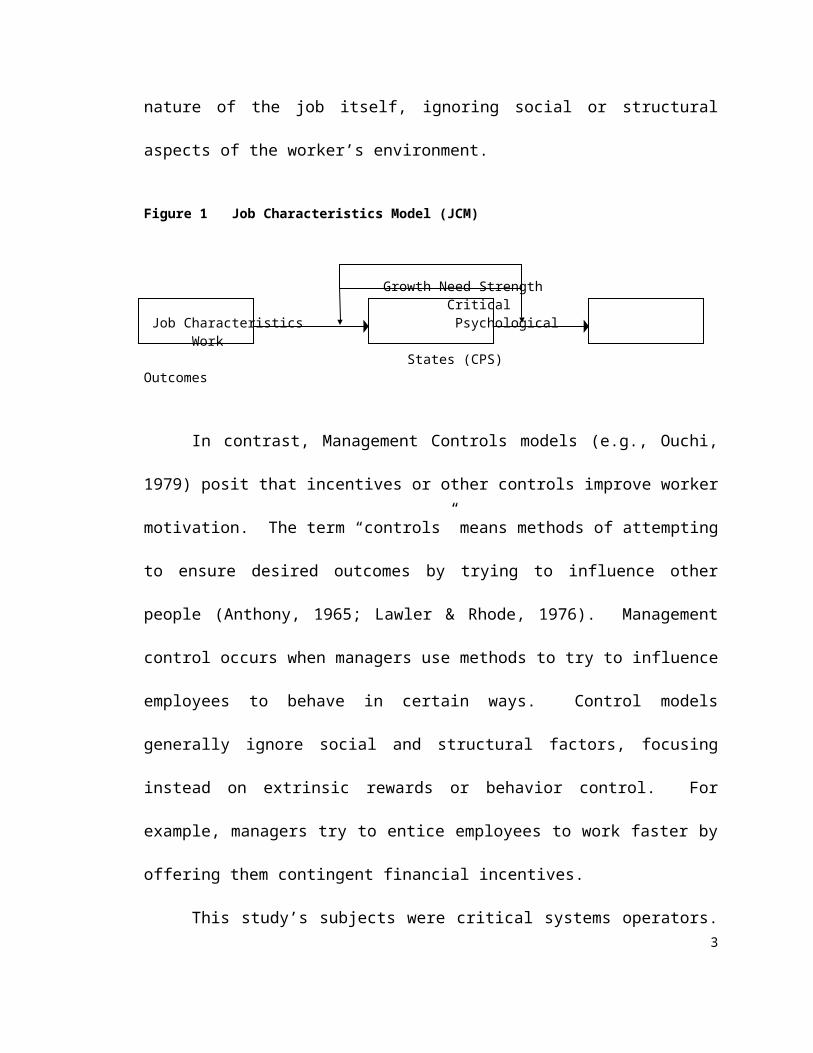
As depicted in Figure 1, the Hackman and Oldham (1975) Job
Characteristics Model (JCM) posits that worker perceptions of their Job
Characteristics (e.g., Skill Variety) lead to Critical Psychological States
(e.g., Felt Responsibility) that, in turn, lead to motivational Work
Outcomes (e.g., Job Satisfaction). These model linkages are
moderated by the worker’s Growth Need Strength, an individual
characteristic variable. The JCM focuses on the nature of the job itself,
ignoring social or structural aspects of the worker’s environment.
Figure 1 Job Characteristics Model (JCM)
Growth Need Strength Critical
Job Characteristics Psychological Work States (CPS) Outcomes
In contrast, Management Controls models (e.g., Ouchi, 1979)
posit that incentives or other controls improve worker motivation. The
term “controls” means methods of attempting to ensure desired
outcomes by trying to influence other people (Anthony, 1965; Lawler
& Rhode, 1976). Management control occurs when managers use
methods to try to influence employees to behave in certain ways.
Control models generally ignore social and structural factors, focusing
instead on extrinsic rewards or behavior control. For example, 2
managers try to entice employees to work faster by offering them
contingent financial incentives.
This study’s subjects were critical systems operators. Critical
systems are computer systems that must be kept available to users,
or else numerous business or operational transactions are interrupted.
Transaction processing systems, used to conduct a firm’s daily
business, often fall in the category of critical systems (Laudon &
Laudon, 1995). Managers of critical systems try to keep their systems
continuously available to system users. Hence, critical systems
operators (CSOs) must be constantly alert to problems that might
threaten the system. When a critical systems crashes, the operators
are charged with restoring it within seconds or minutes, not hours.
The researcher studied critical computer systems operators (CSOs) in
two stages: exploratory (Phase I) and confirmatory (Phase II). The
systems these operators ran were considered critical because
thousands of users required that the systems be continuously
available so they could perform their daily job function.
During the study’s Phase I interviews, it became evident that
CSOs were clearly motivated by the nature of their job, but that
controls and incentives did not have consistent, positive motivational
effects on CSOs. In analyzing Phase I data, it became clear that
worker relationships with superiors and their beliefs about the work
environment also influenced their motivation. Some evidence for this 3
effect also comes from the management literature (e.g., Cook & Wall,
1980; Locke, Latham & Erez, 1988). Therefore, the study’s research
question is:
Do operator/supervisor Relationships and System Trust
improve the ability of the Job Characteristics Model and the
Management Controls model to predict critical systems
operator motivation and motivational outcomes?
In other words, this study tested the extent to which
operator/supervisor Relationships and System Trust added predictive
value to the JCM and the MCM in the critical systems operator context.
THE NATURE OF THE CRITICAL SYSTEMS OPERATOR JOB
The critical computer systems operator (CSO) is a subset of the
class of information systems workers called “computer operators.” A
literature search revealed that very little research has been done on
computer operators. The management information system (MIS)
literature focuses on system development, implementation,
maintenance, and use issues, while covering few system operation
issues (Berkeley, 1984; Ives, Hamilton and Davis, 1980; Swanson &
Ramiller, 1993). Lyytinen & Hirschheim's (1987) exhaustive review of
the MIS failure literature reported almost no research on system
operation issues.
In fact, in the 1970s and 1980s, the traditional computer operator job was viewed
as a quasi-clerical function that did not merit intensive study (Couger & Zawacki, 1980). 4

In their survey of over 1200 computer operations employees, Couger
and Zawacki (1980: 33) reported that “employees in DP operations
perceive their jobs to be deficient in the key characteristics that
produce motivation and lead to increased productivity. The
motivating potential score (MPS) of these jobs is lower than that of
any of the other 500 jobs in the Hackman/Oldham data base.” MPS,
derived from the scores of the five JCM job characteristics, represents
how motivating a job is. Describing computer operations as a data
processing ‘stepchild,’ Couger and Zawacki suggested that only “the
‘sledgehammer’ of a catastrophic event such as a flood or bombing”
could “draw attention to computer operations.” (1980: 34)
This study draws attention to the job of the critical systems operator—a job that
does not fit the Couger and Zawacki computer operator profile. In the critical system
context, the threat of catastrophic system downtime is so large that it produced
motivating potential scores for the eighty-six critical systems operators in this study that
were more than double that of the traditional computer operator Couger and Zawacki
measured. This study’s informants operated three critical transaction processing systems
at a large U. S. corporation fictionally name XYZCo. During Phase I interviews, critical
systems operators (CSOs) at XYZCo were found to be highly skilled and motivated
individuals who performed an extremely interesting and challenging job. For example,
the task of diagnosing and fixing system outages was reported to be exhilarating,
satisfying, and yet full of pressure. These CSOs were found to be primarily intrinsically
motivated, in that they more often mentioned that they enjoyed their job and its challenge 5
than they mentioned extrinsic job rewards. From Phase I data (discussed in more detail
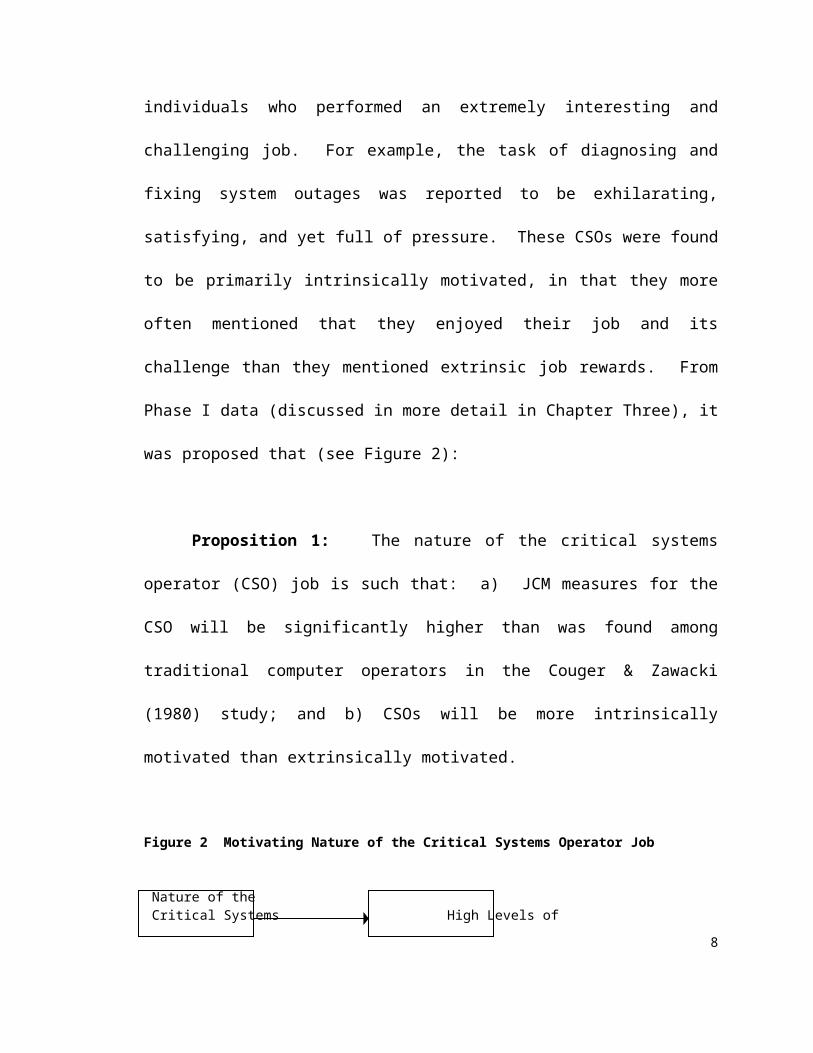
in Chapter Three), it was proposed that (see Figure 2):
Proposition 1: The nature of the critical systems operator (CSO) job is such
that: a) JCM measures for the CSO will be significantly higher than was found among
traditional computer operators in the Couger & Zawacki (1980) study; and b) CSOs will
be more intrinsically motivated than extrinsically motivated.
Figure 2 Motivating Nature of the Critical Systems Operator Job
Nature of the Critical Systems High Levels of Operator Job Motivation
The CSO job is therefore considerably different from the jobs of the traditional
computer operators Couger and Zawacki (1980) studied. The CSO subjects of this study
are not representative of computer operators in general, but are representative of
operators of computer (and other) systems that are required to stay available nearly 100%
of the time. Therefore, rather than generalizing to the job of computer operators, the
results of this study will shed light on: a) the jobs of critical computer system operators
(e.g., for transaction processing systems—Laudon & Laudon, 1995; Weick, 1990); and
b) the jobs of those who operate critical systems like nuclear power plants or aircraft
carriers (e.g., Perrow, 1984; Weick & Roberts, 1993).
ADVANCING THE JOB CHARACTERISTICS MODEL
The Job Characteristics Model posits that jobs may be designed to maximize
6
motivation (e.g., Hackman, 1980). JCM forms the theoretical basis for worker
empowerment (e.g., Peters, 1992) and the related process “reengineering” (Hammer &
Champy, 1993) paradigms, which have dominated recent motivation practices of
corporations. JCM has also been widely adopted and discussed in the Management and
MIS literatures (e.g., Couger & Zawacki, 1980; Roberts & Glick, 1981). Evidence
developed by those who have studied information systems jobs (e.g., Couger & Zawacki,
1980; Ives & Chervany, 1983; Lending, 1996) generally supports the application of the
JCM to the information systems worker. Therefore, (see Figure 1)
Proposition 2: The job characteristics of critical systems operators will be
positively associated with their Critical Psychological States (CPS), which, in turn, will
be positively associated with their Work Outcomes. Both linkages will be moderated by
Growth Need Strength (GNS).
Over the past twenty years, significant evidence has accumulated that social
relationships also motivate workers. The original JCM (Hackman & Lawler, 1971)
contained social needs factors that were later removed, probably because they did not
receive as much empirical support as did the job characteristics part of the model
(Lending, 1996). However, some researchers have continued to include some aspect of
sociality in their testing of the JCM (e.g., Couger & Zawacki, 1980; Lending, 1996).
Further, Salancik & Pfeffer (1978) offered their Social Information Processing (SIP)
model as a JCM alternative. SIP posits that worker perceptions of their jobs are
influenced through social cognitive processes rather than through job characteristics. 7
Lending (1996) and Couger & Zawacki (1980) used forms of social needs in their
studies, based on Hackman & Lawler (1971). These needs have not always been found
to be closely related to CPS or Work Outcomes.
Note that measurements of social needs or social cognitions are indirect ways of
measuring the ‘goodness’ of relationships between people in the work place. That is,
measuring social need fulfillment refers to how well a relationship fulfills a person’s
need, rather than measuring the quality of the relationship (i.e., trust and liking between
the people) directly. Similarly, social cognition embodies how cognitive frames are
formed, but does not directly measure people relationships. However, if social need
fulfillment and social cognition are important to motivation, then it seems reasonable that
people relationships measured directly could be even more important. In fact, Smits,
McLean and Tanner (1997) found that the relationship with one’s supervisor was one of
the two most significant predictors of the motivational variable called organizational
commitment. Similarly, Lending (1996) found that one relationship variable,
“Satisfaction with Supervisor,” improved her ten-factor JCM index’s prediction of
system developer Job Satisfaction from an adjusted R-squared of .22 to .33. System
Trust, because it is part of the family of trust variables that are positively related to
motivation (Locke, Latham & Erez, 1988), is also likely to be related to motivational
outcomes. For example, how one feels about the structures encouraging equity in the
work environment (System Trust) should be related to one’s Job Satisfaction (a Work
Outcome). Therefore (see Figure 3):
8

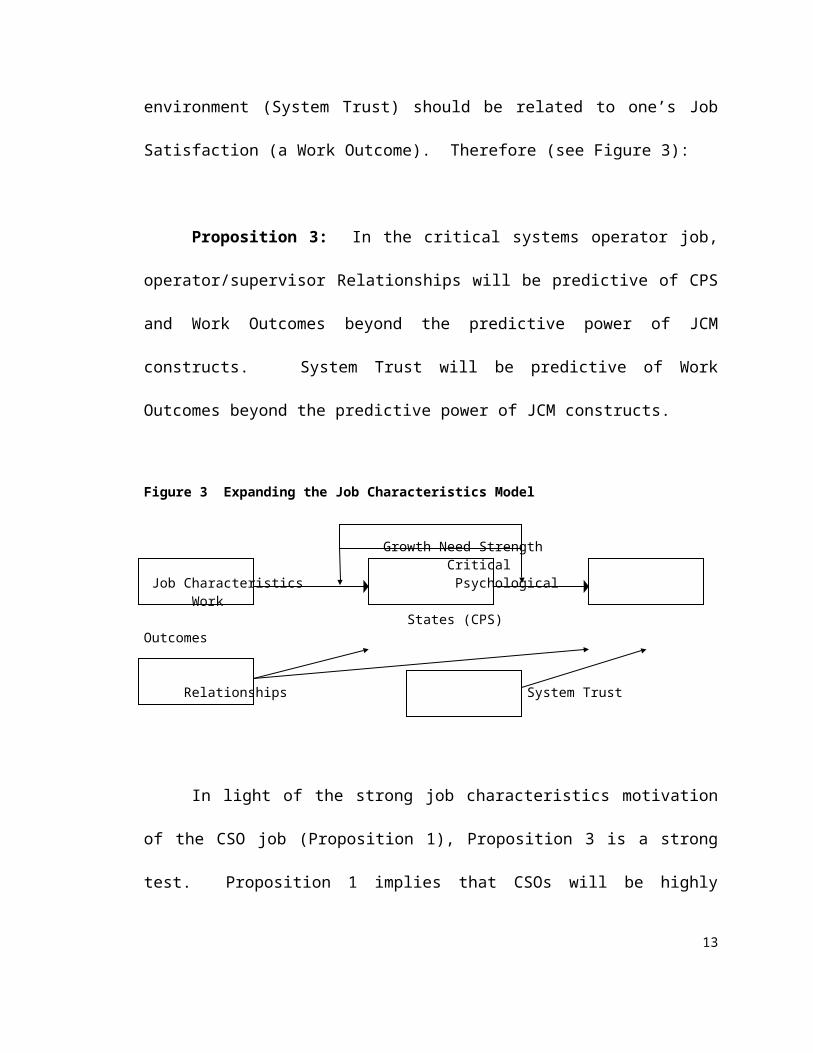
Proposition 3: In the critical systems operator job, operator/supervisor
Relationships will be predictive of CPS and Work Outcomes beyond the predictive
power of JCM constructs. System Trust will be predictive of Work Outcomes beyond
the predictive power of JCM constructs.
Figure 3 Expanding the Job Characteristics Model
Growth Need Strength Critical
Job Characteristics Psychological Work States (CPS) Outcomes
Relationships System Trust
In light of the strong job characteristics motivation of the CSO job (Proposition
1), Proposition 3 is a strong test. Proposition 1 implies that CSOs will be highly
motivated by job characteristics. The strong salience of the job characteristics factors
makes it less likely that, in the presence of job characteristics factors, Relationships and
System Trust will be significant predictors of CPS and Work Outcomes. That is, in the
CSO context, job characteristics factors are more likely to dwarf the effects of
Relationships and Systems Trust than would occur in another work context. Thus,
Proposition 3 is a strong test of the efficacy of Relationships and System Trust.
ADVANCING THE MANAGEMENT CONTROLS MODEL
Management Controls research (e.g., Ouchi, 1979; Eisenhardt, 1985) has
typically linked controls to desired outcomes like motivation. For example,
accountability control should lead to higher motivation (Tetlock, 1985). Also, agency 9
theory proposes that, to be successful, principals should contract with the agent such that:
a) their objectives are aligned (typically through offering the agent incentives); or, b) the
agent’s behavior can be monitored. The latter constitutes a behavioral control, while the
former is an outcome control (Kirsch, 1992).
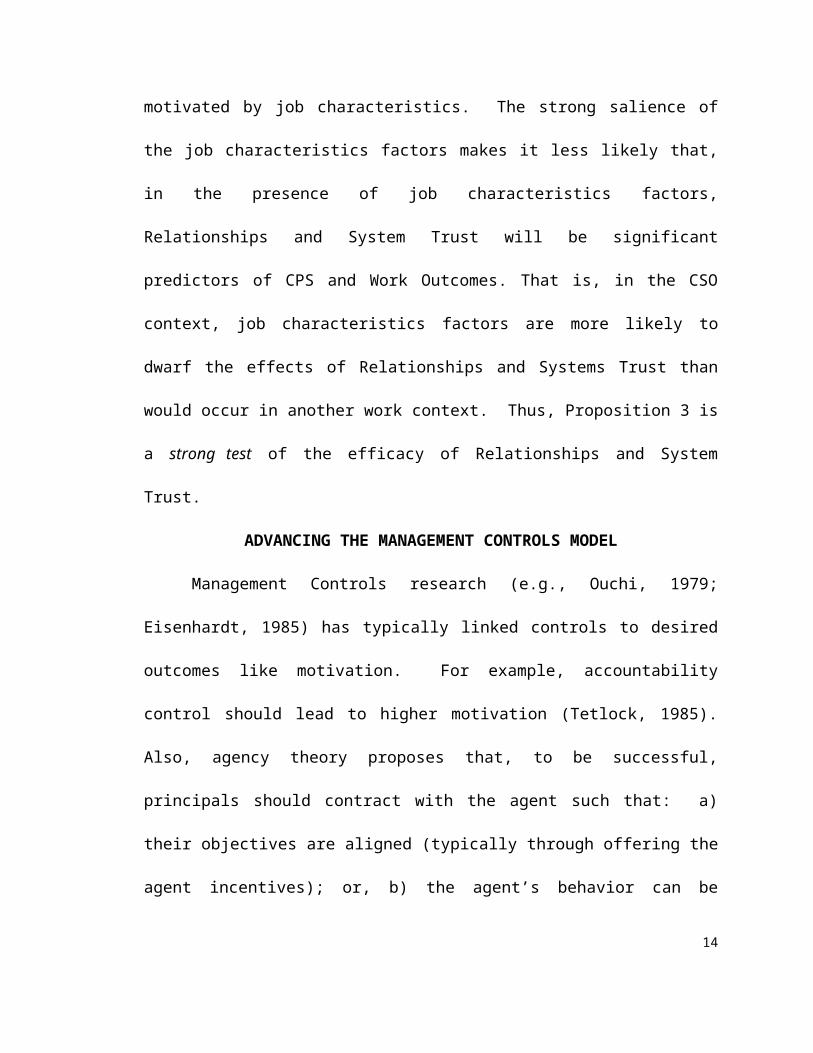
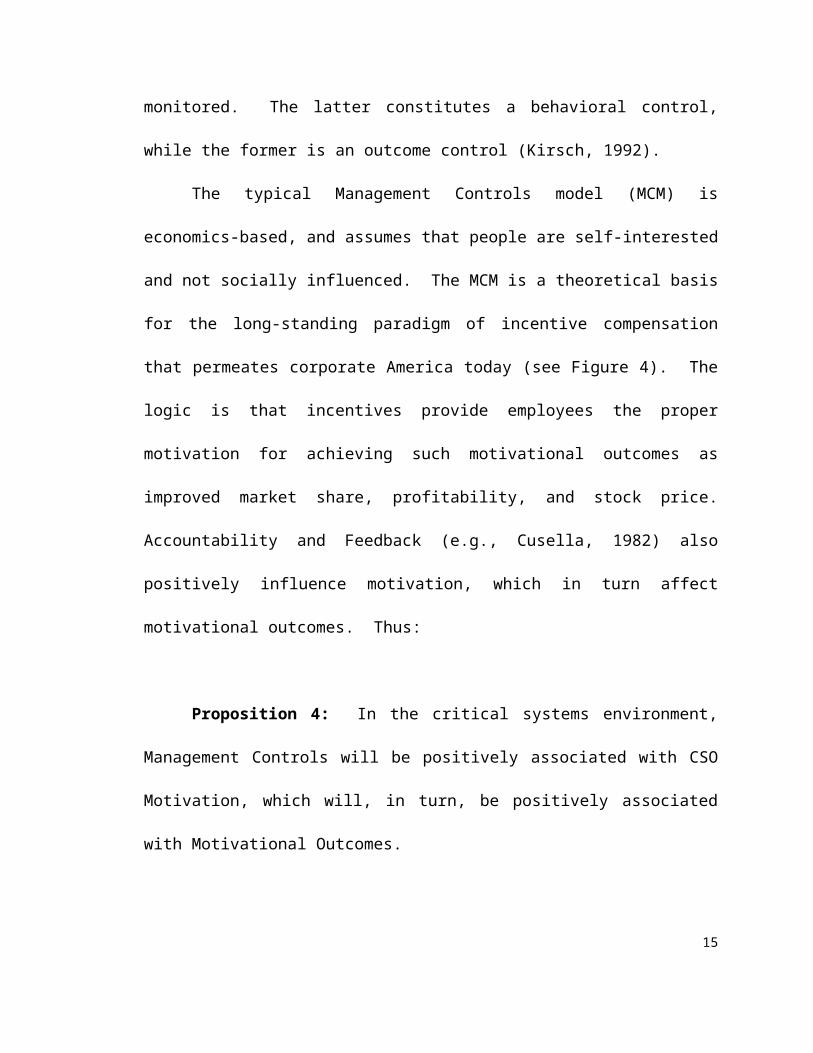
The typical Management Controls model (MCM) is economics-based, and
assumes that people are self-interested and not socially influenced. The MCM is a
theoretical basis for the long-standing paradigm of incentive compensation that
permeates corporate America today (see Figure 4). The logic is that incentives provide
employees the proper motivation for achieving such motivational outcomes as improved
market share, profitability, and stock price. Accountability and Feedback (e.g., Cusella,
1982) also positively influence motivation, which in turn affect motivational outcomes.
Thus:
Proposition 4: In the critical systems environment, Management Controls will
be positively associated with CSO Motivation, which will, in turn, be positively
associated with Motivational Outcomes.
Figure 4 Management Controls Model
Management Motivation Motivational Controls Outcomes
10
Paradoxically, Management Controls have sometimes had negative outcomes.
Whereas incentives, or other controls, have sometimes been found to improve worker
motivation and performance (e.g., Henderson & Lee, 1992), they have also been found to
have dysfunctional side effects (e.g., Lawler & Rhode, 1976; Simons, 1995). For
example, Powers and Dickson (1973) found negative perceived effects of project controls
on system development outcomes. However, they did not explain why this occurred.
Phase I data indicated that the worker relationship with the manager is likely to
have an effect on the worker’s motivation. In two Phase I instances, the relationship
moderated the effects of controls on worker motivation. In another instance, the
relationship directly affected the worker’s motivation.
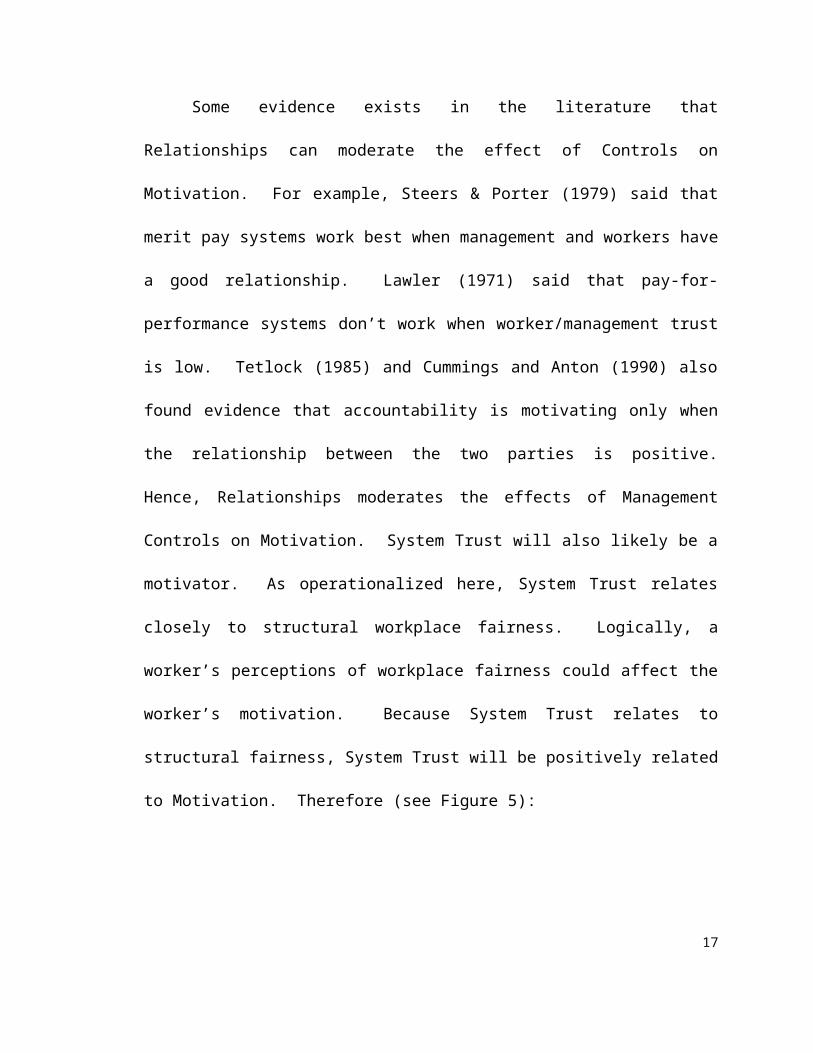
Some evidence exists in the literature that Relationships can moderate the effect
of Controls on Motivation. For example, Steers & Porter (1979) said that merit pay
systems work best when management and workers have a good relationship. Lawler
(1971) said that pay-for-performance systems don’t work when worker/management trust
is low. Tetlock (1985) and Cummings and Anton (1990) also found evidence that
accountability is motivating only when the relationship between the two parties is
positive. Hence, Relationships moderates the effects of Management Controls on
Motivation. System Trust will also likely be a motivator. As operationalized here,
System Trust relates closely to structural workplace fairness. Logically, a worker’s
perceptions of workplace fairness could affect the worker’s motivation. Because System
Trust relates to structural fairness, System Trust will be positively related to Motivation.
Therefore (see Figure 5):
11
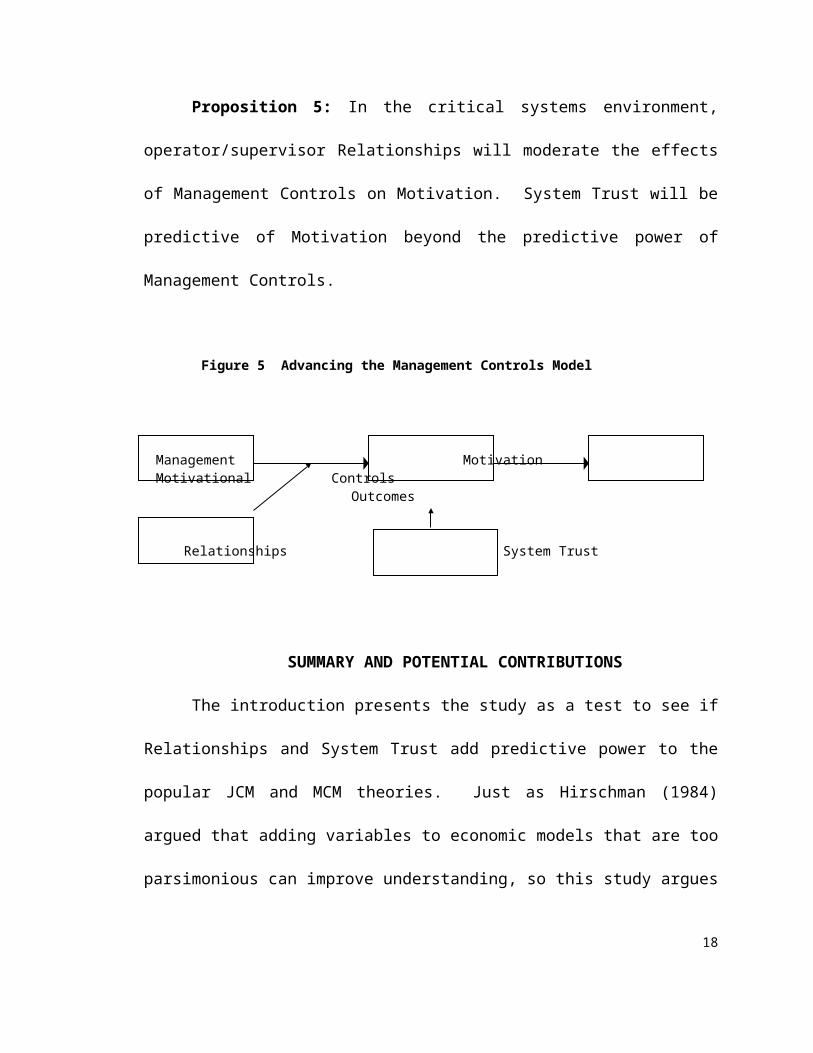
Proposition 5: In the critical systems environment, operator/supervisor
Relationships will moderate the effects of Management Controls on Motivation. System
Trust will be predictive of Motivation beyond the predictive power of Management
Controls.
Figure 5 Advancing the Management Controls Model
Management Motivation Motivational Controls Outcomes
Relationships System Trust
SUMMARY AND POTENTIAL CONTRIBUTIONS
The introduction presents the study as a test to see if Relationships and System
Trust add predictive power to the popular JCM and MCM theories. Just as Hirschman
(1984) argued that adding variables to economic models that are too parsimonious can
improve understanding, so this study argues that adding Relationships and System Trust
to the JCM and the MCM can improve prediction of motivation.
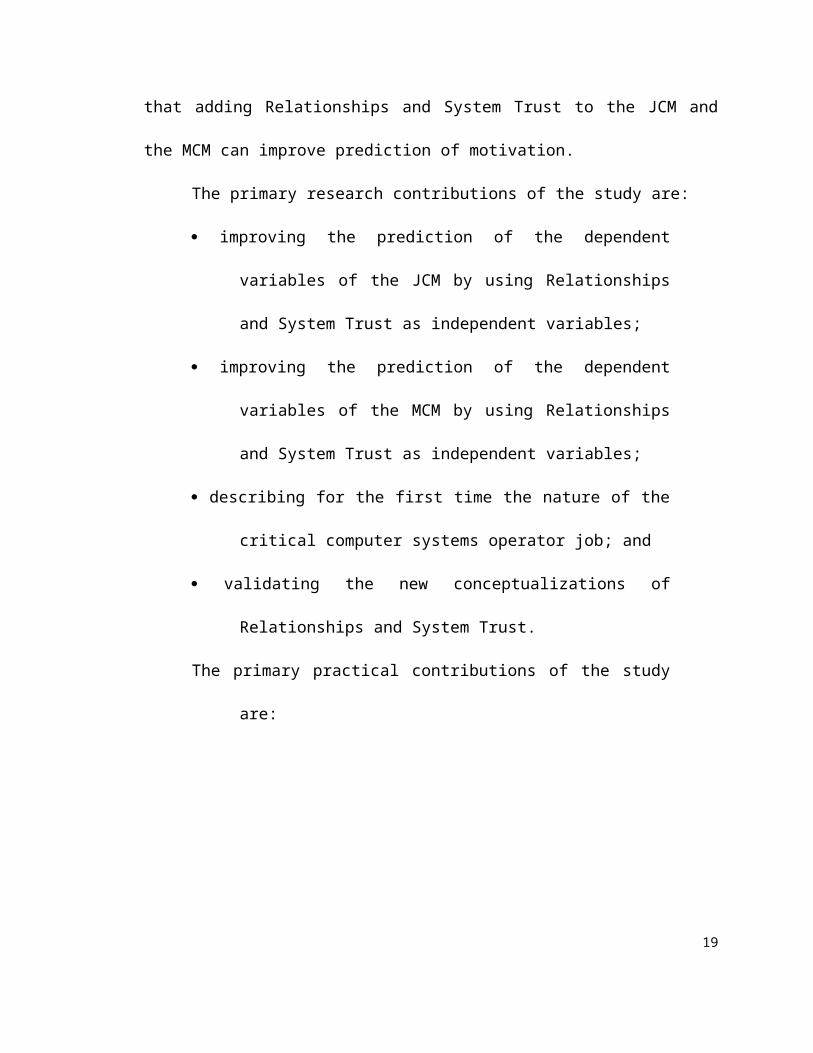
The primary research contributions of the study are:
improving the prediction of the dependent variables of the JCM by using
Relationships and System Trust as independent variables;
improving the prediction of the dependent variables of the MCM by
using Relationships and System Trust as independent variables;
12
describing for the first time the nature of the critical computer systems
operator job; and
validating the new conceptualizations of Relationships and System
Trust.
The primary practical contributions of the study are:
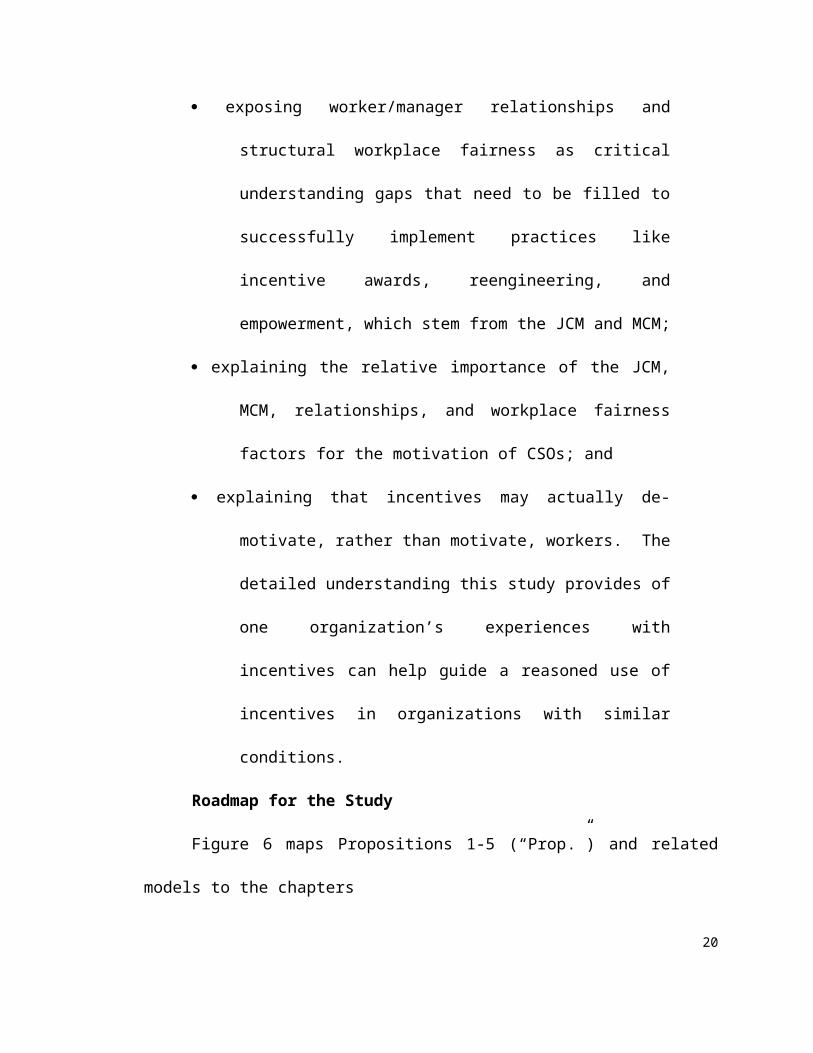
exposing worker/manager relationships and structural workplace fairness
as critical understanding gaps that need to be filled to successfully
implement practices like incentive awards, reengineering, and
empowerment, which stem from the JCM and MCM;
explaining the relative importance of the JCM, MCM, relationships, and
workplace fairness factors for the motivation of CSOs; and
explaining that incentives may actually de-motivate, rather than
motivate, workers. The detailed understanding this study provides
of one organization’s experiences with incentives can help guide a
reasoned use of incentives in organizations with similar conditions.
Roadmap for the Study
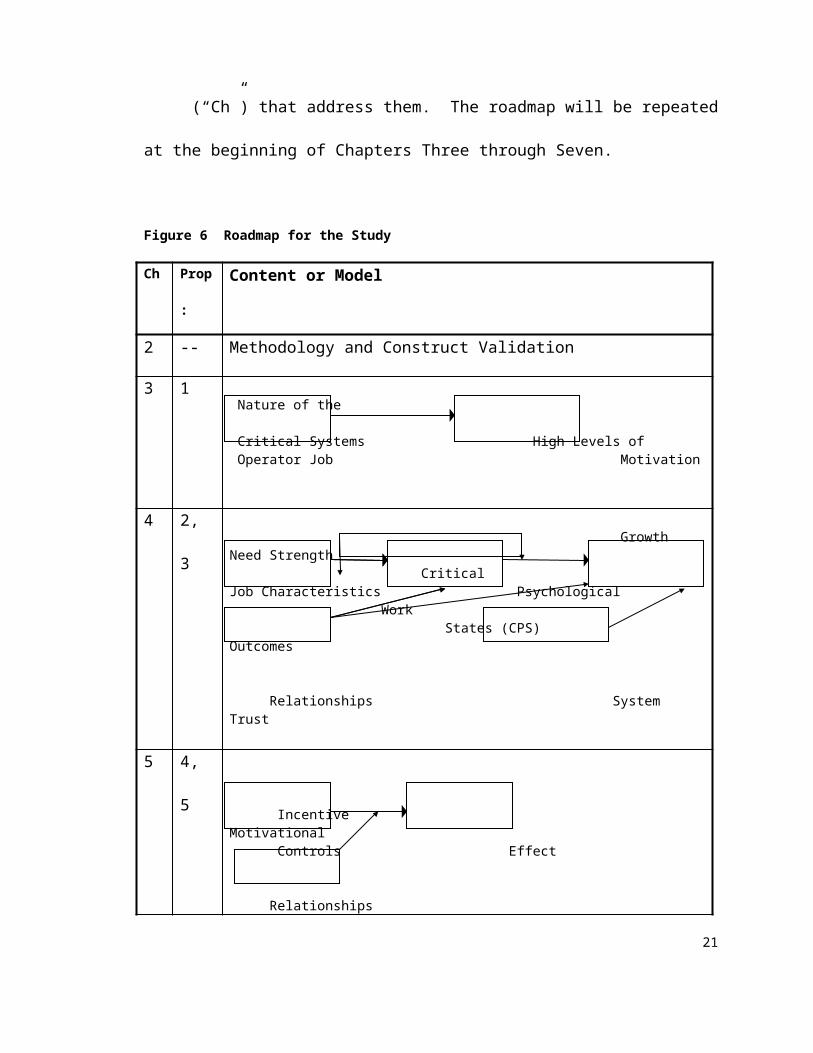
Figure 6 maps Propositions 1-5 (“Prop.”) and related models to the chapters
13
(“Ch”) that address them. The roadmap will be repeated at the beginning of
Chapters Three through Seven.
Figure 6 Roadmap for the Study
Ch Prop: Content or Model
2 -- Methodology and Construct Validation
3 1 Nature of the Critical Systems High Levels of Operator Job Motivation
4 2, 3 Growth Need Strength
Critical Job Characteristics Psychological Work
States (CPS) Outcomes
Relationships System Trust
5 4, 5
Incentive Motivational Controls Effect
Relationships
6 4, 5
Other Motivation Motivational Controls Outcomes
Relationships System Trust
7 -- Contributions, Limitations, and Future Research
14
CHAPTER TWO: METHODOLOGY AND CONSTRUCT VALIDATION
First, this chapter outlines and justifies the general approach
taken in the study. Next, the methodologies for Phases I and II are
discussed. This is followed by the results of construct validation
efforts. Finally, a brief description of the research site is given.
APPROACH OF THE STUDY
Research models may be built in at least two different ways.
Using Method 1, a researcher searches the scientific literature for what
has been done in the area of interest (e.g., Kaplan, 1964). By analysis
of what has already been done, a researcher deductively builds a
model for testing. Using Method 2, a researcher visits the research
site and observes what is happening (e.g., Glaser & Strauss, 1967;
Glaser, 1978). By analyzing some subset of the complex
phenomenon, the researcher inductively creates a conceptual model
of the phenomenon. Method 1 has the advantages that it builds upon
earlier work and results in a readily testable model. Its disadvantage
is that the model may not adequately reflect what is occurring in the
research setting. Method 2 has the advantage of more closely
matching the phenomenon chosen. Its disadvantages are that it can
create models that are: a) hard to connect with existing models in the
literature, and b) difficult to test scientifically. This study combines
Methods 1 and 2 to take advantage of the benefits of each.15
This study was conducted in two phases. Phase I explored the
research problem using semi-structured interview data analyzed via
grounded theory methods (Glaser & Strauss, 1967; Strauss, 1987).
Phase II tested the model produced by Phase I, using telephone
questionnaire data primarily analyzed with correlation and regression
techniques.
16
Why was this two-phased approach was taken? First, from an
initial literature search, no studies were found that addressed the
critical systems operator’s (CSO’s) job within the context of the related
management controls and people relationships. This decreased the
researcher’s confidence that hypotheses developed from the literature
would hold; rather, the judgment was that such hypotheses would be
conjectural. Given this judgment, it would be likely that, even after
testing, the resulting model would not explain many of the interacting
factors found in this area of practice. This issue is a concern because
both MIS and reference discipline scholars have said that complex,
interacting factors determine system reliability (Hale & Glendon, 1987;
Lyytinen & Hirschheim, 1987). For example, Lucas (1975) said, “...a
number of variables are involved in the design and operation of
successful systems. The complex relationships among technical,
behavioral, situational, and personal factors all must be considered. If
any variable is ignored, systems are likely to fail.” (1975: 110)
Second, an exclusively deductive model building approach would likely
lead to “Type III” errors (Kirk & Miller, 1986), which occur when a
researcher misses important issues for study in the setting. This is
especially important to new fields of study, such as the critical
computer system.
17
Third, the contribution of a deductive model building / model
testing effort is likely to be very limited. To make a major
contribution, one needs to go beyond a small, incremental addition to
the literature, which Weick compared to swimming toward “the white
cliffs of the obvious” (Mintzberg, 1979). Meehl (1978) argued that
“science does not, and cannot, proceed by incremental gains achieved
through statistical significance testing of hypotheses” (Kaplan &
Duchon, 1988: 572). Mintzberg argued that serious exploratory work
is needed for progress to be made: “Simplification squeezes out the
very thing on which the research should focus” (1979: 586). Further,
solely deductive research tends to prevent the discovery of new
insights (Kirk & Miller, 1986).
18
For these reasons, the researcher felt it important to first
develop conceptual models of the phenomenon through an inductive
approach. A conceptual model may, or may not, be quantitatively
testable. Often, these models are developed at a high level of
abstraction that needs further delineation in order to be tested. At the
least, a conceptual model provides a clear description of what factors
are important in explaining the target outcomes of the study. This
approach lies within the tradition of creating models from case study
work (Applegate, 1991; Eisenhardt, 1989a). The resulting conceptual
models need to be: a) made testable and b) tested empirically. This
is important if the resulting models are to add to the body of
scientifically tested knowledge. Through literature searches, the
researcher can make the conceptual models specific enough to be
tested. This is done by justifying variable-level hypotheses that can
be tested by existing or new quantitative scales. Hence, this intensive
study builds theory by integrating the strengths of exploratory and
testing methods, much as Lee (1991a) recommended integrating
positivist with post-positivist research.
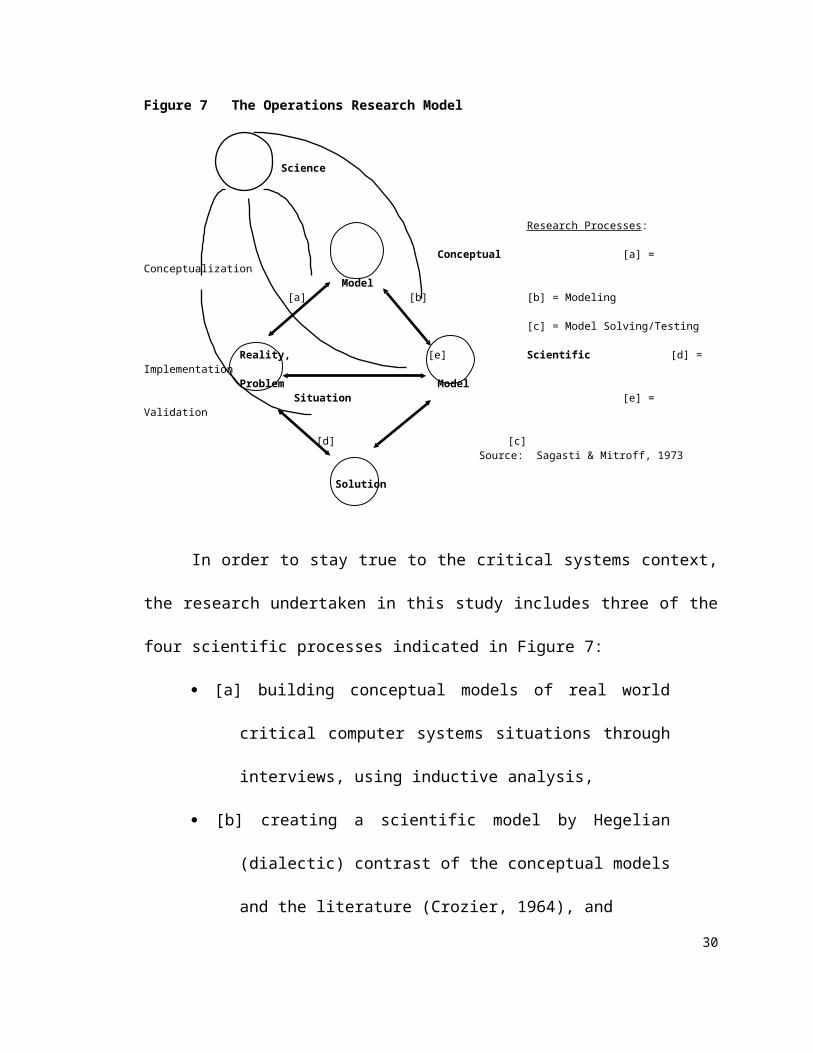
This study's overall structure can be understood in terms of
Sagasti & Mitroff's (1973) diamond model, which represents four
"bases" of research (Figure 7). The bases are (from "3rd base"
clockwise to "home plate"): (1) the real world problem; (2) the
conceptual model of the problem; (3) the scientific model; and (4) the 19
model's solution. Sagasti & Mitroff argued that the four bases are
connected by four scientific research processes--conceptualization,
modeling, model solving/testing, and implementation (see Figure 7--
[a],[b],[c],[d]). By linking these four bases, one can produce, from
everyday reality, [a] conceptual models that can be refined into [b]
scientific models that, when [c] tested, can be used as helpful input
[d] to the problem again.
The danger of not pursuing part [a] of the process is producing irrelevant or
unrealistic models (Mintzberg, 1979). As Dubin said, “observation and description of
the real world are the essential points of origin for theories” (1976: 18). Warning against
the use of reality-starved methodologies, Cook & Campbell (1979: 92) remarked that
exclusive reliance on statistical or experimental methods can have “disastrous” effects on
a study. Crozier said that “premature rigor” can keep a theory “from being adequately
comprehensive.” (1964: 5). Oversimplifying phenomena through excessive
mathematical modeling eliminates key elements, such that “every similarity to reality is
gone” (Hofstede, 1967: 89). Researchers should preserve reality by resisting models that
are not founded on a thorough prior understanding of the real world phenomenon.
20
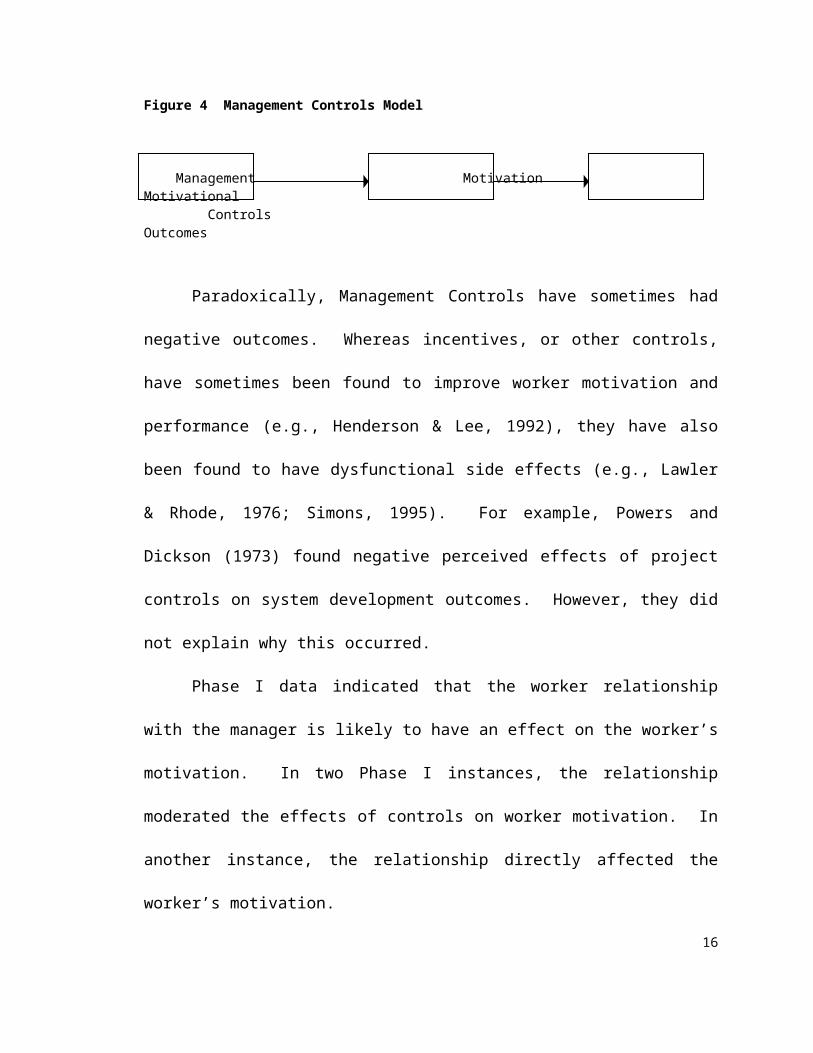
Figure 7 The Operations Research Model
Science
Research Processes:
Conceptual [a] = Conceptualization Model
[a] [b] [b] = Modeling
[c] = Model Solving/Testing
Reality, [e] Scientific [d] = ImplementationProblem Model
Situation [e] = Validation
[d] [c]Source: Sagasti & Mitroff, 1973
Solution
In order to stay true to the critical systems context, the research
undertaken in this study includes three of the four scientific processes
indicated in Figure 7:
[a] building conceptual models of real world critical
computer systems situations through interviews,
using inductive analysis,
[b] creating a scientific model by Hegelian (dialectic)
contrast of the conceptual models and the literature
(Crozier, 1964), and
[c] testing the scientific model through questionnaire
data, analyzed with regression analysis.
This study’s approach to the dialectic of inductive and deductive
theory building does not rely completely on the qualitative data (as do
21
grounded theorists—Glaser, 1992), but synthesizes the grounded
empirical results and the existing literature into testable models.
Research step [a] ensures that the resulting theoretical contribution is
grounded in real world situations. Step [b] ensures that conceptual
models are translated into scientific models that [c] are rigorously
tested. Following these steps strengthens the study’s contribution,
because the resulting models will be applicable to practice ([a]) and
the study will add to the body of scientifically validated models ([b]
and [c]).
PHASE I CONCEPTUAL MODEL BUILDING METHODOLOGY
Phase I data consisted of transcripts of twenty semi-structured
interviews of managers and operators at a computer site described in
the last section of Chapter Two. Observations of operators in action
were limited to two cases of less than thirty minutes each. The
interviewees consisted of a convenience sample selected in
consultation with research site management. A grounded theory
approach (Glaser & Strauss, 1967; Strauss & Corbin, 1990) was used
to develop the conceptual model that resulted in the
controls/relationships model (Figure 5), but without the System Trust
construct. Due to time constraints, only six of the twenty interviews
were analyzed with grounded theory methods to produce the model.
The six were selected because they were felt to be the richest sources
22
of what seemed key concepts in Phase I: controls, motivation,
teamwork, and relationships.
Grounded Theory
Grounded theory is a qualitative method from sociology (Glaser
& Strauss, 1967) that enables one to build theory from a rigorous
analysis of observational or interview data. Grounded theory employs
the “usual canons of ‘good science’...significance, theory-observation
compatibility, generalizability, consistency, reproducibility, precision,
and verification” (Denzin, 1994: 508), and has been used effectively in
MIS research (Orlikowski, 1993).
A full grounded theory study was not done; rather, the
researcher used three methods from grounded theory: theoretical
sensitivity, open coding, and axial coding. Theoretical sensitivity
means that the researcher modifies the specific research topics as key
aspects become apparent from the data already gathered. This is
especially important to exploratory research like Phase I. The
researcher used theoretical sensitivity to focus attention on specific
research concepts (e.g., motivation, controls) that seemed important,
based on the initial few interviews at the research site. Using a
modifiable interview instrument facilitated use of theoretical
sensitivity. That is, the researcher added and deleted specific
questions from one interview to the next in order to focus on the key
concepts. Open coding means that the researcher abstracted 23
theoretical concepts from segments of the transcribed interview data.
This was done by reading a transcribed sentence, phrase, or word and
asking questions like, “What is this an instance of?” (Kearney, Murphy
& Rosenbaum, 1994: 353), or “What kind of concept does this refer
to?” Axial coding means to analyze the data a second time, relating
one concept to another. Through axial coding, the relationships
between concepts that form a conceptual model are developed.
Examples from the research data of open and axial coding are
included in Appendix A.
Grounded theory was selected because:
It is considered a rigorous method (Denzin, 1994),
compared with other qualitative research
techniques;
It is widely used in the social sciences (Denzin, 1994) and
in MIS research (e.g., Kaplan & Duchon, 1988);
It is well suited for building models (Strauss & Corbin,
1990), that reflect reality; and,
The use of the theoretical sensitivity technique enables
researchers to follow the line of study that appears
most important in the research setting.
Phase I Research Framework
Before entering the field to collect data, the researcher
documented the research framework guiding Phase I interviews 24
(Figure 8). At this point, the research design was not fully specified,
as is common in studies combining qualitative and quantitative
methods (Kaplan & Duchon, 1988).
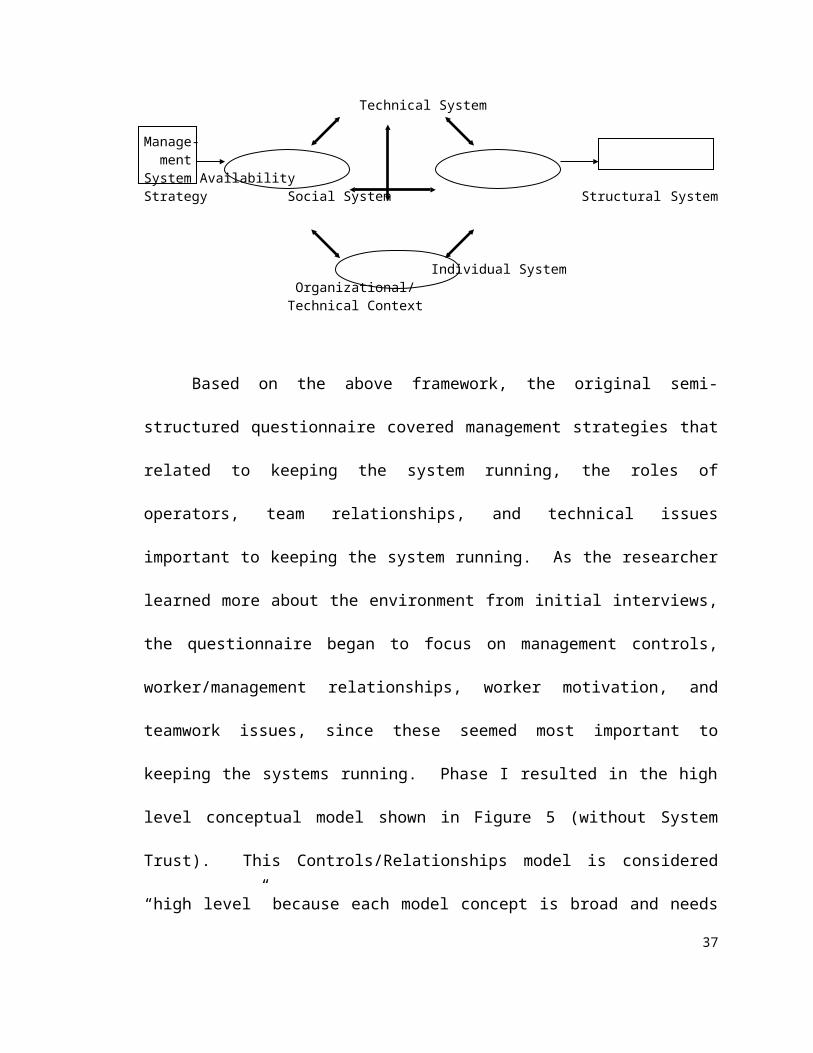
This framework assumes that the systems approach to understanding the complex
and interactive causes of computer failure is the most productive one (Lyytinen &
Hirschheim, 1987). In particular, several complex systems (sets of factors) interact in the
setting to produce the system availability1 results. To understand the interactive effects
of management strategies, the researcher used the framework shown in Figure 8, which
synthesizes the frameworks of Bostrom & Heinen (1977) and Orlikowski (1992). The
framework assumes that the effects of management strategies on system availability will
be mediated by the interacting systems shown. In particular, the effects of strategies are
translated into performance (i.e., system availability) by these systems’ processes and
interactive effects. The Technical System includes the computer system, its physical
environment, and the tools the operators use to run it. The Social System refers to the
informal interaction roles and relationships that exist among workers and management.
The Structural system means the formal aspects of organizations (e.g., official roles,
procedures, and official measurement/incentive systems). The Individual System is
comprised of the perceptions, traits, knowledge, and capabilities of people.
Figure 8 Phase I Research Framework
Technical System
1 ?For simplicity, availability is defined to be measured at the central computer site. Availability equals the total time possible (24 hours/day, 7 days/week) minus the summed duration of all computer site outages (planned or unplanned), divided by total time possible.
25
Manage- ment System AvailabilityStrategy Social System Structural System
Individual System Organizational/ Technical Context
Based on the above framework, the original semi-structured questionnaire
covered management strategies that related to keeping the system running, the roles of
operators, team relationships, and technical issues important to keeping the system
running. As the researcher learned more about the environment from initial interviews,
the questionnaire began to focus on management controls, worker/management
relationships, worker motivation, and teamwork issues, since these seemed most
important to keeping the systems running. Phase I resulted in the high level conceptual
model shown in Figure 5 (without System Trust). This Controls/Relationships model is
considered “high level” because each model concept is broad and needs further
specification before measurement can be done. For example, in the literature, the term
“Controls” can refer to many different things--from incentives to budgeting systems to
surveillance. Specifics on the creation of the conceptual and testable versions of Figure 5
are contained in later chapters.
PHASE II MODEL BUILDING AND TESTING METHODOLOGY
In general, Phase II refined the Controls/Relationships model by
decomposing it into measurable form. This was done by: a)
26

decomposing the high level concepts into measurable constructs,2
each associated with a questionnaire instrument, and b) developing
testable hypotheses, based on a combination of literature search and
qualitative analysis of the Phase I interviews. The reasons for
choosing the particular constructs is explained in the theory building
sections of Chapters Three through Six. Similarly, the JCM concepts
shown in Figure 3 were broken down according to the JCM literature.
The researcher telephoned one hundred operators for the phone
questionnaire. Eighty-six of the one hundred participated. Only
fourteen declined.
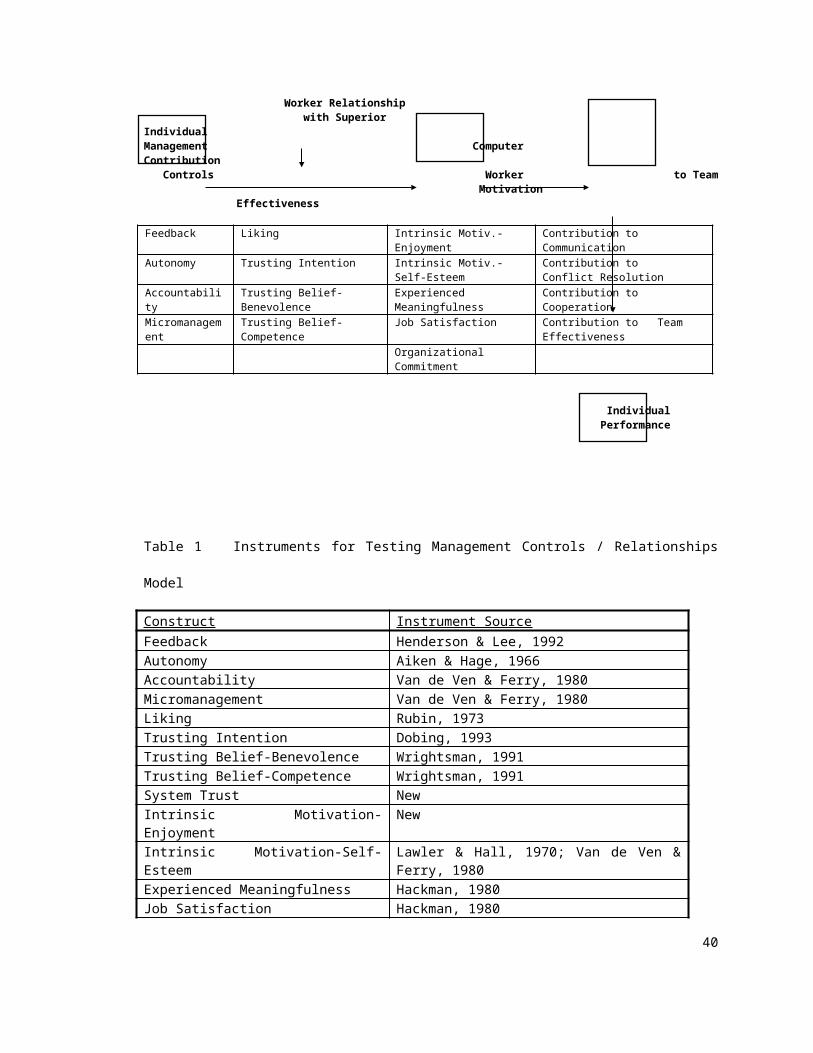
Measurable Constructs Used
This section describes how instruments were developed for
testing the hypotheses, which are presented in Chapters Three
through Six. First, midrange constructs were taken from the literature
to form constitutive parts of the high level concepts of Figure 5 (see
Figure 9). A questionnaire instrument was found for each construct,
generally adapted from existing instruments (see Table 1). Each
construct was measured with either three, four, or five items. Most
scales had seven points, from Strongly Agree to Strongly Disagree.
Two scales used five point scales because they were worded in terms
2 In general, the term “concept” refers to the high level entities (e.g., Motivation) comprised of several measured constructs (e.g., Intrinsic Motivation, Job Satisfaction). The term “construct” refers to measurable (mid-range) entities (Autonomy, Feedback, Trusting Intention,...).
27
of amount instead of agree/disagree. Final items and questionnaire
item order are shown in Appendix C for the operator questionnaire.
Figure 9 Management Controls / Relationships Model—Detailed Level
Worker Relationship with Superior Individual
Management Computer Contribution Controls Worker to Team
Motivation Effectiveness
Feedback Liking Intrinsic Motiv.-Enjoyment Contribution to CommunicationAutonomy Trusting Intention Intrinsic Motiv.-Self-Esteem Contribution to Conflict ResolutionAccountability Trusting Belief- Benevolence Experienced Meaningfulness Contribution to CooperationMicromanagement Trusting Belief-Competence Job Satisfaction Contribution to Team Effectiveness
Organizational Commitment
Individual Performance
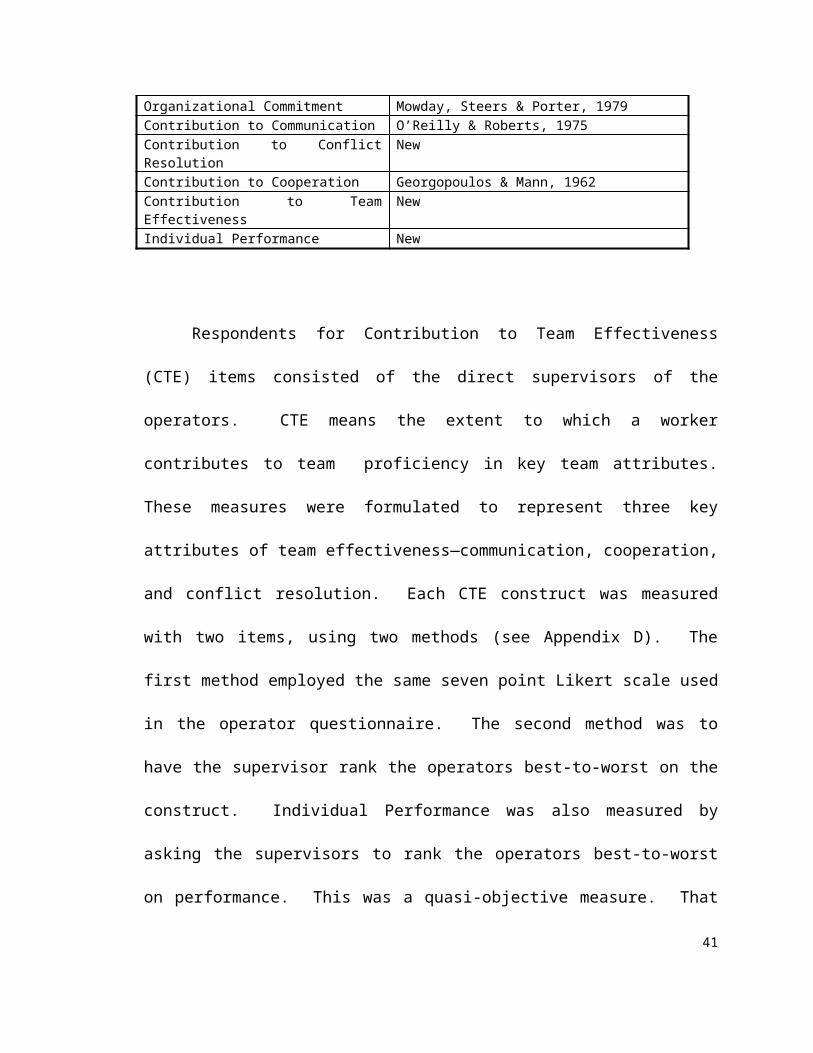
Table 1 Instruments for Testing Management Controls / Relationships Model
Construct Instrument SourceFeedback Henderson & Lee, 1992Autonomy Aiken & Hage, 1966Accountability Van de Ven & Ferry, 1980Micromanagement Van de Ven & Ferry, 1980Liking Rubin, 1973Trusting Intention Dobing, 1993Trusting Belief-Benevolence Wrightsman, 1991Trusting Belief-Competence Wrightsman, 1991System Trust NewIntrinsic Motivation-Enjoyment NewIntrinsic Motivation-Self-Esteem Lawler & Hall, 1970; Van de Ven & Ferry, 1980Experienced Meaningfulness Hackman, 1980Job Satisfaction Hackman, 1980Organizational Commitment Mowday, Steers & Porter, 1979Contribution to Communication O’Reilly & Roberts, 1975Contribution to Conflict Resolution NewContribution to Cooperation Georgopoulos & Mann, 1962Contribution to Team Effectiveness NewIndividual Performance New
28
Respondents for Contribution to Team Effectiveness (CTE) items
consisted of the direct supervisors of the operators. CTE means the
extent to which a worker contributes to team proficiency in key team
attributes. These measures were formulated to represent three key
attributes of team effectiveness—communication, cooperation, and
conflict resolution. Each CTE construct was measured with two items,
using two methods (see Appendix D). The first method employed the
same seven point Likert scale used in the operator questionnaire. The
second method was to have the supervisor rank the operators best-to-
worst on the construct. Individual Performance was also measured by
asking the supervisors to rank the operators best-to-worst on
performance. This was a quasi-objective measure. That is, the
supervisor was asked to give the report based on the group’s latest
official best-to-worst rankings. Supervisors with small groups reported
the ranking from memory. The others were heard accessing a ranking
file as they prepared to answer over the phone.
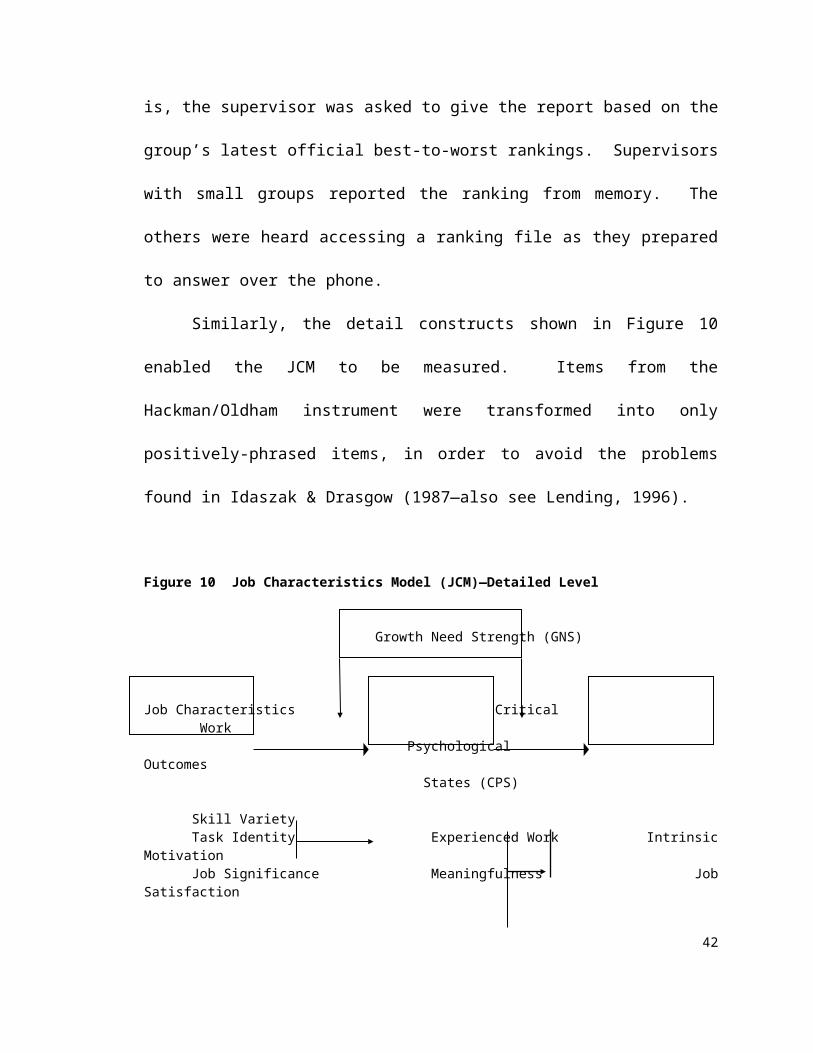
Similarly, the detail constructs shown in Figure 10 enabled the
JCM to be measured. Items from the Hackman/Oldham instrument
were transformed into only positively-phrased items, in order to avoid
the problems found in Idaszak & Drasgow (1987—also see Lending,
1996).
29
Figure 10 Job Characteristics Model (JCM)—Detailed Level
Growth Need Strength (GNS)
Job Characteristics Critical Work Psychological Outcomes
States (CPS)
Skill Variety Task Identity Experienced Work Intrinsic Motivation Job Significance Meaningfulness Job
Satisfaction Work Performance
Autonomy Felt Responsibility
Job Feedback Knowledge of Results
Instrument Pretest
This section describes how instruments were refined. In order
to assure that the instruments would provide reliable and valid
measures of the theoretical constructs, several pretests and a pilot
were conducted. The pretest entailed the following steps, based on
Davis (1989):
1. Created a document listing each construct’s definition and
items. The researcher and three faculty members successively
reviewed this document for face validity. Changes were made and the
document revised after each of the four reviews. Most changes were
wording items that clarified or simplified the items. For example, an
item that was found to address two ideas was simplified to only
address one idea. Since the Job Characteristics and Motivation 30
instruments had already undergone significant testing by others (e.g.,
see Lending, 1996; Mowday, Steers & Porter, 1979; Van de Ven &
Ferry, 1980), the next pretest steps concentrated on improving the
Controls and Relationships constructs.
2. Pretest instrument A was a matching instrument (Appendix E).
This instrument was given to four Ph. D. Students and one department
clerical person. Respondents were asked to match items to construct
names/definitions and then to point out which items (up to three
items) didn’t fit well with the definition. Pretest A was analyzed in
terms of the number of respondents who incorrectly categorized each
item. Respondent comments about which items didn’t fit were
quantified by assigning points to each of the items. A worst item
comment was given a 3, second worst item a 2, and third worst a 1.
An overall ranking of best-to-worst items was developed by equally
weighting the results of these two analyses. Those items within each
construct that had low rankings were reworded.
3. Pretest B was a categorization exercise (Appendix F). The two
Pretest B versions (one each for trust and control) were each
administered to forty-eight MBA students. Respondents were asked to
place sixteen statements into three to five categories by placing A, B,
C, D, or E next to the statement. At the bottom of the page,
respondents were asked to define each construct. The questionnaire
included improved directions versus the previous pretest, and asked 31
for the item numbers that were difficult to analyze. Pretest B was
analyzed for number of respondents correctly categorizing each item
and for the items identified as hard to categorize. Eighty-nine percent
of the Relationship items and seventy percent of the Controls items
were categorized correctly. The major problem with Controls was the
two negatively worded items that caused respondents to categorize in
terms of degree of control instead of type of control. These were
reworded positively. Several other changes were made based on
Pretest B.
4. Pretest C was drafted as an item sorting exercise. Forty-one
MBA students were given an envelope with fifteen slips of paper with
items on them--twenty-four respondents for trust constructs and
seventeen for control. The students were asked to sort the items into
three to five categories and then to tell what the categories mean
(Appendix G). The data were analyzed for difficult items and changes
to the instruments were made. The trust instruments (ninety-two
percent correctly classified) again did better than the controls
instruments (seventy-two percent correct).
5. After the instrument changes were made, the questions were
ordered by major topic (e.g., Job Characteristics) and by construct
within topic for the pilot. All items of a construct were asked together,
in order to improve internal consistency (Davis & Venkatesh, 1994). In
addition, a preface sentence introducing each construct was placed 32
before the first question in the series. For example, before the
Feedback questions, the interviewer said, “The next few questions relate to
supervisory feedback.” (see Appendix C for other examples). The
questionnaire mechanics were based on Dillman’s (1978)
recommendations. In particular, respondents were first asked whether
they agreed with, disagreed with, or were neutral toward, the
statement; then they were asked whether they (dis)agreed strongly,
moderately, or slightly. This technique enabled use of a seven point
scale without producing cognitive overload among respondents
(Appendix C).
The questionnaire was done by telephone because telephone
interviews, per Dillman (1978):
have high response rates, both for individual items and the
entire instrument;
allow the researcher to control fully the sequence of questions;
are less expensive to conduct than face-to-face interviews;
are almost unlimited in terms of the number of items one may
ask;
facilitate transitions that indicate when a new construct is
being covered;
enable researchers to gauge the feelings of the respondents;
provide less social desirability bias than face-to-face
interviews, and about the 33
same as written questionnaires;
facilitate use of open-ended questions.
Because social desirability was still considered a possible validity
threat, the researcher included in the questionnaire’s introduction
assurances that: a) there were no right or wrong answers to the
questionnaire; b) he was not an agent of management; and c) the
respondents’ answers would not be shared with anyone else (see
Appendix C).
Instrument Pilot
The pilot consisted of administering the revised pretest
instruments in full telephone questionnaire form to ten computer
troubleshooters in another company (not the research site). The pilot
group consisted of troubleshooters organized into a self-directed
team. These troubleshooters were not actually computer operators,
but were the technical support people for a number of software
products. When customers called the help desk with difficult software
problems, debugging tasks were assigned to these troubleshooters.
Hence, their job functions were somewhat similar to those of the
operators at the research site, providing a realistic pilot test for the
instruments. The researcher made notes of respondent difficulties
with, or comments about, the individual items. For example, if the
respondent paused before answering, the researcher wrote “pause”
by the question. These notes were then analyzed to identify items 34
needing rework. To further identify rework items, those items were
identified whose average score varied the most from the average of
all item scores for the construct. Reliability analysis of each construct
also identified rework items. Table 2 displays reliability results from
the pilot.
From the pilot, a number of changes were made. First, several
items were reworded slightly (e.g., in Job Significance, Task Identity).
Second, since respondents seemed to have trouble with the first set of
questions of the questionnaire (i.e., Job Significance was the first set in
the Job Characteristics series), the researcher placed the most reliable
Job Characteristics construct (Skill Variety) at the beginning of the
questionnaire. Third, items were substituted in some instruments
(e.g., Accountability), in order to improve reliability. The instrument
was administered to eighty-six computer operators at the research
site.
Table 2 Pilot Reliability Analysis
ConstructCronbach’s Alpha
Liking .95Trusting Belief-Benevolence .92Trusting Belief-Competence .99Trusting Intention .99System Trust .60Feedback .87Autonomy .74Accountability .66
35
Skill Variety .72Job Significance .14Task Identity .48Job Feedback .98Experienced Meaningfulness .60Knowledge of Results .81Felt Responsibility .66Job Satisfaction .63Growth Need Strength .60Organizational Commitment .78Intrinsic Motivation-Self-Esteem
.79
Intrinsic Motivation-Enjoyment
.93
CONSTRUCT VALIDATION RESULTS
The psychometric tests consisted of internal consistency
reliability and simple construct validity tests on the data from the
eighty-six questionnaires. Nomological validity was done for the trust
constructs and mono-method bias was tested for the Autonomy
construct.
Reliability. Cronbach’s alpha (Cronbach, 1951) was used as
the indicator of internal consistency reliability. Reliability refers to the
ratio of “true” variance to total variance in a set of measures obtained
from a respondent (Schwab, 1980). True variance means systematic,
error-free variance. While the true variance can’t be calculated, it
can be estimated by assuming that the available items are a random
sample of a population of items that would give a true measure of the
variable if all the items were answered (Cronbach, 1951). Reliability is 36
a necessary, but not a sufficient, condition for construct validity. This
is because unreliable measures cannot be depended upon to
consistently reflect the same conceptual meaning. Table 3 shows that
nearly all the constructs were unidimensional at, or almost at, the 0.70
level generally endorsed (Nunnally, 1978).
Only Job Significance and Growth Need Strength (GNS) did not
come close to 0.70. Both constructs appeared to have reached a
ceiling effect, with very low variances. On seven point scales, GNS
and Job Significance items had average means of 6.82 and 6.77,
respectively. Their standard deviations were 0.36 and 0.45. Most
other constructs had standard deviations above 1.0. Because of these
high means and low standard deviations, the researcher decided to
use GNS and Job Significance as unitary constructs, even though their
internal consistency score was low. Descriptive statistics for all
constructs are shown in Appendix I.
Table 3 Construct Level Cronbach’s Alpha Reliabilities (n=86 research site respondents; number of items in parentheses
CONTROLS: AlphaJOB CHARACTERISTICS: (not included elsewhere) Alph
aAutonomy Granted (4 items) 0.79 Skill Variety (3 items) 0.67Micro Management (4) 0.85 Job Significance (3*) 0.62Feedback (4) 0.98 Task Identity (3) 0.77Job Accountability (2*) 0.69 Job Feedback (3) 0.85
Knowledge of Results (3) 0.92RELATIONSHIPS: Growth Need Strength (3) 0.44Liking (4 items) 0.94 Felt Responsibility (3) 0.73Trusting Intention (4) 0.99Trusting Belief--Benevolence (4) 0.97 CONTRIBUTION TO TEAM
37
EFFECTIVENESS:**Trusting Belief--Competence (3*) 0.95 Contrib. to Overall Team Effectiveness
(2)0.70
Contrib. to Coordination Effectiveness (2) 0.71MOTIVATION: Contrib. to Communication Effectivns.
(2)0.68
Experienced Meaningfulness (3*) 0.92 Contrib. to Conflict Resolution (2) 0.67Organizational Commitment (4) 0.84Intrinsic Motivation--Enjoyment (4) 0.92 OTHER TRUST-RELATED:Intrinsic Motivation--Self-Esteem (4) 0.77 System Trust (4) 0.94Job Satisfaction (3*) 0.86 Dispositional Trust (3) 0.91
*Questionnaire contained additional items that did not highly correlate with items in the constructs shown.**Note: These alphas are probably deflated because two different methods were used to collect them.
Construct Validity. Adequate construct validity means that
the measures of a variable correspond closely to the conceptual
meaning of the variable (Schwab, 1980). Construct validity addresses
“the approximate validity with which we can make generalizations
about higher-order constructs from research operations” (Cook &
Campbell, 1979: 38). This is important because no true implications
can be drawn at the construct level from measures that do not
adequately represent the meaning of the construct. Reliability is
generally considered a necessary, but not sufficient, condition for
construct validity. Further evidence is required, in terms of
convergent and discriminant validity. Convergent validity means the
extent to which responses from different measurements of the same
construct are highly correlated (Schwab, 1980). Discriminant validity
means the extent to which a construct is distinct from other
constructs. Therefore, discriminant validity means one construct’s 38
measurements should be distinct from measurements of other
constructs.
Convergent and discriminant construct validity were
demonstrated by pairwise intercorrelation matrices of constructs
within each high level concept (Appendix H). For example, the first
pair contrasts correlations within and between Autonomy and
Micromanagement, two Controls constructs. The intra-construct
correlations are consistently higher than the correlations between
constructs. Appendix H reports the intra- and inter-correlation
averages, and highlights intercorrelations that exceed the smallest
intra-construct correlation. This analysis was done to show, in the
simplest possible fashion, how the constructs hold together internally
while being distinguished from similar constructs, much as a factor
analysis would do. This method was chosen over factor analysis
because factor analysis is based on correlation analysis, but uses
somewhat arbitrary cut-off values that may obscure what the actual
correlations indicate. These results show that each construct is
internally cohesive (convergent validity) and differs from similar
constructs (discriminant validity). This is a strong test of discriminant
validity, since one would expect high correlations among four different
types of Motivation, for example.
Of the Controls constructs, only Accountability shows construct
validity problems (see bold highlighting of items in Appendix H). 39
However, when item 4 is removed, the construct demonstrated
discriminant validity. For hypothesis testing, the researcher dropped
item 4 and treated Accountability as a two item construct.3 The
resulting reliability improved from 0.65 to 0.69 when this was done.
Among the Relationship constructs, Liking, Trusting Intention, and
Trusting Belief-Benevolence had high intercorrelations with each
other. However, the average intracorrelations were consistently
higher than the average inter-correlations, providing evidence that
these constructs can be distinguished. These constructs were also
kept separate at this point because of the theoretical basis for treating
them as separate constructs (McKnight & Chervany, 1996; McKnight,
Cummings & Chervany, 1996). The intercorrelation matrices for the
Motivation and Job Characteristics constructs provide significant
evidence that these are unitary constructs.
Nomological Validity. Because System Trust is a new
operationalization and the other trust constructs are re-formulations,
nomological validity of these constructs was analyzed. Nomological
validity means that one assesses (theoretically and empirically) the
relationships between a construct and other constructs (Schwab,
1980). Hence, nomological validity is also tested in later chapters,
when the hypotheses are tested. In this chapter, the researcher
3 Item two had already been removed in pilot testing.40
looked at nomological validity in terms of the relationships among
System Trust and other trust-related variables.
McKnight & Chervany (1996) and McKnight, Cummings &
Chervany (1997) hypothesized the relationships among trust variables
shown in Figure 11. This theory has not previously been tested, so all
the links are tentative. Trusting Belief-Benevolence and Trusting
Belief-Competence were selected for this study because of their
importance to the trust literature in general (e.g., Barber, 1983;
Mayer, Davis & Schoorman, 1995) and the technical worker
specifically (Crozier, 1964).
Figure 11 Nomological Network for Trust Constructs
Other empirical work has shown that Trusting Beliefs are related
to Trusting Intention (e.g., Dobing, 1993). Tests of the links from
Dispositional Trust have had mixed results (e.g., Johnson-George &
Swap, 1982), so these are shown as weak links using dotted lines. In
addition to the relationships shown in Figure 11, Liking should be
Trusting Intention System Trust
Dispositional Trust
Trusting Belief-- Benevolence
Trusting Belief-- Competence
41
highly related with the Trusting Beliefs and Trusting Intention, but less
highly related with System- and Dispositional Trust (since the latter
are not social constructs). Liking was selected because it has
traditionally been an important interpersonal variable that generalizes
much of the emotional tie one person has for another (Rubin, 1973).
Table 4 shows the correlations among these variables.
Table 4 Intercorrelations of Trust Constructs and Liking(correlation / [significance])
Trusting Intention
Trusting Belief-Benevolence
Trusting Belief-Competence
System Trust
Dispositional Trust
Liking
Trusting Intention
1.0
Trusting Belief-Benevolence
.85/[.000]
1.0
Trusting Belief-Competence
.75/[.000]
.79/[.000] 1.0
System Trust
.51/[.000]
.59/[.000] .42/[.000] 1.0
Dispositional Trust
.18/[.049]
.05/[.340] .04/[.345] .16/[.066]
1.0
Liking .82/[.000]
.80/[.000] .83/[.000] .42/[.000]
.15/[.087] 1.0
In general, the results support nomological validity. System
Trust and the Trusting Beliefs are highly correlated with Trusting
Intention, as expected. Dispositional Trust is correlated with System 42
Trust at p=.066. However, instead of being related with Trusting
Beliefs, Dispositional Trust is related directly (at p=.049) to Trusting
Intention. This is a little surprising, and indicates that Dispositional
Trust can be a determinant of one’s willingness to depend on the
other party (Trusting Intention) irrespective of one’s Trusting Beliefs in
that party.
The relationships between Liking and the trust constructs are as
expected, in that Liking is highly related to the Trusting Beliefs and
Trusting Intention, but very little related with Dispositional Trust.
However, the fact that Liking is significantly related with System Trust
indicates that the study’s operationalization of System Trust ties it
more closely to feelings about one’s supervisor than the theory
projects. This is probably because System Trust was operationalized
to represent structures supporting fairness in one’s environment, and
the supervisor is one of the prime administrators of fairness in the
work environment. The high correlations between System Trust and
the Trusting Beliefs constructs may be explained in the same way. So
while the theoretical System Trust variable is quite impersonal, the
operationalization of it is quite closely related with operator feelings
regarding their supervisor. Note that System Trust does not equate to
fairness or equity, such as constructs in the organizational justice
literature (e.g., Greenberg, 1993), but is the belief that the workplace
has features that encourage fairness.43
Mono-method bias. For purposes of this study, mono-method
bias refers to the use of a single informant type: the CSO or the
supervisor. Though mono-method bias has been pointed out as a
potential problem with JCM research (Roberts & Glick, 1981), most
researchers have accepted it as a given, since employees are the best
informants of their own beliefs and feelings about their own job
characteristics and related motivation. Although this argument has
significant merit, the laissez-faire approach of accepting it fully is not
completely satisfying. Thus, two separate efforts addressed mono-
method bias in the study. First, the Contribution to Team
Effectiveness and Individual Performance dependent variables used
supervisors as informants, while the JCM, Controls, Relationships,
System Trust, and Motivation variables had CSOs as informants. This
means that tests of links between constructs gathered from these two
different sources constituted stronger tests. However, it also means
that tests of links within informant constituted relatively weaker tests.
The relative weakness or strength of these tests is demonstrated by
the very high correlation (see Chapter Four) between the supervisor
variables Contribution to Team Effectiveness and Individual
Performance versus the weak correlation between CSO-informed
variables and Individual Performance. This result emphasizes the
large difference a different informant can make. But it leaves
unanswered the question of which informant’s view is most correct.44
Second, the researcher tested the results when one variable
(Autonomy) was measured with both methods. Table 5 displays a
variation of the Campbell & Fiske (1959) multitrait-multimethod
analysis (cf. Henderson & Lee, 1992). The informant is represented as
a method, while the item is represented as a trait. Note that the
correlations within methods (in bold) are generally higher than the
correlations between methods. Average correlations are also shown,
as in the pairwise matrices of Appendix H. From Table 5, the two
methods appear to be related (based on the cross-correlations), but
also appear to be somewhat separate constructs from each other
(based on higher within-method correlations). Exploring further, we
did Cronbach’s Alpha measures for each of the methods separately,
and one that joined them. The result was that joining them raised the
alpha from .75 (Supervisor informant) or .79 (CSO informant) to .80
(combined). Since joining the constructs together as one did not
degrade internal consistency, they are probably not two distinct
constructs. The average intercorrelation of Table 5 items overall
is .41. This is a significant correlation, and is higher than the average
correlation among Motivation constructs (.36), which was treated as
one second order construct. Based on this analysis, the Autonomy
items from both informants could effectively form one construct.
Table 5: Mono-Trait, Mono-Method Analysis for Autonomy
45
(Methods) Method 1: Supervisor
Report
Method 2:Operator Report
(Traits)
Item 1 Item 2 Item 1
Item 2 Item 3 Item 4
Method 1: Item 1
1.00 Means:
Supervr.
Operator
Cross
Supervisor Report
Item 2
.65 1.00 .65 .55 .29
OverallMethod 2: Item
1.14 .23 1.00 .41
Operator Item 2
.26 .36 .74 1.00
Report Item 3
.30 .25 .41 .60 1.00
Item 4
.42 .32 .39 .51 .62 1.00
A look at the wording used for each informant (Appendix B)
revealed that the Supervisor question was worded in more general
terms than were the Operator questions. Each of the four Operator
questions was worded specifically and differed slightly from each
other. The differences between these constructs is also accentuated
in that while the Operator measure of Autonomy used a seven-point
agree/disagree/neutral format only, the Supervisor measure used both
the seven-point scale and a one-to-N ranking of the employee against
all other employees in the supervisor group (see Appendix B, B.
Questions Asked Supervisors). These wording and scaling differences
probably accentuate the level of overall method bias that exists.
46
Since CTE and Individual Performance used the same informant
as the Supervisor-reported Autonomy construct, a correlation was run
among these constructs and Operator-reported Autonomy, in order to
isolate how much difference the informant method would make to the
correlation. Table 6 shows the result. Supervisor-reported Autonomy
was correlated with CTE and Individual Performance almost as
strongly (.72, .79) as CTE and Performance are with each other (.84),
while CSO-reported Autonomy was only correlated with CTE at .37 and
Individual Performance at .30. Similarly (Table 7), Operator-reported
Autonomy was correlated with other (Operator-reported) job
characteristics and CPS variables at an average of r = .20, while
Supervisor-reported Autonomy was correlated with the same job
characteristics and CPS variables at only an average of r =.10. So the
autonomy construct was, on average, twice as highly correlated with
the JCM variable if it had the same informant as the JCM variable. This
is another indication that some level of method bias exists, and needs
to be addressed in future research of this kind. To see if using the
combined Autonomy variable mattered to the prediction of Motivation,
the six items were merged into one variable. Combined Autonomy
only correlated with Motivation at r = .069, which means combined
Autonomy did not predict Motivation any better than did CSO-reported
Autonomy (see Chapter Six).
47
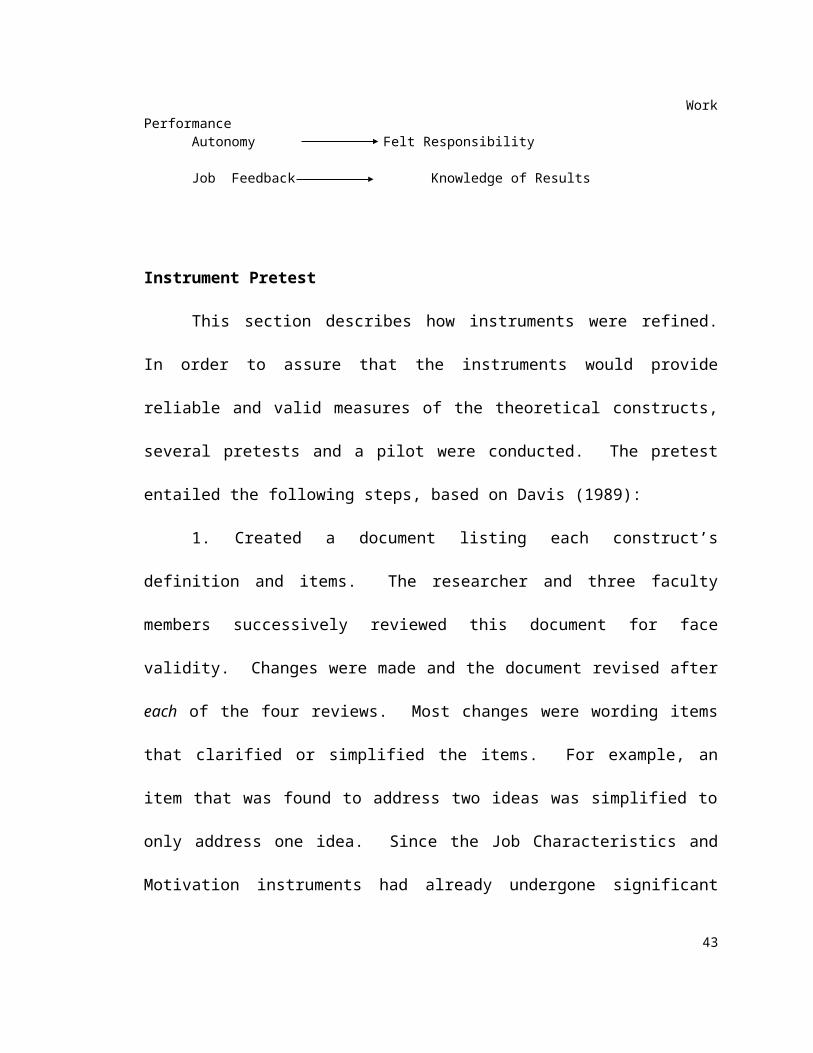
Table 6 Correlations among CTE, Performance, and Two Autonomy Types
Supv-reported
AutonomyCSO-
reported Autonomy
Contribution to Team
EffectivenessIndividual
Performance
Supv-reported Autonomy
1.00
CSO-reported Autonomy
.40 1.00
Contribution to Team
Effectiveness
.72 .37 1.00
Individual Performance
.79 .30 .84 1.00
Table 7 Correlations among JCM Variables and Two
Autonomy Types
(CSO-reported) JCM variables
Supv-reported Autonomy
CSO-reported Autonomy
Job Significance -.03 -.03Job Identity -.01 .33Job Feedback .16 .35Skill Variety .22 .16Experienced Meaningfulness
-.05 .00
Knowledge of Results .14 .32 |Mean| = .10 |Mean| = .20
In summary, mono-method (common informant) bias is a
concern that was addressed for equations predicting CTE and
Performance, but only partly tested for equations predicting
Motivation, CPS, and Work Outcomes. The testing of Autonomy for
mono-method bias revealed some differences between methods. 48
Overall, however, the items from the two methods can be successfully
merged into a single construct, lending confidence to the results of
this study. Just as important, this study was more concerned with the
operator’s own perceptions of their JCM, Motivation, Relationships, and
System Trust constructs. It is highly doubtful that the supervisor can
accurately report on what the operator perceives and feels about
these constructs. Hence, for the purposes of this study, the CSO-
reported data was justifiably used for these constructs.
First-Order versus Second-Order Concept Formation.
Once the reliability and validity of the constructs were tested, the
items were summed to their respective constructs. Because the
Figures 3 and 5 models are shown at two levels—second-order
(concept) level (e.g., Controls) and the first-order (construct) level that
defines the concept operationally (e.g., Feedback, Autonomy)--the
researcher needed to determine at which level to test the model. An
analysis was performed similar to that done to analyze second order
factor models (e.g., Hunter & Gerbing, 1982; Kumar & Dillon, 1990). It
was decided that those concepts (e.g., Controls) whose construct
components (e.g., Feedback, Autonomy, Accountability, and
Micromanagement) were internally consistent and had convergent
validity as a set would be tested at the second-order (concept) level.
This was judged by performing reliability and intercorrelation matrix
analyses on the constructs within each high level category. The first 49
rule for use of the second-order concept was for the concepts to be
internally consistent at the Cronbach’s alpha .70 level, just as for
the operational constructs. For this test, each construct was treated
like an item and a reliability analysis was performed (see Table 8) for
the set of constructs. The second rule was for the concepts to display
the same kind of convergent and discriminant validity among similar
concepts as was demonstrated in Appendix H for items. For this test,
Appendix J displays the intercorrelation matrix analysis. The reliability
analysis demonstrated adequate support for treating Relationships,
Motivation and Contribution to Team Effectiveness as unitary
constructs, with alphas of .94, .73, and .97, respectively. By
comparing internal to cross-correlations, Appendix J shows that
Relationships, Motivation and Contribution to Team Effectiveness are
internally cohesive and separate from the other concepts. In contrast,
based on the same intercorrelation analysis, Controls, Job
Characteristics, Critical Psychological States, and Work Outcomes are
not unitary. Further they had alphas of .52, .44, .48, and .22,
respectively. Hence, the researcher chose to test hypotheses using
Relationships, Motivation and CTE as unitary concepts, while Controls,
Job Characteristics, CPS, and Work Outcomes were tested at the
construct level.
HYPOTHESIS TESTING METHODOLOGY
50
To test the hypotheses, correlation and regression analyses
were done, using SPSS. In some cases, qualitative analysis
supplemented the correlational analyses, as detailed in Chapters 3-6.
The model relationships were tested with regression. The coefficient
beta used by regression gives a clear interpretation of the magnitude
of the effect of each independent variable on the dependent variable.
All hypotheses are stated and tested at the individual operator level of
analysis. Specific hypothesis testing techniques will be discussed in
detail in succeeding chapters.
Table 8 Reliabilities for High Level (Second Order) Concepts(N=86)
Model Concepts # Items Alpha Item IntercorrelationControls4 4 .52 .31
.35 .12
.18 .24 .37Relationships5 4 .94 .82
.80 .85
.83 .75 .79Motivation6 5 .73 .22
.49 .44
.32 .22 .41
.51 .47 .34 .17Contribution to Team Effectiveness7
4 .97 .86.85 .85.90 .92 .86
Job Characteristics8 5 .44 .16 .45 -.09-.15 .14 .09 .16 -.03 .35 .33
Critical Psychological States9 3 .48 .40
4 Controls = Autonomy, Feedback, Accountability, and Micromanagement5 Relationships = Liking, Trusting Intention, Trusting Belief-Benevolence, Trusting Belief-Competence6 Motivation = Experienced Work Meaningfulness, Organizational Commitment, Intrinsic Motivation-Enjoyment, Intrinsic Motivation-Self-Esteem, Job Satisfaction7 Contribution to Team Effectiveness = Contribution to Team Coordination Effectiveness, Contribution to Communication, Contribution to Conflict Resolution, Contribution to Overall Team Effectiveness8 Job Characteristics = Skill Variety, Job Significance, Job Feedback, Job Identity, Autonomy
51
.24 .34
Work Outcomes10 3 .22 .10.17 .12
In general, the hypotheses in this study were tested at the alpha
= .05 level. This level is appropriate for three reasons. First, this is a
field study, not a controlled experiment. Because of the complexity of
things happening in a field setting, links between variables will be
harder to find than in an experiment, in which alpha = .01 may be
appropriate. Second, this study covers virgin conceptual territory
through new, and sometimes speculative, hypotheses. Third, the use
of an alpha of .01 or .001, while decreasing the chance of a Type I
error, severely increases the chance of a Type II error. That is, using a
very small alpha decreases the chance that researchers will think they
have found an effect when they didn’t (Type I error). But it greatly
increases the chance that one will think there is no effect when there
really is one (Type II error), per Cohen (1988), who recommends a
moderate choice of alpha for significance testing. Cohen illustrated
this using an alpha of .001 for a given scenario. In Cohen’s scenario,
the .001 significance level for Type I errors implied that the Type II
rate is .90. The ratio of importance between the two is .90 divided
by .001, or 900 to one. Hence, this assumes that “mistakenly
rejecting the null hypothesis…is 900 times more serious than 9 Critical Psychological States = Experienced Work Meaningfulness, Felt Responsibility, Knowledge of Results10 Work Outcomes = Job Satisfaction, Individual Performance, Intrinsic Motivation-Self-Esteem
52
mistakenly accepting it” (Cohen, 1988: 5). Cohen gave a more
moderate scenario that used an alpha of .05, in which the ratio
was .20 divided by .05, or four to one. Using alpha = .05 reflects this
Type II moderation while still providing a challenging alpha for study
of new phenomena in a field setting.
Regression analysis assumes that multicollinearity and non-
constant variance are not present (Neter, Wasserman & Kutner, 1990).
Multi-collinearity of the independent variables was checked for each
regression using the variance inflation factor (VIF) statistic in SPSS.
The few regressions found to have multi-collinearity are reported in
the Results sections of Chapters Three through Six. Non-constant
variance was analyzed through a test devised by Weisberg (1985).
None of the study’s equations had the problem of non-constant
variance. These tests provided evidence that the regression
assumptions were met.
To test the model’s moderation structure, regression was used
as outlined by Baron & Kenny (1986). For moderation
(X=independent variable, Y=dependent variable, Z=moderator
variable), the study assumes linear effects of X on Y. So Y is regressed
on X, Z and XZ. Moderator effects were considered to be indicated if
XZ is significant while X and Z are controlled. The interaction terms
were created by multiplying standardized terms together, as
53
recommended by Aiken & West (1991), in order to minimize
multicollinearity.
Because moderation effects are much more difficult to
demonstrate for field data than for laboratory data (McClelland & Judd,
1993), an additional moderation analysis was done for the
Management Controls / Relationships model. The data were split into
two groups reflecting respondents with high- and low-Relationships
scores. For example, in the high Relationships conditions, a means
test was performed to see whether Motivation was higher or lower for
those in low or high Controls (e.g., Autonomy) groups. Two-by-two
tables were constructed to show the Motivation means under the four
Relationships (HI-LO) and Controls (HI-LO) conditions. An interaction
was considered to have taken place when, under conditions of HI
Relationships, the effect of Controls was high; yet under conditions of
LO Relationships, the effects of Controls was low. If the effects of
Controls did not significantly differ under the two Relationships levels,
then there was no interaction.
Cook & Campbell (1979) said that researchers who eliminate
plausible alternatives to the constructs in their model increase the
likelihood that they have found a valid relationship among constructs
(‘internal validity’). To improve confidence in the internal validity of
this study’s findings, a number of plausible alternatives were added to
the models tested to see if they added predictive power. These 54
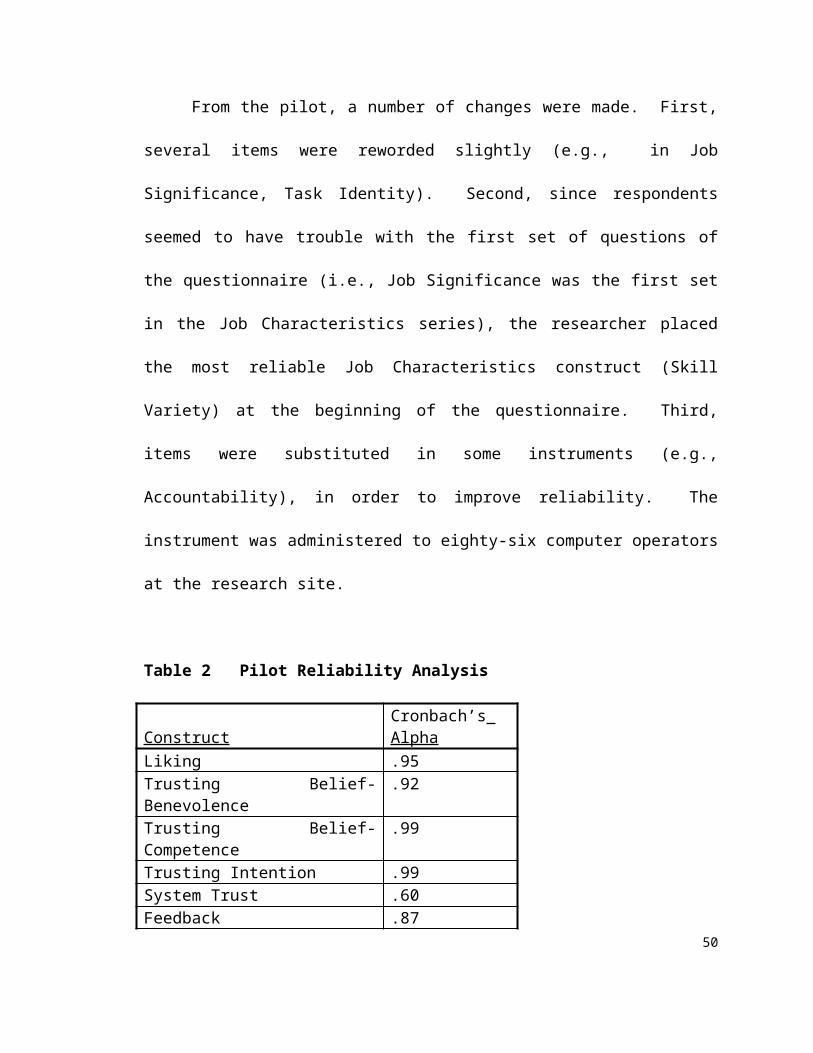
included the normal demographic variables (e.g., age, gender, and
education) and several others suited as alternatives to the constructs
used in the study (see Appendix B). These were entered into the JCM-
and Management Controls-related models to see if they improved the
models’ prediction of the motivation-related dependent variables.
RESEARCH SITE FOR THE STUDY
This study intensively researches one field site, because:
the literature lacks a reasonably complete understanding
of the critical computer systems phenomenon;
understanding the detailed context in which the operator
phenomenon exists will improve whatever
knowledge exists of how the phenomenon really
works (Kaplan & Duchon, 1988; Lending, 1996; Van
Maanen, 1979b);
logically, a more complete understanding would have the
effect of generating more--and better focused--
research; and, therefore,
studying a single site intensively would enable this
deeper level of initial understanding (Mintzberg,
1979), laying a firmer foundation for future research.
A general description of the research site is presented below.
The details of the research site are discussed throughout Chapters 3-6
55
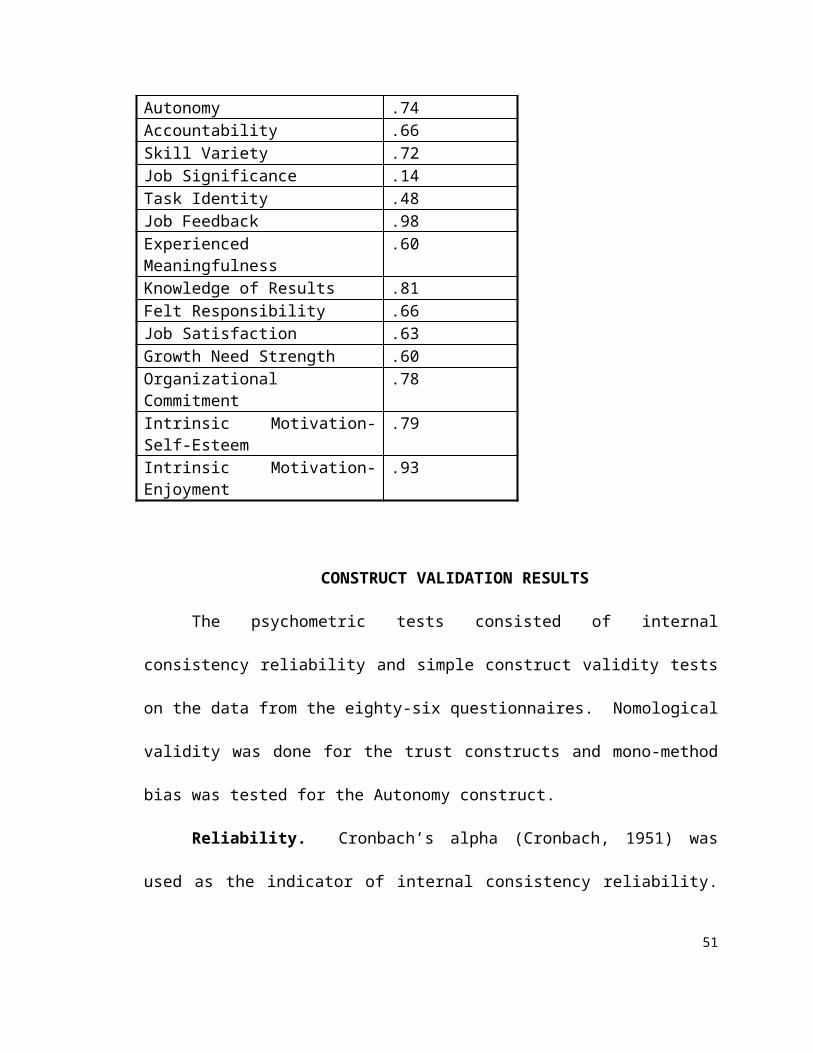
in order both to provide a context for the study and to support
hypotheses.
The description of the research site supplied vital data about the
context in which the critical systems phenomenon takes place, aiding
the researcher in asking the right questions. Lending (1996), for
example, found that the organizational context was important in her
study of systems analyst use of CASE tools. The organizational
context can be a major factor in how work is accomplished. For
example, in stressful jobs like nuclear plant operation or air traffic
control, the context can influence individual worker ability to
accomplish the work (Mowday & Sutton, 1993). Context is also
important because questionnaire data can best be understood in light
of the specific environment of the organization (Mintzberg, 1979). The
contextual environment includes both the nature of the tasks done by
the workers and the manner in which the company is run by
management. It also includes the workers’ norms and customs and
assumptions. Because time was limited, the researcher did not do a
complete ethnographic study. Therefore, the description of these
environmental factors is incomplete. The site description effort was
guided by Barley (1990), Denzin (1978, 1989), Lincoln & Guba (1985),
Lofland (1971), Sanjek (1990), and Van Maanen (1979a,b).
The research site studied was the computer operations
department (comprised of approximately 100 hardware and software 56
operators and their nine supervisors), which operates a large host
computer system in a firm to be called XYZCo. “Host” computer
system means that thousands of workers throughout XYZCo’s industry
continually use the system for daily business transactions--not just
employees within the host system’s parent corporation. XYZCo
employees take pride in the high level of system availability--better
than 99.9% up-time at the computer site. The operations department
also operates several other smaller systems. The largest of these is
the test/development system, used by the company to test new and
modified applications software, most of which is developed in-house.
Finally, one subgroup within the organization operates another
company’s system. Those who support the main system are
separated into hardware and software groups. Hardware operators
are assigned to a single shift, but the software operators for the
largest of the systems rotate among the three shifts. This means that
the set of people watching for system problems on a given shift differs
from day to day. Specific duties (e.g., watching monitors, handling
utilities) are also shifted among hardware and software operators on a
given shift. But hardware operators do not handle software duties,
and software operators do not handle hardware duties.
Because the system is used internationally, operators try to
keep the system fully available not only on first shift, but also during
second and third shifts. Over the past ten or fifteen years, system 57
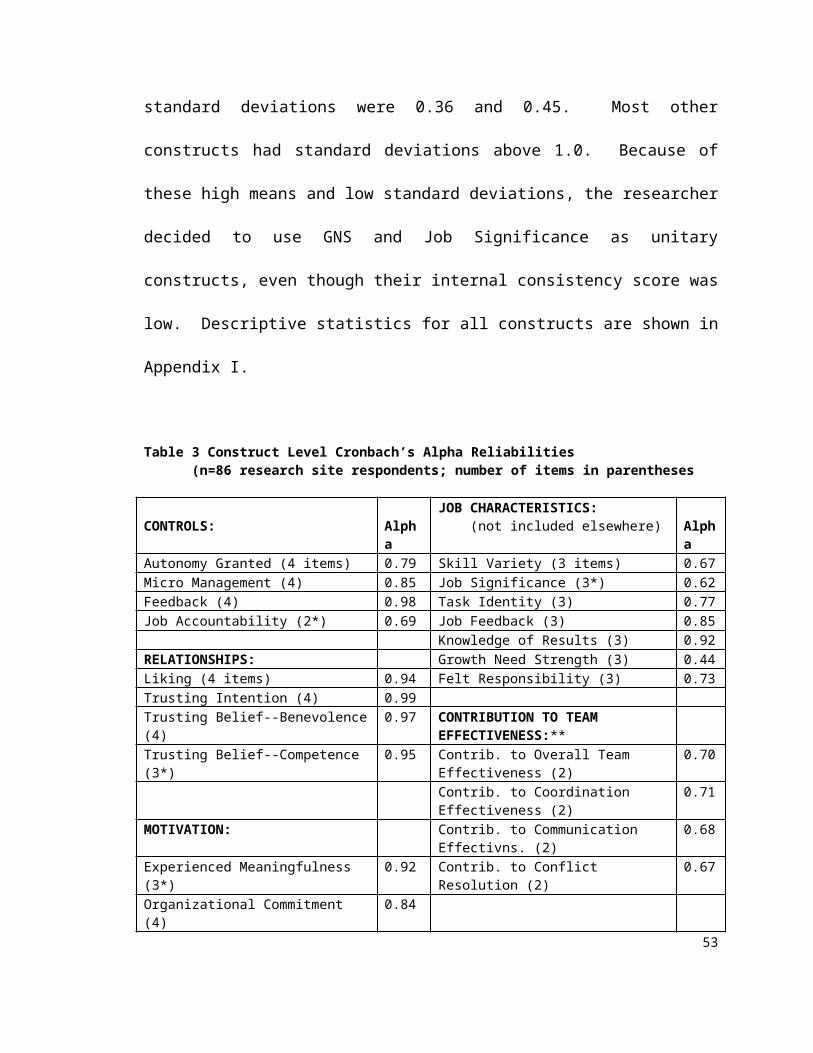
unavailability due to scheduled maintenance (on second or third shift)
has been greatly reduced. Unavailability due to system outages has
also been significantly reduced. Nearly every year for the past ten
years, the average system availability has improved over the prior
year.
XYZCo is very customer-conscious; it tries to please every user
of the system. Hence, the operators take pride in their role in keeping
the system available. The computer division of XYZCo incorporated
Total Quality Management practices in 1991. A quality improvement
team meets after each operator-caused outage to analyze the root
causes of the outage and to discuss what can be done to prevent this
type of outage from happening again.
XYZCo has traditionally provided operators a favorable
workplace. CSOs have typically stayed in their positions for many
years. Some have transferred due to promotions or lateral
opportunities, both of which have been adequate or even plentiful.
During Phase I, the researcher noted a (then) recent
management decision to automate many of the hardware operator
functions. The researcher expected this action to increase the level of
job insecurity among hardware operators. In addition, a new
management incentive system was installed as Phase I began that
encouraged stricter cost controls by management. The incentive
system provided operators financial bonuses, which had previously 58
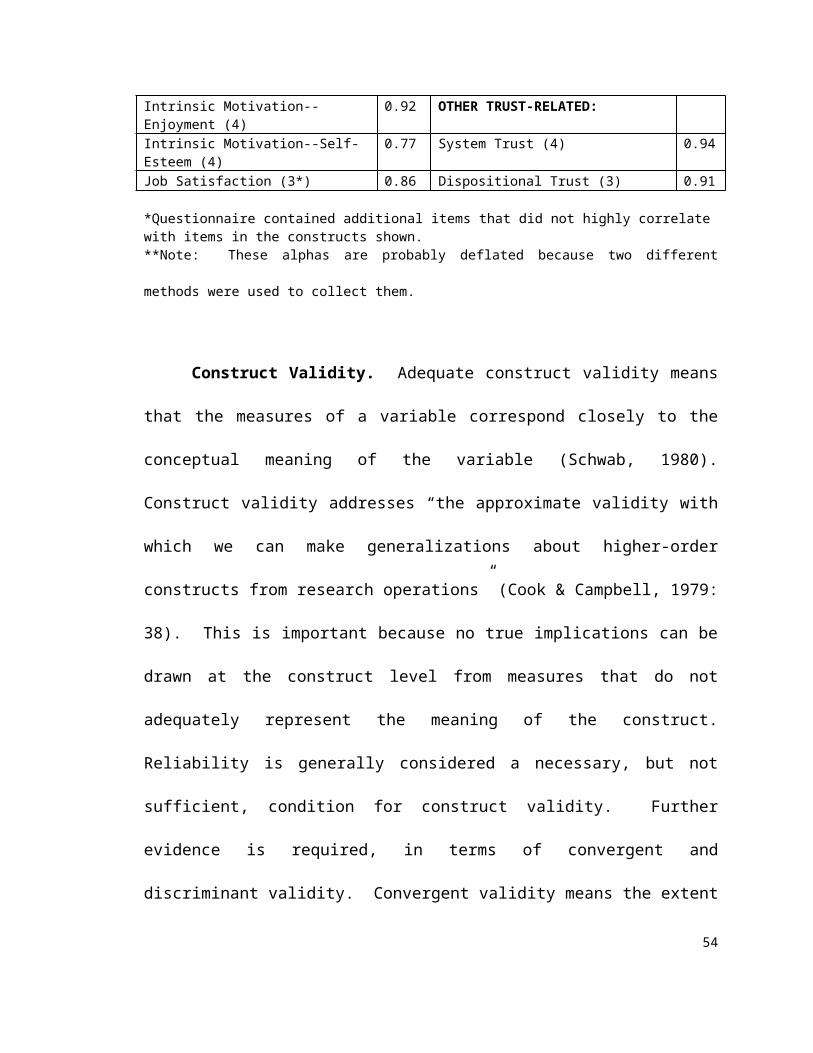
only been provided to managers. The awarding of these bonuses was
contingent upon the profitability of the overall organization.
The role of the critical system operator (CSO) is interesting and
challenging. Depending on the situation, the CSO plays three primary
roles, which resemble the roles of a detective, a doctor and a fire
fighter. In the detective role, the CSO monitors the computer system,
proactively looking for problems that could potentially harm the
system. In this role, the CSO uses both the system’s monitoring
consoles and system “dumps” that report small or large internal
computer events. CSOs may also interface with system help desk
personnel to try to head off individual-level problems that could be
symptoms of larger system problems. The curious, persistent,
somewhat suspicious CSO is best suited to the detective’s task.
When the system incurs a serious, but unknown problem, the
CSO becomes like a frenzied doctor trying to diagnose a patient who
will die within minutes if not properly treated. In the doctor role, CSOs
try to very quickly diagnose the cause of the problem. This task can
involve interpretation of “dumps,” system monitor cues, or help desk
news. In those cases in which a new problem arises (Weick, 1990),
the diagnosis task requires intensely imaginative brainstorming. In
this highly unstructured situation, some who are not as good at
everyday tasks excel. Some CSOs can imagine the step-by-step
process the computer takes as it undergoes various problems (Weick 59
& Roberts, 1993). Describing the creative scenario-generating
prowess of one of the software operators, a co-worker said, “[name]
can BE the computer.” The abstract thinker with a great imagination
does the diagnosis task best.
Once the root problem is confidently diagnosed, the CSO
becomes like a fire fighter. When the building is burning, every
second counts. Realizing the urgency of restoring the system which
thousands are impatiently waiting to use, the CSO takes rapid, but
calculated, actions. The proactive, quick-to-act, experience-assured
CSO performs the fire fighting task best.
It should be noted that the CSO job often involves technological
equivoque, which Weick (1990: 2) defined as “something that admits
of several possible or plausible interpretations and therefore can be
esoteric, subject to misunderstandings, uncertain, complex, and
recondite.” Weick said that technological equivoque occurs for three
reasons. First, because stochastic, random events occur to cause the
system problems. Second, Weick explained that the randomness of
these events causes worse problems when the event is not
understood. Hence, a large store of knowledge and skill is required
among CSOs and the technical specialists they must immediately
access during a system outage. Third, since the internal workings of
these critical systems are obscure and hard to visualize (Brooks, 1987;
Weick, 1990), operators must deal with abstract, almost 60
incomprehensible, events. Because of the nature of critical systems,
CSOs need an aptitude for “high attention to work processes, rapid
response to emergencies, ability to stay calm in tense environments,
and early detection of malfunctions” (Weick, 1990: 13).
61
CHAPTER THREE:
NATURE OF THE CRITICAL SYSTEMS OPERATOR JOB
Ch Prop: Content or Model
2 -- Methodology and Construct Validation
3 1 Nature of the High Levels of Critical Systems Motivation Operator Job
4 2, 3 Growth Need Strength
Critical Job Characteristics Psychological Work
States (CPS) Outcomes
Relationships System Trust
5 4, 5
Incentive Motivational Controls Effect
Relationships
6 4, 5
Other Motivation Motivational Controls Outcomes
Relationships System Trust
7 -- Contributions, Limitations, and Future Research
Chapter Three first reviews the nature of critical systems from
the research literature. From this review and from Phase I data,
62
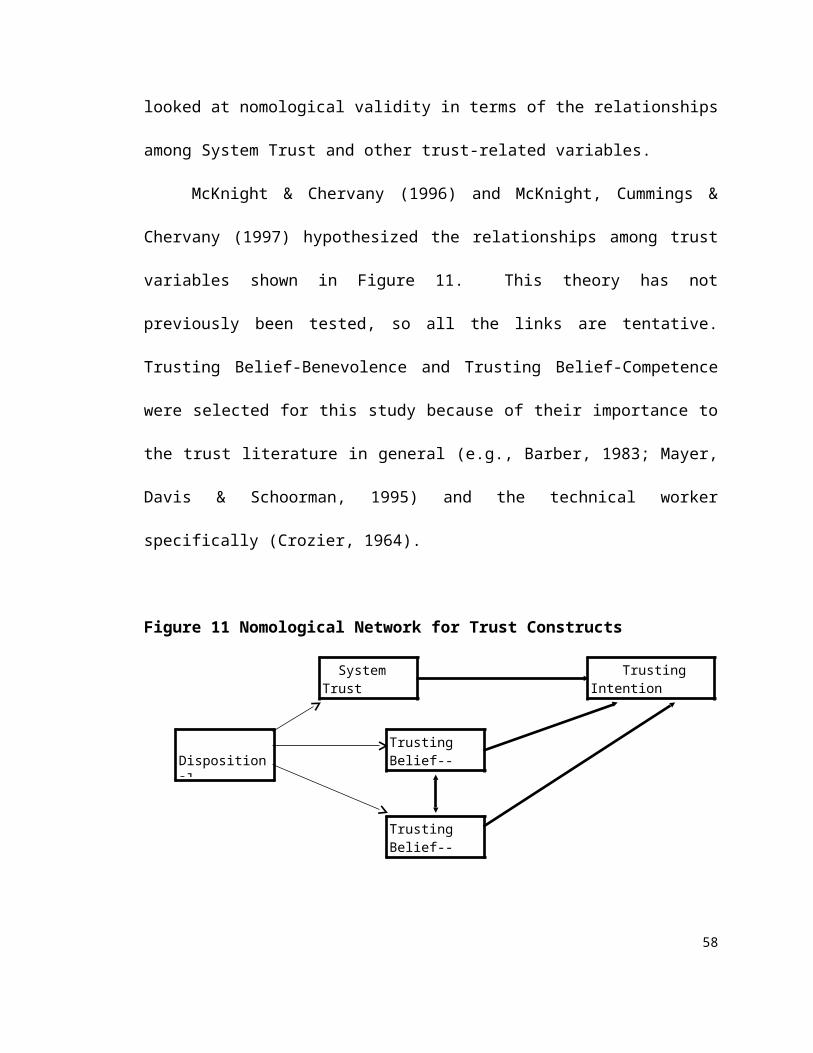
hypotheses are developed. The methods used to test the specific
hypotheses are outlined. The results are then presented and
discussed.
THEORY BUILDING
The Nature and Importance of the Critical Computer System
To understand the CSO job, one must first understand what
critical computer systems are like. The critical nature, importance,
and complexity of these systems is now discussed.
Critical Nature. Some computer systems are so critical to the
operations of an organization that when they become unavailable,
they create major problems. One class of such systems is the
transaction processing system (TPS). "A transaction processing
system is a computerized system that performs and records the daily
routine transactions necessary to conduct the business..." (Laudon &
Laudon, 1995: 37) As an example of system criticality, Lucas (1975:
16) said that “...interruption of on-line service in a reservation system
can drastically affect the functioning of other departments in the
organization.” Now that airlines share their reservation systems with
travel agents, system downtime can interrupt thousands of travel
businesses across the globe. As another example, automated bank
teller systems can be critical for conducting personal business (e.g.,
withdrawing money from a bank). In terms of the need for continuous
operation (Weick, 1990), the critical computer system resembles the 63
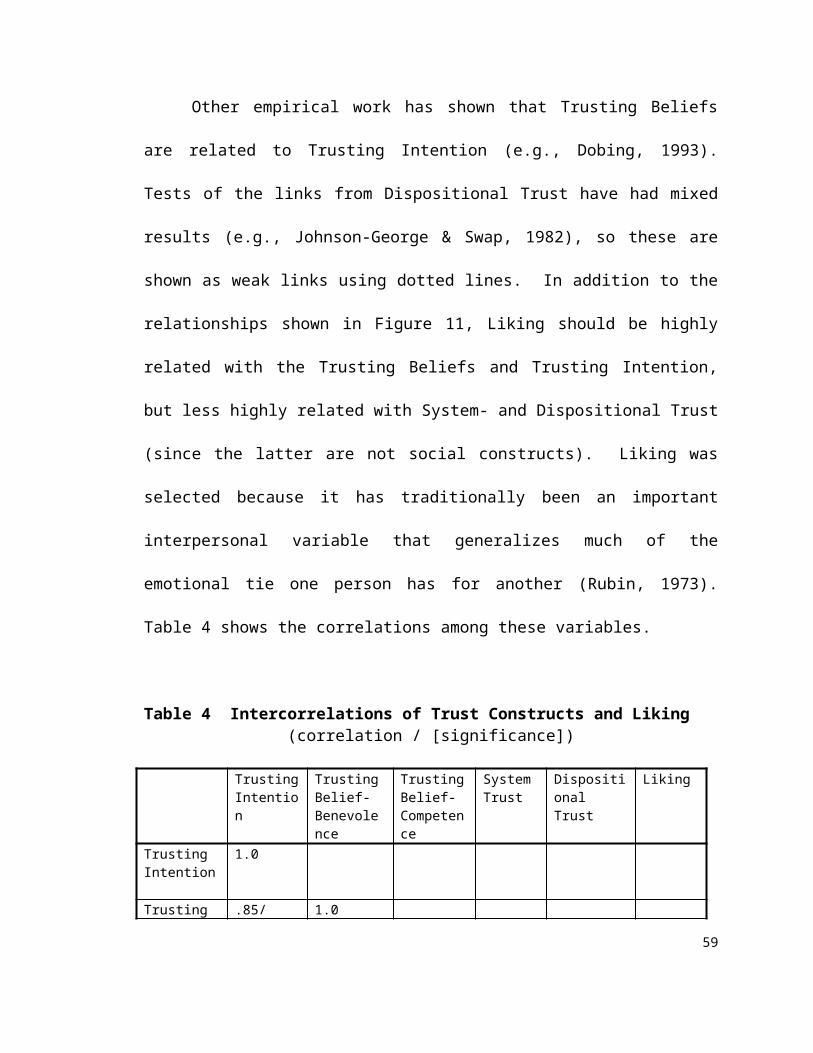
critical nature of nuclear power plants, air traffic control systems, or
the aircraft carrier. Hence, critical computer systems can be classified
as a member of the general family of critical technology systems
(Perrow, 1984; Rasmussen, 1986; Weick & Roberts, 1993). However,
the critical computer systems studied here did not have life-
threatening consequences. Instead, their consequences consisted of
work stoppages for large numbers of people and significant customer
inconveniences, both of which could hurt those businesses that
depended on the systems.
Importance. When a TPS fails, a company may lose sales,
upset important customers, or decrease productivity for itself and its
customers. Upsetting customers is becoming dangerous as more and
more firms compete on the basis of service quality (Schlesinger &
Heskett, 1991). The decreased productivity caused by TPS failures is
costly--and ironic, since companies use such systems to try to increase
productivity (Drucker, 1991). But TPS failures are even more harmful
because they often cause total work stoppages for those dependent
on the system (Weick, 1990; Zuboff, 1985). Without the use of its TPS,
a company may not be able to transact its daily business. In the
extreme case, "...TPS failure for a few hours can spell the demise of a
firm and perhaps other firms linked to it" (Laudon & Laudon, 1995:
37). An interesting parallel to the critical nature of the TPS failure was
found in Crozier’s (1964) account of plant machine stoppages. Crozier 64
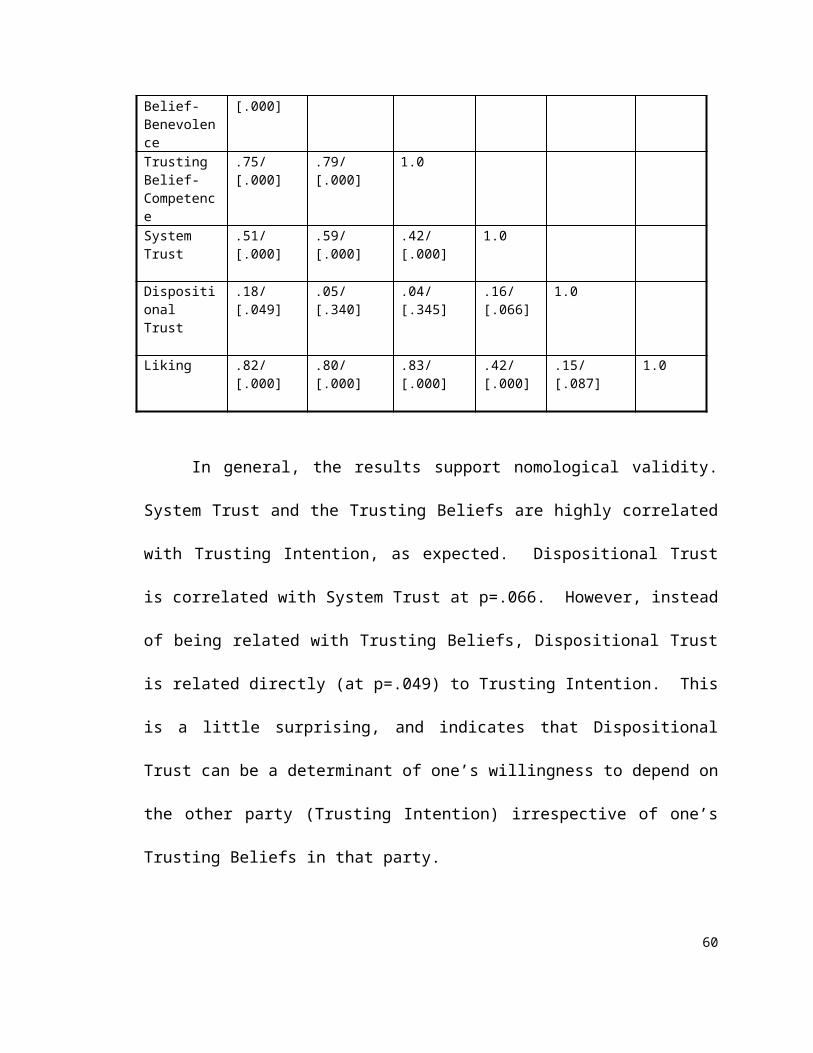
said these stoppages were crucial because: a) they are unpredictable;
b) impersonal rules can’t be applied to fix them; and c) only skilled
maintenance people can cope with them.
Internet-related computer systems are also becoming more
critical to business. For example, well over 1 million people use
America Online (AOL) to conduct business (Reuters News Service,
1996). These people have suffered such business interruptions as a
nineteen hour outage on August 7, 1996 (Wall Street Journal, 1996).
Because of this and subsequent AOL availability problems, the Wall
Street Journal online edition hosted a discussion group regarding AOL
problems for several months during 1996 and 1997, further
accentuating the public relations problems related to the AOL outages.
Another recent example of the business consequences resulting from
system failure involved a small Internet provider used by a number of
firms to transact business (personal communication with a subscriber).
During the summer of 1996, this provider incurred a series of long
outages. A number of businesses, that depended on the network’s
continuous availability to be able to conduct daily operations, were
severely hurt. Soon, this internet provider lost about 10% of its
customer base and a higher percentage of its revenues.
Complexity. Like all large computer systems, critical systems
are generally complex. As Brooks (1987: 11) said, “Software entities
are more complex for their size than perhaps any other human 65

construct because no two parts are alike…In this respect, software
systems differ profoundly from computers, buildings, or automobiles,
where repeated elements abound.” Complexities of systems are
compounded when: a) systems interact with each other, and b)
systems are operated by automated systems (Zuboff, 1985, 1988).
Weick (1990) posited that technology can be very hard to control
when it is comprised of many automated, interacting parts.
Complexity places a burden of escalating cognitive demands on
operators that can lead to operator errors.
Interactive effects between complexity and criticality are also
possible. Critical systems have the added burden of having many
people dependent upon them. Zuboff (1985: 13-14) warned: “Such
dependence on automation means that the problems of reliability will
be critical. Automatic controls that can provide fail-safe measures to
guard against systems errors will be needed, since the ripple effects of
such failures can escalate with alarming speed in a highly automatic
and interdependent machine system.”
Management Information Systems Literature
The MIS literature contains several research streams that relate
to computer operations. These bodies of research helped inform
Phase I exploration of the critical computer systems operators
phenomenon. A large body of literature (e.g., Bailey, 1982; Galitz,
1980; Norman, 1983) addresses what might be called “user interface 66
requirements,” (Davis & Olson, 1985) or the engineering of computers
to match “human factors” (Shneiderman, 1980). User interface
research addresses an important issue: how to design systems with
which humans can effectively and efficiently interact. This literature
stresses the importance of designing appropriate computer interfaces
for operators in order to minimize errors at the operator console.
Davis & Olson (1985) mentioned three types of controls to
improve information system availability: physical facilities control (to
prevent the risk of access to the computer site by undesirables),
terminal access control (to protect against illegal access), and backup
and recovery controls (to recover from errors). Further, Davis & Olson
discussed procedures and duties performed by information systems
personnel to monitor system quality in terms of errors, downtime,
reruns, and application repair maintenance. They also discussed
preventive controls (i.e., quality application development and
adequate testing) and detective controls (e.g., redundant parity bits).
These controls emphasize ways to protect the system. They
encompass both technical and structural approaches.
DeGreene (1970) discussed the Semi-Automatic Ground
Environment (SAGE) air defense system set up by the Air Force to
detect and destroy enemy bomber aircraft. This system was the
“granddaddy” of the electronic control systems (DeGreene, 1970: 12).
However, DeGreene almost exclusively discussed the system in terms 67
of the lessons learned from developing—not operating--SAGE.
Similarly, Lyytinen & Hirschheim’s (1987) detailed review of system failures
reports almost no studies of operations failures. It does, however,
point out the importance of operations in terms of keeping the system
running, because “errors...are hard to pin down and correct” when
systems are so complex (1987: 281).
Perhaps closest to this study’s domain is research in technical
support and computer maintenance. Amit Das (1994) and Brian
Pentland (1992) studied the technical support done at computer user
help desks. Das took a problem solving (i.e., Simon, 1981) approach
to technical support work, explaining that the failure mode leads to
the types of tasks and problem solving moves used. Pentland’s work
described how technical problem solvers interpret and coordinate
(e.g., assign, refer, escalate) the trouble calls they receive. Das and
Pentland showed that helping users is a dynamic process that requires
effective teamwork.
In the area of computer maintenance, Lientz & Swanson (1980)
and Swanson & Beath (1989) have taken a combined technical and
organizational approach. For example, Swanson (1984) has looked at
the impact of alternate organizational designs on software
maintenance. Others have also taken up the topic of software
maintenance (e.g., Slaughter, 1995; Banker, Datar, Kemerer & Zweig,
1993), particularly in terms of the economics of enhancing and 68
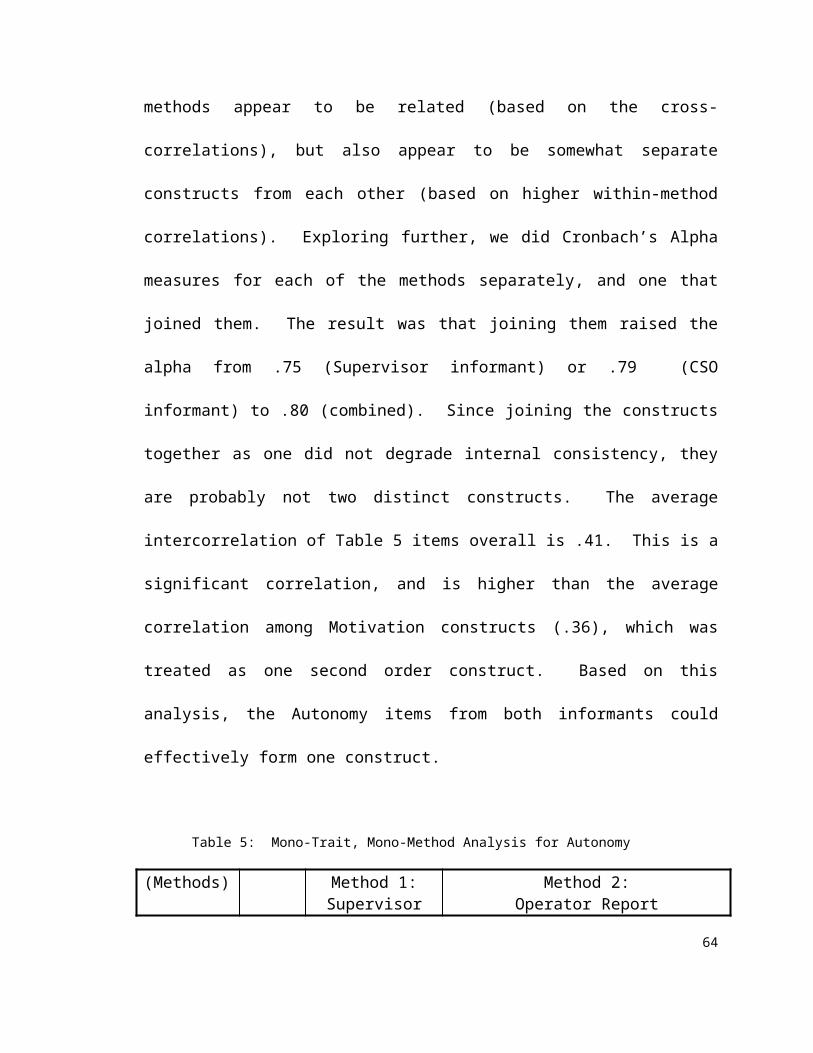
maintaining software. These studies have primarily addressed the
enhancement of application software, while this study researches
large infrastructure systems that include both the systems software
and the related applications, and focuses on pure maintenance (fixing
the system when it breaks).
Couger and Zawacki (1980) surveyed over 1200 computer
operations employees. From analysis of their data, Couger and
Zawacki concluded that the computer operator job is one of the least
motivating jobs in industry. By contrast, Couger and Zawacki found
that the job of the system developer was more motivating than the
average industry job.
In sum, the MIS literature is helpful in framing the boundaries for
this study, and introducing the researcher to the complex nature of
the task, the opportunity for human error, and the importance of
teamwork in the critical systems operator context. The Couger &
Zawacki (1980) study provided a benchmark view of the traditional
operator job that could be compared with Phase I findings regarding
the critical systems operator.
Management of Technology Literature
Perrow (1984) described the Three Mile Island nuclear power
disaster as a “normal accident” that occurs when complex, interacting,
and hard-to-visualize systems combine with human limitations.
Perrow argued (1984: 31) that neither “better organization..., [nor] 69
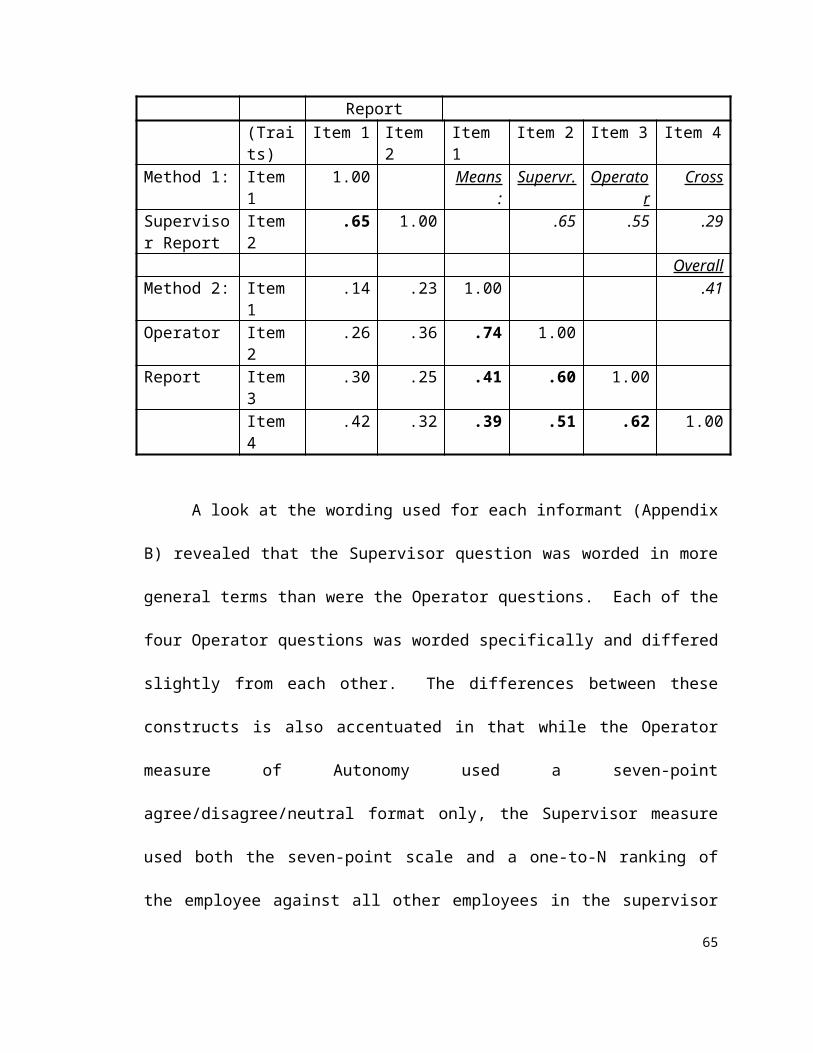
more money and resources for better people and equipment” will help
reduce the risk of accident in such systems. Per Perrow, only taking
steps to simplify the system will help. This is a structural view of
system problems that says people, interpersonal relationships, and
the organization of workers’ roles do not matter: simplification is the
only possible answer.
Rasmussen, like Perrow, studied the operation of nuclear power
plants. Rasmussen focused on the human-system interactions,
primarily using cognitive decision-making as his research paradigm
(e.g., Rasmussen, 1986). However, some studies sponsored or
reported by Rasmussen allude to the importance of people
relationships or motivation in keeping nuclear plants operating (e.g.,
Quantanilla, 1987). This alerted the researcher to the importance of
social issues in keeping systems running.
Zuboff (1985, 1988) discussed how computers affect people and
management in terms of controls and power issues. Computers may
be used by management to both control or even replace people,
making the computer divisive to the worker-management relationship.
Highlighting power issues between workers and management, Zuboff
(1985) explained that giving information to workers takes away some
measure of manager control, constituting a threat to management.
These descriptions helped the researcher be aware that: a)
automating the critical systems operator function may have some 70
drawbacks and b) power issues may exist between technicians and
their management.
Weick & Roberts (1993) explained how things work on the flight
deck of a military aircraft carrier. The flight deck is extremely
complex, interactive and risky, “a million accidents waiting to
happen.” In this context, Weick & Roberts portrayed the people and
interactive roles as the glue that kept things together, “but only a few
[accidents] do [happen].” Weick & Roberts posited that the combined
problem solving capability of the high-reliability organization enables
it to hold at bay its potentially hazardous environment. In contrast to
Perrow’s belief that the environment limits people, Weick & Roberts
posited that the combination of people, organization, and relationships
is able to overcome almost any degree of structural complexity.
Weick & Roberts’ belief in the ability of teams to handle complex
situations inspired the researcher to wonder if highly alert, motivated,
and team-oriented operators might be a key to keeping critical
systems running.
This dissertation research fills an important gap by examining
how computer operator motivation and teamwork function within an
organizational and social context. To some extent, researchers have
studied critical computer systems (DeGreene, 1970), beginning with
air defense systems. But they have primarily focused on technical or
human/computer interaction factors. The same focus permeates the 71
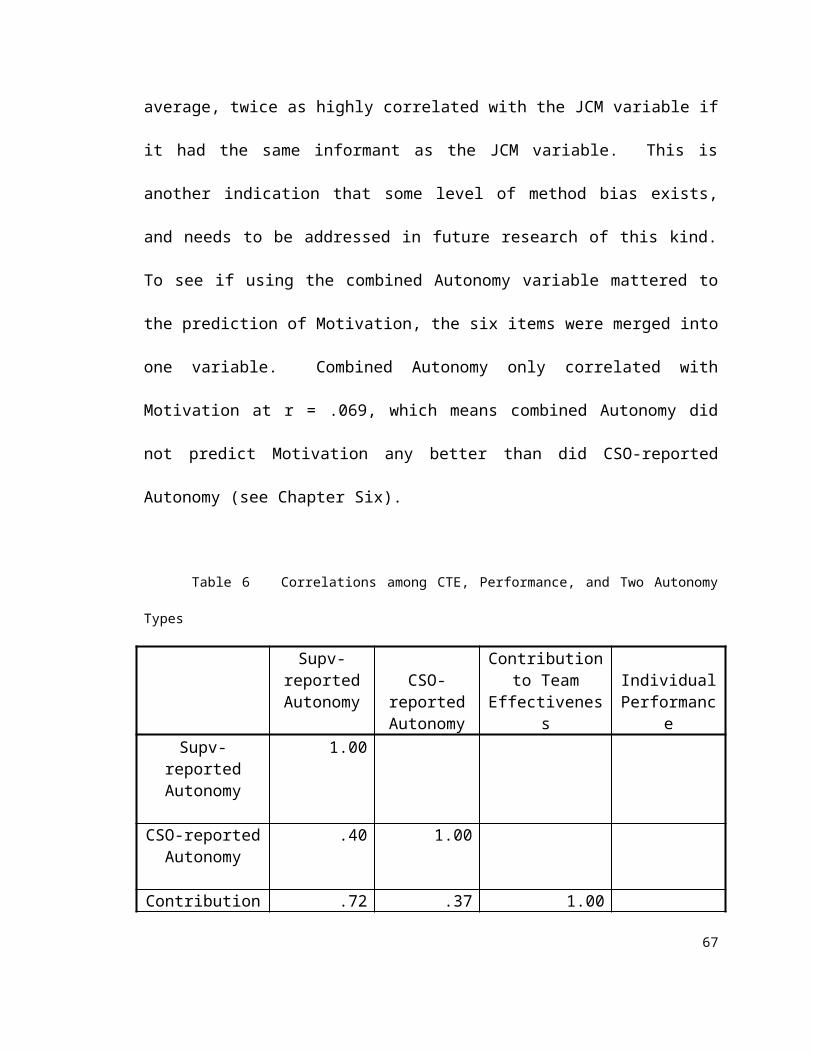
analogous literatures on industrial safety (Hale & Glendon, 1987) and
nuclear plant availability (Rasmussen, 1986; Rasmussen, Duncan, &
Leplat, 1987), leaving a gap in the area of social/organizational issues.
This gap is important to fill, since people and organizations are part of
the interacting systems components that determine the success of
computer systems (e.g., Lucas, 1975; Lyytinen & Hirschheim, 1987;
see Figure 8 in Chapter Two).
Conceptual Model Building
In part, reducing computer outages is complex because
computer system components are themselves complex (Brooks,
1987). This was confirmed at XYZCo. The main system consisted of
many thousands of interacting segments of computer code. Once
each week, many new and revised segments were implemented, each
carrying the potential to take the system down through programming
errors. Pre-implementation testing of software was extremely
rigorous.
72
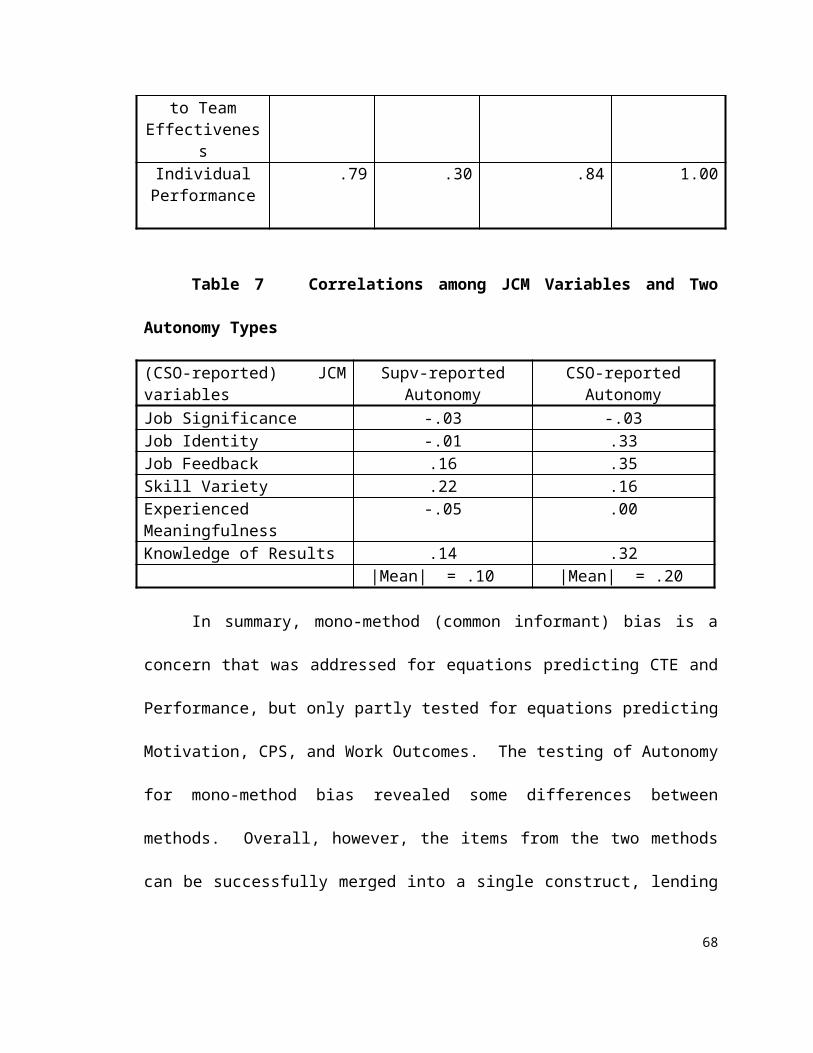
Phase I found that each operator must learn as much as possible
to be prepared for almost any contingency. This is because: a)
operators cannot predict the type of system problem they will next
face; b) system repair knowledge is highly specialized and dispersed
among numerous people; c) differing levels of experience, abilities,
motivation, and teamwork exist among operators; and, d) because of
rotating shifts among software operators and the unpredictability of
the timing of outages, management cannot predict which set of
operators will be onsite when an outage occurs.
The operators take pride in being key to keeping the system
going. But, since system outages damage so many peoples’ ability to
do their job, they also feel intense pressure from the task to do things
right. Most of the hardware and software operators have college
degrees, but they primarily obtained their technical knowledge on the
job.
The operators continuously and alertly monitor the health of the
system, proactively investigating anything that could bring the system
down. They act on such cues as messages on the operator console
and calls from the help desk. When the system does crash, they
immediately respond in cohesive team fashion to bring the system up
again--hopefully in a matter of a few minutes. One operator said, “...an
outage looks very chaotic. But everybody basically knows what to do...” The
researcher found that what one does during an outage also depended 73
on who else was present and what the outage symptoms were.
Operators reported that adrenaline rushes are common as they fix
system problems. Total attention is focused on getting the system
running. When asked about how the presence of management felt in
an outage, one interviewee replied,
Respondent: That's tough, because when you are in the middle of an outage,
I think that the pressure is so great that you don't particularly think of it. I
don't particularly care for popcorn, okay? But if you give me a bag of
popcorn in the middle of an outage, I'll eat the whole thing.
Interviewer: Just because you're so nervous?
Respondent: Right. Well, it's not even.. [pause].. It's like energy.
Another XYZCo employee said the operator job is “an
adrenaline junkie’s dream.” While system outages occurred more
frequently during the 1980s, they now only occur about once every
two weeks. Between fixes, some team members search for potential
problems in existing software or in hardware or software that will soon
be brought online. Others “tune” the large body of application and
system software for increased efficiency. Still others monitor the
utilities that create off-line files for testing and disaster-recovery
storage.
74
The operators are proud of the fact that the system has historically improved to
over 99% availability. In many cases, their greatest motivation appears to be the
challenge of keeping the system continuously up and running. In talking with several
employees, this feeling of pride is especially strong among the “old-timers.” One of
these (whom we’ll call Tom), for example, began with the company in the early 1960s,
when the system was in its infancy. After working as a software operators for about
twenty years, Tom moved to the applications group in the 1980s. In spite of this job
change, he has maintained a close relationship with the current operators. Tom also
spends about half an hour each day looking for things that might harm the system, much
as he did when in the operator group.
Hypotheses
These findings can be related to the Hackman/Oldham JCM (see
Figure 2). These hypotheses expand upon Proposition 1 (see Chapter
One), which stated that CSOs will be more highly motivated than
traditional computer operators. Each job characteristic will be
italicized in the following discussion. Based on the findings at XYZCo,
the job of the critical systems operators appeared to be highly
significant to the operators, because the entire organization and
thousands of customers depend on each individual operator to keep
the system running. Arguably, these jobs would be more job
significant than the job of a system developer, since developers
typically have fewer continually dependent constituents. Because so
many different activities are possible during outages and periods of 75
calm, the job appeared to be replete with skill variety. Critical
systems operator skill variety is probably higher than that of system
developers, who tend to work on one task for a longer period of time.
Because most CSOs possess significant knowledge and skill, they
appeared to be given much autonomy by management in carrying out
their complex functions. Because the system itself tells CSOs
immediately whether or not they succeeded in fixing an outage, the
task potentially carries high levels of job feedback. Job feedback
should be higher than for system developers, who do not receive
feedback as often, and don’t receive complete feedback until their
system is tested and implemented. Given the significant pressure on
the critical systems operator and the length of time it takes to learn
the job, CSOs will probably have higher levels of growth need strength
than will systems developers or traditional operators. Therefore:
76
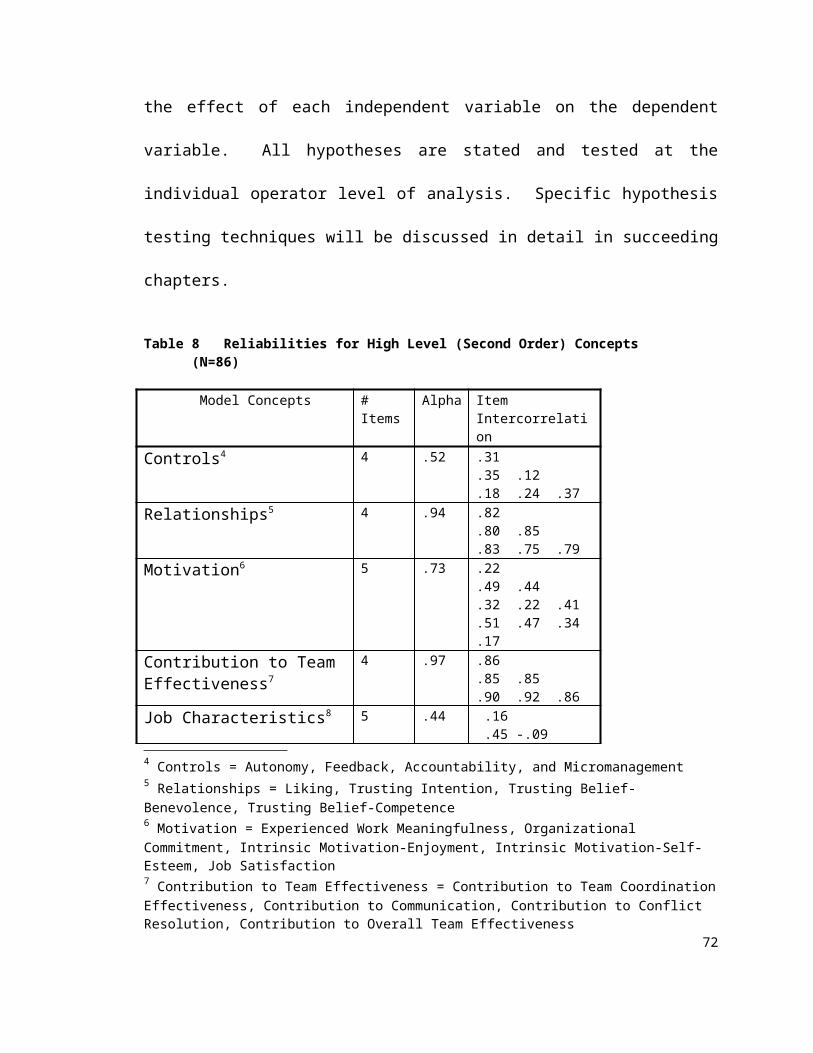
Hypothesis 1: The nature of the critical systems operator job
is such that the levels of Job Significance, Skill Variety, Autonomy, Job
Feedback, Growth Need Strength, and Motivating Potential Score will
be significantly higher for XYZCo operators than was found among
traditional: a) computer operators and b) system developers in the
Couger & Zawacki (1980) study.
Note that systems developers have been found to be highly motivated employees
(e.g., Couger & Zawacki, 1980; Lending, 1986). For example, Couger and Zawacki
found that system developers had an average Motivating Potential Score that was fifty-
five percent higher than that of the computer operator. Hence, the comparison of CSOs
to Couger & Zawacki operators is an easy test, but the comparison of CSOs to Couger &
Zawacki system developers constitutes a difficult test. Also note that if CSOs are
strongly motivated by job characteristics, they are probably not as strongly motivated by
other factors, such as social relationships. Thus, Hypothesis 1, if true, enables a strong
test of whether Relationships and System Trust add to the JCM’s prediction of
motivation constructs (tested in Chapter Four).
The Lending (1996) study of system developers was included as a comparison
group to help remove the objection that the time period (1980 to 1997) was the major
differentiating factor between the CSO measures and those of the Couger & Zawacki
(1980) computer operator study.
Hackman and Oldham’s Task Identity construct refers to the extent to which
workers see the task as a whole or complete task, as opposed to some component part of 77
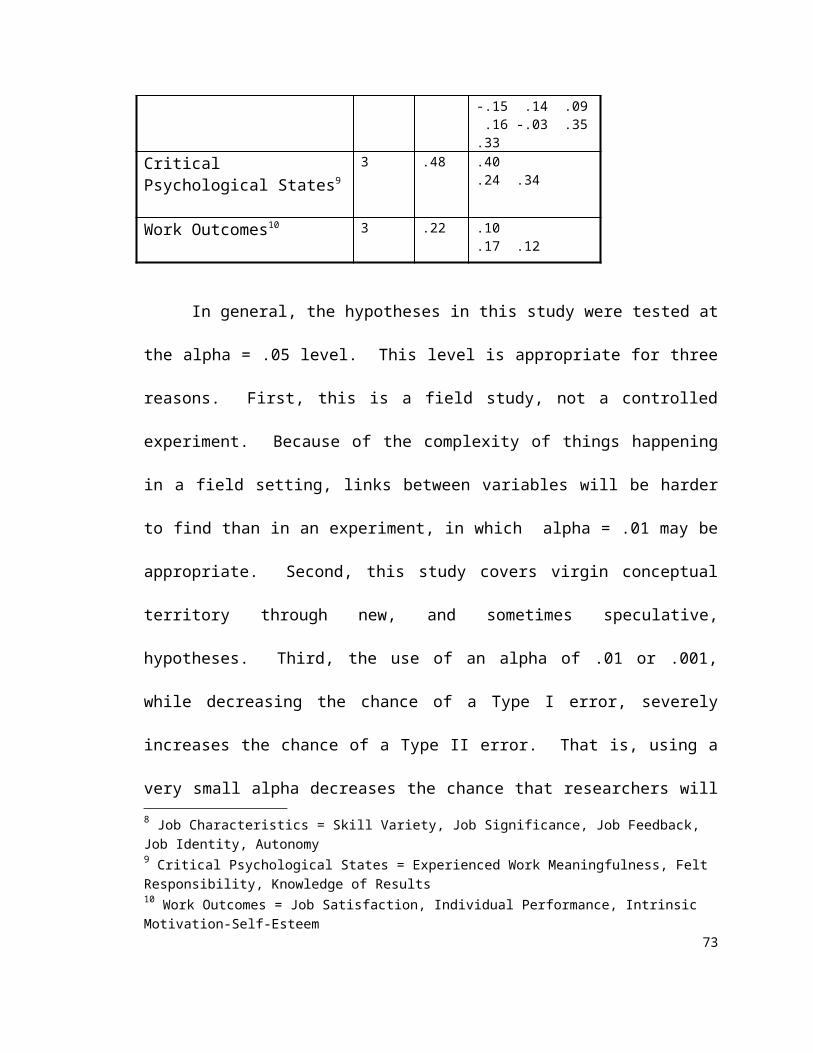
an entire task. Since XYZCo workers often get interrupted by outages or new potential
problems to explore, their Task Identity should be relatively low. Therefore:
Hypothesis 2: The nature of the critical systems operator job
is such that the levels of Task Identity will be significantly lower for
XYZCo operators than was found among traditional: a) computer
operators and b) system developers in the Couger & Zawacki (1980)
study.
Based on JCM theory, these four job characteristics—job
significance, skill variety, autonomy, and job feedback--should result in
high levels of experienced meaningfulness, felt responsibility, and
knowledge of results. In fact, interviews indicated that operators feel
their job is very meaningful and that they feel keenly their
responsibility to keep the system available. Note that these four will
far outweigh the effects of Job Identity, which is hypothesized to go
the other direction. Therefore:
Hypothesis 3: The nature of the critical systems operator job
is such that the levels of Experienced Meaningfulness, Felt
Responsibility, and Knowledge of Results will be significantly higher for
XYZCo operators than was found among traditional: a) computer
operators and b) system developers in the Couger & Zawacki (1980) 78
study.
Based on the JCM, the Critical Psychological States will lead to
motivational Work Outcomes. Supporting this theory, Phase I
interviews found significant levels of job satisfaction and intrinsic
motivation. Therefore:
Hypothesis 4: The nature of the critical systems operator job
is such that the levels of intrinsic motivation and job satisfaction will
be significantly higher for XYZCo operators than was found among
traditional: a) computer operators and b) system developers in the
Couger & Zawacki (1980) study.
To motivate its workers effectively, management should know the extent to
which the workers are motivated by intrinsic factors (i.e., the characteristics of the job)
or extrinsic factors (e.g., incentives) (Steers & Porter, 1977). Hackman and Oldham
found that the worker’s Growth Need Strength moderated the effects of Job
Characteristics on their motivating psychological states (Figure 1). In Phase I interviews,
workers were asked what motivated them to do a good job. In the vast majority of cases,
the answers were intrinsic, rather than extrinsic, in nature. This provided initial evidence
that critical computer systems operators are more intrinsically motivated than
extrinsically motivated. In Phase II (Appendix C, questions 48. and 49.), CSOs were 79
asked to compare their current level of commitment to work hard for the company to
their commitment level three years previously (or less, if they had less than three years of
tenure). While CSOs probably had trouble remembering their commitment level of three
years ago, this question broadly measured the upward or downward trend in their
commitment levels. The CSOs were then asked why they are more (or less) committed
today. Their answers provided qualitative data on what motivates the CSOs to be
committed. Because this question asks about their motivation indirectly, the responses
should be less subject to social desirability bias than would result from a direct question
about their motivation. Therefore:
Hypothesis 5: When asked why they are more (or less)
committed to work hard for the organization today than they were
three years ago, most of the reasons CSOs provide will be intrinsic,
rather than extrinsic, in nature.
To the Phase I question of what motivated them to do a good job, some CSO
answers indicated that people relationships, either with supervisors or peers, motivated
them. From this, the researcher projected that a significant portion of the responses to
the question of why the CSO is more/less committed today would involve people
relationships. If over half of the responses are expected to refer to intrinsic factors
(Hypothesis 5), it is reasonable to assume that a significant portion of the remaining
responses would be about twenty percent of the remaining responses, or ten percent of
the total responses. Therefore:80
Hypothesis 6: When asked why they are more or less
committed to work hard for the organization today than they were
three years ago, greater than ten percent of CSO responses will
indicate that critical systems operators are motivated by people
relationships.
Age, grade level, and job security probably affect the worker’s
choice between intrinsic and extrinsic factors. Herzberg (1966) said
that what motivates someone is what they want that they don’t have
(Steers & Porter, 1977). Hence, a junior employee is more likely to be
motivated by money or promotions (extrinsic factors) because they
are usually at a lower salary and grade level early in their career.
Similarly, the employee with a low grade level is more likely to choose
extrinsic factors like promotion over a challenging job. Employees
with low job security are likely to want job security, or will at least
want to be compensated for the lack of job security by receiving
greater compensation or promotional opportunities. Moreover, based
on needs-based motivation theories (e.g., Herzberg, 1976; Maslow,
1954), the lack of job security (a low-order need) will direct operator
attention from higher order needs like job satisfaction to lower order
needs like compensation. Therefore:
81
Hypothesis 7: When asked what motivates them to work hard
and do a good job, those critical systems operators a) who possess a
higher grade level, and b) have greater job security will be more likely
to choose intrinsic over extrinsic motivators.
While XYZCo has found that improved technical tools helped, the
proactive teamwork of the highly motivated operations “fire-fighters”
has contributed much to improving uptime. For example, one
management person said that the number one factor for keeping the
system up was “lots of teamwork.” In part, this is because the system
is so complex and has so many interacting parts that, as one operator
said, “There’s too much for one person alone, for even just a handful of people alone.
Everybody has their part.” Hence, teamwork is essential to CSO performance.
In the CSO setting, teamwork is essential because no one knows
what problem is going to threaten system availability next. Some
members of the team specialize in particular parts of the system (e.g.,
data base software or system utilities), since no one can comprehend
it all. Thus, diagnosing and fixing the system often requires the onsite
personnel to access by phone a virtual network of experts. Knowing
who to call for what purpose and being quick to respond to a call
become incredibly important as the seconds of downtime tick into
minutes. Those interviewed on-site named many people who were
critical to keeping the systems available. The names of those critical 82
came from many different parts of the organization--from on-site
hardware vendor technicians, to system engineering department
gurus who specialized in tape or DASD (Direct Access Storage
Devices), to applications programmers like Tom. In spite of being in a
new job in a different city, Tom still reported getting four or five calls
from the software group per month. Given how important such
teamwork is, management probably views an operator’s contribution
to team effectiveness as an essential ingredient in the operator’s
individual performance. Therefore:
Hypothesis 8: Because of the nature of the critical systems
operator task, teamwork will be highly valued at XYZCo. This will be
manifested by a high correlation between the supervisor’s evaluation
of the operator’s contribution to team effectiveness and the operator’s
performance rating.
Pfeffer (1981) said that those workers who are most critical in
meeting an organizational contingency will have the most power,
particularly when they are hard to replace in the function. Pfeffer
cited Crozier’s (1964) study of French maintenance engineers who
controlled “the one remaining uncertainty confronting the
organization, the breakdown of machinery” (Pfeffer, 1981: 113).
Crozier found that maintenance engineers held significant power over 83
assistant plant managers, for example, and were able to exert more
influence on the plant manager than did the assistant manager. As a
group, the operators of XYZCo’s critical systems hold this type of
power.
However, levels of power differ between software and hardware
operators. Software operators have significant expert power (French
& Raven, 1968) because: a) they have no written procedures for
diagnosing problems, since the possible problems are too complex to
document, and b) the amount of knowledge it takes to become
relatively competent at this task can only be learned on-the-job over a
period of about two years. To become expert at the job requires much
more time, however. The interview with Tom highlighted this. Though
no longer a CSO, he still was frequently called on issues within his
area of expertise. Tom also pointed out three software operators who,
in Tom’s opinion, were “becoming” expert. Each of the three had
been software operators for ten years or more!
Hardware operator power levels appears to be lower than for
software operators. While the task of the hardware operators is also
complex, portions of the hardware job are sufficiently standardized to
make automation possible. Hence, management has pursued a “lights
dim” initiative to replace enough hardware functions to make it
unnecessary to have operators physically located in the computer
room. By making the hardware operators partially replaceable, “lights 84
dim” efforts constituted a threat to hardware operator power
(McKnight, 1996). One informant reported that the operators resisted
programmers who came to the operators to develop specifications for
automating their function. This resistance demonstrates the use of
operator power against actions that threatened their power.
Arguably, the worker/management relationship will begin to
erode when management makes attempts to eliminate worker jobs or
erode worker power. This relationship erosion will be manifest in
terms of the trust and liking of the workers for their management.
Even though such policies generally come from higher management
levels, such actions will likely taint hardware operators’ relationships
with their immediate supervisors. Therefore:
Hypothesis 9: Critical systems operators in groups whose jobs
will likely be eliminated over time will have lower levels of trust and
liking toward their supervisors than will operators in other groups.
Workers whose jobs will be eliminated will likely have lower
organizational commitment and job satisfaction. They are likely to get
less enjoyment from their job because of job insecurity, as they focus
more on lower-order, rather than higher-order, needs (Deci & Ryan,
1985; Maslow, 1954)
85
Hypothesis 10: Critical systems operators in groups whose
jobs will likely be eliminated over time will have lower levels of
Organizational Commitment, Intrinsic Motivation-Enjoyment, and Job
Satisfaction than will operators in other groups.
METHODOLOGY DETAIL
Hypotheses 1-4 (motivation levels comparisons with other
groups) were tested by means comparison tests.
Hypotheses 5 and 6 (intrinsic and relationships motivation
orientation) were tested by grounded theory’s open coding method
(Glaser & Strauss, 1967). The qualitative responses were open coded
into categories. Once the categories were identified from the data,
the researcher went back through the coding process again, making
several minor coding changes. Hypothesis 5 indicates that a majority
of comments would be intrinsic. For testing purposes, “majority” was
assumed to be 50% or more. Hypothesis 6’s “significant percentage”
was interpreted to be over 10% for testing purposes. Given that over
50% were projected to be intrinsic, then 10% is at least 20% of the
remaining 50% of the comments.
Hypothesis 7 (grade/job security motivation orientation) was
tested by correlating grade and secure group membership with a
construct developed to represent the operator’s choice of intrinsic
versus extrinsic motivation for why they work hard and do a good job. 86
This construct was named IMO, for Intrinsic Motivation Orientation.
The data for IMO was gathered by asking questions #50-52 in
Appendix B, as shown in Table 9. Questions 50-51 present four
choices for why the employee works hard, two intrinsic and two
extrinsic. Respondents are also offered the choice of “5. Something
else (specify:)___” The intrinsic and extrinsic choices were selected
from theory. Question 52 offers three extrinsic choices, choice “5.
Something else,” and one choice that mixes extrinsic and intrinsic:
“Appreciation from your boss.” This choice is partly extrinsic (Kohn,
1993b), in that the stimulus comes from outside the worker, and
partly intrinsic in that appreciation relates to the employee’s self-
esteem. Responses that indicated “5. Something else” were further
probed, and the responses recorded on the questionnaire. These
answers were coded as intrinsic, extrinsic, or mixed. IMO was placed
on a 1-7 scale as follows. To the minimum score of 1.0, two points
were added for each answer on questions 50-52 that was an intrinsic
motivator. Exceptions: a) one point was added for “Appreciation from
your boss;” b) the scores from mixed answers to “5. Something else”
probes were scored through open coding methods explained above.
Since IMO was formulated by summing the intrinsic responses to each
of the three questions, IMO could not be tested for reliability.
Table 9 Intrinsic Motivation Orientation (IMO) Scale
Q# Question Text Category87
50. From the following list, please select the one reason that best represents why you try to work hard and do a good job:1. Opportunities for a promotion Extrinsic2. The challenge of the task Intrinsic3. Merit pay increases Extrinsic4. A feeling of accomplishment Intrinsic5. Something else (specify) Either
51. From the following list, please select the one reason that best represents why you try to work hard and do a good job:1. [incentive plan name] bonuses Extrinsic2. Solving the incident, outage, or potential problem Intrinsic3. Achievement award programs Extrinsic4. Enjoyment of the job Intrinsic5. Something else (specify) Either
52. From the following list, please select the one reason that best represents why you try to work hard and do a good job:1. Opportunities for a Promotion Extrinsic2. Appreciation from your boss Extrinsic/
Intrinsic3. Merit pay increases Extrinsic4. [incentive plan name] bonuses Extrinsic5. Something else (specify) Either
Hypotheses 8 (CTE importance) and 9-10 (job security effects on
relationships, motivation) were tested using correlations, with a one-
tailed significance test. Hence, Hypotheses 9-10 tests for differences
between employees whose functions were going to be eliminated and
those in the other groups by correlating insecure group membership
with Relationships and Motivation variables.
RESULTS OF HYPOTHESIS TESTING
Table 10 shows the results related to Hypotheses 1-4
(motivation levels).
Table 10 Job Characteristics Comparisons (averages)
TYPE OF JOB: SYSTEM COMPUTER
88
DEVELOPMENT OPERATIONS
H:Support
?STUDY:
Lending, 1996
Couger &Zawacki, 1980
Couger &Zawacki, 1980
XYZCo, 1997
1 Yes Job Significance 5.37 5.75 5.62 6.771 Yes Skill Variety 5.76 5.55 3.98 6.281 Yes Autonomy 5.31 5.31 4.08 5.971 Yes Job Feedback 5.09 5.20 4.62 5.951 Yes Growth Need Strength 5.29 5.91* 5.78 6.821 Yes Motivating Potential Score 150 154* 99 2162 No Task Identity 4.98 5.37 4.53 4.833 Yes Felt Responsibility n/a 5.31 4.08 6.883 Yes Experienced Meaningfulness n/a 5.56 4.71 6.623 Yes Knowledge of Results n/a 4.59 4.33 6.384 Yes Job Satisfaction 5.10 5.10 4.94 6.294 Yes Intrinsic Motivation 5.70 n/a 5.71 6.46
*Based on combined programmers and analysts; other column entries are analysts only
Lending results shown here only to demonstrate that System Development scores have not changed greatly from 1980 (Couger & Zawacki study) to 1996 (Lending study). Means tests did not involve Lending results.
Hypothesis 1 (CSO JCM measures higher than those of
comparison groups) was consistently supported. Each Hypothesis 1
job characteristics measure for critical systems operators at XYZCo is
nominally higher than the Lending or Couger results. Note that the
contrast is greatest between XYZCo CSOs and Couger’s computer
operators. For each variable, a T-test was performed, comparing the
XYZCo results to the Couger & Zawacki System Developer score
(Keller, Warrack & Bartel, 1988). At alpha = .05, each variable
showed a significant mean difference. XYZCo’s figures are also
significantly higher than the operator figures, since the System
Developer figures each exceeded Couger & Zawacki’s operator figure.
The CSO Motivating Potential Score was more than double that of the
89
computer operator, and over sixty points higher than that of the
System Developers. Hence, Hypothesis 1 was fully supported.
Hypothesis 2 (CSO Task Identity lower than those of comparison
groups) was partially supported. XYZCo’s Task Identity mean was
nominally lower than the means of Lending and Couger & Zawacki
system developers, but was higher than that of the Couger & Zawacki
computer operators. T-test results showed that XYZCo’s average Task
Identity score of 4.83 was significantly (alpha = .05) lower than the
Couger & Zawacki average for system developers (5.37), supporting
Hypothesis 2. However, T-tests showed that XYZCo’s average Task
Identity score of 4.83 was not significantly different from the Couger &
Zawacki average for Computer Operators (4.53) or the Lending
average for system developers (4.98).
Based on alpha = .05 significance T-tests, Hypotheses 3 and 4
(CSO CPS and Work Outcome measures higher than those of
comparison groups) were also supported. While most T-tests
compared the XYZCo mean with that of Couger & Zawacki’s System
Developers, the Intrinsic Motivation T-test compared the XYZCo mean
with that of the Couger & Zawacki operators, since that was the only
number available.
T-tests were also done to compare Hypotheses 1 and 4 XYZCo
results with those of Lending (1996). For each variable, the average
XYZCo score was significantly higher than that of Lending. Hypothesis 90
2 Lending results were reported above, and Lending did not report
data on Hypothesis 3 variables.
Table 11 presents the strongly supportive results of Hypotheses
5 and 6 (intrinsic and relationships motivation orientation). In support
of Hypothesis 5, Table 11 shows that intrinsic factors were strongly
favored over extrinsic factors—52.9% to 8.9%. In support of
Hypothesis 6, the worker’s relationship with either his/her boss or
coworkers was mentioned almost 20% of the time, which was more
than twice as often as extrinsic factors. Even the sum of job security
and hygiene factors was a higher percentage than extrinsic factors
overall.
Table 11 Intrinsic versus Extrinsic Factors Reported(Hypotheses 5 and 6 Results)
% Factor Reported52.9% Intrinsic factors (job related)
8.9% Extrinsic factors (pay, promotions, bonuses)19.5% People relationship factors
8.0% Job security3.0% Shift work (hygiene factor)
7.7% Other hygiene factors (overtime, work conditions)
100.0%
Hypothesis 7 (grade/job security motivation orientation) was
supported. Grade level was correlated with IMO (r = .200) with a
significance of p=.033. This provides evidence that those with higher
grade levels are more likely to choose intrinsic factors. Being in one of 91
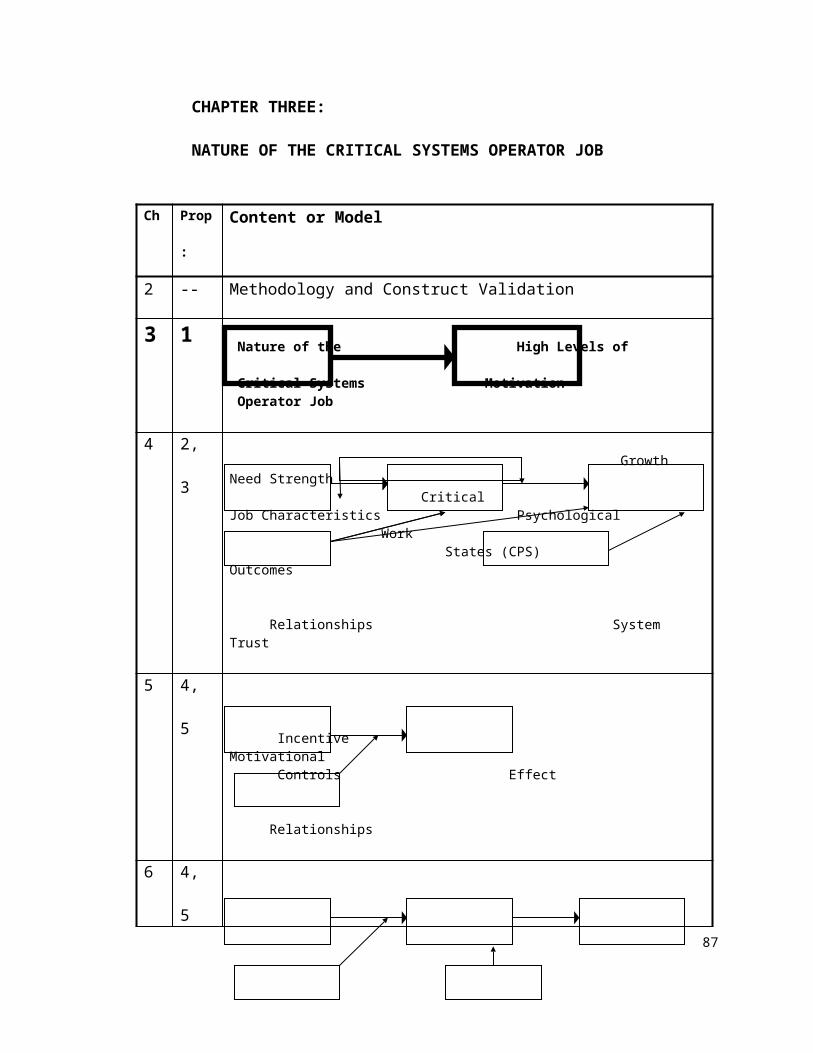
the more job-secure groups was correlated with IMO scores (r = .405),
at p=.000 level. This strongly indicates that lack of job security led
hardware operators to think more in terms of extrinsic rewards, rather
than intrinsic ones. As an alternative to grade level, age was tested.
Age was not a factor (r = .073, p=.253).
Hypothesis 8 (CTE importance) was strongly supported.
Contribution to Team Effectiveness was highly correlated with
Individual Performance (r = .84, p=.000). In terms of prediction, CTE
predicted Individual Performance at an adjusted R-squared level
of .71. A caveat of this result is that CTE and Individual Performance
were both reported by the supervisor (see Mono-method bias in
Chapter Two). However, Individual Performance was based on written
performance appraisal documentation.
Hypothesis 9 (job security effects on relationships) was
supported, but Hypothesis 10 (job security effects on motivation) was
not (Table 12). That is, those in less secure groups had lower levels of
trust in their supervisor. Yet their motivation levels were no different
than those in more secure groups.
Table 12 Correlations between Less Secure Group and Other Attributes (Hypotheses 9 and 10)
Less Secure Group correlations with:
r p Trusting Belief-Benevolence .261 .008Trusting Belief-Competence .219 .021Liking .258 .008
92
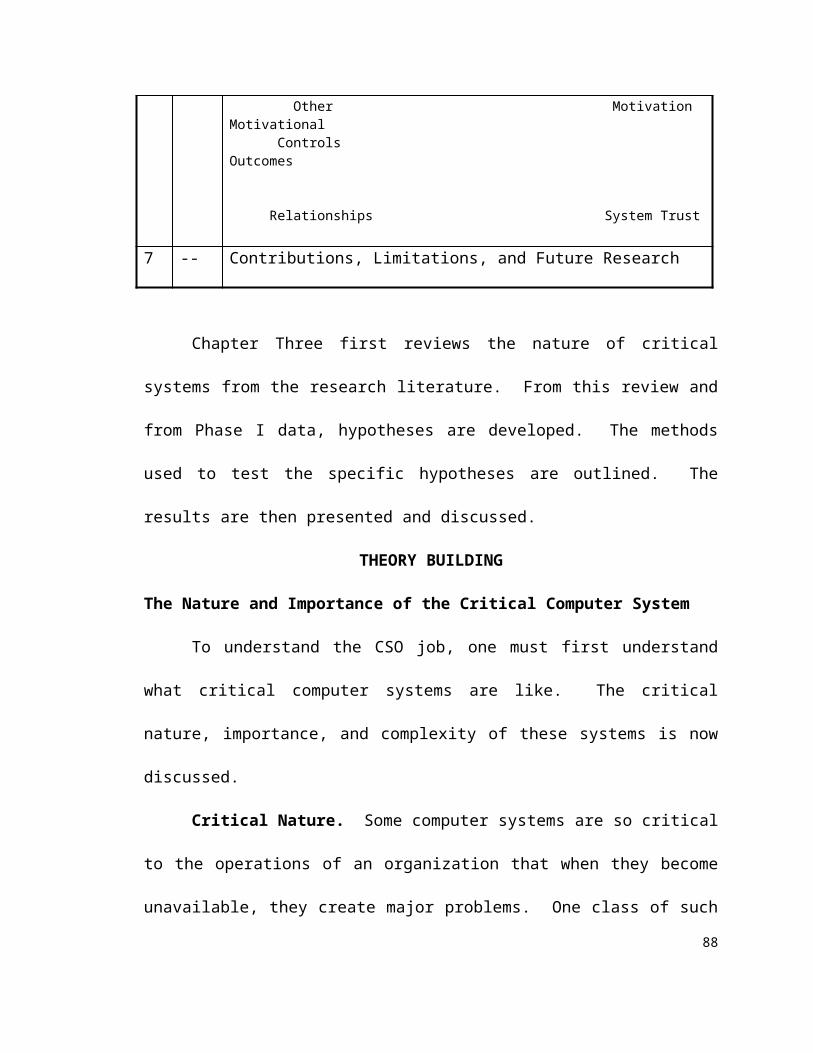
IM-Enjoyment -.035 .376Organizational Commitment -.076 .244Job Satisfaction .135 .108
Eliminating Plausible Alternatives
In order to establish these hypotheses’ internal validity with
greater confidence, the researcher entered a number of plausible
alternatives into the equations predicting the CPS and Work
Outcomes. These included demographic variables (age, grade level,
education), individual situation variables (number of recent
promotions, number of recent pay raises, percent of time keeping
systems available, duration of time worked with supervisor), and
variables providing possible alternative explanations (interaction with
team members, interaction with supervisor, relationship with team
members). These variables added little predictive value to the Work
Outcomes models’ most significant equations (i.e., predictions of IMSE
and JobSat). Only grade level helped ‘predict’ Performance. However,
good Performance is more likely to cause higher grade levels than
vice-versa. So grade level was eliminated from consideration as a
Performance predictor. Because these plausible alternatives were
eliminated, one can have greater confidence in the internal validity of
the best equations for the Work Outcomes models (see Table 14).
While none of the plausible alternatives helped predict Felt
Responsibility, two alternatives successfully entered the equations 93
predicting the other CPS. Education level was strongly (negatively)
predictive of Experienced Meaningfulness (beta = .317, p = .000), and
the CSO’s relationship with team members was predictive of
Knowledge of Results (beta = .244, p = .015). The fact that the CSO’s
relationship with the team was related to Knowledge of Results
indicates that having a good relationship with peers helps CSOs know
how they are doing on the job. Perhaps they receive considerable
feedback from their peers, as well as from the job. This was also
indicated in the answers to the questions about pressure on the job.
Many respondents, after indicating that they did not feel significant
pressure to perform well from managers or supervisors, said they felt
more pressure from the job itself and from their peers. The highly
negative correlation between education level and Experienced
Meaningfulness can be interpreted as follows. It is possible that
education broadens one’s views of what is important in the workplace
generally. If so, those with more education would be less ‘impressed’
by the importance or meaningfulness of their current job because they
would have more knowledge of other interesting jobs in the economy.
DISCUSSION OF RESULTS
The results of Hypotheses 1-4 underscore the highly motivating
nature of the CSO job. In particular, while it is impressive that
XYZCo’s motivating potential score more than doubled that of
Couger’s computer operators, it is even more impressive that the 94
operator job is significantly more motivating than that of the system
developer—a job which has received much more research attention in
the past. These results confirm that the CSO job is very different from
that of the traditional computer operator, placing it in the general
class of critical technology systems jobs (e.g., nuclear plant
operators).
Critical systems operators are primarily motivated to work hard
for the organization through intrinsic factors like the job’s challenge
(53%) and through people relationships (20%), rather than through
extrinsic motivation (9%). Those with higher grade levels and secure
positions are significantly more intrinsically motivated than their
counterparts. Operator Contribution to Team Effectiveness (CTE) is
closely related to operator Performance rating, showing how important
supervisors consider CTE to be. Operators in secure groups had
higher trust and liking towards their supervisor, but did not report
significantly higher levels of motivation than did their counterparts.
This latter finding shows the over-arching power of the critical systems
job to motivate the operator. Apparently, the job’s characteristics are
powerful enough to lead to high levels of job enjoyment,
organizational commitment, and job satisfaction in spite of being in an
insecure group. This agrees with the relatively infrequent mention
(8%) of job security as a motivational driver. Additional analysis
revealed that Experienced Meaningfulness and Intrinsic Motivation—95
Self-Esteem were not significantly correlated with secure group either.
One explanation of this is that workers who stay in insecure groups (or
companies) tend to reconcile their feelings about such groups. This
would happen in order for them to reconcile their feelings about
continuing to work there. Some evidence exists that workers are
beginning to adapt to the fact that the American dream of job security
is no longer the same (Wall Street Journal, 1995).
If the CSO job is highly motivating, the question remains: which
specific tasks are CSOs most motivated to do? It was suggested to the
researcher by an advisor that a highly visible and appreciated task like
fixing the system may be more attractive to the CSO than an almost
invisible task like preventing problems. This was informally termed
the “Red Adair versus Maytag repair” syndrome. The CSO reward
system is likely to favor fixing the system, as opposed to preventing
system problems. At the extreme, a CSO may feel a disincentive to do
preventive maintenance, for three reasons. First, fixing the system is
probably more intrinsically motivating and brings greater job
satisfaction than the prevention job because it is more challenging.
Second, the ‘honor and glory’ is more likely go to the CSO in heroic
fire-fighter mode, because of the high visibility of an outage (and the
longer the outage, the more visible it is). Third, the fix-it task
preserves the power of the operator (Crozier, 1964), as discussed
earlier. The researcher found no evidence that this phenomenon was 96
taking place at XYZCo. On the contrary, the researcher found that
when a new manager asked who had fixed a particularly troubling
outage, the supervisor refused to give out an individual name, stating
that it was a team effort. The fact that fix-it successes were identified
as team, rather than individual, successes suggests that the Red Adair
versus Maytag repair syndrome may not exist at XYZCo.
In sum, the picture of the critical systems operator job reflects:
extremely high motivating potential,
the job itself (intrinsic factors) as the primary motivator
and relationships the secondary motivator,
extrinsic and job security factors less important,
job security positively related to operator/supervisor
relationships, and
Contribution to Team Effectiveness a paramount virtue in
supervisors’ eyes.
The highly intrinsically motivating nature of the operator job is
likely to impact additional parts of this study. For example, because
this job is so highly motivating, job characteristics are likely to be
especially important to worker motivational outcomes. Hence, the
basic tenets of the JCM (tested in Chapter Four) are likely to hold. For
the same reason, however, Relationships and System Trust are not
likely to be as important to worker motivational outcomes as job
characteristics. Chapter Three evidence on what motivates operators 97
supports this prediction. Even though about 20% of comments
mentioned relationship issues, nearly three times as many referred to
job-related / intrinsic motivational factors. Chapter Four examines
further the relative importance of relationship and intrinsic factors.
98
CHAPTER FOUR:
JOB CHARACTERISTICS MODEL--ADDING RELATIONSHIPS
Ch Prop: Content or Model
2 -- Methodology and Construct Validation
3 1 Nature of the Critical Systems High Levels of Operator Job Motivation
4 2, 3 Growth Need Strength
Job Characteristics Critical Work
Psychological Outcomes States (CPS)
Relationships System Trust
5 4, 5
Incentive Motivational Controls Effect
Relationships
6 4, 5
Other Motivation Motivational Controls Outcomes
Relationships System Trust
7 -- Contributions, Limitations, and Future Research
99
THEORY BUILDING
Chapter Four first builds hypotheses regarding the Job
Characteristics Model (JCM), expanding upon Chapter One’s
Propositions 2 and 3. These hypotheses are supplemented by
hypotheses on the incremental predictive power of Relationships and
System Trust. The methodology for testing the hypotheses is detailed
and the research results are presented and discussed.
JCM Related Research
The hypotheses in Chapter Four primarily come from literature,
supplemented by Phase I results. The Hackman and Oldham Job
Characteristics Model posits that the worker’s perceptions of five job
characteristics (Job Significance, Task Identity, Skill Variety, Autonomy,
and Job Feedback) will predict the Critical Psychological States that, in
turn, affect Work Outcomes. The Critical Psychological States are
Experienced Work Meaningfulness, Felt Responsibility, and Knowledge
of Results.
While the Job Characteristics Model has had some criticism (e.g.,
Roberts & Glick, 1981), significant amounts of evidence support the
model (e.g., Hackman & Oldham, 1976; Hackman, 1980). In MIS
research, Couger and Zawacki (1980) applied the Job Characteristics
Model. In general, their research supported the tenets of the JCM.
The recent dissertation study of Lending (1996) also supported the
basic premises of the JCM. Lending also confirmed earlier research 100
findings that combining the job characteristics in an additive way
predicts better than in the multiplicative way that Hackman & Oldham
prescribed. Note that Hackman & Oldham’s (1975) version of the JCM
focuses solely on job characteristics without employing the effects of
controls or relationships, as does the Management Controls /
Relationships model. Lending (1996) pointed out that the JCM
originally (Hackman & Lawler, 1971) included two interpersonal
characteristics (friendship opportunities, dealing with others) that
were later removed.
The alternative offered to the JCM by Salancik and Pfeffer
(1978), Social Information Processing (SIP), says that task attitudes
are socially constructed from organizational influences rather than
from the characteristics of the job, as the JCM posits. While the JCM
theory has generally found more support than SIP (Glick, Jenkins &
Gupta, 1986), the void created by removing interpersonal issues was
partially filled by SIP. Rather than looking directly at the effects of
management controls and relationships between people, as this study
does, however, SIP looks at how people’s perceptions of their jobs are
influenced socially through cognitive processes. Because some have
found that the leader/worker relationship is as important to job
motivation as the task itself (e.g., McIntosh, 1990), this study later
tests the effects of relationships on motivation.
JCM Hypotheses101
The hypotheses of this section follow the detailed version of the
Hackman/Oldham model, as depicted in Figure 10 in Chapter Two.
Justification for the original hypotheses may be found in the
Hackman/Oldham studies (e.g., Hackman, 1980; Hackman & Oldham,
1975). Chapter 2 reported that the constructs in the JCM did not
summarize reliably at the concept level (see Table 8). Hence, instead
of testing some hypotheses at Figure 1’s level of Job Characteristics,
Critical Psychological States, and Work Outcomes, JCM hypotheses
were formed at the construct level (e.g., Felt Responsibility, Job
Satisfaction—see Figure 10 in Chapter Two). Therefore:
Hypothesis 11: Skill Variety, Task Identity and Job Significance
will each be positively associated with Experienced Work
Meaningfulness, moderated by Growth Need Strength.
Hypothesis 12: Autonomy will be positively associated with
Felt Responsibility, moderated by Growth Need Strength.
Hypothesis 13: Job Feedback will be positively associated with
Knowledge of Results, moderated by Growth Need Strength.
102
Hypothesis 14: Experienced Meaningfulness, Felt
Responsibility, and Knowledge of Results will each be positively
associated with Intrinsic Motivation-Self-Esteem, Job Satisfaction, and
Work Performance, moderated by Growth Need Strength.
Relationships- and System Trust Related Hypotheses
As briefly discussed in Chapter One, both the originators of the
JCM (Hackman & Lawler, 1971) and its competitors (Salancik & Pfeffer,
1978) have recommended the use of social factors in predicting work
motivation. Hackman & Lawler (1971) used social needs (dealing with
others during work, friendship opportunities) to help predict
motivational outcomes. While these social needs were found to
correlate significantly with job satisfaction, they did not correlate with
other work outcomes, defined as motivation, performance, and
reduced absenteeism (Lending, 1996).
In MIS studies, social aspects of Hackman & Oldham’s (1975) Job
Diagnostic Survey (JDS) have been employed. Couger & Zawacki
(1980) used feedback from supervisors, and dealing with others to
represent the social side. Lending (1996) used three JDS social
variables in her study, dealing with others, friendship opportunities,
and feedback from agents. Lending grouped these with other job
characteristics into a ten-factor index. She did not report the
individual predictive power of these social variables. They probably 103
added predictive power, however, because the ten-factor index out-
predicted the traditional five-factor index. This was especially true for
Job Satisfaction, in that the ten-factor index’s adjusted R-squared
was .22, while the additive five-factor index had an R-squared of
only .10. However, Lending’s exploratory model building included a
construct called “Satisfaction with Supervisor” that raised the ten-
factor index explanation of Job Satisfaction from an adjusted R-
squared of .22 to .33. Expanding her model with a Job Security
construct further increased the adjusted R-squared to .36. Lending
reported that both Satisfaction with Supervisor and Job Security
worked best as moderators in these equations. Couger & Zawacki
(1980) did not report large predictive power from dealing with others,
compared to the core job characteristics variables. However, Couger
& Zawacki reported that feedback from supervisors was correlated
highly (r= .41) with internal work motivation, which was higher than
correlations of any of the core job characteristics variables. Thus,
evidence from Lending (1996) and Couger & Zawacki (1980) provided
strong incentive to employ worker/supervisor relationships as a factor
in predicting operator motivation.
Salancik & Pfeffer (1978) related social cognitive processes to
worker perceptions of the job. They (and others—e.g., Griffin, 1983)
have found support for their Social Information Processing (SIP) model.
However, overall, the Hackman/Oldham model, which excluded social 104
needs, had greater predictive power than the SIP model, based on
Taber and Taylor’s (1990) meta-analysis.
In exploring why social factors inconsistently predicted work
outcomes in the original JCM and SIP theories, two aspects of the JCM
and SIP’s treatment of sociality became clear. First, those variables
did poorly that looked at employee lateral (peer) sociality, rather than
the vertical (employee/boss) relationship. In contrast, Couger &
Zawacki’s (1980) vertical construct, feedback from supervisors, did
better than the peer-related variables. Second, each theory primarily
considers relationships indirectly. SIP examined how cognition is
influenced socially. The original JCM tested how social needs
influenced motivational outcomes rather than directly examining the
relationships between people.
This research is based upon the premise that looking directly at
the worker/supervisor relationship could add greater incremental
predictive power than the approaches employed by the original JCM or
SIP studies. Some evidence from the literature encouraged this
thinking. First, such relationship variables as trust demonstrated a
surprisingly strong impact in some organizational settings (e.g.,
Atwater, 1988). Worker/supervisor relationships has been found to be
significantly correlated with organizational commitment (e.g., Tansky,
1993), a motivational outcome. Second, Smits, McLean and Tanner
(1997) found that the worker/supervisor relationship was one of the 105
two most significant predictors of organizational commitment of
information systems people. This was particularly impressive because
their study included a large number of other independent variables.
Therefore:
Hypothesis 15: Critical systems operator/supervisor
Relationships will be predictive of CPS and Work Outcomes (in the
positive direction) beyond the predictive power of Job Characteristics
Model variables.
Relationships and System Trust were defined in Chapter Two.
This study conceptualizes Relationships in terms of Liking and three
types of trust (see Table 3 in Chapter Two). Liking represents the
affective dimension of the relationship, while the two Trusting Beliefs
represent the cognitive dimension. Finally, Trusting Intention reflects
one’s willingness to depend on the supervisor. Hence, Relationships is
a balanced set of variables that represent how one feels, believes, and
intends to act toward, one’s supervisor. System Trust means a
person’s belief about the structures supporting success in the work
environment. In a sense, System Trust communicates what the
operator believes about the organization or organizational subgroup of
which s/he is a part. For this reason, one might say that System Trust
reflects an operator’s relationship with the organization. Just as the 106
Relationships construct means the extent to which one holds positive
feelings, beliefs and intentions towards another person, so System
Trust refers to one’s feelings/beliefs about the organization. How one
feels about the organization probably motivates one to be committed
to it or to desire to work hard for it. Therefore, System Trust will likely
be positively associated with such motivational Work Outcomes as
contained in the JCM.
System Trust will probably not be strongly related to CPS,
however, since CPS reflect how one feels towards specific aspects of
the job, not the overall work situation. For example, Experienced
Meaningfulness means that one experiences the work as being
important. Similarly, Knowledge of Results means that one
understands the outcomes of one’s job. These are narrowly focused
on job-related psychological states. System Trust, which focuses on
general perceptions of the work environment, is more likely to be
related with the Work Outcomes of CPS, since Work Outcomes reflect
less narrow views of the worker’s motivation, such as Job Satisfaction
or Intrinsic Motivation.
Hypothesis 16: System Trust will be predictive of Work
Outcomes (in the positive direction) beyond the predictive power of
Job Characteristics. System Trust will not add to Job Characteristics’
prediction of Critical Psychological States.107
Given how strongly predictive job characteristics were (see
Chapter Three), Hypotheses 15 and 16 represent strong tests of the
impact of Relationships and System Trust in a work environment.
That is, in a work environment that is so intrinsically motivating, the
effects of social or relationship constructs are very likely to be
overpowered by the intrinsic motivators present. Therefore, if
Hypotheses 15 and 16 are affirmed in this environment, they are even
more likely to hold in less intrinsically motivating environments.
METHODOLOGY DETAIL
Hypotheses 11-16 were tested using regression analysis. To
avoid the multicollinearity problem, the interaction terms were
created by multiplying standardized terms together (Aiken & West,
1991).
RESULTS OF HYPOTHESIS TESTING
Table 13 summarizes the results of the tests of Hypotheses 11-
14. Hypothesis 11 (Job Characteristics Experienced Meaningfulness)
was strongly supported. All three of the hypothesized job
characteristics, GNS, and one interaction entered the equation
significantly. Hypothesis 12 (Autonomy Felt Responsibility) was not
supported. Since Job Feedback predicted Knowledge of Results,
Hypothesis 13 (Job Feedback Knowledge of Results) was supported.
Hypothesis 14 (CPS Work Outcomes) was partially supported. Both 108
Job Satisfaction and Intrinsic Motivation were predicted by some
combination of Experienced Meaningfulness and GNS. However,
Performance was not predicted by any of the CPS or GNS.
Table 13 Job Characteristics Model Test Results
H#
Independent Variables
Dependent Variables R 2 ad
jFstat
Significant Constructs p
11
Skill Variety+ Job Identity+ Job Significance+ GNS+ interactions
Experienced Meaningfulns.
.366 .000Job SignificanceSkill Variety Job IdentityGNSSkill Variety X GNS
.323.180.217.211.242
.005.049.017.049.019
12
Autonomy+ GNS + interaction
Felt Responsibility
-.014
.616 -- -- --
13
Job Feedback+ GNS + interaction
Knowledge of Results .204 .000 Job Feedback .46
6.000
14
Experienced Meaningfulns. + Felt Responsibility + Knowledge of Results+ GNS + interactions
Intrinsic Motivation .170 .003
Experienced Meaningfulns.
GNS
.425
.256
.002
.023
14
Experienced Meaningfulns. + Felt Responsibility + Knowledge of Results + GNS + interactions
Job Satisfaction .343 .000
Experienced Meaningfulns.GNS X Experienced Meaningfulns.
.725
.399
.000
.001
14
Experienced Meaningfulns. + Felt Responsibility + Knowledge of Results + GNS + interactions
Individual Performance
-.035
.760 -- -- --
109
Table 14 shows the results from Hypotheses 15 and 16. For
Hypothesis 15, Relationships with supervisors enters the equations
predicting Experienced Work Meaningfulness (15a) and Felt
Responsibility (15b). However, Table 14’s equation predicting Felt
Responsibility is still nonsignificant, based on the F-statistic. In the
equation predicting Experienced Meaningfulness (15a), the beta for
Relationships is higher than that of any other variable, and raises the
adjusted R-squared from .366 to .492. Separate from Table 14,
however, it was found that when the interaction terms and the non-
significant Skill Variety construct are removed from this equation, Job
Significance has a higher beta (.455) than Relationships (.335). So
Relationships is not as predictive as Job Significance. In the equation
predicting Knowledge of Results (15c), Relationships is not significant
because it is highly correlated with Job Feedback (r = .465).
Relationships does not predict the Work Outcomes (15d,e,f), except
Performance. Based on the F-statistic, however, the Performance
equation (15f) is not significant.
In support of Hypothesis 16, System Trust enters the equations
predicting Job Satisfaction (16b) and Performance (16c). However,
based on the F-statistic, the equation predicting Performance is not
significant overall. System Trust does not help the prediction of
Intrinsic Motivation (16a). As predicted, System Trust did not predict
CPS (16d,e,f). System Trust has only modest predictive power for 110
Experienced Meaningfulness (16d), and no predictive power for Felt
Responsibility (16e) and Knowledge of Results (16f).
111
Table 14 Relationships and System Trust Test Results
H# Independent VariablesDependent Variables R 2 ad
jFstat
Significant Constructs p
15a
Skill Variety+ Job Identity+ Job Significance+ GNS + interactions + Relationships
Experienced Meaningfulns.
.492
.000
Job SignificanceJob IdentityGNSSkill Variety X GNSRelationships
.355.198.258.340.394
.001.016.008.000.000
15b
Autonomy+ GNS + interaction+ Relationships
Felt Responsibility
.023
.209
Relationships .220
.045
15c
Job Feedback+ GNS + interaction+ Relationships
Knowledge of Results .19
4.000
Job Feedback .471
.000
15d
Experienced Meaningfulns. + Felt Responsibility + Knowledge of Results+ GNS + interactions+ Relationships
Intrinsic Motivation .17
7.003
Experienced Meaningfulns.
GNS
.355
.243
.016
.030
15e
Experienced Meaningfulns. + Felt Responsibility + Knowledge of Results+ GNS + interactions+ Relationships
Job Satisfaction .33
5.000
Experienced Meaningfulns.
GNS X Experienced Meaningfulns.
.713
.392
.000
.001
15f Experienced Meaningfulns. + Felt Responsibility + Knowledge of Results+ GNS + interactions+ Relationships
Individual Performance
.029
.247
Relationships .297
.016
16a
Experienced Meaningfulns. + Felt Responsibility + Knowledge of Results+ GNS + interactions+ System Trust
Intrinsic Motivation .16
5.004
Experienced Meaningfulns.
GNS
.405
.266
.004
.020
16b
Experienced Meaningfulns. + Felt Responsibility + Knowledge of
Job Satisfaction .41
5.000
Experienced Meaningfulns.GNS X Experienced
.648
.000
112
Results+ GNS + interactions+ System Trust
Meaningfulns. System Trust
.354.284
.001.002
16c
Experienced Meaningfulns. + Felt Responsibility + Knowledge of Results+ GNS + interactions+ System Trust
Individual Performance
.006
.395
System Trust .234
.046
113
Table 14 (Continued)16d
Skill Variety+ Job Identity+ Job Significance+ GNS + interactions + System Trust
Experienced Meaningfulns.
.393
.000
Job SignificanceJob IdentityGNSSkill Variety X GNSSystem Trust
.337.184.267.266.197
.003.041.014.009.038
16e
Autonomy+ GNS + interaction+ System Trust
Felt Responsibility
.013
.282
-- -- --
16f Job Feedback+ GNS + interaction+ System Trust
Knowledge of Results .19
4.000
Job Feedback .468
.000
DISCUSSION OF RESULTS
First, the hypotheses related to the JCM itself are discussed.
Since most of the equations predicting CPS and Work Outcomes are
significant, the basic tenets of the Job Characteristics Model were
largely supported by the study’s data. The fact that few interaction
terms were significant in the six models is consistent with earlier
findings (Griffin, Walsh & Moorhead, 1981). In the critical systems
environment, Experienced Work Meaningfulness emerged as a very
important psychological state in terms of predicting two of the three
Work Outcomes. Job Significance was the most important predictor of
Experienced Work Meaningfulness. Job Feedback successfully
predicted Knowledge of Results. But neither Knowledge of Results nor
Felt Responsibility had any effect on the Work Outcomes. However,
exploratory regression analysis revealed that Knowledge of Results 114
was significantly correlated with Felt Responsibility, which in turn was
significantly correlated with Experienced Meaningfulness.
Second, hypotheses concerning Relationships and System Trust
are discussed. Relationships and System Trust have significant
predictive effect in two of the equations. In light of the highly
intrinsically motivating job studied, this finding is remarkable.
Relationships adds predictive power to the JCM equation predicting
Experienced Work Meaningfulness. This by itself is important, since
Experienced Work Meaningfulness is the most powerful predictor of
Job Satisfaction and Intrinsic Motivation. System Trust adds predictive
power to the JCM equation predicting Job Satisfaction. In the critical
systems setting, as expected, the characteristics of the job appear to
be the most important factors in predicting Critical Psychological
States (CPS). One CPS, Experienced Meaningfulness, was the most
important factor in predicting two Work Outcomes—Job Satisfaction
and Intrinsic Motivation. Since Relationships and System Trust add
predictive value to two of the more important of the JCM equations,
they represent a vital missing element in the current configuration of
the JCM.
While none of the Table 14 equations predicted Performance,
exploratory analysis found that Relationships by itself predicted
Performance with an R-Squared of .043, Beta = .233, and p = .031.
Hence, Relationships was a better predictor of Performance than any 115
of the JCM variables. However, even Relationships did not predict
Performance well. From Chapter Three results, Contribution to Team
Effectiveness was a major predictor of Performance. Performance
may also not be predicted by motivation-related variables because
variables not measured, like the CSO’s skill, knowledge, and ability,
were much more important predictors of performance. Another
possible explanation is that supervisors (the informant for
Performance) may distinguish employees more via skill, knowledge,
and ability than via motivation levels. This seems plausible in light of
the high mean scores and low standard deviations of the CPSs (Felt
Responsibility, Experienced Meaningfulness, and Knowledge of
Results--see Appendix I).
In summary, Chapter Four provides evidence that:
the JCM applies in the Critical Systems Operator (CSO)
environment;
the job’s significance and related Experienced Work
Meaningfulness are the most important factors in
predicting CSO intrinsic motivation and job
satisfaction, and, therefore, the work context makes
a difference;
by increasing the variance explained from .366 to .492
(34%), Relationships with the supervisor adds
116
significant power to the JCM’s prediction of
Experienced Meaningfulness;
by increasing the variance explained from .343 to .415
(21%), System Trust adds significant power to the
JCM’s prediction of Job Satisfaction.
Chapter Four’s evidence that relationships matter beyond the
power of the JCM constructs is especially striking in light of Chapter
Three’s evidence that the CSO job is highly extrinsically motivating.
Further, while Chapter Three demonstrated that Relationships are
qualitatively important to CSO motivation, Chapter Four quantifies
that importance using an entirely different method. Together, these
two methods provide triangulated evidence (Kaplan & Duchon, 1988)
for the importance of relationships.
117
CHAPTER FIVE:
INCENTIVE CONTROLS--ADDING RELATIONSHIPS
Ch Prop: Content or Model
2 -- Methodology and Construct Validation
3 1 Nature of the Critical Systems High Levels of Operator Job Motivation
4 2, 3 Growth Need Strength
Critical Job Characteristics Psychological Work
States (CPS) Outcomes
Relationships System Trust
5 4, 5
Incentive Motivational Controls Effect
Relationships
6 4, 5
Other Motivation Motivational Controls Outcomes
Relationships System Trust
7 -- Contributions, Limitations, and Future Research
Chapter Five first reviews theory about Incentive Controls.
Hypotheses are then tailored to the XYZCo environment. The
118
methodology for testing the hypotheses is detailed, and then the
results are presented and discussed.
THEORY BUILDING
Definitions
One view of management controls is to measure performance
against some comparison standard (Davis & Olson, 1985: 319). This
definition of controls is broad enough to fit several control
mechanisms, such as monitoring, feedback and accountability. Other
controls definitions augment the comparison-versus-standard view of
control. At the organizational level, the term "controls" means the
process of assuring that resources are used effectively to accomplish
an organization's goals (Anthony, 1965). This is a broad, structural
definition. At an interpersonal level, the term "controls" means the
processes used "to direct, to influence, or to determine the behavior of
someone else" (Lawler & Rhode, 1976: 1248). Combining the
meanings from Anthony and Lawler & Rhode, this study defines
controls as methods of attempting to ensure desired outcomes by
trying to influence other people. Management controls occur when
managers use various methods to try to influence employees to
behave in ways that lead to outcomes desirable to management. This
definition is similar to Kirsch’s (1992: 9) interpretation of Anthony’s
view of control: “motivating individuals to act in accordance with
organizational objectives.”119
Control is distinguished from related concepts as follows.
Influence is a descriptive term that means that one person causes
changes in another person’s behavior, emotions or thoughts (Huston,
1983; Tannenbaum, 1968). Following Huston, this study defines
power as the ability (whether used or not used) to achieve desired
ends through influence. Translating the researcher’s definition of
controls in light of the definitions of influence and power, control
means trying to utilize power through influence attempts. Dominance
exists when influence is asymmetrical over a broad range of activities
(Huston, 1983). Dependence means one’s interest (what is at stake)
in satisfactions provided by the other person (Walton, 1968). Power,
controls, influence, dominance, and dependency exist in actual and
perceived form (Walton, 1968).
Controls Theory Overview
Existing controls theories (e.g., organization theory--Ouchi,
1979; agency theory--Eisenhardt, 1989b) have largely been used to
test the link between types of controls and desired outcomes. For
example, Ouchi’s (1979) controls theory said that outcome-, behavior-,
and clan controls each produce different outcomes under different
kinds of conditions. Agency Theory says that an agent will do what
the principal wants as long as: a) the contract aligns the objectives of
the principal and the agent through bonding mechanisms and/or b)
the principal can monitor the agent’s behavior (Barney & Ouchi, 120
1986). The assumptions underlying Ouchi’s control theory, Agency
Theory, and Transaction Cost Economics (Williamson, 1975) are from
the long-standing tradition in economics: people are boundedly
rational, probably opportunistic but definitely self-interested, and not
influenced socially. In other words, these theories assume that people
are not to be trusted, and therefore they should be controlled.
Organization theory and agency theory provide significant light
about how controls work in terms of what leads to the use of different
kinds of controls, and which types of controls work best on what.
However, because these theories largely ignore organizational, social,
and interpersonal factors, they have trouble explaining how controls
achieve outcomes. That is, controls work through peoples’ attitudes
towards their job, management, and the company. Controls affect,
and are affected by, the social/organizational issues (e.g., motivation,
teamwork, and trust) that are often key to positive outcomes. Several
researchers have pointed out how important workplace relationships
are toward accomplishing tasks (e.g., Ring & Van de Ven, 1994;
Gabarro, 1990). Granovetter (1985) argued that researchers should
find a balance between over-socialized (i.e., relationships are
paramount) and under-socialized (i.e., relationships don’t matter)
depictions of organizational phenomena. Granovetter maintained that
many controls theories (e.g., agency theory and transaction cost
economics) are under-socialized. To the extent that they are under-121
socialized, control theories do not adequately address the linkage
between controls, social relationships, and worker motivation.
Moreover, more work is needed to understand the mechanisms
behind the effects of controls on organizational outcomes. Powers &
Dickson (1973) found that system development project controls were
perceived to have negative effects on system development success.
However, they did not conclude why or how this occurred. Henderson
& Lee (1992) found that controls had positive effects. However, their
operational definitions of controls primarily reflected only positive
types of controls (e.g., helping behaviors) instead of the full range of
possible control mechanisms. Lawler & Rhode (1976) discussed briefly
the negative impacts of tight financial control mechanisms (e.g.,
budgets) on employee behavior, but did not explain the mechanisms
behind it. Simons (1995) said incentives stimulate initiative and
opportunity-seeking, but may have dysfunctional side-effects. Simons
did not explain this statement further.
Conceptual Model Development--Incentives
XYZCo’s context provided some clues about why controls have
dysfunctional side-effects. At XYZCo, management is concerned
enough about system availability to want to control critical systems
operator (CSO) behavior in order to improve availability. The CSOs’
management is active and involved in the day-to-day affairs of the
unit. The senior management team is keenly interested in keeping 122
the system continually available. The company has norms for doing
things right, for succeeding, and for not accepting excuses for failure.
These norms act like controls; management inculcates these norms to
try to influence workers to do things right. The company also has a
norm for rapidly fixing problems that need to be addressed, as well as
a norm for promptly reporting the problem cause and both short-term
and long-term solutions to management. Management requests
significant levels of detail on the reasons behind every outage and
what is being done to see that these underlying causes never recur.
These actions are a form of the feedback- and accountability controls
treated in Chapter Six.
Based on Phase I data, XYZCo management’s concern to keep
the systems operating primarily manifested itself through five control
mechanisms: incentives, accountability, feedback, autonomy
granting, and management involvement. The conceptual and
scientific model development and test results for incentive controls
will be discussed in this chapter. The other control mechanisms will be
covered in Chapter Six.
In 1994, senior corporate management installed a bonus award
system for all employees. Overall, the bonuses were made contingent
on division profitability. However, each work group also had its own
set of performance goals that largely determined its members’ annual
bonus awards. The division was profitable in 1994 and 1995, so 123
bonuses were given. During this period, management focused on cost
controls in order to assure high division profitability. Two interviewees
perceived this as a change from past management strategy, because
the division’s first emphasis had always been to spend enough money
on system infrastructure to assure the system would be kept highly
available. In 1996, the new management team changed the bonus
distribution from a team-based method to an individual merit basis.
The team-based method tied the bonus to specific team availability
goals, while the individual-based method was not as specific.
Interviewees said that the focus on cost savings that began about
1994 decreased morale of some operators. In part, morale decreases
were due to employees’ perceptions that management was de-
emphasizing quality of their system by spending less on it. CSOs had
always been proud of the system’s quality. Therefore, reduced
spending called into question what had been the highest priority of
employees. Also, CSOs translated events like cuts of budgeted
positions11 into job insecurity feelings. However, these slight to
moderate changes in morale did not appear to have seriously
jeopardized system availability. When the computer went down,
workers still quickly got it going again--in a very cooperative, highly
motivated manner.
11 No layoffs of any size had taken place.124
However, the incentive system did produce the potential for
negative side effects in the overall company (McKnight, 1996). Groups
that had different bases for their incentives tended to have more
conflicts with each other than they did before the incentives were
implemented. For example, the major incentive for the programming
division was now to produce more new systems, with no incentive to
maintain old systems or to keep existing systems running. Hence, the
management of the operations group felt the incentives motivated the
programmer group to implement new systems before they were
adequately tested, thereby endangering system availability.
However, the good interpersonal relationships, developed over time,
between specific programmers and operators ameliorated the conflicts
that resulted from the incentive system, such that it appeared to have
no negative effects on computer system availability.
This example supports the conceptual version of the
controls/relationships model (Figure 5—Chapter One). In this
example, interpersonal relationships moderated the effects of controls
(incentives) on system availability. Evidence in Phase I interview data
lent credence to Relationships’ moderation of the Incentive Controls
Motivation link in Figure 5. Those interviewees who appeared to have
the worst relationship with management also appeared to be most
negatively affected, in terms of morale, by the incentive plan.
125
Several interviewees also mentioned that the incentives had
made both management and technicians so cost-conscious that they
were afraid to spend money even for the “infrastructure” that would
keep the system at a high level of availability. If continued,
interviewees noted, this trend could eventually have serious
implications. One interviewee claimed that low infrastructure
spending had already resulted in at least one extended system
availability problem. Two other informants said that incentives were
encouraging the operations people to focus only on things that were
true outages, but to ignore things that inconvenienced the customer
without being outages for which operations was accountable.
From the data above, the researcher felt: a) that incentives may
have negative, as well as positive, effects on CSO motivation at
XYZCo; b) the changes in the incentive plan distribution methods may
change the plan’s effectiveness; and, c) the CSO/supervisor
relationship may influence how incentives affect CSO motivation.
Scientific Model Development-- Incentives
Earlier research has linked controls and motivation. Three most
applicable examples follow: a) scientific management theories, b)
cognitive choice theories, and, c) need-motive-value theories. From
these theories, the intrinsic motivation literature will be discussed in
more detail.
126
Scientific Management Theories. Frederick Taylor’s (1911)
research on “scientific management” of physical tasks resulted in
recommendations that workers be motivated by piece rate incentives.
“In Taylor’s view, workers would only respond to financial incentives
based on defined performance standards” (Simons, 1995: 22). To
Taylor, effective controls came through the strategic placement of a
quantified carrot. Taylor’s work coincides with a large body of
literature in learning psychology on how animals and people can be
controlled by offering them reinforcing rewards (e.g., Skinner, 1953).
Out of this tradition have come many studies in organizational
behavior on related topics such as operant learning theory (e.g.,
Hamner, 1974). As shown in Figure 4, many studies support the
proposition that incentive controls improve worker motivation (see
Hamner, 1991).
Cognitive Choice Theories. Control was the theme in early
animal experimental work in psychology. Experimenter control
assumed, however, that the animal was merely a responder to stimuli,
not a purposeful, thoughtful being. Only the actions of the animals
were studied, since their thought processes were assumed away for
purposes of empirical rectitude (Hergenhahn & Olson, 1993). While
most early work in the psychology of motivation studied behavior
only, Tolman (1932) hypothesized that motivating rats and people
involves not only behaviors, but behavior supported by cognitive 127
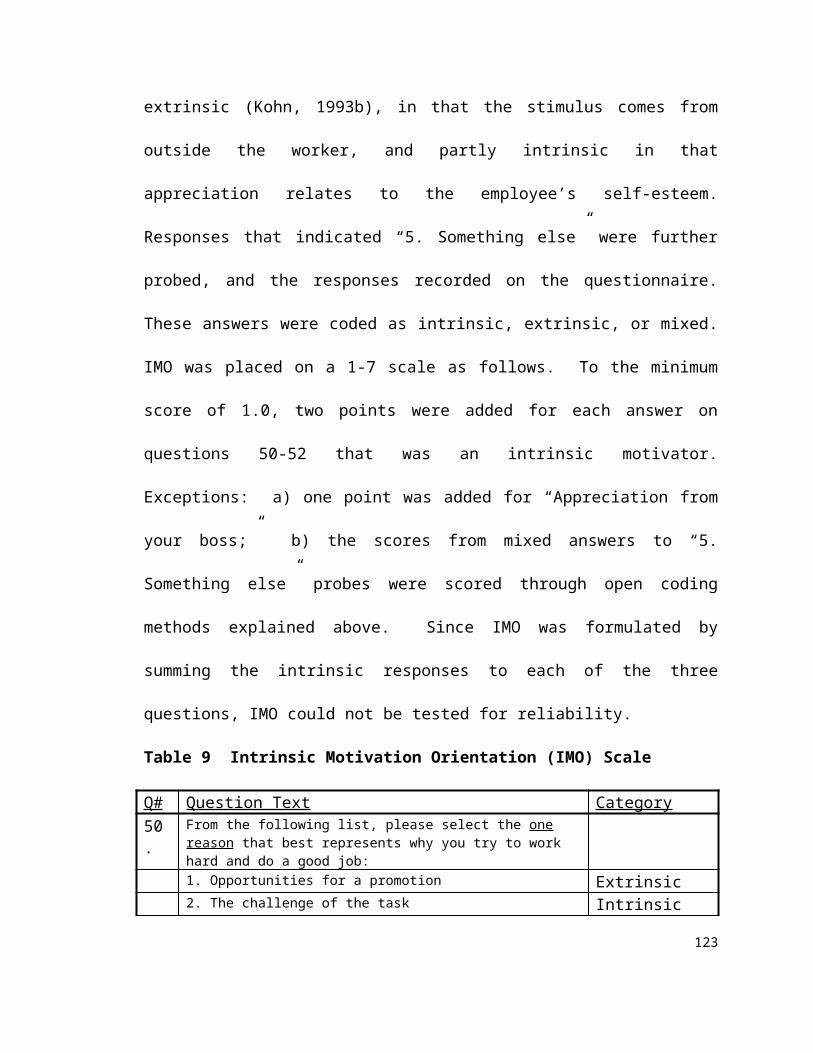
processes. The cognitive revolution in psychology spawned a number
of what Kanfer’s motivation review article (1990:75) called “cognitive
choice” theories of motivation, such as expectancy/value theory
(Vroom, 1964), attribution theory (Weiner, 1974), dynamics of action
theory (Atkinson & Birch, 1970) and “self-regulation-metacognition”
theories, such as goal setting (Locke, 1968), social learning (Bandura,
1986) and cybernetic controls theories (Carver & Scheier, 1981).
These theories do not agree with the assumptions behind the narrow
behavioral view of human motivation espoused by operant learning-
and scientific management theorists.
Need-based Theories. Also at odds with scientific
management are the need-motive value motivation theories (Kanfer,
1990). In his famous Western Electric Hawthorne research, Elton
Mayo reported that workers were motivated by the support and
sentiment of social interaction in the workplace (Mayo, 1949). Social
control by meeting worker sociality needs was the key motivator to
Mayo. The Hawthorne studies relate to what Kanfer (1990) called the
need-motive-value research in motivation. This broad area of
research includes need fulfillment theories (e.g., Maslow, 1943;
Alderfer, 1969), intrinsic motivation (e.g, Deci, 1975), and equity
theories (e.g., Adams, 1963) of motivation. For example, Maslow’s
hierarchy of needs theory said that people are first motivated to fulfill
basic needs, such as for food and safety. Once these needs are 128
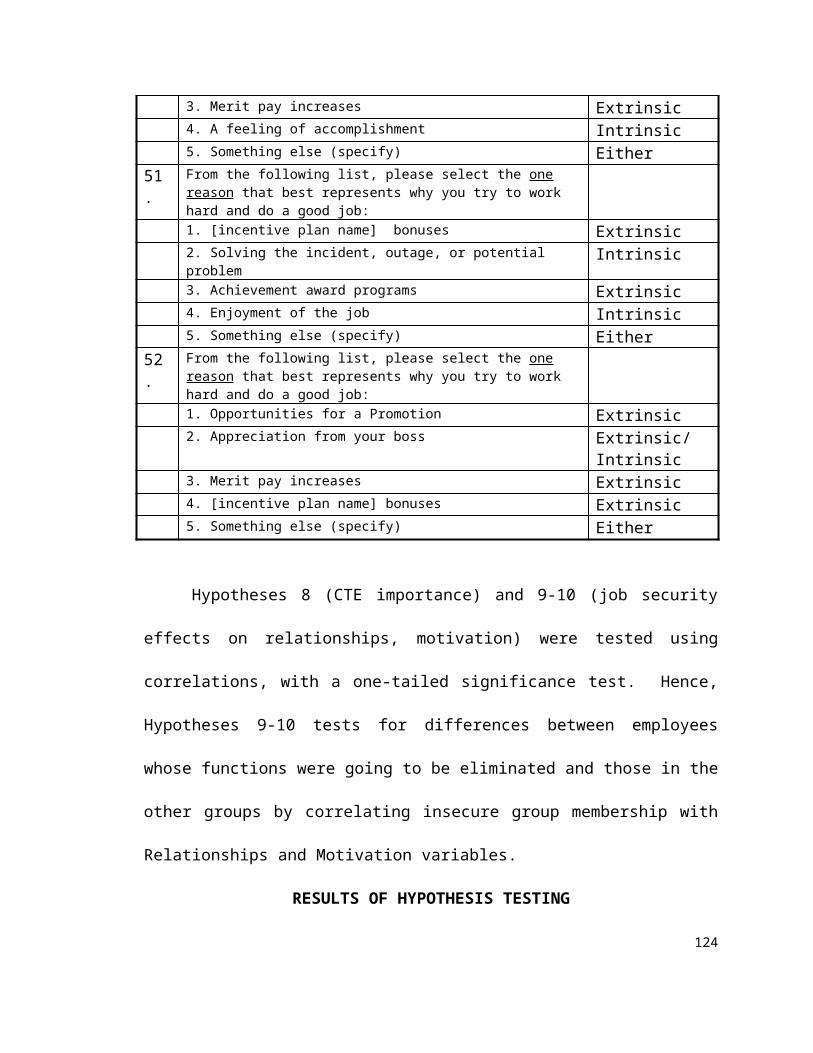
fulfilled, they no longer motivate. At this point, one desires to fulfill
higher order needs, such as love, self-esteem, and finally, self-
actualization.
One underlying difference between the operant learning and
need-based motivation theories is important for this study. The
assumptions underlying the scientific management and operant
learning theories are that humans are disconnected from each other,
self-interested, and fully rational (Simons, 1995). Note that these
assumptions are also reflected in the economic controls theories
discussed previously (e.g., Eisenhardt, 1989b). By contrast, the need-
motive-value theories assume that people are socially connected, both
self- and other-interested, and not always economically rational. In
particular, intrinsic motivation researchers have tried to reconcile the
economics-based, gain-seeking motivation perspective with the idea
that people are motivated by other needs and desires.
Intrinsic Motivation. Intrinsic motivation means motivation
that “results from an individual’s need to be competent and self-
determining” (Steers & Porter, 1979: 249). Intrinsic motivation
signifies that the outcome/reward for the work behavior comes from
inside the person (e.g., personal satisfaction). Extrinsic motivation
signifies that the outcome of the behavior comes from the outside,
such as a monetary incentive or a job promotion (Kanfer, 1990). The
inference is that a person is intrinsically motivated when outside 129
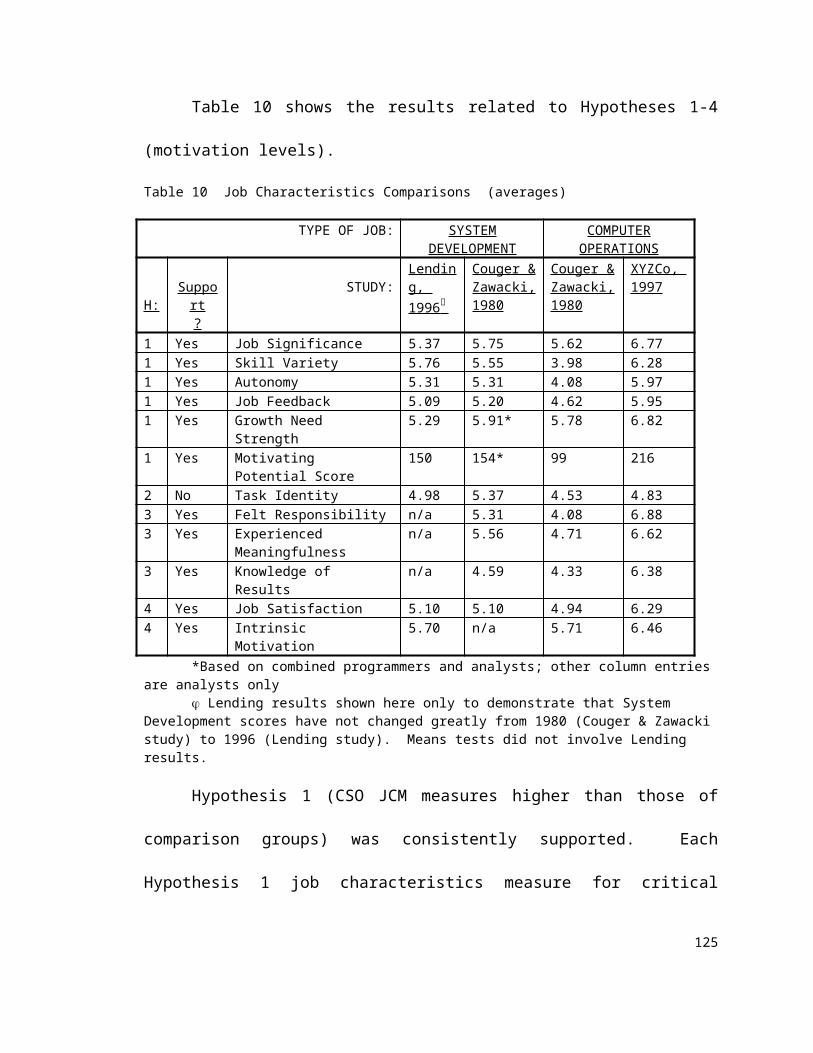
forces are not present in enough force to move one to action.
However, “[w]hen there are strong [external] forces bearing on the
individual to perform an activity, there is little reason to assume that a
behavior is self-determined...” (Staw, 1976).
Management controls constitute some of these outside forces.
That is, a control like behavior monitoring can act as an extrinsic
motivation factor. For example, Strickland found that supervisors who
watched their employees (i.e., a behavioral control, per Kirsch, 1992)
more frequently felt that the employees’ good behavior was caused by
the supervisor’s monitoring. Staw (1976) cited Strickland (1958) as an
example of how people interpret another person’s behavior as
extrinsically motivated when the other person is being controlled.
Hence, employing managerial controls can affect the manager’s views
of the worker’s motivation.
Bem (1967) said that this principle can also be applied to self-
perception: how one views the motivation behind one’s own behavior.
If one acts in the presence of strong external rewards, s/he is likely to
attribute her/his behavior to external controls. If these outside
rewards are not strong, s/he will probably assume her/his behavior is
due to his/her own interest in the activity. The same point was made
by deCharms (1968: 328): “...when a person perceives the locus of
causality for his behavior to be external to himself (that he is a Pawn),
he will consider himself to be extrinsically motivated.” Staw (1976) 130
argued that when intrinsic rewards are high and extrinsic rewards
(e.g., pay, bonuses) are low, people will perceive themselves as being
intrinsically motivated. That is, intrinsic motivation is perceived to
justify the person’s action to her/himself. However, when both
intrinsic and extrinsic rewards are high, the workers will be faced with
an unstable perception. The perception is unstable because it is
“oversufficiently justified” (Staw, 1976: 255). That is, the person feels
more than fully justified for the action taken. S/he is likely to reason,
therefore, that since the external reward by itself would have justified
the action, s/he was extrinsically motivated to perform the activity,
and therefore, the task was not that enjoyable--or intrinsically
motivating--after all. This drop in intrinsic motivation may be crucial if
the nature of the task was intrinsically motivating before: total
motivation may be decreased and task performance may therefore
suffer.
Three early studies provided evidence of this concept (see Table
15).
Table 15 Effects of Extrinsic Motivation on Intrinsically Motivating Tasks
Study Task Subjects Effects of Experimental ConditionDeci, 1971 Solving
puzzlesCollege students
Lower intrinsic motivation (i.e., less time playing with the puzzle during free time) after being paid for solving a puzzle
Lepper, Greene, and Nisbett,
Playing with Magic Markers
Nursery school children
Lower intrinsic motivation (i.e., less time playing with the markers during free-play period) after a contingent reward
131
1973Kruglanski, Freedman and Zeevi, 1971
Creativity and Memory tasks
Teenagers Less satisfaction with the task, less likely to volunteer for future tasks, lower task performance after being offered the extrinsic reward (i.e., a free tour of the laboratory facility)
Deci (1971, 1972) hypothesized that only rewards contingent on
a high level of task performance will adversely affect intrinsic
motivation. This was supported by Lepper, Greene & Nisbett (1973) in
that those in the unexpected reward condition were not as affected as
those in the expected (i.e., contingent) reward condition. In all three
of the studies summarized in Table 15, what seemed to change the
cognitive orientation of the person from intrinsic to extrinsic was the
contingent reward for a given level of output.
Eisenhardt (1985) challenged Deci’s hypothesis that extrinsic
rewards diminish intrinsic motivation. Eisenhardt used data from
specialty retailers to support her economics-based hypothesis that
incentives motivate. She found that the intrinsic motivation of those
in sales jobs who were given salient, contingent sales incentives was
not decreased. Eisenhardt interpreted this result as a contradiction of
Deci’s overjustification hypothesis. However, Eisenhardt did not
report the specific levels of intrinsic motivation her respondents
possessed, making it impossible to know whether their level of
intrinsic motivation was high enough for the overjustification
hypothesis to work.
132
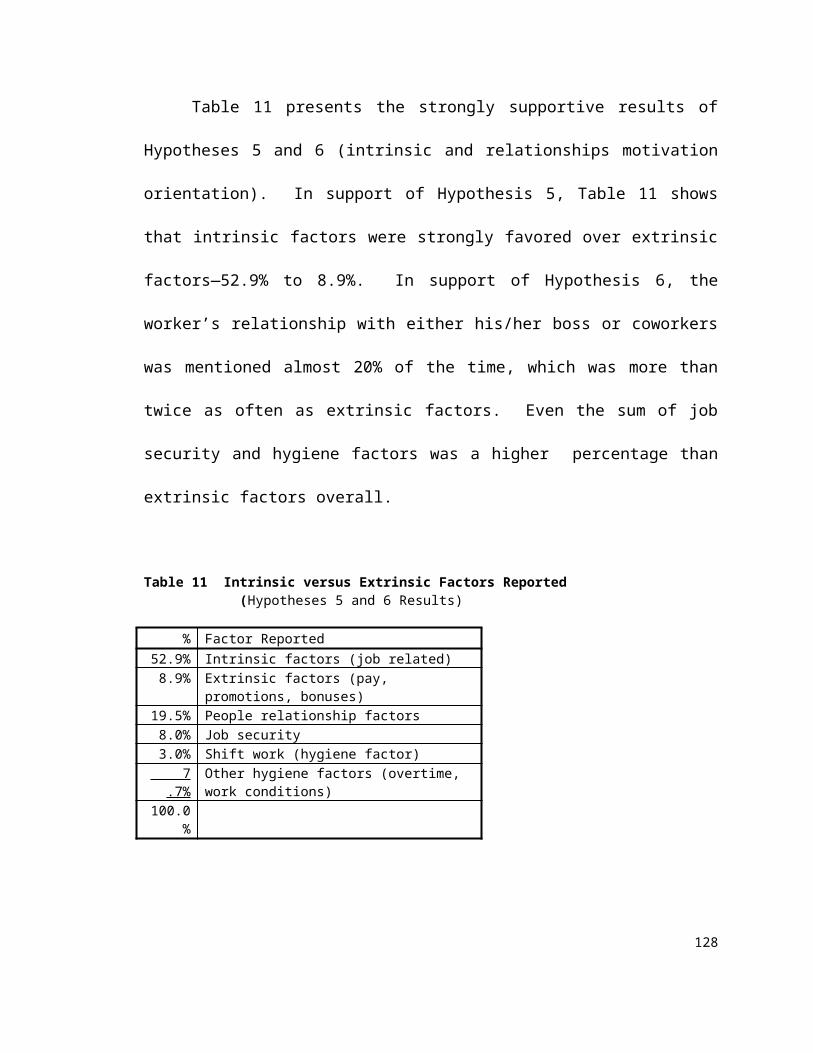
Why Extrinsic Rewards Can Demotivate. The literature
suggests two reasons why extrinsic rewards can demotivate. First, the
use of extrinsic rewards may change the person’s mind about why
they are doing the intrinsically motivating task. Before the reward
was offered, the person may have been doing the task primarily
because the task was enjoyable. The extrinsic reward convinces them
that they are doing the task for the sake of obtaining the reward
instead of for enjoyment. This causes them to dislike the task: “In
fact, the more you want what has been dangled in front of you, the
more you may come to dislike whatever you have to do to get it.”
(Kohn, 1993b: 83) Second, the use of extrinsic rewards harms the
person’s view of themselves by moving their locus of control from
internal to external. People have a desire to be efficacious and
autonomous (de Charms, 1968). They like to control their own
destiny. When the extrinsic reward moves their locus of control
outside of themselves, they may become less interested in the task.
But they also wonder: Why does my manager believe I cannot control
myself? This is not perceived as a compliment! Arguably, those who
already have a poor relationship with their management are more
likely to interpret controls negatively than are those with a good
relationship with their management.
Conditions for Proper Application of Cognitive Evaluation
Theory. Per Staw (1976, quoted in Steers & Porter, 1979: 261), 133
researchers still need to take these early findings and “determine the
exact conditions under which they might be expected to hold.” The
following discusses five conditions. These studies help by predicting
more precisely when extrinsic rewards will affect intrinsic motivation.
Condition 1—Incentive Salience. Ross (1975) showed
through two experiments that the reward offered had to be salient, or
it would not affect intrinsic motivation. Deci (1975) explained that
rewards may not be salient enough to affect negatively intrinsic
motivation because they are perceived to be informational rather than
controlling. This may occur when the reward is interpreted as
providing information related to one’s competencies--which may
enhance, rather than hurt, one’s feelings of control (Kanfer, 1990).
Evidence for this was found by Harackiewicz, Manderlink & Sansone
(1984). Similarly, Freedman, Cunningham & Krismer (1992) noted
that the greater the incentive offered, the more it will decrease
intrinsic motivation.
Condition 2—Norms. Staw, Calder & Hess (1976) found that
rewards decrease intrinsic motivation only when there is a situational
norm not to give extrinsic rewards for the task. Fisher (1978) found
that the same held for societal norms.
Condition 3—Pre-existing Level of Intrinsic Motivation.
Calder & Staw (1975) found that extrinsic rewards only hurt intrinsic
motivation when intrinsic motivation is high. When intrinsic 134
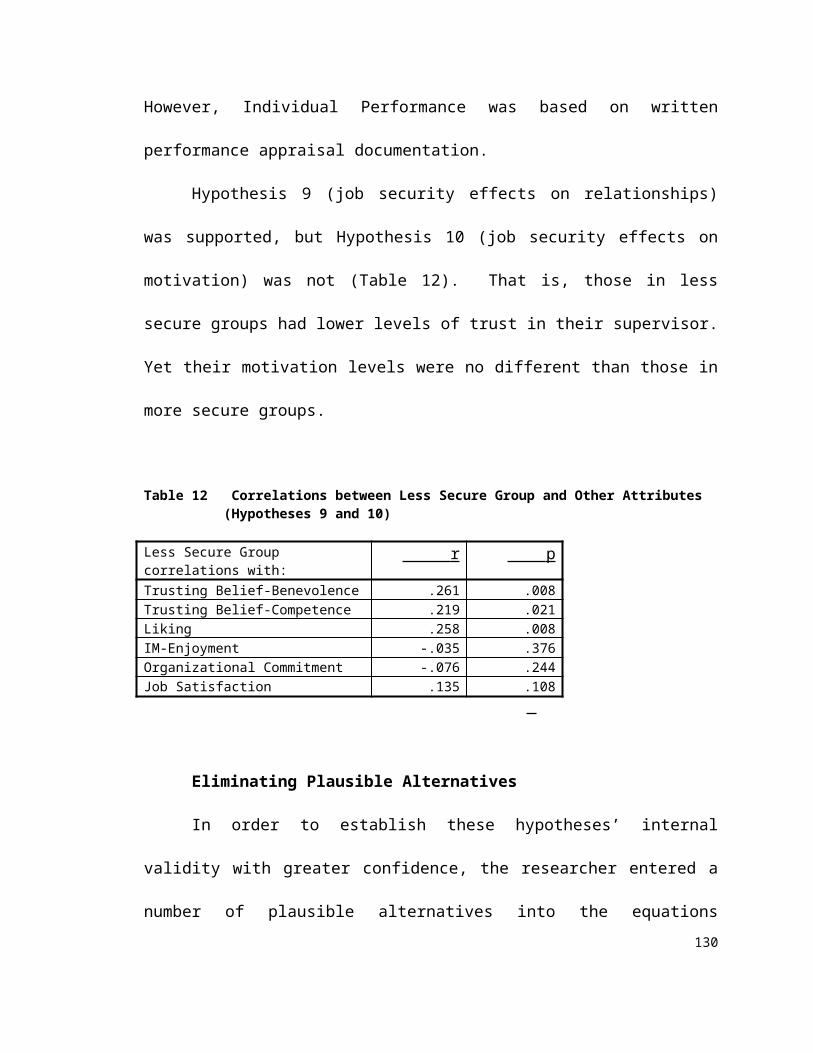
motivation is low, the rewards had a reinforcement effect that
increased overall motivation. Staw (1976) commented that most
industrial work settings do not meet the conditions for when extrinsic
rewards will hurt intrinsic motivation, because many work tasks are
not highly intrinsically motivating and extrinsic rewards are the norm.
Condition 4—Competence/Control Impact of Incentive.
Two studies found that incentives can increase intrinsic motivation if
they increase the task’s level of perceived challenge, provide the
worker additional competence information, or increase the perception
of personal control over performance (Tripathi, 1991; Lopez, 1981).
Condition 5—Perceived Reason for Incentive. Calder &
Staw (1975) also cautioned that the perception of why the reward
being offered is a key. “For example, if a financial reward is perceived
as a bonus for good work rather than as an inducement to keep
people on the job, it may not have a deleterious effect on the valence
of intrinsic outcomes” (Campbell & Pritchard, 1976: 104).
In summary, how an incentive is perceived is just as important
as its objective attributes. In particular, it is likely that when the
situation involves a highly intrinsically motivating task and extrinsic
rewards are not the norm, a salient, contingent extrinsic reward will
lead to lower intrinsic motivation for the task. In contrast, extrinsic
rewards will not negatively affect intrinsic motivation if: a) they are
not salient or contingent; b) they are already the norm; c) the task is 135
not intrinsically motivating; d) the reward is perceived to increase the
worker’s feelings of competence or control; or, e) the reward is
perceived to be a compliment for good work. Applying these factors
to XYZCo: a) The incentive award was potentially large enough in
monetary value to be salient. b) The award was the norm since 1994,
but the method of distributing the award changed in 1996 from the
previous norm of team-based to individual performance-based; c) The
task is intrinsically motivating in the extreme; d) The incentive award,
since no longer tied to specific actionable measures, did not increase
worker feelings of competence or control; e) The incentive award
could probably be more clearly interpreted as a compliment for
individual performance now. But since it was no longer team-based, it
could also be interpreted as more of a management “carrot,” and less
of a compliment for good team performance. These applications to
XYZCo will influence the hypotheses tested.
Hypotheses-Incentives
Phase I’s qualitative data indicated that when the original
incentive system was installed in 1994, the incentives were tied to
challenging team goals. However, the method for distributing rewards
changed in 1996. The literature indicates that challenging goals need
to be quantifiable. Quantifiable goals provide the worker with greater
perceived control over performance (and related rewards). The
qualitative data indicated that the new award distribution method was 136
relatively subjective, making it likely to be perceived as non-salient.
Therefore:
Hypothesis 17: Since the incentive award system was recently
changed from specific, quantifiable team goals to a non-quantified
individual performance at XYZCo, most CSOs will say that the
incentive plan goal was not challenging for them. Hence, the
incentive will not be perceived to be highly challenge salient, even
though, in absolute dollar terms, the goal is large enough to be
considered monetarily salient.
Because the incentive will probably not be perceived as salient,
and because the workers probably have high levels of intrinsic
motivation, the incentive will probably be considered to have neutral
or negative effects on CSO motivation. The changes that were made
to the incentive award structure will probably cause negative
reactions in many of the workers. Therefore:
Hypothesis 18: When asked: a) if achieving their incentive
plan goal was challenging for them, and b) if the incentive plan has
any other effects on them or their team, the majority of the responses
will indicate that the incentive plan has either little-to-no effect or a
negative effect on motivation.137
The recent changes at XYZCo in how XYZCo’s incentive awards
are divided will also mean the awards will probably not be regarded as
being highly motivational. Rather, they will be considered only “nice-
to-have” by some workers, but punitive by those who receive smaller
than expected awards. This is because the workers’ views of an
award will probably change from a bonus for overall good team
performance to a vehicle to reward differentially “good versus bad”
employees. The new way of awarding bonuses may violate employee
norms for how things should be done. Therefore:
Hypothesis 19: When asked: a) if the incentive plan has a
positive motivating effect on them and the team; b) if the incentive
plan has a positive effect on their own and the team’s
conscientiousness; and, c) if the incentive plan has a positive effect on
their own and the team’s work effort, respondents will be significantly
more negative than they were for the other questions in the survey.
Several researchers have indicated that the relationship
between workers and management impacts the effectiveness of
incentives in motivating employees. In the context of budget controls,
Hofstede said that “the interpersonal relation and communication
between superior and subordinate is of much greater importance for 138
the functioning of the organization than the power relationship”
(1967: 58). Steers & Porter (1979: 547) said that merit pay systems
work best when trust and openness exist between workers and
management. Indeed, other studies suggest that pay-for-performance
plans may not work because of a lack of worker/management trust
(Lawler, 1971; Steers & Porter, 1979: 526-531). Lawler said that “No
plan can succeed in the face of low trust and poor supervision, no
matter how valid it may be from the point of view of mechanics”
(1971: 163). Steers & Porter (1979: 386) said that the perceived
helpful intent of controls leads to employee liking of the boss, which
leads to greater productivity.
The literature reviewed above indicated that the effects of
incentives also depend on worker perceptions of why the incentive
was given. Phase I’s qualitative data indicated that worker
perceptions are often influenced by worker relationships with
management. Hence, worker relationships with management
probably moderate the effects of the incentive on the worker’s
motivation, as Figure 5 indicates. Therefore:
Hypothesis 20: Responses to the questions in Hypothesis 19
will be significantly more positive for those CSOs with a better
relationship with management than those with a worse relationship
with management.139
Another important factor will be whether the groups have a
feeling of security about their jobs. Workers in groups whose jobs are
going away are more likely to feel less motivated by the incentive
than those whose jobs are secure. Therefore:
Hypothesis 21: Responses to the questions in Hypothesis 19
will be significantly less positive for CSO groups with insecure
positions.
It is likely that respondents’ answers about the incentives’ effect
on motivation are to some extent driven by the level of motivation
they possess about the job itself. That is, how intrinsically motivated
they are will probably be related to how they feel about their own
level of motivation. If they are highly intrinsically motivated, they will
more likely feel the incentive plan provides positive motivational
effect. This hypothesis makes intuitive sense, but is speculative,
because it is not based on prior research. Therefore:
Hypothesis 22: The CSOs’ intrinsic motivation will be
positively associated with answers about the effects of the incentive
plan on them and their team.
140
METHODOLOGY DETAIL
Chapter Five’s hypotheses were tested through a combination of
qualitative and quantitative methods.
To determine whether the incentives were perceived as
challenge salient (H17), the respondents to the telephone
questionnaire were asked (on a 7-point scale) the extent to which they
agreed that achieving their most recent bonus goal was challenging
for them. Scores of four or less were considered “not challenging”
responses, while those over four were coded as challenging. A simple
majority of “not challenging” responses was considered adequate
support for Hypothesis 17.
H18 (incentive plan Motivational effect) was tested by coding
the researcher’s notes from respondents’ open-ended responses to
the two questions implied in the hypothesis (Appendix C, questions 43
and 90). By open-ended is meant the responses that CSOs used to
comment on their agree/disagree answer to these questions. The
coding of these responses was done twice, once to capture whether
answers were positive or negative toward the incentive, and a second
time to capture answers that specifically stated that the incentive plan
had little or no effect on the respondent’s or the team’s motivation.
These questions were asked of the respondents over a period of time
from about the date the award was given to about two months after
the award was given. Hence, the most recent award was fresh in their 141
minds. A simple majority of negative responses is considered support
for Hypothesis 18.
H19 (incentive planMotivational effect) was tested by asking
the respondents the questions implied in the a), b), and c) parts of
Hypothesis 19. Each of the three topics was asked with two items.
One item addressed the individual’s feelings about the team, and the
other question asked them to respond about themselves (see
Appendix B, questions 84-89). The six items could be joined into one
construct called Motivational Effect with a Cronbach’s alpha of 0.92.
However, for this hypothesis, the answers will each be analyzed
separately by pair of questions. This is because the first pair asks for
general motivation effects, while the second and third ask for two
specific types of motivational effects: conscientiousness and work
effort. The hypothesis was tested by comparing the average
responses to these three sets of questions with the average responses
to the other questions in the survey. Hypothesis 19 will be considered
supported if: a) each of the three mean scores is in the bottom
quartile when compared with the mean scores in Appendix I; b) each
of the three mean scores is significantly below the average of all mean
scores shown in Appendix I. Test a) is probably the stronger of the
two tests. The test for b) will be an alpha = .05 significance T-test of
the difference between two means, as used to test Hypotheses 1-4
(Keller, Warrack & Bartel, 1988).142
To test whether relationships with management made a
difference (Hypothesis 20), the data were divided at the mean into a
good relationship group and a poor relationship group. The mean
scores for opinions on the motivational effect of the incentive awards
were calculated, and then a one-way anova test performed. The same
test was done for those who were in secure versus insecure groups
(Hypothesis 21). The insecure group consisted of the hardware
operators, whose functions management had decided to largely
automate.
Hypothesis 22 (Intrinsic MotivationMotivational effect) was
tested by correlating the degree of both enjoyment- and self-esteem-
based intrinsic motivation (Appendix C, average of questions 20-27)
with respondents’ beliefs about the effects of the incentive plan
(Motivational Effect--average of questions 84-89 in Appendix C).
RESULTS OF HYPOTHESIS TESTING
Hypothesis 17 (incentive salience): H17 was supported.
Fifty of eighty-six (58.1%) of the respondents felt the goals were not
challenging to obtain. Hence, the incentive was not salient in terms of
challenge. Prior year goals appeared to present a mild to moderate
challenge, based on responses. This occurred even though the annual
award was found to be anywhere from zero to as much as somewhat
143
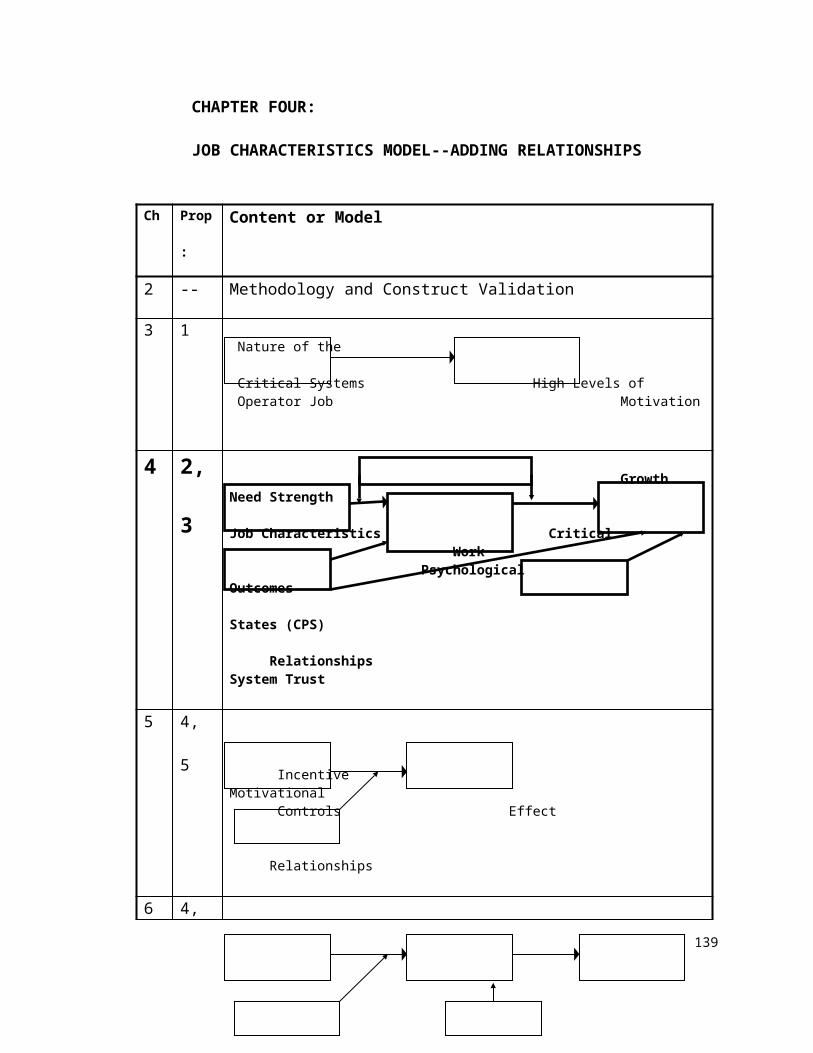
above ten percent of employee annual salary. Thus, the incentive was
monetarily salient but not challenge salient.
Hypothesis 18 (negative effect of incentive): H18 was
supported. Eighty-four percent of the responses were negative and
16% of the responses were positive about the incentive plan in
answers to questions 43 and 90. Although the researcher did not
specifically solicit this comment, 44% (37 of 84) of the respondents to
these two questions also stated that the incentive plan had little or no
effect on their motivation or actions, or those of the team.
Hypothesis 19 (Incentive planMotivational Effect): H19
was strongly supported. The mean score for the sum of the six
questions asked about the incentive was 4.03 on a 1-7 scale, which is
very low compared to the mean scores of other variables (Appendix I).
The detailed questions were then analyzed to obtain a more complete
view. On the question of the incentive’s general effect on motivation,
scores were somewhat more positive (mean = 4.58), while they were
quite negative on how the incentive specifically affected
conscientiousness (mean = 3.78) and work effort (mean = 3.72).
Comparing these scores to the means in Appendix A, all three
Motivational Effect scores were in the bottom quartile of scores. In
fact, excluding Micromanagement (reverse-scaled), Accountability
(five-point scale) and Performance (scaled to be close to 4.0 on
average), Motivational Effect mean scores were the lowest of all the 144
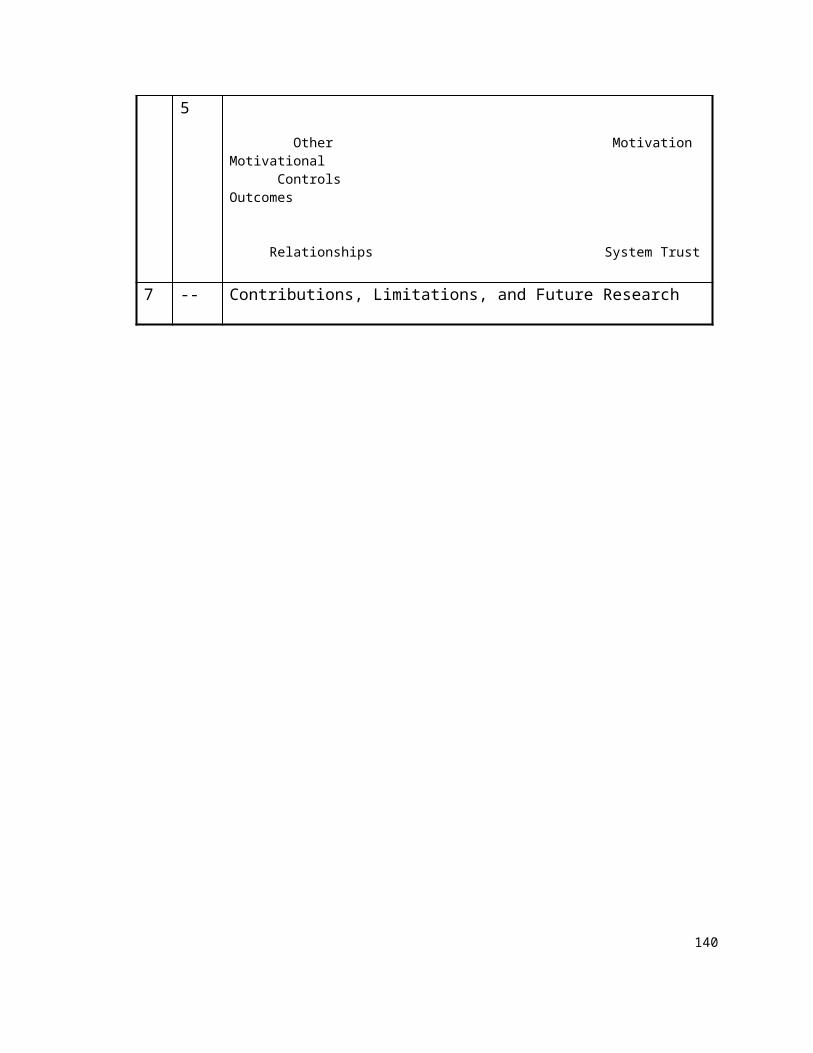
variables in the study. T-tests revealed that each of the three
Motivational Effect scores was significantly below the average mean of
all other Appendix I variables, which was 5.74. Hence, H19 was fully
supported.
Hypothesis 20 (effect of Relationships): H20 was weakly
supported. Responses were more positive for those employees with
better relationships with management (mean = 4.36; n=43) versus
those with worse relationships (mean = 3.69; n=43). However, a one-
way ANOVA revealed that the means were different at the moderately
significant p=.072 level.
Hypothesis 21 (effects of job security): H21 was not
supported. Contrary to prediction, responses were more positive for
those in insecure groups (mean = 4.64) versus secure groups (mean =
3.79). These two means differed at the significant p=.038 level.
H22 (intrinsic motivation motivational effect) results:
The respondents’ intrinsic motivation was significantly correlated with
their beliefs about the motivational effectiveness of the incentive plan
(Motivational Effect), at r= .243; p=.012. Intrinsic Motivation-
Enjoyment and Intrinsic Motivation-Self-Esteem were about equally
correlated with Motivational Effect.
DISCUSSION OF RESULTS
145
Based on the results of Hypotheses 17-19, CSOs felt that since
the incentives were not challenging, the incentives only had general
motivational effects rather than specifically improving their
conscientiousness or work effort. Those CSOs with higher intrinsic
motivation and better relationships with their supervisors felt the
incentives had greater motivational effect. To understand these
results better, the following discusses the findings in light of other
qualitative analysis of the questionnaires.
From the questionnaire interviews, CSO perceptions of the
incentive plan had changed since it was installed in 1994. While at
first it was almost like a profit sharing award tied to team goals, such
as system availability, it became more of a carrot for management to
use to try to influence behavior by rewarding or punishing individual
performance. The reward value came through for those who received
medium to large awards. Qualitative responses from those who were
dissatisfied with the incentive bonus consistently indicated that it had
a punitive effect for them, as Kohn (1993a,b) and Simons (1995: 79)
predicted. A number of respondents who were not satisfied with their
own award indicated that they felt the bonus award system was not
equitable (e.g., it worked like a “good old boy” system). Since
incentive systems that punish have never proven to be effective
motivators (see review in Hergenhahn & Olson, 1993), XYZCo’s
system has a decidedly negative motivational effect on those who 146
received lower than expected rewards, in spite of the money devoted
to it.
To further understand CSO views on how motivating the
incentives were, the researcher split the data in questions 84-89 by
the perceived effect of the incentives on the CSO versus on the team.
Paradoxically, even though 69% of the CSOs were satisfied (scores
above 4.0) with their own recent incentive award, only 28% felt that
most of their co-workers were satisfied. This is probably because the
comments they heard around the shop were primarily negative. If so,
this indicates a rumor-mill type of effect that is similar to how second-
hand knowledge about a person can exaggerate the effects of various
factors on peoples’ trust of that person (Burt & Knez, 1996). The
preponderance of negative (84%) comments given the researcher also
supports the rumor-mill effect.
Tests of Hypothesis 19 showed that the incentive plan had more
general effects (e.g., morale boosting--”it’s nice to have a bonus”), as
opposed to helping the team’s specific work effort motivation or its
conscientiousness. The qualitative questionnaire data supported this.
Many respondents said they rarely thought about the incentive except
just before and just after it was given. Hence, the incentive probably
had very little day-to-day motivational effect, even on those who were
positive toward it. Rather, it probably only acted like a general and
temporary morale booster.147
The results contradicting Hypothesis 21 (job security lower
motivational effect of incentives) can be explained as follows. Even
though those in the insecure groups are just as highly intrinsically
motivated as those in the other groups (Table 12), Chapter Three
found that those in insecure groups were more likely to explain what
motivates them with extrinsic, rather than intrinsic, factors (p= .000).
Because of this tendency, those in insecure groups were more likely to
believe that extrinsic controls have motivational effect.
Overall, the incentive plan tended to have either neutral or
negative effects. While none of the interviewees suggested that the
incentive be done away, the workers’ consensus was two-fold: a) the
incentive did not significantly effect their specific motivation to work
harder or be more conscientious; and b) the 1996 changes made to
the incentive plan primarily had negative effects on worker morale.
The latter effect was more pronounced among those who were
dissatisfied with their own award.
Incentives fit this study’s definition of controls in that incentives
are used by management to influence the work behavior of
employees. Figure 5 posits that the operator’s relationship with the
supervisor moderates how effective the operator felt the incentive was
in motivating her/him and the team. Results from Hypothesis 20
support the controls/relationship model, in that the mean Incentive
Salience for those in the low group was 3.69, while it was 4.36 for 148
those in the high relationship group. Though the difference is not
significant at p = .05, this provides modest evidence that
Relationships moderate the effects of controls on worker motivation in
the critical systems environment.
The literature search pointed out that controls may have either
informational or controlling effects, depending on how they are
interpreted. The qualitative data showed that a few workers felt that
incentives were used by management as a carrot. These employees
said things like, “I don’t need a bonus to work hard.” Most employees
did not say this directly. However, the fact that 44% made the
unsolicited comment that incentives had little or no influence on their
work motivation reflects a less than favorable attitude toward either
the bonus or the way it was awarded.
Since this study’s data showed that Relationships may moderate
the effect of incentives on motivation, it makes a step towards
resolving a paradox in the literature. The literature on controls has
been mixed on whether, or when, controls improve motivation.
Scholars have tried to explain contradictory results (e.g., Harackiewicz
& Larson, 1986; Pittman, et al., 1980; Ryan, 1982) by describing the
feedback as controlling versus informational. But this ignores the
relationships between the controller and the controllee. This study
contends that the literature has been unable to unravel this because
of their neglect of interpersonal relationships. Adding personal 149
relationships into the analysis helps predict when controls will hurt
motivation (i.e., when a poor relationship exists). The relationship
probably provides a lens by which the worker views the control
mechanism as either controlling or complimentary/informational.
In sum, Chapter Five found evidence that in XYZCo’s CSO
environment:
the incentive plan was perceived to have more negative
or neutral effects than positive effects;
the incentive plan’s effects on motivation consisted more
of general and temporary morale boosting than
increases in CSO work effort or conscientiousness;
CSO relationships with their supervisors modestly
moderated the effects of the incentive plan on
perceived work motivation;
CSOs in insecure groups were more likely to believe the
incentives had a positive effect on worker motivation
—probably because they are more extrinsically
oriented;
those CSOs with higher levels of intrinsic motivation were
generally more positive about the effects of the
incentive plan on CSO motivation;
since CSOs were generally satisfied with their own
incentive award, many of the negative perceptions 150
they had about the incentive probably related to
how they felt other CSOs perceived the incentive
award process, a “rumor-mill” effect.
151
CHAPTER SIX: OTHER CONTROLS—ADDING RELATIONSHIPS
Ch Prop: Content or Model
2 -- Methodology and Construct Validation
3 1 Nature of the Critical Systems High Levels of Operator Job Motivation
4 2, 3 Growth Need Strength
Critical Job Characteristics Psychological Work
States (CPS) Outcomes
Relationships System Trust
5 4, 5
Incentive Motivational Controls Effect
Relationships
6 4, 5
Other Motivation Motivational Controls Outcomes
Relationships System Trust
7 -- Contributions, Limitations, and Future Research
This chapter first develops hypotheses relating four types of
Controls, Relationships, and System Trust to critical systems operator
Motivation. The Motivation construct consists of Job Satisfaction,
Experienced Work Meaningfulness, Organizational Commitment, 152
Intrinsic Motivation--Self-Esteem, and Intrinsic Motivation--Enjoyment.
Then, the methods are detailed and the results are reported and
discussed.
THEORY BUILDING
Conceptual Model Building--Accountability
Accountability at XYZCo. Accountability means being held
responsible for an action or event. This occurs either by receiving
some consequence from the event (Tetlock, 1985), or by being asked
to give a verbal or written account or explanation of the event
(Cummings & Anton, 1990). When an outage occurs at XYZCo,
someone begins to account for it immediately. The supervisor is
contacted right away, and outages over five minutes are reported to
higher levels of management. At the end of the shift, an incident
report is created by the supervisor to explain why the outage occurred
and what was done about it. Those in higher levels of management
felt keenly aware of the need to account for the health of the system
on a daily basis. The Vice President and division President read a
system situation report first thing each morning. However, when the
system went down, these executives required almost minute by
minute reporting so that they could communicate up the line to their
corporate leaders. In other words, accountability is a constant in this
critical systems organization.
153
AccountabilityMotivation. This type of accountability
appears to have positive motivational consequences in terms of
making workers aware that their job was important. CSOs appear to
interpret constant accountability as a signal of management interest
in system health. Since operators know how keenly management was
interested in keeping the system up, they know their jobs are critically
important. This raises their level of pride in their work, and positively
affects their self-esteem. Overall, then, this type of accountability
primarily has positive motivational effects at XYZCo.
Relationships as Moderator. However, accountability also
had negative effects. For example, one employee involved in
accounting to a disliked boss appeared to be de-motivated by the
accounting process. This appeared to happen because the process
had a negative effect on her/his self-esteem. Thus, accountability
controls can have either positive or negative effects on motivation.
What helped resolve this paradox was the relationship between the
CSO and the manager who held the CSO accountable. When the CSO
had a good relationship with the manager, the accountability control
had positive impacts. When the CSO had a poor relationship with the
manager, the accountability control had a negative impact on the
worker’s motivation. Hence, as Figure 5 shows, the relationship
moderates the effects of Management Controls on Motivation.
Scientific Model Building--Accountability154
AccountabilityMotivation. Cummings & Anton (1990) said
that accountability leads to felt responsibility (a JCM motivation
construct). Steers & Porter (1979, p. 324) reported that whatever
leads to definite expectations leads to felt responsibility, which results
in organizational commitment (another motivation construct). Since:
a) strong accountability leads to definite expectations in terms of
having to account for oneself, and b) definite expectations lead to felt
responsibility and organizational commitment, then c) accountability
should lead to felt responsibility and organizational commitment.
Tetlock (1985) agreed that accountability should lead to higher
motivation in terms of experienced work meaningfulness. Therefore:
Hypothesis 23: The perception of accountability by the CSO
will be positively related with the CSO’s Motivation.
Relationships as a moderator. Tetlock pointed out that the
relationship between the two parties could make a difference. He said
that having a good relationship makes one want to account for their
task. Having a bad relationship makes accountability threatening,
especially if job insecurity is present. Cummings & Anton (1990) came
to a similar conclusion. They theorized that the worker’s perceptions
of management’s attitude toward them determine whether
accountability becomes a mentoring or a controlling/monitoring 155
system. The person held accountable will respond in accordance with
the motives s/he perceives in management. This suggests that
Relationships will moderate the effects of Accountability on Motivation.
Therefore:
Hypothesis 24: Relationships will moderate the effect of
Accountability on Motivation. Those CSOs with positive Relationships
with their supervisors will more likely have significant positive links
between Accountability and Motivation.
Conceptual Model Building—Feedback
Feedback at XYZCo. In this study’s context, feedback refers to
information the supervisor gives the critical systems operator about
how s/he is doing on the job. Most feedback comes to CSOs in an
informal way during day-to-day interaction with their supervisors.
Only one instance of feedback was found in the qualitative data. In
this instance, the feedback was negative, and the existing relationship
between supervisor and CSO was negative. The CSO indicated that
the experience had a negative effect on the CSO’s morale.
Scientific Model Building--Feedback
FeedbackMotivation. In general, feedback has been found
to have positive effects on motivation (Gear, Marsh & Sergent, 1985),
motivation-related productivity (Gallegos & Phelan, 1977; Pritchard & 156
Montagno, 1978), and job satisfaction (Sarata & Jeppesen, 1977).
Feedback has been found to be correlated positively with
organizational commitment (Ivancevich & McMahon, 1982). Feedback
has had positive correlations with intrinsic motivation (Cusella, 1982;
Ivancevich & McMahon, 1982; Shanab, Peterson, Dargahi & Deroian,
1981).
Hypothesis 25: Perceived feedback from the supervisor will be
positively related with the CSO’s Motivation.
However, feedback has not always been found to positively
affect Motivation. Formal feedback in the form of performance
appraisals caused the organizational commitment of satisfactory (less
than outstanding) employees to drop (Pearce & Porter, 1986). Some
have found that negative or controlling feedback hurts intrinsic
motivation (Deci, 1972; Harackiewicz & Larson, 1986; Ryan, 1982).
These findings suggest that there may be a need for a moderator in
the Feedback Motivation equation.
Relationships as a Moderator.
Although several treat topics close to Relationships (e.g., social
mediation) and feedback (Guzzo, 1979), Harackiewicz and Larson
(1986) come the closest to connecting feedback, superior/subordinate
relationships, and intrinsic motivation. They proposed that the 157
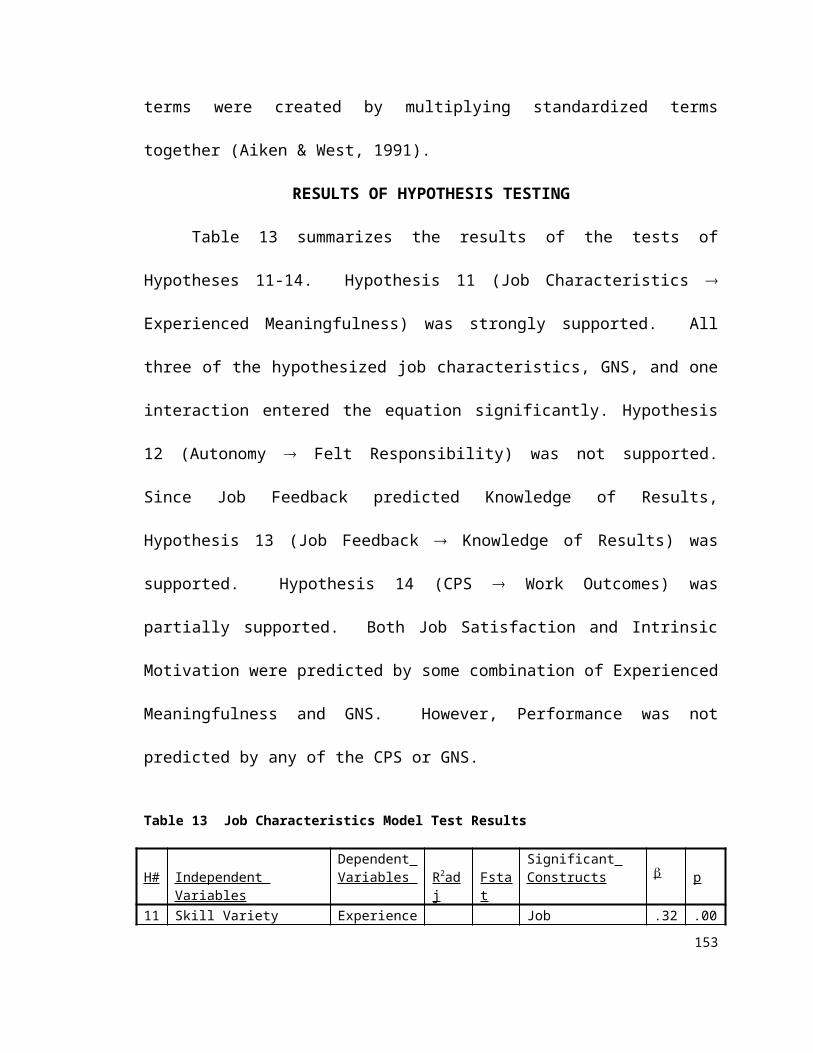
supervisor’s feedback style impacts intrinsic motivation. A controlling
feedback style will undermine intrinsic motivation, while a supportive
feedback style enhances it. In their experiment, Harackiewicz and
Larson operationalized controlling feedback style by the printed
messages subject supervisors chose to give to their subordinates. In
this way, the control mechanism became part of the experiment.
Harackiewicz & Larson did not hypothesize or test any effect of the
relationship between the superior and the subordinate. Interestingly,
the Harackiewicz & Larson study found that in the no-reward-for-
subordinate condition, the control mechanism had a positive effect on
intrinsic motivation, contradicting prior results (Pittman, et al., 1980;
Ryan, 1982). The authors gave the plausible explanation that the
controlling behavior contained informational feedback, which may
have overpowered the negative effect of the controlling behavior. No
measure of the subordinate’s feeling of being controlled was made.
But some who have read this important study felt there may be
more to it. Kanfer commented on the Harackiewicz & Larson (1986)
study: “As suggested by Dyer and Parker (1975), normative beliefs
associated with the broader context in which behavior occurs appear
to influence the interpretation of events and intrinsic motivation. In
the Harackiewicz and Larson (1986) study, subordinates performing a
novel task might have construed the situation as one in which the
supervisor’s feedback was designed to help the subordinate master 158
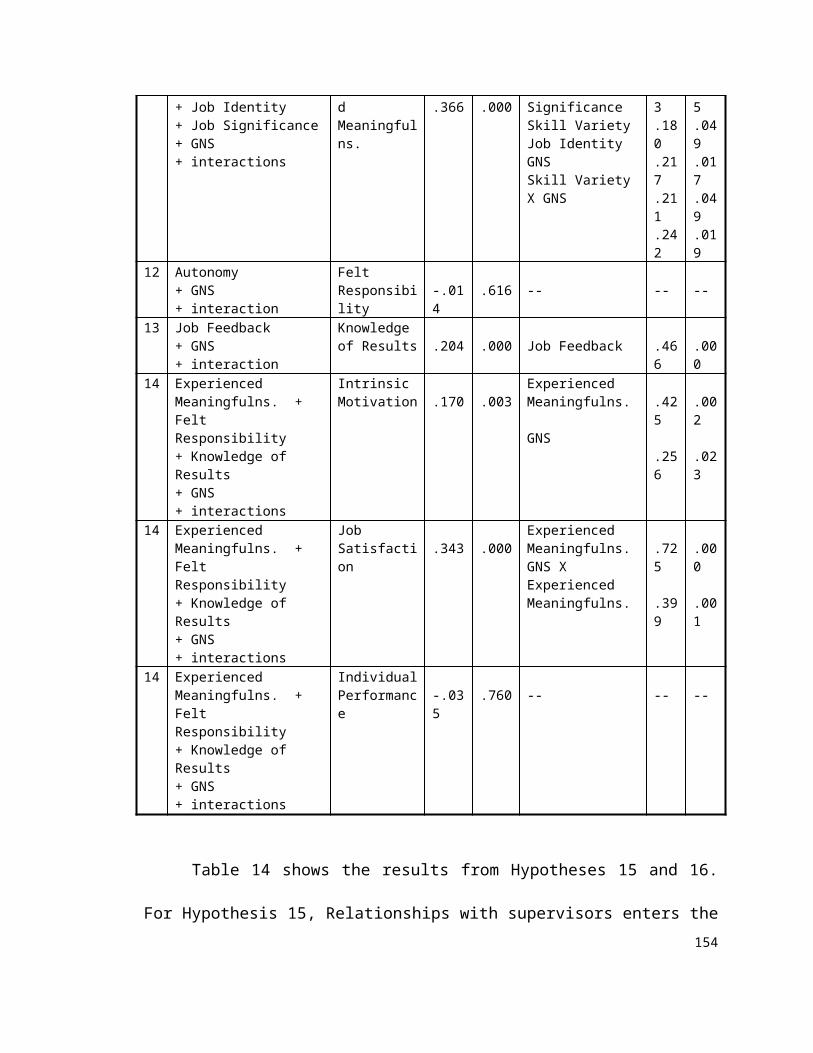
the task, thus reducing the perception that the feedback was
controlling.” (1990: 91) The point here is that the positive social and
structural context surrounding the task can make enough difference
to reverse the expected results of this highly controlled experiment.
A worker with a good relationship with the supervisor would be more
likely to interpret the supervisor’s feedback as helpful, rather than
controlling.
This study contends that one of the key contextual variables not
being taken into account in these feedback experiments is the
relationship between the superior and subordinate. There are hints in
the literature that relationships are important. Earley (1986), for
example, found that feedback is more effective in influencing a
worker’s performance if the worker trusts the feedback giver. Earley
(1988) found that the feedback source (i.e., supervisor or computer)
influenced a person’s level of trust in the feedback. Lawler & Rhode
(1976) found that, in order to motivate positively, feedback should
come from a trusted source. Therefore:
Hypothesis 26: Relationships will moderate the effects of
Feedback on CSO Motivation. Those CSOs with positive Relationships
with their supervisors will more likely have significant positive links
between Feedback and Motivation.
159
Conceptual Model Building--Micromanagement
MicromanagementMotivation. Micromanagement means
that a supervisor gets so deeply involved with the worker’s task that
s/he takes over the task. From Phase I interviews, the extent to which
CSOs were micromanaged could not be ascertained. One worker
reported that a former supervisor knew so much about certain topics
that s/he would “take over” for the worker. The interviewee reported
that this made him/her feel bad about being in that job, and he soon
found a better position. S/he said that in general s/he had a good
relationship with the boss, but that these actions had put a strain on
the relationship.
Relationships as a Moderator. One interviewee described
his/her reactions to the widely varying management styles of a former
and current boss. One of the bosses used a hands-off approach, while
the other was very hands-on. The hands-on manager would actually
come in and take over the job for the operator on occasion. The
interviewee’s reactions to the hands-on manager was intriguing.
Whereas the researcher would have predicted that this obtrusive
management style would demotivate the worker, s/he reported feeling
good about the manager’s actions. S/he interpreted the manager’s
actions as a kind of training/helping function. In further questioning,
the researcher found that the operator had worked with the hands-on
supervisor for many years, and had a very good relationship with the 160
supervisor. This led the researcher to speculate that the operator’s
relationship with the supervisor moderated the potentially negative
motivational effects of the supervisor’s micromanagement actions.
Scientific Model Building--Micromanagement
MicromanagementMotivation; Relationships as a
Moderator. Standing by a worker without taking an active part can
lead to higher felt responsibility by the worker, per Steers & Porter
(1979:323). But standing over the worker may reduce the worker’s
intrinsic motivation--enjoyment (Steers & Porter, 1979: 323) or job
satisfaction (Ouchi & Maguire, 1975). Similarly, Creed & Miles (1996)
said that overmanagement may lead to lower morale. It is speculated
that Relationships make a difference in how Micromanagement affects
Motivation. Therefore:
Hypothesis 27: Perceived micromanagement from the
supervisor will be negatively related with the CSO’s Motivation,
moderated by Relationships.
161
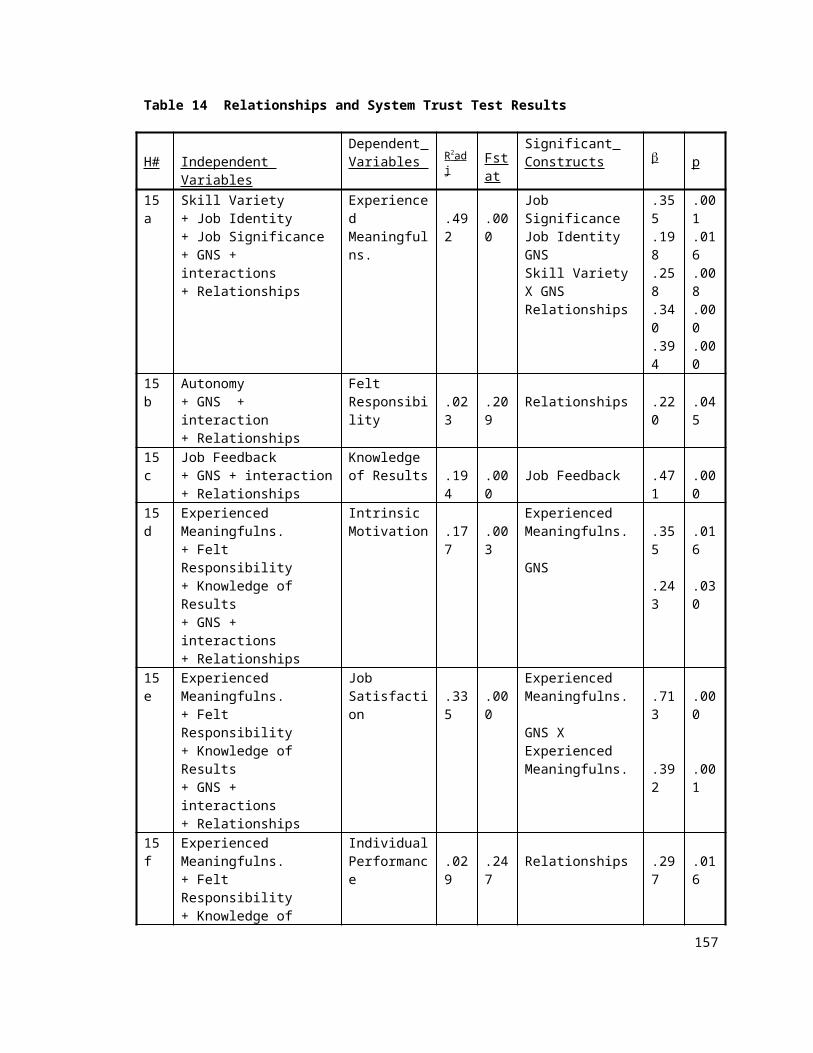
Conceptual Model Building--Autonomy
AutonomyMotivation. Autonomy is not the opposite of
Micromanagement. Micromanagement refers to doing work, while
autonomy refers to decision making. This study defines Autonomy as
the extent to which an employee is allowed to make decisions
pertaining to his/her own job functions. One employee reported that
s/he was constrained from making his/her own decisions. S/he
contrasted this with the autonomy s/he was given by a former boss
when s/he was in a less responsible position. S/he said s/he felt better
about his/herself and his/her authority in the less responsible position
than s/he felt now. S/he saw the lack of autonomy in his/her current
job as a clear sign that the present supervisor did not trust him/her.
The lack of autonomy granted appeared to have a negative effect on
the worker’s morale.
Scientific Model Building--Autonomy
AutonomyMotivation. Several researchers have found that
autonomy leads to greater job satisfaction (e.g., Jayaratne, Vinokur-
Kaplan & Chess, 1995; Kakabadse, 1986). The JCM has connected
autonomy with felt responsibility and other general job attitudes
(Hackman & Lawler, 1971; Hackman & Oldham, 1975). Research on
Autonomy has provided fuel for the practical business press on
empowering or liberating workers (e.g., Peters, 1992). Steers & Porter
(1977) and Rosin & Korabik (1991) found that autonomy is positively 162
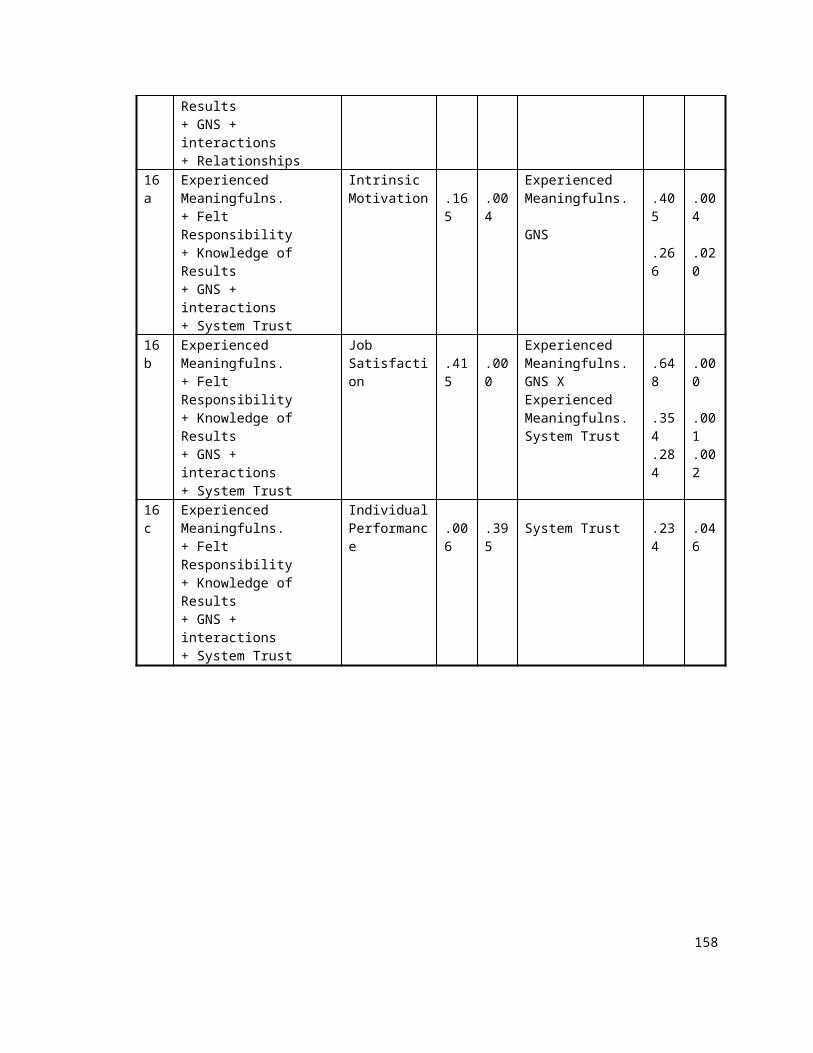
related to organizational commitment. Deci and Ryan (1987) found
that autonomy promoted intrinsic motivation, as have others (e.g.,
Goudas, Biddle & Underwood, 1995; Green & Foster, 1986). Therefore:
Hypothesis 28: Perceived autonomy from the supervisor will
be positively related with the CSO’s Motivation.
Relationships as a Moderator. As already justified in Chapter
Four, Relationships is proposed to moderate the effect of Autonomy on
motivational variables. Therefore:
Hypothesis 29: The effects of Autonomy on Motivation will be
moderated by Relationships. Those CSOs with positive Relationships
with their supervisors will more likely have significant positive links
between Autonomy and Motivation.
Scientific Model Building--Work Outcomes
Motivation Individual Performance. The motivation
literature shows that highly motivated workers are likely to produce
better outcomes, both in terms of productivity and general
performance (Steers & Porter, 1979). While this linkage does not
always hold (Griffin, Welsh & Moorhead, 1981), it holds often enough
163
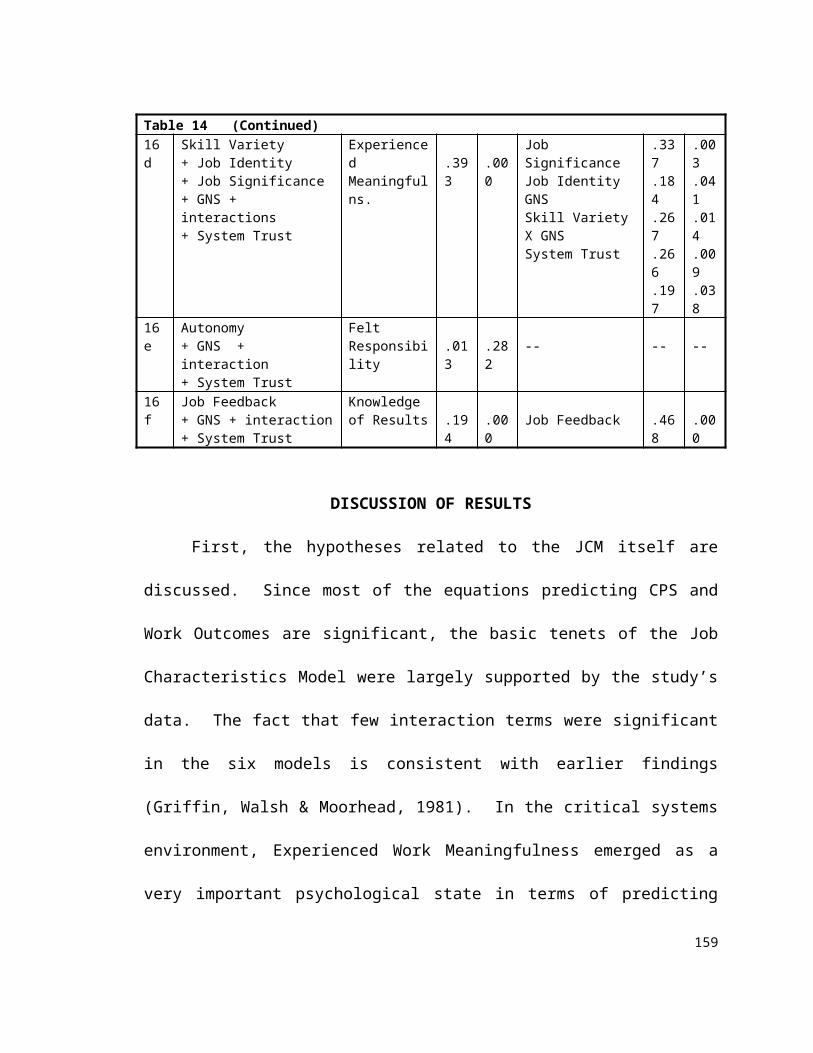
to propose a link between a CSO’s motivation and individual
performance. Therefore:
Hypothesis 30: CSO Motivation will be positively associated
with CSO Individual Performance.
Motivation Contribution to Team Effectiveness. This
study linked Motivation to the CSO’s Contribution to Team
Effectiveness, with subconstructs relating to team cooperation,
communication, conflict resolution, and overall team effectiveness
(see Figure 9). Contribution to Team Effectiveness was also linked to
Individual Performance, measured objectively by the supervisor’s
recall of the latest official rating of the CSO.
To date, very little research has been done to see how
motivation affects functioning as a team. Thus, the linkage between
Motivation and Contribution to Team Effectiveness is considered
speculative. However, it makes sense that highly motivated
employees will like their jobs and will get along with those with whom
they work. Getting along with others on the job is connected with the
construct Contribution to Team Effectiveness (CTE), because CTE
includes communication and cooperation, which are manifestations of
getting along. Therefore,
164
Hypothesis 31: CSO Motivation will be positively associated
with CSO Contribution to Team Effectiveness.
Hypothesis 8 already demonstrated the strong linkage between
Contribution to Team Effectiveness (CTE) and Individual Performance.
165
System Trust’s Impact on Motivation
In Chapter 4, it was argued that System Trust will be related to
such Work Outcomes as Job Satisfaction and Intrinsic Motivation,
which are included in the Motivation construct. Further, System Trust
is probably related to Organizational Commitment, since it reflects
how an operator feels towards the work environment. System Trust
will also probably be related to Experienced Meaningfulness, since an
unfair work environment would tend to cast doubt on how important
the work is. Workplace unfairness can reduce general motivation
levels. For example, from studying budget controls, Hofstede (1967:
56) reported that feelings of unfairness regarding management “are
strongly demotivating.” Thus, System Trust will probably be
predictive of Motivation, comprised of the above discussed constructs.
Therefore:
Hypothesis 32: CSO System Trust will be positively associated
with CSO Motivation.
METHODOLOGY DETAIL
Regression analysis was used to test Chapter Six’s hypotheses,
including the moderation effects. The researcher also used a second
method to test for moderation. The researcher divided the
questionnaire results into groups: those with high Relationship scores 166
and those with low Relationship scores. The means for the Control
and Motivation variables were then calculated and a T-test done to
see if there was a mean difference. This was done with two groups
(low-high) and three groups (low-medium-high) to see how significant,
or close to significant, the moderator was. McClelland and Judd (1993)
said that showing a moderation effect using regression techniques on
survey data is many times more difficult than showing a moderation
effect using ANOVA on experimental data. The sensitivity analysis
employed here seemed appropriate given the difficulty in seeing a
moderation effect on field data using a regression analysis.
RESULTS OF HYPOTHESIS TESTING
Table 16 presents a set of correlation matrices of the
hypothesized variables. Table 16 shows at a glance which variables
are most closely related with Motivation (Feedback, Relationships and
System Trust). These correlations are not intended to test the
hypotheses, but are shown to provide information clarifying the
regression results. Table 17 presents the results of the related
regressions.
Hypotheses 23-32. Relationships and Feedback were the only
variables that were significant in the full regressions for Hypotheses
23-29 (Table 17). Based on Table 17’s results, only Hypotheses 23,
25, and 32 were supported. Relationships was not found to
significantly moderate the linkage between any of the Controls and 167
Motivation. However, Relationships by itself was a significant
predictor of Motivation (as shown in Table 17 between H24 and H25).
Since Feedback was highly correlated with Relationships, only one of
the two could be used as a predictor without introducing
multicollinearity. Hence, the better model would employ only
Feedback, with an
168
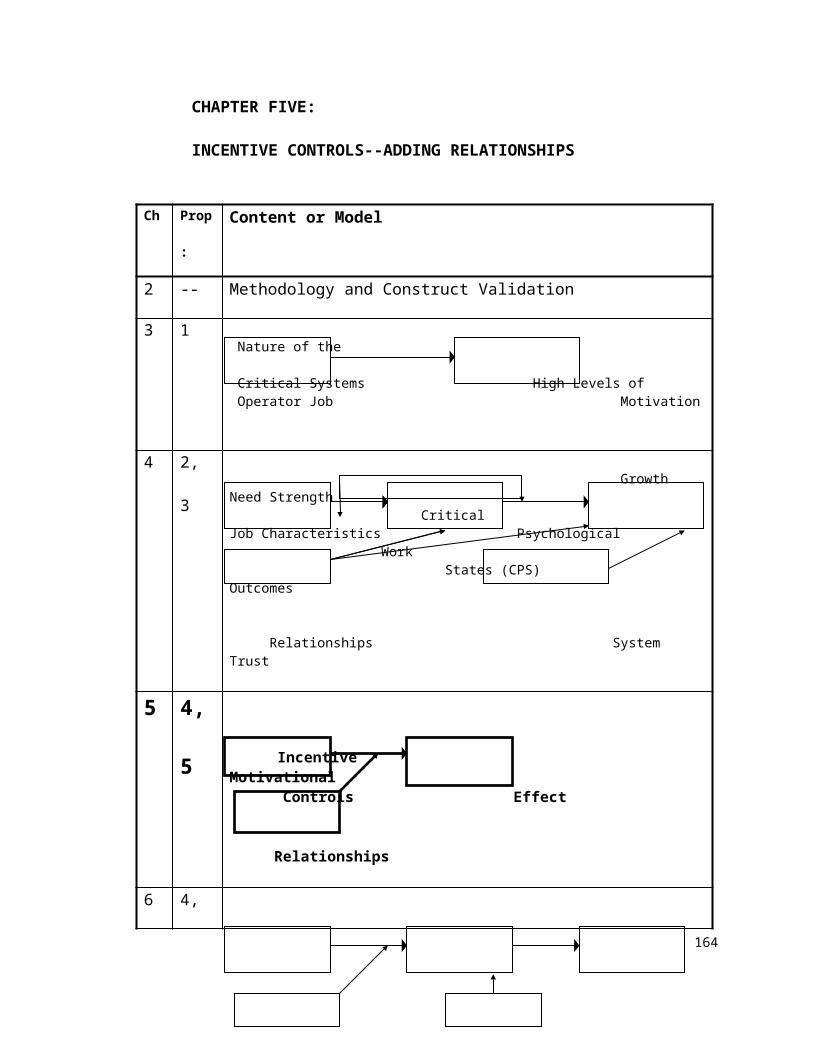
Table 16 Management Controls / Relationships Model—Correlation Tables
H# Motivation Accountability
Relationships
Accountability X
Relationships
Motivation 1.023 Accountability .23 1.024 Relationships .28 .40 1.024 Accountability X
Relationships-.27 -.38 -.55 1.0
Motivation Feedback Relationships
Feedback XRelationships
Motivation 1.025 Feedback .32 1.026 Relationships .28 .71 1.026 Feedback X
Relationships-.15 -.40 -.81 1.0
MotivationMicromanage-ment Relationship
s
Micromanage-ment X Relationships
Motivation 1.027 Micromanagemen
t-.20 1.0
27 Relationships .28 .10 1.027 Micromanagemen
t X Relationships-.26 -.12 -.17 1.0
Motivation Autonomy Relationships
Autonomy X Relationships
Motivation 1.028 Autonomy .06 1.029 Relationships .28 .06 1.029 Autonomy X
Relationships-.01 -.07 .11 1.0
Motivation CTE Performance Relationships
Motivation 1.031 CTE .14 1.030 Performance .10 .84 1.0
Relationships .28 .28 .23 1.0
Motivation System
169
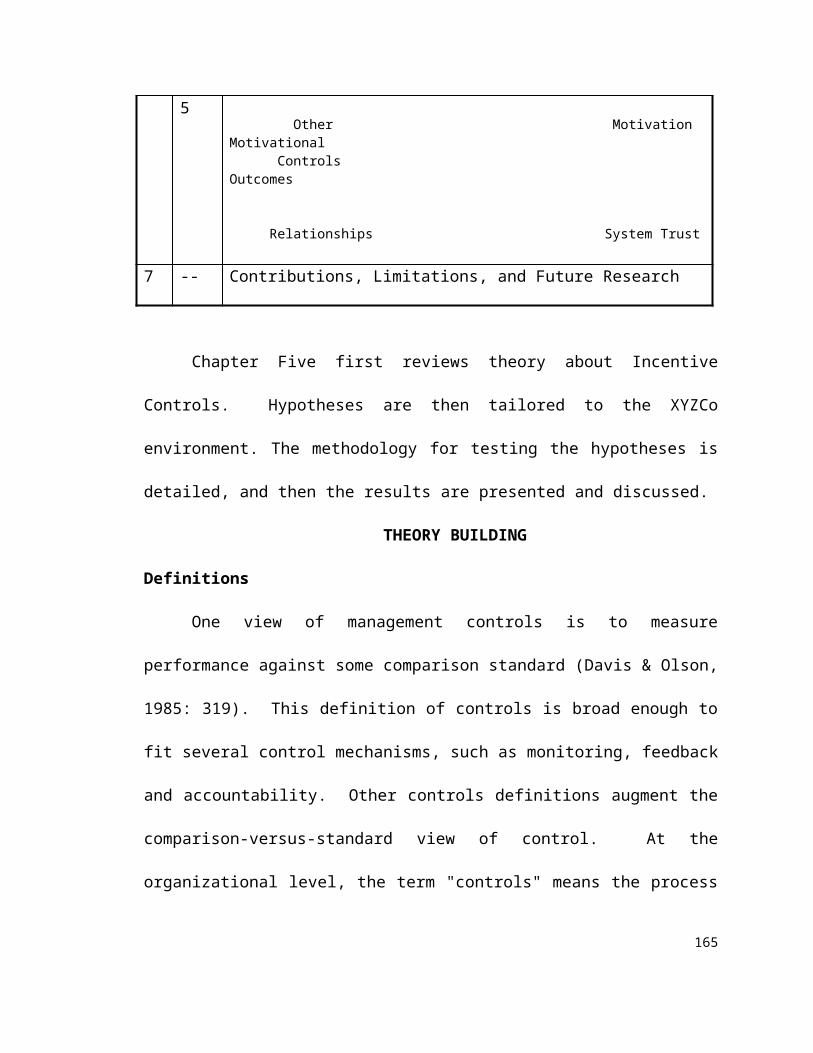
TrustMotivation 1.0
32 System Trust .35 1.0
170
adjusted R-squared of .089 and model significance of p=.003.
Relationships by itself produces an adjusted R-squared of .069 and
p= .008.
Table 17 Management Controls / Relationships Model—Regression Results
H#
Independent Variable(s)
Dependent Variables R 2 ad
jFstat
Significant Constructs p
23
Accountability Motivation .040 .036 Accountability .226
.036
24
Accountability + Relationships + Accountability X Relationships
Motivation .075 .025 -- -- --
Relationships Motivation .069 .008 Relationships .283
.008
25
Feedback Motivation .089 .003 Feedback .316
.003
26
Feedback + Relationships + Feedback X Relationships
Motivation .079 .021 -- -- --
27
Micromanagement Motivation -.012
.961 -- -- --
27
Micromanagement + Relationships + Micromanagement X Relationships
Motivation .074 .026 Relationships .263
.016
28
Autonomy Motivation -.008
.582 -- -- --
29
Autonomy + Relationships + Autonomy X Relationships
Motivation .050 .066 Relationships .285
.009
30
Motivation Performance
-.002
.369 -- -- --
31
Motivation CTE .007 .205 -- -- --
171
32
System Trust Motivation .112 .001 System Trust .350
.001
In Hypotheses 30-31, Motivation predicted neither CTE nor
Individual Performance. In exploratory mode, Relationships by itself
was found to be predictive of CTE, with an R-squared of .070, Beta
= .284, and p = .008. Supporting Hypothesis 32, System Trust was
strongly related with Motivation, with a higher R-squared than either
Feedback or Relationships. Only System Trust explained more than
ten percent of the variance in Motivation.
Tables 18 through 21 present the moderation sensitivity analysis
by variable. Tables 18 through 21 show the moderation analysis based
on dividing each variable into halves and then thirds. Using thirds was
done in case the moderation effect related only at the two extreme
values of the data. That is, a moderation effect may only be
significant among those with relatively high or low Relationship scores.
Using the top third and lower third captures this possibility. A
Relationships moderation effect is represented by a table in which
there is a significant difference in Motivation means () between the
left side and the right side of the table. That is, at a given level of the
Controls variable, moving from low to high Relationships resulted in a
significant increase in the mean of the Motivation scores.
172
For example, in the second part of Table 18, which represents
high and low thirds, one sees that in the case of the low Accountability
scores, a change from low to high Relationships scores produced a
significantly higher (p= .04) set of Motivation scores. Therefore,
Relationships is said to have moderated the effects of Accountability
on Motivation. This effect appears in the “thirds” analysis for
Accountability and Feedback, and in the “halves” analysis for
Micromanagement. In each case, the difference is only significant
when the Controls variable is in the “low” condition. This provides
modest evidence that Relationships moderates the effect of these
Controls variables on Motivation, supporting Hypotheses 24, 26, and
27.
Table 18 Sensitivity Analysis for Relationships Moderation of
Accountability
Low Half Relationships
Significance Of Difference
High Half Relationships
Low Half Accountability
= 6.13; n=24
not significant (n.s.)
= 6.45; n=17
Significanceof Difference
n.s. n.s.
High Half Accountability
= 6.30; n=19
n.s. = 6.55; n=26
Low Third Significanc High Third 173
Relationships e Of Difference
Relationships
Low Third Accountability
= 5.95; n=10
p = .041 = 6.51; n=4
Significanceof Difference
n.s. (p=.08) n.s.
High Third Accountability
= 6.36; n=9
n.s. = 6.53; n=30
Note: refers to the mean of the Motivation scores in this cell.
174
Table 19 Sensitivity Analysis for Relationships Moderation of Feedback
Low Half Relationships
Significance Of Difference
High Half Relationships
Low Half Feedback
= 6.11; n=35
n.s. = 6.33; n=11
Significanceof Difference
n.s. (p=.09) n.s.
High Half Feedback
= 6.61; n=8
n.s. = 6.57; n=32
Low Third Relationships
Significance Of Difference
High Third Relationships
Low Third Feedback
= 6.12; n=21
p = .041 = 6.48; n=9
Significanceof Difference
n.s. (p= .053)
n.s.
High Third Feedback
= 6.75; n=1
n.s. = 6.56; n=35
Note: refers to the mean of the Motivation scores in this cell.
Table 20 Sensitivity Analysis for Relationships Moderation of
Micromanagement
Low Half Relationships
Significance Of Difference
High Half Relationships
Low Half Micromanagement
= 6.16; n=21
p = .01 = 6.58; n=22
Significanceof Difference
n.s. n.s.
High Half Micromanagement
= 6.24; n=21
n.s. = 6.44; n=22
Low Third Significanc High Third 175
Relationships
e Of Difference
Relationships
Low Third Micromanagement
= 5.98; n=8
n.s. p = .051
= 6.53; n=11
Significanceof Difference
n.s. n.s.
High Third Micromanagement
= 6.26; n=9
n.s. = 6.46; n=26
Note: refers to the mean of the Motivation scores in this cell.
Table 21 Sensitivity Analysis for Relationships Moderation of
Autonomy
Low Half Relationships
Significance Of Difference
High Half Relationships
Low Half Autonomy
= 6.12; n=24
n.s. (p = .069)
= 6.45; n= 20
Significanceof Difference
n.s. n.s.
High Half Autonomy
= 6.31; n=19
n.s. = 6.56; n= 23
Low Third Relationships
Significance Of Difference
High Third Relationships
Low Third Autonomy
= 6.12; n=8
n.s. = 6.53; n=12
Significanceof Difference
n.s. n.s.
High Third Autonomy
= 6.30; n=8
n.s. = 6.57; n=22
Note: refers to the mean of the Motivation scores in this cell.
Eliminating Plausible Alternatives
176
In order to establish these hypotheses’ internal validity with
greater confidence, the researcher entered a number of plausible
alternatives into the equations predicting Motivation, CTE, and
Performance. These included demographic variables (age, grade
level, education), individual situation variables (number of recent
promotions, number of recent pay raises, percent of time keeping
systems available, duration of time worked with supervisor), and
variables providing possible alternative explanations (interaction with
team members, interaction with supervisor, relationship with team
members). Interaction with, and duration of time worked with, the
supervisor were suggested by research on trust (e.g., Burt & Knez,
1996). Interaction and relationship with team members was
suggested by the social needs emphasis of the JCM. None of these
variables added any significant predictive value to the model’s most
significant equations (i.e., System Trust Motivation; Relationships
CTEs). With these plausible alternatives eliminated, one can have
greater confidence in the internal validity of the best equations for
these models (see Table 17).
DISCUSSION OF RESULTS
Of the Control constructs, only Feedback and Accountability
were significantly related to Motivation. Neither Autonomy nor
Micromanagement had any significant effect on the CSOs’ Motivation. 177
Further analysis revealed that Micromanagement did not significantly
(p=.05, one-tailed test) correlate with any of the motivation-related
variables that comprised Critical Psychological States, Work Outcomes,
or Motivation. Autonomy significantly correlated with only one
(Knowledge of Results, r = .323; p<.01). In light of both the research
cited above and the ground swell of practitioner support for
‘empowering’ or ‘liberating’ workers (e.g., Peters, 1992), this finding is
very surprising. This underscores the possibility that empowering by
itself may not have as strong of an effect on motivation as the
CSO/supervisor relationship.
In contrast, Feedback from the Supervisor appears to be
strongly positively related to the worker’s Motivation, as is
Accountability to a lesser extent. Relationships itself relates positively
to Motivation, and is more strongly related to Motivation than any of
the Controls except Feedback. This is interesting because Feedback is
the control that apparently has the most to do with Relationships,
given its high correlation with Relationships. This high correlation
indicates that either frequency of feedback leads to good relationships
or that good relationships leads to frequent feedback (or both).
Hence, Feedback may be thought of as a characteristic of the
relationship. Hence, an important finding of this study is that
operator/supervisor Relationships (and the related Feedback) have a
more power for predicting Motivation than do the Control types. Even 178
though Relationships has a stronger direct, than interactive, effect on
Motivation, the sensitivity analysis shows that Relationships does have
some impact on the strength with which most of the Controls affect
Motivation. In particular, above average Relationships were
associated with significantly higher Motivation among those CSOs with
below average Micromanagement scores. Similarly, top third
Relationships scores were associated with higher Motivation among
those with lower third Feedback and Accountability.
The fact that Relationships and Feedback frequency are so
highly correlated is in itself important. Argyris (1975) argued that
those who act within controlling environments will develop poor
relationships with the controller and will come to seek little feedback.
It is also likely that a supervisor with a poor relationship with the
employee will have less desire to give feedback. From the other
direction, the infrequency of feedback will leave questions in the mind
of the worker, which will lead to suspicion and, over time, to lower
trust levels (Holmes & Rempel, 1989). The power differences between
the worker and supervisor tend to increase the levels of suspicion and
distrust (Kramer, 1996). Hence, XYZCo data supports the idea that
relationships and feedback tend to reinforce each other over time.
One possible reason why Autonomy had so little predictive
power is that Autonomy is so crucial in the critical system environment
(Weick, 1990) that almost all CSOs have high degrees of autonomy. 179
The data shows some evidence of this (Appendix I), in that the mean
for Autonomy was 5.97 out of 7.00. Also, while answering the
questionnaire, two supervisors said they give all their CSOs full
autonomy on the job.
Also somewhat surprising, Relationships predicted CTE better
than did Motivation. Also, Autonomy predicted CTE and Individual
Performance even better than did Relationships. It is probable,
however, that the causality is the opposite for Autonomy. That is, it is
possible that those who are the best performers are given the most
Autonomy by their supervisors. Hence, Individual Performance is
probably a predictor of Autonomy, rather than the converse. The
finding that Motivation did not predict Individual Performance parallels
the Chapter Four finding that CPS did not predict Individual
Performance. Again, this is probably because other variables, such as
Contribution to Team Effectiveness, skill, knowledge, and ability are
more salient predictors of Individual Performance.
Note that the only Table 17 R-squared that exceeds .10 is the
prediction of Motivation by System Trust, which is only .112. By
contrast, Chapter Four’s significant JCM equations had R-squares in
the .20-.49 range. It appears from this that these controls have far
less motivational impact on CSOs than do the characteristics of the
job. Based on Chapter Five, the same is probably true of incentive
controls.180
In sum, Chapter Six found evidence that:
System Trust was the best predictor of Motivation,
followed by Feedback;
of the other Controls, only Accountability was a
significant predictor of Motivation;
Relationships itself predicted Motivation better than any
Control except Feedback;
Relationships had a modest moderating effect on how
Controls affect Motivation, especially for
Relationships in the top or bottom third;
Relationships predicted CTEs better than did Motivation;
Although a direct comparison cannot be made,
Controls appear to have less effect on CSO
motivation than do the JCM variables.
181
CHAPTER SEVEN:
CONTRIBUTIONS, LIMITATIONS, AND FUTURE RESEARCH
Ch Prop: Content or Model
2 -- Methodology and Construct Validation
3 1 Nature of the Critical Systems High Levels of Operator Job Motivation
4 2, 3 Growth Need Strength
Critical Job Characteristics Psychological Work
States (CPS) Outcomes
Relationships System Trust
5 4, 5
Incentive Motivational Controls Effect
Relationships
6 4, 5
Other Motivation Motivational Controls Outcomes
Relationships System Trust
7 -- Contributions, Limitations, and Future Research
182
CONTRIBUTIONS
This research contributes to both theory and practice.
To Theory
The current literature lacks models fully explaining the paradoxical effects of
controls. That is, controls sometimes have positive effects and sometimes negative
effects (e. g., Harackiewicz & Larson, 1986; Powers & Dickson, 1973). This suggests a
hidden moderator is present (Sitkin & Pablo, 1992). While the nature of the feedback
itself has been examined as a moderator, the contextual relationships between parties,
though suggested by Kanfer (1990), has not been examined. This study developed and
tested a model that used relationships as a moderator of the Management
Controls/Motivation link. Building on existing theory, the Controls/Relationship model
helps explain prior paradoxical empirical findings on Controls by including
Relationships. When CSO/supervisor relationships were positive, Management Controls
had a stronger positive influence on motivation than when these relationships were
negative. Adding the Relationships and System Trust constructs improved the predictive
power of the Management Controls model of motivation.
Through the use of Relationships and System Trust, the study also extended the
predictive power of the Job Characteristics Model. Even though the job of the CSO is
highly intrinsically motivating, Relationships and System Trust were found to be
predictive of JCM dependent variables in the presence of job characteristics predictors.
While this study says Relationships and System Trust are important, it does not claim
that job characteristics are not important. Indeed, job characteristics were the most
salient predictors of CSO motivation in this study. 183
This research also fills a key gap in the management information systems domain
by analyzing and describing the critical computer systems operator (CSO) job vis-a-vis
that of traditional computer operators and system developers. The CSO job is critical
because of the urgent need to restore systems that crash. Two recent five-hour e-mail
blackouts at America Online (Quick, 1997) underscore again the need to keep highly
used systems running 100% of the time. In addition, the System Trust and Relationships
constructs are introduced for the first time in psychologically measurable form in this
study.
This study helps explain the paradoxical research findings
regarding Management Controls. While Controls have been found to
motivate employees (Eisenhardt, 1985; Henderson & Lee, 1992;
Tetlock, 1985), controls often have dysfunctional effects (e.g., Lawler
& Rhode, 1976; Powers & Dickson, 1973). Unraveling paradoxes is a
highly recommended theory-building process (e.g., Poole & Van de
Ven, 1989). Resolving paradoxes often requires that researchers
incorporate moderator or mediator variables between independent
and dependent variables (e.g., Sitkin & Pablo, 1992). Perhaps one
reason the economics literature has been unable to unravel the
control paradox is because it assumes that interpersonal relationships
are not important. This study adds value by positing Relationships as
a moderator of the traditional Management Controls Motivation link.
From the results of this study, it is proposed that Management
Controls have positive effects on Motivation when worker/supervisor 184
Relationships are positive, but negative effects when Relationships are
negative. Adding personal relationships into the analysis helps
explain when controls will hurt motivation (when a poor relationship
exists), but also how (through threatening the self-esteem of the
worker).
This study also calls for broader-based motivation research
approaches. Most studies of motivation have focused narrowly on one
kind of factor (e.g., incentives, job characteristics) or outcome (e.g.,
organizational commitment, intrinsic motivation). This study found
that one can measure the relative strength of several motivational
factors. Further, in a given context, one can test to see which
motivational paradigm (i.e., controls, job characteristics) works best.
To Practice
Two major paradigms of management have dominated U. S. Corporations in
recent years. One, based on the Hackman/Oldham model, says to redesign work to
increase productivity and decrease worker costs. In the process, managers should
empower or ‘liberate’ (Peters, 1992) the workers by giving them more autonomy to do
their job. Similarly, numerous corporations have pursued “reengineering” (Hammer &
Champy, 1993) with the charge to enrich the worker’s job (e.g., Davenport, 1993)--but
without considering people relationships. The ‘gurus’ of the reengineering movement
now admit that they forgot the people part (Wall Street Journal, November, 1996). This
study points out that autonomy by itself may not be nearly as motivating as simply a
good worker/supervisor relationship. Further, a reengineered job may motivate, but that 185
motivation can be enhanced by a positive worker/boss relationship. The other paradigm,
based on economics, said that corporations can be most successful by giving corporate
agents salient incentives to encourage them to do the right thing for corporate principals.
Some are now beginning to show that this paradigm does not consistently work either
(e.g., Kohn, 1993a). This study’s findings say that each of these two paradigms is
inadequate! That is, proper management of people relationships and the fairness of the
company’s work environment are also required for effective corporate management. The
“traditional models of authority” often assume that “managers must closely supervise
their employees and cannot trust them” (Tyler & Kramer, 1996: 6). The relationships
findings of this study shed new light on authority models of management by pointing out
that the manager/worker relationship is itself an overlooked key to the worker’s
motivation. Since trust is the key component of Relationships, managers should work to
improve the level of trust between them and their employees. Creed and Miles (1996:
36, 19) pointed out that, by “taking the initiative in trusting,” management plays “a
central role” in determining a unit’s levels of trust. This study’s System Trust findings
also provide evidence that “managers need to create an environment in which workers
can be trusted” (Ibid.)
Popular management books and articles are also beginning to emphasize trust
between workers and managers (e.g., Covey, 1989; Peters, 1992). Further, the role of
workplace justice is being explored in management books: “[Workers] must trust that
you will treat them fairly if they make mistakes” (Campbell, 1997). This is especially
important in light of evidence that worker/management relationships have eroded
because of the layoffs, downsizing and other insecurity-building management practices 186
(e.g., Associated Press, 1997). One recent study of 215 companies found that “trust has
declined in three out of four workplaces during the past two years” (Jones, 1997: 1). The
lack of worker trust in management is commonly associated with lower worker loyalty to
the company (e.g., Jackson, 1997). Jackson said that the “new contract” between
employees and employers has left employees feeling like they are on their own. Hence,
worker loyalty , based on trust, is at an all-time premium in the corporate workplace. In
the critical system environment, in which a large store of knowledge and skill must be
kept to face the next unpredictable contingency (Weick, 1990), loyalty and retention of
skilled workers is of paramount importance.
This study also emphasizes that giving out incentives may not motivate. Rather
than just giving incentives, managers need to find out first what motivates their workers
and then try to give it to them (Pinder, 1991). In this study’s research site, the operators
were more strongly motivated by intrinsic factors and Relationships/System Trust than
anything else. Hence, managers of CSOs should concentrate on keeping the CSO job
motivating and developing a good relationship with each CSO. They should also take
steps to assure that CSOs feel that workplace structures encourage fair treatment.
Management should be very careful in how they employ incentive systems or alter
existing incentive systems. Mohrman, Resnick-West, and Lawler (1989) emphasized
that pay for performance must be done correctly, or “the positive advantages …are more
than wiped out…” (1989: 174-175). Lawler (1971) recommended that incentive pay not
be used in situations in which worker/supervisor trust levels are low.
By adding Relationships and System Trust to either the JCM or the Controls
model, organizations can more fully explain and more accurately predict motivation and 187
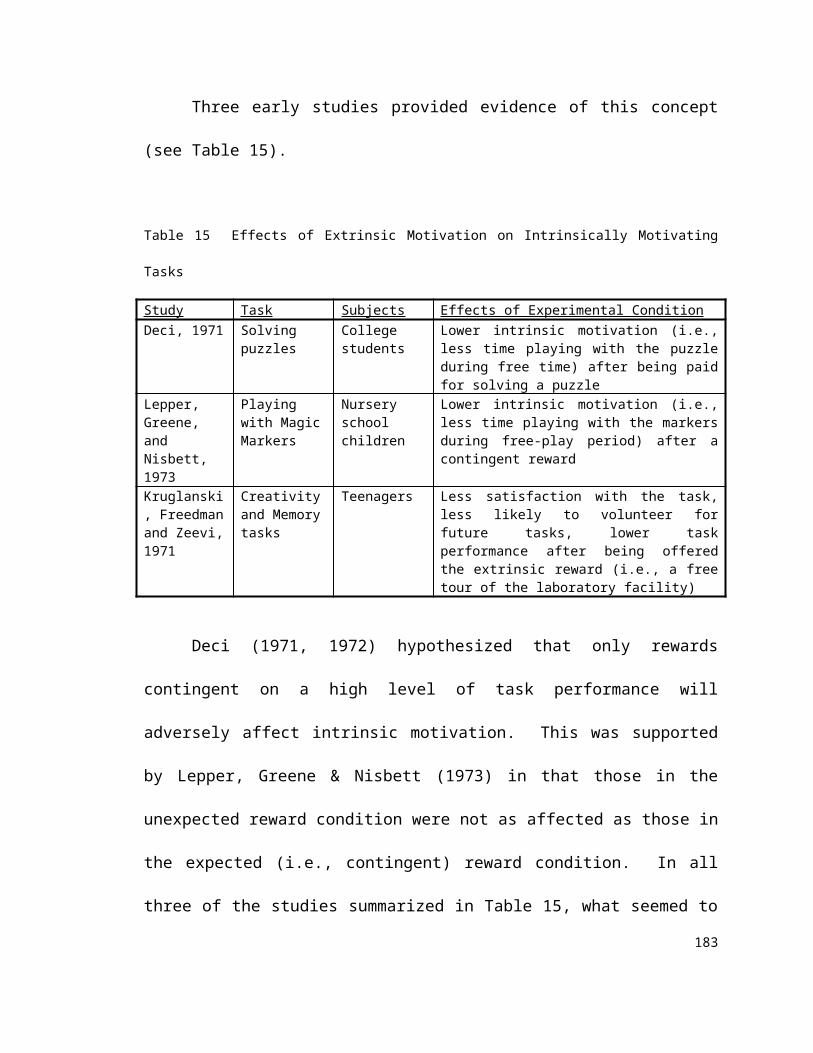
motivational work outcomes. In the context examined in this research, the study outlines
the significant motivational impacts of Job Characteristics, Relationships, and System
Trust for those operating critical computer systems.
This research also contributes to practice by applying the critical technology
systems paradigm (e.g., Weick, 1990) to the information systems field. What has been
learned in this study largely relates to the very challenging CSO job and its environment.
This researcher echoes Weick’s impression of critical systems operators generally:
“Considering what they face, it is remarkable that operators do as well as they do” (1990:
33). This study identifies several personal (e.g., knowledge), interpersonal (e.g.,
Relationships), structural (e.g., System Trust), and technical (e.g., testing) factors that
interact in this environment. While these factors each require additional research, the
immediate contribution to practice is that, in managing CSOs, one should consider all of
these interacting aspects of the CSO environment. Otherwise, unforeseen problems may
arise.
STUDY LIMITATIONS
This section discusses limitations and how they were addressed.
Most research is subject to the researcher’s pre-existing biases (Yin,
1984). However, the use of both inductive and deductive methods
helps reduce the effects of bias in this study.
External Validity
The most important limitation of a study of a single organization
is that its results may not be generalizable to other organizations. The
fact that the study’s data is drawn from operators of three separate 188
critical systems helps minimize the site’s uniqueness in terms of
critical systems, but does not address the uniqueness of XYZCo as an
organization. This study has argued that it is the unique
organizational and systems task-related factors at XYZCo that make it
an informative site. The drawback of this argument is that the results
may not have external validity, limiting this study’s contribution to
both science and practice.
However, the researcher believes that many of the principles
brought out in this study have wider applicability. For example, the
Controls/Relationships model (Figure 5) can be applied to many other
situations, both in information systems settings, and in general
management situations. Likewise, the issues relating to incentive
systems have broad applicability. The new instruments developed
here were designed for broad application. The following briefly
outlines efforts the researcher has already made to test the
generalizability of the Management Controls / Relationships model and
the specific incentive findings.
First Test for External Validity: Controls/Relationships
Model. First, the Management Controls/Relationships model has been
tested in a different setting. Separate from the dissertation study, the
researcher and a colleague have tested the external validity of a
subset of the Controls/Relationships model using an existing data
source, the “world-class manufacturing study.” This study began in 189
1991 at the University of Minnesota’s Carlson School of Management.
Its researchers collected data on a wide range of important variables
from 110 American, Japanese, and Italian manufacturing plants. The
data included variables reflecting Management Controls,
worker/management Relationships, and Motivation. Using these data,
a model of Relationships moderating the effects of Controls on
Motivation was tested. A variable for plant nationality was also placed
in the model as a covariate. This model was found to be strongly
supported. This external validity test provides significant additional
evidence for the usefulness of the Management Controls/Relationships
model. Obviously, more testing is needed.
Second Test for External Validity: Incentives Effects on
Motivation. The pilot organization afforded a second site to further
explore the implications of incentives because of how their reward
structure differed from that at XYZCo. At the pilot company:
incentives were salient in terms of goal challenge, but not as salient
in terms of objective amount;
the incentive was tied to a one time productivity goal over a three
month period;
the award was based on the team meeting its goal; and,
the award was divided evenly among team members.
The researcher hypothesized that the incentive would have negative
side effects.190
Team members were interviewed about the incentive and their
motivation both during and after the three month award period. The
incentive appeared to increase several aspects of their motivation
(and performance) during the award period. However, performance
decreased immediately after the award period to lower-than-normal
levels. In subsequent months, performance gradually increased to
about the same as it had been before the incentive. Post-award
interviews confirmed the researcher’s hypothesis that the incentive
would have some negative impact. Explaining the reduced post-
incentive performance, several interviewees said that the incentive
caused the team to focus so much on the goal that it neglected other
things that were not directly related to the goal. Having to pursue
these neglected items contributed to decreases in goal-related
productivity in the months directly following the goal period. Hence,
the pilot site confirmed that negative effects of controls may occur.
Other Limitations. The fact that most constructs were based
on self-report data makes it difficult to know how valid they are in the
face of threats like social desirability bias (Cook & Campbell, 1979). In
spite of Dillman’s (1978) assurances to the contrary (Chapter Two),
this threat may have been exacerbated by the use of a telephone
questionnaire. This possibility was minimized by assurances the
interviewer provided that tend to decrease social desirability bias (see
Chapter Two, Appendix C-Introduction).191
Another issue is statistical power (Cohen, 1988). Because the
sample size was limited to the number of people available to talk at
one research site, power calculations were not pursued. Intuitively, a
sample size of eighty-six is probably adequate to feel safe about the
main effects of the models. However, the interactive effects probably
require additional power.
Mono-method (common informant) bias is a limitation that was
addressed for equations predicting CTE and Performance, but not for
equations predicting Motivation, CPS, and Work Outcomes. Hence,
mono-method bias should be considered a caveat for this study. The
testing of Autonomy for mono-method bias revealed some differences
between methods, but overall, the items from the two methods could
be successfully merged into a single construct.
Another limitation is that several minor wording changes were
made to the JCM scales in order to increase their reliability. While
these were minor, it is possible that this could have slightly affected
the scores for these variables. It is not at all unusual, however, for
JCM constructs to be operationalized in ways that differ somewhat
from the original (Griffin, Welsh & Moorhead, 1981).
FUTURE RESEARCH
This study raises a number of interesting questions for researchers to pursue. The
most obvious question is, “To what extent will these findings apply in similar and diverse
settings?” A number of direction-of-causality issues were raised in the discussion 192
sections. This study indicates that a number of processes lie behind these cross-sectional
results; the interactional nature of relationships and motivation is intriguing but not clear
at this point. To begin to answer such questions, the following steps are suggested.
First, the constructs of this study need to be studied in other critical computer
systems settings. Second, the direction of causality of a number of construct-to-construct
relationships needs to be studied. These include the extent to which Controls, System
Trust, and Relationships influence each other. Third, the interaction between
Relationships, System Trust, and Motivation should be tested longitudinally--both
experimentally and through questionnaire research. Fourth, the surprising strength of
System Trust and Relationships’ trust constructs makes determining the antecedents of
trust a strong imperative (e.g., see Luhmann, 1991). Fifth, while the relationship
between workers and direct supervisors is important, some research suggests that the
relationship between workers and higher levels of management may also be important—
yet difficult to manage (e.g., Crozier, 1964: 82-83, 95). The effects of these relationships
on worker motivation should also be studied. Sixth, the relative strength of the JCM and
MCM should be tested. Simultaneous model tests (e.g., Davis, Bagozzi & Warshaw,
1989) help science advance.
In future research, method bias should be addressed in two ways. First, the social
desirability bias resulting from telephone questionnaire should be compared directly to
that resulting from written questionnaires by splitting the sample. Second, informant-
related bias should be addressed by gathering independent variables from one informant
and dependent variables from the other informants. Alternatively, one set should be
gathered from both informants.193
This study found that organizational, people, and relationships issues were
important to the operation of critical computer systems. Abstracting to a higher level,
one might say that this study explores the effects of people and organizational issues on
information systems (people + organizations systems). This is the opposite of the
trend in the MIS field, which has primarily focused on how information systems affect
people and organizations (systems people + organizations). For example, George &
King (1991) discussed how computing can drive centralization or decentralization of
organizations, but did not discuss how organizational structure can affect the health of
systems. The results of this study suggest, as emphasized by Kaplan and Duchon (1988:
583), that research “designs should consider the impacts of users, the organization, or
society on the computer information system.” As an example, this study’s results about
incentives imply a need to study cross-sectionally the effects of information system
management incentives on system availability.
In particular, the well-being of critical systems needs to be examined in much
more detail than has been done so far. Since system availability is becoming more and
more important, the following research avenues should be pursued:
The effects of Total Quality Management approaches on critical computer
system availability should be researched. This was suggested by XYZCo’s quality
improvement teams made up of CSOs. Improving critical system availability to six
sigma (99.9999%) quality is a natural fit for the quality management research paradigm.
Thompson (1967) predicted that the structural system will address system
uncertainties by protecting the technical system from environmental threats. Phase I
confirmed this proposition at XYZCo (McKnight, 1996). The effects of structural 194
technical safeguards like redundant equipment, backup software, system environmental
protections, and testing procedures all contributed to XYZCo’s systems availability.
These should be studied in terms of which factors are the most important to system
availability.
The complexity and comprehensibility of an operational environment change in
both nature and degree when the environment is computerized (Lee, 1991b; Perrow,
1984; Zuboff, 1988). In light of efforts to automate CSO roles, the effects of operator
automation on CSO alertness, comprehension, and job characteristics should be studied
(McKnight, 1996).
In the Chapter Three Discussion of Results section, the issue of CSO
disincentives to do preventive maintenance was raised. This area needs further research.
In light of this possibility, the extent to which teamwork and trust among CSOs reduces
the tendency to prefer the ‘glory job’ of system repair over the ‘no glory’ job of
preventive maintenance should also be studied.
As Pentland (1992) found, an individual CSO in troubleshooting mode is likely
to need the help of others on the team to resolve a thorny problem. The network of team
members on whom the CSO can call seems paramount. Research should identify what
attributes of the networked team member are most important to the CSO handling a
given problem type (e.g., particular knowledge, skills), and how the interpersonal
relationships attributes (e.g., Liking, Trusting Beliefs-Benevolence) matter regarding
who the CSO contacts for help.
195
The central computing center probably accounts for far fewer system outages,
as experienced by end users, than the combined communications network and end user
premise environments. These should also be studied in terms of system availability.
While studies have been done of the human-computer interaction (HCI) of
nuclear plant and aircraft carriers operators (e.g., Rasmussen, 1986; Weick & Roberts,
1993), little is known about the HCI of CSOs. At XYZCo, work has been done to
simplify and more clearly present the system control screen information to the CSO. The
HCI domain needs to be explored in much more detail in the uniquely frenetic CSO
arena.
Weick (1990) pointed out that the critical system environment can be a cauldron
of strong emotions. In the context of a critical computer system outage, emotional events
are likely to affect both management, the CSO, and the system user—as they interact.
How these emotions affect, and are affected by, the interpersonal dynamics of the
situation is interesting. How these interactive factors impact CSO performance is an
intriguing question to pursue.
196
REFERENCES
Adams, J. S. 1963. Toward an understanding of inequity. Journal of Abnormal and Social Psychology, 65: 422-436.
Aiken, M. & Hage, J. 1966. Organizational alienation: A comparative analysis. American Sociological Review, 31: 497-507.
Aiken, L. S. & West, S. G. 1991. Multiple regression: Testing and interpreting interactions. Newbury Park, CA: Sage.
Alderfer, C. P. 1969. An empirical test of a new theory of human needs. Organizational Behavior and Human Performance, 4: 142-175.
Anthony, R. N. 1965. Planning and control systems: A framework for analysis. Boston, MA: Division of Research, Graduate School of Business Administration, Harvard University.
Applegate, L. M. 1991. Technology support for cooperative work: A framework for studying introduction and assimilation in organizations. Journal of Organizational Computing, 1: 11-39.
Argyris, C. 1975. Dangers in applying results from experimental social psychology. American Psychologist, 30: 469-485.
Associated Press. 1997. Job is great-except for boss, workers say. Deseret News archives, September 1: 1.
Atkinson, J. W. & Birch, D. 1970. The dynamics of action. New York: Wiley.
Atwater, L. E. 1988. The relative importance of situational and individual variables in predicting leader behavior: The surprising impact of subordinate trust. Group and Organization Studies, 13: 290-310.
Bailey, R. W. 1982. Human performance engineering: A guide for system designers. Englewood Cliffs, NJ: Prentice-Hall.
Bandura, A. 1986. Social foundations of thought and action: A social cognitive theory. Englewood Cliffs, NJ: Prentice-Hall.
197
Banker, R. D., Datar, S., Kemerer, C. F. & Zweig, D. 1993. Software complexity and software maintenance costs. Communications of the ACM, 36: 81-94.
Barber, B. 1983. The logic and limits of trust. New Brunswick, NJ: Rutgers University Press.
Barley, S. R. 1990. Images of imaging: Notes on doing longitudinal field work. Organization Science, 1: 220-247.
Barney, J. B. & Ouchi, W. G. 1986. (Eds.) Organizational economics. San Francisco: Jossey-Bass.
Baron, R. M. & Kenny, D. A. 1986. The moderator-mediator variable distinction in social psychological research: Conceptual, strategic, and statistical considerations, Journal of Personality and Social Psychology, 51: 1173-1182.
Bem, D. J. 1967. Self-perception: The dependent variable of human performance. Organizational Behavior and Human Performance, 2: 105-21.
Berkeley, P. E. 1984. Computer operations training: A strategy for change. New York: Nostrand Reinhold, 1984.
Berscheid, E. 1983. Emotion. In Kelley, H. H., Berscheid, E., Christensen, A., Harvey, J. H., Huston, T. L., Levinger, G., McClintock, E., Peplau, L. A. & Peterson, D. R. (Eds.), Close relationships: 110-168. New York: W. H. Freeman.
Blau, P. M. 1964. Exchange and power in social life. New York: John Wiley & Sons.
Bostrom, R. P. & Heinen, J. S. 1977. MIS problems and failures: A socio-technical perspective, Part I: The causes. MIS Quarterly, 1: 17-32.
Brooks, F. P. Jr. 1987. No silver bullet: Essence and accidents of software engineering. IEEE Computer, April: 10-19.
Burt, R. S. & Knez, M. 1996. Trust and third-party gossip. In R. M. Kramer & T. R. Tyler (Eds.). Trust in organizations: Frontiers of theory and research, 68-89. Thousand Oaks, CA: Sage.
198
Calder, B. J. & Staw, B. M. 1975. Self-perception of intrinsic and extrinsic motivation. Journal of Personality and Social Psychology, 31: 599-605.
Campbell, J. 1997. Workplaces that don’t work. Deseret News archives, July 13: 3.
Campbell, D. T. & Fiske, D. W. 1959. Convergent and discriminant validation by the multitrait-multimethod matrix. Psychological Bulletin, 56: 81-105.
Campbell, J. P. & Pritchard, R. D. 1976. Motivation theory in industrial and organizational psychology. In M. D. Dunnette (Ed.) Handbook of industrial and organizational psychology, 63-130. Chicago: Rand McNally.
Carver, C. S. & Scheier, M. F. 1981. Attention and self-regulation: A control theory approach to human behavior. New York: Springer-Verlag.
Cohen, J. 1988. Statistical power analysis for the behavioral sciences, second edition. Hillsdale, NJ: Lawrence Erlbaum.
Cook, T. D. & Campbell, D. T. 1979. Quasi-experimentation: Design & analysis issues for field settings. Chicago: Rand-McNally.
Cook, J. & Wall, T. 1980. New work attitude measures of trust, organizational commitment and personal need non-fulfilment. Journal of Occupational Psychology, 53: 39-52.
Couger, J. D. & Zawacki, R. A. 1980. Motivating and managing computer personnel. New York: John Wiley.
Covey, S. R. 1989. The seven habits of highly effective people: Restoring the character ethic. New York: Simon & Schuster.
Creed, W. E. D. & Miles, R. E. 1996. Trust in organizations: A conceptual framework linking organizational forms, managerial philosophies, and the opportunity costs of controls. In R. M. Kramer & T. R. Tyler (Eds.). Trust in organizations: Frontiers of theory and research, 16-38. Thousand Oaks, CA: Sage.
Cronbach, L. J. 1951. Coefficient alpha and the internal structure of tests. Psychometrika, 16: 297-334.
199
Crozier, M. 1964. The bureaucratic phenomenon. Chicago: University of Chicago Press.
Cummings, L. L. & Anton, R. J. 1990. The logical and appreciative dimensions of accountability. In S. Srivastva, D. L. Cooperrider and Associates, (Eds.) Appreciative management and leadership: The power of positive thought and action in organizations, 257-286. San Francisco: Jossey-Bass.
Cusella, L. P. 1982. The effects of source expertise and feedback valence on intrinsic motivation. Human Communication Research, 9: 17-32.
Das, A. 1994. Productivity in knowledge work: A study of technical support in supercomputing. Unpublished doctoral dissertation, University of Minnesota.
Davenport, T. H. 1993. Process innovation: Reengineering work through information technology. Boston: Harvard Business School Press.
Davis, F. D. 1989. Perceived usefulness, perceived ease of use, and user acceptance of information technology. MIS Quarterly, 13: 319-340.
Davis, G. B. & Olson, M. H. 1985. Management information systems: Conceptual foundations, structure, and development, Second edition, New York: McGraw-Hill.
Davis, F. D., Bagozzi, R. P. & Warshaw, P. R. 1989. User acceptance of computer technology: A comparison of two theoretical models. Management Science, 35: 982-1003.
Davis, F. D. & Venkatesh, V. 1994. A critical assessment of potential measurement biases in the technology acceptance model: Three experiments. Unpublished working paper, University of Minnesota.
de Charms, R. 1968. Personal causation: The internal affective determinants of behavior. New York: Academic Press.
Deci, E. L. 1971. The effects of externally mediated rewards on intrinsic motivation. Journal of Personality and Social Psychology, 18: 105-15.
200
Deci, E. L. 1972. The effects of contingent and noncontingent rewards and controls on intrinsic motivation. Organizational Behavior and Human Performance, 3:217-229.
Deci, E. L. 1975. Intrinsic motivation. New York: Plenum.
Deci, E. L. & Ryan, R. M. 1985. Intrinsic motivation and self-determination in human behavior. New York: Plenum.
Deci, E. L. & Ryan, R. M. 1987. The support of autonomy and the control of behavior. Journal of Personality & Social Psychology, 53: 1024-1037.
DeGreene, K. B. 1970. (Ed.), Systems psychology. New York: McGraw-Hill.
Denzin, N. K. 1978. The logic of naturalistic inquiry. In Denzin, N. K. (Ed.). Sociological methods: A sourcebook, second edition, New York: McGraw-Hill.
Denzin, N. K. 1989. The research act: A theoretical introduction to sociological methods. Englewood Cliffs, NJ: 1989.
Denzin, N. K. 1994. The art and politics of interpretation. In N. K. Denzin & Y. S. Lincoln (Eds.). Handbook of qualitative research, 500-515. Thousand Oaks, CA: Sage.
Dillman, D. A. 1978. Mail and telephone Surveys: The total design method. New York: Wiley.
Dobing, B. 1993. Building trust in user-analyst relationships. Unpublished doctoral dissertation, Information and Decision Sciences Department, University of Minnesota, Minneapolis.
Drucker, P. F. 1991. The new productivity challenge. Harvard Business Review, November-December, 69: 69-79.
Dubin, R. 1976. Theory building in applied areas. In M. D. Dunnette (Ed.), Handbook of industrial and organizational psychology, 17-39. Chicago: Rand-McNally.
Dyer, L. & Parker, D. F. 1975. Classifying outcomes in work motivation research: An examination of the intrinsic-extrinsic dichotomy. Journal of Applied Psychology, 60: 455-458.
201
Earley, P. C. 1986. Trust, perceived importance of praise and criticism, and work performance: An examination of feedback in the United States and England. Journal of Management, 12: 457-473.
Earley, P. C. 1988. Computer-generated performance feedback in the magazine-subscription industry Organizational Behavior and Human Decision Processes, 41: 50-64.
Eisenhardt, K. M. 1985. Control: Organizational and economic approaches. Management Science, 31: 134-149.
Eisenhardt, K. M. 1989a. Building theory from case study research, Academy of Management Review, 14: 532-550.
Eisenhardt, K. M. 1989b. Agency theory: An assessment and review, Academy of Management Review, 14: 57-74.
Fisher, C. D. 1978. The effects of personal control, competence, and extrinsic reward systems on intrinsic motivation. Organizational Behavior and Human Performance, 21: 273-288.
Freedman, J. L., Cunningham, J. A. & Krismer, K. 1992. Inferred values and the reverse-incentive effect in induced compliance. Journal of Personality and Social Psychology, 62: 357-368.
French, J. R. P. & Raven, B. 1968. The bases of social power. In D. Cartwright and A. Zander (Eds.), Group Dynamics, third edition, 259-269. New York: Harper and Row.
Gabarro, J. J. 1990. The development of working relationships. In J. Galegher, R. E. Kraut & C. Egido, Intellectual teamwork: Social and technological foundations of cooperative work. Hillsdale, 79-110. NJ: Lawrence Erlbaum.
Galitz, W. O. 1980. Human factors in office automation. Atlanta: Life Office Management Association.
Gallegos, R. C & Phelan, J. G. 1977. Effects on productivity and morale of a systems-designed job-enrichment program in Pacific Telephone. Psychological Reports, 40:283-290.
Gear, T. E., Marsh, N. R. & Sergent, P. 1985. Semi-automated feedback and team behavior. Human Relations, 38: 707-721.
202
George, J. F. & King, J. L. 1991. Examining the computing and centralization debate. Communications of the ACM, 34: 63-72
Georgopoulos, B. S. & Mann, F. C. 1962. The community general hospital. New York: Macmillan.
Glaser, B. 1978. Theoretical sensitivity. Mill Valley, CA: Sociology Press.
Glaser, B. 1992. Emergence vs. forcing: Basics of grounded theory analysis. Mill Valley, CA: Sociology Press.
Glaser, B. & Strauss, A. 1967. The discovery of grounded theory.
Chicago: Aldine.
Glick, W. H., Jenkins, G. D., Jr. & Gupta, N. 1986. Method versus substance: How strong are underlying relationships between job characteristics and attitudinal outcomes? Academy of Management Journal, 29: 441-464.
Goudas, M., Biddle, S. & Underwood, M. 1995. A prospective study of the relationships between motivational orientations and perceived competence with intrinsic motivation and achievement in a teacher education course. Psychology, 15: 89-96.
Granovetter, M. 1985. Economic action and social structure: The problem of embeddedness, American Journal of Sociology, Volume 91, pp. 481-510.
Green, L. & Foster, D. 1986. Classroom intrinsic motivation: Effects of scholastic level, teacher orientation, and gender. Journal of Educational Research, 880: 34-39.
Greenberg, J. 1993. Justice and organizational citizenship: A commentary on the state of the science. Employee Responsibilities and Rights Journal, 6: 249-256
Griffin, R. W. 1983. Objective and social sources of information in task redesign: A field experiment. Administrative Science Quarterly, 28: 184-200.
Griffin, R. W., Welsh, A. & Moorhead, G. 1981. Perceived task characteristics and employee performance: A literature review. Academy of Management Review, 6: 655-664.
203
Guzzo, R. A. 1979. Types of rewards, cognitions, and work motivation. Academy of Management Review, 4: 75-86.
Hackman, J. R. 1980. Work Redesign, Reading, MA: Addison-Wesley.
Hackman, J. R. & Lawler, E. E. 1971. Employee reactions to job characteristics. Journal of Applied Psychology, 55: 259-286.
Hackman, J. R. & Oldham, G. R. 1975. Development of the job diagnostic survey. Journal of Applied Psychology, 60: 159-170.
Hackman, J. R. & Oldham, G. R. 1976. Motivation through the design of work: Test of a theory. Organizational Behavior and Human Performance, 16: 250-279.
Hale, A. R. & Glendon, A. I. 1987. Individual behaviour in the control of danger, Amsterdam: Elsevier.
Hammer, M. & Champy, J. 1993. Reengineering the corporation: A manifesto for business revolution. New York: Harper Business.
Hamner, W. C. 1974. Reinforcement theory and contingency management in organizational settings. In H. L. Tosi & W. C. Hamner (Eds.), Organizational behavior and management: A contingency approach. Chicago: St. Clair Press.
Hamner, W. C. 1991. Reinforcement theory and contingency management in organizational settings. In R. M. Steers & L. W. Porter (Eds.) Motivation and work behavior, fifth edition. New York: McGraw-Hill.
Harackiewicz, J. M. & Larson, J. R. 1986. Managing motivation: The impact of supervisor feedback on subordinate task interest. Journal of Personality and Social Psychology, 51: 547-556.
Harackiewicz, J. M., Manderlink, G. & Sansone, C. 1984. Rewarding pinball wizardry: Effects of evaluation and cue value on intrinsic interest. Journal of Personality and Social Psychology, 47: 287-300.
Henderson, J. C. & Lee, S. 1992. Managing I/S design teams: A control theories perspective. Management Science, 38: 757-777.
204
Hergenhahn, B. R. & Olson, M. H. 1993. An introduction to theories of learning, fourth edition. Englewood Cliffs, NJ: Prentice Hall.
Herzberg, F. 1966. Work and the nature of man. Cleveland: World.
Herzberg, F. 1976. The motivation-hygiene concept and problems of manpower. In R. A. Zawachi & D. D. Warrick (Eds.). Organization development: Managing change in the public sector, 178-182. Chicago: IPMA.
Hirschman, A. O. 1984. Against parsimony: Three easy ways of complicating some categories of economic discourse. American Economic Review, 74: 89-96.
Hofstede, G. H. 1967. The game of budget control, second edition. Assen, The Netherlands: Van Gorcum & Comp.
Holmes, J. G. & Rempel, J. K. 1989. Trust in close relationships. In C. Hendrick (Ed.), Close relationships: Review of personality and social psychology, 10: 187-220. Newbury Park, CA: Sage.
Hunter, J. E. & Gerbing, D. W. 1982. Unidimensional measurement, second order factor analysis, and causal models. In B. M. Staw & L. L. Cummings (Eds.) Research in Organizational Behavior, 4: 267-320. Greenwich, CN: JAI Press.
Huston, T. L. 1983. Power. In H. H. Kelley, E. Berscheid, A. Christensen, J. H. Harvey, T. L. Huston, G. Levinger, E. McClintock, L. A. Peplau & D. R. Peterson (Eds.). Close relationships, 169-219. New York: W. H. Freeman.
Idaszak, J. R. & Drasgow, F. 1987. A revision of the Job Diagnostic Survey: Elimination of a measurement artifact. Journal of Applied Psychology, 72: 69-74.
Ivancevich, J. M. & McMahon, J. T. 1982. The effects of goal setting, external feedback, and self-generated feedback on outcome variables: A field experiment. Academy of Management Journal, 25: 359-372.
Ives, B. & Chervany, N. L. 1983. Alternative data entry technologies and settings: Impact on worker attitudes and behavior. Information & Management, 6: 37-47.
205
Ives, B., Hamilton, S. & Davis, G. B. 1980. A framework for research in computer-based management information systems. Management Science. 26: 910-934.
Jackson, M. 1997. Employers strive to cultivate a loyal workforce. Minneapolis Star Tribune business archives, October 13.
Jayaaratne, S, Vinokur-Kaplan, D. & Chess, W. A. 1995. The importance of personal control: A comparison of social workers in private practice and public agency settings. Journal of Applied Social Sciences, 19: 47-59.
Johnson-George, C. & Swap, W. C. 1982. Measurement of specific interpersonal trust: Construction and validation of a scale to assess trust in a specific other. Journal of Personality and Social Psychology, 43: 1306-1317.
Jones, D. N. 1997. Is workplace morale on decline? Deseret News Archives, September 7: 1.
Kakabadse, A. 1986. Organizational alienation and job climate: A comparative study of structural conditions and psychological adjustment. Small Group Behavior, 17: 458-471.
Kanfer, R. 1990. Motivation theory and industrial and organizational psychology. In Dunnette, M. D. (Ed.) Handbook of industrial & organizational psychology, 1: 75-170. Palo Alto, CA: Consulting Psychologist Press.
Kaplan, A. 1964. The conduct of inquiry. New York: Chandler.
Kaplan, B. & Duchon, D. 1988. Combining qualitative and quantitative methods in information systems research: A case study. MIS Quarterly, 12:571-586
Kearney, M. H., Murphy, S. & Rosenbaum, M. 1994. Mothering on crack cocaine: A grounded theory analysis. Social Science and Medicine, 38: 351-361.
Keller, G., Warrack, B. & Bartel, H. 1988. Statistics for management and economics: A systematic approach. Belmont, CA: Wadsworth.
Kirk, J. & Miller, M. L. 1986. Reliability and validity in qualitative research. Beverly Hills, CA: Sage.
206
Kirsch, L. J. 1992. Formal, informal, and self controls: An analysis of working relationships during systems development projects. Unpublished doctoral dissertation, Information and Decision Sciences Department, University of Minnesota, Minneapolis.
Kohn, A. 1993a. Why incentive plans cannot work. Harvard Business Review, 71: 54-60.
Kohn, A. 1993b. Punished by rewards: The trouble with gold stars, incentive plans, A’s, praise, and other bribes. Boston: Houghton Mifflin.
Kramer, R. M. 1996. Divergent realities and convergent disappointments in the hierarchic relation: Trust and the intuitive auditor at work. In R. M. Kramer & T. R. Tyler (Eds.), Trust in organizations: Frontiers of theory and research: 216-245. Thousand Oaks, CA: Sage.
Kruglanski, A. W., Freedman, I. & Zeevi, G. 1971. The effects of extrinsic incentives on some qualitative aspects of task performance. Journal of Personality, 39: 606-617.
Kumar, A. & Dillon, W. R. 1990. On the use of confirmatory measurement models in the analysis of multiple-informant reports. Journal of Marketing Research, 27: 102-111.
Laudon, K. C. & Laudon, J. P. 1995. Essentials of management information systems: Organization and technology. Upper Saddle River, NJ: Prentice-Hall.
Lawler, E. E. 1971. Pay and organizational effectiveness: A psychological view. New York: McGraw-Hill.
Lawler, E. E. & Hall, D. T. 1970. Relationship of job characteristics to job involvement, satisfaction, and intrinsic motivation. Journal of Applied Psychology, 54: 305-312.
Lawler, E. E. & Rhode, J. G. 1976. Information and control in organizations. Pacific Palisades, CA: Goodyear Publishing Company.
Lee, A. S. 1991a. Integrating positivist and interpretive approaches to organizational research. Organization Science, 2: 342-365.
207
Lee, L. 1991b. The day the phones stopped. New York: Donald I. Fine.
Lending, D. 1996. CASE Technology and Systems Development Job Characteristics. Unpublished Doctoral Dissertation, Information and Decision Sciences department, University of Minnesota, Minneapolis.
Lepper, M. R., Greene, D. & Nisbett, R. E. 1973. Undermining Children’s intrinsic interest with extrinsic rewards: A test of the ‘overjustification’ hypothesis. Journal of Personality and Social Psychology, 28: 129-137.
Lewis, J. D. & Weigert, A. J. 1985. Trust as a social reality. Social Forces, 63: 967-965.
Lientz, B. P. & Swanson, E. B. 1980. Software maintenance management. Reading, MA: Addison-Wesley.
Lincoln, Y. S. & Guba, E. G. 1985. Naturalistic inquiry. Beverly Hills, CA: Sage.
Locke, E. A. 1968. Toward a theory of task motivation and incentives. Organizational Behavior and Human Performance, 3: 157-189.
Locke, E. A., Latham, G. P. & Erez, M. 1988. The determinants of goal commitment. Academy of Management Review, 13: 23-39.
Lofland, J. 1971. Analyzing social settings: A guide to qualitative observation and analysis. Belmont, CA: Wadsworth.
Lopez, E. M. 1981. Increasing intrinsic motivation with performance-contingent reward. Journal of Psychology, 108: 59-65.
Lucas, H. C. 1975. Why information systems fail. New York: Columbia University Press.
Luhmann, N. 1991. Trust and Power. Ann Arbor, MI: University Microfilms International.
Lyytinen, K. & Hirschheim, R. 1987. Information systems failures--A survey and classification of the empirical literature. Oxford Surveys in Information Technology, 257-309. Oxford: Oxford University Press.
208
Maslow, A. H. 1943. A theory of human motivation. Psychological Review, 50: 370-396.
Maslow, A. H. 1954. Motivation and personality. New York: Harper & Row.
Mayer, R. C., Davis, J. H. & Schoorman, F. D. 1995. An integrative model of organizational trust. Academy of Management Review, 20, 709-734.
Mayo, E. 1949. The social problems of an industrial civilization. London: Routledge & Kegan Paul.
McClelland, G. H. & Judd, C. M. 1993. Statistical difficulties of detecting interactions and moderator effects. Psychological Bulletin, 114: 376-390.
McIntosh, N. J. 1990. Leader support and responses to work in US nurses: A test of alternative theoretical perspectives. Work & Stress, 4: 139-154.
McKnight, D. H. 1996. Management strategies for operating critical transaction processing systems, In J. M. Carey (Ed.) Proceedings of the Americas conference on information systems, 194-196. Association for Information Systems, Phoenix, Arizona, August 16-18.
McKnight, D. H. & Chervany, N. L. 1996. The meanings of trust. MIS research center, working paper series, WP 96-04, Information and Decision Sciences department, Carlson School of Management, University of Minnesota.
McKnight, D. H., Cummings, L. L. & Chervany, N. L. 1996. Trust formation in new organizational relationships. MIS research center, working paper series, WP 96-01, Information and Decision Sciences department, Carlson School of Management, University of Minnesota.
Meehl, P. E. 1978. Theoretical risks and tabular asterisks: Sir Karl, Sir Ronald, and the slow progress of soft psychology. Journal of Consulting and Clinical Psychology, 46: 806-834.
Mintzberg, H. 1979. An emerging strategy of “direct” research. Administrative Science Quarterly, 24: 582-589.
209
Mohrman, A. M., Jr., Resnick-West, S. M. & Lawler, E. E. 1989. Designing performance appraisal systems: Aligning appraisals and organizational realities. San Francisco: Jossey-Bass.
Mowday, R. T., Steers, R. M. & Porter, L. W. 1979. The measurement of organizational commitment. Journal of Vocational Behavior, 14: 224-247.
Mowday, R. T. & Sutton, R. I. 1993. Organizational behavior: Linking individuals and groups to organizational contexts. Annual Review of Psychology, 44: 195-229.
Neter, J., Wasserman, W. & Kutner, M. H. 1990. Applied linear statistical models: Regression, analysis of variance, and experimental designs, third edition. Homewood, IL: Irwin.
Norman, D. A. 1983. Design rules based on analyses of human error. Communications of the ACM, 26: 254-258.
Nunnally, J. C. 1978. Psychometric theory, second edition. New York: McGraw-Hill.
O’Reilly, C. & Roberts, K. 1974. Information filtration in organizations: Three experiments. Organizational Behavior and Human Performance, 11: 253-265.
Orlikowski, W. J. 1992. The duality of technology: Rethinking the concept of technology in organizations. Organization Science, 3: 398-427.
Orlikowski, W. J. 1993. CASE tools as organizational change: Investigating incremental and radical changes in systems development. MIS Quarterly, 17: 309-340.
Ouchi, W. G. 1979. A conceptual framework for the design of organizational control mechanisms, Management Science, 25: 833-848.
Ouchi, W. G. & Maguire, M. A. 1975. Organizational control: Two functions. Administrative Science Quarterly, 20: 559-569.
Pearce, J. L. & Porter, L. W. 1986. Employee responses to formal performance appraisal feedback. Journal of Applied Psychology, 71: 211-218.
210
Pentland, B. T. 1992. Organizing moves in software support lines. Administrative Science Quarterly, 37: 527-548.
Perrow, C. 1984. Normal accidents: Living with high-risk technologies. New York: Basic Books.
Peters, T. 1992. Liberation management: Necessary disorganization for the nanosecond nineties. New York: Alfred A. Knopf.
Pfeffer, J. 1981. Power in organizations. HarperBusiness.
Pinder, C. D. 1991. Valence-instrumentality-expectancy theory. In R. M. Steers & L. W. Porter, (Eds.) Motivation and work behavior, 144-164, fifth edition. New York: McGraw-Hill.
Pittman, T. S., Davey, M. E., Alafat, K. A., Wetherill, K. V. & Kramer, N. A. 1980. Informational versus controlling verbal rewards. Personality and Social Psychology Bulletin, 6: 228-233.
Poole, M. S. & Van de Ven, A. H. 1989. Using paradox to build management and organization theories. Academy of Management Review, 14: 562-578.
Powers, R. F. & Dickson, G. W. 1973. MIS project management: Myths, opinions, and reality. California Management Review, Spring: 147-156.
Pritchard, R. D. & Montagno, R. V. 1978. Effects of specific vs. nonspecific and absolute vs. comparative feedback on performance and satisfaction. US AFHRL Technical Report, 78-12.
Quick, R. 1997. Surge in e-mail volume causes a five-hour blackout at AOL. Wall Street Journal interactive edition, November 25.
Quintanilla, S. A. R. 1987. New technologies and human error: Social and organizational factors. In J. Rasmussen, K. Duncan & J. Leplat (Eds.) New technology and human error, 125-128. Chichester, U. K.: John Wiley & Sons.
Rasmussen, J. 1986. Information processing and human-machine interaction: An approach to cognitive engineering. New York: North-Holland.
211
Rasmussen, J., Duncan, K. & Leplat, J. (Eds.). 1987. New technology and human error. Chichester, U. K.: John Wiley & Sons.
Reuters News Service. 1996. “AOL Outage Takes Toll,” and “America Online Says it Has Resumed Service,” August 8.
Ring, P. S. & Van de Ven, A. H. 1994. Developmental processes of cooperative interorganizational relationships. Academy of Management Review. 19: 90-118.
Roberts, K. H. & Glick, W. 1981. The job characteristics approach to task design: A critical review. Journal of Applied Psychology, 66: 193-217.
Rosin, H. M & Korabik, K. 1991. Workplace variables, affective responses, and intention to leave among women managers. Journal of Occupational Psychology, 64: 317-330.
Ross, M. 1975. Salience of reward and intrinsic motivation. Journal of Personality and Social Psychology, 32: 245-254.
Rubin, Z. 1973. Liking and loving: An invitation to social psychology. New York: Holt, Rinehart and Winston.
Ryan, R. 1982. Control and information in the intrapersonal sphere: An extension of cognitive evaluation theory. Journal of Personality and Social Psychology, 43: 450-461.
Sagasti, F. R. & Mitroff, I. I. 1973. Operations research from the viewpoint of general systems theory, OMEGA, 1: 695-709.
Salancik, G. & Pfeffer, J. 1978. A social information processing approach to job attitudes and task design. Administrative Science Quarterly, 23: 224-253.
Sanjek, R. 1990. The secret life of fieldnotes. In Sanjek, R. (Ed.). Fieldnotes: The makings of anthropology, 187-270. Ithaca, NY: Cornell University Press.
Sarata, B. P, & Jeppesen, J. C. 1977. Job design and staff satisfaction in human service settings. American Journal of Community Psychology, 5: 229-236.
212
Schlesinger, L. A. & Heskett, J. L. 1991. The service-driven service company. Harvard Business Review, September-October, 69: 71-81.
Schwab, D. P. 1980. Construct validity in organizational behavior. In B. M. Staw & L. L. Cummings (Eds.). Research in Organizational Behavior, 2: 3-43. Greenwich, CN: JAI Press.
Shanab, M. E., Peterson, D., Dargahi, S. & Deroian, P. 1981. The effects of positive and negative verbal feedback on the intrinsic motivation of male and female subjects. Journal of Social Psychology, 115: 195-205.
Shapiro, S. P. 1987. The social control of impersonal trust. American Journal of Sociology, 93: 623-658.
Shneiderman, B. 1980. Software psychology: Human factors in computer and information systems, Cambridge, MA: Winthrop.
Simon, H. A. 1981. The sciences of the artificial (second edition). Cambridge, MA: MIT Press.
Simons, R. 1995. Levers of control: How managers use innovative control systems to drive strategic renewal. Boston: Harvard Business School Press.
Sitkin, S. B. & Pablo, A. L. 1992. Reconceptualizing the determinants of risk behavior. Academy of Management Review, 17: 9-38.
Skinner, B. F. 1953. Science and human behavior. New York: Macmillan.
Slaughter, S. 1995. Software development practices and software maintenance performance: A field study. Unpublished dissertation, Information and Decision Sciences Department, University of Minnesota, Minneapolis.
Smits, S. J., McLean, E. R. & Tanner, J. R. 1997. A longitudinal study of I/S careers: Synthesis, conclusions, and recommendations. In F. Niederman (Ed.), Proceedings of the 1997 ACM SIGCPR conference, 36-48, April 3-5, San Francisco.
Staw, B. M. 1976. Intrinsic and extrinsic motivation. Morristown, NJ: General Learning Press.
213
Staw, B. M., Calder, B. J. & Hess, R. 1976. Intrinsic motivation and norms about payment. Working paper, Northwestern University.
Steers, R. M. & Porter, L. W. 1977. The role of achievement motivation in job design. Journal of Applied Psychology, 62: 472-479.
Steers, R. M. & Porter, L. W. 1979. Motivation and Work Behavior. New York: McGraw-Hill.
Strauss, A. 1987. Qualitative analysis for social scientists. New York: Cambridge University Press.
Strauss, A. & Corbin, J. 1990. Basics of qualitative research. Newbury Park, CA: Sage.
Strickland, L. H. 1958. Surveillance and trust. Journal of Personality, 26: 200-215.
Swanson, E. B. 1984. Organizational designs for software maintenance. In L. Maggi, J. L. King & K. L. Kraemer (Eds.). Proceedings of the 5th international conference on information systems, 73-82, Tucson, November 28-30.
Swanson, E. B. & Beath, C. M. 1989. Maintaining information systems in organizations, New York: John Wiley and Sons.
Swanson, E. B. & Ramiller, N. C. 1993. Information Systems Research Thematics: Submissions to a New Journal, 1987-1992, Information Systems Research, 14: 299-330.
Taber, T. D. & Taylor, E. 1990. A review and evaluation of the psychometric properties of the Job Diagnostic Survey. Personnel Psychology, 43: 467-500.
Tannenbaum, A. S. 1968. Control in organizations. New York: McGraw-Hill.
Tansky, J. W. 1993. Justice and organizational citizenship behavior: What is the relationship? Employee Responsibilities and Rights Journal, 6: 195-207.
Taylor, F. W. 1911. Scientific management. New York: Harper and Brothers.
Tetlock, P. 1985. Accountability: The neglected social context of judgment and choice. In B. M. Staw & L. L. Cummings, Research in Organizational Behavior, 7: 297-332.
214
Thagard, P. 1992. Conceptual Revolutions. Princeton, NJ: Princeton University Press.
Thompson, J. D. 1967. Organizations in action. New York: McGraw-Hill.
Tolman, E. C. 1932. Purposive behavior in animals and men. New York: Appleton-Century-Crofts.
Tripathi, K. N. 1991. Effect of contingency and timing of reward on intrinsic motication. Journal of General Psychology, 118: 97-105.
Tyler, T. R. & Kramer, R. M. 1996. Whither trust? In R. M. Kramer & T. R. Tyler (Eds.), Trust in organizations: Frontiers of theory and research: 1-15. Thousand Oaks, CA: Sage.
Van de Ven, A. H. & Ferry, D. L. 1980. Measuring and assessing organizations. New York: Wiley.
Van Maanen, J. 1979a. Reclaiming qualitative methods for organizational research. Administrative Science Quarterly, 24:520-526.
Van Maanen, J. 1979b. The fact of fiction in organizational ethnography. Administrative Science Quarterly, 24:539-550.
Vroom, V. H. 1964. Work and motivation. New York: Wiley.
Wall Street Journal. 1995. “Amid record profits, companies continue to lay off,” May 4.
Wall Street Journal. 1996. “AOL Fights to Keep its Customers On-Line,” August 8.
Wall Street Journal. 1996. “Re-Engineering gurus take steps to remodel their stalling vehicles,” November 26.
Walton, R. E. 1968. Social and psychological aspects of verification, inspection, and international assurance, Technical Report #1. Lafayette: Purdue University.
Weick, K. E. 1990. Technology as equivoque: Sensemaking in new technologies. In P. S. Goodman, L. S. Sproull and Associates (Eds.) Technology and organizations, 1-44. San Francisco: Jossey-Bass.
215
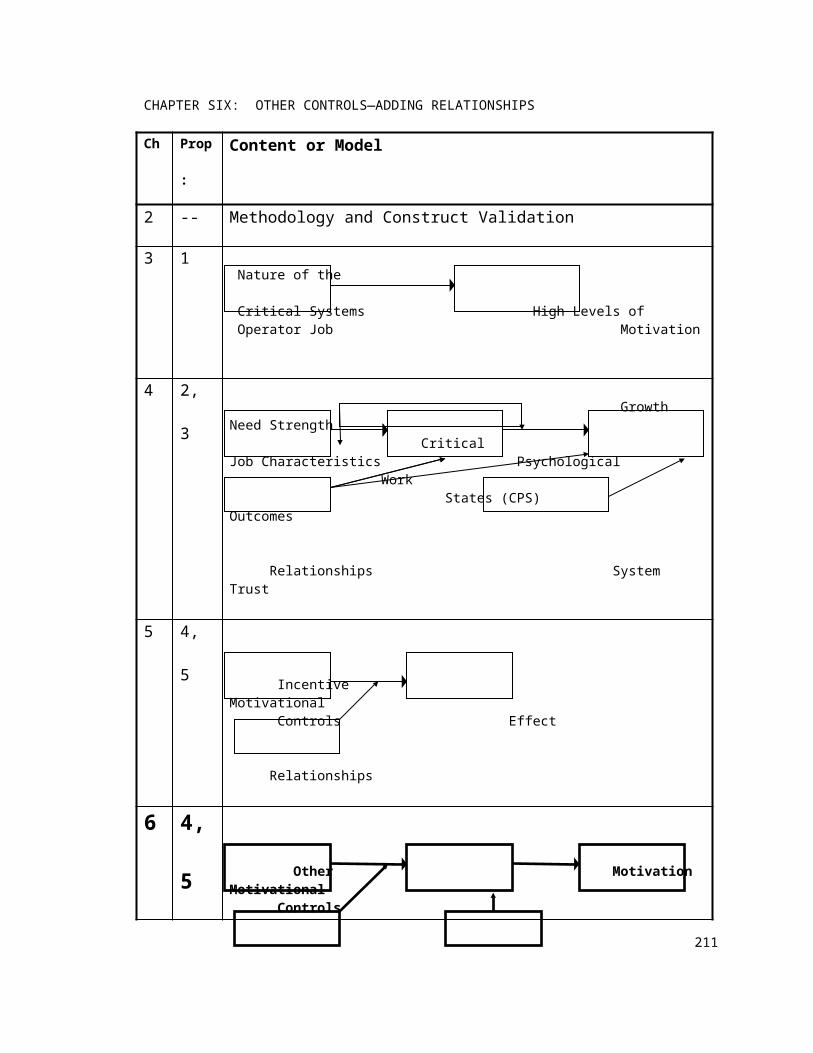
Weick, K. E. & Roberts, K. H. 1993. Collective mind in organizations: Heedful interrelating on flight decks. Administrative Science Quarterly, 38: 357-381.
Weiner, B. 1974. An attributional interpretation of expectancy-value theory. In B. Weiner (Ed.). Cognitive views of human motivation, 51-69. New York: Academic Press.
Weisberg, S. 1985. Applied linear regression. Second edition. New York: Wiley.
Williamson, O. E. 1975. Markets and hierarchies: Analysis and antitrust implications. New York: Free Press.
Wrightsman, L. S. 1991. Interpersonal trust and attitudes toward human nature. In J. P. Robinson, P. R. Shaver & L. S. Wrightsman (Eds.) Measures of personality and social psychological attitudes: Vol. 1: Measures of social psychological attitudes, 373-412. San Diego, CA: Academic Press.
Yin, R. K. 1984. Case study research: Design and methods. Newbury Park, CA: Sage.
Zuboff, S. 1985. Automate/Informate: The two faces of intelligent technology. Organizational Dynamics, 14: 5-18.
Zuboff, S. 1988. In the age of the smart machine. New York: Basic Books.
Zucker, L. G. 1986. Production of trust: Institutional sources of economic structure, 1840-1920. In B. M. Staw & L. L. Cummings (Eds.), Research in Organizational Behavior, 8: 53-111. Greenwich, CN: JAI Press.
216
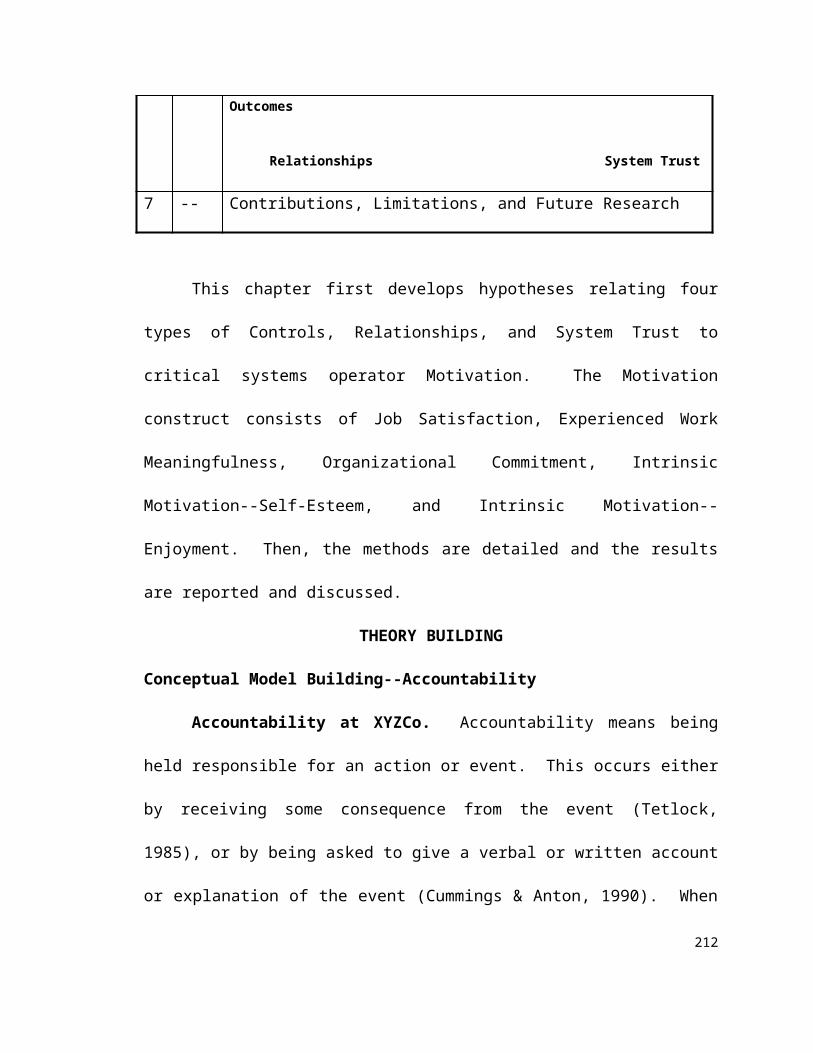
APPENDICES
Appendix A Example of Open and Axial Coding
The following example illustrates the construct creation and linking process.I. OPEN CODING (to establish constructs and their descriptors--see Figure 12)
A. Interview text: "I think [manager #1 (Mgr1) and manager #2 (Mgr2)]...they cared about people."
A. Construct creation: In general, this has to do with people caring for other people; a construct was created called "Felt Caring." By comparing this construct with other constructs, "Felt Caring" was found to be similar, but not identical, to those constructs (e.g., liking, trust) that also expressed something about the personal relationships between workers. Hence, the construct "Felt Caring" was made a subset of the existing higher level conceptual category called "Relationships between people." The detail conceptual descriptors of the construct "Felt Caring" were examined, based on this item. These include: a) Who cares b) about Whom.
B. Interview text: "Mgr1 and Mgr2 like whenever we had outages, even at night, would always show up....I think there was more interaction between us and Mgr1 and Mgr2....with Mgr1 or Mgr2 you could yak or kid...they'd be apt to show up [to an outage] in their sweats."
B. Construct creation: A construct called "Outages--Attendance" was created, with Who and When descriptors. Another construct called "Interaction between people" was created. Conceptual descriptors for this construct were: a) who (Mgr1/Mgr2); b) when--frequency ("whenever"); c) when--occasion (during outages); d) when--time of day (night); e) how--mode or medium (in person); f) how--style (formal/informal). Informality was indicated by "yak or kid," and by the informal attire ("sweats") worn during the interaction.
C. Interview text: "Mgr1 and Mgr2 used to always come down at holiday time, say, you know, 'Happy New Year,' 'Merry Christmas,'...it's just little things sometimes people do for you that make you know that they appreciate you."
C. Construct creation: First, a new construct was easily formed: "felt appreciation." It was given who and about whom descriptors. However, the first half of this text was more problematic. At first, the researcher coded the part before "Merry Christmas..." as an indicator of the construct "Felt Caring." But the second half of the quote shows that the interviewee interpreted the holiday greetings as "felt appreciation." By comparing it to other constructs, he decided to place it in the "Interaction between people" construct, with how--style (formal/informal) mode and when-occasion descriptors.
D. Interview text: "If Mgr1 or Mgr2 came down [to a computer outage], I probably would have felt easy."
D. Construct creation: The first phrase reflects "Outages--Attendance." The second phrase has to do with how comfortable or "easy" a person feels with the superior. The researcher placed this in a category called "Nervous around others," which was also in the larger relationships between people category. Detail descriptors: a) Who; b) about Whom; c) when [during an outage]; d) Where [in the computer center]; e) Certainty of easiness [probably]
217
Figure 12 Model of Construct Creation Relationships
K Between People K K K
Interaction Felt Felt Outages-- Nervous Between People Caring Appreciation Attendance Around Others
I I I I I I
I Text Text Text Text A B C D
K = Kind link (one construct is a subset or “kind” of another)I = Instance link (object in box is an instance of construct in ellipse)
Notation source: Thagard (1992)
II. AXIAL CODING (to establish relationships between constructs)
A. B. C. D. Interview text: [see above]
A. B. C. D. Relationship creation: These four pieces of text are connected by reference to Mgr1 and Mgr2 (and to the interviewee). One causal link is made obvious by the interviewee's comments (Figure 13): informal holiday interaction led the interviewee to feel appreciated ("it's just little things sometimes people do for you that make you know that they appreciate you"). The links between interaction and felt caring don't appear to be causal, but they do seem to be positively associated. The links between interaction/felt caring/felt appreciation and nervousness were then explored. The evidence in this text only indicates that interaction/caring/felt appreciation are negatively associated with nervousness around Mgr1 and Mgr2. No causal link can be formed here.
Figure 13 Model of Construct LinkagesLEGEND:
+Ca Ca = CausalA = Associative
Interaction Felt Felt Nervous + = Positive link Between People Caring Appreciation Around Others - = Negative link
+A +A -A -A
-A
218
APPENDIX B QUESTIONNAIRE ITEMS BY CONSTRUCT
A. QUESTIONS ASKED TECHNICIANSNote: Question number indicates the order in which questions were asked
JOB CHARACTERISTICSSkill Variety: The extent to which the job requires the worker to use a diverse set of talents.1. My job requires me to do many different things at work, using a variety of my skills and talents.2. This job requires me to use a number of complex or high-level skills.3. Overall, my tasks are not simple and repetitive.
Job Significance: The extent to which the worker perceives the job as crucial or important to their own, or the general, workplace.4. This job is one where a lot of other people, in this organization and other organizations, can be affected by how well my work gets done.5. This job is important in that the results of my work can significantly affect other peoples’ ability to do their work.6. This job itself is very significant and important in that it facilitates or enables other peoples’ work.7. My job is very important in the broader scheme of things, that is, in the general workplace.
Task Identity: The extent to which the worker sees the job as a whole or complete set of work, as opposed to just a component piece of an overall set of work.8. This job is arranged so that I can usually do an entire piece of work from beginning to end, not just a small part of an overall piece of work.9. This job generally provides me the chance to completely finish the pieces of work I begin.10. My job usually involves a complete piece of work that has an obvious beginning and end.
Job Feedback: The extent to which the job itself provides workers knowledge about how well they have done a task.11. This job itself provides me information about my work performance. That is, the actual work itself provides clues about how well I am doing--aside from any feedback co-workers or supervisors may provide.12. After I finish a task, I know whether I performed it well.13. Just doing the work required by this job provides many chances for me to figure out how well I am doing.
Growth Need Strength: The extent to which a worker desires a job that is challenging or growth-producing.14. I would like to have stimulating and challenging work.15. I would like to exercise independent thought and action in my work.16. I would like to have opportunities for personal growth and development at my work.
Knowledge of Results: The extent to which workers understand how well they are doing on the job.17. I usually know whether or not my work is satisfactory on this job.18. I have a pretty good idea of how I am performing my work19. I can generally tell whether I am doing well or poorly in this job.
MOTIVATIONIntrinsic Motivation—Enjoyment: The degree to which the person perceives that their job gives them enjoyment or pleasure. 20. I get a lot of enjoyment out of doing my job.21. When it comes right down to it, I really enjoy my work.22. Just doing my job gives me a sense of keen satisfaction.23. Doing my job gives me a very satisfying feeling.
219
Intrinsic Motivation--Self-Esteem: The degree to which the person perceives that their job gives them a feeling of self-esteem (i.e., when they do the job well).24. When I do my job well, it gives me a feeling of accomplishment.25. When I perform my work well, it contributes to my personal growth and development.26. My opinion of myself goes up when I do this job well.27. Performing this job well reinforces my feelings of self-esteem.
Job Satisfaction: The extent to which one feels pleased or satisfied with one’s job.32. Generally speaking, I feel satisfied with this job.33. Overall, I feel satisfied with the kind of work I do in this job.34. In general, I feel satisfied with my job.35. I seldom think of finding another job.
Experienced Work Meaningfulness: The degree to which the person experiences the job as one that is generally meaningful, valuable, and worthwhile.39. To me, most of the work I do is valuable and important.40. My work is worthwhile and valuable.41. In general, the work I do in this job is important. 42. Only a few of the things I do on this job seem useless or trivial.
Organizational Commitment: Willingness of the worker to exert considerable effort/sacrifice on behalf of the organization. (Note: this is the work/effort component of the overall Organizational Commitment construct.)44. I am willing to put in a great deal of effort beyond that normally expected in order to help this organization be successful.45. This organization inspires the very best in me in the way of job performance.46. I show by my actions that I really care about the fate of this organization.47. I am willing to sacrifice to help this organization meet its goals.
Felt Responsibility: The degree to which one feels personally obligated or responsible for one’s work.36. I feel a high degree of personal responsibility for the work I do on this job.37. Whether or not this job gets done--and done properly--is clearly my responsibility.38. I feel I should personally take responsibility for the results of my work on this job.
RELATIONSHIPSLiking: The extent to which a subordinate has positive affect toward the boss. 60. My lead/supv, _____________, is one person I really like.61. I have a lot of respect for my lead/supv.62. Overall, I react very favorably to my lead/supv.63. I admire my lead/supv.
Trusting Intention: A subordinate’s willingness to depend on the supervisor on an issue important to the subordinate’s career.64. When an issue that is critical to my career arises, I feel I can depend on my lead/supv.65. I can always rely on my lead/supv in a career-related issue.66. My lead/supv is a person on whom I feel I can rely when the issue is important to my career.67. I feel I can depend on my lead/supv on a career-sensitive issue.
Trusting Belief-Benevolence: The extent to which a subordinate believes that the boss is benevolent (cares for the welfare of the subordinate and is motivated to act in the subordinate’s interest).68. When it comes to my well-being, my lead/supv really cares.69. If I required help, my lead/supv would care enough to help me.70. I believe that my lead/supv cares enough to act in my personal best interest.
220
71. When you get right down to it, my lead/supv cares about what happens to me.
IF HI: You have a good working R w/your lead. Briefly, what is the basis for that good R?
Trusting Belief-Competence: The extent to which a subordinate believes that the boss is capable, skillful, and/or proficient at work.76. My lead/supv is skillful and effective in her/his work.77. My lead/supv performs his/her job very well.78. Overall, I have a capable and proficient lead/supv.79. Overall, my lead/supv is competent technically.
Felt Gratitude: The extent to which a subordinate perceives that their boss appreciates the subordinate’s work.80. My lead/supv often shows appreciation for me when I do a good job.81. When I do my task well, my lead/supv often expresses appreciation to me.
TRUST--OTHERSystem Trust: The belief that impersonal structures (e.g., regulations, procedures) exist that support or encourage fairness in one’s work environment.53. Our workplace has processes that assure that we will be treated fairly and equitably.54. I work in an environment in which good procedures make things fair and impartial.55. Fairness to employees is built into how issues are handled in our work environment. 56. In this workplace, sound practices exist that help ensure fair and unbiased treatment of employees.
Dispositional Trust: General tendency of one to believe in the benevolence of other people across most situations.57. In general, people really do care about the well-being of others.58. The typical person is sincerely concerned about the problems of others.59. Most of the time, people care enough to try to be helpful, rather than just looking out for themselves.
INCENTIVESChallenge Content of Incentive: The degree to which reaching the contingent performance standard required substantial effort.43. Achieving my [incentive plan name] goals during last year’s incentive period was very challenging for me, based on when the goals were given.
Motivational Effect: The degree to which the incentive awards have positive motivational impact on the individual and the team.82. The goal-oriented [plan name] bonuses have a positive motivational effect on the CODWRD team. 83. The goal-oriented [plan name] bonuses have a positive motivational effect on me.84. The CODWRD team is more conscientious now because of the [plan name] bonuses.85. I am more conscientious now because of the [plan name] bonuses.86. The CODWRD team works harder because of the [plan name] bonuses.87. I work harder now because of the [plan name] bonuses.
Satisfaction with Incentive: The degree to which the person is pleased or content with the incentive award. 88. Most of my co-workers feel satisfied with the [plan name] bonus they received.89. I feel satisfied with the [plan name] bonus I received.
Aside from our normal questions, tell me, very briefly, does the [plan name] have any other effects on you or the team?
CONTROLS
221
Autonomy: The extent to which a boss allows a subordinate to make decisions about their work on their own.72. In my work, I usually do not have to refer matters to my lead/supv for a final decision.73. Usually, my lead/supv does not have to approve my decisions before I can take action.74. Rather than asking my lead/supv, I usually make my own decisions about what to do on my job.75. I can usually do what I want on this job without consulting my lead/supv.
Feedback (from Supervisor): The frequency with which a boss gives a subordinate work-related feedback.90. My lead/supv gives me a lot of feedback about how I am doing on this job.91. My lead/supv frequently tells me how I am doing on my job functions.92. Our lead/supv gives me frequent feedback about my performance.93. Our lead/supv often let’s me know the extent to which I did a task satisfactorily.
Micromanagement: The extent to which a boss becomes so involved in a subordinate’s task that the boss does the task for the subordinate.94. My lead/supv rarely gets so involved that s/he does my task for me.95. Our lead/supv rarely gets too involved in the activities of my job.96. I hardly ever see our lead/supv take a larger role in work assigned to me than s/he should.97. Our lead/supv rarely performs a part of my job for me.
Accountability: The extent to which job holders are held responsible for their work.101. How much are you held personally responsible for achieving your performance goals or standards?102. How much are you personally given credit for successes you have on the job?103. How much are you held personally accountable for the work decisions you make in your job?104. How much are you held personally responsible for mistakes you make on the job?
In genl, who in mgmt are you held accountable by?______________________________________
Pressure: The extent to which a subordinate feels under stress from the boss when performing their job.105. I seldom feel significant pressure from my lead/supv to perform at a consistently high level on this job.106. I seldom feel significant pressure from my manager to perform at a consistently high level on this job.
PERCEIVED TEAM EFFECTIVENESSOverall Team Effectiveness: The perception that the team performs its function proficiently.107. I feel that this team effectively performs its overall task.108. Overall, this team performs its functions effectively.109. In general, the CODWRD team is effective in doing its job.
Team Coordination Effectiveness: The perception that the members of the team function in a cooperative and helpful way so as to accomplish the team’s function.110. The people who work together on the CODWRD team do their job properly and efficiently without getting in each other’s way.111. The people who work together on this team perform their tasks without interfering with each other’s duties.112. When it comes to jointly fixing system problems (*or * making sched changes), my activities are well-coordinated with activities of other CODWRD team members.113. Team members are willing to assist each other when needed.114. I feel the various CODWRD team members work together very well.
222
Information Sharing Accuracy: The perception that the information shared among team members is factual.115. The information I receive from other team members is seldom inaccurate.116. I can feel confident that information I receive from other CDWRD team members is correct.117. I rarely have to go back and check the information I have received from team members.118. I never have to worry about getting false information from members of the CODWRD team.
Information Sharing Openness: The perception that team members openly share information with each other.119. It is easy to talk openly about work-related issues to all members of this team.120. The members of this team freely discuss various topics important to the CODWRD team.121. It is easy to ask for information from any member of this team.122. I feel free to discuss almost any work-related issue in the CODWRD team.
Conflict Resolution: The perception that the group deals with and resolves its internal problems productively and positively.125. Conflicts among team members are usually resolved effectively and positively.126. When disagreements occur, the CODWRD team is good at bringing the issues into the open and working them out peacefully.127. When problems between team members do arise, they are handled satisfactorily.Do you Agree or Disagree, or are you Neutral?128. Conflict is typically dealt with and resolved constructively by the CODWRD team.
EXPLANATORY/PLAUSIBLE ALTERNATIVESInteraction with Team Members--98. In general, how much do you interact with other CODWRD team members. Again, the CODWRD team consists of all those who keep central site CODWRD up and running:Interaction with Supervisor--99. In general, how much do you interact with your lead/supv:
Interaction with Manager--100. In general, how much do you interact with your manager:Effect of Supervisor Interaction on Worker Self-esteem (SEspv)--28. My work-related interactions with my lead/supv usually have a positive effect on my self-esteem.29. Interacting with my lead/supv on the job generally reinforces my feelings of self-esteem.Feelings today versus Earlier--30. I get a greater feeling of accomplishment from my job today than I did 3 years ago.31. I get more enjoyment from doing my job today than I did 3 years ago.Reasons?________________________________Feelings Today versus Earlier--48. When I compare my current level of work commitment to the company’s success versus three years ago, I am more committed today.49. I am more committed to work hard for this company today than I was three years ago.(any reasons you are more/less committed today?)Communication Today versus Earlier--123. Compared to the CODWRD team 3 years ago, current CODWRD team members share information more openly today.124. Compared to the CODWRD team 3 years ago, team information shared with me by current CODWRD team members is more accurate today.members. Intrinsic Motivation Orientation--50. From the following list, please select the one reason that best represents why you try to work hard and do a good job: (I’ll read the list again if you would like) (1st List)
1. Opportunities for a promotion2. The challenge of the task3. Merit pay increases4. A feeling of accomplishment5. Something else (specify) (would you like me to read the list again?)
223
51. From the following list, please select the one reason that best represents why you try to work hard and do a good job: (2nd List)
1. [incentive plan name] bonuses2. Solving the incident, outage, or potential problem3. Achievement award programs4. Enjoyment of the job5. Something else (specify) (shall I read them again?)
52. From the following list, please select the one reason that best represents why you try to work hard and do a good job: (3rd List)
1. Opportunities for a Promotion2. Appreciation from your boss3. Merit pay increases4. [incentive plan name] bonuses5. Something else (specify) (shall I read them again?)
Relationship with Team Members--129. In general, I have a good relationship with those CODWRD team members I interact with.Percent of Time Directly Keeping System Available--130. What percentage of your job (in terms of % of hours spent) relates directly to keeping CODWRD up and running? ____ By ‘directly related,’ I mean either fixing CODWRD when it goes down, or working to prevent it from crashing in the first place.Extent of Time Worked with Supervisor--131. How many years and months have you worked with your current lead/supv, both now and in past jobs? _____yrs. ____Mths.
DEMOGRAPHICAge--132. How old did you turn on your last birthday? ____Number of recent Promotions--133. How many promotions have you had over the past five years, if any? ____Number of recent Merit Pay Increases--134. How many base pay increases have you had over the past five years, if any? ____Grade Level--135. What is your current grade level? ____Educational Attainment--136. How many years of academic, vocational, or professional education have you obtained beyond high school? _____
224
B. QUESTIONS ASKED SUPERVISORS
(Same questions [107-128] as above for: Overall Team Effectiveness, Team Coordination Effectiveness, Information Sharing Accuracy, Information Sharing Openness, Communication Today versus Earlier, Conflict Resolution)
Questions regarding each person they supervise: (each question was prefaced by a definition)12
Organizational Commitment (defined above)1. _______________________ typically displays a commitment and desire to work hard and exert2. Please rate the following employees 1-N, with 1=Most; N=Least, on the following attributes: (again, use all N numbers, if at all possible)Amount of Commitment to Work Hard they display(If at all possible, please use all N numbers instead of showing “ties” between people.)
#(1-N) ____ ______________
Autonomy (defined above)3. I usually give a lot of decision-making autonomy to _______________________ on matters related to her/his job.4. Please rate the following employees 1-N, with 1=Most; N=Least, on the following attributes: (again, use all N numbers, if at all possible)Amount of Decision-makingAutonomy I give them in their work
#(1-N) ____ ______________
Contribution to Team Coordination Effectiveness: The degree to which a worker enhances the willing and effective cooperation and helpfulness among team members.5. ____________typically makes a good contribution to effective team cooperation, both by his/her own example and by his/her positive influence on other team members.6. Please rate the following employees 1-N, with:
1=Best at coordinating their activities with others and helping other members of the team when needed.
N=Worst at coordinating their activities with others and helping other members of the team when needed.
Contribution to Team Communication Effectiveness: The degree to which a person enhances the communication effectiveness of the team through example and influence on others.7. ____________typically makes a good contribution to effective team communication, both by his/her own example and by his/her positive influence on other team members.8. Please rate the following employees 1-N, with:
1=Best at communicating openly and accurately with team members and influencing other team members to do the same.
N=Worst at communicating openly and accurately with team members and influencing other team members to do the same.
Contribution to Team Conflict Resolution: The degree to which a person enhances the team’s ability to resolve internal problems through example and influence on others.
12 Question order for supervisor instrument was: 1, 3, 5, 7, 9, 11, 4, 2, 10, 6, 8, 12, 13225

9. ____________usually enhances the team’s ability to constructively resolve large or small disagreements or conflicts that arise, both by his/her own example and by his/her positive influence on other team members.10. Please rate the following employees 1-N, with:
1=Best at helping the CODWRD team effectively resolve its internal conflicts or disagreements, large or even small; and
N=Worst at helping the CODWRD team effectively resolve its internal conflicts or disagreements, large or even small.
Contribution to Overall Team Effectiveness: The degree to which a person enhances the team’s ability to effectively accomplish its overall goals.11. ____________typically makes a good contribution to overall team effectiveness, both by his/her own example and by his/her positive influence on other team members.12. Please rate the following employees 1-N, with:
1=Best contributor towards overall CODWRD team effectiveness.N=Worst contributor towards overall CODWRD team effectiveness.
Employee Performance: The extent to which the worker does his/her job functions in a capable manner.13. Please rate the following employees 1-N, with 1=Best Overall Performer; N=Worst Overall Performer. Base the ratings on the most recent official ratings you (and/or others) have done for each person, recent merit pay evaluations, or ‘write-ups’ for bonuses or special awards given.(If at all possible, please use all N numbers instead of showing “ties” between people.)#(1-N) ____ ______________
226
APPENDIX C OPERATOR QUESTIONNAIRE
INTRODUCTION
Hi, ________; this is (researcher). Are you having a good day today?_______________________ (Good. I was hoping to find you in a good mood!) I appreciate the opportunity to talk with you. Just to remind you, I’m a Management Information Systems researcher from the University of Minnesota. The purpose of the questionnaire is to study how teams like yours keep systems running, in terms of social and interpersonal issues.
For the next forty to forty-five minutes, I’ll be asking you some questions about your job and workplace. By the way, if you get called to do something, we can be interrupted and just resume where we left off. I want to assure you of a couple of things before we get started. First, your answers are being captured over here with a pen and piece of paper--not with a tape recorder.Second, your answers and this conversation will be kept completely confidential. That’s one reason we’re doing this by phone. The other reason is that it is less expensive for me to conduct research over the phone than in person. Your specific answers will not be shared with anyone else either within or outside your organization. I’m not an agent of management. So your answers will not be made available to your management. Any results of the study will be presented only at a summary level. So you can share your thoughts freely. All right?Third, the questions I’m going to ask you do not have ‘right’ or ‘wrong’ answers. In fact, I have no preconceived notions of the right answers myself. Your opinion is the correct answer, and that’s what I’m interested in hearing. Your first impressions are usually going to be the best answer. Hence, we will go through the questions fairly quickly. Let me know if we go too fast, though. Also, if you feel uncomfortable answering a question, or if you don’t hear or fully understand something I say, please let me know as we go along. Okay?
The questionnaire has two parts. Part I addresses aspects of the job. Part II addresses people and team issues. By ‘team,’ I mean the CODWRD team. I’m defining the CODWRD team as those people who keep the CODWRD system up and running. Based on that definition, you consider yourself part of the CODWRD team, right? _____ That would also include people in your work group and several other work groups, right? If the CODWRD team consists of those who keep the central site part of the CODWRD system up and running, which other groups do you think belong to the CODWRD team? ____________________________________________________________________________________
**1ST TIME/GP: By the way, who do you report to? I mean, do you have a lead or someone who acts as a kind of supervisor over you?___________Do you call him/her a lead orwhat?______________________For each of the following statements, I want you to react first by telling me whether you agree or disagree with the statement. Then I will ask you whether you strongly, moderately, or slightly agree or disagree with the statement. Slightly means you agree a little. Strongly means you agree a lot. Moderately is in-between; it means you agree, but not a large or a small amount. You may also tell me if you neither agree nor disagree, but are completely neutral. However, even if you only slightly agree, you should say that you agree rather than saying that you are neutral. You may also say “I don’t know” if that’s the appropriate response.Okay?************************************************************************************Part I-- the nature of your job. These first three questions address the skill variety involved in your job.
227
Question: 1. My job requires me to do many different things at work, using a variety of my skills and talents. Do you Agree or Disagree, or are you Neutral?
AGREE Do you agree Strongly, Moderately, or Slightly?
DISAGREE Do you disagree Strongly, Moderately, or Slightly?Next question.
2. This job requires me to use a number of complex or high-level skills.Do you Agree or Disagree, or are you Neutral?
AGREE Do you agree Strongly, Moderately, or Slightly?
DISAGREE Do you disagree Strongly, Moderately, or Slightly?Next question.
3. Overall, my tasks are not simple and repetitive.Agree, Neutral, or Disagree?
AGREE Do you agree Strongly, Moderately, or Slightly?
DISAGREE Do you disagree Strongly, Moderately, or Slightly?
Next, we address how important your job is to others in the general workplace--at CODWRD and elsewhere.
Question: 4. This job is one where a lot of other people, in this organization and other organizations, can be affected by how well my work gets done.Do you Agree or Disagree, or are you Neutral?
AGREE Do you agree Strongly, Moderately, or Slightly?
DISAGREE Do you disagree Strongly, Moderately, or Slightly?
Next.
5. This job is important in that the results of my work can significantly affect other peoples’ ability to do their work.Agree, Neutral, or Disagree?
AGREE Do you agree Strongly, Moderately, or Slightly?
DISAGREE Do you disagree Strongly, Moderately, or Slightly?
6. This job itself is very significant and important in that it facilitates or enables other peoples’ work.Do you Agree or Disagree, or are you Neutral?
AGREE Do you agree Strongly, Moderately, or Slightly?
DISAGREE Do you disagree Strongly, Moderately, or Slightly?
228
7. My job is very important in the broader scheme of things, that is, in the general workplace.Agree, Neutral, or Disagree?
AGREE Do you agree Strongly, Moderately, or Slightly?
DISAGREE Do you disagree Strongly, Moderately, or Slightly?
The next three questions assess the extent to which you do a whole piece of work, as opposed to just doing part of a larger piece of work.
8. This job is arranged so that I can usually do an entire piece of work from beginning to end, not just a small part of an overall piece of work.Do you Agree or Disagree, or are you Neutral?
AGREE Do you agree Strongly, Moderately, or Slightly?
DISAGREE Do you disagree Strongly, Moderately, or Slightly?Next question.
9. This job generally provides me the chance to completely finish the pieces of work I begin.Agree, Neutral, or Disagree?
AGREE Do you agree Strongly, Moderately, or Slightly?
DISAGREE Do you disagree Strongly, Moderately, or Slightly?
10. My job usually involves a complete piece of work that has an obvious beginning and end.Agree, Neutral, or Disagree?
AGREE Do you agree Strongly, Moderately, or Slightly?
DISAGREE Do you disagree Strongly, Moderately, or Slightly?
These next questions are about how the job itself informs you about your work performance.
Question 11. This job itself provides me information about my work performance. That is, the actual work itself provides clues about how well I am doing--aside from any feedback co-workers or supervisors may provide.Do you Agree or Disagree, or are you Neutral?
AGREE Do you agree Strongly, Moderately, or Slightly?
DISAGREE Do you disagree Strongly, Moderately, or Slightly?
Next question.
229
12. After I finish a task, I know whether I performed it well.Agree, Neutral, or Disagree?
AGREE Do you agree Strongly, Moderately, or Slightly?
DISAGREE Do you disagree Strongly, Moderately, or Slightly?
Next.13. Just doing the work required by this job provides many chances for me to figure out how
well I am doing.Agree, Neutral, or Disagree?
AGREE Do you agree Strongly, Moderately, or Slightly?
DISAGREE Do you disagree Strongly, Moderately, or Slightly?
These next questions should be answered without consideration of what your job is like today. Rather, they cover what you want your ideal job to be like.
14. I would like to have stimulating and challenging work.Agree, Neutral, or Disagree?
AGREE Do you agree Strongly, Moderately, or Slightly?
DISAGREE Do you disagree Strongly, Moderately, or Slightly?Next question.
15. I would like to exercise independent thought and action in my work.Do you Agree or Disagree, or are you Neutral?
AGREE Do you agree Strongly, Moderately, or Slightly?
DISAGREE Do you disagree Strongly, Moderately, or Slightly?
Next question.
16. I would like to have opportunities for personal growth and development at my work.Agree, Neutral, or Disagree?
AGREE Do you agree Strongly, Moderately, or Slightly?
DISAGREE Do you disagree Strongly, Moderately, or Slightly?
These next 3 questions address how well you typically know your task results.
17. I usually know whether or not my work is satisfactory on this job.Do you Agree or Disagree, or are you Neutral?
AGREE Do you agree Strongly, Moderately, or Slightly?
DISAGREE Do you disagree Strongly, Moderately, or Slightly?
Next question.
230
18. I have a pretty good idea of how I am performing my work.Agree, Neutral, or Disagree?
AGREE Do you agree Strongly, Moderately, or Slightly?
DISAGREE Do you disagree Strongly, Moderately, or Slightly?
Next question.19. I can generally tell whether I am doing well or poorly in this job.
Agree, Neutral, or Disagree?
AGREE Do you agree Strongly, Moderately, or Slightly?
DISAGREE Do you disagree Strongly, Moderately, or Slightly?
Okay, the next topic relates to the enjoyment or pleasure you get from your job.
20. I get a lot of enjoyment out of doing my job.Agree, Neutral, or Disagree?
AGREE Do you agree Strongly, Moderately, or Slightly?
DISAGREE Do you disagree Strongly, Moderately, or Slightly?Next.
21. When it comes right down to it, I really enjoy my work.Agree, Neutral, or Disagree?
AGREE Do you agree Strongly, Moderately, or Slightly?
DISAGREE Do you disagree Strongly, Moderately, or Slightly?
22. Just doing my job gives me a sense of keen satisfaction.Do you Agree or Disagree, or are you Neutral?
AGREE Do you agree Strongly, Moderately, or Slightly?
DISAGREE Do you disagree Strongly, Moderately, or Slightly?
Next question.
23. Doing my job gives me a very satisfying feeling.Agree, Neutral, or Disagree?
AGREE Do you agree Strongly, Moderately, or Slightly?
DISAGREE Do you disagree Strongly, Moderately, or Slightly?
The next questions deal with how your job affects your self-concept.
231
24. When I do my job well, it gives me a feeling of accomplishment.Agree, Neutral, or Disagree?
AGREE Do you agree Strongly, Moderately, or Slightly?
DISAGREE Do you disagree Strongly, Moderately, or Slightly?
Next.25. When I perform my work well, it contributes to my personal growth and development.
Agree, Neutral, or Disagree?
AGREE Do you agree Strongly, Moderately, or Slightly?
DISAGREE Do you disagree Strongly, Moderately, or Slightly?
26. My opinion of myself goes up when I do this job well.Do you Agree or Disagree, or are you Neutral?
AGREE Do you agree Strongly, Moderately, or Slightly?
DISAGREE Do you disagree Strongly, Moderately, or Slightly?
Next question.27. Performing this job well reinforces my feelings of self-esteem.
Agree, Neutral, or Disagree?
AGREE Do you agree Strongly, Moderately, or Slightly?
DISAGREE Do you disagree Strongly, Moderately, or Slightly?
Here are two similar questions:
28. My work-related interactions with my lead/supv usually have a positive effect on my self-esteem.Agree, Neutral, or Disagree?
AGREE Do you agree Strongly, Moderately, or Slightly?
DISAGREE Do you disagree Strongly, Moderately, or Slightly?
29. Interacting with my lead/supv on the job generally reinforces my feelings of self-esteem.Agree, Neutral, or Disagree?
AGREE Do you agree Strongly, Moderately, or Slightly?
DISAGREE Do you disagree Strongly, Moderately, or Slightly?
The next question compares today with 3 years ago. To prepare to answer this, take just a moment and think back to what you were doing 3 years ago--that would be March of 1994, who you were working with, and how you felt about your job and so forth.....Do you recall your workgroup? your manager? your vice president? Okay, are you ready?
30. I get a greater feeling of accomplishment from my job today than I did 3 years ago.
232
Agree, Neutral, or Disagree?
AGREE Do you agree Strongly, Moderately, or Slightly?
DISAGREE Do you disagree Strongly, Moderately, or Slightly?
Next.31. I get more enjoyment from doing my job today than I did 3 years ago.
Agree, Neutral, or Disagree?
AGREE Do you agree Strongly, Moderately, or Slightly?
DISAGREE Do you disagree Strongly, Moderately, or Slightly?Reasons?_____________________________________________________________________Next we ask about your current level of job satisfaction.
32. Generally speaking, I feel satisfied with this job.Agree, Neutral, or Disagree?
AGREE Do you agree Strongly, Moderately, or Slightly?
DISAGREE Do you disagree Strongly, Moderately, or Slightly?
33. Overall, I feel satisfied with the kind of work I do in this job.Do you Agree or Disagree, or are you Neutral?
AGREE Do you agree Strongly, Moderately, or Slightly?
DISAGREE Do you disagree Strongly, Moderately, or Slightly?
Next question.
34. In general, I feel satisfied with my job.Agree, Neutral, or Disagree?
AGREE Do you agree Strongly, Moderately, or Slightly?
DISAGREE Do you disagree Strongly, Moderately, or Slightly?
Next question.35. I seldom think of finding another job.
Agree, Neutral, or Disagree?
AGREE Do you agree Strongly, Moderately, or Slightly?
DISAGREE Do you disagree Strongly, Moderately, or Slightly?
Next, I’ll ask about the sense of personal obligation or responsibility you feel in doing your job.
36. I feel a high degree of personal responsibility for the work I do on this job.
233
Agree, Neutral, or Disagree?
AGREE Do you agree Strongly, Moderately, or Slightly?
DISAGREE Do you disagree Strongly, Moderately, or Slightly?
Next question.
37. Whether or not this job gets done--and done properly--is clearly my responsibility.Agree, Neutral, or Disagree?
AGREE Do you agree Strongly, Moderately, or Slightly?
DISAGREE Do you disagree Strongly, Moderately, or Slightly?
38. I feel I should personally take responsibility for the results of my work on this job.Agree, Neutral, or Disagree?
AGREE Do you agree Strongly, Moderately, or Slightly?
DISAGREE Do you disagree Strongly, Moderately, or Slightly?
This next set is about how significant and important you feel your work is.
39. To me, most of the work I do is valuable and important.Agree, Neutral, or Disagree?
AGREE Do you agree Strongly, Moderately, or Slightly?
DISAGREE Do you disagree Strongly, Moderately, or Slightly?
Next question.
40. My work is worthwhile and valuable.Agree, Neutral, or Disagree?
AGREE Do you agree Strongly, Moderately, or Slightly?
DISAGREE Do you disagree Strongly, Moderately, or Slightly?Next.
41. In general, the work I do in this job is important. Do you Agree or Disagree, or are you Neutral?
AGREE Do you agree Strongly, Moderately, or Slightly?
DISAGREE Do you disagree Strongly, Moderately, or Slightly?
42. Only a few of the things I do on this job seem useless or trivial.Agree, Neutral, or Disagree?
AGREE Do you agree Strongly, Moderately, or Slightly?
234
DISAGREE Do you disagree Strongly, Moderately, or Slightly?
Okay, we’ll shift gears for this question:
43. Achieving my [incentive plan name] goals during last year’s incentive period was very challenging for me, based on when the goals were given.Do you Agree or Disagree, or are you Neutral?
AGREE Do you agree Strongly, Moderately, or Slightly?
DISAGREE Do you disagree Strongly, Moderately, or Slightly?
The next questions address your relationship with the company in terms of work commitment.
44. I am willing to put in a great deal of effort beyond that normally expected in order to help this organization be successful.Agree, Neutral, or Disagree?
AGREE Do you agree Strongly, Moderately, or Slightly?
DISAGREE Do you disagree Strongly, Moderately, or Slightly?
Next question.
45. This organization inspires the very best in me in the way of job performance.Agree, Neutral, or Disagree?
AGREE Do you agree Strongly, Moderately, or Slightly?
DISAGREE Do you disagree Strongly, Moderately, or Slightly?
Next.46. I show by my actions that I really care about the fate of this organization.
Agree, Neutral, or Disagree?
AGREE Do you agree Strongly, Moderately, or Slightly?
DISAGREE Do you disagree Strongly, Moderately, or Slightly?
47. I am willing to sacrifice to help this organization meet its goals. Do you Agree or Disagree, or are you Neutral?
AGREE Do you agree Strongly, Moderately, or Slightly?
DISAGREE Do you disagree Strongly, Moderately, or Slightly?
Okay, the next 2 questions compare today to 3 years ago--so think back again for a moment....Ready?
48. When I compare my current level of work commitment to the company’s success versus three years ago, I am more committed today.Agree, Neutral, or Disagree?
AGREE Do you agree Strongly, Moderately, or Slightly?
235
DISAGREE Do you disagree Strongly, Moderately, or Slightly?
Next question.49. I am more committed to work hard for this company today than I was three years ago.
Agree, Neutral, or Disagree?
AGREE Do you agree Strongly, Moderately, or Slightly?
DISAGREE Do you disagree Strongly, Moderately, or Slightly?
(any reasons you are more/less committed today? ____________________________________________)That completes Part I. To give you a little break before we proceed to Part II, I have three questions of a different type.
50. From the following list, please select the one reason that best represents why you try to work hard and do a good job: (I’ll read the list again if you would like)
(1st List) 1. Opportunities for a promotion2. The challenge of the task3. Merit pay increases4. A feeling of accomplishment5. Something else (specify) (would you like me to read the list again?)
51. From the following list, please select the one reason that best represents why you try to work hard and do a good job: (2nd List)
1. [incentive plan name] bonuses2. Solving the incident, outage, or potential problem3. Achievement award programs4. Enjoyment of the job5. Something else (specify) (shall I read them again?)
52. From the following list, please select the one reason that best represents why you try to work hard and do a good job: (3rd List)
1. Opportunities for a Promotion2. Appreciation from your boss3. Merit pay increases4. [incentive plan name] bonuses5. Something else (specify) (shall I read them again?)
Part II covers people and team issues.
First, we’ll talk about the nature of your work environment in terms of structures that encourage fairness to workers.
53. Our workplace has processes that assure that we will be treated fairly and equitably.Agree, Neutral, or Disagree?
AGREE Do you agree Strongly, Moderately, or Slightly?
236
DISAGREE Do you disagree Strongly, Moderately, or Slightly?
Next.
54. I work in an environment in which good procedures make things fair and impartial.Do you Agree or Disagree, or are you Neutral?
AGREE Do you agree Strongly, Moderately, or Slightly?
DISAGREE Do you disagree Strongly, Moderately, or Slightly?
Next question.
55. Fairness to employees is built into how issues are handled in our work environment. Agree, Neutral, or Disagree?
AGREE Do you agree Strongly, Moderately, or Slightly?
DISAGREE Do you disagree Strongly, Moderately, or Slightly?
56. In this workplace, sound practices exist that help ensure fair and unbiased treatment of employees.Agree, Neutral, or Disagree?
AGREE Do you agree Strongly, Moderately, or Slightly?
DISAGREE Do you disagree Strongly, Moderately, or Slightly?
Next, we’ll ask 3 questions about what you believe about other people in the world generally; not people at work, but people in general. Okay?
57. In general, people really do care about the well-being of others.Agree, Neutral, or Disagree?
AGREE Do you agree Strongly, Moderately, or Slightly?
DISAGREE Do you disagree Strongly, Moderately, or Slightly?
237

58. The typical person is sincerely concerned about the problems of others.Do you Agree or Disagree, or are you Neutral?
AGREE Do you agree Strongly, Moderately, or Slightly?
DISAGREE Do you disagree Strongly, Moderately, or Slightly?
59. Most of the time, people care enough to try to be helpful, rather than just looking out for themselves.Agree, Neutral, or Disagree?
AGREE Do you agree Strongly, Moderately, or Slightly?
DISAGREE Do you disagree Strongly, Moderately, or Slightly?
How you feel towards your lead/supv is the next topic. You said your lead/supv’s name was _____. Right?
62. My lead/supv, _____________, is one person I really like.Agree, Neutral, or Disagree?
AGREE Do you agree Strongly, Moderately, or Slightly?
DISAGREE Do you disagree Strongly, Moderately, or Slightly?Next.
63. I have a lot of respect for my lead/supv.Agree, Neutral, or Disagree?
AGREE Do you agree Strongly, Moderately, or Slightly?
DISAGREE Do you disagree Strongly, Moderately, or Slightly?
64. Overall, I react very favorably to my lead/supv.Agree, Neutral, or Disagree?
AGREE Do you agree Strongly, Moderately, or Slightly?
DISAGREE Do you disagree Strongly, Moderately, or Slightly?
Next question
65. I admire my lead/supv.Agree, Neutral, or Disagree?
AGREE Do you agree Strongly, Moderately, or Slightly?
DISAGREE Do you disagree Strongly, Moderately, or Slightly?
Now we go to additional feelings about your lead/supv.
66. When an issue that is critical to my career arises, I feel I can depend on my lead/supv.
238
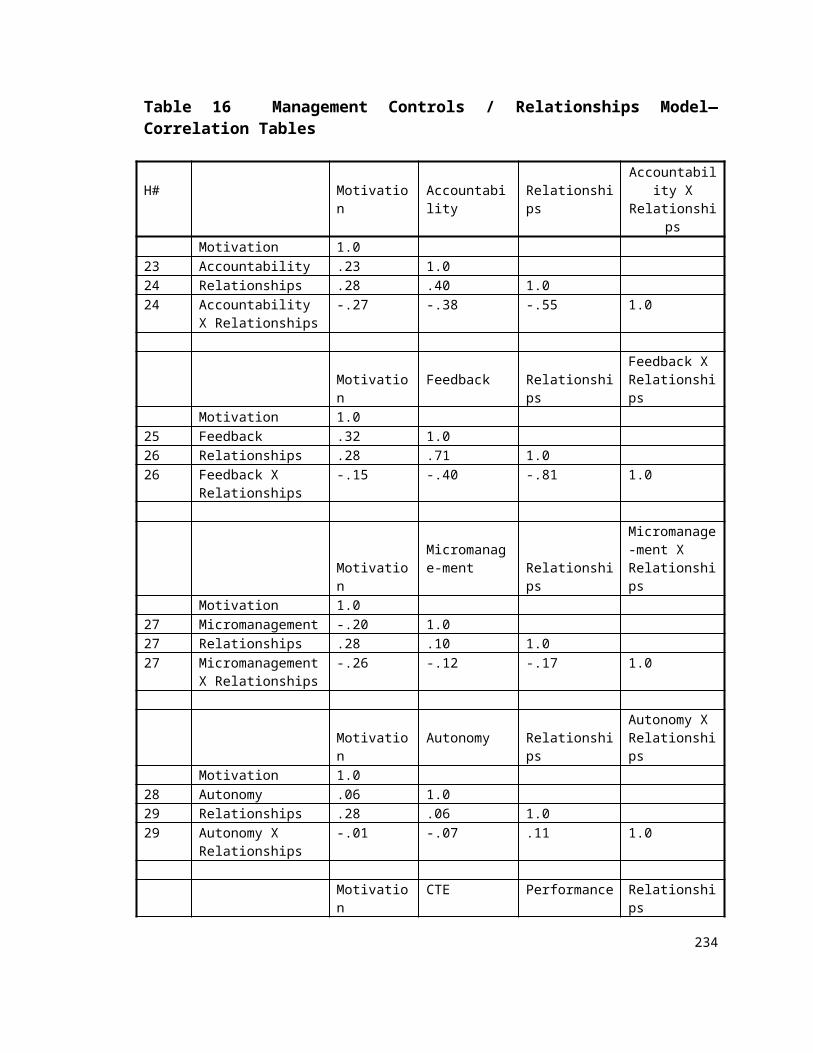
Agree, Neutral, or Disagree?
AGREE Do you agree Strongly, Moderately, or Slightly?
DISAGREE Do you disagree Strongly, Moderately, or Slightly?
Next.67. I can always rely on my lead/supv in a career-related issue.
Agree, Neutral, or Disagree?
AGREE Do you agree Strongly, Moderately, or Slightly?
DISAGREE Do you disagree Strongly, Moderately, or Slightly?
68. My lead/supv is a person on whom I feel I can rely when the issue is important to my career.Do you Agree or Disagree, or are you Neutral?
AGREE Do you agree Strongly, Moderately, or Slightly?
DISAGREE Do you disagree Strongly, Moderately, or Slightly?Next question.
69. I feel I can depend on my lead/supv on a career-sensitive issue.Agree, Neutral, or Disagree?
AGREE Do you agree Strongly, Moderately, or Slightly?
DISAGREE Do you disagree Strongly, Moderately, or Slightly?
These next questions are similar, but relate to issues of caring and concern.
70. When it comes to my well-being, my lead/supv really cares.Agree, Neutral, or Disagree?
AGREE Do you agree Strongly, Moderately, or Slightly?
DISAGREE Do you disagree Strongly, Moderately, or Slightly?
71. If I required help, my lead/supv would care enough to help me.Agree, Neutral, or Disagree?
AGREE Do you agree Strongly, Moderately, or Slightly?
DISAGREE Do you disagree Strongly, Moderately, or Slightly?
72. I believe that my lead/supv cares enough to act in my personal best interest.Do you Agree or Disagree, or are you Neutral?
AGREE Do you agree Strongly, Moderately, or Slightly?
DISAGREE Do you disagree Strongly, Moderately, or Slightly?
73. When you get right down to it, my lead/supv cares about what happens to me.Agree, Neutral, or Disagree?
239
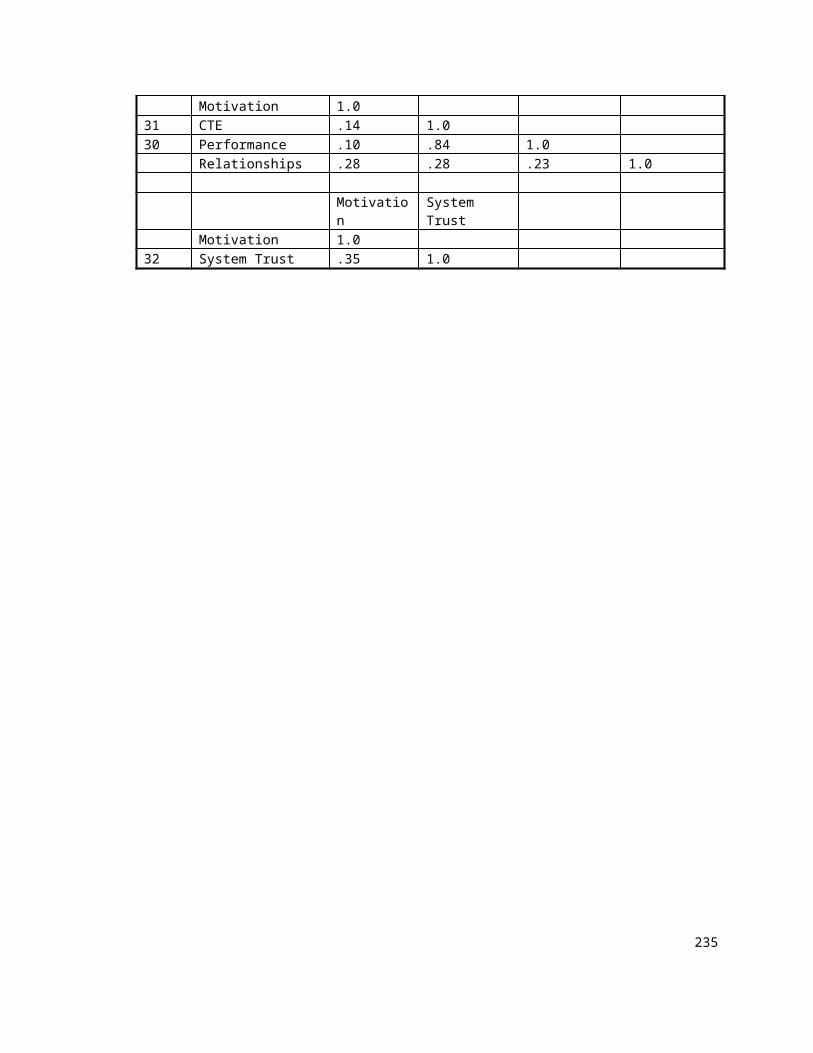
AGREE Do you agree Strongly, Moderately, or Slightly?
DISAGREE Do you disagree Strongly, Moderately, or Slightly?IF HI: You have a good working R w/your lead. Briefly, what is the basis for that good R?
These next questions address the amount of decision-making autonomy you have.
74. In my work, I usually do not have to refer matters to my lead/supv for a final decision.Do you Agree or Disagree, or are you Neutral?
AGREE Do you agree Strongly, Moderately, or Slightly?
DISAGREE Do you disagree Strongly, Moderately, or Slightly?
Next.
75. Usually, my lead/supv does not have to approve my decisions before I can take action.Agree, Neutral, or Disagree?
AGREE Do you agree Strongly, Moderately, or Slightly?
DISAGREE Do you disagree Strongly, Moderately, or Slightly?
76. Rather than asking my lead/supv, I usually make my own decisions about what to do on my job.Agree, Neutral, or Disagree?
AGREE Do you agree Strongly, Moderately, or Slightly?
DISAGREE Do you disagree Strongly, Moderately, or Slightly?
Next.77. I can usually do what I want on this job without consulting my lead/supv.
Agree, Neutral, or Disagree?
AGREE Do you agree Strongly, Moderately, or Slightly?
DISAGREE Do you disagree Strongly, Moderately, or Slightly?
Next we look at other perceptions you have about your lead/supv.
78. My lead/supv is skillful and effective in her/his work.Agree, Neutral, or Disagree?
AGREE Do you agree Strongly, Moderately, or Slightly?
DISAGREE Do you disagree Strongly, Moderately, or Slightly?
79. My lead/supv performs his/her job very well.Agree, Neutral, or Disagree?
AGREE Do you agree Strongly, Moderately, or Slightly?
240
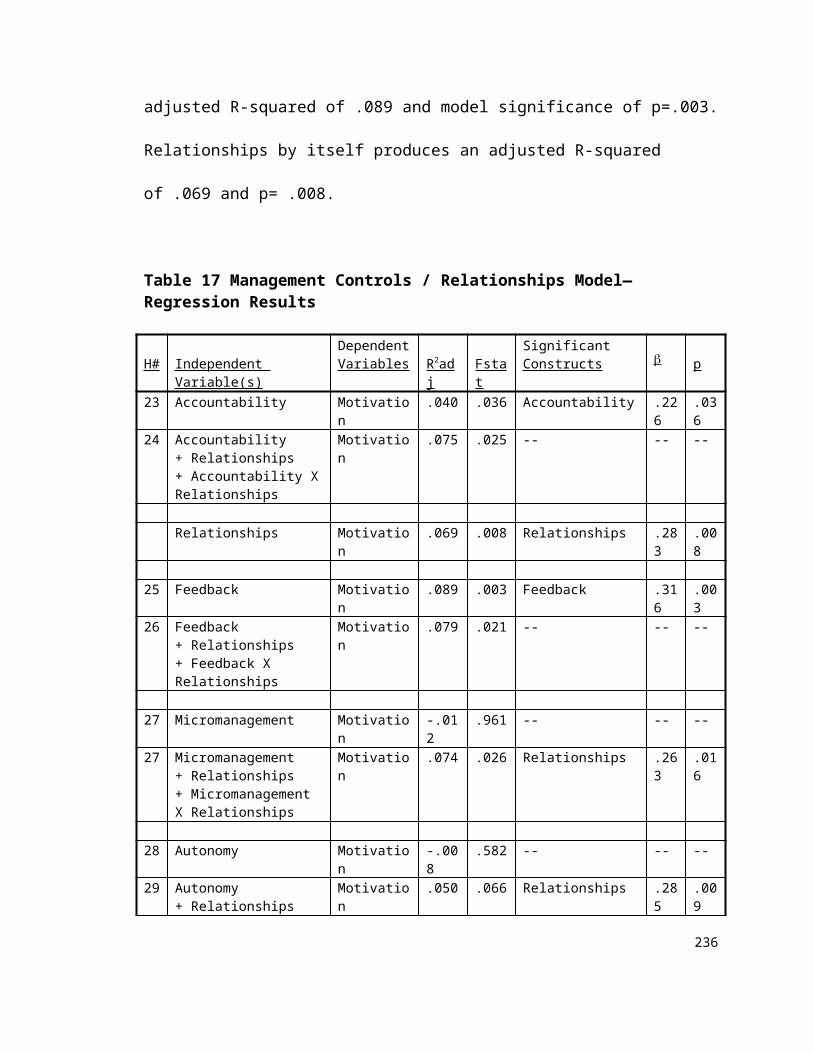
DISAGREE Do you disagree Strongly, Moderately, or Slightly?
80. Overall, I have a capable and proficient lead/supv.Agree, Neutral, or Disagree?
AGREE Do you agree Strongly, Moderately, or Slightly?
DISAGREE Do you disagree Strongly, Moderately, or Slightly?
81. Overall, my lead/supv is competent technically.Agree, Neutral, or Disagree?
AGREE Do you agree Strongly, Moderately, or Slightly?
DISAGREE Do you disagree Strongly, Moderately, or Slightly?
82. My lead/supv often shows appreciation for me when I do a good job.Do you Agree or Disagree, or are you Neutral?
AGREE Do you agree Strongly, Moderately, or Slightly?
DISAGREE Do you disagree Strongly, Moderately, or Slightly?
83. When I do my task well, my lead/supv often expresses appreciation to me.Agree, Neutral, or Disagree?
AGREE Do you agree Strongly, Moderately, or Slightly?
DISAGREE Do you disagree Strongly, Moderately, or Slightly?
Next a question about the [incentive plan name] bonus’s current affects on the CODWRD team. The CODWRD team consists of all those (in several groups) who keep central site CODWRD up and running.
84. The goal-oriented [plan name] bonuses have a positive motivational effect on the CODWRD team. Agree, Neutral, or Disagree?
AGREE Do you agree Strongly, Moderately, or Slightly?
DISAGREE Do you disagree Strongly, Moderately, or Slightly?
85. The goal-oriented [plan name] bonuses have a positive motivational effect on me.Agree, Neutral, or Disagree?
AGREE Do you agree Strongly, Moderately, or Slightly?
DISAGREE Do you disagree Strongly, Moderately, or Slightly?
86. The CODWRD team is more conscientious now because of the [plan name] bonuses.Agree, Neutral, or Disagree?
AGREE Do you agree Strongly, Moderately, or Slightly?
DISAGREE Do you disagree Strongly, Moderately, or Slightly?
241
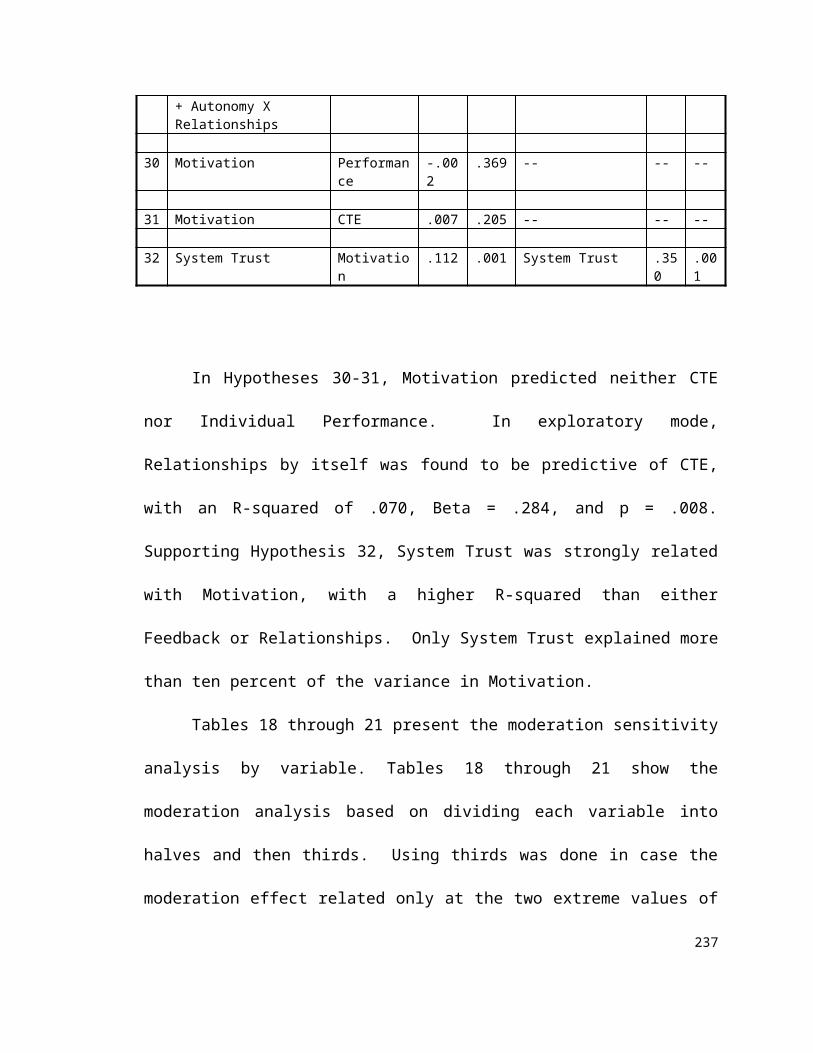
87. I am more conscientious now because of the [plan name] bonuses.Agree, Neutral, or Disagree?
AGREE Do you agree Strongly, Moderately, or Slightly?
DISAGREE Do you disagree Strongly, Moderately, or Slightly?
88. The CODWRD team works harder because of the [plan name] bonuses.Agree, Neutral, or Disagree?
AGREE Do you agree Strongly, Moderately, or Slightly?
DISAGREE Do you disagree Strongly, Moderately, or Slightly?
89. I work harder now because of the [plan name] bonuses.Agree, Neutral, or Disagree?
AGREE Do you agree Strongly, Moderately, or Slightly?
DISAGREE Do you disagree Strongly, Moderately, or Slightly?
89a. Most of my co-workers feel satisfied with the [plan name] bonus they received.Agree, Neutral, or Disagree?
AGREE Do you agree Strongly, Moderately, or Slightly?
DISAGREE Do you disagree Strongly, Moderately, or Slightly?
89b. I feel satisfied with the [plan name] bonus I received.Agree, Neutral, or Disagree?
AGREE Do you agree Strongly, Moderately, or Slightly?
DISAGREE Do you disagree Strongly, Moderately, or Slightly?
90. Aside from our normal questions, tell me, very briefly, does the [plan name] have any other effects on you or the team?_______________________________________________________________________________________________________________________________________________________________________________________________________________________________________________________________
The next few questions relate to supervisory feedback.
95. My lead/supv gives me a lot of feedback about how I am doing on this job.Agree, Neutral, or Disagree?
AGREE Do you agree Strongly, Moderately, or Slightly?
DISAGREE Do you disagree Strongly, Moderately, or Slightly?
Next.96. My lead/supv frequently tells me how I am doing on my job functions.
242
Agree, Neutral, or Disagree?
AGREE Do you agree Strongly, Moderately, or Slightly?
DISAGREE Do you disagree Strongly, Moderately, or Slightly?
97. Our lead/supv gives me frequent feedback about my performance.Do you Agree or Disagree, or are you Neutral?
AGREE Do you agree Strongly, Moderately, or Slightly?
DISAGREE Do you disagree Strongly, Moderately, or Slightly?Next question.
98. Our lead/supv often let’s me know the extent to which I did a task satisfactorily.Agree, Neutral, or Disagree?
AGREE Do you agree Strongly, Moderately, or Slightly?
DISAGREE Do you disagree Strongly, Moderately, or Slightly?
The next 4 questions relate to supervisory involvement.
99. My lead/supv rarely gets so involved that s/he does my task for me.Agree, Neutral, or Disagree?
AGREE Do you agree Strongly, Moderately, or Slightly?
DISAGREE Do you disagree Strongly, Moderately, or Slightly?
100. Our lead/supv rarely gets too involved in the activities of my job.Agree, Neutral, or Disagree?
AGREE Do you agree Strongly, Moderately, or Slightly?
DISAGREE Do you disagree Strongly, Moderately, or Slightly?
101. I hardly ever see our lead/supv take a larger role in work assigned to me than s/he should.Agree, Neutral, or Disagree?
AGREE Do you agree Strongly, Moderately, or Slightly?
DISAGREE Do you disagree Strongly, Moderately, or Slightly?
102. Our lead/supv rarely performs a part of my job for me.Agree, Neutral, or Disagree?
AGREE Do you agree Strongly, Moderately, or Slightly?
DISAGREE Do you disagree Strongly, Moderately, or Slightly?
These next 4 questions are on a different scale, and address how much you interact with others on the job. In increasing order, the scale choices are “Not at All,” “A Little,” “Some,” “Quite a Bit,” and “Very Much.” And I will repeat the scale as we go along.
243
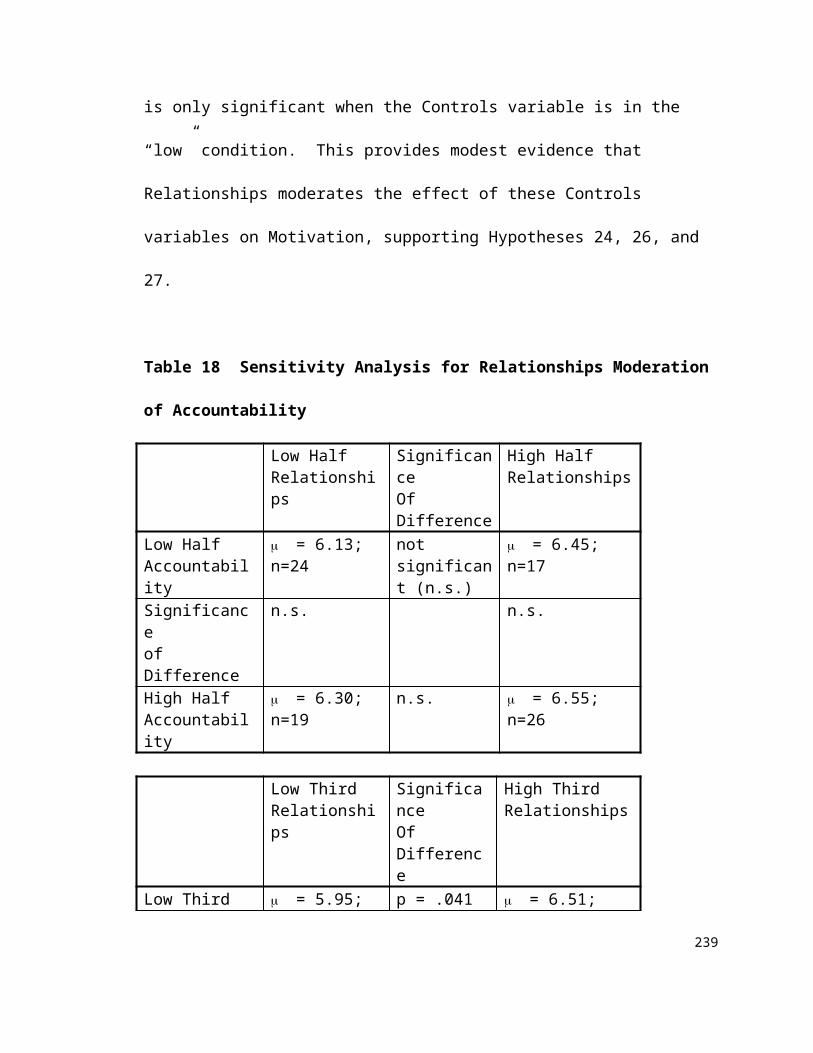
103. In general, how much do you interact with other CODWRD team members. Again, the CODWRD team consists of all those who keep central site CODWRD up and running:
Not at All, A Little, Some, Quite a Bit, or Very Much?
104. In general, how much do you interact with your lead/supv:
Not at All, A Little, Some, Quite a Bit, or Very Much?
105. In general, how much do you interact with your manager:
Not at All, A Little, Some, Quite a Bit, or Very Much?
On the same scale, I’ll be asking you about the amount of accountability you feel is present in your job.
107. How much are you held personally responsible for achieving your performance goals or standards?
Not at All, A Little, Some, Quite a Bit, or Very Much?
108. How much are you personally given credit for successes you have on the job?
Not at All, A Little, Some, Quite a Bit, or Very Much?
109. How much are you held personally accountable for the work decisions you make in your job?
Not at All, A Little, Some, Quite a Bit, or Very Much?
110. How much are you held personally responsible for mistakes you make on the job?
Not at All, A Little, Some, Quite a Bit, or Very Much?
In genl, who in mgmt are you held accountable by?______________________________________
Now two questions on the level of pressure you feel on the job.
244
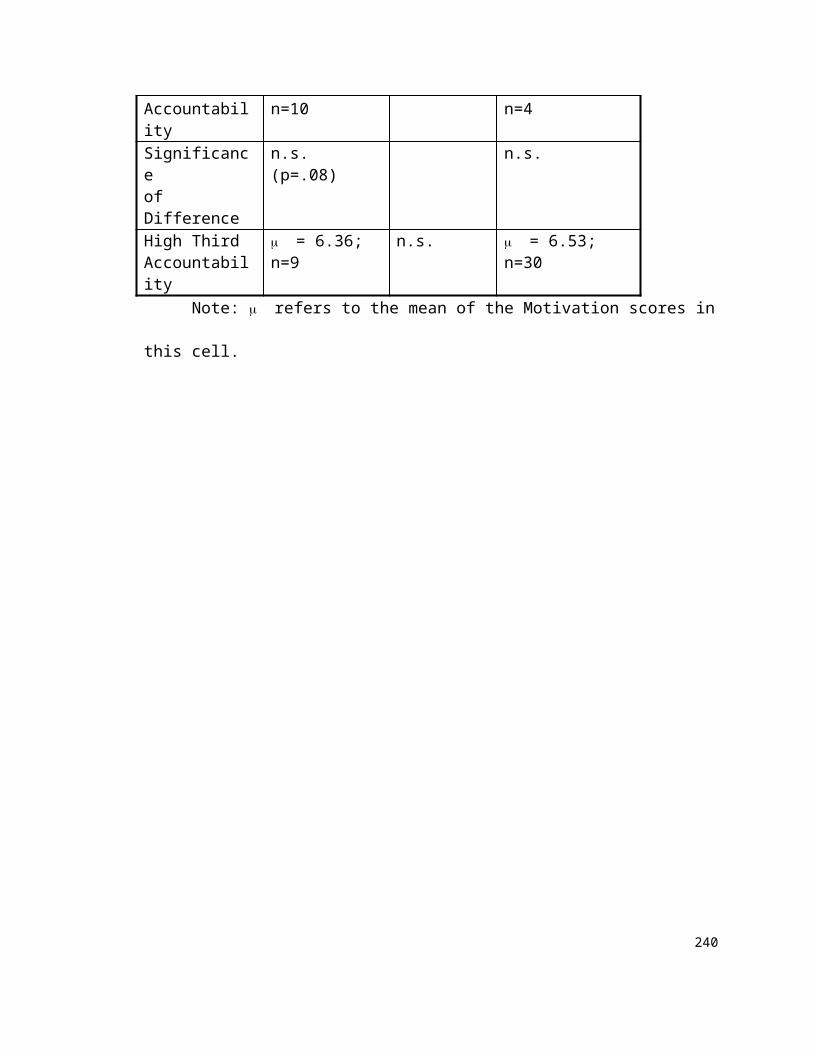
111. I seldom feel significant pressure from my lead/supv to perform at a consistently high level on this job.Agree, Neutral, or Disagree?
AGREE Do you agree Strongly, Moderately, or Slightly?
DISAGREE Do you disagree Strongly, Moderately, or Slightly?
Next question112. I seldom feel significant pressure from my manager to perform at a consistently high level
on this job.Agree, Neutral, or Disagree?
AGREE Do you agree Strongly, Moderately, or Slightly?
DISAGREE Do you disagree Strongly, Moderately, or Slightly?
Next we’ll talk about team effectiveness. By ‘team,’ I mean the CODWRD team, those who keep central site CODWRD up and running.
118. I feel that this team effectively performs its overall task.Do you Agree or Disagree, or are you Neutral?
AGREE Do you agree Strongly, Moderately, or Slightly?
DISAGREE Do you disagree Strongly, Moderately, or Slightly?Next.
119. Overall, this team performs its functions effectively.Agree, Neutral, or Disagree?
AGREE Do you agree Strongly, Moderately, or Slightly?
DISAGREE Do you disagree Strongly, Moderately, or Slightly?
120. In general, the CODWRD team is effective in doing its job.Agree, Neutral, or Disagree?
AGREE Do you agree Strongly, Moderately, or Slightly?
DISAGREE Do you disagree Strongly, Moderately, or Slightly?
Next we address internal team coordination effectiveness.
121. The people who work together on the CODWRD team do their job properly and efficiently without getting in each other’s way.Do you Agree or Disagree, or are you Neutral?
AGREE Do you agree Strongly, Moderately, or Slightly?
DISAGREE Do you disagree Strongly, Moderately, or Slightly?122. The people who work together on this team perform their tasks without interfering with
each other’s duties.
245
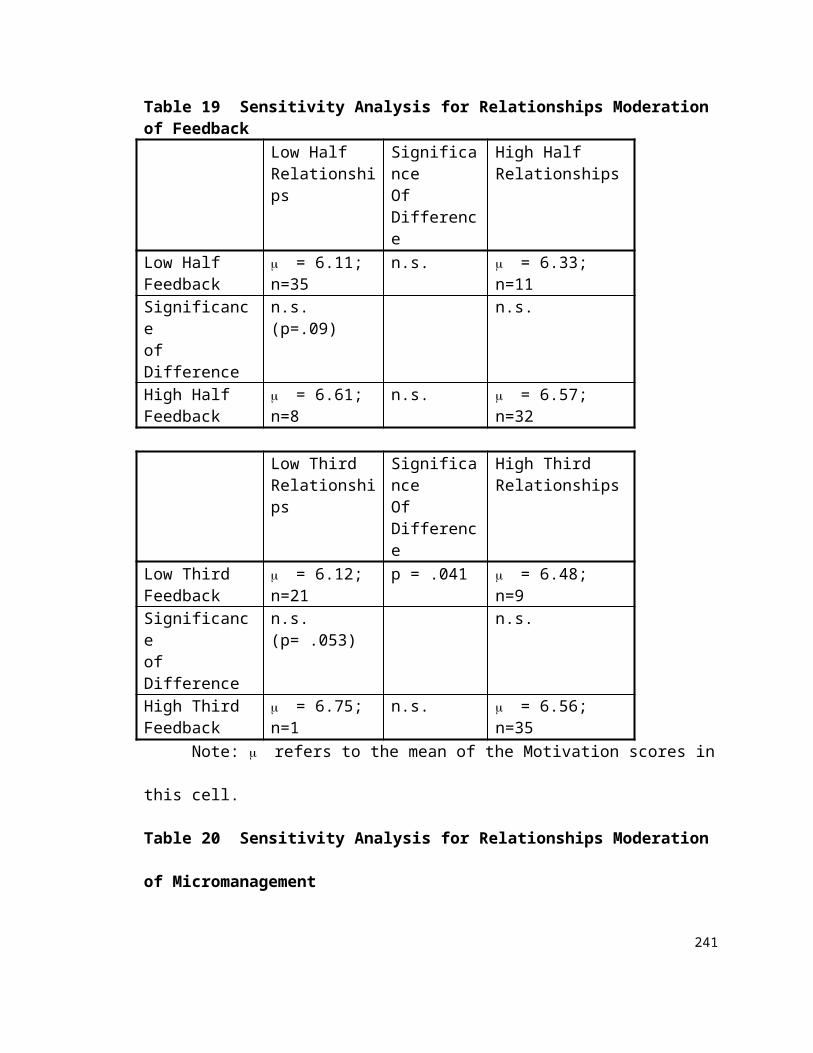
Agree, Neutral, or Disagree?
AGREE Do you agree Strongly, Moderately, or Slightly?
DISAGREE Do you disagree Strongly, Moderately, or Slightly?Next question.
123. When it comes to jointly fixing system problems (*or * making sched changes), my activities are well-coordinated with activities of other CODWRD team members.Agree, Neutral, or Disagree?
AGREE Do you agree Strongly, Moderately, or Slightly?
DISAGREE Do you disagree Strongly, Moderately, or Slightly?
124. Team members are willing to assist each other when needed.Agree, Neutral, or Disagree?
AGREE Do you agree Strongly, Moderately, or Slightly?
DISAGREE Do you disagree Strongly, Moderately, or Slightly?
125. I feel the various CODWRD team members work together very well.Agree, Neutral, or Disagree?
AGREE Do you agree Strongly, Moderately, or Slightly?
DISAGREE Do you disagree Strongly, Moderately, or Slightly?
Now I’ll ask about aspects of information sharing among CODWRD team members.
126. The information I receive from other team members is seldom inaccurate.Do you Agree or Disagree, or are you Neutral?
AGREE Do you agree Strongly, Moderately, or Slightly?
DISAGREE Do you disagree Strongly, Moderately, or Slightly?Next question.
127. I can feel confident that information I receive from other CDWRD team members is correct.Agree, Neutral, or Disagree?
AGREE Do you agree Strongly, Moderately, or Slightly?
DISAGREE Do you disagree Strongly, Moderately, or Slightly?Next.
246
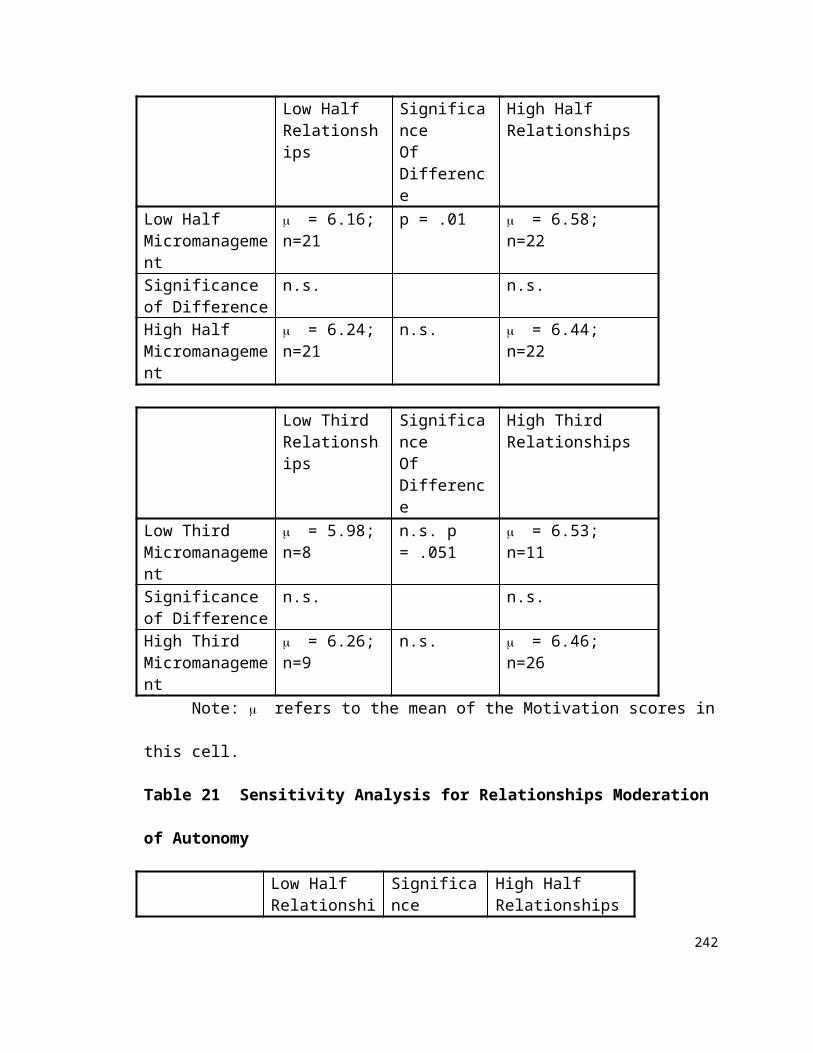
128. I rarely have to go back and check the information I have received from team members.Agree, Neutral, or Disagree?
AGREE Do you agree Strongly, Moderately, or Slightly?
DISAGREE Do you disagree Strongly, Moderately, or Slightly?
129. I never have to worry about getting false information from members of the CODWRD team.Agree, Neutral, or Disagree?
AGREE Do you agree Strongly, Moderately, or Slightly?
DISAGREE Do you disagree Strongly, Moderately, or Slightly?
Okay, this next set is a bit different from the prior set, but is still about CODWRD team communication effectiveness.
130. It is easy to talk openly about work-related issues to all members of this team.Do you Agree or Disagree, or are you Neutral?
AGREE Do you agree Strongly, Moderately, or Slightly?
DISAGREE Do you disagree Strongly, Moderately, or Slightly?Next question.
131. The members of this team freely discuss various topics important to the CODWRD team.Agree, Neutral, or Disagree?
AGREE Do you agree Strongly, Moderately, or Slightly?
DISAGREE Do you disagree Strongly, Moderately, or Slightly?
Next question.
132. It is easy to ask for information from any member of this team.Agree, Neutral, or Disagree?
AGREE Do you agree Strongly, Moderately, or Slightly?
DISAGREE Do you disagree Strongly, Moderately, or Slightly?
133. I feel free to discuss almost any work-related issue in the CODWRD team.Agree, Neutral, or Disagree?
AGREE Do you agree Strongly, Moderately, or Slightly?
DISAGREE Do you disagree Strongly, Moderately, or Slightly?
Okay, this next set is a bit different, but is still about CODWRD team communication. Think back again to your work group and CODWRD team of 3 years ago.
134. Compared to the CODWRD team 3 years ago, current CODWRD team members share information more openly today.
247
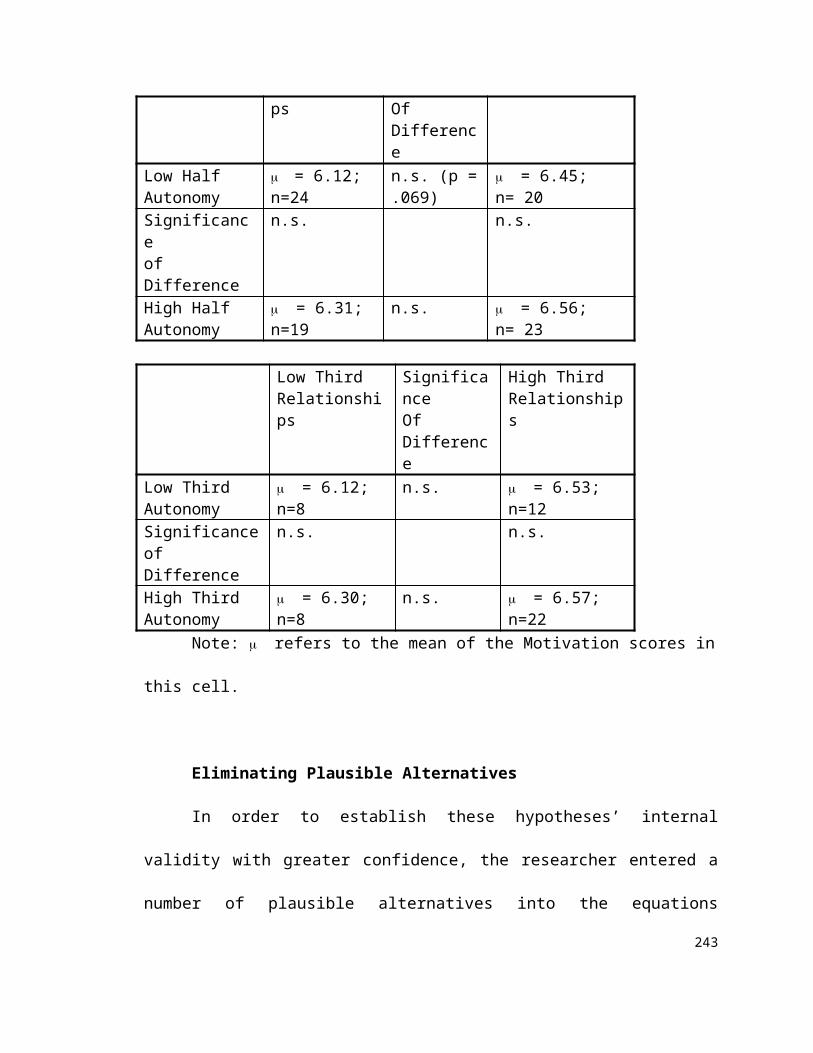
Do you Agree or Disagree, or are you Neutral?
AGREE Do you agree Strongly, Moderately, or Slightly?
DISAGREE Do you disagree Strongly, Moderately, or Slightly?Next question.
135. Compared to the CODWRD team 3 years ago, team information shared with me by current CODWRD team members is more accurate today.members. Agree, Neutral, or Disagree?
AGREE Do you agree Strongly, Moderately, or Slightly?
DISAGREE Do you disagree Strongly, Moderately, or Slightly?
Next we talk about CODWRD team conflict resolution. Once more, the CODWRD team consists of those who keep CODWRD up and running
136. Conflicts among team members are usually resolved effectively and positively.Agree, Neutral, or Disagree?
AGREE Do you agree Strongly, Moderately, or Slightly?
DISAGREE Do you disagree Strongly, Moderately, or Slightly?Next.
137. When disagreements occur, the CODWRD team is good at bringing the issues into the open and working them out peacefully.Agree, Neutral, or Disagree?
AGREE Do you agree Strongly, Moderately, or Slightly?
DISAGREE Do you disagree Strongly, Moderately, or Slightly?
138. When problems between team members do arise, they are handled satisfactorily.Do you Agree or Disagree, or are you Neutral?
AGREE Do you agree Strongly, Moderately, or Slightly?
DISAGREE Do you disagree Strongly, Moderately, or Slightly?Next question.
139. Conflict is typically dealt with and resolved constructively by the CODWRD team.Agree, Neutral, or Disagree?
AGREE Do you agree Strongly, Moderately, or Slightly?
DISAGREE Do you disagree Strongly, Moderately, or Slightly?
This is a different kind of question.
140. In general, I have a good relationship with those CODWRD team members I interact with.Agree, Neutral, or Disagree?
248
AGREE Do you agree Strongly, Moderately, or Slightly?
DISAGREE Do you disagree Strongly, Moderately, or Slightly?
Finally, a few background questions.
145. What percentage of your job (in terms of % of hours spent) relates directly to keeping CODWRD up and running? ____ By ‘directly related,’ I mean either fixing CODWRD when it goes down, or working to prevent it from crashing in the first place.
146. How many years and months have you worked with your current lead/supv, both now and in past jobs? _____yrs. ____mths.
147. How old did you turn on your last birthday? ____
148. How many promotions have you had over the past five years, if any? ____
151. How many base pay increases have you had over the past five years, if any? ____
152. What is your current grade level? ____
153. How many years of academic, vocational, or professional education have you obtained beyond high school? _____
THAT COMPLETES THE QUESTIONNAIRE, _____. THANKS VERY MUCH FOR YOUR HELP! Again, I want to compliment you on being a part of the CODWRD team! I have one request for you. So that I can obtain consistent results from all team members, I would request that you do not discuss this questionnaire with other members of the team or those in other departments. Okay?____________________ Also, to follow up on what I said at the beginning, were there any questions I asked that made you feel uncomfortable or that I should not have asked? ________________
THANKS AGAIN, AND BEST OF WISHES TO YOU!
249
APPENDIX D SUPERVISOR QUESTIONNAIRE
First, I’ll ask you to evaluate each of your team members in terms of several attributes. Is that okay? If my list is correct, I have the following people reporting to you: ________ _______ _______ _______________ _______ _______ ________ _______ _______ _______ _______ (Reconcile the list)The first attribute I want you to give me your opinion with respect to your team members is the individual’s contribution to effective team cooperation. By this, I mean the degree to which an individual enhances the willing and effective cooperation among members of the CODWRD team. By cooperation, I mean the person willingly coordinates activities with others and helps them out when needed. In other words, the degree to which an individual both willingly cooperates with CODWRD team members her- or himself, and also influences other team members to do the same.I’ll ask about your folks in alphabetical order, so think ahead a little about some reasonable range of best to worst workers, such that we can cover a wide range in terms of your best (which will be strongly agree answers) and your worst (which will be strongly disagree answers). Okay?
1. ____________typically makes a good contribution to effective team cooperation, both by his/her own example and by his/her positive influence on other team members: (circle)Agree, Neutral, or Disagree?
AGREE Do you agree Strongly, Moderately, or Slightly?
DISAGREE Do you disagree Strongly, Moderately, or Slightly?
(Repeat 1. For each employee)
Now we’ll talk about the individual’s contribution to effective team communication. By this, I mean the degree to which an individual enhances communication effectiveness among members of the CODWRD team. By communication effectiveness, I mean the extent to which a team member talks openly and accurately to others on work related issues. In other words, these questions address the degree to which an individual both communicates with CODWRD team members openly and accurately her- or himself, and also influences other team members to do the same.
2. ____________typically makes a good contribution to effective team communication, both by his/her own example and by his/her positive influence on other team members: (circle)Agree, Neutral, or Disagree?
AGREE Do you agree Strongly, Moderately, or Slightly?
DISAGREE Do you disagree Strongly, Moderately, or Slightly?
(Repeat 2. For each employee)
Now we’ll talk about the individual’s contribution to team conflict resolution. By this, I mean the degree to which an individual enhances the team’s ability to effectively resolve disagreements or conflicts that arise, large or small. So these questions address the degree to which an individual facilitates the CODWRD team’s ability to bring issues into the open and work them out peacefully.
250
3. ____________usually enhances the team’s ability to constructively resolve large or small disagreements or conflicts that arise, both by his/her own example and by his/her positive influence on other team members: (circle)Agree, Neutral, or Disagree?
AGREE Do you agree Strongly, Moderately, or Slightly?
DISAGREE Do you disagree Strongly, Moderately, or Slightly?
(Repeat 3. For each employee)
Now we’ll talk about the individual’s contribution to overall team effectiveness. By this, I mean the degree to which an individual enhances the team’s ability to do its work effectively. By team effectiveness, I mean the team does its job in a way that allows it to meets its objectives. So these questions address the degree to which an individual facilitates the effectiveness of the overall CODWRD team.
4. ____________typically makes a good contribution to overall team effectiveness, both by his/her own example and by his/her positive influence on other team members: (circle)Agree, Neutral, or Disagree?
AGREE Do you agree Strongly, Moderately, or Slightly?
DISAGREE Do you disagree Strongly, Moderately, or Slightly?
(Repeat 4. For each employee)
Please rate the following employees 1-N, with 1=Most; N=Least, on the following attributes: (please use all N numbers, if at all possible)
1. Individual contribution to 2. Individual contribution to 3. Individual contribution toeffective team cooperation effective team communication effective conflict resolution#(1-N) #(1-N) #(1-N)____ ______________ ____ _____________ ____ _________________ _____________ ____ ______________ ____ _________________ ______________ ____ ______________ ____ _____________...
4. Individual contribution tooverall team effectiveness #(1-N) ____ __________________ _________________ ______________ ...
251
Please rate the following employees 1-N, with 1=Best Overall Performer; N=Worst Overall Performer. Base the ratings on the most recent official ratings you (and/or others) have done for each person, recent merit pay evaluations, ‘write-ups’ for bonuses or special awards given, or other information you have about them.(If at all possible, please use all N numbers instead of showing “ties” between people.)
#(1-N) ____ __________________ __________________ ______________...
252
APPENDIX E PRETEST INSTRUMENT A--MATCHING
Instructions: First, carefully read all three construct definitions. Match the Item in the left column with the appropriate Construct in the right column by drawing a straight line from the Item number to the Construct letter. The ___ in most items refers to a specific person.
ITEMS: CONSTRUCTS: Definitions 1. If I were faced with a question related to my professional future, I feel I could depend on ___.
2. When you get right down to it, ___cares about what happens to me.
3. I can count on ___ to act in my A. Dispositional Trust: The general personal best interest. tendency of one to believe in the
benevolence of other people in 4. The typical person is sincerely most situations. [Benevolence concerned about the problems of others. means one cares for the welfare
of the other person and is5. I feel that I could depend on ___, even on motivated to act in the other a crucial issue that could affect my career. person’s interests.]
6. ___ is more inclined to help me out than to look out for him/herself.
7. In general, people really do care about the well-being of others.
8. ___ is a person on whom I can rely when the issue is important to my career. B. Trusting Belief--Benevolence:
One’s belief that a specific other9. If I really needed help with something, I could person will act with benevolence always count on ___ to come to my aid. towards one. [See benevolence
definition above]10. Most of the time, people care enough to help, rather than just looking out for themselves.
11. When a career-critical issue arises, I would want to be dependent on ___.
12. Most people do not hesitate to go out of C. Trusting Intention: One’s willingness their way to help someone in trouble. to depend on a specific person on an
issue that is critical to one’s career.13. Human nature is fundamentally cooperative.
14. When it comes to things important to me, ___ really cares.
15. I can always rely on ___ in a career-related issue.
253
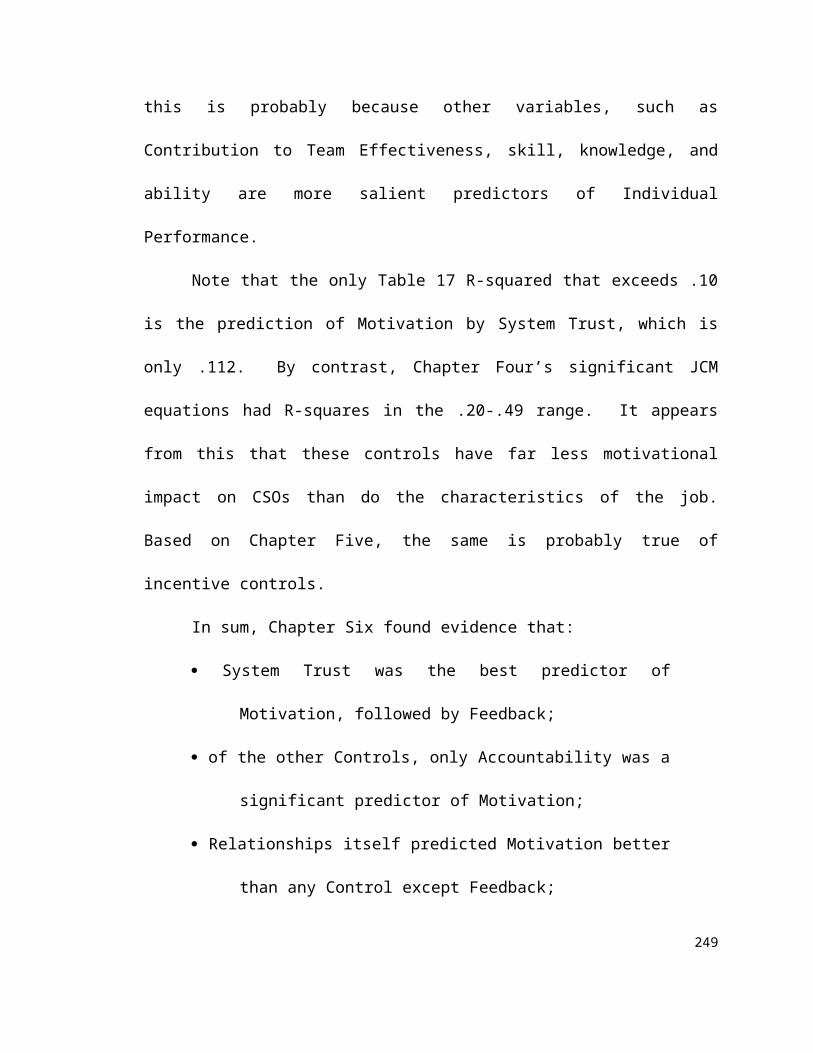
APPENDIX F PRETEST INSTRUMENT B--CATEGORIZATION
Differentiating Types of Trust
Instructions: Below are statements that related to different types of Trust. Please place them into three to five categories (Category A, B, C...) such that statements within a category are most similar in meaning to each other and are dissimilar in meaning from statements in other categories. As you proceed, briefly describe the meanings of your categories at the bottom of the page. After your initial round of categorizing, read all the statements by category to verify that they ‘fit’ where you placed them.
CATEGORY STATEMENT (A, B, C,...)_____ If I were faced with an issue related to my professional future, I feel I could depend on
___.
_____ Because of the way employee issues are handled here, I believe we are safe from unfairor unjust treatment.
_____ When you get right down to it, ___ cares about what happens to me.
_____ Fairness to employees is built into the way issues are handled in our work environment.
_____ I can count on ___ to act in my personal best interest.
_____ I feel that I could depend on ___, even on an issue that could affect my career.
_____ If I required help, ___ would care enough to help me.
_____ In this workplace, safeguards exist that protect us from unfair treatment.
_____ ___ is a person on whom I can rely when the issue is important to my career.
_____ I work in an environment in which good procedures make things fair and impartial forthe employees.
_____ If I really needed help with something. I could always count on ___ to come to my aid.
_____ Our workplace has processes that assure that we will be treated fairly and equitably.
_____ When a career-critical issue arises, I would want to be dependent on ___.
_____ When it comes to things important to me, ___ really cares.
_____ I can always rely on ___ in a career-related issue.
_____ This organization treats its employees in a fair, impartial manner.
Category A means:_____________________________________________________________________Category B means: _____________________________________________________________________Category C means:_____________________________________________________________________Category D means:_____________________________________________________________________Category E means: _____________________________________________________________________
254
APPENDIX G PRETEST INSTRUMENT C--SORTING
Differentiating Types of Trust
Instructions: Attached are sixteen statements that relate to three to five different types of Trust. Please sort them into three to five categories (Category A, B, C, D, E) such that statements within a category are most similar in meaning to each other and are dissimilar in meaning from statements in other categories. (Sort by conceptual meaning, not by the degree of trust the statement implies). After your initial round of categorizing, read all the statements by category to verify that they ‘fit’ where you placed them. Adjust accordingly. Then fill in PART I. Next, briefly describe the meanings of your categories (PART II).
PART I: SORTING SUMMARY
Items placed in Category A (#s): _____ _____ _____ _____ _____
Items placed in Category B (#s): _____ _____ _____ _____ _____
Items placed in Category C (#s): _____ _____ _____ _____ _____
Items placed in Category D (#s): _____ _____ _____ _____ _____
Items placed in Category E (#s): _____ _____ _____ _____ _____
PART II: CATEGORY DESCRIPTION
Category A means: ___________________________________________________________________
Category B means: ___________________________________________________________________
Category C means: ___________________________________________________________________
Category D means: ___________________________________________________________________
Category E means: ___________________________________________________________________
List the numbers of any statements you found difficult to categorize: (#s)___ ___ ___
255
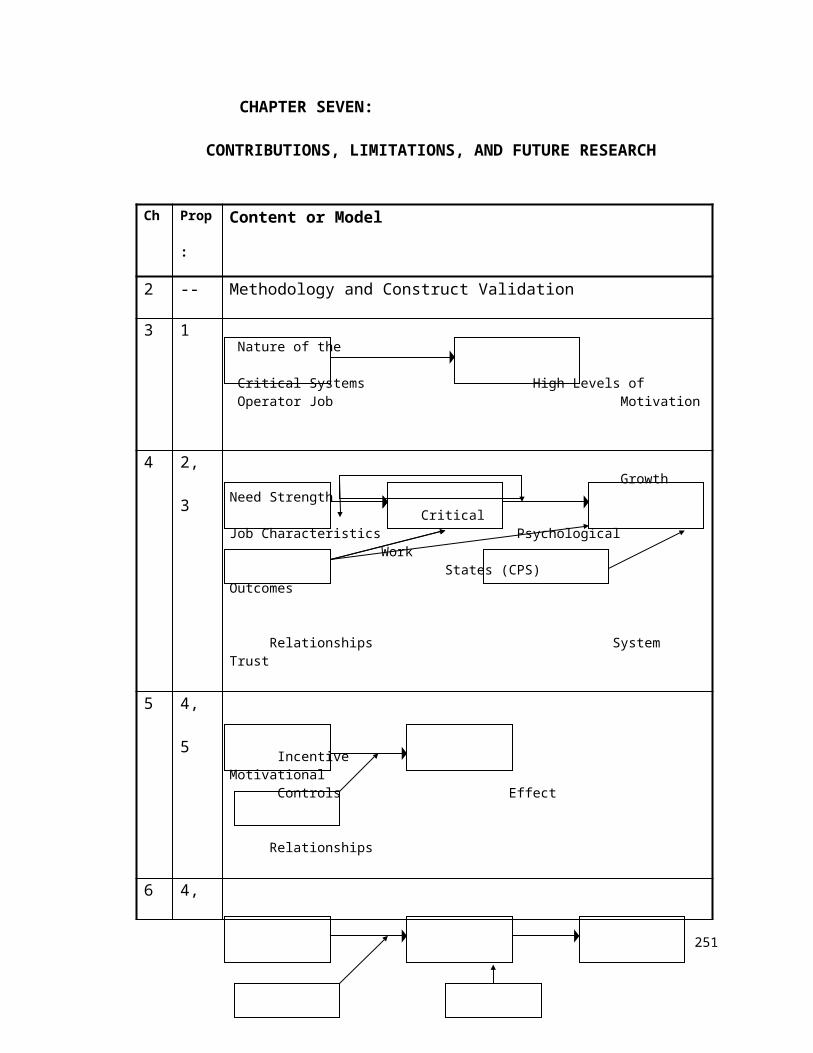
APPENDIX H PAIRWISE INTERCORRELATION MATRICES(see Appendix I for key to construct abbreviations)
**not shown**
APPENDIX I DESCRIPTIVE STATISTICS(ordered by increasing Mean)
Abbrev. Construct Min Max Mean Mode StdDevMicr Micromanagement 1.00 6.75 1.79 1.00 1.22Acct Accountability 2.50 5.00 4.27 5.00 0.65Perf Individual Performance 1.00 7.00 4.31 4.50 1.96FB Feedback 1.00 7.00 4.63 6.00 1.94SysTr System Trust 1.00 7.00 4.67 6.00 1.68Comm Contribution to Communication
Effectiveness1.50 7.25 4.70 3.15 1.50
Coord Contribution to Coordination Effectiveness
1.50 7.35 4.73 2.45 1.52
ConfRes Contribution to Conflict Resolution 1.50 7.25 4.74 2.95 1.40CTE Contribution to Team Effectiveness 1.81 7.00 4.74 6.35 1.40TeamEff Contribution to Overall Team
Effectiveness1.50 7.35 4.80 2.00 1.49
JobID Job Identity 1.00 7.00 4.83 6.00 1.66DispTr Dispositional Trust 1.00 7.00 5.55 6.00 1.20TrInt Trusting Intention 1.00 7.00 5.67 7.00 1.72JobFB Job Feedback 1.67 7.00 5.95 7.00 1.25Auton Autonomy 2.00 7.00 5.97 7.00 1.00TrBBn Trusting Belief-Benevolence 1.25 7.00 6.08 7.00 1.40Rs Relationships 1.21 7.00 6.08 7.00 1.27OCW Organizational Commitment 1.50 7.00 6.13 7.00 1.05Like Liking 1.00 7.00 6.24 7.00 1.21SkVar Skill Variety 2.00 7.00 6.28 6.67 0.88IMEnj Intrinsic Motivation-Enjoyment 2.50 7.00 6.28 7.00 0.88JobSat Job Satisfaction 2.00 7.00 6.29 7.00 0.88TrBCp Trusting Belief-Competence 1.33 7.00 6.32 7.00 1.14Mots Motivation 4.62 7.00 6.36 7.00 0.58KnRes Knowledge of Results 2.33 7.00 6.38 7.00 0.94IMSE Intrinsic Motivation-Self-Esteem 3.50 7.00 6.46 7.00 0.71ExMng Experienced Meaningfulness 4.00 7.00 6.62 7.00 0.60JobSig Job Significance 4.00 7.00 6.77 7.00 0.45GNS Growth Need Strength 5.33 7.00 6.82 7.00 0.36FR Felt Responsibility 5.00 7.00 6.88 7.00 0.32
256
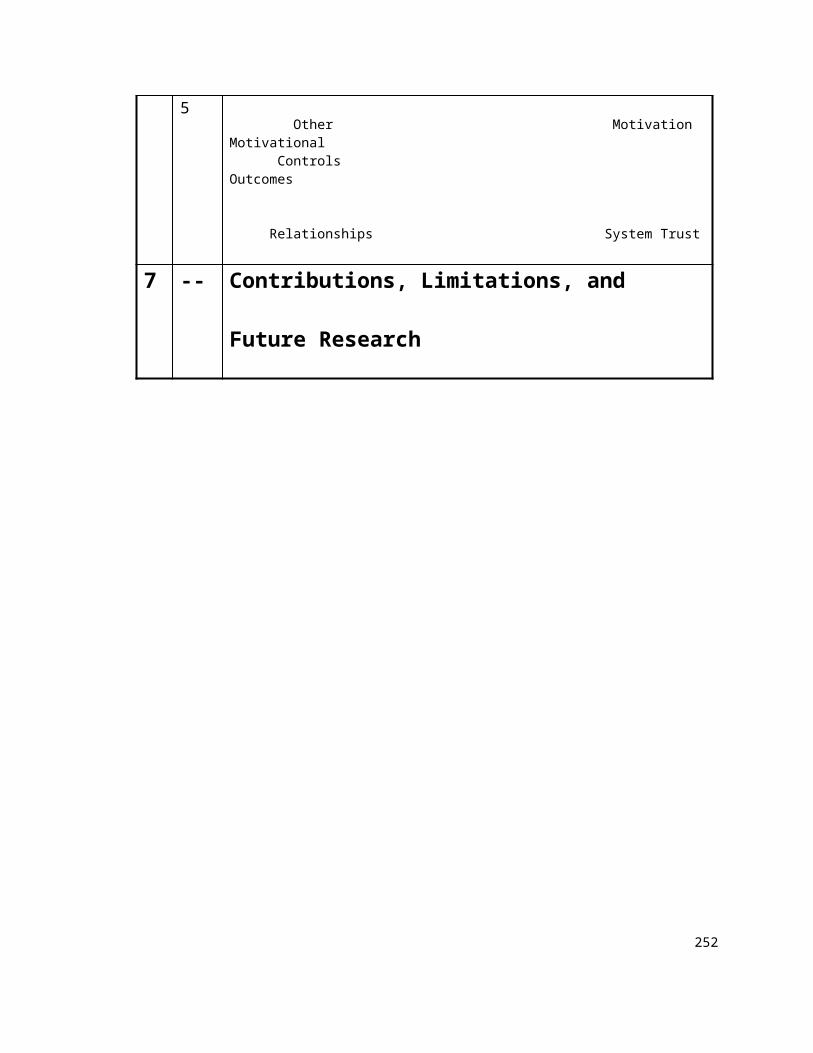
APPENDIX J PAIRWISE INTERCORRELATION MATRICES-- HIGH LEVEL CONCEPTS**not shown**
257