Embed Size (px)
Citation preview
Do Rail Transit Stations Encourage Neighborhood Retail Activity?
Jenny Schuetz
Price School of Public Policy
University of Southern California
Last revised:
February 8, 2014
Abstract
Over the past 20 years, California has made substantial investments in intra-metropolitan
passenger rail infrastructure, expanding existing systems and building new ones. According to
advocates of New Urbanism, such investment should encourage the growth of mixed-use transit-
oriented development, defined as a high-density mix of residential and commercial uses within
walking distance of rail stations. Little research to date has examined whether rail investment
stimulates retail activity, which is a key component of mixed-use development. In this paper, I
test whether the opening of new rail stations across California’s four largest metropolitan areas
has affected retail employment within one-quarter mile of the stations, compared to similar
neighborhoods around older stations or with no rail stations. Results indicate that new rail
stations were located in areas with initially high employment density, somewhat outside the city
centers. The impact of new stations on nearby retail activity varies within and across
metropolitan areas. While new station openings are not significantly associated with retail
employment across all MSAs, in the Los Angeles and Sacramento MSAs new stations are
negatively associated with retail. Newly opened stations are positively associated with retail
employment around suburban stations, but have a negative relationship near downtown stations.
Keywords: Transit-oriented development; economic development; retail location
JEL classifications: H4, H7, R1, R3, R4
Acknowledgements
Funding for this project was provided by the METRANS Transportation Center at USC and the
Lusk Center for Real Estate. Marie Sullivan provided outstanding help with GIS analysis.
Thanks to Gen Giuliano, Peter Gordon, Chris Redfearn and Lisa Schweitzer for helpful
comments. Thanks also to Yuting Hu, Sanggyun Kang, Thom Malone and Vincent Reina for
excellent research assistance.

1
Section 1) Introduction
According to advocates of “New Urbanism”, one of the goals of public investment in rail
transit is to encourage the growth of mixed-use transit-oriented development, defined as a high-
density mix of residential and commercial uses within walking distance of rail stations. In
theory, by reducing transportation costs for residents in the surrounding neighborhood, new
transit stations should result in increased land values, spurring higher density development and
higher-value uses (TCRP 2004). Numerous studies have attempted to identify the impacts of rail
transit systems on surrounding neighborhoods in a variety of U.S. metropolitan areas. Most of
these test the relationship between rail stations and property values; results vary widely both
across MSAs and across stations or neighborhoods within an MSA (Bowes & Ihlanfeldt 2001;
Debrezion et al 2007; Duncan 2011; Hess & Almeida 2007, Lin 2002; Mathur and Ferrell 2009).
Analysis of other outcomes, such as transit ridership, population density, employment
composition, urban form, and aggregate social welfare, reveal similarly heterogeneous (Baum-
Snow and Kahn 2005; Bollinger and Ihlanfeldt 1997; Ewing and Cervero 2010; Giuliano and
Agarwal 2010; Kahn 2007; Lund et al 2004; Winston and Maheshri 2007). However, no
research to date has examined the impacts of rail investment on one of the key components of
mixed-use development, namely retail activity. In this study, I contribute to a broader
understanding of TOD by examining whether the development of new rail transit stations in four
California metropolitan areas has increased the quantity of retail employment near stations.
As a land use class, retail should be highly compatible with neighborhoods surrounding
rail stations: the increased pedestrian traffic generated by transit riders should increase retail
business, whereas high traffic may be considered a negative amenity for residential development.
Moreover, municipalities offer give planning preference to commercial developments over
2
residential ones because of the fiscal benefits generated by business taxes; this is particularly true
in California, because Proposition 13 limits local revenues from property taxes (Gruen 2010).
The presence of retail services in a neighborhood, such as grocery stores, pharmacies and
restaurants, has important quality of life implications for residents, for instance whether they can
purchase healthy food choices at reasonable prices (Hayes 2000). Therefore the extent to which
rail investments improve the quantity or quality of retail services in surrounding neighborhoods
is potentially a valuable social benefit that might serve to justify public expenditures. This is
particularly true for rail investments in low-income and minority neighborhoods, which tend to
have fewer retail and household service establishments, and where those that do exist offer
inferior quality goods at higher prices (Alwitt and Donley 1997; Bartie et al 2007; Carr and
Schuetz 2001; Sloane et al 2005). Moreover, because, low-income households are typically less
likely to own automobiles, they may face greater barriers to reaching commercial centers outside
their immediate neighborhoods.
This study examines how public investments in rail transportation in California’s four
largest metropolitan areas – Los Angeles, Sacramento, San Diego and San Francisco-San Jose –
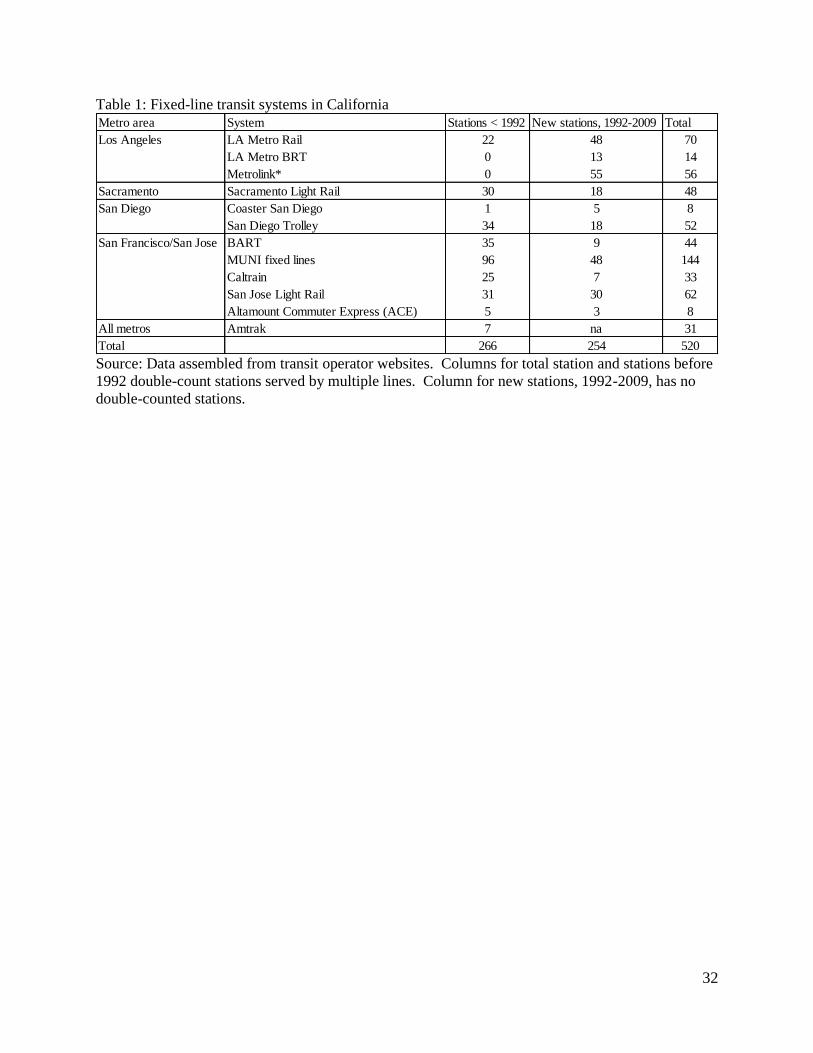
have affected the quantity of retail in surrounding neighborhoods. As shown in Table 1, the
number of rail stations in these regions has nearly doubled over the past 20 years, through
expansion of existing rail systems and development of new ones. The stations vary considerably
in their locations, physical characteristics, type of rail system, and neighborhood economic and
demographic characteristics, both within and across MSAs, offering the chance to investigate
how station heterogeneity affects the impact on retail. Only a few prior studies have
incorporated detailed information on station traits, such as the density of surrounding streets,
parking availability and slope gradients (Duncan 2011, Bowes and Ihlanfeldt 2001).
3
The urban economics literature provides several models of retail firm location that
provide a theoretical framework for why the presence of public transportation should affect the
amount and composition of local retail outlets. The addition of a new rail station to a
neighborhood decreases transportation costs between neighborhoods that are connected by the
rail line, thus expanding the market area – and number of potential consumers – for stores at each
station. If rail stations attract additional riders to the neighborhood, either residents who move to
the area or commuters who work nearby, the station will effectively increase the buyer density in
the neighborhood, and so should lead to an increase in the number of retail establishments and
employees (Berry 1967, Stern 1972). A larger consumer base may also encourage product
differentiation, leading to greater diversity of store types by goods and services offered (Fisher
and Harrington 1996). Previous empirical studies on the impacts of rail stops on other outcomes,
such as property values, population and employment, have shown that the extent of impacts
depend crucially on increases in ridership (Baum-Snow and Kahn 2005; Brown et al 2013; Kahn
2007; Bollinger and Ihlanfeldt 1997). Therefore whether rail stations result in an increase in the
quantity (or quality) of surrounding retail will depend on the number of transit users at that
location. Moreover, an increase in retail establishments near a newly built train stop could
represent either a net increase in retail activity through new store creation or redistribution from
other, less accessible sites, as stores relocate closer to the rail station.
In this analysis, I combine geocoded data on retail establishments from the National
Establishment Time Series (NETS) database with the location and opening dates of more than
500 rail stations throughout California’s large metropolitan areas. First I examine differences in
neighborhood characteristics for the one-quarter mile areas around rail stations, comparing new
station neighborhoods to areas around older station as well as designated census tracts that are

4
never within one-half mile of any rail stations. Then I test whether the opening of new stations
has been associated with a growth in retail employment immediately around the stations, relative
to control tracts and older station areas. This study contributes to the prior literature on TOD in
several ways. First, I focus on an economic outcome that has been hypothesized as a benefit of
TOD but which has not previously been analyzed. Second, by using longitudinal data that spans
growth in transit systems, I can test for changes after new stations open while controlling for pre-
existing neighborhood differences. Third, by using consistent data and methods for four large
metropolitan areas, I allow for comparisons across different cities.
Results indicate that new rail stations were located in areas with initially high
employment density, somewhat outside the city centers, with relatively low household incomes
and property values. Analysis of retail employment suggests that the impact of new stations on
retail activity near the stations varies across and within metropolitan areas. Across all cities and
neighborhoods, new station openings are not associated a significant change in retail
employment. In Los Angeles and Sacramento, the estimated effect is negative and significant,
while in San Diego and San Francisco, the effect is positive but not statistically different from
zero. Stations within five miles of the CBD have high average levels of retail employment, but
new station openings are negatively associated with retail employment. Station openings farther
from the CBD are positively associated with retail employment, although starting from a much
lower baseline. The differences in growth of nearby retail may reflect unobserved variables,
such as different in transit ridership, or different valuation of transit access across
neighborhoods.
The remainder of this paper is organized as follows. Section 2 provides background on
the rail systems that form the setting for the analysis and lays out hypotheses for how station

5
characteristics might affect surrounding retail growth. Section 3 describes the data and empirical
methods. Section 4 presents results of descriptive statistics, while Section 5 offers directions for
future research and discusses policy implications.
Section 2) Background on California rail systems
This paper focuses on fixed-line transit systems in California’s four largest metropolitan
areas: Los Angeles-Long Beach, Sacramento, San Diego, and San Francisco-San Jose. As of the
end of the study period in 2009, these four MSAs had a total of 520 stations belonging to eleven
different fixed-line transit systems. Most of the systems are light rail lines, there are some heavy
rail lines (BART, Caltrain, and the LA Metro Red and Purple lines) and one bus rapid transit
(BRT) system (the MTA’s Orange Line).1 This section describes the growth of rail systems
during the 1992-2009 period, and discusses how the characteristics of the stations and the rail
systems might affect their impact on surrounding development patterns.
Data assembly
Data on the location and characteristics of transit stations was assembled from a variety
of sources, primarily the websites of the various transit operators. Station names and locations
were collected from system maps, along with indicators for all systems and lines using each
station. Addresses were geocoded to obtain latitude and longitude coordinates and match
stations with census tracts. Information on the initial year of rail service at each station was
obtained from transit operator websites and supplemental sources, including Amtrak’s Great
American Stations website and contemporaneous media coverage.2
Expansion of California rail systems
1 The analysis focuses mostly on rail stations because the investment in fixed-location infrastructure increases the
probability of future development at that location, relative to bus stops, which may be moved more easily. 2 http://www.greatamericanstations.com/

6
Most of California’s metropolitan areas are relative newcomers to rail transit systems,
compared to East Coast cities: Baum-Snow and Kahn (2005) find that San Francisco is the only
California city in the group of seven “legacy” MSAs with rail transit in 1970. But all four of the
state’s largest MSAs had some rail stations as of 1990 (Table 1), and nearly all of the transit
systems expanded between 1992 and 2009.
The new stations represent various types of growth. LA’s Metropolitan Transit Authority
(MTA) built several new subway and light rail lines and a new BRT line. Most of these stations
connect neighborhoods within the City of Los Angeles, but two lines extend to the nearby cities
of Long Beach and Pasadena. The other main rail system in the LA region is the Metrolink
commuter rail system, operated by the Southern California Regional Rail Authority. The entire
Metrolink system was developed between 1992 and 1995, and serves all five counties in the LA
CMSA (Los Angeles, Orange, Riverside, San Bernadino, and Ventura).3 The Sacramento
Regional Transit District operates a light rail system, begun in 1987 and expanded during the
study period. San Diego’s Metropolitan Transit System operates three light rail lines under the
San Diego Trolley; two lines were built in the 1980s, the third was added in 1990 and expanded
throughout the study period. The San Diego region is also served by the North County Transit
District’s Coaster commuter rail, built in 1995.
The San Francisco-San Jose MSA has the oldest systems and the most extensive transit
network in California. The San Francisco Municipal Railway System, or MUNI, is a system of
buses, trolleys and cable cars, some of which have operated along the same routes for nearly a
century, but with expansions continuing through the 1990s and 2000s. MUNI stops are only
located within the city of San Francisco. The Bay Area Rapid Transit (BART) is a heavy rail
3 Quite a few of the Metrolink stations also overlap with Amtrak’s inter-city passenger rail service. However, most
of the Amtrak stops were instituted after Metrolink service began.

7
system running throughout the region, including the East Bay cities of Oakland and Berkeley;
the earliest BART stations were built in the 1970s, within expansions continuing to current years.
In the San Jose area, the Santa Clara Valley Transportation Authority operates three light rail
lines, primarily in the City of San Jose, but extending to several other cities in Santa Clara and
San Mateo counties. These stations opened between 1987 and 2005. A regional commuter rail,
Caltrain, runs through the spine of the Bay Area, from San Francisco to San Jose and extending
south to Gilroy. Most Caltrain stations were opened before 1992, with a few later expansions.
The newest and smallest rail system in the Bay Area is the Altamount Commuter Express, which
began operating in 1998, from San Jose north to Fremont and extending east to Stockton.4 The
Bay Area has by far the highest share of transit riders among the four MSAs in this study,
although ridership varies across counties as well: roughly one-third of commuters in San
Francisco County ride public transit to work, and 11 percent in Alameda County, compared to
under seven percent in Los Angeles County and about three percent in San Diego and
Sacramento Counties.5
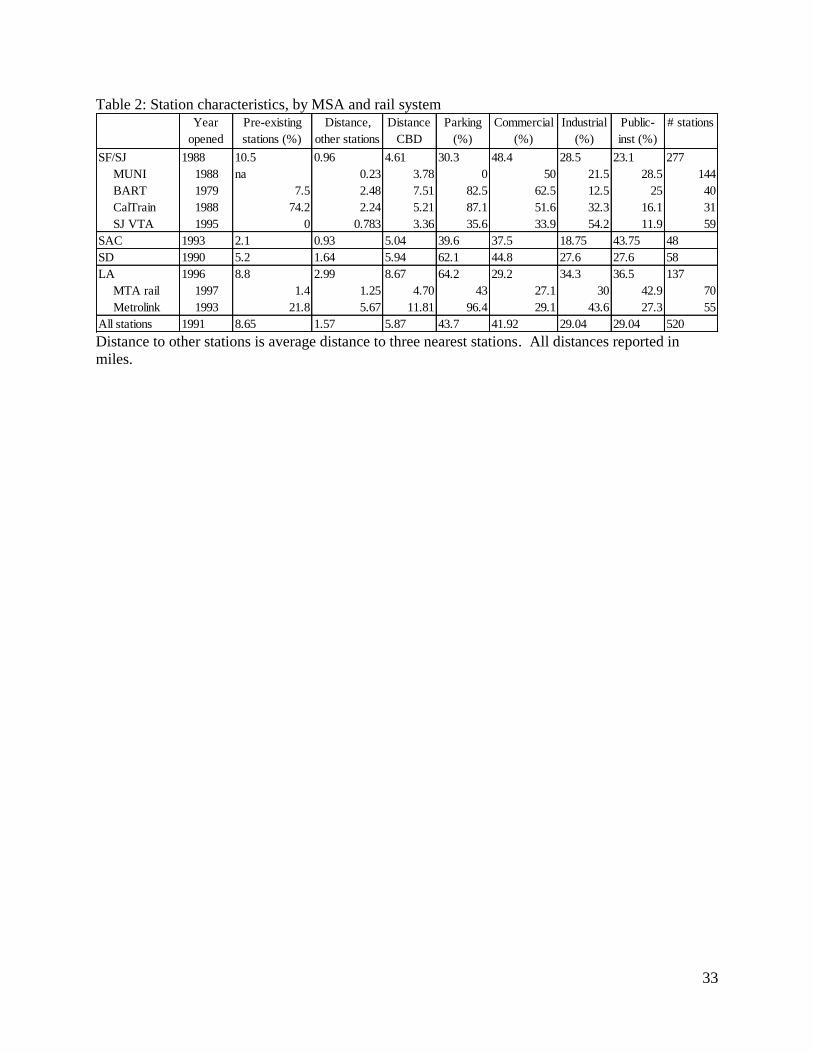
As shown in Table 2, the location and characteristics of stations varies across MSAs and
across rail systems within MSAs. Although most of the current passenger rail services are of
fairly recent duration (Column 1), some of the transit systems made use of pre-existing stations
and track infrastructure built as part of earlier passenger or freight rail systems (Column 2).6 A
4 The three easternmost stations on ACE – Stockton, Lathrop/Manteca and Tracy – fall outside the counties in the
San Francisco-San Jose CMSA as so are excluded from analysis in this paper., 5 Transit ridership shares calculated from 2010 ACS data; numbers represent percent of workers aged 16 or more
who do not work at home. 6 Approximately one-quarter of all stations and 13 percent of newly built stations serve multiple rail lines (this
includes multiple lines within the same transit system and multiple systems). For the purposes of analysis, any
station that served one or more of the listed transit systems prior to 1992 is considered to be an existing station
through the entire period of analysis. Newly opening stations from 1992 to 2009 either did not exist or did not serve
any of these rail stations prior to 1992. Although not part of the analysis, 31 of these stations are also served by
Amtrak; Amtrak passenger service either pre-dated 1992 or was added to new stations after the local rail service

8
review of station histories provided by Amtrak indicates that many of these stations were built
prior to 1940 as part of inter-city passenger rail services, most notably belonging to the historic
Atchison, Topeka and Santa Fe Railway. MUNI and the San Jose and Sacramento light rail
systems are quite dense, with the average station less than one mile from its three nearest
stations, while stations in the commuter rail systems of BART, Caltrain and Metrolink are quite
widely spaced (Column 3).7 Not surprisingly, stations serving the intra-city rail systems
(especially MUNI, San Jose rail, Sacramento rail and MTA rail) are located on average closer to
their cities’ Central Business Districts than the commuter rail systems (Column 4). Availability
of parking lots or garages designated for transit riders also varies by rail system: none of the
MUNI stations have parking, about 35-45 percent of stations serving other intra-city systems
have parking, while more than 80 percent of stations on commuter rail systems have designated
parking, some with several thousand spaces. The last three columns in Table 2 indicate the
predominant land use category in areas around the station, as of 1992.8 Across all MSAs, 42
percent of stations were built in commercial areas, in which employment was composed mostly
of activities such as finance and insurance, professional services, retail, and food service. About
30 percent of stations were located in areas dominated by industrial uses, such as manufacturing,
transportation and warehousing. The same percent of stations were located near institutional
uses, such as public administration, education, and health care.
Could station characteristics impact nearby retail development?
began. The first year of rail service for some pre-1992 stations could not be determined, particularly for the MUNI
stations. 7 The distance to other station is a nearest neighbor index, measuring average distance from each station to its three
nearest neighbors. Methodology discussed in more detail in Section 3. 8 Land use categories are derived from the industry with the largest share of employment, using the NETS data. Full
discussion of the data and method is provided in Section 3.

9
The variation in station characteristics presented in Table 2 may plausibly impact nearby
economic activity, directly through physical context and indirectly through differences in transit
ridership (Duncan 2011; Voith 2005). Broadly speaking, the type of station attributes that may
affect retail growth can be grouped into four categories: station physical characteristics,
neighborhood physical characteristics, neighborhood economic & demographic characteristics,
and neighborhood regulatory and political environment.
Comparing two stations along Metrolink’s Orange County Line illustrates how station
and neighborhood physical conditions might impact nearby development. The Fullerton station,
originally developed in 1923 by the Union Pacific Railroad, is built in Spanish Colonial style,
with decorative architectural features. It is located in a fairly dense commercial area near the
city’s downtown, and ties directly into the surrounding street grid. The Laguna Niguel/Mission
Viejo station does not have a station building, just a boarding platform, surrounded by large
surface parking lots, lying between two major freeways. While the Fullerton station could
easily be incorporated into a New Urbanist-style, pedestrian-friendly transit oriented
development, the location and physical characteristics the Laguna Niguel station would make
such development difficult, if not impossible. More generally, the physical features of the
station and its surrounding neighborhood offer different opportunities for nearby development.
Most light rail stations and tracks lie above ground, creating a break in the street grid on either
side of the station, relative to underground subway systems. Like the Laguna Niguel stop, many
stations along commuter rail lines are surrounded by large surface parking lots, to accommodate
park-and-ride passengers. The presence of large parking lots or garages may form a physical
barrier around the station that limits the possibility of retail activity within walking distance of

10
the station. Several rail lines, such as the MTA Green Line, run down the median of freeways,
again forming a barrier to immediately contiguous development.
A priori, it is unclear whether newly opening stations built in older, denser
neighborhoods should experience more retail growth than stations built in low-density,
undeveloped areas. On the one hand, neighborhoods that already have high density of either
residential or commercial uses have existing infrastructure and may provide more critical mass
of consumers (see Brooks and Lutz (2013) for the example of persistent development patterns
around Los Angeles streetcar lines). On the other hand, building new stores might require
redevelopment of existing structures, a more time-consuming process. Older neighborhoods
may also have more fragmented land ownership, requiring costly and lengthy parcel assembly
for large-scale projects.
The reuse of existing and historic stations has several potentially important implications
for retail growth subsequent to station re-opening. First, the locations of these stations were not
selected based on current economic conditions; they may not be in the optimal location relative
to current distribution of population and non-retail activities. Second, the built environment
surrounding older stations is more likely to be already developed than the surroundings of
greenfields stations, which may make these areas more costly to adapt (although older stations
may have higher density of retail prior to station opening, as a legacy of the existing
development patterns). Third, for older stations that are considered architecturally or historically
important, there may be historic preservation mechanisms that hinder nearby redevelopment (a
number of the older stations are listed on the National Registry of Historic Places).
In general, we would expect economic and demographic characteristics to affect the
likelihood of retail growth around a station. Households with more disposable income or wealth
11
represent desirable consumers for retailers. Previous research has shown that some population
characteristics, such as share of college-educated population, share of households with children,
and share of owner-occupied homes, are negatively correlated with retail activity, potentially
because these households prefer neighborhoods that are exclusively residential (Schuetz et al
2012, Waldfogel 2006). Higher income households are also more likely to own cars, and may
find rail transit less of an amenity than households who depend on public transit.
Two attributes of stations which I cannot directly observe are likely to affect the
prospects for retail growth around new stations. First, the regulatory and political environment
will affect the potential not only for retail, but for any type of transit-oriented development. If a
new station is opened in an area not zoned for commercial activity, or zoned for low density
development, then little retail growth is likely to follow. Specifically, while retail activity should
be compatible with other commercial uses - and new retail establishments should face few
regulatory barriers to entry in those areas – it seems likely that areas previously occupied by
industrial uses will be a more challenging environment for retailers, possibly requiring zoning
changes or environmental remediation. Buildings occupied by public agencies, schools, and
other institutions may or may not permit nearby retail activity. Conversely, local officials may
offer incentives for projects near transit, relative to other locations; such incentives may include
density bonuses in designated areas, reduced permitting fees or fast-tracking of development
approvals. If developments near stations receive preferential treatment, it is unclear whether
TOD projects represent a net increase in jobs or merely a shift away from other locations. I do
not have data on zoning around the 520 stations, so rely on proxies such as non-retail
employment density and primary land use prior to station opening to infer zoning constraints.
Second, stations with higher ridership should be more attractive to retailers, because of the

12
higher volume of consumers. Time-varying ridership data per station is not available. My
closest proxies are the number of lines serving each station and the density of nearby stations;
rail transit will be a more desirable mode of transportation at stations that are part of a denser
network, offering access to more destinations.
Section 3) Methodology and data description
This paper seeks to determine whether investments in public transportation have
improved access to retail services by increasing the amount of retail activity in neighborhoods
surrounding new rail stations. The empirical strategy is a modified difference-in-difference
approach, which compares retail employment density near newly opening transit stations, before
and after the stations open, to changes in retail employment density for two sets of control
neighborhoods. The transit literature generally finds that most potential riders will come from a
one-quarter mile radius of the station, with impacts declining rapidly beyond that (see Kolko
2011), so I define the primary treatment area to be within one-quarter mile radius of each newly
opening station.9 Stations that opened prior to 1992 and thus were in operation during the entire
study period (1992-2009) form one set of control areas. The second set of control areas are
census tracts outside a half-mile boundary of any transit station (new or existing), so not likely to
be directly affected by station openings, but within the same PUMA as at least one rail station.
Limiting control areas to the same PUMA should yield comparison groups that have similar
demographic and economic characteristics to the treatment areas, as well as similar proximity to
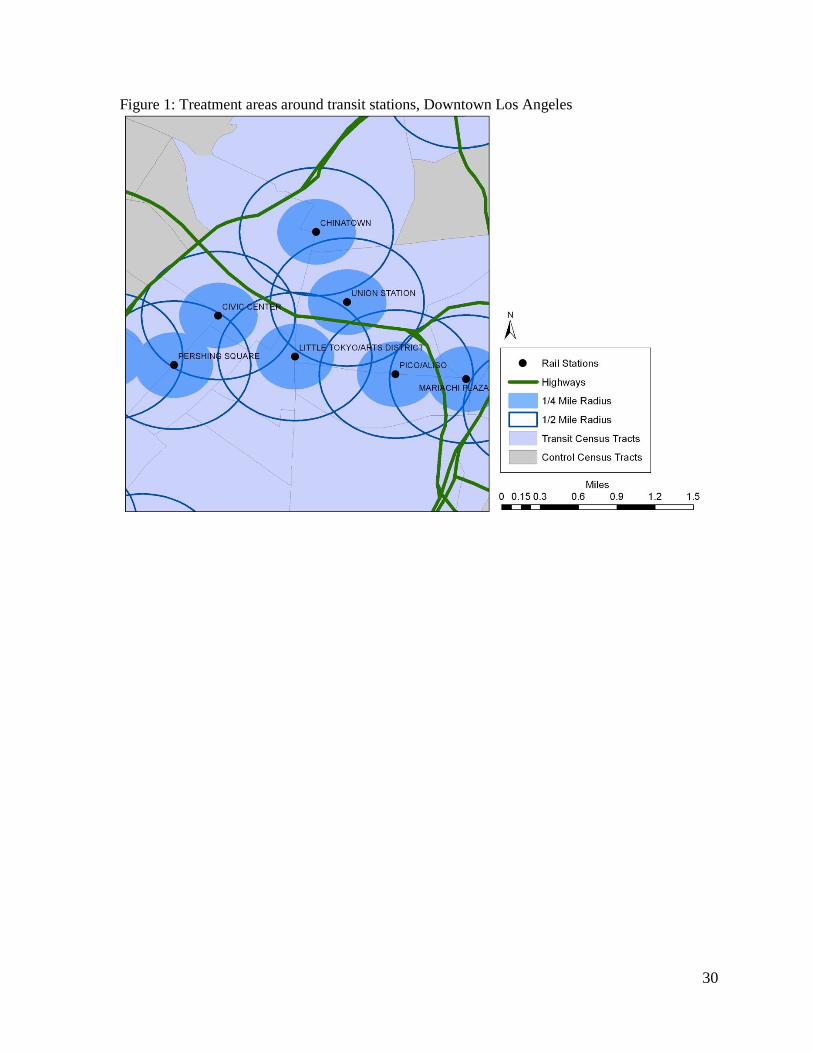
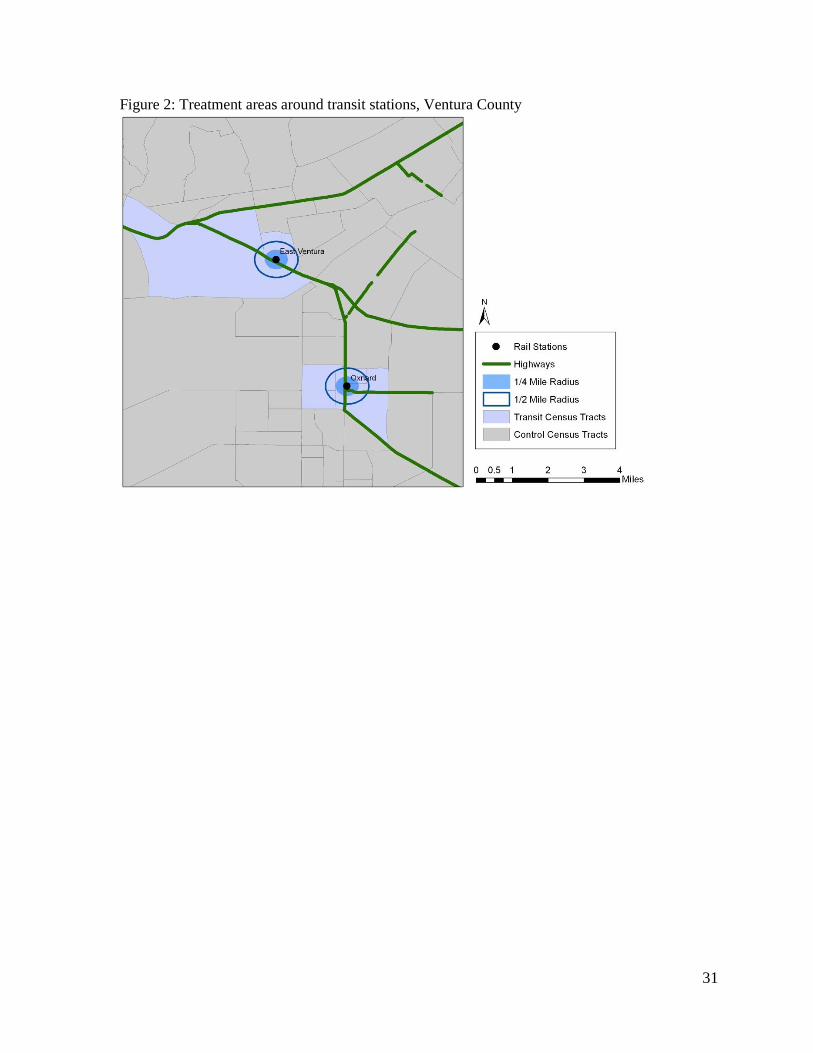
spatially-specific amenities (parks, school districts, etc.). Figures 1 and 2 show the quarter mile
boundaries for areas around selected transit stations, as well as the control tracts that fall outside
the larger half-mile boundary.
9 Similar analyses using one half-mile radius around stations produces highly similar results; see Appendix A.
13
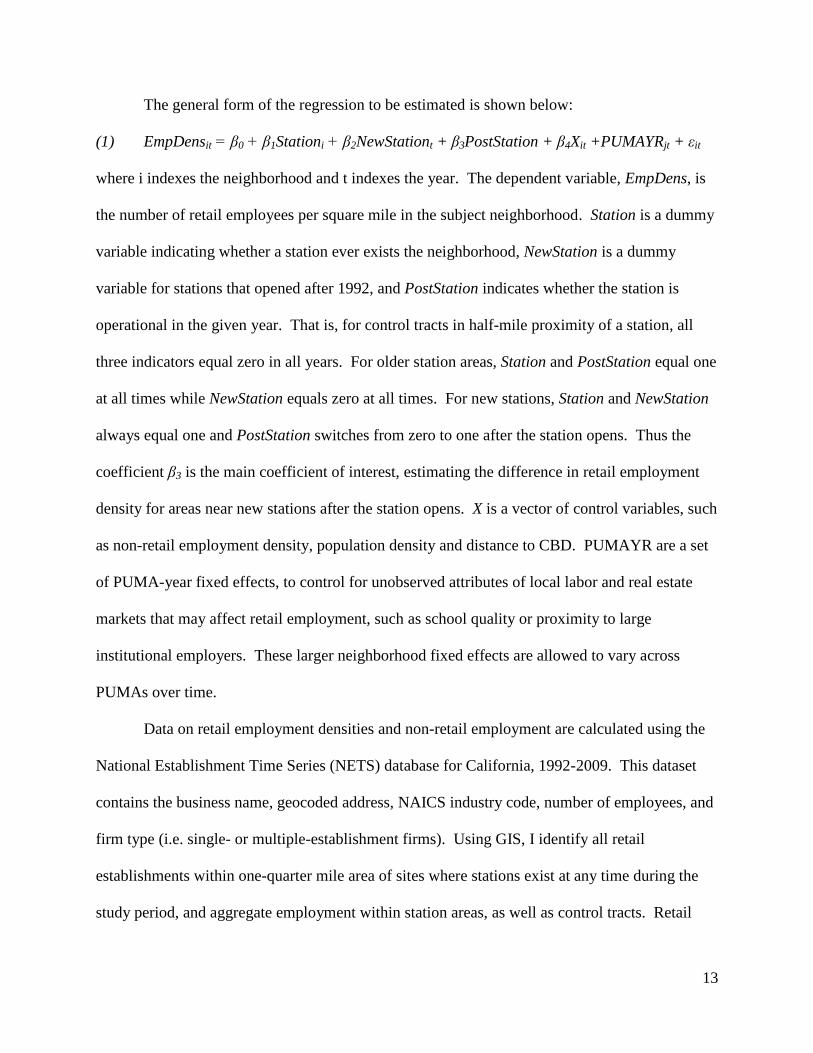
The general form of the regression to be estimated is shown below:
(1) EmpDensit = β0 + β1Stationi + β2NewStationt + β3PostStation + β4Xit +PUMAYRjt + εit
where i indexes the neighborhood and t indexes the year. The dependent variable, EmpDens, is
the number of retail employees per square mile in the subject neighborhood. Station is a dummy
variable indicating whether a station ever exists the neighborhood, NewStation is a dummy
variable for stations that opened after 1992, and PostStation indicates whether the station is
operational in the given year. That is, for control tracts in half-mile proximity of a station, all
three indicators equal zero in all years. For older station areas, Station and PostStation equal one
at all times while NewStation equals zero at all times. For new stations, Station and NewStation
always equal one and PostStation switches from zero to one after the station opens. Thus the
coefficient β3 is the main coefficient of interest, estimating the difference in retail employment
density for areas near new stations after the station opens. X is a vector of control variables, such
as non-retail employment density, population density and distance to CBD. PUMAYR are a set
of PUMA-year fixed effects, to control for unobserved attributes of local labor and real estate
markets that may affect retail employment, such as school quality or proximity to large
institutional employers. These larger neighborhood fixed effects are allowed to vary across
PUMAs over time.
Data on retail employment densities and non-retail employment are calculated using the
National Establishment Time Series (NETS) database for California, 1992-2009. This dataset
contains the business name, geocoded address, NAICS industry code, number of employees, and
firm type (i.e. single- or multiple-establishment firms). Using GIS, I identify all retail
establishments within one-quarter mile area of sites where stations exist at any time during the
study period, and aggregate employment within station areas, as well as control tracts. Retail

14
establishments are defined as those with NAICS two-digit code 44-45, as well as food service
establishments (NAICS 722). The NETS data are also used to categorize the primary economic
activity in each station area and control tract. Neighborhood employment is aggregated for each
of the twenty NAICS 2-digit industry sectors, and the sector with the largest share of total
employment is designated as the primary industry. To simplify the twenty-plus NAICS sectors,
neighborhoods are then assigned one of four categories, based on the primary industry:
commercial, industrial, public-institutional, or undeveloped.10
None of the station areas and very
few of the control tracts are in undeveloped areas. The other industry categories serve as proxies
for the type of building stock and land use regulation likely to be prevalent in each
neighborhood, indicating the relative demand for and ease of developing retail activities.
A key question of interest is whether the effects of new rail stations vary by prior
demographic, economic or physical characteristics of the neighborhood. As Redfearn (2009)
points out, estimating average effects across all transit stations may obscure substantial
differences in localized impacts. Duncan (2011) finds that proximity to San Diego trolley
stations increases property values more in pedestrian-friendly neighborhoods. Hess and Almeida
(2007) find that in Buffalo, rail stations positively affect property values in high-income areas
but have negative impacts in low-income neighborhoods. Anecdotal evidence from Los Angeles
suggests that development patterns around new transit lines have varied considerably: new
residential and commercial activity has occurred around Metro’s Gold Line in Pasadena and the
Red Line stations in Hollywood, while very little development has occurred around the Blue
10
Commercial consists of the following NAICS 2-digit sectors: retail (44-45), information (51), finance and
insurance (52), real estate (53), professional services (54), arts and recreation (71), food service and accommodation
(72), and other services (81). Industrial sectors include: utilities (22), construction (23), manufacturing (31),
wholesale (42), transportation and warehousing (48), and administrative, support and waste disposal services (56).
Public-institutional uses include education (61), health care and social services (62) and public administration (92).
Agriculture (11) is designated as undeveloped, although this category is nearly non-existent in the sample.

15
Line stations in relatively lower-income neighborhoods of South LA. To test whether baseline
characteristics influence the trajectory of retail around new stations, the basic estimates from
Equation 1 are estimated for several sample stratifications: by MSA, within-MSA location, rail
system type, parking availability and initial land use. To capture differences of station impacts
within-MSA location, neighborhoods are classified by proximity to Central Business District
(within or outside five miles).11
Rail systems are classified as either intra-city (primarily
connecting neighborhoods within the primary city) or commuter rail (primarily linking suburbs
with the CBD of the primary city). Intra-city rail systems are the Los Angeles MTA rail and
BRT, Sacramento light rail, San Diego Trolley, San Francisco MUNI, and San Jose light rail.
Commuter rail systems are Southern California Metrolink, San Diego Coaster, and in the Bay
Area BART, Caltrain, and ACE.12
Data on population characteristics are taken from the 1990 and 2000 census and the
2005-2009 American Community Survey. Because station areas are defined as the one-quarter
mile circle surrounding stations, they do not align with census tract boundaries. GIS tools were
used to identify which census tracts fall within the one-quarter mile treatment area for each
station, and the amount of land each tract represents within the treatment area. Census variables
for each tract are weighted by land shares to calculate average characteristics for each treatment
area. Particular variables included are population density, median household income, and share
of housing units built before 1940. Future analysis may explore differences in station impacts by
initial neighborhood income and racial/ethnic composition. Variable definitions and sources are
shown in Table 5, summary statistics are shown in Table 6.
11
Estimates using OMB definitions of central cities for each MSA produce very similar results to the within-5 mile
of CBD estimates. 12
Stations which serve both intra-city and commuter rail systems are designated as intra-city.

16
Several geographic variables are also included in the analysis. Distance from each station
and from the centroid of each control tract to the nearest Central Business District are calculated
using latitude and longitude coordinates. The CBD is defined as the census tract with the highest
total employment density, using the NETS data. One CBD is identified for each of the
designated central cities within the MSA, using OMB definitions. Standard urban economics
suggest that property values and employment densities will decrease with greater distance from
the CBD (Alonso 1964; Mills 1972; Muth 1969). Proximity of stations and control tracts to
major highways are also calculated using GIS. Initial retail density and growth in retail are
likely to vary relative to proximity to both the CBD and highways, also some rail stations are
built along the freeway median, which is likely to impede nearby development. As discussed in
the previous section, rail transit should be more attractive to riders when stations are part of a
dense network. Therefore the analysis also includes a measure of station density, specifically the
average distance of each station to its three nearest neighbor stations. Higher distances to
nearby stations indicate lower network density.
One potential concern with identifying the effects of new rail stations on retail activity is
that transit investments may occur simultaneously with changes in local land use or fiscal policy,
designed to enhance the use of transit (for instance, an increase in allowable density of
development or reduced tax rates). Unfortunately, collecting systematic data on those policies
for all neighborhoods that receive train stations, and comparing them with similar policies for
neighborhoods that do not receive rail stops, is not feasible, but this is an important area for
future research.

17
Section 4) Empirical results
Where are stations located?
As shown in Table 2, the location and characteristics of new stations with respect to other
stations and the CBD varies across MSA and across systems within MSAs. San Francisco has
the oldest transit network of the four MSAs (average year open 1988) and among the highest
station density (mean distance to other stations less than one mile), while LA’s network is the
most recent (mean year open 1996) and the least dense (nearly three miles between stations).
The San Francisco-San Jose region has the largest number of stations and the greatest number of
separate transit systems, with MUNI making up more than half the region’s stations. LA’s
stations are shared between the intra-city MTA rail and the inter-city Metrolink commuter rail.
Most of San Diego’s stations belong to the intra-city San Diego Trolley, although the suburban
Coaster system has been expanding. An illustration of the variation in station density within the
LA region is shown in Figures 1 and 2. Downtown Los Angeles has seven MTA rail stations, all
less than one mile from at least one other station. Indeed for several stations, there are overlaps
in the quarter-mile radius of the station, which is expected to draw the most riders and should see
the greatest development impact. By contrast, the two Metrolink stations in Ventura County are
approximately four miles apart, with no overlap in potential catchment areas.
To examine more systematically the characteristics of neighborhoods around new rail
stations, Table 5 presents descriptive characteristics of new station areas, compared to old station
areas and the set of control census tracts with no stations. Columns 1-3 show the mean and
standard deviation for several key characteristics, while Columns 4-6 present differences
between the three neighborhood groups. New station areas had much higher initial overall
employment density than control tracts, and were in fact comparable to older station areas in

18
baseline employment density. A question is whether planners behind the location decisions
believed that placing new stations in employment centers would maximize ridership, by serving
an existing base of consumers, or whether it was easier to gain neighborhood acceptance for
stations in heavily commercial areas; Goetz (2013) suggests that the support of the business
community can be crucial in implementing successful transit projects. New stations were more
likely to be located in industrial areas than either old stations or control tracts, and less likely to
be surrounded by public and institutional uses (the traditional civic centers of most cities, near
City Hall and other local government offices, are generally served by older transit stations). In
terms of distance from CBD, new stations fall between older station areas (which are close to the
CBD) and control tracts. Newer stations are also closer to highways; several of the newer
systems were built parallel to major highways. The areas where new stations were built were on
average 10 miles from older stations, closer than the control tracts that did not receive stations.
The population density of new station areas, as of 1990, was lower than that of older station
areas, but compared to the population density of control tracts. Both old and new station areas
had comparable median incomes, both significantly lower than control tracts. New stations
opened in areas with lower college-educated population shares than either older stations or
control tracts. While the black population share in new stations was not significantly different
than in older station or control areas, new stations were in more Hispanic neighborhoods. New
station areas had an older housing stock than control tracts but newer housing stock than older
station areas.
In general, the comparison of new station areas to older stations and control tracts
suggests that station placement was not exogenous to initial physical, economic and
demographic characteristics. New stations were placed in highly dense commercial areas

19
somewhat outside the city center, with relatively low population densities and low incomes –
areas that should have the potential to accommodate, and could benefit from, additional
commercial activity.
Does retail density increase after new stations open?
To determine whether the opening of new stations is associated with a change in nearby
retail employment, I first present differences in means of employment density, before and after
stations open, then estimate difference-in-difference regressions for the full sample and stratified
across several characteristics of neighborhoods and rail systems.
Table 6 compares average retail employment densities across the three neighborhood
groups, as well as pre- and post-station densities for new station areas. The first section of the
table presents results for all metropolitan areas combined. Retail employment density is higher
in areas around old and new stations than in control tracts: 523 retail employees per square mile
in control tracts, compared to 2268 employees around older stations and 2439 retail employees in
the quarter mile radius around new stations. Moreover, retail employment density in the areas
about new stations appears to increase in years after the stations opened, rising from 2066
employees per square mile to 2668 employees. But this average effect for the full set of new
station neighborhoods conceals large differences across MSAs, as shown in the lower four
sections of Table 6.
In the Los Angeles and Sacramento MSAs, retail employment density within one-quarter
mile of new stations actually decreases after these stations open. In Los Angeles, retail density
around new stations both before and after opening is lower than retail density around older
stations; this reflects the placement of new Metrolink stations in suburban parts of Southern
California, as well as some of the MTA rail stations in less dense areas. Prior to new stations

20
opening, the average station area had 1902 retail employees per square mile, which drops by
nearly 400 employees in the years after the stations open. The drop is statistically significant at
the one percent level. In Sacramento, new station areas initially had higher retail employment
density than older station areas (1859 employees compared to 1513), but after the stations open,
retail employment drops by approximately 460 employees per square mile, although significant
only at the 10 percent level. Retail employment density around new stations in San Diego
increased by approximately 300 employees per square mile after stations opened, although the
change is not statistically significant. The only MSA in which new station openings are
associated with a positive and significant change in retail employment is the San Francisco-San
Jose metropolitan area. Retail employment around new stations is initially 2265, similar to that
around older stations (2324), but increases to 4810 after station opening – more than doubling
retail employment within a constant land area.
The difference in means tests summarized in Table 6 offer some insight into raw changes
in retail employment around station areas, but do not provide causal evidence of a link between
station opening and employment. In particular, given the substantial differences in station areas
and most control tracts, the difference in means do not address the counterfactual question of
whether retail employment might have been increasing or decreasing in comparable areas during
the same time period (there is no “post” opening period for control areas or older stations). To
conduct a more robust test of the relationship between station opening and surrounding retail
employment, I move to a regression framework. The results confirm some results of the
difference in means analysis: across the combined sample, both old and new station areas have
higher retail density than control tracts, and retail employment increases following new station
opening. But adding controls for baseline differences in neighborhoods makes the post-station

21
difference in employment statistically insignificant. Stratifying the sample in a number of
dimensions also confirms that proximity to stations has heterogeneous effects, across and within
MSAs.
The first three columns in Table 7 show results of regressions including only the dummy
variables for station presence, new stations and post-station opening. All regressions include
PUMA-year fixed effects, to account for secular changes in retail employment over time that
may vary by larger market areas. Coefficients in columns 1-3 indicate that neighborhoods ever
within one-quarter mile of stations have higher retail density than control tracts, and that newer
station areas have lower employment density than older stations. The coefficient on post-station
in Column 3 is positive and statistically significant, indicating that retail employment near new
stations was higher after the stations opened, as transit planners have proposed. (The post-station
dummy is always equal to one for older stations, so the net effect of older stations can be
calculated by summing the coefficients on “station” and “post-station”). Column 4 adds
variables for a number of locational, economic and demographic characteristics, to control for
prior differences between station and control areas. While the coefficients on station and new
station remain statistically significant, their magnitude drops considerably, and the coefficient on
post-station is substantively and significantly equal to zero. This suggests that any increase in
retail employment around newer station areas is due not to the presence of the station, but prior
conditions of the area that were favorable to retail activity. The most strongly significant
predictors of retail employment are baseline non-retail employment density, population density
and the dummy indicating predominantly commercial neighborhoods (all positive). These three
variables together explain about half the variation in retail employment levels. Retail
employment density increases with distance from the CBD, somewhat inconsistent with

22
monocentric cities models, but consistent with the retail industry following population to the
suburbs.13
Retail employment decreases with distance from the highway and increases with
distance to older transit stations. Share of older housing stock is positively associated with retail
density. Median household income, share of college educated population, and black and
Hispanic population shares are negatively associated with retail density. Although higher
income should imply greater purchasing power, high-income and well-educated households are
often opposed to nearby commercial activity. The results on black and Hispanic population
shares are consistent with empirical research on disparities in retail access in minority
neighborhoods (Schuetz et al 2012).
As with the difference in means, the aggregate results obscure variation in station impacts
across the four MSAs (Columns 5-8). In Los Angeles and San Francisco, although areas ever
near a station have higher retail density than control tracts within the same PUMA, the
coefficients on post-station opening are negatively and statistically significant. For Sacramento,
the coefficients on station and new station are positive but not statistically significant, while the
post-station coefficient is negative and significant, again consistent with Table 6. The estimates
for San Diego suggest that areas around older stations have a lower retail density than control
tracts, and newer stations were located in higher retail density areas, but with no significant
differences in retail density after station opening. The estimated coefficients on control variables
are largely consistent across MSAs, suggesting that the fundamental drivers of retail activity are
similar across cities.
Stratifying the sample by MSA is a fairly crude proxy for underlying differences in
station and neighborhood characteristics, however; station traits and location vary substantial
13
Because the CBD measures are calculated based on multiple central cities per MSA, this actually measures
distance to the nearest employment sub-center, and does not assume monocentricity.

23
within MSAs. Table 8 presents the estimated coefficients just for the three station variables,
stratified along four dimensions: intra-MSA location, rail system type, availability of on-site
parking, and initial land use category. The results on post-station are somewhat counterintuitive,
based on predictions from transit planners and theories of retail location. Based on anecdotal
evidence from a number of stations, a plausible hypothesis would be that transit stations closer to
the CBD, served by intra-city rail systems – both of which typically have higher ridership and
more frequent service than commuter rail systems – should have more impact on surrounding
development than suburban commuter rail stations. Likewise, we might anticipate that stations
surrounded by large parking lots and garages, which serve as impediments to contiguous
development, would reduce the incentive for retailers to locate nearby. The estimated results run
contrary to these hypotheses, however: the estimates on post-station are negative and significant
for stations within five miles of the CBD, stations served by intra-city rail and stations with no
on-site parking. The coefficient on post-station is positive and significant for stations more than
five miles from the CBD and those on commuter rail lines, suggesting that retail was higher
around these areas after the stations opened. Also somewhat surprisingly, while there is no
apparent relationship between post-station retail employment in commercial and public-
institutional areas, the coefficient on post-station is positive and significant in primarily
industrial areas. Similar analysis stratifying by proximity to CBD and MSA produce largely
similar results (Table 9).
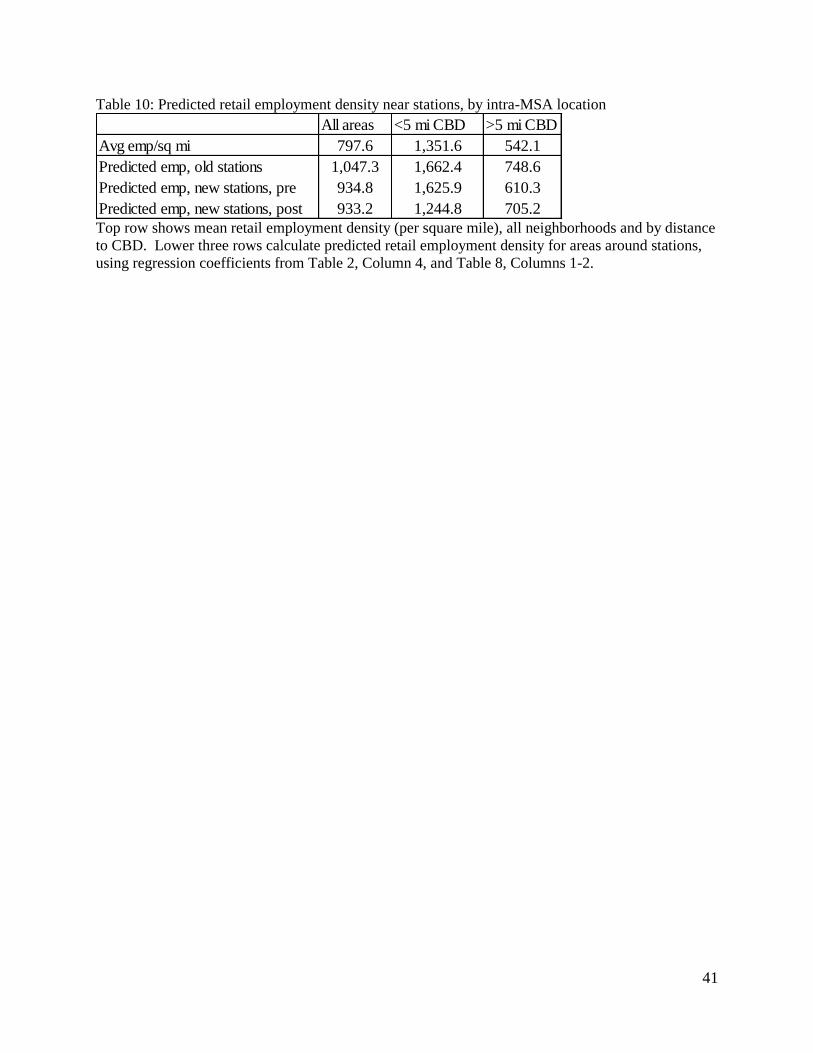
To better understand the magnitude of the effects, Table 10 presents predicted retail
employment densities for areas around older stations, and new stations before and after opening.
These predictions are obtained by summing the appropriate coefficients (Table 2, Column 4 for
all areas, Table 8 Columns 1 and 2 for the samples within and beyond five miles of the CBD),
24
then multiplying the total coefficients by the average retail employment density for each group.
As shown in Column 1 of Table 10, areas around both new and old stations have substantially
higher predicted retail densities than the average, with older stations being denser than newer
ones. For the full sample, there is essentially no difference in predicted density around new
stations, before and after station opening. Predicted densities in station areas close to the CBD
are much higher than predicted densities farther than five miles from the CBD. However, retail
density is predicted to decrease after station opening, for closer-in stations, while it increases by
a fairly large percent after opening in the farther stations.
Section 5) Discussion and policy implications
Over the past twenty years, local and regional governments in California have made
substantial investments in new or expanded rail transit systems. One of the justifications for
public funding of transit systems offered by policymakers is that the areas near transit stations
will benefit from greater economic development, increases in jobs, property values, and other
amenities. In this paper, I describe the characteristics and locations of new rail stations in
California’s four largest MSAs and examine whether the opening of new stations has been
associated with a growth in retail activity immediately around the stations.
Results indicate that new rail stations were located in areas with initially high
employment density, somewhat outside the city centers, with relatively low household incomes.
These areas therefore offer potential for physical and economic development surrounding the
stations. However, there is considerable variation in the baseline characteristics of
neighborhoods selected for rail stations, both within and across MSAs, which may affect the
prospects for nearby development. In addition, the new stations vary in their physical

25
characteristics, intra-MSA location, and the type of rail networks to which they belong. Stations
that attract higher ridership will presumably be more attractive targets for retail or residential
development, because of their ability to draw in consumers. Analysis of retail employment
suggests that the impacts of new stations on retail activity near the stations has been highly
varied: new station openings are not significantly associated with increased retail employment in
the San Francisco and San Diego MSAs, while retail employment actually decreased around new
stations in Los Angeles and Sacramento. New station opening is associated with increased retail
employment around stations more than five miles from the CBD, but with decreased
employment near more centrally located stations.
Although somewhat counter to the predictions of urban planners and standard economics
models, there are several possible explanations that would be consistent with these results. There
may be unobserved features of the urban structure, the transit system, or the population that
make transit access a more valuable amenity in certain neighborhoods. For instance, areas close
to the CBD may already be saturated with retail; the baseline retail employment density within
five miles of the CBD is more than double that of tracts farther away. In centrally located
neighborhoods, there may be higher barriers to larger-scale development projects, including high
land costs, fragmented land ownership, and cumbersome development processes. It may also be
the case that consumers prefer to conduct their shopping by car rather than by train, particularly
when purchasing bulky or heavy items. In car-oriented metropolitan areas – certainly including
Los Angeles and San Diego – developers may prefer to construct new shopping centers
surrounded by abundant parking, which will be difficult to do directly adjacent to transit stations.
The mixed results of the empirical analysis make it difficult to draw clear and consistent
implications for policymakers and planners. Like a growing number of studies, these results

26
should serve as a reminder that the impacts of transit infrastructure on surrounding
neighborhoods will vary, based on complex interactions between station and neighborhood
characteristics. In part, the difficulty lies in what the primary purpose of building transit stations
and rail networks should be: is the goal of such investment to improve functioning of the
transportation systems within a metropolitan area, or is it to spur economic development?
Building rail stations in centrally located neighborhoods that already have a high density of
residents or businesses seems likely to improve access to existing jobs, goods and services, but
may not result in increased economic activity if these areas are congested or require costly
redevelopment. By contrast, suburban stations will likely serve fewer potential passengers, but
may offer greater potential for greenfields development projects, oriented around the station.
The results raise questions about whether building new stations will be an effective economic
development tool for underserved neighborhoods in central cities. Planners and policymakers
considering the expansion or development of rail systems should therefore consider the pre-
existing neighborhood conditions, and weigh competing goals, before deciding where to make
new transit investments.

27
References
Alonso, William. 1964. Location and Land Use. Cambridge, MA: Harvard University Press.
Alwitt, L. and T. Donley. 1997. Retail Stores in Poor Neighborhoods. Journal of Consumer
Affairs 31: 139-164.
Bartie, P. and T. Blakely, J. Pearce, K. Witten. 2007. “Neighborhood Deprivation and Access to
Fast Food Retailing: A National Study.” American Journal of Preventive Medicine 32(5): 375-
82.
Baum-Snow, Nathaniel and Matthew Kahn. 2005. Effects of Urban Rail Transit Expansions:
Evidence from Sixteen Cities, 1970-2000. Brookings-Wharton Papers on Urban Affairs.
Berry, B. 1967. Geography of Market Centers and Retail Distribution. Englewood Cliffs, NJ,
Prentice Hall.
Bollinger, Christopher R. and Keith Ihlanfeldt. 1997. The Impact of Rapid Rail Transit on
Economic Development: The Case of Atlanta’s MARTA. Journal of Urban Economics 42: 179-
204.
Bowes, D. & Keith Ihlanfeldt. 2001. Identifying the impacts of rail transit stations on residential
property values. Journal of Urban Economics 50: 1-25.
Brooks, Leah and Byron Lutz. 2013. Vestiges of Transit: Urban Persistence at a Micro Scale.
Working paper.
Brown, Jeffrey, Gregory Thompson, Torscha Bhattacharya and Michal Jaroszynski. 2013.
Understanding Transit Ridership Demand for the Multidestination, Multimodal Transit Network
in Atlanta, Georgia: Lessons for Increasing Rail Transit Choice Ridership while Maintaining
Transit Dependent Bus Ridership. Urban Studies 50(1): 1-21.
Carr, James and Jenny Schuetz. 2001. Financial Services in Distressed Communities: Framing
the Issue, Finding Solutions. Washington, DC: Fannie Mae Foundation.
Cervero, Robert, and John Landis. 1997. Twenty Years of the Bay Area Rapid Transit System:
Land Use and Development Impacts. Transportation Research Part A 31 (4): 309–33.
Debrezion, Ghebreegziabiher, Eric Pels, and Piet Rietveld. 2007. The Impact of Railway Stations
on Residential and Commercial Property Values: A Meta-Analysis. Journal of Real Estate
Finance and Economics 35: 161–80.
Duncan, Michael. 2011. The Impact of Transit-Oriented Development on Housing Prices in San
Diego, CA. Urban Studies 48(1): 101-127.

28
Ewing, Reid and Robert Cervero. 2010. Travel and the Built Environment. Journal of the
American Planning Association 76(3): 265-294.
Fischer, Jeffrey and Joseph Harrington. 1996. Product Variety and Firm Agglomeration. RAND
Journal of Economics 27(2): 281-309.
Giuliano, Genevieve and Ajay Agarwal. 2010. Public Transit as a Metropolitan Growth and
Development Strategy. Brookings Institution working paper.
Goetz, Andrew. 2013. Suburban Sprawl or Urban Centres: Tensions and Contradictions of
Smart Growth Approaches in Denver, Colorado. Urban Studies 50(11): 2178-2195.
Gruen, Claude. 2010. New Urban Development: Looking back to see forward. Piscataway NJ:
Rutgers University Press.
Handy, Susan, Xinyu Cao, and Patricia Mokhtarian. 2005. Correlation or Causality between the
Built Environment and Travel Behavior? Evidence from Northern California. Transportation
Research Part D 10: 427–44.
Hayes, Lashawn R. 2000. “Do the Poor Pay More? An Empirical Investigation of Price
Dispersion in Food Retailing.” Princeton Department of Economics, Industrial Relations
Working Paper No. 446.
Hess, Daniel Baldwin and Tangerine Maria Almeida. 2007. Impact of Proximity to Light Rail
Rapid Transit on Station-area Property Values in Buffalo, New York. Urban Studies 44(5):
1041-1068.
Hotelling, Harold. 1929. Stability in competition. Economic Journal 39: 41–57.
Kahn, Matthew. 2007. Gentrification Trends in New Transit Oriented Communities: Evidence
from Fourteen Cities that Expanded and Built Rail Transit Systems, Real Estate Economics 35
(2): 155-182.
Kolko, Jed. 2011. Making the Most of Transit: Density, Employment Growth, and Ridership
around New Stations. Public Policy Institute of California working paper.
Lin, Jeffrey. 2002. Gentrification and Transit in Northwest Chicago. Transportation Quarterly 56
(4): 175–91.
Lund, Hollie, Robert Cervero, and Richard Willson. 2004. Travel Characteristics of Transit-
Oriented Development in California.
Mathur, Shishir, and Christopher Ferrell. 2009. Effect of Suburban Transit Oriented
Development on Residential Property Values. San Jose, CA: Mineta Transportation Institute.

29
Mills, Edwin. 1972. Studies in the Structure of the Urban Economy. Baltimore: Johns Hopkins
University Press.
Muth, Richard F. 1969. Cities and Housing. Chicago, IL: University of Chicago Press.
Redfearn, Christian. 2009. How Informative are Average Effects? Hedonic Regression and
Amenity Capitalization in Complex Urban Housing Markets. Regional Science and Urban
Economics 61:519-41.
Schuetz, Jenny, Jed Kolko and Rachel Meltzer. 2012. Are Poor Neighborhoods Retail Deserts?
Regional Science and Urban Economics 42(1): 269-285.
Sloane, D.C., L.B. Lewis, L.M. Nascimento. 2005. Assessing Healthy Food Options in South
Los Angeles Restaurants. American Journal of Public Health 95(4): 668-673.
Stern, N. 1972. The Optimal Size of Market Areas. Journal of Economic Theory.
Transit Cooperative Research Program. 2004. Transit-oriented development in the United
States: Experiences, challenges and prospects. Report No. 102, TCRP, Washington DC.
Voith, Richard. 2005. Comment on Baum-Snow and Kahn. Brookings-Wharton Papers on
Urban Affairs.
Waldfogel, Joel. 2008. The median voter and the median consumer: Local private goods and
population composition. Journal of Urban Economics 63: 567-582.
Winston, Clifford and Vikram Maheshri. 2007. On the Social Desirability of Urban Rail Transit
Systems. Journal of Urban Economics 62: 362-382.
30
Figure 1: Treatment areas around transit stations, Downtown Los Angeles
31
Figure 2: Treatment areas around transit stations, Ventura County
32
Table 1: Fixed-line transit systems in California
Source: Data assembled from transit operator websites. Columns for total station and stations before
1992 double-count stations served by multiple lines. Column for new stations, 1992-2009, has no
double-counted stations.
Metro area System Stations < 1992 New stations, 1992-2009 Total
Los Angeles LA Metro Rail 22 48 70
LA Metro BRT 0 13 14
Metrolink* 0 55 56
Sacramento Sacramento Light Rail 30 18 48
San Diego Coaster San Diego 1 5 8
San Diego Trolley 34 18 52
San Francisco/San Jose BART 35 9 44
MUNI fixed lines 96 48 144
Caltrain 25 7 33
San Jose Light Rail 31 30 62
Altamount Commuter Express (ACE) 5 3 8
All metros Amtrak 7 na 31
Total 266 254 520
33
Table 2: Station characteristics, by MSA and rail system
Distance to other stations is average distance to three nearest stations. All distances reported in
miles.
Year
opened
Pre-existing
stations (%)
Distance,
other stations
Distance
CBD
Parking
(%)
Commercial
(%)
Industrial
(%)
Public-
inst (%)
# stations
SF/SJ 1988 10.5 0.96 4.61 30.3 48.4 28.5 23.1 277
MUNI 1988 na 0.23 3.78 0 50 21.5 28.5 144
BART 1979 7.5 2.48 7.51 82.5 62.5 12.5 25 40
CalTrain 1988 74.2 2.24 5.21 87.1 51.6 32.3 16.1 31
SJ VTA 1995 0 0.783 3.36 35.6 33.9 54.2 11.9 59
SAC 1993 2.1 0.93 5.04 39.6 37.5 18.75 43.75 48
SD 1990 5.2 1.64 5.94 62.1 44.8 27.6 27.6 58
LA 1996 8.8 2.99 8.67 64.2 29.2 34.3 36.5 137
MTA rail 1997 1.4 1.25 4.70 43 27.1 30 42.9 70
Metrolink 1993 21.8 5.67 11.81 96.4 29.1 43.6 27.3 55
All stations 1991 8.65 1.57 5.87 43.7 41.92 29.04 29.04 520

34
Table 3: Variable definitions and sources
Variable Definition Source
Station presence Transit operator websites
station =1 if station ever exists in nhood, =0 otherwise
newstation =1 if station opened after 1992, =0 otherwise
poststation =1 if station currently operating, =0 otherwise
Employment/industry composition NETS 1992-2009
empdens # retail employees/sq mi
totemp92 # non-retail employees/sq mi, 1992
commercial = 1 if largest % jobs in commercial sectors, = 0 owNETS 1992-2009
industrial = 1 if largest % jobs in industrial sectors, = 0 ow
pubinst = 1 if largest % jobs in public/institutional sectors, = 0 ow
Location metrics
distcbd distance (miles) to CBD GIS calculations, lat-lon from Census
disthwy distance (miles) to nearest class 1 highway GIS calculations
diststa Average distance to 3 nearest stations, 1990
Population characteristics Census 1990, 2000, ACS 2005-2009
popdens Pop/sq mi
hsgpre40 % housing built < 1940
income Median HH income (2000 $)
baplus % population w/ BA degree or higher
black % black population
hispanic % Hispanic population

35
Table 4: Variable summary statistics
Mean Std. Dev. Min Max Obs
Station presence
station 0.15 0.36 0.00 1.00 62,370
newstation 0.07 0.26 0.00 1.00 62,370
poststation 0.12 0.33 0.00 1.00 62,370
Employment/industry composition
empdens 798 2,181 0 69,239 62,370
totemp92 4,895 24,945 0 671,527 62,370
commercial 0.44 0.50 0.00 1.00 62,362
industrial 0.24 0.43 0.00 1.00 62,362
pubinst 0.32 0.46 0.00 1.00 62,362
Location metrics
distcbd 8.78 6.07 0.06 62.00 62,370
disthwy 1.32 1.83 0.00 59.63 62,370
diststa 13.10 14.31 0.10 62.25 62,370
Population characteristics
popdens 8,960 7,735 0 61,088 62,370
hsgpre40 72,485 33,382 0 261,852 62,370
income 10.46 15.82 0.00 100.00 61,954
baplus 28.43 18.97 0.00 100.00 61,998
black 8.19 13.44 0.00 97.64 62,006
hispanic 28.06 24.73 0.00 100.00 62,006

36
Table 5: Neighborhood characteristics of station areas (1992/1990)
Census variables are reported for 1990, employment density for 1992. Distance to CBD and
distance to pre-1992 stations are constant over time. Station areas for new and old stations are
0.25 radius around station. Control areas are non-station census tracts in PUMAs with at least
one station. Standard errors shown in parentheses. *** p<0.01, ** p<0.05, * p<0.1
(1) (2) (3)
New station Old station None New - old New - None Old - none
totemp92 22,891 23,114 2,552 -223 20,338 *** 20,562 ***
(65,388) (62,462) (4,184)
commercl 0.390 0.447 0.452 -0.058 -0.062 ** -0.004
0.489 0.498 0.498
industrl 0.370 0.214 0.240 0.156 *** 0.130 *** -0.026
0.484 0.411 0.427
pubinst 0.240 0.338 0.303 -0.098 *** -0.062 ** 0.036
0.428 0.474 0.459
distcbd 7.30 4.50 9.30 2.80 *** -2.00 *** -4.80 ***
(6.76) (3.26) (6.03)
disthwy 0.85 1.04 1.39 -0.19 -0.53 *** -0.35 ***
0.80 1.96 1.87
diststa 10.02 0.99 14.46 9.03 *** -4.43 *** -13.47 ***
(12.67) (1.09) (14.53)
popdens 8513 11226 8266 -2,713 *** 247 2,960 ***
(8484) (7568) (7377)
income 59,834 59,576 74,668 258 -14,834 *** -15,091 ***
(20,879) (26,626) (33,086)
baplus 22.91 26.23 25.30 -3.32 *** -2.39 ** 0.93
(13.59) (14.69) (16.64)
black 8.95 10.46 8.35 -1.51 0.60 2.11 **
(12.35) (12.47) (15.31)
hisp 26.17 20.64 24.21 5.53 *** 1.96 -3.57 ***
(22.44) (18.51) (22.76)
hsgpre40 16.27 30.72 9.45 -14.45 *** 6.82 *** 21.27 ***
(18.00) (21.71) (15.07)
n = 254 266 2945
(4) (5) (6)

37
Table 6: Retail employment density, by presence of station (1992-2009)
Retail employment density is calculated as employees per square mile, either for the one-quarter mile
radius around a station or for control census tracts. Standard errors shown in parentheses. ***
p<0.01, ** p<0.05, * p<0.1
All metropolitan areas
No stations Old stations New stations
All years Before opening After opening Post - pre
Mean 523 2,268 2,439 2,066 2,668 602 ***
St dev (872) (4,309) (5,552) (3,798) (6,383)
n = 53,010 4,788 4572 1,738 2,834
Los Angeles
Mean 576 2643 1623 1902 1510 -391 ***
St dev (919) (2837) (2279) (2295) (2264)
n = 33,210 396 2,070 593 1,477
Sacramento
Mean 276 1513 1701 1859 1398 -461 *
St dev (403) (2555) (2443) (2669) (1911)
n = 3186 540 324 213 111
San Diego
Mean 443 2400 2128 1896 2215 318
St dev (699) (4509) (2213) (1973) (2293)
n = 5814 612 432 117 315
San Francisco/San Jose
Mean 477 2324 3622 2265 4810 2595 ***
St dev (892) (4627) (8363) (4946) (10334)
n = 10800 3240 1746 815 931

38
Table 7: Does retail employment growth increase after station opening?
Observations are for neighborhood-year, where neighborhood for stations is defined as one-
quarter mile radius of stations, and census tracts for control tracts. Robust standard errors shown
in parentheses. *** p<0.01, ** p<0.05, * p<0.1
Dep var: ln(Retail emp/sq mi) LA SAC SD SF-SJ
(1) (2) (3) (4) (5) (6) (7) (8)
station 1.116*** 1.369*** 1.093*** 0.315*** 0.823*** 0.144 -0.288* 0.557***
(0.024) (0.034) (0.071) (0.057) (0.089) (0.250) (0.170) (0.096)
newstation -0.424*** -0.325*** -0.143*** -0.427*** 0.283 0.525*** -0.629***
(0.042) (0.047) (0.039) (0.074) (0.211) (0.093) (0.063)
poststation 0.273*** -0.002 -0.146** -0.725*** 0.126 0.009
(0.062) (0.050) (0.062) (0.237) (0.158) (0.091)
ltotemp92 0.0368** 0.0780*** -0.193** 0.000 -0.031
(0.018) (0.022) (0.091) (0.077) (0.033)
commercial -0.129*** -0.124*** 0.011 -0.118*** -0.281***
(0.014) (0.016) (0.058) (0.039) (0.036)
industrial 0.662*** 0.667*** 0.680*** 0.686*** 0.612***
(0.005) (0.006) (0.021) (0.014) (0.010)
ldistcbd 0.865*** 0.863*** 0.969*** 0.899*** 0.807***
(0.009) (0.012) (0.041) (0.029) (0.019)
ldisthwy -0.010 0.019 0.141*** 0.052 -0.149***
(0.011) (0.014) (0.045) (0.037) (0.026)
diststa 0.0141*** 0.00666*** 0.0239*** -0.007 0.0934***
(0.002) (0.002) (0.007) (0.009) (0.006)
lpopdens 0.322*** 0.316*** 0.179*** 0.275*** 0.360***
(0.007) (0.009) (0.022) (0.022) (0.013)
hsgpre40 0.0423*** 0.0410*** -0.0953*** 0.0577*** 0.0445***
(0.006) (0.007) (0.024) (0.018) (0.011)
lincome -0.116*** -0.0695*** -0.119 -0.847*** -0.506***
(0.020) (0.020) (0.119) (0.081) (0.067)
baplus -0.00465*** -0.00651*** -0.00522** 0.00524*** -0.001
(0.001) (0.001) (0.002) (0.002) (0.002)
black -0.00657*** -0.00543*** -0.00912*** -0.0178*** -0.00793***
(0.001) (0.001) (0.003) (0.003) (0.001)
hisp -0.00398*** -0.00380*** 0.003 -0.00889*** -0.00913***
(0.000) (0.001) (0.003) (0.001) (0.001)
Fixed effects PUMAYR PUMAYR PUMAYR PUMAYR PUMAYR PUMAYR PUMAYR PUMAYR
Observations 62,370 62,370 62,370 61,938 35,396 3,986 6,786 15,770
R-squared 0.34 0.342 0.342 0.695 0.72 0.671 0.647 0.688

39
Table 8: Retail employment near stations, by station/neighborhood characteristics
Robust standard errors shown in parentheses. All regression include controls for ltotemp92, commercial,
industrial, distance to CBD, distance to highway, distance to other stations, pop density, % housing pre-
1940, ln(income). *** p<0.01, ** p<0.05, * p<0.1
Dep var: ln(retail emp/sq mi)
Sample <5 mi CBD 5+ mi, CBD Intracity Commuter Parking No parking Commercial Industrial Pub/Inst
(1) (2) (3) (4) (5) (6) (7) (8) (9)
station 0.512*** 0.206** 0.231*** 0.349*** 0.226** 0.328*** 0.236*** 0.449*** 0.587***
(0.075) (0.092) (0.065) (0.095) (0.090) (0.074) (0.090) (0.115) (0.093)
newstation -0.309*** -0.080 -0.060 -0.562*** -0.052 -0.314*** 0.041 -0.663*** -0.075
(0.048) (0.067) (0.049) (0.062) (0.057) (0.054) (0.063) (0.076) (0.065)
poststation -0.282*** 0.175** -0.190*** 0.434*** 0.084 -0.268*** -0.099 0.219** -0.059
(0.069) (0.077) (0.058) (0.085) (0.080) (0.070) (0.079) (0.098) (0.078)
Other controls? Yes Yes Yes Yes Yes Yes Yes Yes Yes
Fixed effects PUMAYR PUMAYR PUMAYR PUMAYR PUMAYR PUMAYR PUMAYR PUMAYR PUMAYR
Observations 19,676 42,262 59,580 55,170 56,664 57,852 27,349 14,690 19,619
R-squared 0.646 0.71 0.707 0.714 0.687 0.728 0.679 0.768 0.719
Initial land useParking availableIntra-MSA location Rail type

40
Table 9: Retail employment near stations, by intra-MSA location and MSA
Robust standard errors shown in parentheses. All regression include controls for ltotemp92, commercial,
industrial, distance to CBD, distance to highway, distance to other stations, pop density, % housing pre-
1940, ln(income). *** p<0.01, ** p<0.05, * p<0.1
Dep var: ln(Retail emp/sq mi)
LA SAC SD SF/SJ
<5mi CBD >5mi CBD <5mi CBD >5mi CBD <5mi CBD >5mi CBD <5mi CBD >5mi CBD
(1) (2) (3) (4) (5) (6) (7) (8)
station 0.937*** 0.970*** 0.179 -0.574 0.310 -0.094 0.639*** 0.045
(0.109) (0.144) (0.330) (0.370) (0.328) (0.176) (0.113) (0.210)
newstation -0.193** -0.932*** -0.054 1.019*** 0.450*** 0.407*** -0.750*** -0.291**
(0.084) (0.128) (0.274) (0.320) (0.132) (0.100) (0.070) (0.138)
poststation -0.441*** 0.178** -0.361 -0.835** -0.542* 0.130 -0.315*** 0.845***
(0.085) (0.085) (0.312) (0.348) (0.302) (0.162) (0.109) (0.195)
Other controls Y Y Y Y Y Y Y Y
FE Y Y Y Y Y Y Y Y
Observations 9,288 26,116 1,098 2,888 1,504 5,282 7,794 7,976
R-squared 0.656 0.743 0.633 0.691 0.633 0.626 0.663 0.671
41
Table 10: Predicted retail employment density near stations, by intra-MSA location
Top row shows mean retail employment density (per square mile), all neighborhoods and by distance
to CBD. Lower three rows calculate predicted retail employment density for areas around stations,
using regression coefficients from Table 2, Column 4, and Table 8, Columns 1-2.
All areas <5 mi CBD >5 mi CBD
Avg emp/sq mi 797.6 1,351.6 542.1
Predicted emp, old stations 1,047.3 1,662.4 748.6
Predicted emp, new stations, pre 934.8 1,625.9 610.3
Predicted emp, new stations, post 933.2 1,244.8 705.2

42
Appendix Table A: Retail employment density, one-half mile around stations
Robust standard errors shown in parentheses. *** p<0.01, ** p<0.05, * p<0.1
Dep var: ln(Retail emp/sq mi)
(1)
station 1.251*** 1.447*** 1.242*** 0.243***
(0.018) (0.025) (0.052) (0.036)
newsta -0.329*** -0.256*** -0.0718***
(0.030) (0.033) (0.023)
post_sta 0.202*** -0.038
(0.045) (0.030)
distcbd 0.00753***
(0.002)
ldisthwy -0.0678***
(0.011)
ltotempd 0.795***
(0.005)
commercial 0.876***
(0.008)
industrial -0.0216**
(0.010)
oldnear3 0.0143***
(0.002)
lpopd 0.270***
(0.005)
loldhsg 0.0561***
(0.005)
linc -0.130***
(0.013)
Fixed effects PUMA-year PUMA-year PUMA-year PUMA-year
Observations 62,370 62,370 62,370 61,946
R-squared 0.37 0.371 0.372 0.755