Embed Size (px)
Citation preview
1
ABSTRACT
Cosmetics containing rhododendrol (RD) were voluntarily recalled after
incidents of leukoderma related to their use. Users reported using up to five different
RD products by layered application. It was hypothesized that layered application
increased the skin permeation of RD, resulting in leukoderma. The role of tyrosinase
inhibition and melanocyte cytotoxicity of RD was implicated, however, from a
pharmaceutical point of view, these provide limited insights on the influence of
formulations, and in-use conditions on skin permeation of RD.
In the 1st Chapter, we investigated the effects of layered application,
formulations, and their components on the skin permeation of cosmetics containing RD.
Experiments were designed to simulate actual in-use conditions, such as varying
application volumes, physical mixing of formulations, sequence of cosmetics
application and time interval between applications, to establish their effect on
permeation. Milk and lotion RD-containing cosmetics (2%), 1% aqueous RD, and
preparations of formulation components were applied as the first or second layers as
finite doses of 10 or 20 µL/cm2. Permeation experiments were performed through
excised porcine ear skin using Franz diffusion cells. Cosmetics applied by layered
application exhibited lower skin permeation of RD compared with a single application
despite having the same application dose. High initial volume (20 µL at 0 or 5 s) did
not exhibit any significant reduction in the permeation of RD. Formulations and their
components reduced RD permeation, probably due to changes in thermodynamic
activity of the active component. Layered application, formulation components,
application volume, time interval and sequence of application had significant influences
on the skin permeation of the active component.
2
Rapid evaporation of solvents occurs from topically applied formulations in
finite dose systems which alters the vehicle composition. The finite dose experiment
represents clinical use wherein depletion of dose and evaporation of excipients may
occur. In the 2nd Chapter, we attempted a mathematical approach for predicting skin
permeation and concentration of RD, from complex vehicle-based formulations applied
as finite dose. In vitro skin permeation and concentration studies of RD were conducted
from formulations containing water and polyols with concentrations ranging from 10 –
100% under infinite and finite dose conditions. Observed data for skin permeation and
the viable epidermis and dermis (VED) concentration of RD were estimated by the
differential equations under Fick’s second law of diffusion together with water
evaporation kinetics and changes in the partition coefficient from vehicles to the
stratum corneum. As a result, a goodness-of-fit was observed allowing accurate
estimation of skin permeation and VED concentration of RD.
Finally, we investigated the effects of layered application and other finite dose
conditions using an artificial membrane, Strat-M®. The use of artificial membranes
designed to mimic animal skin offer a competent alternative to estimate skin permeation.
However, its usefulness in the assessment of permeation from complex formulations
under in-use conditions has not been clarified. Assessment of dermal absorption is
ascribed to be performed using porcine skin, hence, it is imperative to establish the
equivalency of Strat-M. Permeation of drugs from formulation of high polyol content
and residual formulation is increased with an increase in the permeability of the
artificial membrane. Barrier integrity of Strat-M is disrupted by high concentration of
polyol as evidenced by reduction in electrical impedance. The use of Strat-M in the
assessment of dermal permeation may be limited to finite dose conditions and not in
concurrent application of formulations and infinite dose conditions.
3
GENERAL INTRODUCTION
Functional cosmetics typically contain an active component (quasi-drug) that
serves as the basis for their marketing claims. Exposure to cosmetic active components
could induce forms of localized skin toxicities. In recent times, cosmetics containing
rhododendrol (RD) were voluntarily recalled after incidents of leukoderma related to
their use.[1] Users reported using up to five different RD-containing products
concurrently suggesting a link between the incident and the applied dose and cosmetics
use habits.[2] RD was shown to exhibit melanocyte cytotoxicity at high concentrations.
[3-6] However, from a pharmaceutical point of view, it provides very limited insights
into the influence of formulations and the manner of cosmetics application on the skin
permeation of actives. Evaluation methods based upon appropriate skin models and in-
use conditions could confirm the dose-dependent toxicity of compounds at the site of
action. [7-12] The efficacy and safety of cosmetics and locally acting drugs applied on
skin are determined by their distribution into its intended site of action, the viable
epidermis and dermis (VED). [13-18]
Numerous reports have described techniques to assess the permeation of
cosmetic active compounds through the skin. [18-22] Evaluation of dermal permeation is
typically conducted under finite and infinite experiments. Finite dose experiment is
supposed to best represent its clinical use (i.e., in-use conditions) wherein depletion of
dose and evaporation of excipients may occur. On the other hand, an infinite dose
experiment is characterized by a non-depleting dose and allows estimation of
permeation parameters. Under in-use conditions, rapid evaporation of solvents occur
which significantly alter the effective diffusion area of the applied formulation and the
composition of the resulting residual formulation after formulations are applied on the
skin. [23-25] The impact of vehicle dynamics on the skin permeation can be realistically

4
clarified by simulating the residual formulation based on evaporation kinetics from
applied formulations. To estimate dermal absorption, experimental conditions should
be as close as possible to real exposure conditions reflecting in-use conditions such as
the use of finite dose, and periods of exposure. [26-27] Similarly, the appropriate conduct
of in vitro dermal absorption studies must encompass dose, and vehicle/formulation
conditions should represent the in-use conditions. Experimental conditions for in
vitro dermal absorption studies of cosmetics for dose or amount applied during use (i.e.,
layered application), formulation (e.g., finished cosmetics products, complex vehicles),
and barrier integrity must be met. [20-23]
Methods to assess dermal permeation include mathematical models aimed at
predicting skin or VED concentration of chemicals. It entails the understanding of the
factors (e.g., diffusion and partition coefficient, solubility parameters) that influence
skin permeation. [18,28-32] The inclusion of vehicle dynamics is an approach viewed to
enhance the accuracy of mathematical models in predicting skin or VED concentration
from cosmetic formulations. Another method employed to estimate permeation of
drugs and safety assessments is the use of skin membranes and artificial membranes
(e.g., Strat-M®, silicone membrane). [33-40] However, the usefulness of artificial
membrane, Strat-M®, has not yet been verified in the context of cosmetics in-use
conditions. Assessment of dermal absorption of cosmetic actives is ascribed to be
performed using porcine skin as it resembles closely human skin properties such as
permeability to chemicals, thickness and lipid composition. [41-43] Hence, being the
membrane of choice, it is imperative to understand the similarities and establish
equivalency and relationship between Strat-M and porcine skin in terms of membrane
characteristics confirm its applicability in evaluating permeation of cosmetic actives.
5
CHAPTER 1
Effect of layered application on the skin permeation of a cosmetic active
component, rhododendrol
1.1 Introduction
Cosmetics containing RD were voluntarily recalled from the market after
incidents of leukoderma related to their use. Users who experienced RD-induced
leukoderma reported using up to five different RD-containing products concurrently
suggesting a link between the incident and the applied dose of cosmetics. [2] Habits
related to cosmetics use along with the amount of cosmetics applied may have
predisposed users to product-use related toxicities. Sasaki et al. reported that RD
exhibits cytotoxicity against cultured human melanocytes at high concentrations. [3] In
fact, skin permeation and skin concentration of topically applied drugs and cosmetics
often determine their efficacy or toxicity. [16] It was hypothesized that layered
application of RD, that is, increasing the number of applied products on the skin,
increased the skin permeation of RD, resulting in leukoderma. [1] Several studies
attempted to clarify the cause of leukoderma and suggested the role of tyrosinase
inhibition and melanocyte cytotoxicity of RD. [44-46] From a pharmaceutical point of
view, these results provide very limited insights into the influence of formulations and
their components, and the manner of cosmetics application (i.e., single or layered
application, sequence of product application, application time interval, etc.) on the skin
permeation of cosmetic active components.
Layered application is described as the application of a second or succeeding
dose (layer) of cosmetics on the same region after an initial application. Quasi-drug
formulated as medicated cosmetics are pharmacologically or cosmetologically active,
and they are commonly sold in sets to elicit their purported effects synergistically.

6
These cosmetics are in fact recommended to be applied sequentially and in layers.
Moreover, cosmetics have additional esthetic requirements of the active components
and vehicles where excipients are added for reasons unrelated to dermal permeation yet
may have effects on the penetration of the active components. [47]
A previous work revealed that RD permeation after layered application resulted
in a dramatic decrease in its permeation. [1] Cumulative amounts of RD permeated in
infinite doses (1.0 mL/1.77 cm2) of aqueous RD was much higher than those of finite
doses (10 and 20 µL/cm2) due to depletion of RD in finite dose models. Interestingly,
layered application (20 µL/cm2 2) of RD in a lotion formulation resulted in lower
permeation than a single application (40 µL/cm2) despite having the same total volume
applied. The mechanistic explanation on how layered application of RD cosmetics
could cause a decreased permeation profile and leukoderma remains unresolved.
Although numerous studies on cosmetics safety and testing procedures have been
performed, [48-49] the safety of practicing layered application as in most cosmetics and
topical drugs have never been investigated before. Furthermore, no studies have
evaluated the actual manner (layered application) in which consumers use these
medicated cosmetics. Also, there are no studies clearly depicting a mechanism on how
actives would permeate following layered application.
Recently, actual consumption of cosmetic products reflecting Japanese
cosmetics habits has been reported, prompting the need to conduct risk assessments of
cosmetics products and their reported consumption dose. Also, the reported habit of
using up to 5 different RD products simultaneously indicated that the amount of
cosmetics consumed may be a predisposing factor for its toxicity. [2] In addition,
changes in skin permeation of cosmetic active components as influenced by the manner
of application should be considered in the development of cosmetic formulations.
7
In order to accurately assess the safety of chemical substances, it is important
to simulate exposure as realistically as possible. Hence, in the present study,
experiments were designed to simulate actual in-use conditions and multiple “practices”
such as varying sequences of cosmetics application, layered application, varying
application volumes, and time intervals between applications to establish its effect on
the skin permeation of cosmetic active components. In addition, the effects of
formulations and their components on the skin permeation of cosmetic active
component (RD) were also investigated.
1.2 MATERIALS AND METHODS
1.2.1 Chemicals
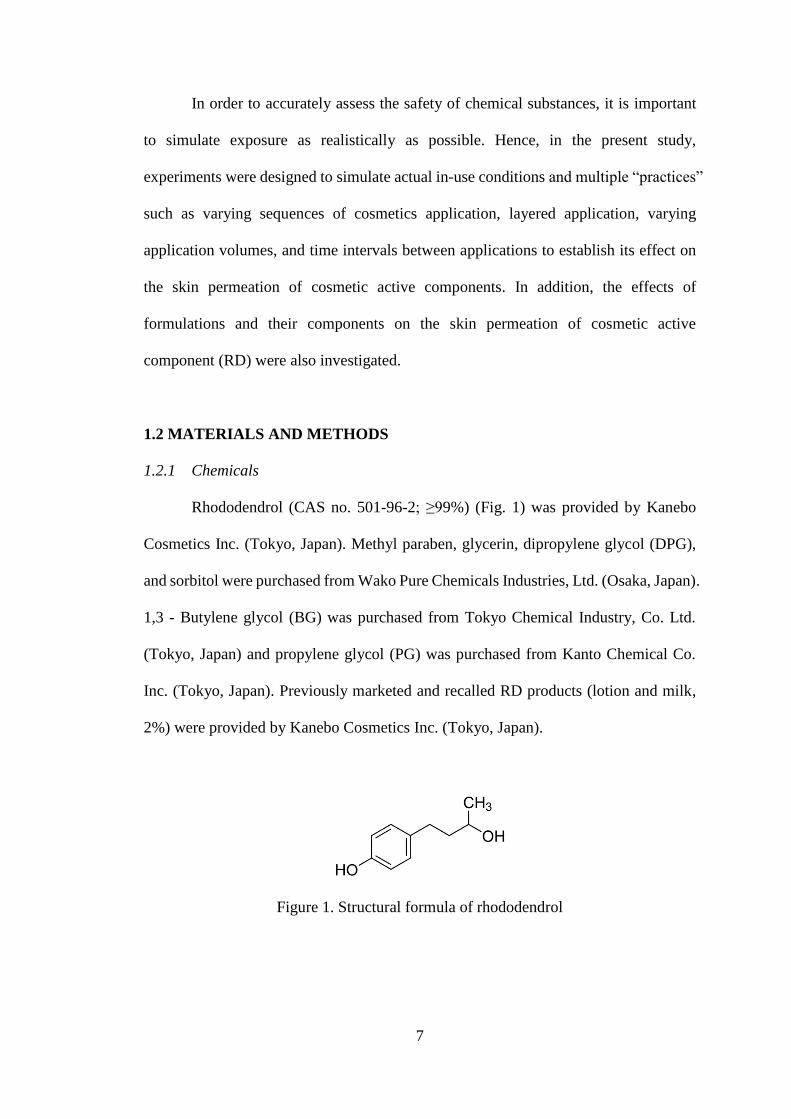
Rhododendrol (CAS no. 501-96-2; ≥99%) (Fig. 1) was provided by Kanebo
Cosmetics Inc. (Tokyo, Japan). Methyl paraben, glycerin, dipropylene glycol (DPG),
and sorbitol were purchased from Wako Pure Chemicals Industries, Ltd. (Osaka, Japan).
1,3 - Butylene glycol (BG) was purchased from Tokyo Chemical Industry, Co. Ltd.
(Tokyo, Japan) and propylene glycol (PG) was purchased from Kanto Chemical Co.
Inc. (Tokyo, Japan). Previously marketed and recalled RD products (lotion and milk,
2%) were provided by Kanebo Cosmetics Inc. (Tokyo, Japan).
Figure 1. Structural formula of rhododendrol
8
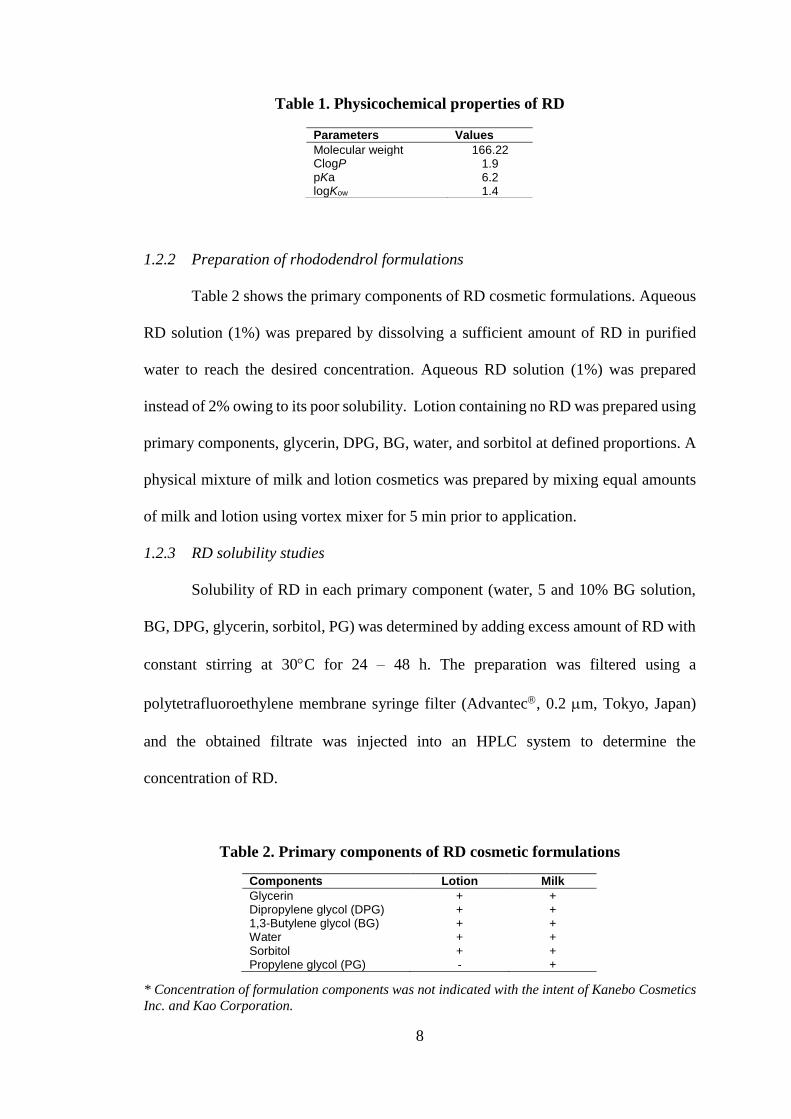
Table 1. Physicochemical properties of RD
1.2.2 Preparation of rhododendrol formulations
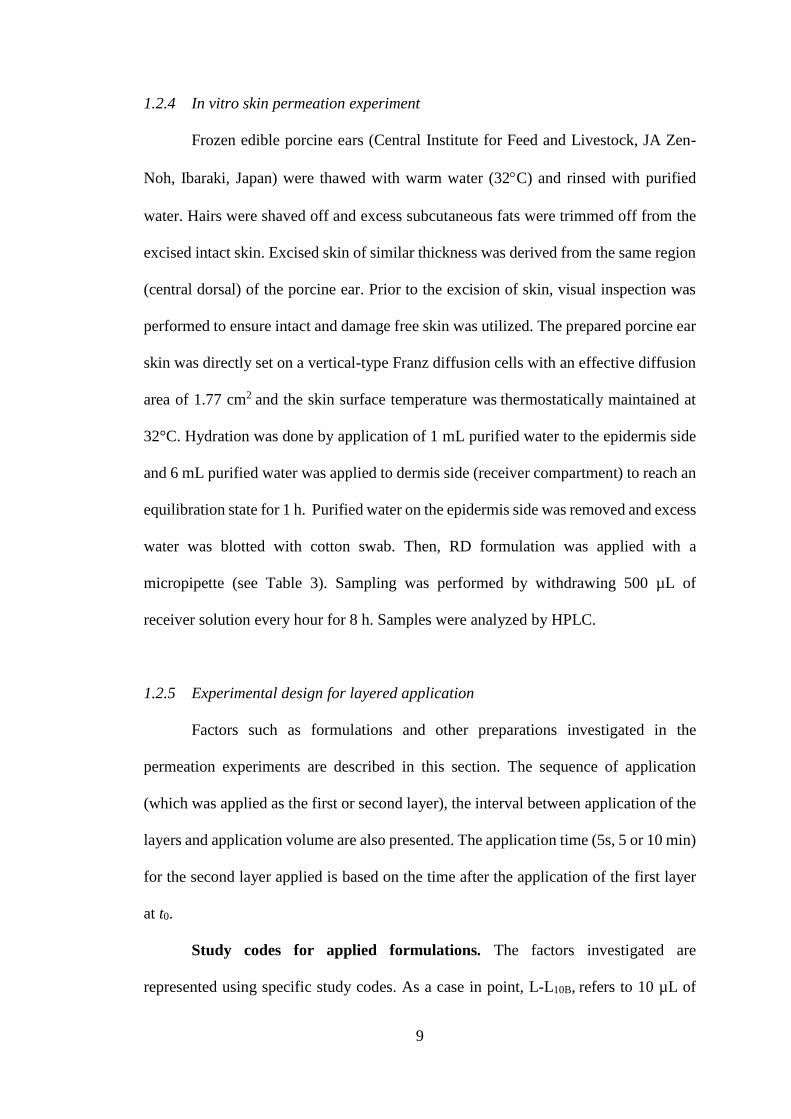
Table 2 shows the primary components of RD cosmetic formulations. Aqueous
RD solution (1%) was prepared by dissolving a sufficient amount of RD in purified
water to reach the desired concentration. Aqueous RD solution (1%) was prepared
instead of 2% owing to its poor solubility. Lotion containing no RD was prepared using
primary components, glycerin, DPG, BG, water, and sorbitol at defined proportions. A
physical mixture of milk and lotion cosmetics was prepared by mixing equal amounts
of milk and lotion using vortex mixer for 5 min prior to application.
1.2.3 RD solubility studies
Solubility of RD in each primary component (water, 5 and 10% BG solution,
BG, DPG, glycerin, sorbitol, PG) was determined by adding excess amount of RD with
constant stirring at 30C for 24 – 48 h. The preparation was filtered using a
polytetrafluoroethylene membrane syringe filter (Advantec, 0.2 m, Tokyo, Japan)
and the obtained filtrate was injected into an HPLC system to determine the
concentration of RD.
Table 2. Primary components of RD cosmetic formulations
* Concentration of formulation components was not indicated with the intent of Kanebo Cosmetics
Inc. and Kao Corporation.
Parameters Values
Molecular weight 166.22 ClogP 1.9 pKa 6.2 logKow 1.4
Components Lotion Milk
Glycerin + + Dipropylene glycol (DPG) + + 1,3-Butylene glycol (BG) + + Water + + Sorbitol + + Propylene glycol (PG) - +
9
1.2.4 In vitro skin permeation experiment
Frozen edible porcine ears (Central Institute for Feed and Livestock, JA Zen-
Noh, Ibaraki, Japan) were thawed with warm water (32C) and rinsed with purified
water. Hairs were shaved off and excess subcutaneous fats were trimmed off from the
excised intact skin. Excised skin of similar thickness was derived from the same region
(central dorsal) of the porcine ear. Prior to the excision of skin, visual inspection was
performed to ensure intact and damage free skin was utilized. The prepared porcine ear
skin was directly set on a vertical-type Franz diffusion cells with an effective diffusion
area of 1.77 cm2 and the skin surface temperature was thermostatically maintained at
32°C. Hydration was done by application of 1 mL purified water to the epidermis side
and 6 mL purified water was applied to dermis side (receiver compartment) to reach an
equilibration state for 1 h. Purified water on the epidermis side was removed and excess
water was blotted with cotton swab. Then, RD formulation was applied with a
micropipette (see Table 3). Sampling was performed by withdrawing 500 µL of
receiver solution every hour for 8 h. Samples were analyzed by HPLC.
1.2.5 Experimental design for layered application
Factors such as formulations and other preparations investigated in the
permeation experiments are described in this section. The sequence of application
(which was applied as the first or second layer), the interval between application of the
layers and application volume are also presented. The application time (5s, 5 or 10 min)
for the second layer applied is based on the time after the application of the first layer
at t0.
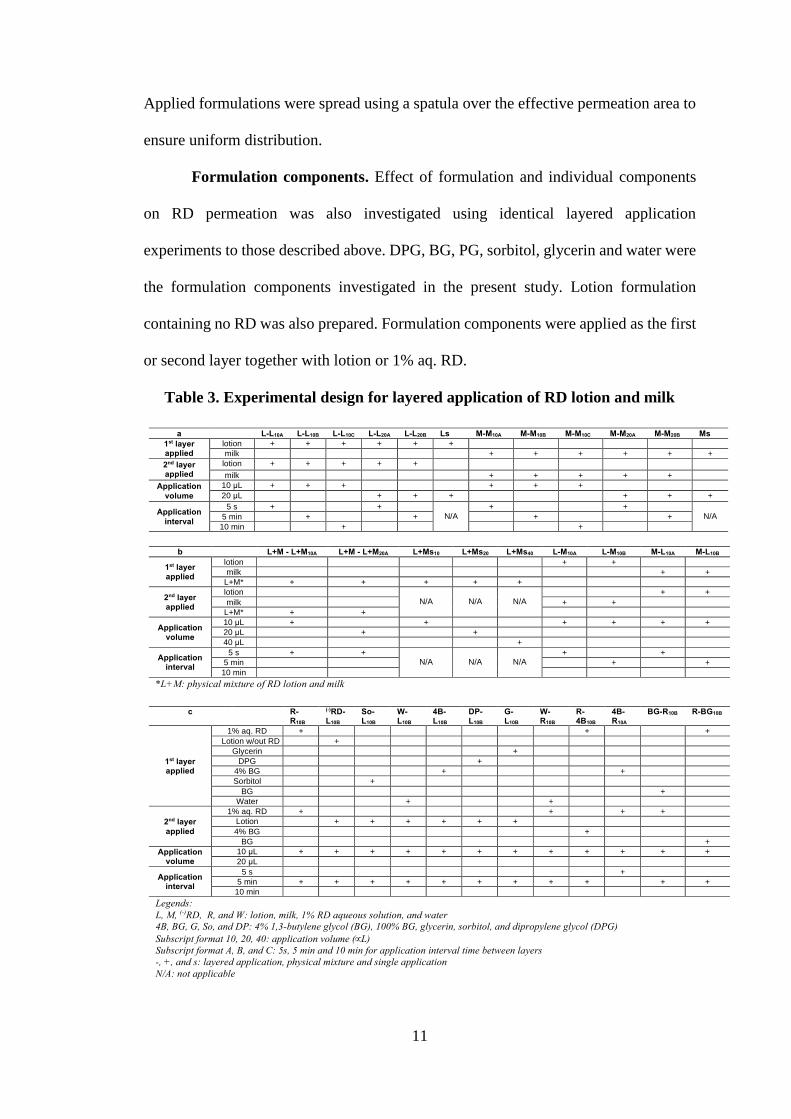
Study codes for applied formulations. The factors investigated are
represented using specific study codes. As a case in point, L-L10B, refers to 10 µL of

10
lotion applied as the first layer onto the prepared porcine ear skin followed by a second
layer of 10 µL of lotion after 5 min. The first code (i.e., L, So, etc.) denotes the
formulation of the first layer followed by a “-” symbol denoting layered application,
then the code for the second layer applied. Applications utilizing mixtures of milk and
lotion include a “+” symbol. Application volumes of 10, 20, and 40 µL are indicated
by 10, 20 and 40 in subscript format, respectively. The application time interval
between layers is indicated by letters - A for 5 s, B for 5 min, and C for 10 min, also in
subscript format. Non-layered or single applications include the letter “s”. Complete
study codes on the factors investigated are listed in Table 3.
Application volume. RD preparations (2% RD lotion and milk formulations,
1% aq. RD) and formulation components were applied as finite doses. For layered
application, 10 and 20 µL/cm2 volumes were used as application doses for the first and
second layers of cosmetics in the experiments. Single application experiments were
carried out at either 20 or 40 µL/cm2.
Sequence of application and physical mixture. In actual use, the application
of cosmetics follows a defined sequence as to which formulation is applied first. Lotion
is often recommended to be applied as a base cosmetic or first layer, whereas milk is
used to a lesser extent. In the present experiment, milk and lotion formulations were
applied either as the first or second layers. Table 3 summarizes the experimental design
for the layered application of cosmetics.
Application time interval. Application time interval for layered application
was observed at 5 s, 5 min, and 10 min. The intended interval time was allowed to
elapse prior to the application of the second layer of cosmetics. Actual interval time of
application among consumers has not been reported, hence, 5s, 5 min and 10 min
application intervals were arbitrarily selected to reveal its effect on RD permeation.
11
Applied formulations were spread using a spatula over the effective permeation area to
ensure uniform distribution.
Formulation components. Effect of formulation and individual components
on RD permeation was also investigated using identical layered application
experiments to those described above. DPG, BG, PG, sorbitol, glycerin and water were
the formulation components investigated in the present study. Lotion formulation
containing no RD was also prepared. Formulation components were applied as the first
or second layer together with lotion or 1% aq. RD.
Table 3. Experimental design for layered application of RD lotion and milk
a L-L10A L-L10B L-L10C L-L20A L-L20B Ls M-M10A M-M10B M-M10C M-M20A M-M20B Ms
1st layer applied
lotion + + + + + +
milk + + + + + +
2nd layer applied
lotion + + + + +
milk + + + + +
Application
volume
10 µL + + + + + +
20 µL + + + + + +
Application
interval
5 s + + N/A
+ + N/A 5 min + + + +
10 min + +
b L+M - L+M10A L+M - L+M20A L+Ms10 L+Ms20 L+Ms40 L-M10A L-M10B M-L10A M-L10B
1st layer applied
lotion + +
milk + +
L+M* + + + + +
2nd layer applied
lotion N/A
N/A
N/A
+ +
milk + +
L+M* + +
Application volume
10 µL + + + + + +
20 µL + +
40 µL +
Application interval
5 s + + N/A
N/A
N/A
+ +
5 min + +
10 min
*L+M: physical mixture of RD lotion and milk
c R-R10B
(-)RD-L10B
So-L10B
W-L10B
4B-L10B
DP-L10B
G-L10B
W-R10B
R-4B10B
4B-R10A
BG-R10B R-BG10B
1st layer applied
1% aq. RD + + +
Lotion w/out RD +
Glycerin +
DPG +
4% BG + +
Sorbitol +
BG +
Water + +
2nd layer
applied
1% aq. RD + + + +
Lotion + + + + + +
4% BG +
BG +
Application volume
10 µL + + + + + + + + + + + +
20 µL
Application interval
5 s +
5 min + + + + + + + + + + +
10 min
Legends:
L, M, (-)RD, R, and W: lotion, milk, 1% RD aqueous solution, and water
4B, BG, G, So, and DP: 4% 1,3-butylene glycol (BG), 100% BG, glycerin, sorbitol, and dipropylene glycol (DPG)
Subscript format 10, 20, 40: application volume (µL)
Subscript format A, B, and C: 5s, 5 min and 10 min for application interval time between layers
-, +, and s: layered application, physical mixture and single application
N/A: not applicable

12
1.2.6 HPLC Analysis
Samples (100 µL) were added with an equal volume of acetonitrile containing
the internal standard (methyl paraben) and centrifuged at 4C for 5 min. Each sample
was analyzed using an HPLC system (Shimadzu Co., Kyoto, Japan) consisting of
column (Inertsil® ODS-3 4.6 mm X 150 mm, GL Sciences Inc., Tokyo, Japan), system
controller (SCL-10A), pump (LC-20AD), degasser (DGU-20A3), auto – injector (SIL-
20A), column oven (CTO-20A), UV detector (SPD-20A), and analysis software (LC
Solution). The column was maintained at 40°C with a flow rate of mobile phase
(acetonitrile: water = 25:75) at 1.0 mL/min. Detection of RD was made at 280 nm.
1.2.7 Measurement of transepidermal water loss (TEWL) at application site
Measurement of water loss at each time-point was performed to estimate
cumulative amount of water which evaporated from the applied formulation.
Evaporation of water from applied formulation (10 µL/cm2) on porcine ear skin was
monitored using Vapo Scan (AS-VT100RS, Asahi Techno Lab., Yokohama, Japan)
over a 20 min observation period. The TEWL measurement was performed at ambient
temperature (20- 25C) and RH of 30 % ± 2.
1.2.8 Statistical Analysis
Experimental data on the cumulative amount of RD permeated were tested for
statistical significance (p < 0.05) using one-way ANOVA and Tukey’s HSD post hoc
analysis. Water loss data were tested for statistical significance (p < 0.05) using
Student’s t-Test.
1.3 Results

13
1.3.1 Effect of layered application, volume, and time interval between applications
on the skin permeation of RD
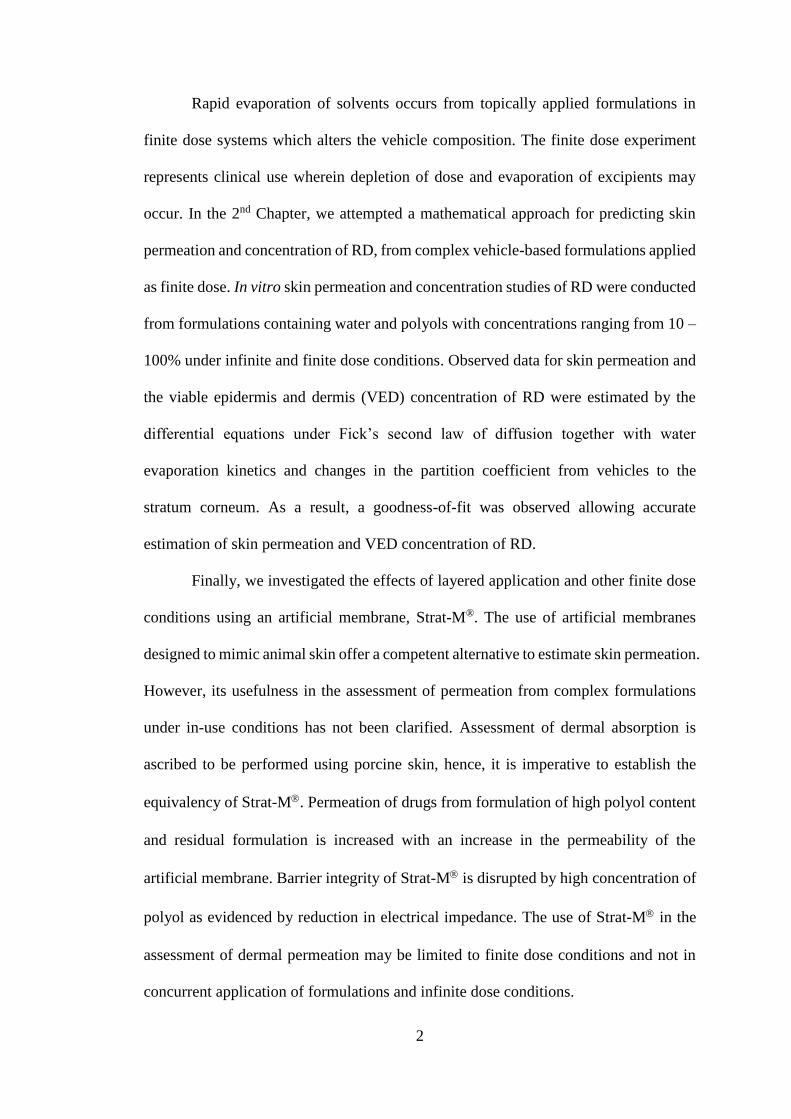
Figures 2A and B show the effect of interval time in layered application of either
lotion or milk formulation, respectively, on the skin permeation of RD. When 40 µL of
lotion in total was applied in portions (20 µL 2, layered application) at time intervals
of 5 s and 5 min, almost the same permeation profile was observed which was
approximately two-fold higher compared with a single application of 20 µL lotion (Fig.
2a). In contrast, a lower RD permeation profile was observed with the layered
applications of 10 µL lotion (10 µL 2) with increasing interval time of 5 s, and 5 and
10 min, accordingly (Fig. 2A). With prolongation of time interval between application,
a greater reduction in RD permeation was observed. A similar tendency was observed
in RD permeations from milk formulations (Fig. 2B). However, the decrease in the RD
permeation from milk formulations (Fig. 2B) was less than those from lotion
applications (Fig. 2A).
Figure 2. Effect of layered application, interval time and initial application volume of
lotion (a) and milk (b) formulations on the skin permeation of RD. a) L-L10A (○), L-
L10B (□), L-L10C (), L-L20A (▲), L-L20B (△), Ls (●); b) M-M10A (○), M-M10B (□), M-
M10C (), M-M20A (▲), M-M20B (△), Ms (●). Each value represents the mean ± S.E. (n
= 3 – 5). *p < 0.05. Study code L-L10A refers to layered application of 10 µL lotion with
5 s interval time of application prior to the second application of lotion (10 µL). A, B
and C represents interval time of application 5 s, 5 min and 10 min, respectively.
Complete details in Table 3 and section 2.4.
14
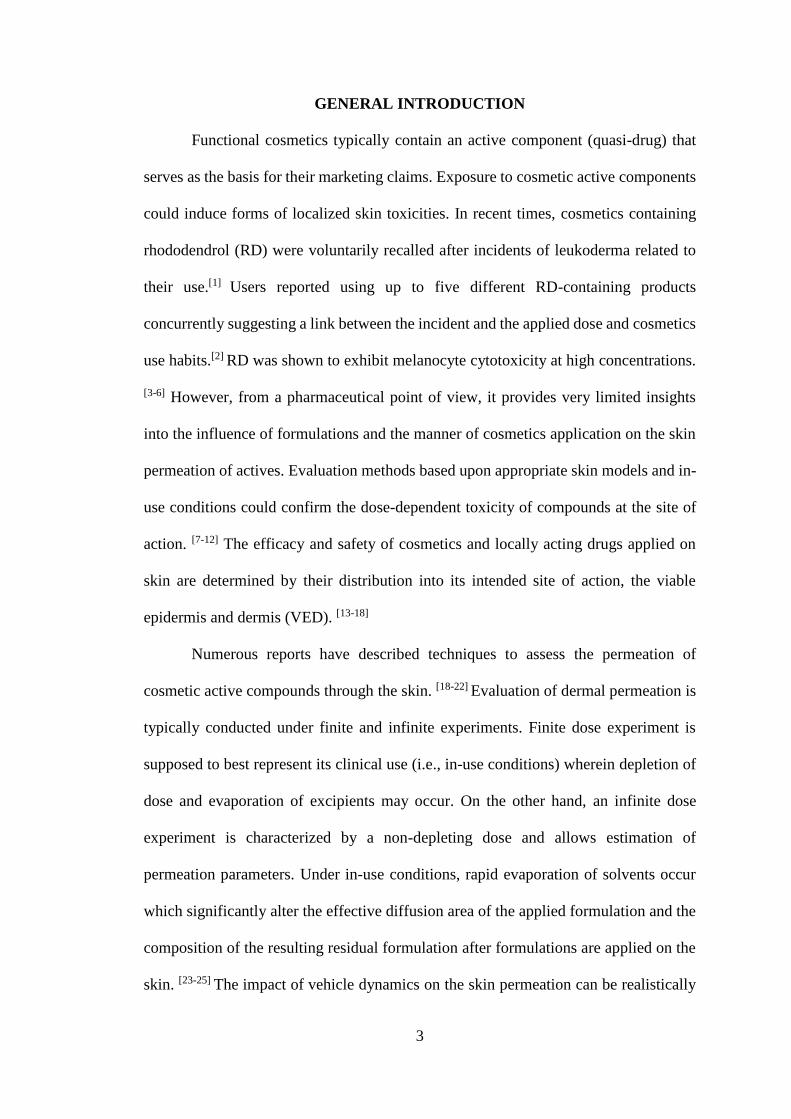
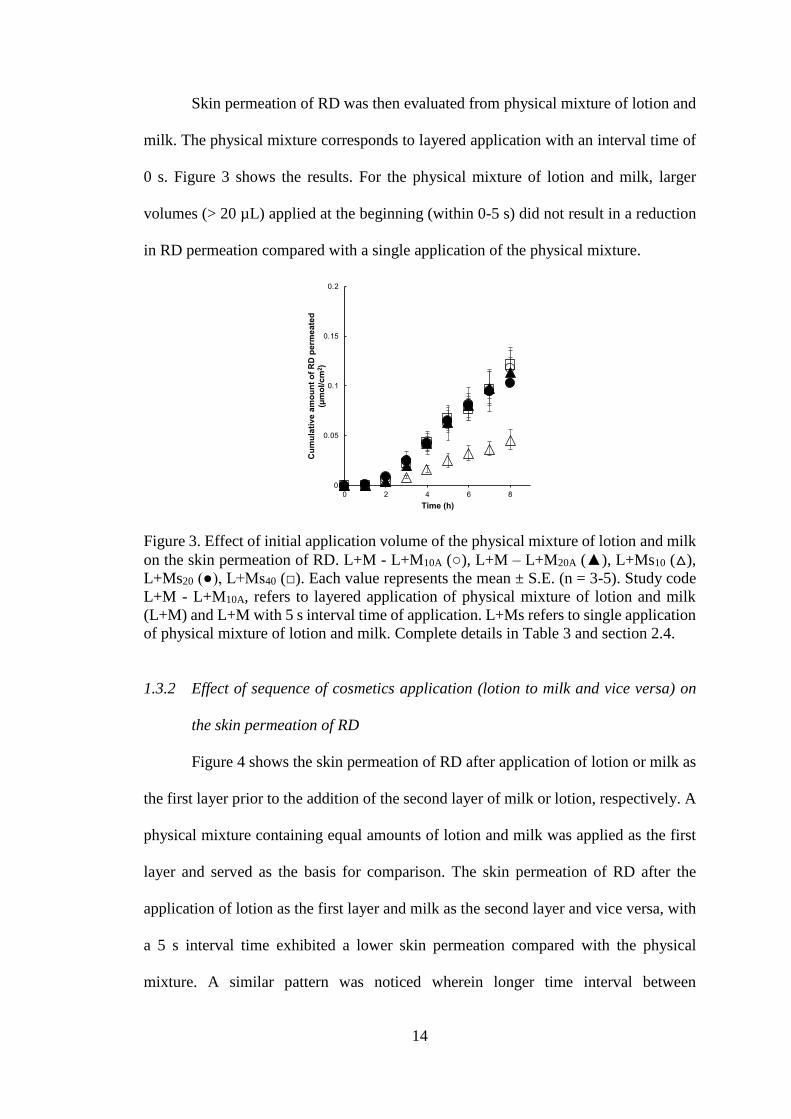
Skin permeation of RD was then evaluated from physical mixture of lotion and
milk. The physical mixture corresponds to layered application with an interval time of
0 s. Figure 3 shows the results. For the physical mixture of lotion and milk, larger
volumes (> 20 µL) applied at the beginning (within 0-5 s) did not result in a reduction
in RD permeation compared with a single application of the physical mixture.
Figure 3. Effect of initial application volume of the physical mixture of lotion and milk
on the skin permeation of RD. L+M - L+M10A (○), L+M – L+M20A (▲), L+Ms10 (△),
L+Ms20 (●), L+Ms40 (□). Each value represents the mean ± S.E. (n = 3-5). Study code
L+M - L+M10A, refers to layered application of physical mixture of lotion and milk
(L+M) and L+M with 5 s interval time of application. L+Ms refers to single application
of physical mixture of lotion and milk. Complete details in Table 3 and section 2.4.
1.3.2 Effect of sequence of cosmetics application (lotion to milk and vice versa) on
the skin permeation of RD
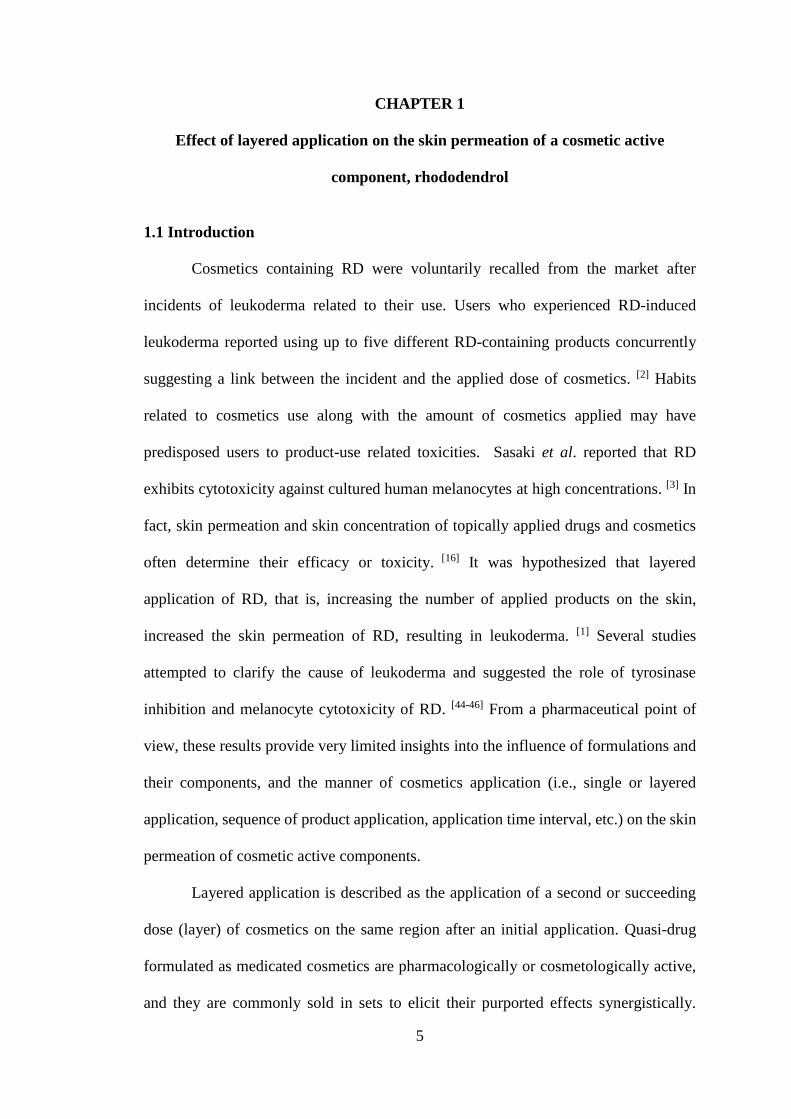
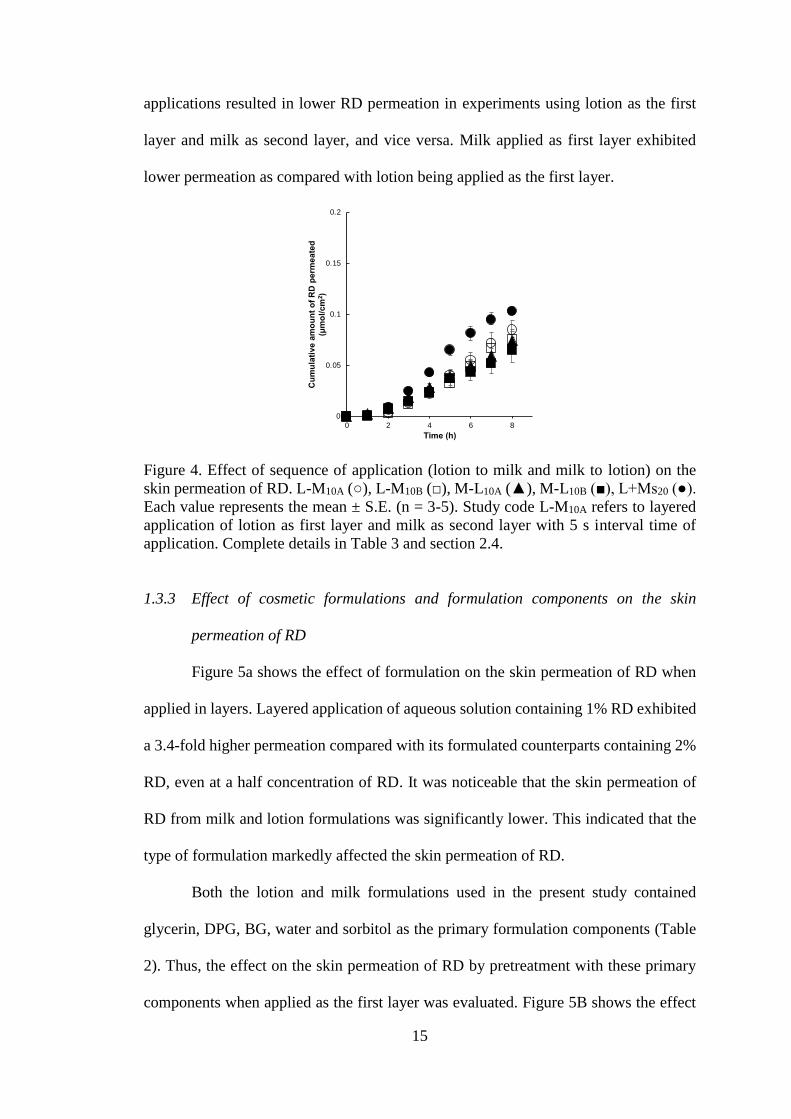
Figure 4 shows the skin permeation of RD after application of lotion or milk as
the first layer prior to the addition of the second layer of milk or lotion, respectively. A
physical mixture containing equal amounts of lotion and milk was applied as the first
layer and served as the basis for comparison. The skin permeation of RD after the
application of lotion as the first layer and milk as the second layer and vice versa, with
a 5 s interval time exhibited a lower skin permeation compared with the physical
mixture. A similar pattern was noticed wherein longer time interval between
15
applications resulted in lower RD permeation in experiments using lotion as the first
layer and milk as second layer, and vice versa. Milk applied as first layer exhibited
lower permeation as compared with lotion being applied as the first layer.
Figure 4. Effect of sequence of application (lotion to milk and milk to lotion) on the
skin permeation of RD. L-M10A (○), L-M10B (□), M-L10A (▲), M-L10B (■), L+Ms20 (●).
Each value represents the mean ± S.E. (n = 3-5). Study code L-M10A refers to layered
application of lotion as first layer and milk as second layer with 5 s interval time of
application. Complete details in Table 3 and section 2.4.
1.3.3 Effect of cosmetic formulations and formulation components on the skin
permeation of RD
Figure 5a shows the effect of formulation on the skin permeation of RD when
applied in layers. Layered application of aqueous solution containing 1% RD exhibited
a 3.4-fold higher permeation compared with its formulated counterparts containing 2%
RD, even at a half concentration of RD. It was noticeable that the skin permeation of
RD from milk and lotion formulations was significantly lower. This indicated that the
type of formulation markedly affected the skin permeation of RD.
Both the lotion and milk formulations used in the present study contained
glycerin, DPG, BG, water and sorbitol as the primary formulation components (Table
2). Thus, the effect on the skin permeation of RD by pretreatment with these primary
components when applied as the first layer was evaluated. Figure 5B shows the effect
0
0.05
0.1
0.15
0.2
0 2 4 6 8
Cu
mu
lati
ve
am
ou
nt
of
RD
pe
rme
ate
d
(µm
ol/c
m2)
Time (h)

16
of pretreatment with primary components applied as the first layer on RD permeation.
Formulation of lotion without RD (containing primary components only) was applied
as the first layer and followed by application of lotion with 5 min interval resulted to
the greatest reduction in the skin permeation of RD. Higher RD permeations were
observed when sorbitol and water were applied as the first layers. On the other hand,
decreased RD permeation was observed when BG, DPG and glycerin were applied as
the first layers compared with sorbitol and water.
Figure 5C shows the skin permeation of RD for the two cases of treatment. An
aqueous solution of RD was applied as the first layer followed by application of the
same aqueous RD solution, 4% BG or BG for the first case. Aqueous RD solution,
water or BG solution was applied as the first layer and followed by application of
aqueous RD solution at an interval of 5 min, for the second case. The second layer
applied, 4% BG or BG markedly decreased RD permeation in contrast with the second
application of aqueous RD solution. Of note, low to no skin permeation of RD was
observed with the application of BG as first and second layer.
Figure 5. Effect of formulations and formulation components on the skin permeation of
RD. a) R-R10B (●), L-L10B (□), M-M10B (), (-)RD-L10B (▲); b) So-L10B (○), W-L10B (■),
4B-L10B (), DP-L10B (△), G-L10B (□), (-)RD-L10B (▲); c) R-R10B (●), W-R10B (), R-
4B10B (□), 4B-R10A (▲), BG-R10B (△), R-BG10B (○). Each value represents the mean ±
S.E. (n = 3-5). *p <0.05. Study code So-L10B refers to layered application of sorbitol as
first layer and lotion as second layer with 5 s interval time of application. 4B, BG, G,
and DP refers to 4% 1,3-butylene glycol (BG), 100% BG, glycerin, and dipropylene
glycol (DPG), respectively. Complete details in Table 3 and section 2.4.
17
1.3.4. Transepidermal water loss at application site after application of lotion and
milk
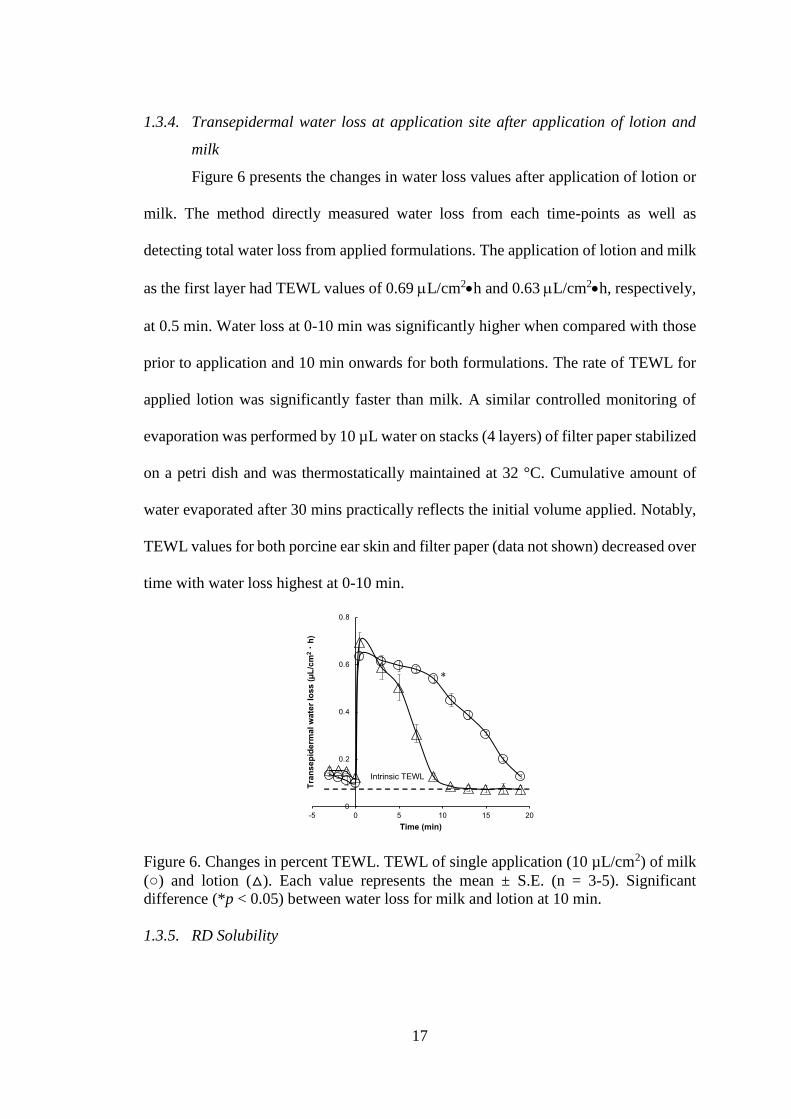
Figure 6 presents the changes in water loss values after application of lotion or
milk. The method directly measured water loss from each time-points as well as
detecting total water loss from applied formulations. The application of lotion and milk
as the first layer had TEWL values of 0.69 L/cm2h and 0.63 L/cm2h, respectively,
at 0.5 min. Water loss at 0-10 min was significantly higher when compared with those
prior to application and 10 min onwards for both formulations. The rate of TEWL for
applied lotion was significantly faster than milk. A similar controlled monitoring of
evaporation was performed by 10 µL water on stacks (4 layers) of filter paper stabilized
on a petri dish and was thermostatically maintained at 32 °C. Cumulative amount of
water evaporated after 30 mins practically reflects the initial volume applied. Notably,
TEWL values for both porcine ear skin and filter paper (data not shown) decreased over
time with water loss highest at 0-10 min.
Figure 6. Changes in percent TEWL. TEWL of single application (10 µL/cm2) of milk
(○) and lotion (△). Each value represents the mean ± S.E. (n = 3-5). Significant
difference (*p < 0.05) between water loss for milk and lotion at 10 min.
1.3.5. RD Solubility
18
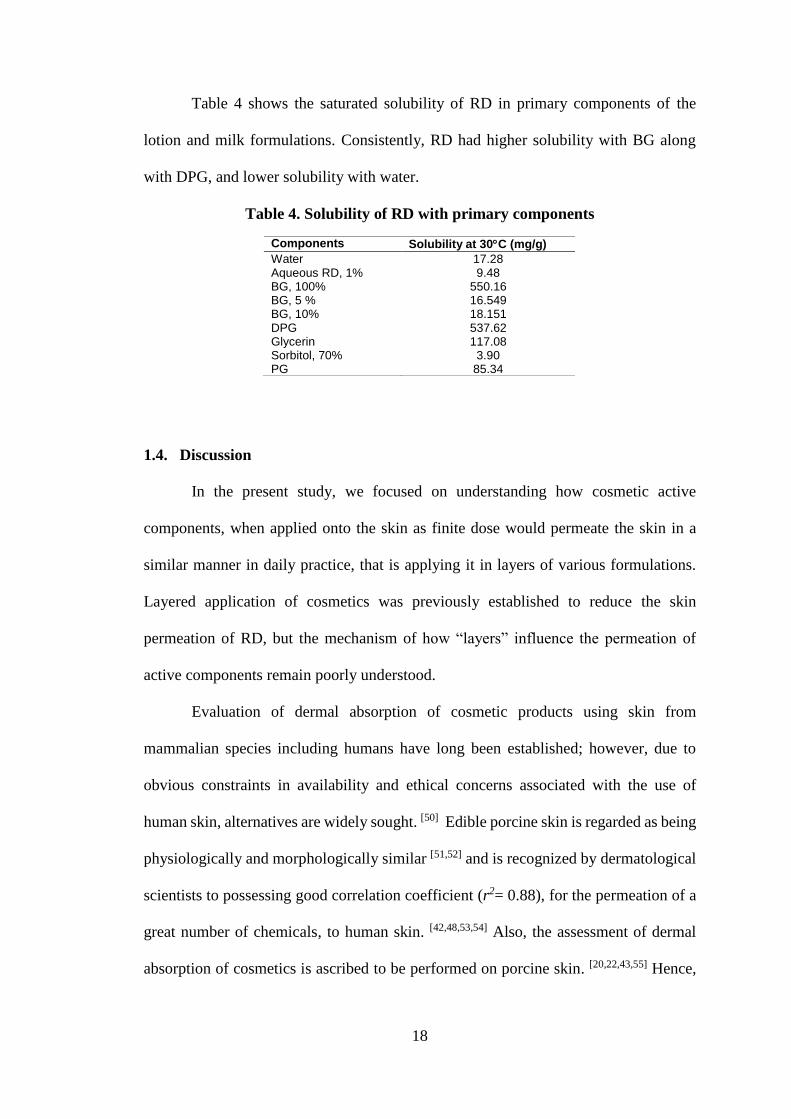
Table 4 shows the saturated solubility of RD in primary components of the
lotion and milk formulations. Consistently, RD had higher solubility with BG along
with DPG, and lower solubility with water.
Table 4. Solubility of RD with primary components
1.4. Discussion
In the present study, we focused on understanding how cosmetic active
components, when applied onto the skin as finite dose would permeate the skin in a
similar manner in daily practice, that is applying it in layers of various formulations.
Layered application of cosmetics was previously established to reduce the skin
permeation of RD, but the mechanism of how “layers” influence the permeation of
active components remain poorly understood.
Evaluation of dermal absorption of cosmetic products using skin from
mammalian species including humans have long been established; however, due to
obvious constraints in availability and ethical concerns associated with the use of
human skin, alternatives are widely sought. [50] Edible porcine skin is regarded as being
physiologically and morphologically similar [51,52] and is recognized by dermatological
scientists to possessing good correlation coefficient (r2= 0.88), for the permeation of a
great number of chemicals, to human skin. [42,48,53,54] Also, the assessment of dermal
absorption of cosmetics is ascribed to be performed on porcine skin. [20,22,43,55] Hence,
Components Solubility at 30C (mg/g)
Water 17.28 Aqueous RD, 1% 9.48 BG, 100% 550.16 BG, 5 % 16.549 BG, 10% 18.151 DPG 537.62 Glycerin 117.08 Sorbitol, 70% 3.90 PG 85.34

19
edible porcine skin was used to evaluate the effect of cosmetics layered application on
the skin permeation of RD.
The results in the present study implicated several factors that can influence the
permeation of an active component. Since the application volume of 10 µL/cm2 was
sufficient to uniformly cover the effective skin permeation area, the application
volumes of 10 and 20 µL/cm2 were used to elucidate the effect of layered application
on the skin permeation of RD. Of note, the application of lotion as the first layer with a
longer interval time between applications, 5 and 10 min, exhibited a significant
reduction in RD permeation (Fig. 2a). Moreover, short application intervals (5 s) of
cosmetics yielded similar results as for permeation after a single application (Fig. 2a,
b). On the other hand, permeation data from experiments employing large volumes
applied provide evidence suggesting that large volumes (20 µL) of cosmetics applied
at the beginning of the permeation experiment resulted in the higher permeation of the
active components (Fig. 2a and b).
When layered application was performed with different formulations, changes
in the composition of the first and second layer occurred upon mixing at the application
site. Physical mixing or addition of other components to formulations comprising oil-
in-water or water-in-oil emulsion might cause instability. Even when the same
formulation is applied, the composition of the first layer becomes non-identical with
the second layer due to the evaporation of solvents (Fig. 3).
In general, elevated skin temperature enhances drug permeation primarily
related to increased diffusivity attributed to the increase in the fluidity of stratum
corneum lipids leading to increase (expansion) in intercellular space. [56,57] However,
the effect of temperature on evaporation and permeation of actives in layered
application is not clearly understood. Water loss data revealed that water evaporation
20
occurred immediately after application of the cosmetics regardless of the type of
formulation. High evaporation rates take place within 0- 10 min (Fig 6) suggesting rapid
supersaturation of the applied layer and effectively reduced permeation of active
component possibly due to crystallization. [58,59] Although polyols such as DPG, BG
and glycerin in the formulation are known chemical enhancers for topically applied
drugs by increasing their partition coefficient from the formulation into the stratum
corneum, permeation of RD after layered application of 10 µL/cm2 exhibited lower
permeation compared with a single application despite having the same application
volume (Fig. 4). Moreover, an increase in the concentration of non-volatile components
such as DPG, BG and glycerin occurs in the residual phase after the high evaporation
rate of water at the time of application. The influence of formulation components on
the skin permeation of the active component was confirmed in terms of its effects on
solubility and consequential RD permeability. BG (4%) and BG (100%) applied as the
first layers resulted to a reduction in RD permeation by 1.6-fold and 80-folds,
respectively (Fig. 5). Saturated solubility of RD in BG, DPG and glycerin was much
higher compared with water (Table 4). A two-fold increase in RD solubility in water in
the presence of 5 – 10% BG and a 58-fold increase with 100% BG was observed. An
increase in concentration of polyols is presupposed to promote the solubility of the
permeating RD in the residual phase, thereby reducing its thermodynamic activity and
consequently the skin permeation of RD. This concept was emphasized by Lane and
colleagues describing the importance of high amount of solvent (i.e., water) in the
residual phase that should remain on the skin in order to maintain the thermodynamic
activity as high as possible to aid in the permeation of the active component. [60]
Similarly, the significantly higher solvent evaporation from the lotion could result in an
increase in the concentration of RD and/or produce a supersaturated state in formulation
21
which is a possible mechanism of its increased permeation after a single application
and large application volumes (20 µL/cm2). [61] Differences in the skin permeation of
model compounds in previous studies were attributed to changes in drug solubility/
thermodynamic activity in the residual phase induced by the evaporation of solvents
(i.e., water) from the formulation. [61,62]
The sequence of application affects the skin permeation wherein milk applied
as the first layer resulted in decreased skin permeation of RD (Fig. 4). Lotion, on the
other hand, having more water content than milk, produced a less viscous mixture
(lower viscosity) rendering RD with a better diffusion environment and subsequently
higher permeation extent. [63] Rheological and mechanical properties of formulation are
known to affect penetration of actives wherein increase in viscosity results in a
reduction in permeation. [64-66]
With a lotion formulation containing no RD applied it as the first layer, it was
found that components of lotion formulation altogether resulted in a 2.6-fold decrease
in RD permeation (Fig. 5). Furthermore, formulation components were prepared
reflective of their respective concentrations in the formulation and applied as the first
layers. Formulation components, 4% BG, DPG, and glycerin resulted in 1.3-, 1.5-, and
1.6- fold decrease in RD permeation, respectively (Fig. 5a). In addition, milk
formulation contains an exclusive component, PG. PG was previously reported to
rapidly permeate, thereby promoting crystallization of the active components further
supporting the lower permeation of RD in milk as opposed to lotion. [67] Our findings
indicate that to minimize undesired permeation profiles of RD after layered application,
lotion should be applied as the first layer with a short interval (<1 min) with respect to
its second layer. In addition, it is desirable to have a large initial volume to be applied
rather than distantly spaced and applied in divided doses. The design of the
22
formulations should be reviewed with respect to the active component’s solubility and
its consequential thermodynamic activity.
As calculated from the 90th percentile of respondents, the amount of lotion used
per application, 1.62 g [2] and total facial skin area, 565 cm2 [21] suggested that
approximately 2.8 µL/cm2 of lotion is the practical amount used per application. Water
evaporation rate constant (kevap) was reported to be 2340 10-10 ms-1. [68] This would
theoretically mean that about 70% of the water in a topically applied formulation at 10
µL/cm2 would evaporate in 5 min, and about 65% of the water from an applied
formulation at 20 µL/cm2s would remain. Thus, in the case of application with doses
lower than 10 µL/cm2, layered application would induce reduction in the skin
permeation of RD.
The need for ensuring safety of cosmetic products was recently raised by a
group of cosmetic scientists as a large population of women utilize these products on a
daily basis over an extended period of time. [2] We have established, for the first time,
that layered application and components of a formulation can be investigated with
regard to their influence on the skin permeation of actives thus, assessing safety of
cosmetics used concurrently or in layers.
1.5. Chapter conclusion
Rapid water loss occurs during the interval time of application between layers.
The increase in the concentration of non-volatile polyol components such as DPG, BG,
and glycerin in the residual phase promotes the solubility of the permeating RD in the
residual phase, thereby reduces its thermodynamic activity and consequently reduces
its permeation. Formulations and their components caused varying reductions in RD
permeation, probably due to decrease in thermodynamic activity of the active
23
component. Layered application, formulation components, application volume, time
interval and sequence of application had significant influences on the skin permeation
of the active component. Layered application of RD-containing cosmetics does not
necessarily increase the amount of RD permeating through the skin and this habit of
use does not directly cause leukoderma.
Moreover, this study established a method of investigating the influence of
formulations and their components on the skin permeation of actives after layered
application.
24
CHAPTER 2
Prediction of skin permeation and concentration of rhododendrol applied as
finite dose from complex cosmetic vehicles
2.1. Introduction
A number of cosmetic formulations are made of quasi-drugs (active compounds)
effectively dissolved in complex vehicle systems. These formulations may contain
components that enhance or decrease the penetration of active compound or other
components. In addition, vehicle composition may change after topical application due
to low amount of formulation applied. Therefore, the permeation of chemicals from a
small amount of topically applied formulation in its in-use conditions is difficult to
simulate experimentally. Evaluation of dermal permeation is typically conducted under
finite and infinite experiments. The finite dose experiment (non-occluded) is supposed
to best represent its clinical use (i.e., in-use conditions) wherein depletion of dose and
evaporation of the excipients may occur. On the other hand, an infinite dose experiment
(occluded) is characterized by a non-depleting dose. Investigating the percutaneous
absorption of chemicals, under its in-use conditions, has been presented with huge
challenges associated with incomplete recovery of the applied formulation, low
extraction ratio of compounds from the skin, and inter-run variabilities for key
parameters (e.g., skin permeability, partition coefficient from vehicle to skin) in such
experiments. [19] To date, no definitive method has been established to address these
challenges.
The penetration of chemicals from aqueous vehicles in infinite dose models
under steady-state conditions (i.e., non-depleting dose) can generally be predicted based

25
on their physicochemical properties. [40,69] However, steady-state conditions are
typically unattainable in finite dose experiments where dose depletion takes place. The
assumption of steady-state conditions does not apply to finite dose experiments since a
high evaporation rate of applied solvents occurs after application. Generally, rapid
evaporation of solvents occurs, which significantly alters the effective diffusion area of
the applied formulation and the composition of the resulting residual formulation after
formulations are applied on the skin. [23-25] In contrast, the majority of studies done to
asses this phenomenon were performed with infinite dose conditions, whereas only a
limited number of studies have been conducted for finite dose conditions. Hence,
caution must be considered in extrapolating data derived from infinite dose experiments
or experiments in which exposure occurs via simple aqueous vehicles, because these
do not necessarily reflect the complexities of most formulations used in practice. In
addition, few studies have been conducted to predict skin permeation in finite dose
settings with the use of actual cosmetic formulations. Appropriate alternatives in
modeling this phenomenon must then be adopted to enhance this point and better
predict skin permeation for in-use conditions. Predicting skin permeation of cosmetic
active compounds in finite dose settings will not only provide insights on local toxicity
but also allow prediction of its systemic absorption.
The influence of in-use conditions such as layered application, evaporation in
formulations, and sequential and concurrent application of polyols with cosmetic
formulation in the skin permeation of cosmetic active compounds has been recently
reported. Layered application of cosmetics and concurrent application of polyols
dramatically reduced the skin permeation of active compounds. [23] Findings from
various reports had diverging claims on the roles of solubility in the skin permeation of
chemicals under finite dose conditions. [47,60,70] Several studies have focused on

26
estimating the amount of chemical permeating through the skin based on the
physicochemical properties of permeants and formulations, yet they neglected the
essential role of evaporation in the actual permeation of chemicals. [40, 71, 72] Furthermore,
little is known about what governs the skin permeation and concentration of chemicals
applied as a finite dose.
The efficacy and safety of cosmetics and locally acting drugs applied on skin
are determined by their distribution into its intended site of action, most likely the viable
epidermis and dermis (VED), and not the stratum corneum (SC). Skin whitening agents
from cosmetics or steroids and antimicrobials from topical medications must be studied
for their distribution and concentration in the VED. [18] The epidermal layers being the
primary site of action for these products offer direct insights for safety assessments or
product optimization. The importance of the concentration in the VED is greater for
cosmetics and topical medications that are capable of causing skin irritation and
inflammation. [73] In recent times, the toxicity of cosmetic active compounds may be
represented well by reports on RD– related leukoderma. In this case, evaluation
methods for dermatological products based upon appropriate skin models and in-use
conditions are important to confirm dose-dependent toxicity of compounds at the site
of action. Determining the distribution of chemicals in the VED is of great significance
for cosmetic formulations, where they are expected to maintain their effective
concentrations. Quantification of permeant concentration in the skin allows a high
precision in predicting their efficacies or toxicities.
Establishing mathematical models aimed at predicting skin or VED
concentration of chemicals entails understanding of the factors that influence skin
permeation. Therefore, this investigation probed the possible role of evaporation and
the composition of residual formulations on the skin permeation and concentration in

27
finite dose conditions. The actual impact of vehicle on the skin permeation and
concentration of the penetrant can be realistically clarified by simulating the residual
formulation based on evaporation kinetics from applied formulations. We employed
various polyols commonly used as solvents in cosmetics and simulated residual
formulations composed of high polyol proportions to reveal its role in the skin
permeation of active compounds. Here, we propose a method that allows investigation
of the permeant disposition from residual formulations encompassing evaporation,
which is a natural process during use. This is an extension of our inquiry on the fate of
cosmetic active compounds from complex formulations in actual product in-use
conditions (e.g., layered application, finite dose conditions). Experiments in steady-
state conditions for simulated residual formulations were conducted to allow surrogate
estimation of skin permeation parameters in finite dose exposures. In the present study,
we attempted to establish a mathematical method in predicting skin permeation and the
concentration of cosmetic active compounds applied in finite dose from a complex
vehicle-based formulation.
2.2.Materials and methods
2.2.1. Materials
RD (CAS no. 501-96-2, 99%) was supplied by Kanebo Cosmetics, Inc.
(Tokyo, Japan). Methylparaben and glycerin were purchased from Fujifilm Wako Pure
Chemicals Industries, Ltd. (Osaka, Japan). Sorbitol, trichloroacetic acid and 1,3-
butylene glycol (BG) were purchased from Tokyo Chemical Industry, Co. Ltd (Tokyo,
Japan) while dipropylene glycol (DPG) was purchased from Sigma Aldrich Chimie
(Saint-Quentin-Fallavier, France).

28
The complex vehicle, a recalled lotion of RD, was supplied by Kanebo
Cosmetics, Inc. It was primarily composed of water and a mixture of polyols (DPG,
glycerin, BG, and sorbitol; each concentration is shown in 2.2).
2.2.2. Preparation of RD formulations
Aqueous formulation of RD (1%) (Table 1) was prepared by dissolving RD in
a sufficient amount of purified water in a volumetric flask. An RD concentration of 1%
was selected instead of 2% due to its limited solubility with water.
The polyol mixture was composed of DPG (46.15%), glycerin (23.08%), BG
(20.51%), and sorbitol (10.26%) identical to that of the recalled formulation. A
prepared lotion formulation (2% RD) containing identical total polyol concentration,
19.5% and water, of the recalled lotion, was also prepared (Table 1).
To reflect formulation conditions in the residual phase, formulations depicting
polyol concentration following evaporation were developed. Simulated residual
formulations of RD (2%) lotion were designed to reflect varying degrees of evaporation
from the formulation hence, polyol concentrations of 40%, 61.8%, and 100% were
adopted. These polyol concentrations were particularly selected to reflect low, middle,
and high degree of water evaporation in the residual phase. These formulations were
prepared by the addition of a sufficient amount of purified water with its corresponding
polyol proportions in a volumetric flask.
Table 1. Composition of RD formulations Recalled
formulation Prepared formulations
Components (%)
Recalled lotion
1% RD Aqueous
Prepared lotion
2% RD Lotion (40% Polyol)
2% RD Lotion (61.8% Polyol)
2% RD Lotion (100% Polyol)
Rhododendrol 2 1 2 2 2 2 Polyols 19.5 - 19.5 40 61.8 q.s. 100 Water q.s. 100 q.s. 100 q.s. 100 q.s. 100 q.s. 100 -
29
2.2.3. In vitro skin permeation experiment
Frozen porcine ears (Central Institute for Feed and Livestock; JA Zen-Noh,
Ibaraki, Japan) were thawed with warm water and rinsed with purified water. Hairs
were trimmed and shaved, and subcutaneous fats were excised off the skin. Skin was
harvested from the central dorsal region of the ears. Before excision, visual inspection
was performed to ensure the integrity of the skin. Only intact and damage-free skin was
excised. For stripped skin, adhesive tape was applied on the SC side and stripped 20
times prior to excision. Isolated porcine skin was set on vertical type Franz diffusion
cells (effective diffusion area of 1.77 cm2). Skin surface temperature was maintained at
32C throughout the experiment. The receiver compartment was filled with 6.0 mL of
purified water. Prior to the application of doses, the skin was applied with purified water
(1.0 mL) to facilitate equilibration for 1 h. Water was then carefully removed and skin
surface was blotted with a cotton swab to remove excess water. Using a positive
displacement micropipette, RD formulations (1% RD aqueous, 2% RD in 19.5% polyol,
2% RD in 40% polyol, 2% RD in 61.8% polyol, 2% RD in 100% polyol) were applied
as either finite (17.7 L/ 1.77 cm2) or infinite dose (1.0 mL/1.77 cm2). At a
predetermined schedule, an aliquot (500 L) was withdrawn from the receiver solution.
Permeation experiments were performed for 0 – 4 h or 0 – 8 h.
2.2.4. Skin concentration experiment
The skin concentration of RD was determined using identical experimental
conditions as the skin permeation experiment using both intact and stripped skin.
Formulations were applied in infinite and finite doses. Skins were demounted from the
diffusion cells and adhering formulations were removed at 4 h and 8 h after the start of
skin permeation experiment. Skins were rinsed thrice on both sides with purified water
30
and blotted dry with tissue paper. Tape-stripping (20 times) was performed on the intact
skin to isolate the VED. A sample (0.05 g) of the VED was reduced in size using a pair
of scissors. Then, water was added and the skin was homogenized using a Polytron PT
1200E (Kinematica, Inc., Luzern, Switzerland) for 5 min. Samples were deproteinized
by the addition of 16% trichloroacetic acid. The samples were agitated using a vortex
mixer for 15 min, followed by centrifugation (15,000 rpm, 4C) for 5 min. The
supernatant liquid was prepared for quantification.
2.2.5. Water evaporation experiment from formulation
Evaporation of water from the recalled formulation was determined
gravimetrically by monitoring weight loss of the applied solvent/formulation over time.
The weight of an empty glass-bottom dish was first measured using an analytical
balance (AUW220D; Shimadzu, Kyoto, Japan). Balance reading was deemed stable
when differing readings are less than 0.0001 g within 3 min. A finite dose (17.7 L)
of lotion was evenly applied using a micropipette and the initial weight of the applied
formulation was recorded. The set-up was placed on a thermostatically (32C)
maintained heating plate (AS ONE, Osaka, Japan). Surface temperature was monitored
(32 1C) using probe and infrared thermometers throughout the experiment. Water
loss (weight of the setup) was recorded over time at intervals of 1 min until constant
weight was attained.
2.2.6. Determination of solubility of RD in residual formulations
The solubility of RD was performed in a wide range of polyol concentrations
(10.0%, 19.5%, 40.0%, 61.8%, and 100%) simulating various stages of evaporation in
the residual formulations based on a previous work [5]. The excess amount of RD was
31
stirred inside a capped vial immersed in a thermostatically controlled water bath (32C)
for 48 h. This approximated the solubility of RD in the residual formulation on skin.
Dissolved RD in solvents/simulated residual formulations were filtered using a
polytetrafluoroethylene membrane syringe filter (Advantec®, 0.2 µm, Tokyo, Japan)
and analyzed using HPLC.
2.2.7. HPLC analysis
RD was analyzed using HPLC as described previously. [23] Briefly, 100 L of
samples were added with an equal amount of internal standard (methylparaben) and
centrifuged at 4C for 5 min. Samples were injected into an HPLC system and analyzed
for RD concentration at 280 nm.
2.2.8. Theoretical
2.2.8.1.Concentration-distance profile of a penetrant in SC and VED
Skin diffusion model of a penetrant is generally expressed in its concentration-
distance profile as shown in Figure 1. As such, a two-layered diffusion model can be
used for penetrant diffusion through the full-thickness skin (SC + VED double
membrane) while one-layered diffusion model is sufficient for SC-stripped skin (VED
single membrane).
32
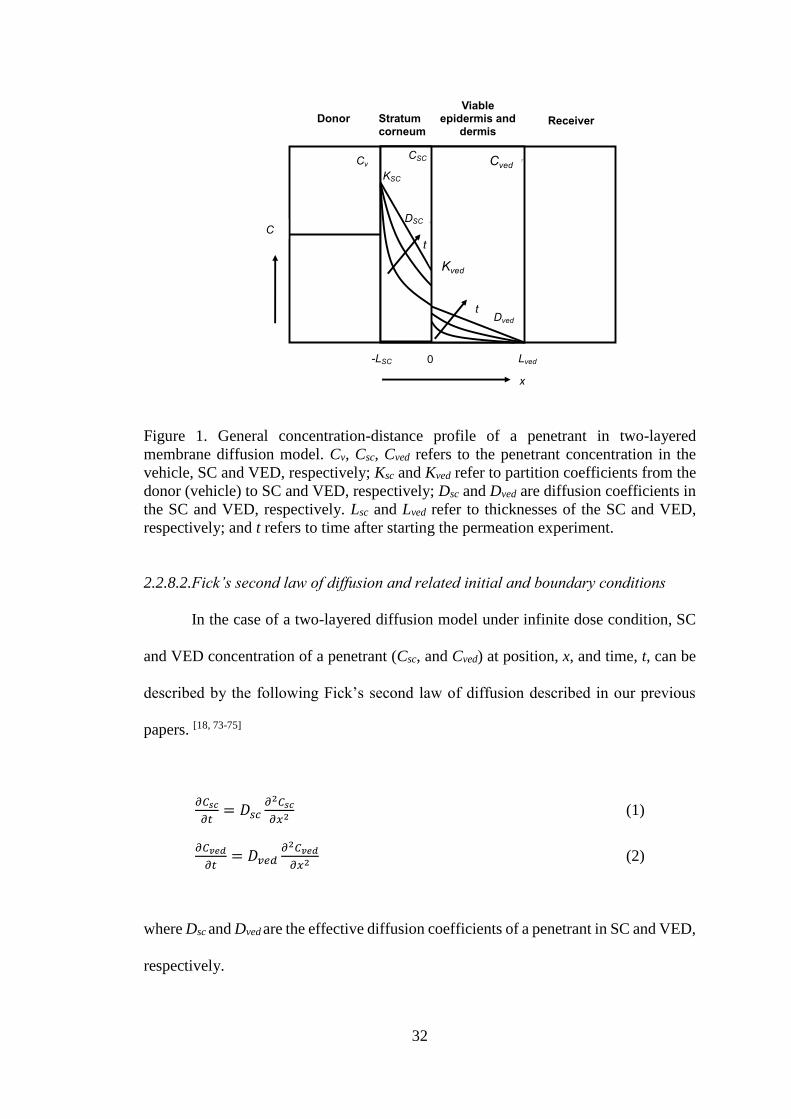
Figure 1. General concentration-distance profile of a penetrant in two-layered
membrane diffusion model. Cv, Csc, Cved refers to the penetrant concentration in the
vehicle, SC and VED, respectively; Ksc and Kved refer to partition coefficients from the
donor (vehicle) to SC and VED, respectively; Dsc and Dved are diffusion coefficients in
the SC and VED, respectively. Lsc and Lved refer to thicknesses of the SC and VED,
respectively; and t refers to time after starting the permeation experiment.
2.2.8.2.Fick’s second law of diffusion and related initial and boundary conditions
In the case of a two-layered diffusion model under infinite dose condition, SC
and VED concentration of a penetrant (Csc, and Cved) at position, x, and time, t, can be
described by the following Fick’s second law of diffusion described in our previous
papers. [18, 73-75]
𝜕𝐶𝑠𝑐
𝜕𝑡= 𝐷𝑠𝑐
𝜕2𝐶𝑠𝑐
𝜕𝑥2 (1)
𝜕𝐶𝑣𝑒𝑑
𝜕𝑡= 𝐷𝑣𝑒𝑑
𝜕2𝐶𝑣𝑒𝑑
𝜕𝑥2 (2)
where Dsc and Dved are the effective diffusion coefficients of a penetrant in SC and VED,
respectively.
0 Lved
t
Cv
C
x
Donor Stratum
conium
Receiver
Kved/sc
Dved
Cved
t
Ksc/v
Dsc
Csc
-Lsc
Viable epidermis
and dermis
Donor Stratum corneum
Viable epidermis and
dermisReceiver
C
Cv
Lved
Cved
Kved
Dved
0-LSC
x
t
DSC
t
KSC
CSC

33
Initial and boundary conditions for penetrant concentration in infinite dose
system were as follows:
t=0 −𝐿 𝑠𝑐 < 𝑥 < 0 𝐶𝑠𝑐 = 0 (3)
0 < 𝑥 < 𝐿𝑣𝑒𝑑 𝐶𝑣𝑒𝑑 = 0
t>0 𝑥 = −𝐿𝑠𝑐 𝐶𝑠𝑐 = 𝐾𝑠𝑐 ∙ 𝐶𝑣 (4)
𝑥 = 0 𝐶𝑣𝑒𝑑 = 𝐾𝑣𝑒𝑑 ∙ 𝐶𝑠𝑐 and
𝐷𝑠𝑐𝑑𝐶𝑠𝑐
𝑑𝑥= 𝐷𝑣𝑒𝑑
𝑑𝐶𝑣𝑒𝑑
𝑑𝑥
𝑥 = 𝐿𝑣𝑒𝑑 𝐶𝑣𝑒𝑑 = 0
where Lsc and Lved are the thicknesses of SC and VED, respectively; Ksc and Kved are the
partition coefficients of the penetrant from the donor (vehicle) to SC and VED,
respectively; Cv is penetrant concentration in the applied formulation (donor or vehicle).
In the present RD permeation experiments through excised porcine ear skin, Lsc and
Lved were set to be 20 m and 1480 m, respectively.
Against Eq. (4) for the infinite dose system, the boundary condition only at x =
0 in the finite dose system becomes,
t > 0 𝑥 = −𝐿𝑠𝑐 𝐶𝑠𝑐 = 𝐾𝑠𝑐 ∙ 𝐶𝑣 (4’)
𝑥 = 0 𝑉𝑣𝑑𝐶𝑣
𝑑𝑡= 𝐴 𝐷𝑠𝑐
𝑑𝐶𝑠𝑐
𝑑𝑥
𝑥 = 𝐿𝑣𝑒𝑑 𝐶𝑣𝑒𝑑 = 0
where Vv is the volume of the vehicle (donor solution); A is the effective permeation
area. The equation in the second line in Eq. (4’) means that the decrease in flux of the
penetrant in the donor compartment is equal to the increase in flux at x = 0 in the SC.

34
When the amount of the penetrant permeated in the finite dose through membrane is
very low, Eq. (4) can be used instead of Eq. (4’). Only a small amount of RD permeated
through the skin in the case of the present RD skin permeation experiment, suggesting
that Eq. (4) can be used for Eq. (4’) even at finite dose.
2.2.8.3.Equations to determine the skin permeation rate and amount of a penetrant
The skin permeation rate of penetrant per unit area, J, is expressed by Eq. (5)
using Fick’s first law of diffusion. The cumulative amount of the penetrant permeated
per unit area, Q, is determined by integrating Eq. (5). Q is expressed by Eq. (6).
𝐽 = −𝐷𝑣𝑒𝑑 (𝑑𝐶𝑣𝑒𝑑
𝑑𝑥)
𝑥=𝐿𝑣𝑒𝑑
(5)
𝑄 = −𝐷𝑣𝑒𝑑 ∫ (𝑑𝐶𝑣𝑒𝑑
𝑑𝑥)
𝑡
0 𝑥=𝐿𝑣𝑒𝑑
𝑑𝑡 (6)
These equations can be applied to both the infinite and finite dose systems.
2.2.8.4.Determination of Dved, Dsc, Kved and Ksc
The Kved and Dved can be obtained from permeation experiment using SC-
stripped skin (VED single membrane) in the infinite dose system [74] (Details are shown
in 2.2.8.6). Then, Ksc and Dsc are determined by the permeation experiment using full-
thickness skin (SC + VED double membrane) in the infinite dose system. The obtained
Kved and Dved values were fixed for calculating Ksc and Dsc.
2.2.8.5.Determination of Cv(t) and Ksc(t)
35
RD formulations consisted of water and polyol mixture (Table 1) were applied
on skin in the present study. Water evaporated from the formulation whereas polyols
remained on the skin in the present finite dose experiments. Thus, Cv and Ksc must be
expressed as a function of time as in Cv(t) and Ksc(t). Then, the Cv of RD in different
concentrations of polyol vehicles (19.5%, 40%, 61.8% and 100%) was determined, and
in each concentration of polyols, Cv was calculated using spline interpolation. Time
course of the polyol concentration was determined by the water evaporation data from
formulation (see 2.2.5 in detail). Finally, the time course of Cv(t) was obtained.
In addition, Ksc of RD from vehicles composed of 19.5, 40, 61.8 and 100%
polyols were experimentally determined by the permeation experiment through full-
thickness skin using infinite dose conditions. Permeation experiments through stripped
skin were also done as mentioned above. The Ksc of RD from each concentration of
polyols in the formulation to SC was then calculated using spline interpolation. The
time course of the polyol concentration was determined by the water evaporation data
as above. Thus, the time course of Ksc(t) was obtained as like in Cv(t).
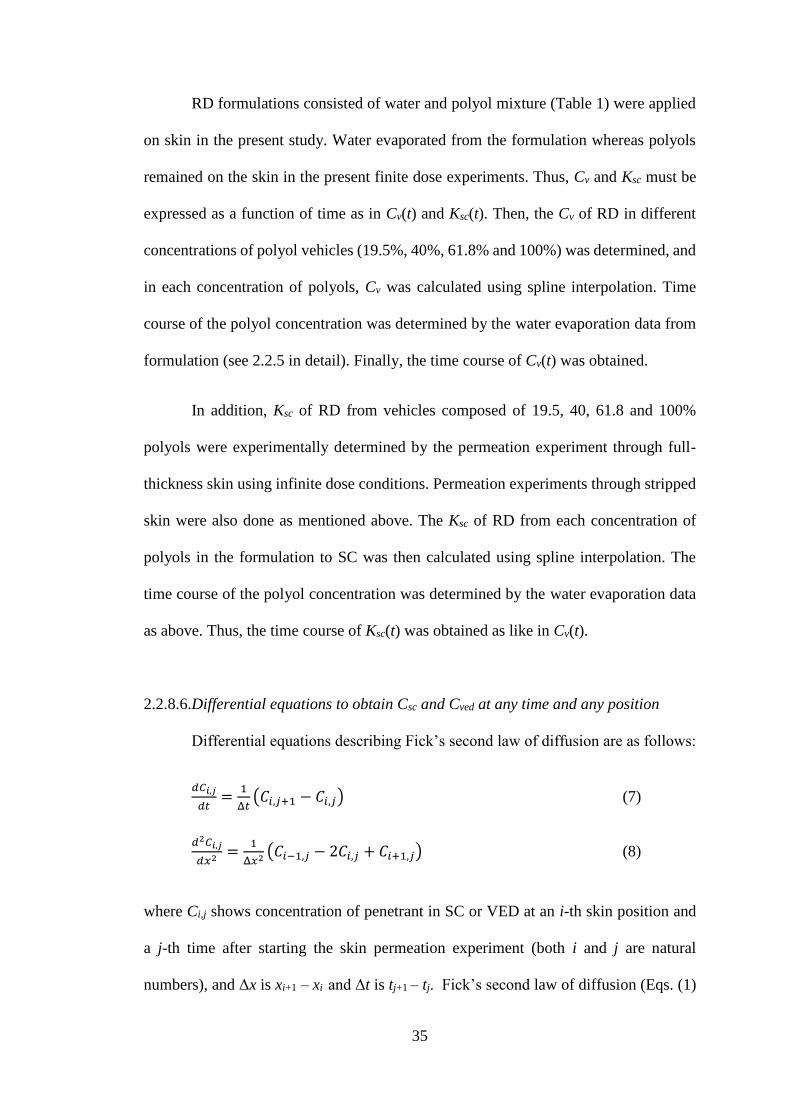
2.2.8.6.Differential equations to obtain Csc and Cved at any time and any position
Differential equations describing Fick’s second law of diffusion are as follows:
𝑑𝐶𝑖,𝑗
𝑑𝑡=
1
Δ𝑡(𝐶𝑖,𝑗+1 − 𝐶𝑖,𝑗) (7)
𝑑2𝐶𝑖,𝑗
𝑑𝑥2 =1
Δ𝑥2 (𝐶𝑖−1,𝑗 − 2𝐶𝑖,𝑗 + 𝐶𝑖+1,𝑗) (8)
where Ci,j shows concentration of penetrant in SC or VED at an i-th skin position and
a j-th time after starting the skin permeation experiment (both i and j are natural
numbers), and Δx is xi+1 – xi and Δt is tj+1 – tj. Fick’s second law of diffusion (Eqs. (1)
36
and (2)) is expressed using the following differential equations, Eqs. (7) and (8). The
following, Eq. (9), was obtained from Eqs. (7) and (8).
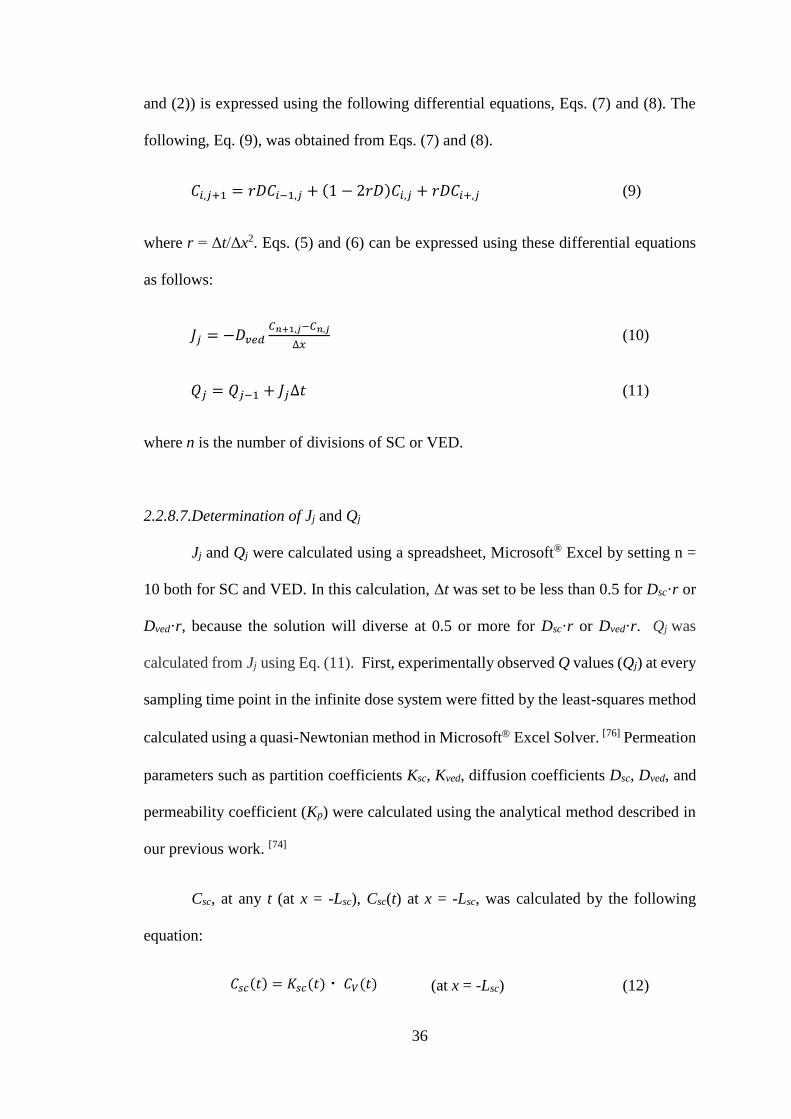
𝐶𝑖,𝑗+1 = 𝑟𝐷𝐶𝑖−1,𝑗 + (1 − 2𝑟𝐷)𝐶𝑖,𝑗 + 𝑟𝐷𝐶𝑖+,𝑗 (9)
where r = Δt/Δx2. Eqs. (5) and (6) can be expressed using these differential equations
as follows:
𝐽𝑗 = −𝐷𝑣𝑒𝑑𝐶𝑛+1,𝑗−𝐶𝑛,𝑗
∆𝑥 (10)
𝑄𝑗 = 𝑄𝑗−1 + 𝐽𝑗∆𝑡 (11)
where n is the number of divisions of SC or VED.
2.2.8.7.Determination of Jj and Qj
Jj and Qj were calculated using a spreadsheet, Microsoft® Excel by setting n =
10 both for SC and VED. In this calculation, Δt was set to be less than 0.5 for Dsc·r or
Dved·r, because the solution will diverse at 0.5 or more for Dsc·r or Dved·r. Qj was
calculated from Jj using Eq. (11). First, experimentally observed Q values (Qj) at every
sampling time point in the infinite dose system were fitted by the least-squares method
calculated using a quasi-Newtonian method in Microsoft Excel Solver. [76] Permeation
parameters such as partition coefficients Ksc, Kved, diffusion coefficients Dsc, Dved, and
permeability coefficient (Kp) were calculated using the analytical method described in
our previous work. [74]
Csc, at any t (at x = -Lsc), Csc(t) at x = -Lsc, was calculated by the following
equation:
(at x = -Lsc) (12) 𝐶𝑠𝑐(𝑡) = 𝐾𝑠𝑐(𝑡)・ 𝐶𝑉(𝑡)

37
where Ksc(t) and Cv(t) are obtained as shown in 2.2.8.5. We inputted Csc(t) (at x = -Lsc)
in the spreadsheet in the present calculation. This was a kind of sequential approach to
derive the calculation method.
2.2.8.8.Diagram of calculation method for Csc and Cved
In this work, permeation parameters, Ksc, Kved, Dsc and Dved, from 1% RD
aqueous solution through intact and stripped skin were initially determined in the
infinite dose system. Figure 2 presents a detailed flow diagram to obtain Ksc(t)and Cv(t).
Figure 2. Flow diagram for time course of Ksc(t) and Cv(t). Cv, Csc, Cved refers to the
penetrant concentration in the vehicle, SC and VED, respectively; Ksc and Kved refer to
partition coefficients to SC and VED, respectively; Dsc and Dved are diffusion
coefficients in the SC and VED, respectively. Lsc and Lved refer to thicknesses of the SC
and VED, respectively; t refers to time after starting the permeation experiment.
2.3 Results
2.3.1 Evaporation of water from applied formulation
Water evaporation was evaluated from a recalled lotion formulation of RD
solubilized in a complex mixture of polyols (DPG, glycerin, BG, and sorbitol).

38
Evaporation kinetics from the applied formulation was measured gravimetrically. The
use of a glass-bottom dish allowed accurate measurement of water evaporation from
the formulation applied as opposed to the use of isolated skin where intrinsic water loss
may lead to overestimation. Observed data for water evaporation was in agreement with
previous study [23] where ∼60% of total water content evaporated within the first 10
min (Fig. 3). The amount of water detected (96.3%) at the end of the experiment
corresponded closely to the actual water content of the recalled formulation. Exhaustive
evaporation of water from the applied formulation was observed in this study. The
evaporation rate from the formulation exhibited first-order kinetics and the percent
water loss, y, was calculated using the following equation, y = 103 x e-0.093t, where t is
the time after the start of experiment (Fig. 3).
Figure 3. Percent water loss from applied formulation. Each point represents the mean
S.D. (n=4).
2.3.2 Skin permeation of RD from aqueous formulation
Water evaporation = 102.6e-0.093t
R² = 0.98
0
20
40
60
80
100
0 10 20 30 40
Wa
ter
in t
he f
orm
ula
tio
n (
%)
Time (min)
39
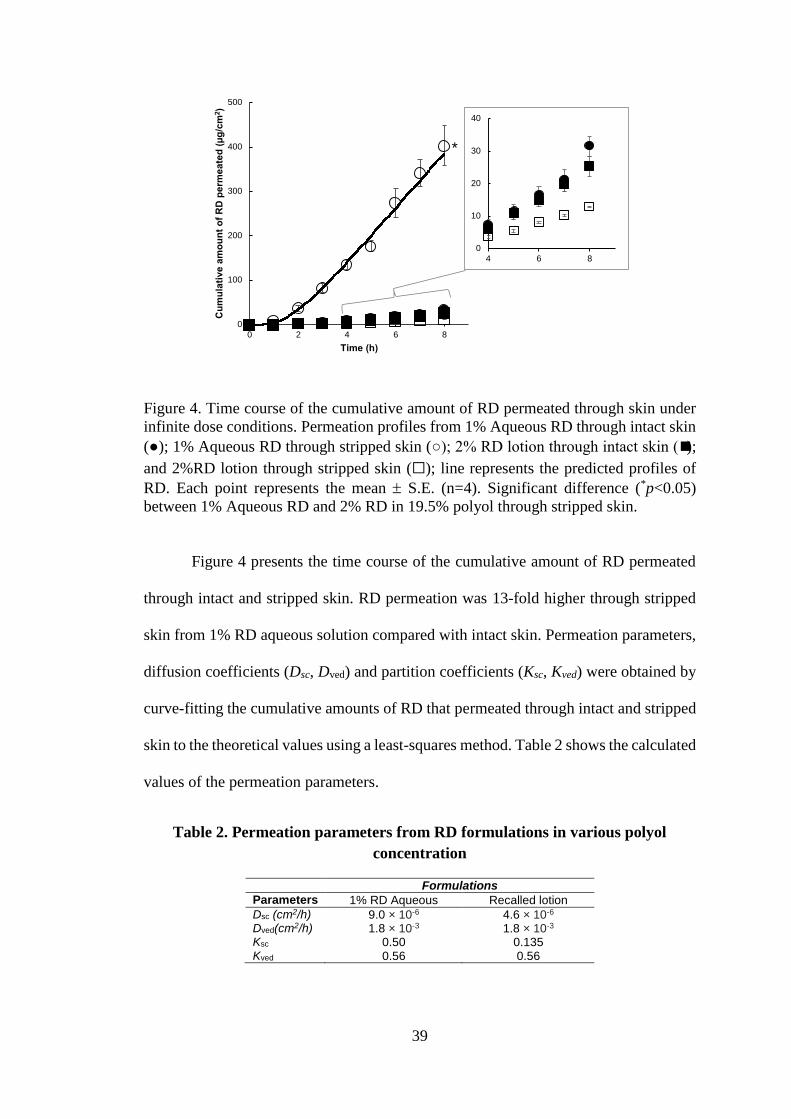
Figure 4. Time course of the cumulative amount of RD permeated through skin under
infinite dose conditions. Permeation profiles from 1% Aqueous RD through intact skin
(●); 1% Aqueous RD through stripped skin (○); 2% RD lotion through intact skin (◼);
and 2%RD lotion through stripped skin (☐); line represents the predicted profiles of
RD. Each point represents the mean S.E. (n=4). Significant difference (*p<0.05)
between 1% Aqueous RD and 2% RD in 19.5% polyol through stripped skin.
Figure 4 presents the time course of the cumulative amount of RD permeated
through intact and stripped skin. RD permeation was 13-fold higher through stripped
skin from 1% RD aqueous solution compared with intact skin. Permeation parameters,
diffusion coefficients (Dsc, Dved) and partition coefficients (Ksc, Kved) were obtained by
curve-fitting the cumulative amounts of RD that permeated through intact and stripped
skin to the theoretical values using a least-squares method. Table 2 shows the calculated
values of the permeation parameters.
Table 2. Permeation parameters from RD formulations in various polyol
concentration
Formulations
Parameters 1% RD Aqueous Recalled lotion
Dsc (cm2/h) 9.0 × 10⁻⁶ 4.6 × 10⁻⁶ Dved(cm2/h) 1.8 × 10⁻³ 1.8 × 10⁻³ Ksc 0.50 0.135 Kved 0.56 0.56
*
0
10
20
30
40
4 6 8
0
100
200
300
400
500
0 2 4 6 8
Cu
mu
lati
ve
am
ou
nt
of
RD
pe
rme
ate
d (µ
g/c
m2)
Time (h)
40
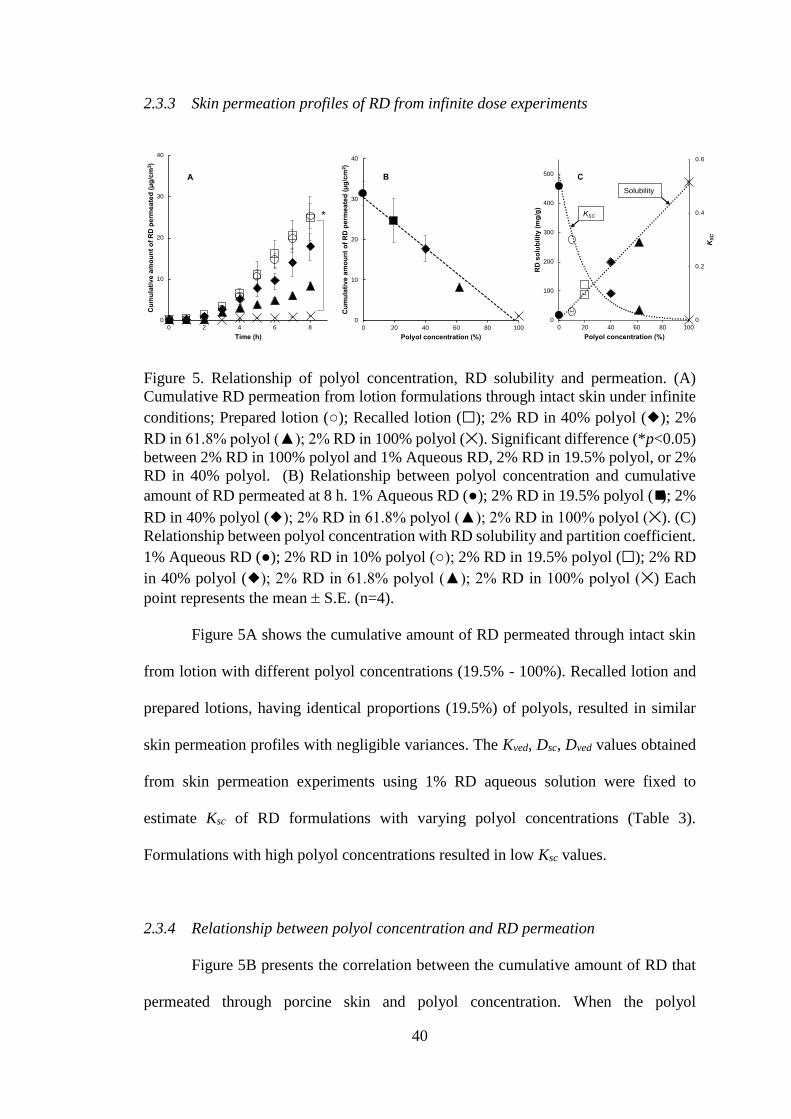
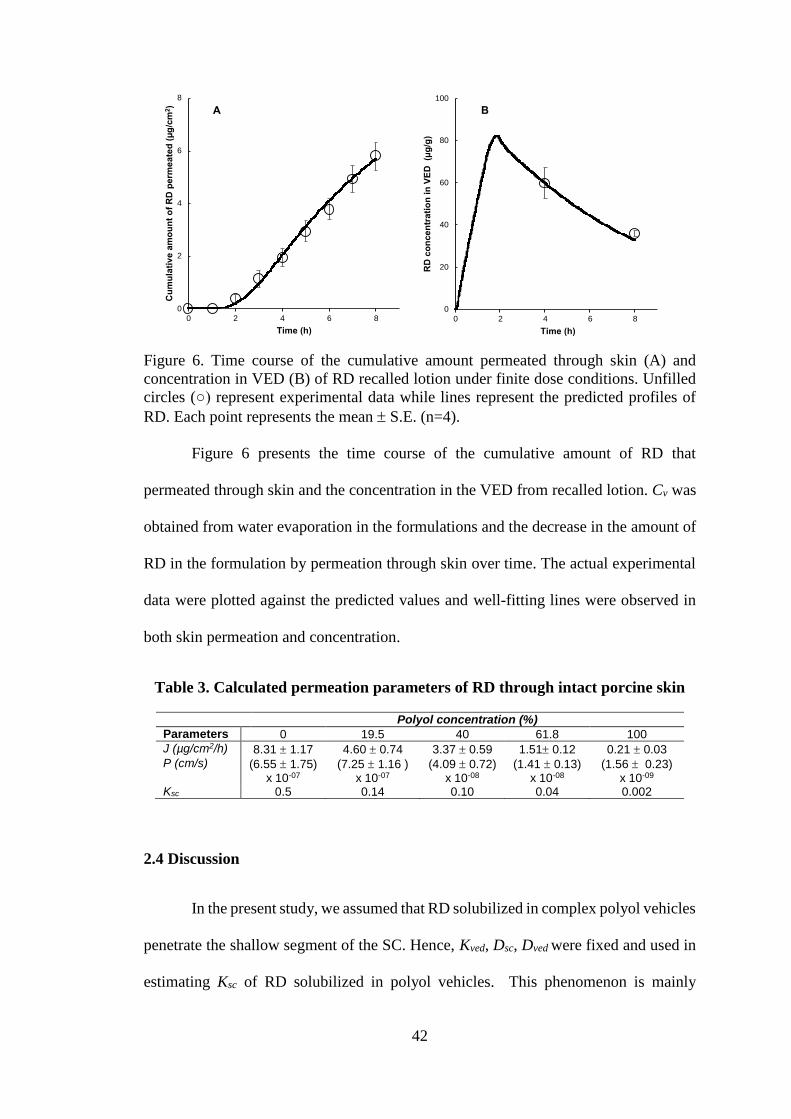
2.3.3 Skin permeation profiles of RD from infinite dose experiments
Figure 5. Relationship of polyol concentration, RD solubility and permeation. (A)
Cumulative RD permeation from lotion formulations through intact skin under infinite
conditions; Prepared lotion (○); Recalled lotion (☐); 2% RD in 40% polyol (◆); 2%
RD in 61.8% polyol (▲); 2% RD in 100% polyol (✕). Significant difference (*p<0.05)
between 2% RD in 100% polyol and 1% Aqueous RD, 2% RD in 19.5% polyol, or 2%
RD in 40% polyol. (B) Relationship between polyol concentration and cumulative
amount of RD permeated at 8 h. 1% Aqueous RD (●); 2% RD in 19.5% polyol (◼); 2%
RD in 40% polyol (◆); 2% RD in 61.8% polyol (▲); 2% RD in 100% polyol (✕). (C)
Relationship between polyol concentration with RD solubility and partition coefficient.
1% Aqueous RD (●); 2% RD in 10% polyol (○); 2% RD in 19.5% polyol (☐); 2% RD
in 40% polyol (◆); 2% RD in 61.8% polyol (▲); 2% RD in 100% polyol (✕) Each
point represents the mean S.E. (n=4).
Figure 5A shows the cumulative amount of RD permeated through intact skin
from lotion with different polyol concentrations (19.5% - 100%). Recalled lotion and
prepared lotions, having identical proportions (19.5%) of polyols, resulted in similar
skin permeation profiles with negligible variances. The Kved, Dsc, Dved values obtained
from skin permeation experiments using 1% RD aqueous solution were fixed to
estimate Ksc of RD formulations with varying polyol concentrations (Table 3).
Formulations with high polyol concentrations resulted in low Ksc values.
2.3.4 Relationship between polyol concentration and RD permeation
Figure 5B presents the correlation between the cumulative amount of RD that
permeated through porcine skin and polyol concentration. When the polyol
0
10
20
30
40
0 20 40 60 80 100
Cu
mu
lati
ve
am
ou
nt
of
RD
pe
rme
ate
d (µ
g/c
m2)
Polyol concentration (%)
0
10
20
30
40
0 2 4 6 8
Cu
mu
lati
ve
am
ou
nt
of
RD
pe
rme
ate
d (µ
g/c
m2)
Time (h)
0
0.2
0.4
0.6
0
100
200
300
400
500
0 20 40 60 80 100
KSC
RD
so
lub
ilit
y (
mg
/g)
Polyol concentration (%)
*
BA C
KSC
Solubility
41
concentration increased from 19.5 to 40%, 61.8 and 100%, the skin permeation of RD
was reduced by 1.8-, 3.8-, and 28.8-fold, respectively. The skin permeation of RD
exhibited a positive inverse correlation (r2 = 0.98) against the polyol concentration in
formulation, suggesting that a high polyol concentration would yield lower skin
permeation of RD.
2.3.5 Solubility of RD in simulated residual formulations
Solubility of RD in the simulated residual formulations revealed a positive
linear correlation (r2 = 0.99) with the polyol concentration in the formulations (Fig. 5C).
High solubility of RD was observed in residual formulations containing high polyol
concentrations (90.44 to 100%) and likewise low solubility at lower polyol
concentrations (19.5 – 40%) (Fig. 5C). In residual formulation containing 61.8%
polyols, wherein its water concentration was about half of its original concentration in
the recalled lotion, yielded a 3-fold increase in RD solubility.
Water evaporation from formulation increased polyol concentration in the
residual phase induced changes in the Ksc (Table 3). A high polyol concentration in the
formulation was correlated with lower Ksc values (r2 = 0.96; Ksc = 0.54e-0.052x, where x
is the concentration of polyol in the formulation).
2.3.6 Prediction of skin permeation and concentration of RD from complex cosmetic
formulations
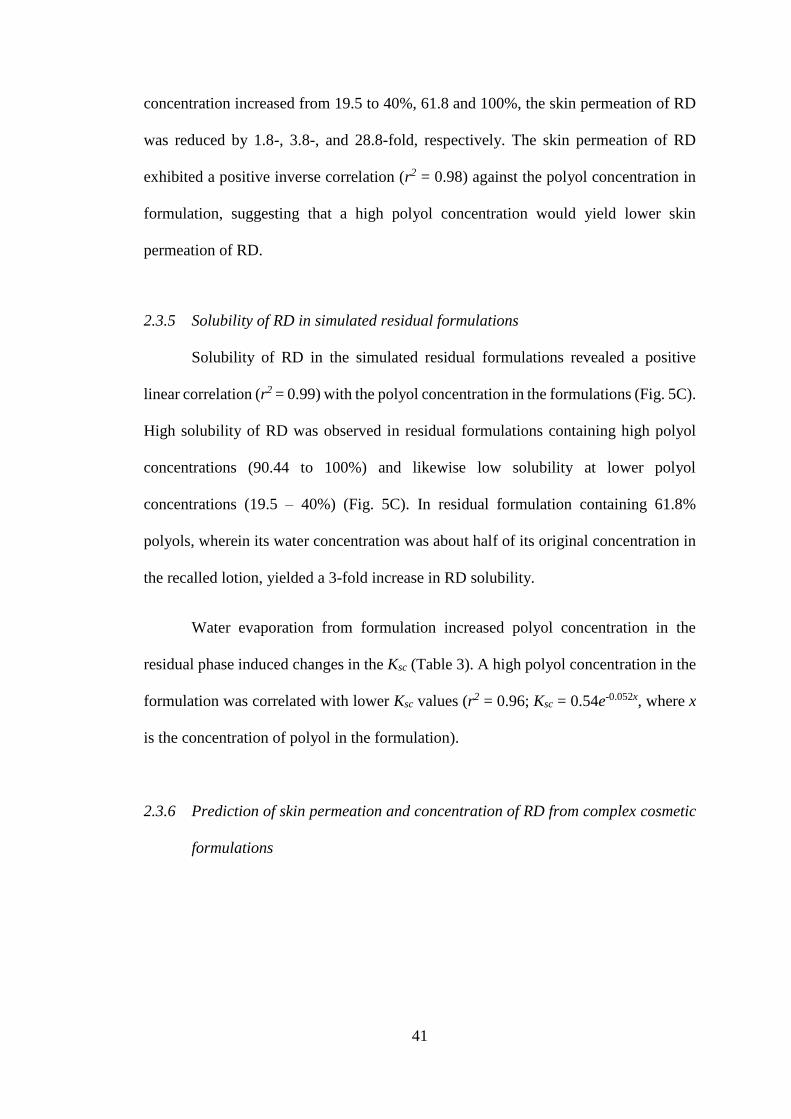
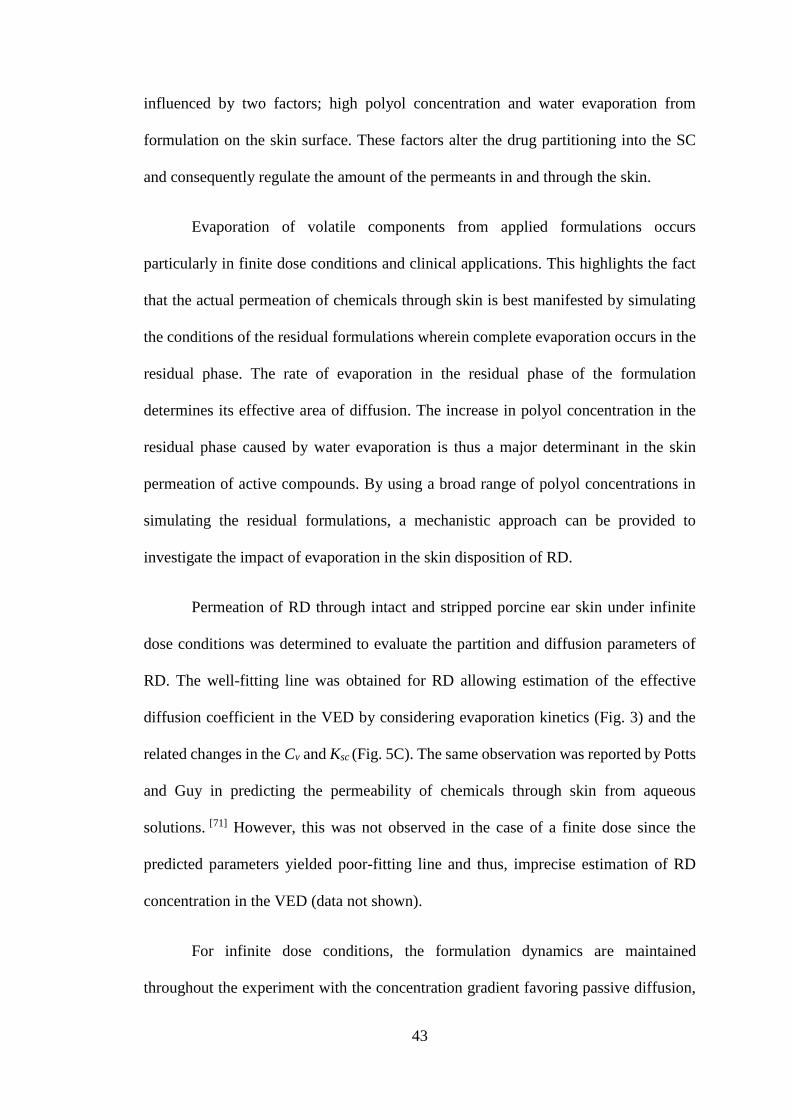
42
Figure 6. Time course of the cumulative amount permeated through skin (A) and
concentration in VED (B) of RD recalled lotion under finite dose conditions. Unfilled
circles (○) represent experimental data while lines represent the predicted profiles of
RD. Each point represents the mean S.E. (n=4).
Figure 6 presents the time course of the cumulative amount of RD that
permeated through skin and the concentration in the VED from recalled lotion. Cv was
obtained from water evaporation in the formulations and the decrease in the amount of
RD in the formulation by permeation through skin over time. The actual experimental
data were plotted against the predicted values and well-fitting lines were observed in
both skin permeation and concentration.
Table 3. Calculated permeation parameters of RD through intact porcine skin
Polyol concentration (%)
Parameters 0 19.5 40 61.8 100
J (µg/cm2/h) 8.31 1.17 4.60 0.74 3.37 0.59 1.51 0.12 0.21 0.03 P (cm/s) (6.55 1.75)
x 10-07 (7.25 1.16 )
x 10-07 (4.09 0.72)
x 10-08 (1.41 0.13)
x 10-08 (1.56 0.23)
x 10-09 Ksc 0.5 0.14 0.10 0.04 0.002
2.4 Discussion
In the present study, we assumed that RD solubilized in complex polyol vehicles
penetrate the shallow segment of the SC. Hence, Kved, Dsc, Dved were fixed and used in
estimating Ksc of RD solubilized in polyol vehicles. This phenomenon is mainly
0
20
40
60
80
100
0 2 4 6 8
RD
co
nc
en
tra
tio
n i
n V
ED
(µ
g/g
)
Time (h)
0
2
4
6
8
0 2 4 6 8
Cu
mu
lati
ve a
mo
un
t o
f R
D p
erm
eate
d (µ
g/c
m2)
Time (h)
BA
43
influenced by two factors; high polyol concentration and water evaporation from
formulation on the skin surface. These factors alter the drug partitioning into the SC
and consequently regulate the amount of the permeants in and through the skin.
Evaporation of volatile components from applied formulations occurs
particularly in finite dose conditions and clinical applications. This highlights the fact
that the actual permeation of chemicals through skin is best manifested by simulating
the conditions of the residual formulations wherein complete evaporation occurs in the
residual phase. The rate of evaporation in the residual phase of the formulation
determines its effective area of diffusion. The increase in polyol concentration in the
residual phase caused by water evaporation is thus a major determinant in the skin
permeation of active compounds. By using a broad range of polyol concentrations in
simulating the residual formulations, a mechanistic approach can be provided to
investigate the impact of evaporation in the skin disposition of RD.
Permeation of RD through intact and stripped porcine ear skin under infinite
dose conditions was determined to evaluate the partition and diffusion parameters of
RD. The well-fitting line was obtained for RD allowing estimation of the effective
diffusion coefficient in the VED by considering evaporation kinetics (Fig. 3) and the
related changes in the Cv and Ksc (Fig. 5C). The same observation was reported by Potts
and Guy in predicting the permeability of chemicals through skin from aqueous
solutions. [71] However, this was not observed in the case of a finite dose since the
predicted parameters yielded poor-fitting line and thus, imprecise estimation of RD
concentration in the VED (data not shown).
For infinite dose conditions, the formulation dynamics are maintained
throughout the experiment with the concentration gradient favoring passive diffusion,

44
a condition obeying Fick’s first law. However, in a finite dose setup, the permeation
environment is abruptly altered after application of the formulation. This ‘new’
environment, residual formulation, therefore dictates how chemicals permeate through
the skin in finite dose exposures. Otto et al. stressed the need to understand the impact
of evaporation on the formulations and the consequent transformations it undergoes
after application onto the skin taking into consideration that the actual permeation
occurs after complete evaporation from the residual formulation. [24] This is a factor
largely ignored despite the fact that the residual formulation differs considerably from
the original formulation prior to application. [25] In the present study, the prediction of
skin permeation and VED distribution was greatly improved upon incorporating
evaporation rates of concerned formulations. A goodness-of-fit was observed for the
RD permeation through porcine skin from the lotion formulation (Fig. 6).
Generally, evaporation from the residual formulation affects the permeation
parameters. These parameters are determined by the interactions between the permeant
and the formulation. It was clear in the present study that water evaporation altered the
solubility of RD in the residual polyol vehicles. The effect of water evaporation on the
skin permeation of RD from residual formulations was confirmed in infinite dose
experiments, where a decrease in the skin permeation of RD was noted with an increase
in polyol concentration in the vehicles (Fig. 5A and B). Estimating the skin permeation
parameters from a residual formulation applied as a finite dose has not been realistically
achieved because formulations tend to evaporate completely leading to incomplete
recovery of formulation for quantification. By simulating the composition of a residual
formulation and performing permeation experiments under infinite dose conditions, it
mimics permeation in the residual phase and allows a reliable estimation of parameters.

45
Ideally, to increase the penetration of chemicals into the SC, the solubility of
the permeating chemical with the SC must be enhanced by increasing its partition
coefficient, Ksc or by reducing its solubility in the vehicle. [77] In the present study, we
found that the solubility of RD in the residual formulation, with very high polyol
concentration, proportionally reduced Ksc through solvent evaporation. RD
formulations in polyol had significantly lower Ksc values relative to the aqueous
formulation (Fig. 5C). RD permeation decreased when the amount of polyol (19.5%
versus polyol concentrations 40%) in the residual formulation was more than the
required amount to dissolve RD. Permeation and consequential distribution of RD in
the VED appeared to be closely related to the thermodynamic activity of RD in the
vehicle, as manifested by its partition coefficient.
In the steady-state experiments, RD fluxes of simulated formulations with high
polyol concentrations were shown to be reduced as the polyol concentration was
increased. An inverse relationship existed between the flux and high polyol
concentration (Table 3). Calculated permeation parameters further revealed that an
increase in polyol concentration decreased flux and the permeability coefficient. The
decrease in partition coefficient for RD in the residual formulation supported the
observed lower permeability coefficient in relation to polyol concentration leading to a
reduction in flux and consequently RD permeation.
The unintended retention of RD on the skin surface instead of benefiting from
a ‘solvent drag effect’ with the use of polyols, typically employed in cosmetics as
solvents, can be explained by its solubility in the residual formulation. In this
experiment, RD was found to be highly soluble with specific polyols (e.g., BG, DPG)
as well as increasing solubility with higher polyol concentration in the residual
formulation. Enhancement of solubility of the permeating active compounds in the

46
formulation (i.e., residual formulation) more than that in the SC resulted in reduced
partitioning into the skin. The increase in its solubility will reduce its thermodynamic
activity, thereby creating a weaker driving force for diffusion. Complete evaporation of
volatile components from the formulation means the chemical in the residual phase has
the same thermodynamic activity as in the simulated residual formulation composed of
100% polyol. [78] In fact, the polyols involved in this investigation possess similar
polarities and thus lack the ability to limit the solubility of RD. Further evidence on the
influence of formulation polarity is the low permeability of RD through stripped skin
(Fig. 4). Lotion formulation is presumably lipophilic and the absence of the lipophilic
barrier, SC, generates a non-ideal diffusion interaction with the hydrophilic VED.
These conditions had unfavorable effects on the formulation where the relative activity
coefficient of RD was reduced and partitioning into the skin was hampered. [79] Hence,
RD penetrates poorly.
Of note, unrealistic similarities in the skin permeation of RD were observed in
infinite dose experiments for aqueous and prepared lotion (19.5% polyol) (Fig. 4). This
affirmed the effect of steady-state conditions in possibly overestimating key parameters.
The extent of impact of solvent evaporation and enhanced polyol concentration on RD
disposition, however, were revealed in data obtained from residual formulations with
high polyol concentrations (40%, 61.8%, 100%) where significantly lower values were
observed. For formulators, seemingly acceptable permeation may be observed with
formulations containing already desirable proportions of polyols (i.e., 19.5%) although
permeation of active compounds from the residual formulation is indeed in its altered
(evaporated) state.
Although the present study established a practical approach in estimating skin
permeation and the concentration of RD from complex vehicles under finite dose
47
conditions, other factors such as saturated formulations, other types of formulations,
solvents, and cosmetic excipients that may affect skin permeation and concentration
must be investigated further. The assumption in this study is applicable to a two-layered
model where active compounds predominantly permeate through the SC. Hence, the
contribution of the hair follicle pathway in the permeation of hydrophilic active
compounds must be recognized in future studies.
2.5 Chapter conclusion
In conclusion, we investigated the skin permeation and concentration of an
active compound in cosmetics, RD, from a complex vehicle as how it would perform
in finite dose exposure. Incorporating evaporation kinetics and vehicle-permeant
dependent parameters (Ksc, Kved, Dsc, Dved) may dramatically improve the precision of
mathematical models in predicting the permeation and distribution of active compounds
in the skin. Predicting these parameters from a complex vehicle made up of actual
cosmetic solvents was previously unattainable due to the fact that steady states were
not possible in finite dose models. The use of residual formulations simulating the
conditions (changes in polyol composition) of the applied finite dose under infinite
experiment conditions have paved the way in the calculation of parameters and
significantly enhanced estimation of permeant disposition. Safety assessments of
permeating chemicals from complex vehicles in clinical and finite dose exposures may
now be sufficiently evaluated for their distribution in the VED using simulated residual
formulations.
48
CHAPTER 3
Usefulness of artificial membrane, Strat-M®, in the assessment of drug
permeation from complex vehicles under finite dose conditions
3.1. Introduction
Prohibitions on the use of animals in testing finished cosmetic products have
been in effect since 2004. With the amendment in regulatory policy, the applications of
in vitro methods without the use of animal tissues have gained significant attention as
tools for the assessment of skin permeation of cosmetic ingredients. Replacements for
skin membranes involving the use of artificial membranes (e.g., Strat-M®, silicone
membrane) designed to mimic human and animal skin offer a competent alternative to
estimate permeation of drugs through skin. [18, 33, 34, 51, 80]
Strat-M is an artificial membrane envisioned as an alternative to animal skin.
It was engineered to mimic key structural and chemical features of human skin. This
multi-layer artificial membrane possesses a tight top layer coated with a lipid blend
resembling the lipid chemistry of the human stratum corneum (SC) and a porous lower
layer resembling epidermis and dermis layers. [36] This membrane possesses
equivalency to human skin for the skin permeation of many drugs and claims to have
better correlations compared with other biological membranes. [37] In 2015, a study
reported an assessment of the permeation of several chemicals solubilized in phosphate-
buffered saline (PBS, pH 7.4) through Strat-M under infinite dose models. [40] A good
correlation coefficient for the permeation of chemicals was found between the artificial
membrane with rat and human skin. Recently, a study on the permeation of nicotine
from formulations with binary solvents (water and chemical penetration enhancers)
applied as a large finite dose (200 L/0.64 cm2) reported similar findings, where a good
49
correlation between the artificial membrane and human skin was found. [36] Other
advantages associated with the membrane are its simplicity of handling, low-cost, and
low variability of lot-to-lot quality as opposed to animal-based models.
Cosmetic formulations usually lack additives (e.g., chemical penetration
enhancers) that alter skin barrier function and promote percutaneous absorption of low
molecular weight ingredients. This positions Strat-M as a suitable substitute for
membranes of biological origin in the assessment of ‘simple’ topical formulations, such
as cosmetics. Vehicles used in cosmetics are mostly composed of complex mixtures
containing components other than water. Therefore, the effect of the combination of
components on the permeation through artificial membranes must be investigated. The
use of Strat-M as an alternative membrane in cosmetics for development, product
optimization, regulatory compliance, and safety assessments has been encouraged by
several reports. However, the actual suitability of this material has not yet been verified
in the context of the in-use conditions of cosmetics. [36-40] Merck Millipore provides a
limited list of pure solvents and binary vehicles deemed compatible for use with Strat-
M in the assessment of chemical permeation, but there is a lack of data on polyols,
which are common ingredients in cosmetic formulations. [37]
The usefulness of the Strat-M artificial membrane in the assessment of the
permeation of cosmetic active ingredients from complex formulations in in-use
conditions has not been clarified. No published data were found on the comparative
performance of Strat-M regarding the permeation of cosmetic active ingredients
through porcine skin, despite the recommendations made. Additionally, the
recommended use of porcine skin in the assessment of the permeation of cosmetic
active ingredients has not been changed. Assessment of the dermal absorption of

50
cosmetic active ingredients is recommended to be performed using porcine skin,
because it resembles closely human skin properties, such as permeability to chemicals,
thickness and lipid composition. [41] Being the membrane of choice, it is imperative to
understand the similarities and establish equivalency and the relationship between
Strat-M and porcine skin in terms of membrane characteristics (e.g., permeability
coefficient, flux, permeation of penetrants) to confirm its applicability in evaluating the
permeation of cosmetic active ingredients. The appropriate conduct of in vitro skin
permeation studies must encompass dose, and the vehicle/formulation should represent
the in-use conditions of the intended cosmetic product. The Scientific Committee in
Consumer Safety (SCCS) stipulates the conditions for in vitro dermal absorption
studies of cosmetics, where experimental dose or the amount applied during use (i.e.,
layered application), formulation (e.g., finished cosmetics products, complex vehicles),
and barrier integrity must be met. Furthermore, sample application during in
vitro experiments should mimic human exposure normally at 10 L/cm2 for liquid
formulations. [19, 20, 23, 55] In this study, the design of permeation experiments
encompassed finite and infinite dose conditions, layered application, the effect of
solvents/complex vehicles, and residual formulations to establish the usefulness of the
artificial membrane in assessing the permeation of RD, a lipophilic molecule, and CF,
a hydrophilic molecule, as model drugs in simulated in-use conditions. Usefulness and
membrane-permeation characteristics were evaluated by comparing these parameters
with porcine skin.
3.2. Materials and methods
3.2.1. Materials

51
Rhododendrol [(RD), (CAS no. 501-96-2, 99%)] was a gift from Kanebo
Cosmetics, Inc. (Tokyo, Japan). Caffeine (CF), methylparaben, and glycerin were
purchased from Fujifilm Wako Pure Chemicals Industries, Ltd. (Osaka, Japan). Sorbitol
and 1,3 – butylene glycol (BG) were purchased from Tokyo Chemical Industry, Co.
Ltd (Tokyo, Japan) while dipropylene glycol (DPG) was purchased from Sigma Aldrich
Chimie (Saint-Quentin-Fallavier, France). Strat-M was purchased from Merck
Millipore (Tullagreen, Carrigtwohill, Ireland). Frozen porcine ears were supplied by
the Central Institute for Feed and Livestock (JA Zen-Noh, Ibaraki, Japan).
3.2.2. Preparation of formulations
Aqueous formulations of CF and RD (1%) were prepared by dissolving a
sufficient amount of the drug with purified water in a volumetric flask. The
concentration of 1% for RD in water was selected instead of 2% due to its limited
solubility.
For complex vehicle-based formulations, a polyol stock composed of DPG
(46.15%), glycerin (23.08%), BG (20.51%), and sorbitol (10.26%) was first prepared.
CF (1%) formulations with high polyol proportion (50 and 75%) and a simulated
residual formulation composed of 100% polyol were derived from the stock. RD (2%)
formulations with low polyol proportion (19.5%), high polyol proportions (40 and
61.8%), residual formulations (90.4 and 100%) were also prepared.
3.2.3. In vitro skin permeation experiment
Porcine skin was isolated from frozen edible porcine ears. The preparation and
isolation of porcine ear skin was performed according to a previous report. [23] To ensure
uniformity, skin from the central dorsal region of the ears was harvested. Before
52
excision, visual inspection was performed to ensure the integrity of the skin. Only intact
and damage-free skin was excised. Isolated porcine skin was set in a vertical-type Franz
diffusion cell (effective diffusion area of 1.77 cm2). Skin surface temperature
throughout the experiment was maintained at 32C. The receiver compartment was
filled with 6.0 mL of purified water. Prior to the application of doses, the skin was
hydrated with purified water (1 mL) for one hour. Water was then carefully removed
and skin surface was blotted with a cotton swab to remove excess water. For Strat-M
experiment, the membrane was directly set in to a vertical-type Franz diffusion cell with
the polyether sulfone side (shiny top layer) upwards. Hydration was not performed
since it does not require such pretreatment prior to use. The same experimental
conditions were applied for the artificial membrane experiment. A positive
displacement micropipette was used to apply CF and RD formulations either as finite
(17.7 or 35.4 L/ 1.77 cm2; layered, 17.7 L and 17.7 L/ 1.77 cm2) or infinite dose (1
mL/1.77 cm2). The applied formulation was spread evenly using the back side of a
spatula. Aliquots (500 L) were withdrawn from the receiver solution at pre-determined
time points. Permeation experiments were performed for 8 h.
3.2.4. HPLC Analyses of CF and RD
An aliquot (100 µL) of the RD sample collected at every time point was mixed
with an equal volume of internal standard (methylparaben), whereas CF samples were
mixed with equal volume of acetonitrile. Samples were then centrifuged at 4C for 5
min. Each sample was analyzed using an HPLC system (Shimadzu Co., Kyoto, Japan)
equipped with column (Inertsil® ODS-3 4.6 mm X 150 mm, GL Sciences Inc., Tokyo,
Japan), system controller (SCL-10A), pump (LC-20AD), degasser (DGU-20A3), auto
– injector (SIL-20A), column oven (CTO-20A), UV detector (SPD-20A), and analysis

53
software (LC Solution). The column was maintained at 40°C with the flow rate of the
mobile phase at 1.0 mL/min. The mobile phase for RD was acetonitrile and water
(25/75, v/v) and 0.1% phosphoric acid and acetonitrile (10/90, v/v) was used for CF.
Detection of RD and CF was made at 280 nm and 254 nm, respectively.
3.2.5. Measurement of membrane electrical impedance
Strat-M (25 mm) discs were mounted in a vertical-type Franz diffusion cell,
identically to the conditions described above. Hydration was not performed prior to the
measurement of impedance. PBS (pH 7.4) was loaded into the donor and receiver cells.
Impedance was first determined for untreated Strat-M discs using an impedance meter
(10 Hz AC, Asahi Techno Lab., Ltd., Yokohama, Japan). The Strat-M membrane was
carefully blotted dry from the donor side, and 10 L/cm2 of polyol stock was applied.
After 10 mins, polyol was removed from the membrane surface and fresh PBS (pH 7.4)
was added, and impedance was determined again.
3.2.6. Statistical analyses
All experimental data were tested for statistical significance (p < 0.05) using
Student’s t-test. Pearson’s correlation coefficient was used to characterize the
relationship between the cumulative amounts of the drug that permeated through the
porcine skin and Strat-M. All data were expressed as mean with a standard error.
3.3. Results
3.3.1. Permeation of drugs under in-use and finite dose conditions
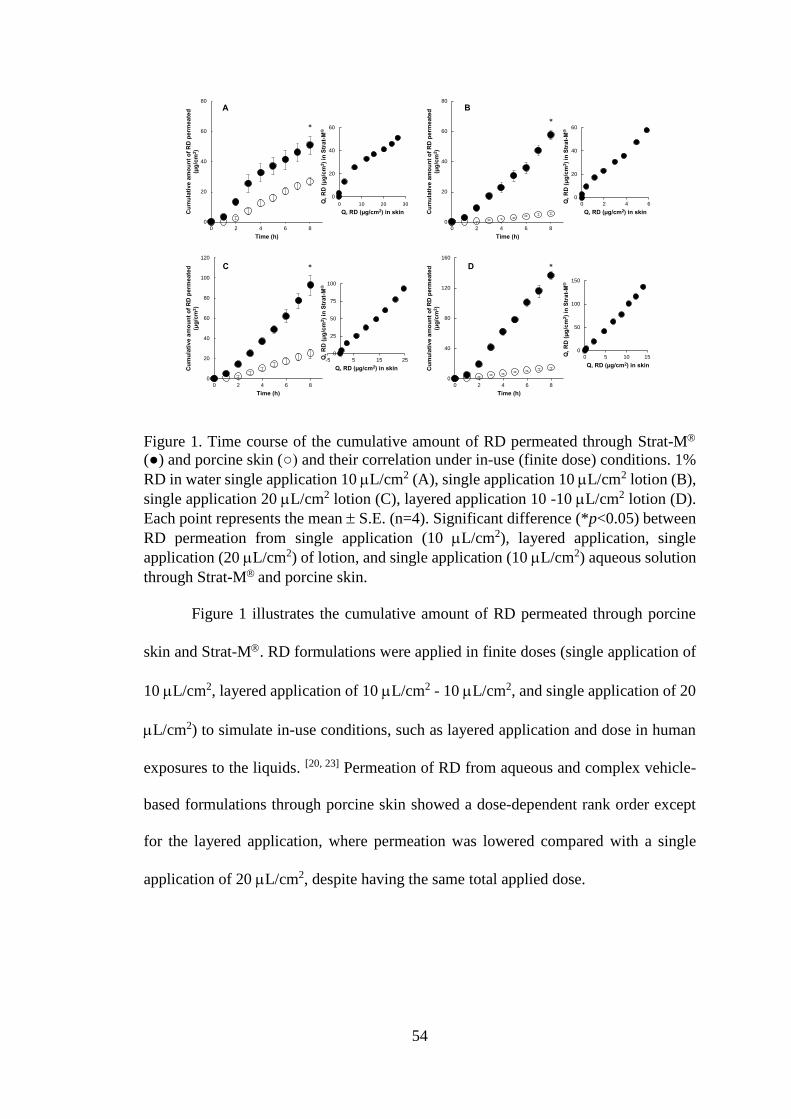
54
Figure 1. Time course of the cumulative amount of RD permeated through Strat-M
(●) and porcine skin (○) and their correlation under in-use (finite dose) conditions. 1%
RD in water single application 10 L/cm2 (A), single application 10 L/cm2 lotion (B),
single application 20 L/cm2 lotion (C), layered application 10 -10 L/cm2 lotion (D).
Each point represents the mean S.E. (n=4). Significant difference (*p<0.05) between
RD permeation from single application (10 L/cm2), layered application, single
application (20 L/cm2) of lotion, and single application (10 L/cm2) aqueous solution
through Strat-M and porcine skin.
Figure 1 illustrates the cumulative amount of RD permeated through porcine
skin and Strat-M. RD formulations were applied in finite doses (single application of
10 L/cm2, layered application of 10 L/cm2 - 10 L/cm2, and single application of 20
L/cm2) to simulate in-use conditions, such as layered application and dose in human
exposures to the liquids. [20, 23] Permeation of RD from aqueous and complex vehicle-
based formulations through porcine skin showed a dose-dependent rank order except
for the layered application, where permeation was lowered compared with a single
application of 20 L/cm2, despite having the same total applied dose.
0
20
40
60
80
100
120
0 2 4 6 8
Cu
mu
lati
ve
am
ou
nt
of
RD
pe
rme
ate
d
(µg
/cm
2)
Time (h)
A B
**
**
0
20
40
60
80
0 2 4 6 8
Cu
mu
lati
ve
am
ou
nt
of
RD
pe
rme
ate
d
(µg
/cm
2)
Time (h)
0
20
40
60
0 10 20 30Q,
RD
(µ
g/c
m2)
in S
tra
t-M
®
Q, RD (µg/cm2) in skin
0
20
40
60
80
0 2 4 6 8
Cu
mu
lati
ve
am
ou
nt
of
RD
pe
rme
ate
d
(µg
/cm
2)
Time (h)
0
20
40
60
0 2 4 6Q,
RD
(µ
g/c
m2)
in S
tra
t-M
®
Q, RD (µg/cm2) in skin
0
25
50
75
100
-5 5 15 25Q,
RD
(µ
g/c
m2)
in S
tra
t-M
®
Q, RD (µg/cm2) in skin
C
0
40
80
120
160
0 2 4 6 8
Cu
mu
lati
ve
am
ou
nt
of
RD
pe
rme
ate
d
(µg
/cm
2)
Time (h)
D
0
50
100
150
0 5 10 15Q,
RD
(µ
g/c
m2)
in S
tra
t-M
®
Q, RD (µg/cm2) in skin
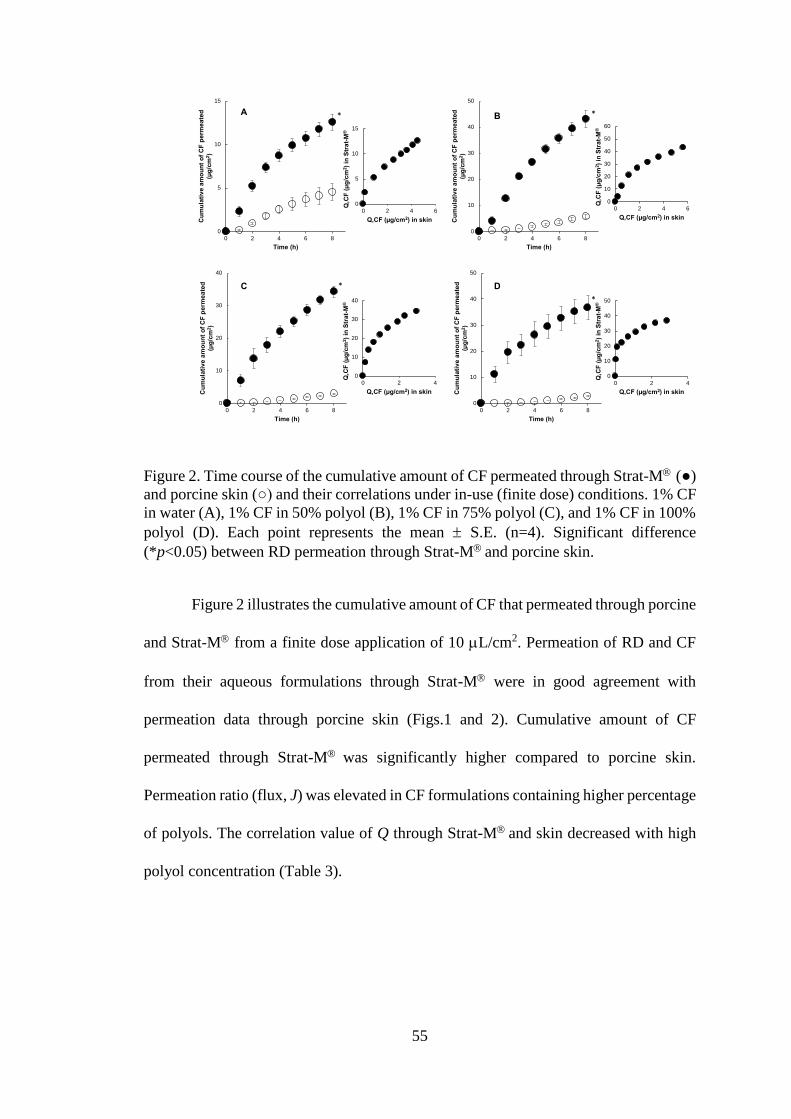
55
Figure 2. Time course of the cumulative amount of CF permeated through Strat-M (●)
and porcine skin (○) and their correlations under in-use (finite dose) conditions. 1% CF
in water (A), 1% CF in 50% polyol (B), 1% CF in 75% polyol (C), and 1% CF in 100%
polyol (D). Each point represents the mean S.E. (n=4). Significant difference
(*p<0.05) between RD permeation through Strat-M and porcine skin.
Figure 2 illustrates the cumulative amount of CF that permeated through porcine
and Strat-M from a finite dose application of 10 L/cm2. Permeation of RD and CF
from their aqueous formulations through Strat-M were in good agreement with
permeation data through porcine skin (Figs.1 and 2). Cumulative amount of CF
permeated through Strat-M was significantly higher compared to porcine skin.
Permeation ratio (flux, J) was elevated in CF formulations containing higher percentage
of polyols. The correlation value of Q through Strat-M and skin decreased with high
polyol concentration (Table 3).
0
5
10
15
0 2 4 6 8
Cu
mu
lati
ve
am
ou
nt
of
CF
pe
rme
ate
d
(µg
/cm
2)
Time (h)
0
5
10
15
0 2 4 6
Q,C
F (µ
g/c
m2)
in S
tra
t-M
®
Q,CF (µg/cm2) in skin
A
0
10
20
30
40
50
0 2 4 6 8
Cu
mu
lati
ve
am
ou
nt
of
CF
pe
rme
ate
d
(µg
/cm
2)
Time (h)
0
10
20
30
40
50
60
0 2 4 6
Q,C
F (µ
g/c
m2)
in S
tra
t-M
®
Q,CF (µg/cm2) in skin
B
0
10
20
30
40
0 2 4 6 8
Cu
mu
lati
ve
am
ou
nt
of
CF
pe
rme
ate
d
(µg
/cm
2)
Time (h)
0
10
20
30
40
0 2 4
Q,C
F (µ
g/c
m2)
in S
tra
t-M
®
Q,CF (µg/cm2) in skin
C
0
10
20
30
40
50
0 2 4 6 8
Cu
mu
lati
ve
am
ou
nt
of
CF
pe
rme
ate
d
(µg
/cm
2)
Time (h)
0
10
20
30
40
50
0 2 4
Q,C
F (µ
g/c
m2)
in S
tra
t-M
®
Q,CF (µg/cm2) in skin
D
* *
*
*

56
Table 1. Permeation parameters of CF and RD from various formulations
through Strat-M and porcine skin under finite dose conditions
3.3.2. Permeation of drugs under infinite dose conditions
Figure 3. Time course of the cumulative amount of RD permeated through Strat-M
(●) and porcine skin (○) and their correlations under infinite dose conditions. 1% RD
in water (A), 2% RD in 19.5% polyol (B), 2% RD in 40% polyol (C), 2% RD in 61.8%
polyol (D), and 2% RD in 100% polyol (E). Each point represents the mean S.E.
(n=4). Significant difference (*p<0.05) between RD permeation through Strat-M and
porcine skin.
Figure 3 presents the permeation of RD through porcine skin and Strat-M in
infinite dose conditions. RD permeation under finite and infinite dose conditions had
identical rank orders of permeation [aqueous formulation (0% polyol) > low polyol
concentration (19.55) > high polyol concentration (40 and 61.8%) > residual
formulation (100% polyol)] through porcine skin, wherein increasing polyol
Formulations Strat-M Porcine skin Permeation ratio
(JStrat-M/JSkin)
r2 (QStrat-M
vs. QSkin) J (g/cm2/h) J (g/cm2/h)
1% CF in water 0.92 0.05 0.63 0.09 1.45 0.96
1% CF in 50% polyol 5.80 0.27 1.42 0.33 4.07 0.89
1% CF in 75% polyol 2.87 0.27 0.61 0.06 4.73 0.87
1% CF in 100% polyol 3.13 0.53 0.57 0.04 5.47 0.71
1% RD in water 4.08 0.42 2.45 0.12 1.66 0.93
0
20
40
60
80
100
120
0 2 4 6 8
Cu
mu
lati
ve
am
ou
nt
of
RD
pe
rme
ate
d (µ
g/c
m2)
Time (h)
0
40
80
120
160
200
0 2 4 6 8
Cu
mu
lati
ve
am
ou
nt
of
RD
pe
rme
ate
d (µ
g/c
m2)
Time (h)
A C
D
0
100
200
300
400
500
600
0 2 4 6 8
Cu
mu
lati
ve
am
ou
nt
of
RD
pe
rme
ate
d (µ
g/c
m2)
Time (h)
0
100
200
300
400
500
600
0 20 40Q,
RD
(µ
g/c
m2)
in S
tra
t-M
®
Q, RD (µg/cm2) in skin
0
100
200
300
400
500
600
0 2 4 6 8
Cu
mu
lati
ve
am
ou
nt
of
RD
pe
rme
ate
d (µ
g/c
m2)
Time (h)
B
0
100
200
300
400
500
600
0 10 20 30Q, R
D (µ
g/c
m2)
in S
trat-
M®
Q, RD (µg/cm2) in skin
0
40
80
120
160
200
0 10 20Q, R
D (µ
g/c
m2)
in S
trat-
M®
Q, RD (µg/cm2) in skin
0
20
40
60
80
100
0 5 10Q, R
D (µ
g/c
m2)
in S
trat-
M®
Q, RD (µg/cm2) in skin
0
20
40
60
80
100
120
140
0 2 4 6 8
Cu
mu
lati
ve
am
ou
nt
of
RD
pe
rme
ate
d (µ
g/c
m2)
Time (h)
0
20
40
60
80
100
120
0 0.5 1 1.5Q, R
D (µ
g/c
m2)
in S
trat-
M®
Q, RD (µg/cm2) in skin
E
* *
*
* *

57
concentration in formulations corresponds to a decrease in the amount of permeated
drug (r2= 0.98). Overall, the artificial membrane demonstrated a high correlation
(r2=0.94 – 0.98) of permeation with porcine skin for RD.
Figure 4. Time course of the cumulative amount of CF permeated through Strat-M (●)
and porcine skin (○) and their correlations under infinite dose conditions. 1% CF in
water (A), 1% CF in 50% polyol (B), 1% CF in 75% polyol (C), and 1% CF in 100%
polyol (D). Each point represents the mean S.E. (n=4). Significant difference
(*p<0.05) between RD permeation through Strat-M and porcine skin.
Figure 4 shows the permeation of CF through porcine skin and Strat-M in
infinite dose conditions. CF permeation through skin in infinite dose conditions had
identical rank order [aqueous formulation (0% polyol) > high polyol concentration (50
and 75%) > residual formulation (100% polyol)] of permeation to RD. However, a
dissimilar order of permeation for CF was found in permeation experiments through
the Strat-M membrane. The permeation of CF through Strat-M from formulations
with high polyol content and residual formulation was consistently enhanced. The
0
150
300
450
600
0 2 4 6 8
Cu
mu
lati
ve a
mo
un
t o
f C
F p
erm
ea
ted
(µg
/cm
2)
Time (h)
0
40
80
120
160
200
0 2 4 6 8
Cu
mu
lati
ve
am
ou
nt
of
CF
pe
rme
ate
d
(µg
/cm
2)
Time (h)
0
150
300
450
600
0 2 4 6 8
Cu
mu
lati
ve
am
ou
nt
of
CF
perm
ea
ted
(µg
/cm
2)
Time (h)
A B
CD
0
40
80
120
160
200
0 2 4 6 8
Cu
mu
lati
ve
am
ou
nt
of
CF
pe
rme
ate
d
(µg
/cm
2)
Time (h)
0
40
80
120
160
200
0 10 20Q
,CF
(µ
g/c
m2)
in S
tra
t-M
®
Q,CF (µg/cm2) in skin
0
50
100
150
0 5 10
Q,C
F (µ
g/c
m2)
in S
trat-
M®
Q,CF (µg/cm2) in skin
0
100
200
300
400
500
600
0 1 2 3
Q,C
F (µ
g/c
m2)
in S
trat-
M®
Q,CF (µg/cm2) in skin
0
100
200
300
400
500
0 0.2 0.4 0.6
Q,C
F (µ
g/c
m2)
in S
trat-
M®
Q,CF (µg/cm2) in skin
*
*
* *
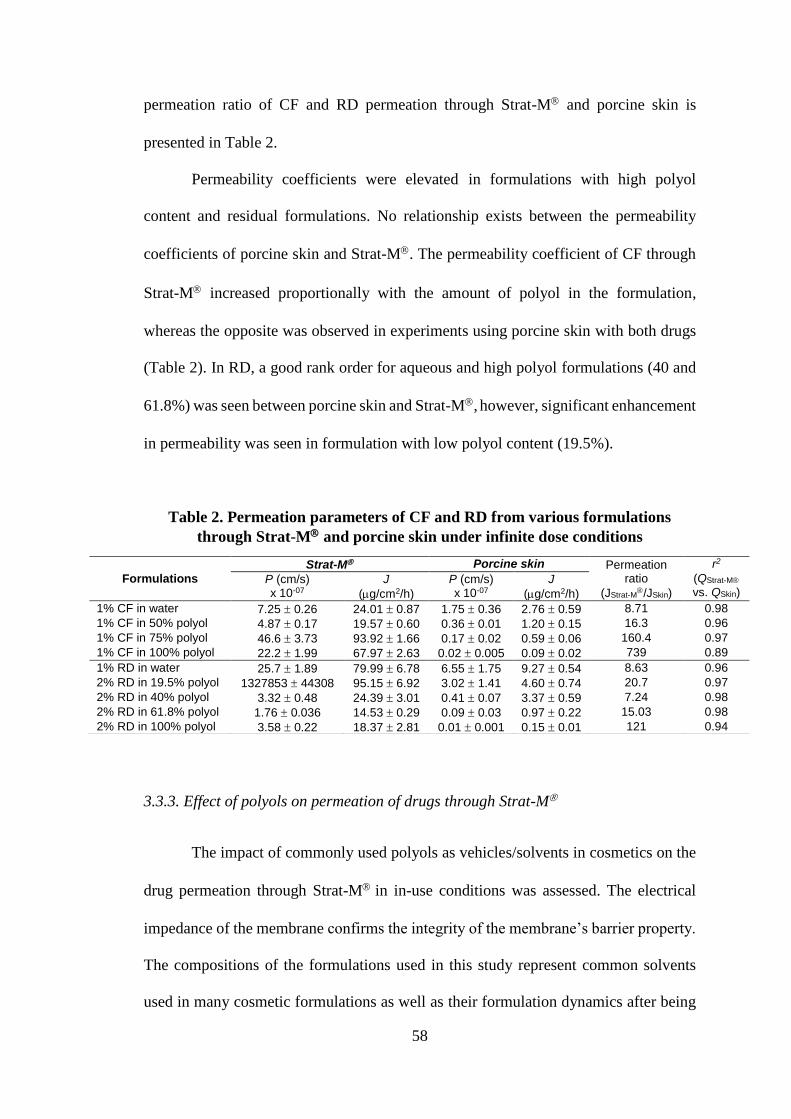
58
permeation ratio of CF and RD permeation through Strat-M and porcine skin is
presented in Table 2.
Permeability coefficients were elevated in formulations with high polyol
content and residual formulations. No relationship exists between the permeability
coefficients of porcine skin and Strat-M. The permeability coefficient of CF through
Strat-M increased proportionally with the amount of polyol in the formulation,
whereas the opposite was observed in experiments using porcine skin with both drugs
(Table 2). In RD, a good rank order for aqueous and high polyol formulations (40 and
61.8%) was seen between porcine skin and Strat-M, however, significant enhancement
in permeability was seen in formulation with low polyol content (19.5%).
Table 2. Permeation parameters of CF and RD from various formulations
through Strat-M and porcine skin under infinite dose conditions
3.3.3. Effect of polyols on permeation of drugs through Strat-M
The impact of commonly used polyols as vehicles/solvents in cosmetics on the
drug permeation through Strat-M in in-use conditions was assessed. The electrical
impedance of the membrane confirms the integrity of the membrane’s barrier property.
The compositions of the formulations used in this study represent common solvents
used in many cosmetic formulations as well as their formulation dynamics after being
Formulations
Strat-M Porcine skin Permeation ratio
(JStrat-M/JSkin)
r2
(QStrat-M
vs. QSkin) P (cm/s) x 10-07
J
(g/cm2/h)
P (cm/s) x 10-07
J
(g/cm2/h)
1% CF in water 7.25 0.26 24.01 0.87 1.75 0.36 2.76 0.59 8.71 0.98
1% CF in 50% polyol 4.87 0.17 19.57 0.60 0.36 0.01 1.20 0.15 16.3 0.96
1% CF in 75% polyol 46.6 3.73 93.92 1.66 0.17 0.02 0.59 0.06 160.4 0.97
1% CF in 100% polyol 22.2 1.99 67.97 2.63 0.02 0.005 0.09 0.02 739 0.89
1% RD in water 25.7 1.89 79.99 6.78 6.55 1.75 9.27 0.54 8.63 0.96
2% RD in 19.5% polyol 1327853 44308 95.15 6.92 3.02 1.41 4.60 0.74 20.7 0.97
2% RD in 40% polyol 3.32 0.48 24.39 3.01 0.41 0.07 3.37 0.59 7.24 0.98
2% RD in 61.8% polyol 1.76 0.036 14.53 0.29 0.09 0.03 0.97 0.22 15.03 0.98
2% RD in 100% polyol 3.58 0.22 18.37 2.81 0.01 0.001 0.15 0.01 121 0.94

59
applied onto the skin. The electrical impedance of the membrane was found to be high
( 100 kcm2), indicating the good barrier properties of its SC-like top layer.
Application of polyols, typical solvents in cosmetic formulations, to Strat-M for 10
min resulted to a significant reduction (92%) in impedance (post-treatment impedance
value of 8.02 0.89 kcm2) of the membrane.
Figure 5. Relationship between cumulative amount permeated at 8 h through Strat-M
and polyol concentration in RD and CF formulations. Finite dose experiment of RD
(A), Infinite dose experiment of RD (B), Finite dose experiment of CF (C), and Infinite
dose experiment of CF (D).
Figure 5 presents the relationship between the cumulative amount of drug
permeated through to Strat-M and polyol concentration in formulations. Permeation
of RD through Strat-M from a range of polyol concentrations was correlated with
polyol concentration in the formulation for finite and infinite dose conditions with an
r2 value of 0.86 and 0.70, respectively. In the case of CF, poor correlations were found
in finite (r2= 0.56) and infinite dose conditions (r2= 0.61) between the cumulative
amount of permeation and polyol concentration (Fig. 5).
3.4. Discussion
This study investigated the usefulness of artificial membrane and its
comparative performance with porcine skin in evaluating permeation of cosmetic active
compounds under in-use conditions. RD permeation through the artificial membrane
predicted accurately the rank order, as expected, for dose conditions, 10 L/cm2 and 20
R² = 0.86
0
10
20
30
40
50
60
70
0 20 40 60 80 100
Q,
RD
(µ
g/c
m2)
in S
tra
t-M
®
Polyol concentration (%)
A
R² = 0.70
0
100
200
300
400
500
600
0 20 40 60 80 100
Q,
RD
(µ
g/c
m2)
in S
tra
t-M
®
Polyol concentration (%)
B
R² = 0.56
0
10
20
30
40
50
0 20 40 60 80 100
Q,C
F (µ
g/c
m2)
in S
tra
t-M
®Polyol concentration (%)
C
R² = 0.61
0
100
200
300
400
500
600
0 20 40 60 80 100
Q,C
F (µ
g/c
m2)
in S
tra
t-M
®
Polyol concentration (%)
D

60
L/cm2, while the permeation of RD from layered application was the highest. Strat-
M was able to discriminate the impact of applied dose and composition of formulation
in the permeation of drugs. Excellent correlations (r2= 0.95 - 1) exist between
permeation through the artificial membrane and skin for RD from all applied dose
conditions (Fig. 1).
Permeation experiment through Strat-M using CF, a hydrophilic model drug,
was performed to understand its similarities or dissimilarities with porcine skin. Fluxes
for CF and RD across Strat-M were within close range with minimal enhancement
ratios of 1.45 and 1.66, respectively (Table 1). However, finite dose experiments of CF
with high polyol proportion and simulated residual formulations revealed significantly
higher permeation in contrast to its profile in skin. In skin permeation experiments
through porcine skin, CF permeation was enhanced by formulation containing 50%
polyol while formulations containing 75% and 100% polyol did not enhance
permeation and yielded lower skin permeation presumably due to diffusional
limitations. CF from its aqueous formulations yielded the lowest permeation whereas
formulations containing polyol had significantly higher permeation through Strat-M .
There was a 4 - 5.5-fold increase in flux with a corresponding increase in polyol
concentration (Table 1). Polyol in formulation apparently enhanced permeation of CF
through Strat-M.
RD permeation under finite and infinite dose conditions had identical rank order
of permeation through porcine skin. High concentrations of polyol on skin reduced the
amount of drug permeated. In this case, the residual formulation was deemed
sufficiently viscous to cause diffusional limitations. RD permeation through Strat-M
was enhanced in formulation with low polyol concentration (19.5%) while the rest of

61
the formulations had similar order of permeation (Fig. 3). This suggests similarities in
the permeation pathway for RD through porcine ear skin and the artificial membrane.
Despite having identical permeation rank order with RD under infinite dose
conditions, a dissimilar order of CF permeation was found through the artificial
membrane. Permeation of CF through Strat-M from formulations of high polyol
content and residual formulation was consistently enhanced. This was contradictory to
what was observed with skin permeation data, where high proportions of polyol in the
residual formulation was found to reduce the thermodynamic activity of CF and RD by
solubilization, hence, decreasing the migration of these drugs from polyol to the skin.
A lower correlation (r2= 0.89) was found between CF permeations through skin and the
Strat-M membrane from its residual formulation owing to large variations in their
concentration-time point profiles (Fig. 4D).
A relatively high concentration-time point correlation can be observed between
Strat-M and porcine skin in most formulations for both drugs, however, it must be
noted that the amount of drug permeating through Strat-M in all dose conditions is
significantly higher than that of skin. Haq et al. have already presented a piece of
evidence on the effect of polyol-membrane interaction on drug permeation. The
cumulative amount of drug permeated from their control formulation composed of a
pure polyol (propylene glycol) through Strat-M resulted in a 14-fold increase in
permeation. [36] Solubilization or lipid extraction of lipophilic structures on its top layer
must have caused the similarities in results particularly the increase in permeation
despite being applied as finite doses as observed in both studies. Also, the artificial
membrane and formulations with high polyol proportions used in this study share
lipophilic qualities. Strat-M lacks the highly organized intercellular structures of the
SC, therefore it simply does not mimic the heterogeneous complexity of the SC and

62
fails to render similar barrier properties to those of the SC to provide the ideal
interaction of vehicles with known SC lipids. [81] Since the partitioning of a drug into
the skin is dependent on its ability to preferentially ‘transfer’ from formulation into SC
and beyond, this may have been the reason for the unusually high permeation of CF in
infinite dose as opposed to how it would permeate from residual formulation through
porcine skin. In a porcine skin-based experiment, formulations with high polyol content
and residual formulations did not result to an increase in flux. In addition, the diffusivity
of chemicals through an artificial membrane is related to its permeation route, with the
relatively thin SC-like layer thus providing a low-tortuosity pathway, which is probably
the reason for higher permeability of hydrophilic compounds. [40]
Flux for CF from formulation of high polyol content (75%) and residual
formulation through Strat-M was higher by 160 and 739 – fold, respectively. A lower
correlation between the permeation enhancement of CF and polyol content through
Strat-M exists. However, it is notable that higher fluxes can be observed in CF
formulations containing high polyol content (75% and 100% polyol). Moreover, the
permeability coefficient of Strat-M was enhanced proportionally with increasing
concentration of polyol which is probably a concentration-dependent disruption of
Strat-M’s barrier integrity. Hence, an increase in the permeability coefficient can be
observed with higher polyol content. Flux of CF through Strat-M is proportionally
enhanced in formulations of high polyol content as well, where applied. Reduction in
flux was observed in porcine skin-based experiments where high polyol content could
reduce the thermodynamic activity of the permeating drugs. A correct prediction for
RD flux was obtained from its aqueous and high polyol content formulations. RD, in
its residual formulation, was shown to permeate 121-fold higher through Strat-M. This
finding was also observed when we conducted identical experiment using another
63
residual formulation containing 90.4% polyol, and it was found that Strat-M was more
permeable (133-fold higher) when formulations with very high polyol content were
applied. The application of polyol-based formulations appeared to solubilize the lipid-
based SC-like top layer of the artificial membrane. In layered application, the
application of the first layer of formulation disrupted the barrier integrity. Hence, it
promotes higher RD permeation through Strat-M from the second layer applied as
opposed to the known lowering of permeation through porcine skin in layered
application. Water evaporation in layered application typically reduces the
thermodynamic activity of RD in the residual formulation. This also supports the
unusually high permeation of CF with high polyol and residual formulations in both
finite and infinite dose systems through Strat-M.
The impact of high amounts of polyol remaining on the skin has been
established to markedly reduce the permeation of cosmetic active ingredients, and a
poor correlation existed between polyol content and permeation. Permeation of RD
through Strat-M from a range of polyol concentrations was inversely correlated with
polyol concentrations in the formulation for finite and infinite dose conditions with an
r2 value of 0.86 and 0.70, respectively. RD permeation through Strat-M is not
correlated with polyol concentration in the formulation because the disruption of the
barrier integrity is likely to be limited to the lipid-based top-layer of the artificial
membrane. The hydrophilic VED-like layer of Strat-M must have remained intact
throughout the experiment and, thus, effectively limited the passage of the lipophilic
RD molecule. In the case of CF, despite having lower correlations between the
cumulative amount of permeation and polyol concentration in finite (r2= 0.56) and
infinite dose experiments (r2= 0.61), an enhanced permeation through Strat-M was
observed (Fig. 5). Moreover, high permeation of CF through Strat-M under finite and

64
infinite dose conditions was exhibited by formulations with high polyol content.
Enhanced permeation of hydrophilic drugs, such as CF, has been previously reported
in membranes with reduced electrical impedance due to compromised barrier function.
[52, 82]
3.5. Conclusion
High correlations (r2= 0.94 – 1) in permeation between Strat-M and porcine
skin under finite and infinite dose conditions were observed with RD, whereas these
were only observed in finite dose conditions for CF. A poor relationship was obtained
between the permeability coefficients of CF and RD through Strat-M. The amounts of
RD and CF that permeated through Strat-M from complex vehicles was higher in both
dose conditions. Similar permeability characteristics between the two membranes can
be observed from aqueous formulations.
Permeation of drugs from formulations with high polyol content and residual
formulation was increased with an increase in the permeability of the artificial
membrane. The barrier integrity of Strat-M was breached upon contact with high
concentrations of polyol by lipid extraction or solubilization of its SC-like top layer, as
indicated by the drastic reduction in electrical impedance. The use of Strat-M in the
assessment of dermal permeation of cosmetics may be limited to formulations with low
polyol content and finite dose conditions. Assessment of permeation from concurrent
application of identical or non-identical formulations (i.e., layered application) and
infinite dose conditions with the use of Strat-M could result in overestimation of the
permeation parameters. Good rank order of permeation from formulations with
complex vehicle-based formulation applied as finite doses was observed with a
65
lipophilic compound (RD). Findings from this study suggest the selective potential
usefulness of artificial membranes in discriminating the effect of complex vehicle
formulations and predicting permeation of cosmetic active ingredients. Further
assessments of the permeation of cosmetic active ingredients should be performed by
employing other solvent systems and formulations to enhance the applicability of Strat-
M in cosmetic formulation design, optimization and safety assessments.

66
CONCLUSION
In conclusion, the following were established from the findings of this study.
1. Cosmetics applied by layered application exhibited lower skin permeation of
RD compared with a single application despite having the same application dose.
2. Formulations and their components caused varying reductions in RD
permeation probably due to changes in the activity coefficient and
thermodynamic activity of the active component.
3. Incorporating evaporation kinetics and vehicle-permeant dependent parameters
(Ksc,ved, Dsc,ved) could improve the precision of mathematical models in
predicting permeation and distribution of actives in the skin.
4. The permeability of the artificial membrane to cosmetic actives is enhanced by
high polyol content and residual formulation due to disruption in its barrier
integrity.
5. Good rank order of permeation from a complex vehicle was observed in the
lipophilic compound suggesting selective usefulness of the artificial membrane
in discriminating effects of complex vehicles and in predicting permeation of
actives.
67
ACKNOWLEDGEMENTS
The author expresses his heartfelt gratitude to the following persons and
institutions who have supported him in the completion of this study.
First, to Professor Kenji Sugibayashi for his infallible and inspiring role as
scientist, teacher, and mentor. To Associate Professor Hiroaki Todo for his meticulosity
yet patient guidance through all my scientific endeavors in the laboratory. To Professor
Konstanty Wierzba and Assistant Professor Shoko Itakura for their insightful and
inspiring scientific conversations. Together, you have turned me into one of the rarest
kind of Filipino pharmacist, a pharmaceutical scientist.
To the Commission on Higher Education of the Republic of the Philippines for
providing supplementary financial support through its Partial Support Scholarship for
Graduate Studies Abroad Program.
To the members of the Laboratory of Pharmaceutics and Cosmeceutics for being
a constant source of technical assistance in the conduct of experiments.
Ultimately, to my family for providing me the inspiration and a great sense of
purpose. To my wife and son for allowing me to pursue a dream beyond our family. To
my parents for instilling in me the value of education, and to my parents-in-law who
have supported my family in my absence.
68
REFERENCES
1. Sugibayashi, K., Todo, H., Oda A., 2016. Effect of layered application of
different cosmeceutical formulations containing rhododendrol. J. Jpn. Cosmet.
Sci. Soc. 40, 259 – 261.
2. Yamaguchi, M., Araki, D., Kanamori, T., Okiyama, Y., Seto, H., Uda, M.,
Usami, M., Yamamoto, Y., Masunaga, T., Sasa, H., 2017. Actual consumption
amount of personal care products reflecting Japanese cosmetic habits. J. Toxicol.
Sci. 42, 797 – 814.
3. Sasaki, M., Kondo, M., Sato, K., Umeda, M., Kawabata, K., Takahashi, Y.,
Suzuki, T., Matsunaga, K., and Inoue, S., 2014. Rhododendrol, a
depigmentation-inducing phenolic compound, exerts melanocyte cytotoxicity
via a tyrosinase-dependent mechanism. Pigm. Cell Melanoma R. 27, 754–763.
4. Abe, Y., Okamura, K., Kawaguchi, M., Hozumi, Y., Aoki, H., Kunisada, T., Ito,
S., Wakamatsu, K., Matsunaga, K., Suzuki, T., 2016. Rhododendrol-induced
leukoderma in a mouse model mimicking Japanese skin. J. Dermatol. Sci. 81,
35-43.
5. Gabe, Y., Miyaji, A., Kohno, M., Hachiya, A., Moriwaki, S., Baba, T., 2018.
Substantial evidence for the rhododendrol-induced generation of hydroxyl
radicals that causes melanocyte cytotoxicity and induces chemical leukoderma.
J. Dermatol. Sci. 91, 311-316.
6. Tokura, Y., Fujiyama, T., Ikeya, S., Tatsuno, K., Aoshima, M., Kasuya, A., Ito,
T., 2015. Biochemical, cytological, and immunological mechanisms of
rhododendrol-induced leukoderma. J. Dermatol. Sci. 77, 146 – 149.
7. Mesko, M.F., Novo, D.L.R., Costa, V.C., Henn, A.S., Flores, E.M.M., 2020.
Toxic and potentially toxic elements determination in cosmetics used for make-
up: a critical review. Anal. Chim. Acta 1098, 1 – 26.
8. Alves, V.M., Muratov, E.N., Zakharov, A., Muratov, N.N., Andrade, C.H.,
Tropsha, A., 2018. Chemical toxicity prediction for major classes of industrial
chemicals: is it possible to develop universal models covering cosmetics, drugs,
and pesticides? Food Chem Toxicol. 112, 526 – 534.
9. Almeida, A., Sarmento, B., Rodrigues, F., 2017. Insights on in vitro models for
safety and toxicity assessment of cosmetic ingredients. Int. J. Pharm. 518, 178
– 185.

69
10. Desprez, B., Dent, M., Keller, D., Klaric, M., Ouédraogo, G., Cubberley, R.,
Duplan, H., Eilstein, J., Ellison, C., Grégoire, S., Hewitt, N.J., Jacques-Jamin,
C., Lange, D., Roe, A., Rothe, H., Blaauboer, B.J., Schepky, A., Mahony, C.,
2018. A strategy for systemic toxicity assessment based on non-animal
approaches: the cosmetics Europe long range science strategy programme.
Toxicol In Vitro 50, 137 – 146.
11. Plošnik, A., Zupan, J., Vračko, M., 2015. Evaluation of toxic endpoints for a set
of cosmetic ingredients with CAESAR models. Chemosphere 120, 492 – 499.
12. Goebel, C., Aeby, P., Ade, N., Alépée, N., Aptula, A., Araki, D., Dufour, E.,
Gilmour, N., Hibatallah, J., Keller, D., Kern, P., Kirst, A., Marrec-Fairley, M.,
Maxwell, G., Rowland, J., Safford, B., Schellauf, F., Schepky, A., Seaman, C.,
Teichert, T., Tessier, N., Teissier, S., Weltzein, H.U., Winkler, P., Scheel, J.,
2012. Guiding principles for the implementation of non-animal safety
assessment approaches for cosmetics: skin sensitization. Regul. Toxicol.
Pharmacol. 63, 40 – 52.
13. Ellison, C.A., Blackburn, K.L., Carmichael, P.L., Clewel, H.J., Cronin, M.T.D.,
Desprez, B., Escher, S.E., Ferguson, S.S., Grégoire, S., Hewitt, N.J., Hollnagel,
H.M., Klaric, M., Patel, A., Salhi, S., Schepky, A., Schmitt, B.G., Wambaugh,
J.F., Worth, A., 2019. Challenges in working towards an internal threshold of
toxicological concern (iTTC) for use in the safety assessment of cosmetics:
discussions from the cosmetics Europe iTTC working group workshop. Regul.
Toxicol. Pharmacol. 103, 63 – 72.
14. Williams, F.M., Rothe, H., Barrett, G., Chiodini, A., Whyte, J., Cronin, M.T.D.,
Monteiro-Riviere, N.A., Plautz, J., Roper, C., Westerhout, J., Yang, C., Guy,
R.H., 2016. Assessing the safety of cosmetic chemicals: consideration of a flux
decision tree to predict dermally delivered systemic dose for comparison with
oral TTC (threshold of toxicological concern). Regul. Toxicol. Pharmacol. 76,
174 – 186.
15. Ates, G., Steinmetz, F.P., Doktorova, T.Y., Madden, J.C., Rogiers, V., 2016.
Linking existing in vitro dermal absorption data to physicochemical properties:
contribution to the design of a weight-of-evidence approach for the safety
evaluation of cosmetic ingredients with low dermal bioavailability. Regul.
Toxicol. Pharmacol. 76, 74 – 78.

70
16. Oshizaka, T., Kikuchi, K., Radhum, W.R., Todo, H., Hatanaka, T., Wierzba, K.,
Sugibayashi, K., 2014. Estimation of skin concentrations of topically applied
lidocaine at each depth profile. Int. J. Pharm. 475, 292 – 297.
17. Sugibayashi, K. 2017. Chemical disposition in skin. In: Sugibayashi, K., (ed.)
Skin permeation and disposition of therapeutic and cosmeceutical compounds.
Springer Japan. pp 55-68.
18. Sugibayashi, K., Todo, H., Oshizaka, T., Owada, Y., 2010. Mathematical model
to predict skin concentration of drugs: toward utilization of silicone membrane
to predict skin concentration of drugs as an animal testing alternative. Pharm
Res. 27, 134-142.
19. Selzer, D., Abdel-Mottaleb, M.M., Hahn, T., Schaefer, U., Neumann, D., 2013.
Finite and infinite dosing: difficulties in measurements, evaluations and
predictions. Adv. Drug Deliv. Rev. 65, 278-294.
20. SCCS/1602/18, 2018. The SCCS's Notes of Guidance for the testing of cosmetic
ingredients and their safety evaluation, 10th revision. Scientific Committee on
Consumer Safety. pp 11-16.
21. SCCS/1416/11, 2012. The SCCS's Notes of Guidance for the testing of cosmetic
ingredients and their safety evaluation, 7th revision. Scientific Committee on
Consumer Safety. pp 68.
22. SCCS/1358/10, 2010. Basic criteria for the in vitro assessment of dermal
absorption of cosmetic ingredients. Scientific Committee on Consumer Safety.
pp 8.
23. Arce, F.V., Asano, N., Yamashita, K., Oda, A., Uchida, T., Sano, T., Todo, H.,
Sugibayashi, K., 2019. Effect of layered application on the skin permeation of
a cosmetic active, rhododendrol. J. Toxicol. Sci. 44, 1-11.
24. Otto, A., Wiechers, J.W., Kelly, C.L., Hadgraft, J., du Plessis, J., 2008. Effect
of penetration modifiers on the dermal and transdermal delivery of drugs and
cosmetic active ingredients. Skin Pharmacol. Physiol. 21, 326-334.
25. Poulsen, B.J., 1973. Design of topical drug products: biopharmaceutics. In:
Ariëns, E.J. (ed.). Drug Design. Academic press, pp. 149-192.
26. Benford, D.J., Cocker, J., Sartorelli, P., Schneide, T., van Hemmen, J., Firth,
J.G., 1999. Dermal route in systemic exposure. Scand. J. Work Environ. Health.
25, 511–520.

71
27. European Commission, 2004. Guidance document on dermal absorption.
Sanco/222/2000 rev. 7.pp 1–15.
28. Rothe, H., Obringer, C., Manwaring, J., Avci, C., Wargniez, W., Eilstein, J.,
Hewitt, N., Cubberley, R., Duplan, H., Lange, D., Jacques-Jasmin, C., Klaric,
M., Schepky, A., Grégoire, S., 2017. Comparison of protocols measuring
diffusion and partition coefficients in the stratum corneum. J. Appl. Toxicol. 37,
806 – 816.
29. Mitragotri, S., Anissimov, Y.G., Bunge, A.L., Frasch, H.F., Guy, R.H.,
Hadgraft, J., Kasting, G.B., Lane, M.E., Roberts, M.S., 2011. Mathematical
models of skin permeability: an overview. Int. J. Pharm. 418, 115 – 129.
30. Lehman, P.A., 2014. A simplified approach for estimating skin permeation
parameters from in vitro finite dose absorption studies. J. Pharm. Sci. 103, 4048
– 4057.
31. Sloan, K.B., Koch, S.A.M., Siver, K.G., Flowers, F.P., 1986. Use of solubility
parameters of drug and vehicle to predict flux through skin. J. Investigativ.
Dermatol. 87, 244 – 252.
32. Hansen, S., Lehr, C.M., Schaefer, U.F., 2013. Improved input parameters for
diffusion models of skin absorption. Adv. Drug. Deliv. Rev. 65, 251 – 264.
33. Kasting, G.B., Miller, M.A., LaCount, T.D., Jaworska, J., 2019. A composite
model for the transport of hydrophilic and lipophilic compounds across the skin:
steady-state behavior. J. Pharm. Sci. 108, 337 – 349.
34. Haq, A., Dorrani, M., Goodyear, B., Joshi, V., Michniak-Kohn, B., 2018.
Membrane properties for permeability testing: skin versus synthetic membranes.
Int. J. Pharm. 539, 58 – 64.
35. Simon, A., Amaro, M.I., Healy, A.M., Cabral, L.M., de Sousa, V.P., 2016.
Comparative evaluation of rivastigmine permeation from a transdermal system
in the Franz cell using synthetic membranes and pig ear skin with in vivo-in
vitro correlation. Int. J. Pharm. 512, 234 – 241.
36. Haq, A., Goodyear, B., Ameen, D., Joshi, V., Michniak-Kohn, B., 2018. Strat-
M synthetic membrane: permeability comparison to human cadaver skin. Int.
J. Pharm. 547, 432-437.
37. Merck, Pioneering skin testing. Experience the unmatched predictability of
Strat-M membrane, Lit. no. MK-BR2545EN ver. 1.0. Merck KGaA, Darmstadt,
Germany. 2018.

72
38. Sugibayashi, K., Yusuf, E., Todo, H., Dahlizar, S., Sakdiset, P., Arce, F.J., See,
G.L., 2019. Halal cosmetics: a review on ingredients, production, and testing
methods. Cosmetics. 6, 1-17.
39. Hatanaka, T., Inuma, M., Sugibayashi, K., Morimoto, Y., 1990. Prediction of
skin permeability of drugs. I. Comparison with artificial membrane. Chem.
Pharm. Bull. 38, 3452-3459.
40. Uchida, T., Kadhum, W., Kanai, S., Todo, H., Oshizaka, T., Sugibayashi, K.,
2015. Prediction of skin permeation by chemical compounds using the artificial
membrane, Strat-M. Eur. J. Pharm. Sci. 67, 113-118.
41. Kwan, Y.H., Tung, Y.K., Kochlar, J.S., Li, H., Poh, A., Kang, L., 2014. Skin
permeation of cosmetics. In: Kwan, Y.H., Tung, Y.K., Kochlar, J.S., Li, H., Poh,
A., Kang, L. (Eds.), Handbook of cosmeceutical excipients and their safeties.
Woodhead Publishing. pp. 31-34.
42. Simon, G., Maibach, H. I., 2000. The pig as an experimental animal model of
percutaneous permeation in man: qualitative and quantitative observations--an
overview. Pharmacol. Appl. Skin Physiol. 13, 229-34.
43. Cilurzo, F., Minghetti, P., Sinico, C., 2007. Newborn pig skin as model
membrane in in vitro drug permeation studies: a technical note. AAPS
PharmSciTech. 8, 97-100.
44. Aoyama, Y., Ito, A., Suzuki, T., Tanemura, A., Nishigori, C., Ito, M., Katayama,
I., Sugiura, S., Matsunaga, K., 2014. The first epidemiological report of
rhododendrol-induced leukoderma in Japan based on a nationwide survey. Jpn.
J. Dermatol. 124, 2095-2109.
45. Arase, N., Yang, L., Tanemura, A., Yang, F., Suenaga, T., Arase, H., Katayama,
I., 2016. The effect of rhododendrol inhibition of NF-kB on melanocytes in the
presence of tyrosinase J. Dermatol. Sci. 83, 148-64.
46. Okura, M., Yamashita, T., Ishii-Osai, Y., Yoshikawa, M., Sumikawa, Y.,
Wakamatsu, K., Ito, S., 2015. Effects of rhododendrol and its metabolic
products on melanocytic cell growth. J. Dermatol. Sci. 80, 142-149.
47. Karadzovska, D., Brooks, J.D., Monteiro-Riviere, N.A., Riviere, J.E., 2013.
Predicting skin permeability from complex vehicles. Adv. Drug Deliv. Rev. 65,
265 – 277.
48. Hojerova, J., Perackova, Z., Berankova, M., 2017. Margin of safety for two UV
filters estimated by in vitro permeation studies mimicking consumer habits:
73
Effects of skin shaving and sunscreen reapplication. Food Chem. Toxicol. 103,
66 – 78.
49. Zhang, X., Yu, Y., Gu, Y., Li, X., Zhang, X., Yu, Y., 2017. In vitro
determination of transdermal permeation of synthetic musks and estimated
dermal uptake through usage of personal care products. Chemosphere. 173, 417
– 424.
50. OECD, 2004a. Organization for Economic Cooperation and Development.
Guideline 428: Skin Absorption. OECD Press. P 8.
51. Flaten, G., Palac, Z., Engesland, A., Filipovic-Grcic, J., Vanic, Z., 2015. In vitro
skin models as a tool in optimization of drug formulation. Eur. J. Pharm. Sci.
75, 10-24.
52. Todo, H., 2017. Transdermal Permeation of Drugs in Various Animal Species.
Pharmaceutics. 3, 9-33.
53. Barbero, AM and Frasch, HF., 2009. Pig and guinea pig skin as surrogates for
human in vitro penetration studies: a quantitative review. Toxicol. In Vitro. 23,
1-13.
54. OECD, 2004b. Organization for Economic Cooperation and Development.
Guidance document for the conduct of skin absorption studies number 28.
OECD Press. pp 14.
55. OECD, 2011. Organization for Economic Cooperation and Development.
Guidance Notes on Dermal Absorption. Series on Testing and Assessment
number 156. OECD Press. pp 26.
56. Akomea, F., Nazir, T., Martin, GP., Brown, MB., 2004. Effect of heat on the
percutaneous absorption and skin retention of three model penetrants. Eur. J.
Pharm. Sci. 21, 337-345.
57. Hao, J., Ghosh, P., Newman, B., Kasting, G., Raney, S., 2016. Heat effects on
drug delivery across human skin. Expert Opin. Drug Deliv. 13, 755- 768.
58. Coldman, M., Poulsen, B., Higuchi, T., 1969. Enhancement of percutaneous
absorption by the use of volatile: nonsolvent system as vehicles. J. Pharm. Sci.
58, 1098-1102.
59. Santos, P., Watkinson, A., Hadgraft, J., Lane, M., 2010. Oxybutynin permeation
in skin: The influence of drug and solvent activity. Int. J. Pharm., 384, 67-72.
60. Lane, M., Hadgraft, J., Oliveira, G., Viiera, R., Mohammed, D., Hirata, K., 2012.
Rational formulation Design. Int. J. Cosmet. Sci. 34, 496- 501.
74
61. Oliveira, G., Hadgraft, J., Lane, M.E., 2012. The influence of volatile solvents
on transport across model membranes and human skin. Int. J. Pharm. 435, 38-
49.
62. Tanaka, S., Takashima, Y., Murayama, H., Tsuchiya, S., 1985. Studies on drug
release from ointments. V. Release of hydrocortisone butyrate propionate from
topical dosage forms to silicone rubber. Int. J. Pharm. 27, 29- 38.
63. Wang, T., Kasichayanula, S., Gu, X., 2006. In vitro permeation of repellent
DEET and sunscreen oxybenzone across three artificial membranes. Int. J.
Pharm. 310, 110- 117.
64. Gu, X., Wang, T., Collins, D., Kasichayanula, S. and Burczynski, F., 2005. In
vitro evaluation of concurrent use of commercially available insect repellent and
sunscreen preparation. Br. J. Dermatol. 152, 1263- 1267.
65. Karakatsani, M., Dedhiya, M., Plakogiannis, FM., 2010. The effect of
permeation enhancers on the viscosity and the release profile of transdermal
hydroxyropyl methylcellulose gel formulations containing diltiazem HCl. Drug
Dev. Ind. Pharm. 36, 1195-206.
66. Ross, J., Shah, J., 2000. Reduction in skin permeation of N, N-diethyl-m-
toluamide (DEET) by altering the skin/vehicle partition coefficient. J. Control.
Release 67, 211-21.
67. Hadgraft, J., Lane, M., 2016. Advanced topical formulations. Int. J. Pharm., 514,
52-57.
68. Gajjar, R., Miller, M., Kasting, G., 2013. Evaporation of volatile organic
compounds from human skin in vitro. Ann. Occup. Hyg. 57, 853 – 865.
69. Magnusson, B.M., Pugh, W.J., Roberts, M.S., 2004. Simple rules defining the
potential of compounds for transdermal delivery or toxicity. Pharm. Res. 21,
1047 – 1054.
70. Wiechers J.W., Watkinson, A.C., Cross, S.E., Roberts, M.S., 2012. Predicting
skin penetration of actives from complex cosmetic formulations: an evaluation
of inter formulation and inter active effects during formulation optimization for
transdermal delivery. Int. J. Cosmet. Sci. 34, 525 – 535.
71. Potts, R., Guy, R., 1992. Predicting skin permeability. Pharm. Res. 9, 663-669.
72. Dias, M., Hadgraft, J., Lane, M.E., 2007. Influence of membrane-solvent-solute
interactions on solute permeation in skin. Int. J. Pharm. 340, 65 – 70.

75
73. Oshizaka, T., Kikuchi, K., Kadhum, W., Todo, H., Hatanaka, T., Wierzba, K.,
Sugibayashi, K., 2014. Estimation of skin concentrations of topically applied
lidocaine at each depth profile. Int J. Pharm. 475, 292-297.
74. Hada, N., Hasegawa, T., Takahashi, H., Ishibashi, T., Sugibayashi, K., 2005.
Culture skin loaded with tetracycline HCl and chloramphenicol as dermal
delivery system: mathematical evaluation of the cultured skin containing
antibiotics. J Control. Release. 108, 341-350.
75. Ishii, H., Todo, H., Sugibayashi, K., 2010. Effect of thermodynamic activity on
skin permeation and skin concentration of triamcinolone acetonide. Chem.
Pharm. Bull. 58, 556 – 561.
76. Sato, K., Mitsui, N., Hasegawa, T., Sugibayashi, K., Morimoto, Y., 2001.
Potential usefulness of solubility index for prediction of the skin permeation
rate of 5-ISMN from pressure-sensitive adhesive tape. J Control. Release. 73,
269-277.
77. Wiechers, J.W., Kelly, C.L., Blease, T.G., Dederen, J.C., 2004. Formulating for
efficacy. Int. J. Cosmet. Sci. 26, 173-182.
78. Oliveira, G., Hadgraft, J., Lane, M.E., 2012. The influence of volatile solvents
on transport across model membranes and human skin. Int. J. Pharm. 435, 38 –
49.
79. Schaefer, U., Lippold, B., Leopold, C., 2007. Formulation issues, in: Roberts,
M, Walters, K. (Eds.). Dermal absorption and toxicity assessment. Informa
healthcare. pp 117-120.
80. Uchida, T., Nishioka, K., Anzu, M., Yakumaru, M., Sano, T., Todo, H.,
Sugibayashi, K., 2016. Effect of esters on the permeation of chemicals with
different polarities through synthetic artificial membranes using high-
throughput diffusion cell array. Chem. Pharm. Bull. 64, 1597-1606.
81. Karadzovska, D., Riviere, J., 2013. Assessing vehicle effects on skin absorption
using artificial membrane assays. Eur. J. Pharm. Sci. 50, 569-576.
82. Sakdiset, P., Kitao, Y., Todo, H., Sugibayashi, K., 2017. High-throughput
screening of potential skin penetration-enhancers using stratum corneum lipid
liposomes; preliminary evaluation for different concentrations of ethanol. J.
Pharm. 1-11.