Embed Size (px)
Citation preview

2
Abstract
In September 2020, Derasat and the United Nations Development Programme (UNDP) in Bahrain
conducted three household surveys to evaluate the socioeconomic impact of Covid-19 in the
Kingdom of Bahrain, the UK, and the US. Questions covered the impact on employment, the impact
on the allocation of time to non-work tasks, on the nature of support participants deemed most
desirable, and on participants’ plans for dealing with the financial challenges associated with the
pandemic. Approximately 3,000 people participated in the three surveys: for the survey conducted in
Bahrain, 700 Bahrainis and 300 Bangladeshis living in Bahrain responded; the other two surveys
carried out for comparison purposes reached 1,000 members of the UK population and 1,000
members of the US population. All three surveys were actually or nearly nationally-representative.
This report presents and analyzes the resulting data.
Ghada Abdulla is a research associate at the Bahrain Center for Strategic, International and Energy
Studies (Derasat), Deema Almoayyed is a Research Associate at UNDP Bahrain, Fatima Al-Sebaie is a
research fellow at Derasat, and Omar Al-Ubaydli is the director of research at Derasat. This project is
funded by a generous grant from UNDP. The authors wish to express their gratitude to
(alphabetically) Ahmad AlAmmadi, Ejlal Bubshait and Stefano Pettinato for valuable comments, to the
Embassy of Bangladesh in the Kingdom of Bahrain for support in distributing the survey, and to the
Information and eGovernment Authority for demographic data. Views expressed in this study are
those of the authors and do not necessarily reflect Derasat’s or UNDP’s point-of-view.
3
Table of Contents
Executive Summary ....................................................................................................................................................... 4
1. Introduction ................................................................................................................................................................ 6
2. The Spread of the Coronavirus in Bahrain, the UK, and the US ...................................................................... 9
3. Survey Method ........................................................................................................................................................ 13
3.1. Survey Questions ........................................................................................................................................... 13
3.2. Participants and Sampling ........................................................................................................................... 14
3.3. Distribution of the Survey ............................................................................................................................ 15
4. Results........................................................................................................................................................................ 17
4.1. General Demographics ................................................................................................................................. 17
4.2. Headline International Comparisons ........................................................................................................ 23
4.3. Selected Subnational Results ...................................................................................................................... 34
5. Summary ................................................................................................................................................................... 54
References ..................................................................................................................................................................... 57
Appendix: Full Survey ................................................................................................................................................. 59

4
Executive Summary
In September 2020, approximately 3,000 participants took part in three short online surveys assessing
the socioeconomic impact of Covid-19. One of them was carried out in Bahrain, and the other two in the
UK and in the US, the latter two executed for comparison purposes. The surveys fell under the umbrella
of UNDP’s international efforts at gauging the consequences of the pandemic by working with local
partners, or the Socio-Economic Impact Assessment; the specific project covered by this report is the
result of a partnership between Derasat and UNDP Bahrain.
The three surveys reached 3,000 respondents, reaching a nearly nationally representative sample of
approximately 700 Bahrainis living in Bahrain, a nearly nationally representative sample of
approximately 300 Bangladeshis living in Bahrain, a nationally representative sample of approximately
1,000 members of the UK population, and a nationally representative sample of approximately 1,000
members of the US population. The main results were as follows.
1. All four groups suffered considerable amounts of self-reported economic distress, in the form of job
losses and decreased income. In general, people with lower education levels reported greater
difficulty in dealing with the pandemic than people with higher education levels.
2. Bahrainis in Bahrain suffered the lowest amount of self-reported economic distress, followed by
approximately equal levels of economic distress among the UK and US populations. The highest
levels of economic distress were reported by Bangladeshis in Bahrain.
3. Bahraini youth gained primary and secondary jobs, whereas all other groups in Bahrain and in other
countries lost them. In the employment domain, Bahraini women generally fared better than Bahraini
men, whereas in the UK and US, the reverse was true.
4. For all four groups of participants, the reported time allocation towards non-work tasks was affected
considerably. In the case of Bangladeshis in Bahrain, an increase in the time allocated to job search
and supplementing income meant a decrease in the time allocated to most non-work activities. For
the remaining three groups, preparing meals, assisting/supervising children and the elderly, and
consuming media all received a significantly larger allocation of time, whereas socializing,

5
leisure/entertainment, and health (except exercise) all witnessed significant declines in time
allocations.
5. In all groups, changes in time allocation were quite sensitive to gender and age group, with non-youth
women allocating significantly more time than their male counterparts to assisting children and the
elderly; and young people generally sleeping more and consuming more leisure. (The data for
Bangladeshis living in Bahrain was not broken down demographically due to the overwhelming
concentration of participants in the “25-44 year-old men” category)
6. The data revealed significant heterogeneity in the kinds of support deemed most desirable. Bahrainis
in Bahrain saw job-market training and loan deferrals as the most attractive, while Bangladeshis in
Bahrain sought job information and rent support. In the UK and US, training and psychological
support were the two most popular choices. These differences reflect deeper differences in the labor
markets, the structures of household finances, and access to support systems.
7. Women were more likely to express a desire for psychological support than were men; whereas men
were more likely than women to express a preference for economic support.
8. When describing their plans for coping with the financial difficulties created by Covid-19, the
populations of the UK and US, as well as Bangladeshis in Bahrain, exhibited great readiness to rely
on a mixture of new employment, running down savings, and decreasing spending. For Bahrainis,
seeking loans and the assistance of friends/family and non-profits was prominent.

6
1. Introduction
Since it commenced in December 2019, the Covid-19 pandemic has caused an unprecedented level of
health and socioeconomic damage across the globe. By the end of September 2020, over one million
Covid-19-related deaths had been reported internationally (Worldometer, 2020), and during its June
2020 World Economic Outlook update, the International Monetary Fund (IMF) predicted a 5%
contraction in the global economy for 2020, in addition to millions of job losses, with highly uncertain
prospects for an economic recovery (IMF, 2020).
In response to the extraordinary and existential threat that Covid-19 poses to the global economy and to
individuals lives and livelihoods, governments across the world have enacted exceptional fiscal and
monetary policy measures (Al-Ubaydli, 2020). While the success of these interventions remains to be
seen, the associated debt is nearly certain to transform into a major burden for taxpayers for the
foreseeable future, ensuring that the impact will be long-lasting even once a solution to the health-
aspects of the pandemic is devised, such as through the development of a vaccine.
The social and psychological fallout has been great, too (Pfefferbaum and North, 2020), and the long-
term repercussions of the pandemic are exacerbated by the fact that it has led to an increase in the level
of inequality between rich and poor, men and women, those with high vs. low levels of education, and
so on (Alon et al., 2020). For this reason, policymakers have had to develop novel policy instruments for
tackling the crisis.
The Kingdom of Bahrain has been acutely affected by the pandemic. Though its death rate of 143 deaths
per million has been approximately equal to the world average of 129, the economy has been severely
affected by the loss of international tourists and the sharp decline in oil prices, leading to a second-
quarter decline in GDP equal to approximately 9% (IGA, 2020). In an attempt to limit the impact,
Bahrain’s government has experimented with new policies, such as paying utility bills on behalf of
citizens, paying the salaries of citizens working in the private sector (both as part of a large fiscal stimulus
package), deferring loan repayments, and developing systems for remote working and distance learning.

7
High quality data constitute an important input into the policymaking process, both as inspiration during
the genesis phase, and as a source of instructions on how to fine-tune policies during the revision stage.
The unprecedented nature of the Covid-19 pandemic means that many of the traditional and extant data-
gathering systems need to be developed to ensure that policymakers acquire the information that they
need. Moreover, all societal stakeholders, including individuals and civil society organizations, need to
have a continuous flow of up to date information to allow them to assess their own interests accurately,
and to enable them to participate in solving the difficult problems raised by the pandemic.
This report attempts to contribute to this process by reporting the results of – and analyzing – the data
gathered from a large, international survey of the socioeconomic impact of Covid-19. During September
2020, a total of approximately 3,000 people participated in three short online surveys wherein they
reported their experiences regarding employment, economic and social Covid-19 related problems, and
changes in the time they allocate to various non-work tasks. Participants also described the support that
they regarded as most helpful, as well as their intentions for dealing with the financial difficulties caused
by the pandemic.
The survey conducted in Bahrain mainly focused on two groups of people residing in the Kingdom:
Bahraini citizens and Bangladeshi citizens, the latter of which represent one of the most adversely
affected communities of migrant workers in Bahrain. Approximately 700 Bahraini citizens and 300
Bangladeshi citizens participated in the survey, allowing researchers to produce nationally representative
estimates of various aspects of the socioeconomic impact of the pandemic. Two additional surveys were
distributed, reaching a nationally representative sample of 1,000 members of the UK’s population, and a
nationally representative sample of 1,000 members of the US’ population, in an attempt to benchmark
the findings for the Kingdom of Bahrain.
The data provide readers with important insights about the pandemic’s effects on people’s lives and
livelihoods in the four groups of participants across the three countries surveyed. The most prominent
finding is that all groups have experienced high levels of socioeconomic distress since the start of 2020,
reflected in loss of employment opportunities, income, leisure time, and psychological well-being.

8
The data also reveal high levels of variation in the effects of Covid-19 by age group, gender, education
level, and several other mediating variables. In general, the survey’s results affirm the importance of
gathering high quality data as an input into the policymaking process, as many of the findings were
unforeseen and surprising.
The remainder of this report is organized as follows. Section 2 provides readers with an overview of the
spread of the coronavirus in Bahrain, the UK, and the US, and of the evolution of the non-pharmaceutical
interventions (NPIs) implemented in these countries, to provide context for understanding the data
gathered in the surveys. Section 3 describes the method used for gathering the data. Section 4 presents
the results in three tranches: the participants’ general demographic, the headline comparisons between
the four groups, and selected results that emerge when disaggregating the data by demographic category
or other mediating variables. Section 5 summarizes the findings.

9
2. The Spread of the Coronavirus in Bahrain, the UK, and the US
Cases of Covid-19 began to be reported in all three of the Kingdom of Bahrain, the UK, and the US during
February 2020. Figure 2.1 shows the number of daily new cases per million people for the three
countries, while Figure 2.2 shows the number of daily new deaths per million people.
Figure 2.1: Daily new Covid-19 cases per million people
Source: Our World in Data (2020)
Figure 2.2: Daily new Covid-19 deaths per million people
Source: Our World in Data (2020)
0
200
400
600
800
2/1/2020 3/1/2020 4/1/2020 5/1/2020 6/1/2020 7/1/2020 8/1/2020 9/1/2020
Bahrain UK USA
0
5
10
15
20
2/1/2020 3/1/2020 4/1/2020 5/1/2020 6/1/2020 7/1/2020 8/1/2020 9/1/2020
Bahrain UK USA
10
Note that comparisons of the daily new cases per million should take into account the fact that Bahrain
has over two times as many tests per million as do the UK and US (Worldometer, 2020), and this is due
to the high levels of testing in the Bahrain, rather than low levels of testing in the UK and US; in fact, as
of late September, Bahrain was ranked eighth in the world for tests per million, with over 820,000. With
this in mind, the most salient features of the data are as follows.
First, the UK and US had an early spike in cases during April 2020. Thereafter, cases in the UK declined
to low levels, before surging again during August 2020, and continuing to rise since that time. In the US,
cases started increasing again during late June 2020, rising to a new peak in early August 2020, before
declining gradually, and then starting to increase again during the middle of September 2020. Cases in
Bahrain follow a different pattern: they start to rise during the middle April 2020, reaching a peak in the
middle of June 2020. They then decline gradually until the end of August 2020, before starting to rise
sharply again.
Overall, daily new cases per capita are highest in Bahrain, followed by the US, and then the UK. All are
significantly higher than the world average.
Second, new deaths per million were very limited in Bahrain at the start of the pandemic, but have been
steady at a little under one death per million since the start of July 2020. In contrast, the UK and US had
a very large surge in deaths per million during April/May 2020 before subsiding, and then rising again
gradually in the case of the US. Cumulative deaths per million in the UK and US are around four times
the corresponding figure for Bahrain. In terms of cumulative deaths per million, Bahrain is close to the
world average, whereas the UK and US have much higher levels, both of them being ranked in the top
10.
A key takeaway from both figures is that in at least one out of the volume of cases per capita and the
volume of deaths per capita, Bahrain, the UK, and the US are all significantly higher than the world
average, setting the stage for a significant socioeconomic impact for Covid-19. These health-based
factors are reinforced by the range of NPIs adopted by the three countries. Table 2.1 below shows the
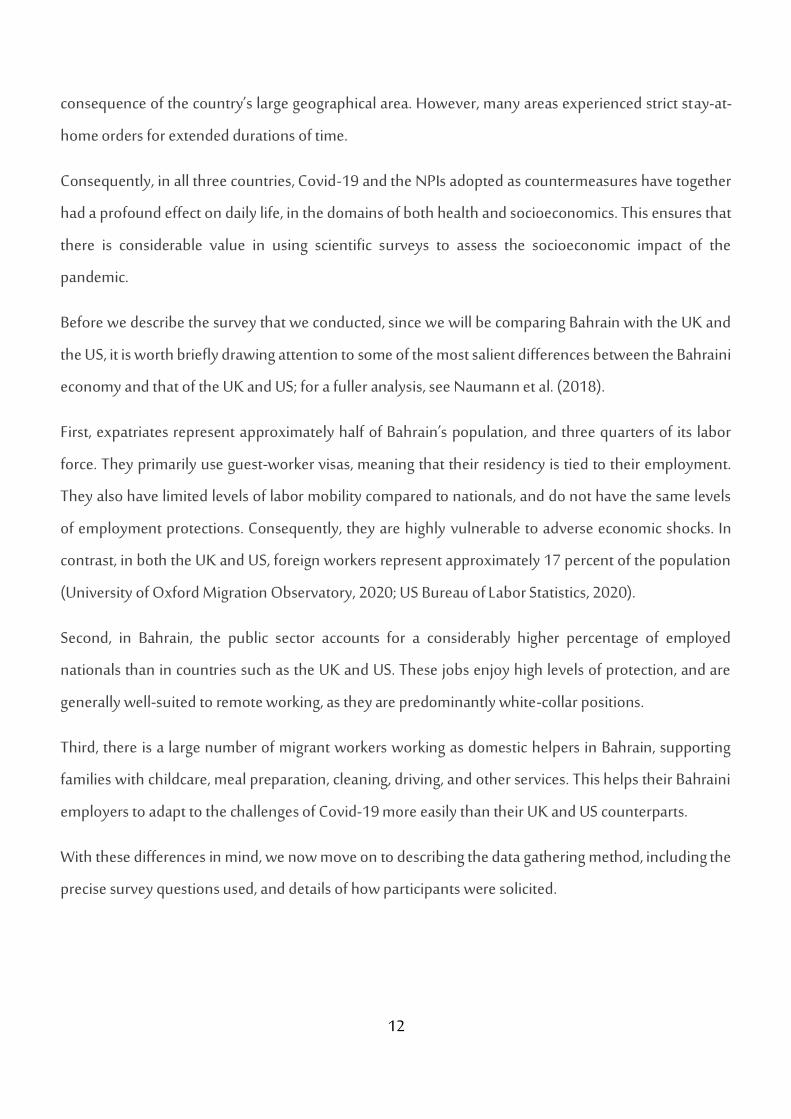
major NPIs in Bahrain since the start of the crisis.

11
Table 2.1: Timeline of Major Covid-19 Non-Pharmaceutical Interventions in Bahrain
Source: Be Aware App (IGA, 2020)
The stringency of measures generally mimics the path of cases: initially, the emphasis was on the
adoption of social distancing measures, including the closure of schools. During the period of May-
August 2020, gradual relaxations were instituted, but in September, in response to the rising cases, the
planned opening of schools was delayed, as was the opening of indoor dining. Notably, as of September
2020, Bahrain has avoided the imposition of stay-at-home orders.
In the case of the UK, a broadly similar path has been adopted, including the reimposition of restrictions
during September 2020 in response to rising cases. The earlier period also featured a complete lockdown,
to the high death rates experienced. The US is much harder to summarize, due to its federal political
structure – creating decentralized and heterogeneous policy responses – and due to the high levels of
internal heterogeneity in the spread of the pandemic and in terms of the deaths, which is itself a natural
Date Decision
2/25/2020 Universities, Schools and Kindergartens closed for two weeks (extended indefinitely on 3/5)
3/17/2020 The activities of all resturants, tourist facilities and places of serving food and beverages are limitted to external orders and delivery
3/17/2020 All commercial movie theaters, sports gyms, fitness studios, swimming pools and recreaional activities closed
3/17/2020 Limiting the service offered by shisha cafes to takeout and delivery of food and beerages only
3/17/2020 Limiting public gatherings to 20 or less people and commiting to stay home as much as possible and going out for necessity only
3/22/2020 Remote work policy introduced covering 50% of government employees
3/23/2020 Suspended the holding of congregational prayers across all mosques and prayer areas
3/25/2020 Entry to Bahrain became restricted
3/26/2020 Banning of gatherings of more than five people
3/26/2020 Closed non essential buisnesses for two weeks until April 09 .
4/3/2020 Transit through Bahrain Airport reopened for international travelers
4/9/2020 Mandated wearing masks in public and intoduced a fine for violators
4/23/2020 Non essential comercial and industrial shops to close for two weeks until May 6
5/7/2020 Reopened commercial and industrial shops, with restrictions for two weeks until May 20
5/21/2020 Retail and industrial buesiness can resume operations as ussual (with certain conditions)
6/1/2020 Announced reopening of public schools on Sep 16
6/7/2020 Home -isolation for active asymptomatic cases became optional
7/28/2020 Licensed restuarants to reopen for private booking of no more than 20 people
8/26/2020 Decided to gradually reopen Mosques, with the commencement of Fajr prayers only Starting from Friday 28th of August.
9/3/2020 reopenening of outdoor dining at resturants and coffee shops
9/17/2020 Postpone the reopening of indoor dining services at resturant and cafes until 24 October 2020.
12
consequence of the country’s large geographical area. However, many areas experienced strict stay-at-
home orders for extended durations of time.
Consequently, in all three countries, Covid-19 and the NPIs adopted as countermeasures have together
had a profound effect on daily life, in the domains of both health and socioeconomics. This ensures that
there is considerable value in using scientific surveys to assess the socioeconomic impact of the
pandemic.
Before we describe the survey that we conducted, since we will be comparing Bahrain with the UK and
the US, it is worth briefly drawing attention to some of the most salient differences between the Bahraini
economy and that of the UK and US; for a fuller analysis, see Naumann et al. (2018).
First, expatriates represent approximately half of Bahrain’s population, and three quarters of its labor
force. They primarily use guest-worker visas, meaning that their residency is tied to their employment.
They also have limited levels of labor mobility compared to nationals, and do not have the same levels
of employment protections. Consequently, they are highly vulnerable to adverse economic shocks. In
contrast, in both the UK and US, foreign workers represent approximately 17 percent of the population
(University of Oxford Migration Observatory, 2020; US Bureau of Labor Statistics, 2020).
Second, in Bahrain, the public sector accounts for a considerably higher percentage of employed
nationals than in countries such as the UK and US. These jobs enjoy high levels of protection, and are
generally well-suited to remote working, as they are predominantly white-collar positions.
Third, there is a large number of migrant workers working as domestic helpers in Bahrain, supporting
families with childcare, meal preparation, cleaning, driving, and other services. This helps their Bahraini
employers to adapt to the challenges of Covid-19 more easily than their UK and US counterparts.
With these differences in mind, we now move on to describing the data gathering method, including the
precise survey questions used, and details of how participants were solicited.
13
3. Survey Method
3.1. Survey Questions
All three surveys shared the same structure, with identical questions and sequence in which they
appeared in the questionnaire.
When designing the survey’s questions, we sought to realize the following goals.
1. A high rate of participation among Bahrainis and non-Bahrainis residing in the Kingdom of
Bahrain; in particular, we targeted a nationally-representative sample of at least 500 Bahraini
citizens.
2. Gathering data that was complementary to the existing data that had been gathered in the
Kingdom of Bahrain, most notably the regular business surveys conducted by the Bahrain
Chamber of Commerce and Industry (BCCI), and the detailed and high frequency employment
data gathered by the Labor Market Regulatory Authority (LMRA).
3. Gathering data that would support policymaking and be scientifically valuable.
In all surveys, there is a tradeoff between the participation/completion rate on the one hand, and the
volume of data gathered per participant on the other hand, especially given that all participation in
Bahrain was uncompensated (see below for the UK and US cases). For this reason, we settled on a series
of questions that would take no more than approximately five minutes to answer. The full survey is
included in the Appendix. After choosing their preferred language and declaring that they were at least
18 years of age, participants proceeded to six groups of questions.
The first group of questions examined employment status: did respondents gain or lose a primary and/or
secondary job since the start of the pandemic? And for those who retained either a primary or secondary
job, how did their hours change, using a Likert scale. Note that the question was not phrased in a way
that explicitly differentiated between regular employment, self-employment, business ownership, and
so on. We chose this due to a strong preference for conciseness; a wordy clarification of all of the different
interpretations would have adversely affected the participation rate. This advantage comes at the cost of
14
having an imprecise and participant-dependent definition of the term “employment”. For the remainder
of this report, we use the term “employment” to refer to what the survey measures.
In addition to this semantic issue, the resultant data can be considered indirect indicators of the
unemployment rate, but not a direct measure that can be interpreted at face value, since the survey did
not address the issue of labor force participation.
The second group of questions posited a series of socioeconomic challenges that the participant was
likely to have encountered due to the pandemic (access to food, loss of income, decreased leisure time,
etc.), and then asked the participant to evaluate, using a Likert scale, the extent to which they had faced
difficulty in dealing with the challenges.
The third group of questions explored how the participant had changed the time they allocated to a series
of non-work tasks, according to a Likert scale. These included tasks such as sleeping, socializing,
childcare, homeschooling, and so on.
The fourth group of questions inquired about the sort of support that the participant deemed most
desirable. The options included labor market support, such as training or information about job
opportunities; financial support, such as loan deferrals; psychological support; and so on.
The fifth group of questions examined how participants were planning on dealing with the financial
difficulties caused by the pandemic. Using a Likert scale, they would declare their intentions regarding
spending habits, seeking financial support from family/friends, and so on.
The sixth and last group of questions was demographic: gender, age category, marital status, nationality,
region, the number of children, the number of elderly assisted, and education level.
3.2. Participants and Sampling
The initial target for Bahrainis was a nationally representative sample of size 500. Using demographic
data from the national statistics office (IGA), Table 3.2.1 shows the distribution of target observations by

15
gender, age-group, and governorate (the sub-national region in the Kingdom of Bahrain), with the actual
number of observations gathered in parentheses (we comment on these in section 4.1).
Participation among non-Bahrainis was expected to be low, with the exception of the Bangladeshi
community, due to assistance from the Embassy of Bangladesh in distributing the survey. The
Bangladeshi community is the second largest non-Bahraini community (after Indians) residing in the
Kingdom of Bahrain. In the initial target was a nationally representative sample of size 200. Table 3.2.2
shows the distribution by gender and age-group, along with actual data gathered.
Table 3.2.1: The composition of a nationally representative sample of 500 Bahraini citizens with
actual observations collected in parentheses
Source: Information and eGovernment Authority
Table 3.2.2: The composition of a nationally representative sample of 200 Bangladeshi citizens
with actual observations collected in parentheses
Source: Information and eGovernment Authority
Overall, by nationality, Bahrainis were expected to be the nationality that was least affected by the
pandemic, due to their being explicitly and exclusively targeted by many of the government assistance
programs. Bangladeshis were expected to represent one of the most severely affected groups of migrant
workers, due to their comparatively low education levels, their concentration in low-wage jobs, and
lower social protections.
Male Female Male Female Male Female
Capital 12 (11) 12 (8) 28 (45) 27 (47) 22 (19) 22 (22)
Muharraq 10 (15) 9 (10) 22 (56) 21 (35) 17 (17) 17 (15)
Northern 18 (15) 17 (23) 42 (56) 41 (70) 33 (21) 33 (25)
Southern 10 (16) 9 (4) 22 (45) 22 (51) 17 (15) 17 (19)
Governorate
Age group
Gender
18-24 25-44 45+
Male Female
18-24 0 (16) 1 (0)
25-44 173 (254) 2 (5)
45+ 23 (7) 1 (1)
Age group
Gender

16
As a contemporaneous point of comparison for the data gathered in the Kingdom of Bahrain, we also
gathered data based on the UK and US populations via a third party (see below). In each case, the target
sample was a nationally representative sample of size 1,000.
3.3. Distribution of the Survey
The survey was delivered online via Lime Survey. It could be accessed via any mainstream web browser,
via desktop/laptop computers, tablets, and mobile telephones. The survey was active for the period 8
September 2020 – 27 September 2020.
The survey targeting Bahrainis was initially distributed by text message to a list of people who had
expressed an interest in participating in surveys. It was subsequently distributed via a variety of social
media channels, including those of Derasat and UNDP Bahrain. Press releases in the local media were
used to increase awareness about the survey. During the third and final week, distribution via social
media was boosted via paid advertisements. Distribution among the Bangladeshi community was
supported by the Embassy of Bangladesh in the Kingdom of Bahrain.
The surveys targeting the UK and US populations were distributed via a third party specializing in online
survey research. The company provides researchers with nationally representative samples of
participants, balanced by gender, age-group, and ethnicity.
17
4. Results
4.1. General Demographics
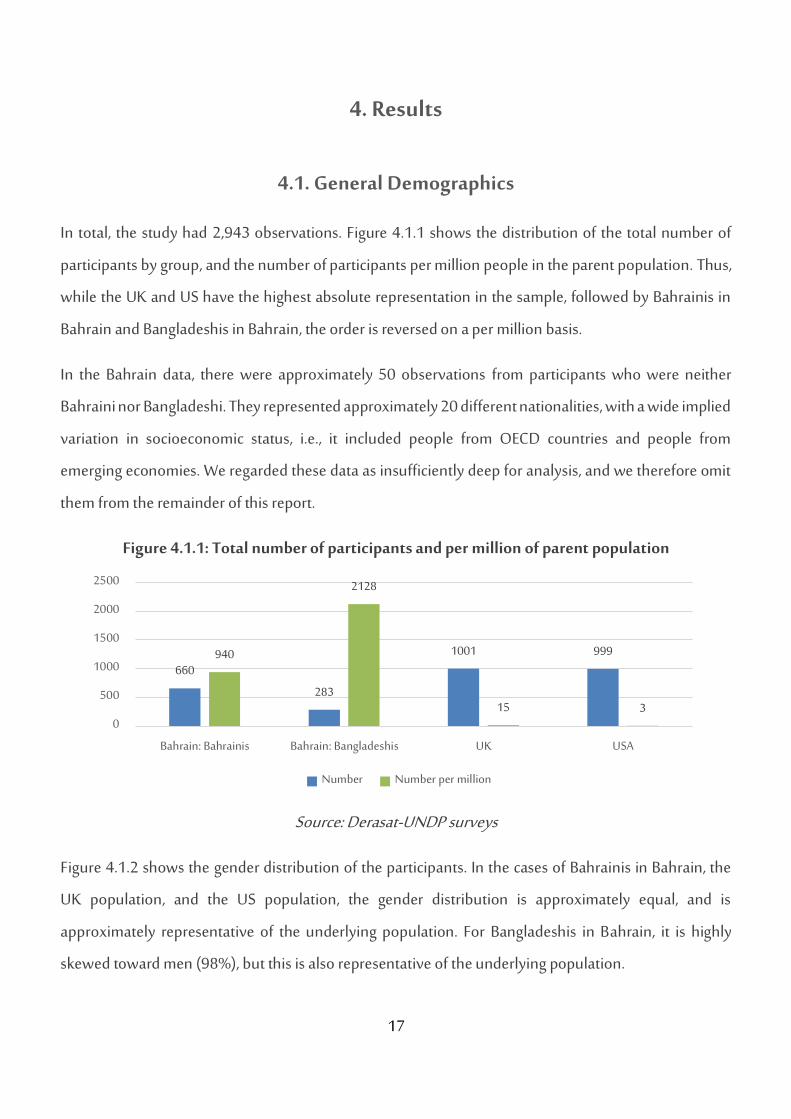
In total, the study had 2,943 observations. Figure 4.1.1 shows the distribution of the total number of
participants by group, and the number of participants per million people in the parent population. Thus,
while the UK and US have the highest absolute representation in the sample, followed by Bahrainis in
Bahrain and Bangladeshis in Bahrain, the order is reversed on a per million basis.
In the Bahrain data, there were approximately 50 observations from participants who were neither
Bahraini nor Bangladeshi. They represented approximately 20 different nationalities, with a wide implied
variation in socioeconomic status, i.e., it included people from OECD countries and people from
emerging economies. We regarded these data as insufficiently deep for analysis, and we therefore omit
them from the remainder of this report.
Figure 4.1.1: Total number of participants and per million of parent population
Source: Derasat-UNDP surveys
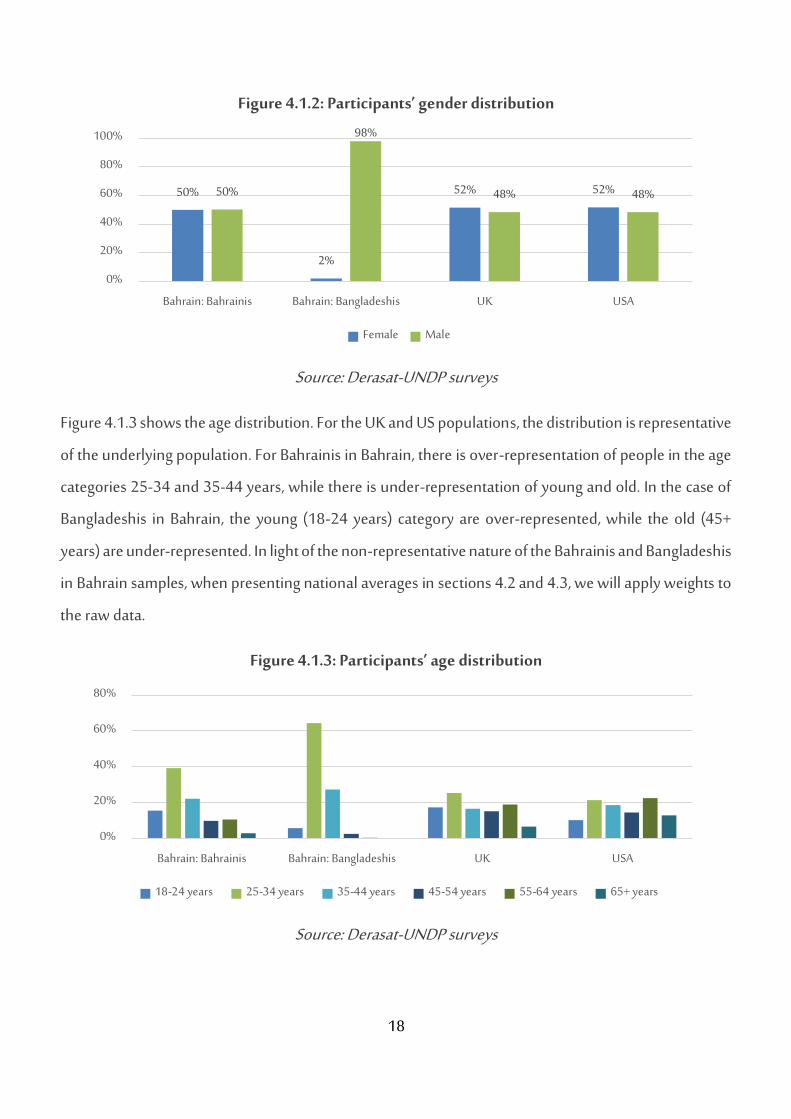
Figure 4.1.2 shows the gender distribution of the participants. In the cases of Bahrainis in Bahrain, the
UK population, and the US population, the gender distribution is approximately equal, and is
approximately representative of the underlying population. For Bangladeshis in Bahrain, it is highly
skewed toward men (98%), but this is also representative of the underlying population.
660
283
1001 999940
2128
15 30
500
1000
1500
2000
2500
Bahrain: Bahrainis Bahrain: Bangladeshis UK USA
Number Number per million
18
Figure 4.1.2: Participants’ gender distribution
Source: Derasat-UNDP surveys
Figure 4.1.3 shows the age distribution. For the UK and US populations, the distribution is representative
of the underlying population. For Bahrainis in Bahrain, there is over-representation of people in the age
categories 25-34 and 35-44 years, while there is under-representation of young and old. In the case of
Bangladeshis in Bahrain, the young (18-24 years) category are over-represented, while the old (45+
years) are under-represented. In light of the non-representative nature of the Bahrainis and Bangladeshis
in Bahrain samples, when presenting national averages in sections 4.2 and 4.3, we will apply weights to
the raw data.
Figure 4.1.3: Participants’ age distribution
Source: Derasat-UNDP surveys
50%
2%
52% 52%50%
98%
48% 48%
0%
20%
40%
60%
80%
100%
Bahrain: Bahrainis Bahrain: Bangladeshis UK USA
Female Male
0%
20%
40%
60%
80%
Bahrain: Bahrainis Bahrain: Bangladeshis UK USA
18-24 years 25-34 years 35-44 years 45-54 years 55-64 years 65+ years

19
Figure 4.1.4a shows the regional distribution for Bahrainis and Bangladeshis in Bahrain. In the case of
Bahrainis, each of Muharraq and the Southern governorates are slightly over-represented, while each of
the Capital and Northern governorates are slightly under-represented. In the case of Bangladeshis, the
Capital is slightly over-represented, while each of the remaining three governorates are slightly under-
represented.
Figure 4.1.4a: Bahraini participants’ regional (governorate) distribution
Source: Derasat-UNDP surveys
Figure 4.1.4b shows the regional distribution of UK participants, and Figure 4.1.4c shows the regional
distribution of US participants. In the case of the US, multiple definitions of region exist; we use the
Bureau of Economic Analysis system, which divides the US into eight regions.
Figure 4.1.4b: UK participants’ regional distribution
Source: Derasat-UNDP surveys
23%
64%
22%11%
32%
10%
23%15%
0%
20%
40%
60%
80%
Bahrain: Bahrainis Bahrain: Bangladeshis
Capital Muharraq Northern Southern
9%
14%
3%
11%
1%
9%
14%
10%
5%
8% 8%
0%
5%
10%
15%
East
Midlands
London North
East
North
West
Northern
Ireland
Scotland South
East
South
West
Wales West
Midlands
Yorkshire
and the
Humber
20
As mentioned above, the UK and US data are nationally representative in terms of gender, age, and
ethnicity (a variable which we do not gather data on). We do not compare our regional distributions to
the population distribution; we merely note that they confirm the existence of significant representation
for all subnational regions in the UK and US, with the exception of Northern Ireland in the UK, which
only accounts for 1% of the data.
Figure 4.1.4c: US participants’ regional (BEA) distribution
Source: Derasat-UNDP surveys
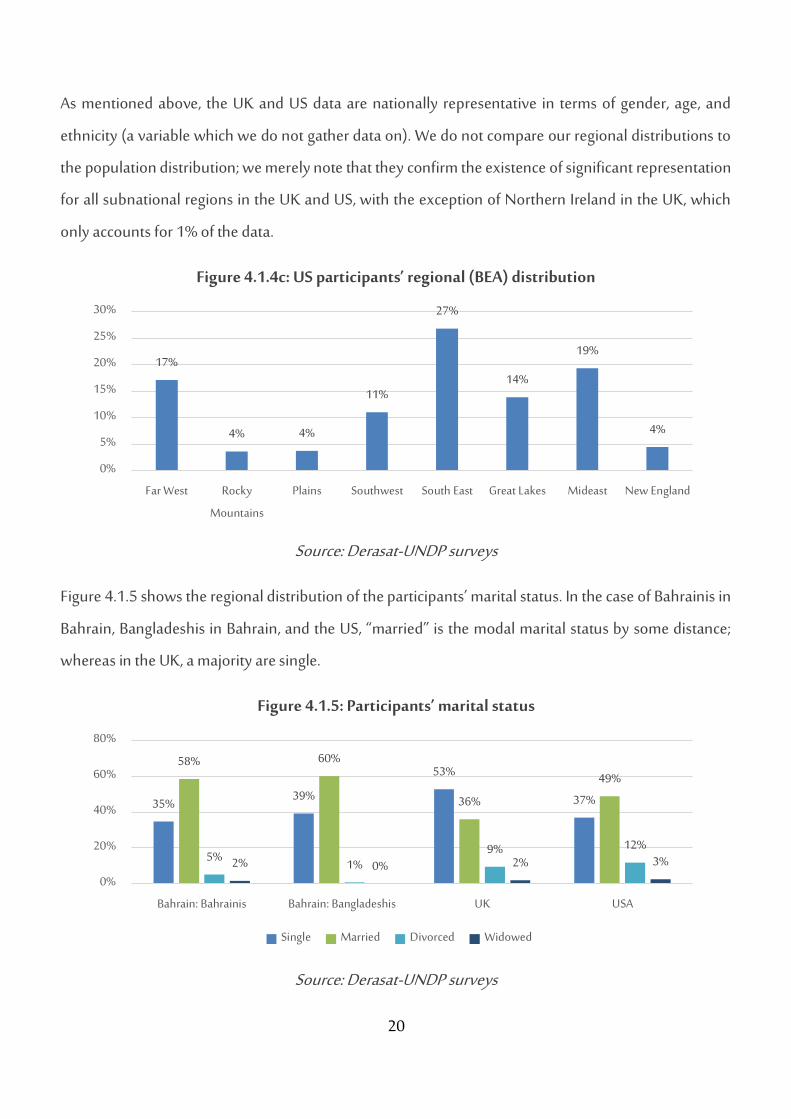
Figure 4.1.5 shows the regional distribution of the participants’ marital status. In the case of Bahrainis in
Bahrain, Bangladeshis in Bahrain, and the US, “married” is the modal marital status by some distance;
whereas in the UK, a majority are single.
Figure 4.1.5: Participants’ marital status
Source: Derasat-UNDP surveys
17%
4% 4%
11%
27%
14%
19%
4%
0%
5%
10%
15%
20%
25%
30%
Far West Rocky
Mountains
Plains Southwest South East Great Lakes Mideast New England
35%39%
53%
37%
58% 60%
36%
49%
5% 1%9% 12%
2% 0% 2% 3%
0%
20%
40%
60%
80%
Bahrain: Bahrainis Bahrain: Bangladeshis UK USA
Single Married Divorced Widowed
21
Figure 4.1.6 shows the distribution of the number of children. In all cases, the mode is zero children. The
data also reflect the lower birth rates in the UK and the US. It also reflects the average household size in
these countries: Bahrain (5.9), UK (2.3), US (2.6), (UN, 2017).
Figure 4.1.6: Participants’ number of children
Source: Derasat-UNDP surveys
Figure 4.1.7 shows the number of elderly people assisted by the participants. In each of the groups
Bahrainis in Bahrain, the UK, and the US, the modal response is “0”, but in the latter two cases, the
distribution is highly skewed toward “0”, too, whereas in the Bahraini case, it is much closer to uniformity.
In the case of Bangladeshis in Bahrain, it is skewed toward “3+”. These data may be indicating the
persistent importance of the family unit as a source of socioeconomic insurance in Bahrain and
Bangladesh, in contrast to the UK and US.
Figure 4.1.8 shows the distribution of the participants’ education level. The UK and US data look very
similar, with approximately 40% of participants in each of high school and bachelor’s, and an equal and
small (around 2%) percentage of participants with less than a high school degree or with a PhD. In the
case of Bahrainis in Bahrain, a bachelor’s degree is the mode by some distance, and a significantly higher
percentage have a master’s degree, both coming at the expense of those with just a high school degree.
In the case of Bangladeshis in Bahrain, high school accounts for 69% of participants, and almost all (26%)
of the rest have a bachelor’s degree.
0%
20%
40%
60%
80%
Bahrain: Bahrainis Bahrain: Bangladeshis UK USA
0 1 2 3 4 5+

22
Figure 4.1.7: Participants’ number of elderly whom they assist
Source: Derasat-UNDP surveys
Figure 4.1.8: Participants’ education level
Source: Derasat-UNDP surveys
When analyzing data at the subgroup level, in an attempt to understand the differential impact of Covid-
19, we consider three different breakdowns. The first is a six-element age/gender decomposition: every
combination of three age groups (18-24, 25-44, 45+) and two genders (female, male). Note that we do
not consider gender purely, since we wish to avoid the possibility of negative differences for one age
group of women being canceled by positive differences for another, which would otherwise lead the
gross average for women to misleadingly look equal to that of men. We also hope to provide more
accurate results than seeing women and men as two distinct homogenous groups or opposite categories.
38%
2%
71% 66%
21%
5%18% 21%
30%
16%9% 10%10%
77%
2% 2%0%
20%
40%
60%
80%
100%
Bahrain: Bahrainis Bahrain: Bangladeshis UK USA
0 1 2 3+
2% 2% 2% 1%
24%
69%
41%36%
47%
26%
40% 40%
23%
2%
15% 20%
4% 0% 2% 4%
0%
20%
40%
60%
80%
Bahrain: Bahrainis Bahrain: Bangladeshis UK USA
Less than high school High school Bachelor's Master's PhD

23
The second is the five different education levels. Education is a decent proxy for income and for
socioeconomic status in general.
In the third breakdown, we consider three groups that are likely to be facing considerable difficulties in
adapting to the pandemic, and whom we can identify given the data that we collect. People with at least
two children, in light of the disruption caused by schools closing; people assisting at least two elderly
people, in light of the health risks faced by the elderly and their greater need to rely on family during the
pandemic; and the elderly themselves (65+ years).
4.2. Headline International Comparisons
This section compares the responses to the five main questions across the four groups under
consideration (Bahrain population: nationals, Bahrain population: Bangladeshis, UK population, US
population). The comparisons will be at the group level only; selected subnational findings will be
examined in the next section (4.3).
Figure 4.2.1: The effect of the Covid-19 pandemic on employment
Did you have a primary/secondary job before the Covid-19 pandemic, and do you have a
primary/secondary job now?
Source: Derasat-UNDP surveys
59%
81%
68% 66%55% 59% 59% 58%
21%29%
11%18%16%
9% 10%19%
0%
20%
40%
60%
80%
100%
Bahrain: nationals Bahrain: Bangladeshis UK USA
Primary job: Pre-pandemic Primary job: Post-pandemic
Secondary job: Pre-pandemic Secondary job: Post-pandemic

24
Figure 4.2.1 looks at the effect of the Covid-19 pandemic on employment rates. Recall that these data are
a useful but indirect indicator of unemployment rates, and so they should not be interpreted as explicit
estimates of the impact on unemployment. The data distinguish between primary and secondary jobs.
The first finding to note is that for Bahraini nationals, the UK, and the US, pre- and post-pandemic
employment rates in primary jobs were broadly comparable across groups, i.e., a significant decrease of
the order of 5 to 10 percentage points. The impact on Bahraini nationals is lower than that on the
populations of the UK and US, a point we return to below when discussing Bangladeshis.
These figures are in line with the large economic contractions that have been reported by these countries:
second quarter GDP decreased year on year by 8.9% for Bahrain (IGA, 2020), 21.7% for the UK, and 9.1%
for the US (Trading Economics, 2020). They also reflect the large number of mechanisms through which
the pandemic adversely effects the economy; see Al-Ubaydli (2020) for a full exposition of these links.
Second, the impact on primary jobs among Bahrain’s Bangladeshi population is very large, and exceeds
that of the other three groups by an order of magnitude: it fell from 81% pre-pandemic to 59% post-
pandemic. This likely explains the relatively muted effect of the pandemic on employment for Bahraini
nationals: Bahrainis account for around one quarter of total employment, and they systematically hold
jobs that are relatively well-protected, such as government jobs. Moreover, they enjoy superior
employment protections to Bangladeshis. Covid-19-related government employment interventions,
namely the paying of salaries of those working in the private sector, are explicitly restricted to Bahraini
nationals, further assisting Bahrainis in their attempts at retaining their jobs. Had such benefits been
extended to the entire working population, the elevated cost would likely have meant a lower per-worker
benefit, including for Bahrainis, and therefore Bahraini citizens would probably have experienced a larger
deterioration in their employment rates.
In the case of secondary jobs, the data reveal a much higher level of variation between the four groups.
In both the UK and the US, employment levels in secondary jobs were approximately flat, likely reflecting
an attempt to use secondary employment to counteract the adverse effect of the pandemic on primary
income (see Figure 4.2.6 below). In Bahrain, for both nationals and Bangladeshis, there was a sharp drop

25
in secondary employment, though the decline for Bangladeshis (20 percentage points) was again
considerably higher than that for Bahrainis (5 percentage points), for the same reasons discussed above.
The difference between Bahrain and the UK and US is likely driven by the different economic structures.
In Bahrain, public sector and quasi-public sector employment accounts for a considerably higher
percentage of jobs than in the UK and US, and public sector employment is a relatively bureaucratic and
rigid process. In contrast, the private sectors of the UK and US are the primary drivers of job creation,
leading to a flexible labor market that is more responsive than Bahrain’s to an increase in the willingness
of people to perform secondary jobs. It could also reflect an elevated need for a secondary job in the UK
and US to cover essential expenses.
Figure 4.2.2 shows the impact of the Covid-19 pandemic on the hours worked by the four groups, for
those members of each group who had a primary/secondary job at the start of the pandemic and
successfully retained their primary/secondary job up until September 2020 at least. Note that
participants evaluate the changes in hours worked using a Likert scale running from -2 (decreased a lot)
to +2 (increased a lot).
Figure 4.2.2: The effect of the Covid-19 pandemic on hours worked
[For those who had a primary/secondary job before the Covid-19 pandemic, and retained it] How did
your hours worked in your primary/secondary job change on a scale of -2 (decreased a lot) to +2
(increased a lot)?
Source: Derasat-UNDP surveys
0.1
-0.6-0.6
-1.2
-0.2-0.1
-0.20.0
-1.5
-1
-0.5
0
0.5
Primary job hours change Secondary job hours change
Bahrain: nationals Bahrain: Bangladeshis UK USA

26
In the case of primary jobs, Bahraini nationals experience no aggregate change, while the UK and US
populations each experience mild contractions in the number of hours worked. Bangladeshis in Bahrain
again suffer the largest decrease, with the average being 0.6 out of 2.
In the case of secondary jobs, Bangladeshis in Bahrain suffer a very large contraction (1.2 out of 2).
Bahraini citizens also suffer a moderate contraction (0.6 out of 2), while the UK and US are essentially
flat. While the factors accounting for the intra-Bahrain differences are most likely the same as those
explaining the intra-Bahrain variation in employment, we do not offer an explanation for the differences
between Bahrain and the UK/US.
Figure 4.2.3 shows the effect of the Covid-19 pandemic on the extent to which members of each group
felt affected by a selection of pandemic-related challenges. Responses are on a Likert scale running from
1 (no effect) to 5 (an extremely large effect).
Figure 4.2.3: The effect of the Covid-19 pandemic on various challenges
For each of the following socioeconomic challenges associated with the Covid-19 pandemic, to what
extent were you affected on a scale of 1 (no effect on me at all) to 5 (an extremely large effect on me)
Source: Derasat-UNDP surveys
We begin by noting that in the six challenges, there is a consistent pattern: Bangladeshis in Bahrain report
high (and the highest by far) levels of distress; the populations of the UK and US are moderately and
approximately equally affected by the challenges; and Bahraini nationals are affected the least, with low-
1.0
2.0
3.0
4.0
5.0
Difficulty accessing
necessities
Difficulty accessing
psycho-social
support
Difficulty accessing
education
Decreased leisure
time
Job loss Income reduction
Bahrain: nationals Bahrain: Bangladeshis UK USA

27
to-moderate impacts reported. Moreover, for Bangladeshis living in Bahrain, and the UK and US
populations, the highest scores were for job losses (4.3, 3.6, 3.5, respectively; all out of 5) and income
reductions (4.5, 3.3, 3.2, respectively; all out of 5), implying that the main socio-economic problem that
they have been struggling with is economic in nature. In contrast, for Bahraini citizens, job losses was the
smallest challenge (1.7 out of 5), and income reduction was an intermediate one (2.4 out of 5). These
inter-group differences for these two challenges also mimic the picture that emerges from the
employment questions covered in Figure 4.2.1 and Figure 4.2.2.
A second remark is that difficulty in accessing necessities, including PPE, has not been a significant
challenge for any group except the Bangladeshis living in Bahrain (4.2 out of 5), and this again likely
stems from an acute economic problem faced by that group. Therefore, in general, the governments of
Bahrain, the UK, and the US were able to overcome the initial supply chain problems relating to food,
medicine, and PPE.
Accessing psycho-social support and education were intermediate challenges for all groups. However, it
is important to note that a lack of difficulty in accessing them does not imply that there were no problems
with them in general. For example, a family with internet access and a computer can access education,
but that is only one of many challenges associated with ensuring a satisfactory quality of education.
A final remark regarding these data is that decreased leisure time has been a significant though not
overwhelming problem for all of the four groups (it was the second highest scoring category for Bahraini
nationals, though). It is likely that this partially reflects the non-availability of many traditional sources of
leisure (cinemas, cafes, restaurants), as well as decreased leisure time due to a need to allocate time to
other activities (see Figure 4.2.4 below).
Figure 4.2.4 shows the effect of the Covid-19 pandemic on the time that participants allocate to a variety
of non-work tasks, using a Likert scale that runs from -2 (decreased time allocated to this task by a lot) to
+2 (increased time allocated to this task a lot); participants also had the option of indicating that a task
did not apply to them, such as homeschooling for an individual who does not have children.

28
Similar to the challenges data, intergroup differences for Bahraini nationals, and the UK and US
populations are relatively small compared to the differences between these groups and Bangladeshis
living in Bahrain. Moreover, Bangladeshis on average decreased their time allocation to every single task
they were asked about, as opposed to the other three groups, that showed a mixture of increased and
decreased time allocations.
Figure 4.2.4: The effect of the Covid-19 pandemic on time allocation
How did the Covid-19 pandemic affect the time you allocated to each of the following non-work tasks
on a scale of -2 (decreased time allocated to this task a lot) to +2 (increased time allocated to this task a
lot); or N/A for tasks that do not apply to you
Source: Derasat-UNDP surveys
First, there is significant variation between the different tasks, i.e., participants did not indifferently select
the same option for all tasks. Second, these tasks are all explicitly non-work tasks, and even within the
class of non-work tasks, they do not constitute an exhaustive list. Though they tended to work fewer
hours (Figure 4.2.2) due to the pandemic, the large number of job losses experienced by the Bangladeshi
community suggests that a lot of time was allocated to the job search process (see Figure 4.2.5).
-2.0 -1.5 -1.0 -0.5 0.0 0.5 1.0 1.5 2.0
Sleep
Health (except exercise)
Exercise
Studying
Preparing meals
Childcare (except homeschooling)
Homeschooling
Assisting elderly
Volunteering at non-profits
Social life
Leisure/entertainment
Communication/media
Bahrain: nationals Bahrain: Bangladeshis UK USA

29
Moving on to the individual tasks, Bahraini citizens (0.04 out of 2) and the UK (0.18 out of 2) and US
(0.14 out of 2) populations all reported a small increase in sleeping time, but this masks significant
subnational variation, which we explore in section 4.3. Time allocated to health, except exercise (-0.83, -
0.52, -0.41, respectively, out of -2), social life (-1.6, -1.3, -1.1, respectively, out of -2), and
leisure/entertainment (-1.0, -0.3, -0.2, respectively, out of -2) decreased considerably, due to a
combination of the these activities being unavailable and being undesirable due to a perceived risk. This
is especially true of a non-essential medical activity such as going to the dentist for a regular checkup, as
dentists all over the world have reported large declines in demand for their services (Nasseh and Vujicic,
2020). Time allocated to volunteering for non-profits has also decreased considerably for all groups (-
0.3, -0.3, -0.4, respectively, out of -2), again due to a combination of physical restrictions and decreased
willingness to participate.
For three groups (Bahrain citizens, UK and US populations), four activities received a moderate increase
in time allocation, again masking high levels of subnational variation to be elaborated upon in section
4.3. These were preparing meals (0.4, 0.6, 0.6, respectively, out of 2), due to the increased time spent at
home; childcare (0.4, 0.2, 0.3, respectively, out of 2), due to the closure of schools; homeschooling (0.5,
0.4, 0.4, respectively, out of 2), also due to the closure of schools; and assisting the elderly (0.3, 0.2, 0.2,
respectively, out of 2), as the elderly are one of the highest Covid-19 risk groups of society, and so they
need help from family and friends for tasks that they would normally be able to do for themselves, such
as grocery shopping and visits to the pharmacy. It is worth noting that although Bahrain experienced a
marginally larger increase in time allocation to assisting the elderly compared to the UK and US, people
aged 65 and over account for a considerably smaller percentage of the population in Bahrain than in the
UK and US; therefore, these data indicate greater attention to the elderly in Bahrain on a per-elderly-
person basis (World Bank, 2020), though it is important to note higher dependence on nursing homes in
the UK and US.
In addition to these four activities, one activity received a significant (and the highest) increase in time
allocation: communication and media (1.1, 0.9, 0.8, respectively, out of 2), which includes watching the
news on TV, reading the newspaper, consuming social media, and so on. This likely reflects the large
increase in mental stress caused by the pandemic, reported widely in other countries (Pfefferbaum and

30
North, 2020), as well as a safe (in terms of physical health) alternative to traditional entertainment and
leisure options. The higher increase in Bahrain compared to the UK and US likely reflects the higher levels
of internet penetration and per capita mobile subscriptions in Bahrain (World Bank, 2020).
Within the three groups of Bahrain citizens and the UK and US populations, the most salient difference
is in exercise: while the UK and US populations kept the time allocated to this task approximately
constant (in fact they increased it a little on average), Bahrainis decreased their time allocation to this task
considerably (-0.5 out of -2). This most likely reflects the differences in climate: in the months March to
September, average temperatures in Bahrain (Manama) are 34 degrees Celsius, compared to 19 degrees
in the UK (London) and 28 degrees in the US (Washington, DC; Weather Atlas, 2020). Consequently,
Bahrainis will have a greater dependence upon commercial gyms for their exercise, and so they will be
more adversely affected by the pandemic, in light of the forced closure of gyms (section 2). In contrast,
residents of the UK and US can more easily use outdoor exercise as an alternative to frequenting a
commercial gym.
Figure 4.2.5: Desired support in light of the Covid-19 pandemic
What kind of support do you think would be the most useful to you?
Source: Derasat-UNDP surveys
0%5%
10%15%20%25%30%35%40%45%
Bahrain: nationals Bahrain: Bangladeshis UK USA

31
Figure 4.2.5 shows the unique form of support that participants regarded as most desirable in light of the
Covid-19 pandemic (participants were restricted to selecting only one). These data indicate significantly
higher levels of intergroup variation than the preceding survey questions. The UK (29%) and US (23%)
populations were broadly similar: they favored training the most, perhaps sensing that several of the
sectors that traditionally employed many people were facing the prospect of a permanent (or at least
protracted) contraction, and that they would be replaced by sectors that require workers to acquire new
skills. Support in paying rent (12% and 14%, respectively) and in dealing with the psychological
challenges posed by Covid-19 (18% and 13%, respectively) were both popular choices for the UK and
US populations, though in the case of psychological challenges, there is again a significant level of
subnational variation to be explored in section 4.3. The limited demand for unemployment benefits (8%
and 10%, respectively) and loan deferrals (4% and 10%, respectively) for the UK and US populations
reflects the comparative effectiveness of their fiscal and monetary policies; see Al-Ubaydli (2020) for
further details on the unprecedented government interventions in this regard. The “other” category was
also quite popular with the UK (13%) and US (14%) populations, with the modal option being some
variant of “I do not need any assistance”, indicating that the participant was coping well with the
pandemic.
Bahraini citizens look broadly similar to the UK and US, with the exception of having a strong preference
for loan deferrals (34%). Notably, this survey was conducted just before the expected expiration of
previous loan deferral edicts issued by the Central Bank of Bahrain (CBB). The CBB subsequently
committed to extending the deferrals to the end of 2020. The low preference for rent support compared
to Bangladeshis (see below) reflects higher rates of home ownership, and existing government support
programs.
The majority of Bangladeshis in Bahrain favored two main requests, together accounting for
approximately 70% of participants’ responses: information on job opportunities (40%), and assistance
with rent (28%). As mentioned above, the first of these supports the view that Bangladeshis are exerting
a lot of effort in the job search process, whether they did or did not get laid off. It also likely reflects
reductions in income, and deteriorations in the economic circumstances of the families that they are
supporting in Bangladesh. Given the high percentage of their salaries that they remit, for Bangladeshis,

32
rent likely accounts for an oversized share of their monthly budget, accentuating the positive impact of
support on dealing with rent payments.
Figure 4.2.6 shows the participants’ intentions regarding the different methods of financially supporting
their households in the near future, until a significant improvement in the Covid-19 situation. The
responses were on a three-item Likert scale: 0 (will not use this method at all), 1 (will use this method a
little), and 2 (will use this method a lot).
Figure 4.2.6: Intended methods for dealing with Covid-19-related financial problems
For each of the following ways of financially supporting your household in the near future until the
Covid-19 situation improves, please indicate whether you will use it a lot (2), a little (1), or not at all (0)
Source: Derasat-UNDP surveys
Again, there is significant inter-group variation, but the UK and US populations are roughly comparable.
For these latter two groups, there is a strong intention to use decreased spending (1.3 and 1.3,
respectively, out of 2) as a way of dealing with the financial problems caused by the pandemic, which
surely accentuates the contraction in aggregate economic activity. Running down savings (0.8 and 0.7,
respectively, out of 2) is a moderately popular option, as is seeking the extra income brought about by
new employment opportunities (0.8 and 0.8, respectively, out of 2), and seeking assistance from the
government (0.5 and 0.7, respectively, out of 2). In contrast, seeking loans (0.2 and 0.2, respectively, out
0.0
0.5
1.0
1.5
Seek
employment
Run down
savings
Decrease
spending
Seek loans Seek assistance
from
family/friends
Seek assistance
from non-
profits
Seek assistance
from
government
Bahrain: nationals Bahrain: Bangladeshis UK USA
33
of 2) and the assistance of family/friends (0.3 and 0.3, respectively, out of 2) and non-profits (0.1 and
0.3, respectively, out of 2) are all unpopular options for the UK and US populations.
In the case of Bahraini citizens, the opposite picture emerges, whereby the most popular three options
are seeking loans (1.2 out of 2) and assistance from family/friends (1.1 out of 2) and non-profits (1.1 out
of 2). Help from non-profits is likely to include seeking the assistance of religious charities, as they play a
central role in poverty alleviation in the Gulf countries denoting a relatively higher level of social
cohesion and informal support networks. Moreover, the willingness to seek the assistance of
family/friends in Bahrain – and the absence of such a desire in the UK and US – is a reflection of the
detribalization that occurred in western countries over the course of the last 1,000 years, that has led to
a significant decline in the importance of the nuclear family to daily life (Fukuyama, 2011).
The other notable difference between Bahrainis and the UK and US populations is that Bahrainis have a
modest willingness to decrease their spending (0.5 out of 2) – and the aforementioned high willingness
to seek loans (1.2 out of 2) – as a way of making their finances more sustainable. This is consistent with
the general pattern of low savings rates in the Gulf countries in general, which in turn reflects a
combination of cultural factors and low levels of financial literacy.
Finally, in the case of Bangladeshis living in Bahrain, seeking employment (1.2 out of 2) and the
assistance of the government (1.1 out of 2) are the two preferred choices, and there is also a high
willingness to decrease spending (1 out of 2). In fact, they are the group with the highest desire to seek
employment opportunities, reflecting the greatest need for such a step, as they suffered the biggest drop
in employment of the four groups by some distance (Figure 4.2.4). It is unclear whether the government
whose assistance they are seeking is the Bahraini government or the Bangladeshi one. Non-profits (0.7
out of 2) are also a reasonably popular potential source – much more popular than in the UK and US,
though not as popular as for Bahraini citizens.
34
4.3. Selected Subnational Results
In light of the considerable volume of data collected, and the multitude of subnational groups that can
be analyzed, this report will not present all the data. Instead, we will present selected results reflecting
what we expect readers to find most interesting.
As a reminder, we construct up to 14 subgroups for each group: six age/gender groups, five education
levels, and three “vulnerable” groups. For Bangladeshi participants, the data are highly concentrated in
the group males ages 25-44 with a high school degree, with very little data in other categories, with the
exception of those holding a bachelor’s degree. Since their responses did not differ significantly from
those with a high school degree, we do not present subnational results for Bangladeshis. Instead, a
separate, forthcoming, dedicated follow-up survey will investigate the experiences of Bangladeshis
residing in Bahrain in greater detail.
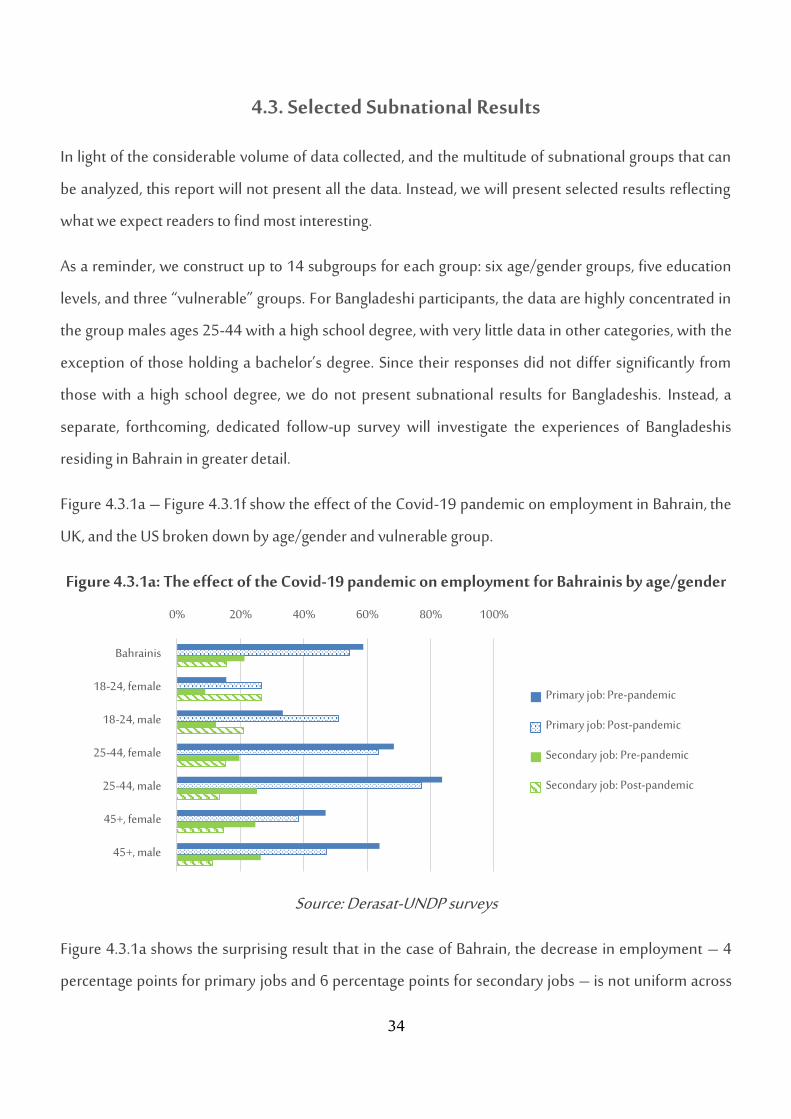
Figure 4.3.1a – Figure 4.3.1f show the effect of the Covid-19 pandemic on employment in Bahrain, the
UK, and the US broken down by age/gender and vulnerable group.
Figure 4.3.1a: The effect of the Covid-19 pandemic on employment for Bahrainis by age/gender
Source: Derasat-UNDP surveys
Figure 4.3.1a shows the surprising result that in the case of Bahrain, the decrease in employment – 4
percentage points for primary jobs and 6 percentage points for secondary jobs – is not uniform across
0% 20% 40% 60% 80% 100%
Bahrainis
18-24, female
18-24, male
25-44, female
25-44, male
45+, female
45+, male
Primary job: Pre-pandemic
Primary job: Post-pandemic
Secondary job: Pre-pandemic
Secondary job: Post-pandemic

35
demographic groups. In particular, while females and males aged 25-44 and 45+ experience a decrease
in employment, females and males aged 18-24 experience considerable increases in primary and
secondary employment. At the time of writing, we do not offer an explanation for this unexpected result;
this will be investigated in follow-up research.
Further, these data also indicate that for the groups experiencing decreased employment, women are less
affected by the pandemic than are men. This is in contrast to the finding in many western countries that
female unemployment has risen more than its male counterpart (Alon et al., 2020). Before offering an
explanation of this observation, we examine the corresponding data for the UK and US.
Figure 4.3.1b shows the employment effect for the UK. The decrease in employment levels for primary
jobs is uniform by demographic group. Moreover, whether in absolute percentage points or in
proportionate terms, the decrease in primary employment is higher for women in each age category than
it is for men.
Figure 4.3.1b: The effect of the Covid-19 pandemic on employment in the UK by age/gender
Source: Derasat-UNDP surveys
Figure 4.3.1c shows the employment effect for the US. Like the UK, the decline in employment levels for
primary jobs is uniform across demographic groups; and with the exception of the 18-24 age group,
women suffer a higher proportionate decline in employment in primary jobs than do men. Why is
0% 20% 40% 60% 80% 100%
UK residents
18-24, female
18-24, male
25-44, female
25-44, male
45+, female
45+, male
Primary job: Pre-pandemic
Primary job: Post-pandemic
Secondary job: Pre-pandemic
Secondary job: Post-pandemic

36
women’s employment more sensitive to the pandemic than men’s in the UK and US, whereas the reverse
is true for Bahrainis?
Figure 4.3.1c: The effect of the Covid-19 pandemic on employment in the US by age/gender
Source: Derasat-UNDP surveys
In the case of the UK and US, Alon et al. (2020) provide two reasons: first, employment-wise, women are
overrepresented in the sectors that involve face-to-face contact, and that are therefore most impacted by
the pandemic. These include personal services, tourism, entertainment, and retail. Second, for cultural
reasons, women bear a greater burden of the extra childcare and homeschooling responsibilities
spawned by the coronavirus, forcing some to withdraw from the workforce, and others to lose their jobs
if their employers do not afford them the flexibility required to reconcile their professional and family
responsibilities.
In the case of Bahrain, several factors potentially account for a reversal of this phenomenon. First,
Bahraini women are systematically employed in white collar jobs, especially the public sector, where they
represent almost 50% of employees, despite representing only 38% of employed Bahrainis (LMRA,
2020). Migrant workers, especially Philippina women, systematically perform the face-to-face contact
jobs that have been most affected by the pandemic. The public sector jobs of Bahrainis are protected
outside and during pandemics, and they are compatible with remote work. In fact, in March 2020, a royal
decree was issued requiring female workers with school-age children to be given priority in remote work,
0% 20% 40% 60% 80% 100%
USA residents
18-24, female
18-24, male
25-44, female
25-44, male
45+, female
45+, male
Primary job: Pre-pandemic
Primary job: Post-pandemic
Secondary job: Pre-pandemic
Secondary job: Post-pandemic

37
attenuating the impact that childcare and homeschooling responsibilities have on women’s
employment.
Second, as explained in section 2, in 2019, there were almost 90,000 foreign domestic workers in Bahrain
(LMRA, 2020), including female domestic helpers that perform meal preparation, cleaning, and childcare
activities for Bahraini families; and drivers who are able to run errands such as grocery shopping. These
workers provide considerable support to working women with children, thereby limiting the adverse
consequences of the pandemic on female employment.
Figure 4.3.1d shows the employment effect in Bahrain for the vulnerable groups. People with at least two
children have fared considerably worse than the national average in terms of job losses, both in primary
and secondary jobs, as have those who are 65 years and over. In the case of those with two or more
children, it could be due to the added childcare and homeschooling responsibilities, though having more
children is correlated with a variety of other potentially important factors, such as lower quality jobs
potentially, and so this interpretation should be taken cautiously.
Figure 4.3.1d: The effect of the Covid-19 pandemic on employment for Bahrainis by group
Source: Derasat-UNDP surveys
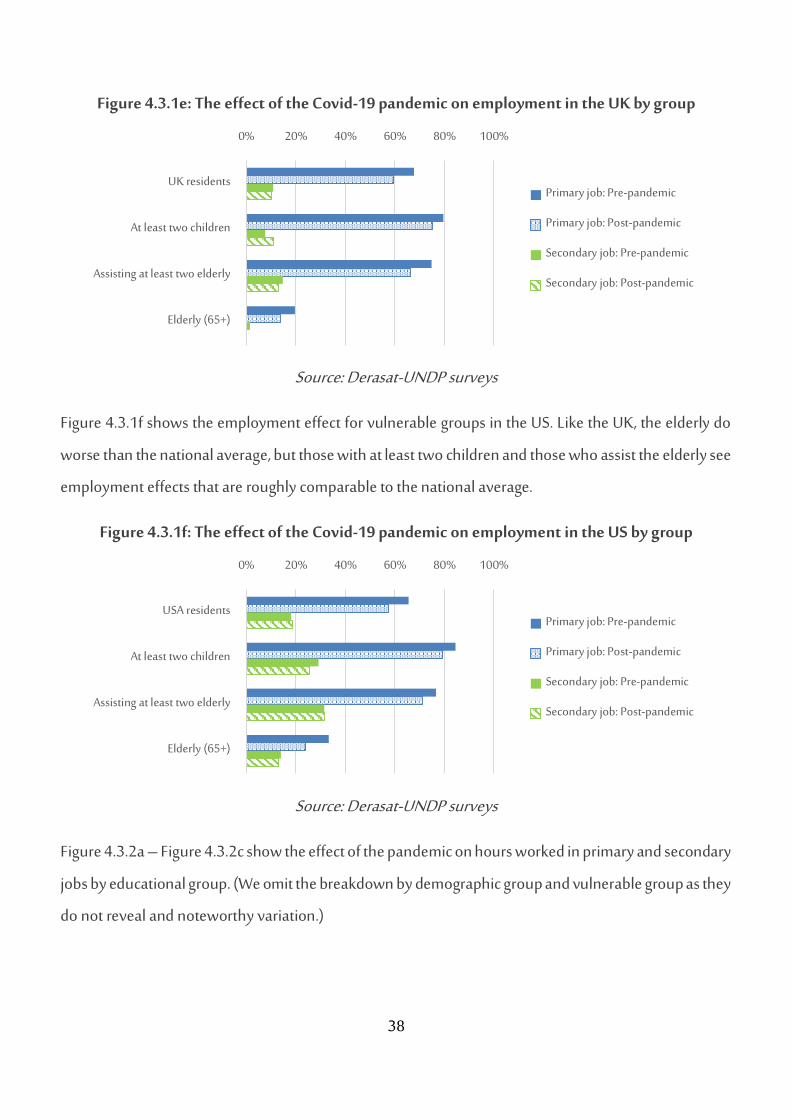
Figure 4.3.1e shows the employment effect for vulnerable groups in the UK. Unlike Bahrain, those with
two children are impacted less than the national average, and in fact they gain secondary jobs. This could
be related to the fact that the UK successfully reopened schools during May-June 2020, and in September
2020. In contrast, the elderly and those assisting them are affected worse than the national average.
0% 10% 20% 30% 40% 50% 60% 70% 80%
Bahrainis
At least two children
Assisting at least two elderly
Elderly (65+)
Primary job: Pre-pandemic
Primary job: Post-pandemic
Secondary job: Pre-pandemic
Secondary job: Post-pandemic
38
Figure 4.3.1e: The effect of the Covid-19 pandemic on employment in the UK by group
Source: Derasat-UNDP surveys
Figure 4.3.1f shows the employment effect for vulnerable groups in the US. Like the UK, the elderly do
worse than the national average, but those with at least two children and those who assist the elderly see
employment effects that are roughly comparable to the national average.
Figure 4.3.1f: The effect of the Covid-19 pandemic on employment in the US by group
Source: Derasat-UNDP surveys
Figure 4.3.2a – Figure 4.3.2c show the effect of the pandemic on hours worked in primary and secondary
jobs by educational group. (We omit the breakdown by demographic group and vulnerable group as they
do not reveal and noteworthy variation.)
0% 20% 40% 60% 80% 100%
UK residents
At least two children
Assisting at least two elderly
Elderly (65+)
Primary job: Pre-pandemic
Primary job: Post-pandemic
Secondary job: Pre-pandemic
Secondary job: Post-pandemic
0% 20% 40% 60% 80% 100%
USA residents
At least two children
Assisting at least two elderly
Elderly (65+)
Primary job: Pre-pandemic
Primary job: Post-pandemic
Secondary job: Pre-pandemic
Secondary job: Post-pandemic

39
Figure 4.3.2a: The effect of the Covid-19 pandemic on hours worked for Bahrainis by education
Source: Derasat-UNDP surveys
Figure 4.3.2a shows the breakdown for Bahrain. In both primary and secondary jobs, for the three groups
that collectively account for 94% of the data (high school, bachelor’s, master’s), people with lower
education levels exhibit a greater reduction in hours worked than do people with higher education levels.
Figure 4.3.2b shows the breakdown of the effect of the pandemic on hours in the UK. Unlike Bahrain, the
relationships are not monotonic, as people with a master’s degree are impacted less than those with a
high school degree, a bachelor’s degree, or a PhD.
Figure 4.3.2b: The effect of the Covid-19 pandemic on hours worked in the UK by education
Source: Derasat-UNDP surveys
-1.0 -0.5 0.0 0.5 1.0
Bahrainis
Less than high school
High school
Bachelor's
Master's
PhD
Primary job hours change
Secondary job hours change
-0.3 -0.25 -0.2 -0.15 -0.1 -0.05 0
UK residents
Less than high school
High school
Bachelor's
Master's
PhD
Primary job hours change
Secondary job hours change
40
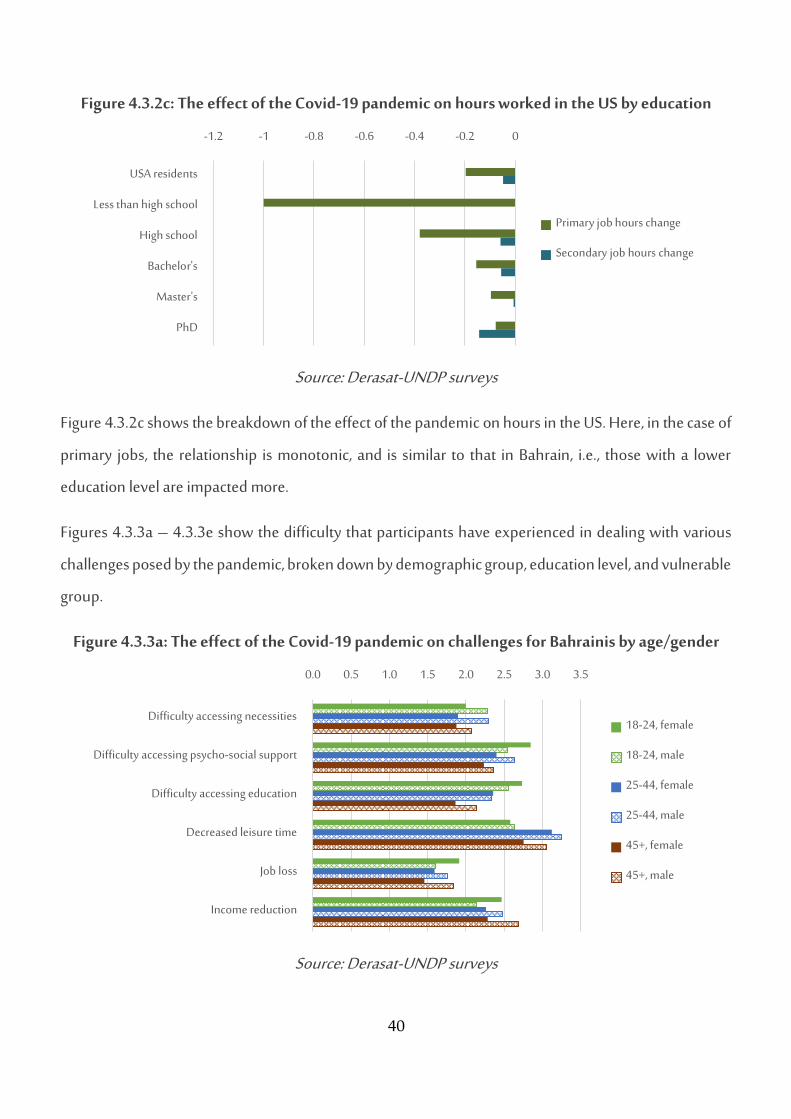
Figure 4.3.2c: The effect of the Covid-19 pandemic on hours worked in the US by education
Source: Derasat-UNDP surveys
Figure 4.3.2c shows the breakdown of the effect of the pandemic on hours in the US. Here, in the case of
primary jobs, the relationship is monotonic, and is similar to that in Bahrain, i.e., those with a lower
education level are impacted more.
Figures 4.3.3a – 4.3.3e show the difficulty that participants have experienced in dealing with various
challenges posed by the pandemic, broken down by demographic group, education level, and vulnerable
group.
Figure 4.3.3a: The effect of the Covid-19 pandemic on challenges for Bahrainis by age/gender
Source: Derasat-UNDP surveys
-1.2 -1 -0.8 -0.6 -0.4 -0.2 0
USA residents
Less than high school
High school
Bachelor's
Master's
PhD
Primary job hours change
Secondary job hours change
0.0 0.5 1.0 1.5 2.0 2.5 3.0 3.5
Difficulty accessing necessities
Difficulty accessing psycho-social support
Difficulty accessing education
Decreased leisure time
Job loss
Income reduction
18-24, female
18-24, male
25-44, female
25-44, male
45+, female
45+, male

41
Figure 4.3.3a shows the demographic breakdown for Bahrainis. The most notable feature of these data
is that they confirm the picture emerging from the aforementioned employment data: men suffer a
greater reduction in employment and in income than do women for the age groups 25-44 and 45+ (the
picture is reversed for 18-24 year old participants, but they are a marginal component of the labor force).
Figure 4.3.3b: The effect of the Covid-19 pandemic on challenges in the UK by age/gender
Source: Derasat-UNDP surveys
Figure 4.3.3c: The effect of the Covid-19 pandemic on challenges in the US by age/gender
Source: Derasat-UNDP surveys
0.0 0.5 1.0 1.5 2.0 2.5 3.0 3.5 4.0
Difficulty accessing necessities
Difficulty accessing psycho-social support
Difficulty accessing education
Decreased leisure time
Job loss
Income reduction
18-24, female
18-24, male
25-44, female
25-44, male
45+, female
45+, male
0.0 0.5 1.0 1.5 2.0 2.5 3.0 3.5 4.0
Difficulty accessing necessities
Difficulty accessing psycho-social support
Difficulty accessing education
Decreased leisure time
Job loss
Income reduction
18-24, female
18-24, male
25-44, female
25-44, male
45+, female
45+, male

42
Figure 4.3.3b shows the demographic breakdown of the difficulties of dealing with the challenges for the
UK population. Again, the data reinforce the preceding employment data, with women facing greater
difficulty in dealing with job losses and income reductions.
Figure 4.3.3c shows the demographic breakdown of the difficulties of dealing with the challenges for the
US population. Here, the data are not quite as corroborative as the Bahrain and UK data: for people aged
45 and over, women express greater difficulty in dealing with the challenges of job losses and reduced
income; but for the other age groups, the ranking is reversed.
Figure 4.3.3d shows the difficulty of dealing with the challenges for Bahrainis broken down by education
level. The most salient property of the data is that people with lower education levels (less than high
school, high school), who collectively account for 27% of participants, uniformly express greater
difficulty in dealing with the challenges than those with higher education levels (and hence higher than
the national average). The effects are particularly acute in the economic domain (jobs, income). The
actual employment data for these groups, which are omitted in the interests of parsimony, do not reveal
the same pattern, but the hours data do to a certain extent. Moreover, the impact of fewer hours on
income-related difficulties is amplified for those with lower education levels, because their incomes tend
to be lower, and they are operating closer to the poverty line.
Figure 4.3.3d: The effect of the Covid-19 pandemic on challenges for Bahrainis by education
Source: Derasat-UNDP surveys
0.0 0.5 1.0 1.5 2.0 2.5 3.0 3.5 4.0
Difficulty accessing necessities
Difficulty accessing psycho-social support
Difficulty accessing education
Decreased leisure time
Job loss
Income reduction
Less than high school
High school
Bachelor's
Master's
PhD

43
In the UK (figure omitted in the interests of parsimony), there are no salient patterns in the data. For the
US, like the Bahrain data, in the economic domain (job losses, income reduction), there is a tendency for
those with lower education levels to report greater difficulties.
Figure 4.3.3e: The effect of the Covid-19 pandemic on challenges for Bahrainis by group
Source: Derasat-UNDP surveys
Figure 4.3.3e shows the difficulties breakdown for Bahrainis by vulnerable group. These data indicate
that people with at least two children, and who assist at least two elderly, uniformly report greater
difficulties in dealing with Covid-19 related challenges than do the population in general. The difference
is especially acute in decreased leisure time, and is presumably accounted for by the large volume of
responsibilities that these respondents have, combined with a diminished ability to use the market for
assistance.
In the UK data, there are no salient patterns to report. For the US data Like Bahrain, there is a tendency
for those with at least two children and/or those assisting at least two elderly to report greater difficulties
than the population in general; while the elderly themselves report significantly less difficulty than do
the population at large.
Figures 4.3.4a – 4.3.4c show the effect of the Covid-19 pandemic on participants’ time allocation broken
down by demographic group and for vulnerable groups.
0.0 0.5 1.0 1.5 2.0 2.5 3.0 3.5 4.0
Difficulty accessing necessities
Difficulty accessing psycho-social support
Difficulty accessing education
Decreased leisure time
Job loss
Income reduction
Bahrainis At least two children Assisting at least two elderly Old (65+)

44
Figure 4.3.4a: The effect of Covid-19 on time allocation for Bahrainis by age/gender
Source: Derasat-UNDP surveys
Figure 4.3.4a shows the demographic breakdown for Bahrainis. In terms of sleeping, most groups do not
change their time allocation, with the exception of young (18-24) males, who significantly increase their
sleep. In terms of meal preparation, three demographic groups drive the rise in the national average: men
and women aged 25-44, and women over the age of 45. There is a clear gender effect, whereby women
experience a larger increase in the time allocated to this task than do men. Young females and males
avoid needing to increase their time allocation presumably either by using takeaway/delivery services,
or by free-riding on the meal preparation efforts of their parents.
The distinction between young and old is also evident in childcare and homeschooling, where men and
women above the age of 25 increase their time allocation considerably. This difference is presumably
attributable to the fact that the younger men and women do not have dependent children, as they are
-2.0 -1.5 -1.0 -0.5 0.0 0.5 1.0 1.5
Sleep
Health (except exercise)
Exercise
Studying
Preparing meals
Childcare (except homeschooling)
Homeschooling
Assisting elderly
Volunteering at non-profits
Social life
Leisure/entertainment
Communication/media
18-24, female
18-24, male
25-44, female
25-44, male
45+, female
45+, male

45
yet to get married. Among the older groups, in childcare (but not homeschooling), there is a slight gender
effect, too, whereby women increase their time allocation more than do men.
In the domain of assisting the elderly, there is no age effect, but there is a gender effect: women of all ages
significantly increase their time allocation to assisting the elderly, whereas men make modest changes
(and actually decrease in the case of younger men).
All of these gender effects can presumably be attributed to cultural stereotypes regarding the gender-
based roles in the allocation of household activities.
Figure 4.3.4b: The effect of the Covid-19 pandemic on time allocation in the UK by age/gender
Source: Derasat-UNDP surveys
Figure 4.3.4b shows the demographic breakdown for the UK. The data show different patterns to those
in Bahrain. In the case of sleep, both young men and women – and especially the latter – increase their
time allocation considerably. Young women are also the only group to significantly increase their time
-2.0 -1.5 -1.0 -0.5 0.0 0.5 1.0 1.5 2.0
Sleep
Health (except exercise)
Exercise
Studying
Preparing meals
Childcare (except homeschooling)
Homeschooling
Assisting elderly
Volunteering at non-profits
Social life
Leisure/entertainment
Communication/media
18-24, female
18-24, male
25-44, female
25-44, male
45+, female
45+, male

46
allocation to exercise. Both groups manage to significantly increase their time allocation for
leisure/entertainment, too, while other groups decrease theirs.
There are clear gender differences in childcare, homeschooling, and assisting the elderly, where women
increase their time allocation by a larger amount than men. This is consistent with the aforementioned
explanations given for the unfavorable impact of the pandemic on women’s employment rates globally,
i.e., women having to bear a disproportionate share of new household responsibilities that were
previously outsourced to a certain degree.
The US data follow the general patterns exhibited by the UK data: young men and women sleep more
and allocate more time to leisure/entertainment while other groups either maintain or decrease their
time allocations to these tasks. There are clear gender effects in childcare, homeschooling, and assisting
the elderly, whereby women at all age groups experience larger increases in time allocations than do men
in the same age group.
Figure 4.3.4c: The effect of the Covid-19 pandemic on time allocation for Bahrainis by group
Source: Derasat-UNDP surveys
-2.0 -1.5 -1.0 -0.5 0.0 0.5 1.0 1.5
Sleep
Health (except exercise)
Exercise
Studying
Preparing meals
Childcare (except homeschooling)
Homeschooling
Assisting elderly
Volunteering at non-profits
Social life
Leisure/entertainment
Communication/media
Bahrainis
At least two children
Assisting at least two elderly
Elderly (65+)

47
Figure 4.3.4c shows the breakdown for Bahrainis by vulnerable group. As expected, childcare and
homeschooling see higher rises for people with at least two children than do the population in general,
while those assisting at least two elderly also allocate greater time to assisting the elderly. Notably, the
elderly (65+) are the only group to experience a sharp decrease in their time allocated to volunteering at
non-profits, presumably because they are unable to contribute face-to-face, and lack the IT literacy to
contribute remotely. They are also the only vulnerable group to increase their time allocated to sleeping.
The UK and US data mimic the data for Bahrainis.
Figures 4.3.5a – 4.3.5d show the most desired form of assistance broken down by demographic group
and vulnerable group.
Figure 4.3.5a: Desired support in light of the Covid-19 pandemic for Bahrainis by age/gender
Source: Derasat-UNDP surveys
0% 10% 20% 30% 40% 50%
Training
Job information
Unemployment benefit
Loan deferral
Tax deferral
Rent
Psychological
Other
18-24, female
18-24, male
25-44, female
25-44, male
45+, female
45+, male
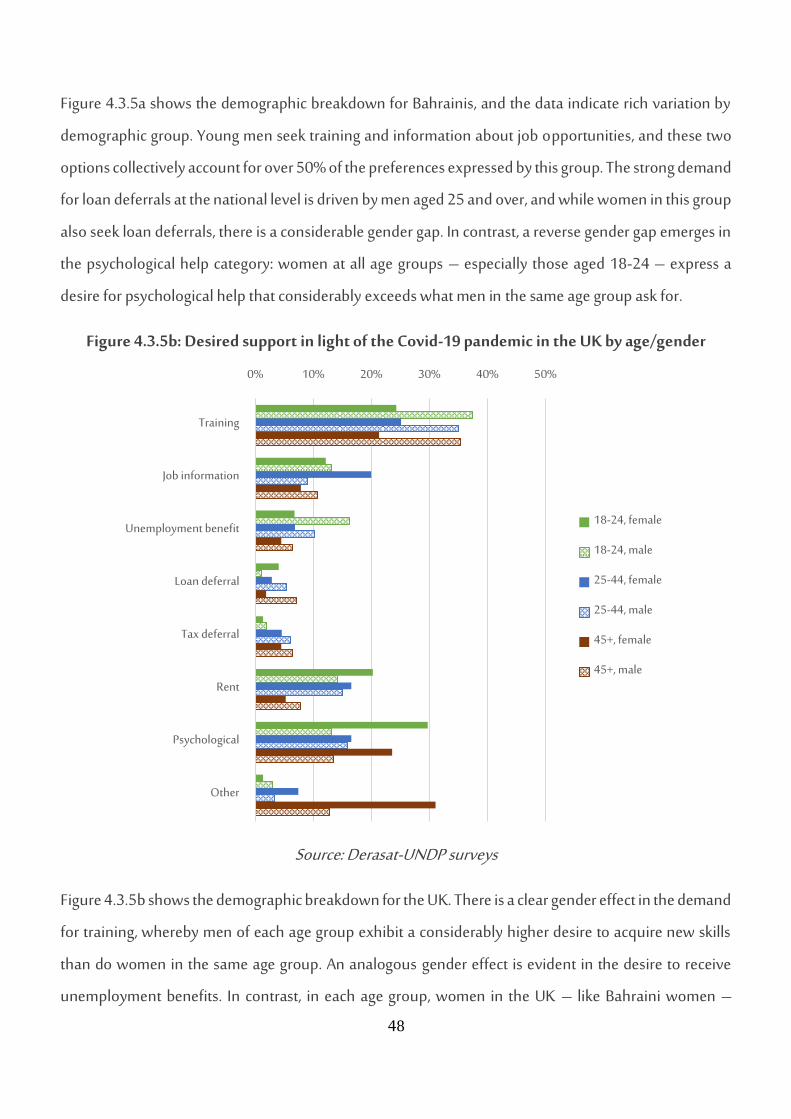
48
Figure 4.3.5a shows the demographic breakdown for Bahrainis, and the data indicate rich variation by
demographic group. Young men seek training and information about job opportunities, and these two
options collectively account for over 50% of the preferences expressed by this group. The strong demand
for loan deferrals at the national level is driven by men aged 25 and over, and while women in this group
also seek loan deferrals, there is a considerable gender gap. In contrast, a reverse gender gap emerges in
the psychological help category: women at all age groups – especially those aged 18-24 – express a
desire for psychological help that considerably exceeds what men in the same age group ask for.
Figure 4.3.5b: Desired support in light of the Covid-19 pandemic in the UK by age/gender
Source: Derasat-UNDP surveys
Figure 4.3.5b shows the demographic breakdown for the UK. There is a clear gender effect in the demand
for training, whereby men of each age group exhibit a considerably higher desire to acquire new skills
than do women in the same age group. An analogous gender effect is evident in the desire to receive
unemployment benefits. In contrast, in each age group, women in the UK – like Bahraini women –
0% 10% 20% 30% 40% 50%
Training
Job information
Unemployment benefit
Loan deferral
Tax deferral
Rent
Psychological
Other
18-24, female
18-24, male
25-44, female
25-44, male
45+, female
45+, male

49
exhibit a greater desire to receive psychological assistance than do men in the same age group. Finally, a
very large percentage (31%) of UK women aged 45 and over selected the other category, with the modal
response being a variant of “I do not require any assistance”.
The US data show similar patterns to those in the UK data. At each age group, men systematically desire
training more than do women, and they seek unemployment benefits more than women, whereas
women are more likely to seek psychological help than are men, without it being their most desired form
of support.
Figure 4.3.5c shows the breakdown for vulnerable groups of Bahrainis. There is a very large desire for
loan deferrals (50%) among people with at least two children, which may be a reflection of the high rate
at which they lost secondary jobs and the ensuing liquidity problems. Further, the elderly expressed a
strong desire for psychological assistance.
Figure 4.3.5c: Desired support in light of the Covid-19 pandemic for Bahrainis by group
Source: Derasat-UNDP surveys
Figure 4.3.5d shows the vulnerable groups breakdown for the UK. The “other” category was also highly
popular with the elderly (50%), most of whom explained that they do not need help. A similar pattern
applies to the US.
0% 10% 20% 30% 40% 50%
Training
Job information
Unemployment benefit
Loan deferral
Tax deferral
Rent
Psychological
Other
Bahrainis
At least two children
Assisting at least two elderly
Old (65+)

50
Figure 4.3.5d: Desired support in light of the Covid-19 pandemic in the UK by group
Source: Derasat-UNDP surveys
Figure 4.3.6a: Dealing with Covid-19-related financial problems for Bahrainis by education
Source: Derasat-UNDP surveys
0% 10% 20% 30% 40% 50%
Training
Job information
Unemployment benefit
Loan deferral
Tax deferral
Rent
Psychological
Other
UK residents
At least two children
Assisting at least two elderly
Old (65+)
0.0 0.2 0.4 0.6 0.8 1.0 1.2 1.4 1.6
Seek employment
Run down savings
Decrease spending
Seek loans
Seek assistance from family/friends
Seek assistance from non-profits
Seek assistance from government
Less than high school
High school
Bachelor's
Master's
PhD

51
Figures 4.3.6a – 4.3.6e show how participants intend to financially support their households for the
duration of the pandemic (until the situation improves), broken down by educational attainment and
vulnerable group.
Figure 4.3.6a shows the demographic breakdown for Bahrainis. A salient trend is that people with lower
education levels tend to prefer seeking loans, whereas those with higher education levels tend to favor
running down savings and decreasing spending. Given the correlation between education and income,
and hence between education and accumulated savings, it is possible that these differences reflect
variation in financial capacity, i.e., less educated people have lower incomes and are therefore less able
to decrease their spending before they hit minimal living standards; and they do not have significant
savings to run down. Alternatively, it could reflect differences in financial literacy and in predispositions
toward short-term thinking.
Figure 4.3.6b: Dealing with Covid-19-related financial problems in the UK by education
Source: Derasat-UNDP surveys
Figure 4.3.6b shows the education breakdown for the UK. A similar pattern to Bahrainis emerges, in that
the more educated are generally more likely to run down savings and decrease spending. However,
0.0 0.2 0.4 0.6 0.8 1.0 1.2 1.4
Seek employment
Run down savings
Decrease spending
Seek loans
Seek assistance from family/friends
Seek assistance from non-profits
Seek assistance from government
Less than high school
High school
Bachelor's
Master's
PhD

52
unlike Bahrainis, there is apparently little appetite in the UK for seeking support from loans, which may
be attributable to the fact that the UK government did not offer deferrals on personal loans in the same
manner that the Central Bank of Bahrain did. Finally, presumably due to their potentially higher average
income, PhDs generally have little intention of using various forms of financial support, i.e., they do not
need to. In the case of the US, there are no clear patterns in the data, and they mimic neither then Bahraini
nor UK data.
Figure 4.3.6c shows the vulnerable groups breakdown for Bahrainis. The most salient feature in the data
is that the elderly are planning on resorting to the different means available significantly more than the
national average, and more than the other vulnerable groups, which are themselves essentially
indistinguishable from the national average.
Figure 4.3.6c: Dealing with Covid-19-related financial problems for Bahrainis by group
Source: Derasat-UNDP surveys
Figure 4.3.6d shows the vulnerable group breakdown for the UK. In contrast to their Bahraini
counterparts, the UK’s elderly apparently intend to use a combination of running down savings and
decreasing spending, and little else. In all options, their intended usage is considerably below national
averages, and often close to zero.
0.0 0.2 0.4 0.6 0.8 1.0 1.2 1.4 1.6
Seek employment
Run down savings
Decrease spending
Seek loans
Seek assistance from family/friends
Seek assistance from non-profits
Seek assistance from government
Bahrainis
At least two children
Assisting at least two elderly
Old (65+)

53
Figure 4.3.6d: Dealing with Covid-19-related financial problems in the UK by group
Source: Derasat-UNDP surveys
Figure 4.3.6e shows the vulnerable group breakdown for the US. The US’ elderly are similar to their UK
counterparts in terms of their apparent stoicism, though they appear more willing to use the available
options than do the elderly in the UK. Further, those with at least two children and/or assisting at least
two elderly show an elevated desire to seek assistance from family/friends, form non-profits, and from
the government compared to the national average.
Figure 4.3.6e: Dealing with Covid-19-related financial problems in the US by group
Source: Derasat-UNDP surveys
0.0 0.2 0.4 0.6 0.8 1.0 1.2 1.4 1.6
Seek employment
Run down savings
Decrease spending
Seek loans
Seek assistance from family/friends
Seek assistance from non-profits
Seek assistance from government
UK residents
At least two children
Assisting at least two elderly
Old (65+)
0.0 0.2 0.4 0.6 0.8 1.0 1.2 1.4 1.6
Seek employment
Run down savings
Decrease spending
Seek loans
Seek assistance from family/friends
Seek assistance from non-profits
Seek assistance from government
USA residents
At least two children
Assisting at least two elderly
Old (65+)

54
5. Summary
This report analyzes the data resulting from surveys in three countries (Bahrain, UK, USA), approximately
a total of 3,000 observations of the socioeconomic impact of Covid-19. The surveys looked at five main
questions:
1. How has the pandemic affected employment?
2. What kinds of challenges did the pandemic pose?
3. How did the pandemic affect people’s allocation of time to non-work tasks?
4. What kind of support did people most desire to help them deal with the pandemic?
5. What financial means would they use to address the financial challenges posed by the pandemic?
In the cases of the UK and USA, the surveys were conducted on nationally representative samples of
adults. In the case of Bahrain, a nearly nationally representative sample of Bahraini adults was gathered,
in addition to a nearly nationally-representative sample of Bangladeshis residing in Bahrain. This latter
group is plausibly one of the groups of migrant workers that have suffered the largest socioeconomic
fallout from the pandemic. In the case of the two populations drawn from Bahrain, weights were used to
construct averages that were nationally representative.
In terms of headline comparisons between these four groups, the main results were as follows.
First, all groups suffered considerable amounts of economic distress. However, the economic distress
suffered by Bahrainis in Bahrain was considerably less than that of the populations of the UK and US,
while the economic distress suffered by Bangladeshis in Bahrain was considerably higher than for all
other groups. The distress took the form of a combination of job losses and decreased income even for
those who did not lose jobs.
Notably, despite facing great hardship, the data provided do not allow us to infer how Bangladeshis in
Bahrain would have fared had they returned to Bangladesh. To understand this important issue more
fully, we are in the process of conducting a follow-up study.

55
Second, the allocation of time to non-work tasks was affected considerably. In the case of Bangladeshis
in Bahrain, it appears that the time allocated to most non-work tasks decreased significantly because they
were allocating so much time to job search and other efforts at elevating their income. For the remaining
three groups, preparing meals, assisting/supervising children and the elderly, and consuming media all
received a significantly larger allocation of time, whereas socializing, leisure/entertainment, and health
(except exercise) all witnessed significant reductions in time allocations.
Third, the data revealed significant heterogeneity in the kinds of support deemed most desirable.
Bahrainis in Bahrain saw job-market training and loan deferrals as the most attractive, while
Bangladeshis in Bahrain sought job information and rent support. In the UK and US, training and
psychological support were the two most popular choices. These differences reflect deeper difference in
the labor markets, the structure of household finances, and access to social support.
Fourth, the populations of the UK and US, as well as the Bangladeshis in Bahrain exhibited great
readiness to rely on a mixture of new employment, running down savings, and decreasing spending as a
way of dealing with the financial challenges posed by Covid-19. For Bahrainis, seeking loans and the
assistance of friends/family and non-profits was prominent. This likely reflects cultural differences in the
role of support networks, as well as the physical distance from their familial support networks and the
precarious nature of jobs in the case of Bangladeshis in Bahrain.
In addition to these headline comparisons, breaking down the data by demographic group and
educational level revealed rich variation in many of the areas covered by the study. Some of the highlights
include the following (this is far from an exhaustive list).
1. Bahraini youth gained primary and secondary jobs, whereas all other groups in Bahrain and in
other countries lost them.
2. In Bahrain, in terms of the economic impact, Bahraini women generally fared better than Bahraini
men, whereas in the UK and US the reverse was true.
3. In general, people with lower education levels faced greater difficulty in dealing with the
pandemic than people with higher education levels.
56
4. In all groups, changes in time allocation were quite sensitive to gender and age group, with non-
youth women allocating significantly more time than their male counterparts to assisting children
and the elderly; and young people generally sleeping more and consuming more leisure,
especially only media due to the non-availability of many of their traditional leisure alternatives
(cafes, restaurants, etc.).
5. Women were more likely to express a desire for psychological support than did men; whereas
men were more likely to express a desire for economic support.
In addition to these narrow empirical insights, the data gathered affirm the importance of systematic data
gathering in informing policy, and in laying a foundation for subsequent research. The research team is
planning on follow-up work with the Bangladeshi community in Bahrain to get a better understanding
of the challenges that they have faced; and the team will also conduct a study of how Bahrainis have been
dealing with the difficulties of repaying their loans.

57
References
Al-Ubaydli, O., 2020. Understanding How the Coronavirus Affects the Global Economy: A Guide for Non-
Economists. Derasat Policy Paper.
Alon, T.M., Doepke, M., Olmstead-Rumsey, J. and Tertilt, M., 2020. The impact of COVID-19 on gender
equality (No. w26947). National Bureau of Economic Research.
Fukuyama, F., 2011. The origins of political order: From prehuman times to the French Revolution. Farrar,
Straus and Giroux.
Information and eGovernment Authority (IGA), 2020. Bahrain open data portal
https://www.data.gov.bh/, (accessed 02/10/2020).
International Monetary Fund (IMF), 2020. A crisis like no other, an uncertain recovery. World Economic
Outlook Update.
Labor Market Regulatory Authority (LMRA), 2020. Bahrain Labor Market Indicators,
http://blmi.lmra.bh/, (accessed 02/10/2020).
Nasseh, K. and Vujicic, M., 2020. Modeling the impact of COVID-19 on US dental spending. Health policy
institute research brief. American dental association.
Naumann, C., Al-Ubaydli, O., Abdulla, G., Alabbasi, A., 2018. Bahrain Human Development Report.
United Nations Development Programme.
Our World in Data, 2020. Coronavirus Pandemic (COVID-19). https://ourworldindata.org/coronavirus,
(accessed 02/10/2020).
Pfefferbaum, B. and North, C.S., 2020. Mental health and the Covid-19 pandemic. New England Journal
of Medicine.
Trading Economics, 2020. https://tradingeconomics.com/, (accessed 02/10/2020).
United Nations (UN), 2017. Household size and composition around the world.

58
University of Oxford Migration Observatory, 2020. https://migrationobservatory.ox.ac.uk/, (accessed
02/10/2020).
US Bureau of Labor Statistics, 2020. https://www.bls.gov/, (accessed 02/10/2020).
Weather Atlas, 2020. https://www.weather-atlas.com/en, (accessed 02/10/2020).
World Bank, 2020. World Bank Open Data, https://data.worldbank.org/, (accessed 02/10/2020).
Worldometer, 2020. https://www.worldometers.info/coronavirus/, (accessed 02/10/2020).

59
Appendix: Full Survey
(Arabic and Bangladeshi language versions of the survey are available upon request.)
Welcome to our Covid-19 survey. This survey has 14 questions and takes 6 minutes to complete. This
survey is exclusively for people who are at least 18 years old. Are you at least 18 years old?
Yes
No
Question 1 of 14: How has the Covid-19 pandemic affected your main job? Please note that full-time
education is not considered a job.
Before the pandemic started in February 2020, I didn’t have a main job, and I still do not have one
now
Before the pandemic started in February 2020, I didn’t have a main job, but I have one now
Before the pandemic started in February 2020, I had a main job, but I no longer have one now
Before the pandemic started in February 2020, I had a main job, and I still have one now
[For those taking the last option in Question 1] How has the total number of hours worked in your
main job changed since the beginning of the pandemic in February 2020, on a scale of 1 to 5, where 1
denotes “Decreased a lot”, 3 denotes “No change”, and 5 denotes “Increased a lot”?
Question 2 of 14: How has the Covid-19 pandemic affected your secondary job? Please note that full-
time education is not considered a job.
Before the pandemic started in February 2020, I didn’t have a secondary job, and I still do not
have one now
Before the pandemic started in February 2020, I didn’t have a secondary job, but I have one now
Before the pandemic started in February 2020, I had a secondary job, but I no longer have one
now
Before the pandemic started in February 2020, I had a secondary job, and I still have one now
60
[For those taking the last option in Question 2] How has the total number of hours worked in your
secondary job changed since the beginning of the pandemic in February 2020, on a scale of 1 to 5, where
1 denotes “Decreased a lot”, 3 denotes “No change”, and 5 denotes “Increased a lot”?
Question 3 of 14: For each of the following socioeconomic challenges associated with the Covid-19
pandemic, please evaluate the extent to which it has affected you on a scale of 1 to 5, where 1 denotes
“No effect on me at all”, 3 denotes “A moderate effect on me”, and 5 denotes “An extremely large effect
on me”:
Difficulty in accessing necessities, such as food, medicines, and personal protective equipment
(masks, sanitizer, etc.)
Difficulty in accessing psychological and social support
Difficulty in accessing ongoing education
Decreased time for leisure and relaxation, for example because you have to work while taking
care of children
Temporarily unemployed or laid-off
Income reduction (without being laid-off) and economic insecurity
Other
Question 4 of 14: Please indicate how the Covid-19 pandemic has affected the time you allocate to each
of the following non-work tasks on a scale of 1 to 5, where 1 denotes “Decreased time allocated to this
task a lot”, 3 denotes “No change in time allocated to this task”, and 5 denotes “Increased time allocated
to this task a lot”; or select "N/A" for tasks that do not apply to you:
Sleeping
Personal health, going to the doctor, etc. (except exercise)
Exercise
Studying and attending classes
Preparing meals
Basic childcare (except home schooling/education)
61
Home schooling
Caring for elderly family members
Volunteering for non-profit organizations
Social life (meeting friends and family)
Leisure (recreation, culture, hobbies, games)
Communication media (reading, social media, TV, radio)
Question 5 of 14: What kind of support do you think would be most useful to you? Select only one
option.
Get training for new skills
Channels or platforms to get information about new employment opportunities
Unemployment benefits
Deferment of loan repayment
Deferment of tax payment
Rent support from government
Psychological support
Other
Question 6 of 14: For each of the following ways of financially supporting your household in the near
future until the Covid-19 situation improves, please indicate whether you will use it a lot, use it a little, or
not use it at all:
Seeking new/additional employment opportunities
Running down existing savings
Decreasing spending
Seeking loans from financial institutions
Seeking financial support from individual friends/family
Seeking financial support from non-profit organizations
62
Seeking financial support from the government
Question 7 of 14: What is your nationality?
Question 8 of 14: What is your gender?
Female / Male
Question 9 of 14: What is your age group?
18-24 / 25-34 / 35-44 / 45-54 / 55-64 / 65+
Question 10 of 14: What is your marital status?
Single (never married) / Married / Divorced or separated / Widowed
Question 11 of 14: How many children do you have under the age of 18?
0 / 1 / 2 / 3 / 4 / 5+
Question 12 of 14: How many elderly family members do you assist?
0 / 1 / 2 / 3+
Question 13 of 14: Which [region] do you live in?
[Options depended upon the country where the survey was distributed]
Question 14 of 14: What is your highest completed educational qualification?
Less than high school / High school / Bachelor’s degree / Master’s degree / PhD


![AN ABSTRACT OF THE THESIS OF - [email protected] Home](https://img.pdfslide.us/doc/110x75/613d46a4736caf36b75b6870/an-abstract-of-the-thesis-of-emailprotected-home.jpg)