Embed Size (px)
Citation preview
Journal of Competitiveness ��
The Efficiency of Bankruptcy Forecast Models in the Hungarian SME Sector
Ékes Kristóf Szeverin, Koloszár László
AbstractThe paper examines the efficiency of bankruptcy forecast models in the Hungarian SME sector. We also try to construct own models using discriminant-analysis, logistical regression’s, and neu-ral network methods, based on a random sample, what we try to validate on a second sample.
It has been proved that our own model can only be applied on the first sample with an outstand-ing result. It has also been proved that complicated statistical solutions themselves are not always applicable; there is a need for the expertise of an experienced economist.
The research, of course, does not say that the bankruptcy-forecast methods used in literature have lost their trustworthiness completely. It just draws the attention to the fact that the eco-nomic circumstances of Hungarian SMEs can’t be compared to that of big foreign companies. Therefore, the results of the indexes developed to the large enterprise sector cannot help accu-rate decision making in case of SMEs. Huge narrowing of the complexity of economic charac-teristics may lead to false results.
Keywords: bankruptcy forecast models, discriminant-analysis and logistical regression, neural networks
JEL Classification: C15, C53, C55, G33, M21
1. INTRODUCTIONSmall and medium sized enterprises have got into the centre of interest in the past two dec-ades. There have been several researches in literature to prove their importance regarding the economic growth, creating workplaces and innovation, too (Szerb 2008, Antal-Pomázi 2011, Némethné 2010, Nyitrai 2011). Their initial successes in the whole economy, in producing in-come and improving employment created growing competitive opportunities for SMEs with the anticipation of market growth. After the economic crisis in the years 2008-2010, the develop-ment of the SMEs came to a halt. The possibility of further change of the size-structure, the de-crease of employment figures, the slackening of the development and innovation opportunities and the internal instability pushed the efficiency in the background. Although both international literature and home research have proved in several cases that small and medium sized enter-prises could create the possibility of growth in domestic economy, and the chance for recovery from the current economic situation.
However, several enterprises have gone bankrupt or got onto the brink of bankruptcy instead.
The primary aim of the publication is to investigate some bankruptcy-forecast models’ efficiency on a random sample of Hungarian SMEs.
It is probable that even using proper statistical methods it is not possible to create an index figure that can be used to forecast bankruptcy more accurately in connection with the changes of the
▪
Vol. 6, Issue 2, pp. 56-73, June 2014 ISSN 1804-171X (Print), ISSN 1804-1728 (On-line), DOI: 10.7441/joc.2014.02.05
joc2-2014_v2.indd 56 25.6.2014 14:30:39

��
Hungarian sector of SMEs. It can be approved is that even indexes available in the literature are not able to forecast the bankruptcy with the necessary efficiency. Regarding the examined sector, the complex synthesis of efficiency indexes cannot create a model to forecast the probability of bankruptcy (risk of bankruptcy) more accurately.
We can declare that neither the current bankruptcy-models nor the created ones can be used to forecast the bankruptcy situation even with the use of data from the previous year. We cannot create an universal model that would be able to take the change of the public available company-data into consideration and to adapt to the examined sector’s less uniformed characters.
2. shORT sUmmaRy OF The RegaRDINg lITeRaTUReThe great depression of the 1930s changed the balance of forces and stigmatized the activities of the enterprises, so the vast majority of the research concentrated on creating crisis management models and their applicability (Figure 1) that are able to forecast the problem of the insolvency in advance in the long run.
Fig. 1 – History of the bankruptcy models. Source: Imre (2007).
Considering any model, applying a proper combination of economic (Herczeg-Juhász 2010), fi-nancial (Bíró et al. 2007) and profitability indexes (ratios, indicators) (Illés, 2008) coming from the companies’ reports and the finance-accountancy statements it is possible to forecast a predicted bankruptcy within a couple of years. Connections between bankruptcy and the set of the indexes can be explored by the help of the statistical analyses. However, it is very important that in case of any indicator or model, we must not forget about the fact that bankruptcy forecast has a priority over bankruptcy analysis. Kotormán (2009) emphasises that the results we receive must be proper in any case in order to quantify the danger of the bankruptcy and to qualify the enterprise accord-ing to the bankruptcy or its avoidance.
joc2-2014_v2.indd 57 25.6.2014 14:30:39

Journal of Competitiveness ��
Studying chronologically, the initial starter models put financial and empirical examinations in the foreground. Imre (2007) writes that Ramster, Forster applied the financial indicators; Fitzpatrick, Winekor and Smith applied liquidity indicators and Back et al. (1996) applied a dif-ferential deduced from operating and non-operating enterprises’ data to anticipate bankruptcy. Beaver’s research (1996) pioneered regarding the applicability of bankruptcy models. Beaver created a system of indicators that forecast with the help of multivariable linear equation. Atiya (2001) and Andrew (2006) also used the result of Beaver model in their bankruptcy prediction research.
Altman’s (1968) works are regarded as in important stage of the development of bankruptcy fore-cast and the applicability of the statistical methods as well. The forecast model, carried out using the first multivariable discriminant-analysis harmonises of liquidity, returns, leverage, adequacy of assets and index groups of assets exploitation. He points out the ideal harmonisation of the enterprises’ operation risk indexes. Several publications have come into existence based on Alt-man’s research. For example, Deakin (1972) and Blum (1974) created their forecast models with the help of discriminant-analysis. Using also their results Bernhardsen (2001), Charitou et al. (2004) and Dankovic et al. (2007) tried to lays foundations for better using in practice. Altman et al. (1977) chose 7 categories from 27 financial indicators according to the demands of the age and he modified the original forecast model. Fulmer, Springate and Comerford have also carried out their suggested model based on discriminant-analysis. Nowadays more researcher also have worked with the bankruptcy modelling, Tomescu-Dumitrescu – Holt (2013) concentrated the basics of Altman, Martin et al. (2014) have concentrated on the base parameters (critical factors) of the bankruptcy.
The difference is that they put a bigger emphasis on conclusions drawn from the factors that influence the liquidity (Arutyunajan, (2002 and Noszkay, 2002). Virág and Hajdú (1996, 1998), achieved an outstanding result in Hungary. They carried out examinations that can be applied with discriminant-analysis and logistical regression. Pang and Kogel (2013) also used the dis-criminant analysis as likely appropriate measure in the establishment of bankruptcy prediction model. There were further methods that complete the discriminant-analysis, in the develop-ment of the statistical methods. Ohlson (1980) made forecast models with the binary logistical regression’s method. Four years later Zmijewski (1984) declared in connection with the logistical regression’s method that putting sample items closer to each other the model can be refined, and the possibility of the deform-effect and that of the type II errors can be minimised. Olmeda and Fernandez (1997) declared that the result, received with the help of the neural network, surpassed the results of the discriminant-analysis ensuring the perfect classification. But in the international literature Avenhuis (2013) think that the good measures of bankruptcy prediction based on the results of the research of Altman’s, Ohlsen’s and Zmijewski’s prediction models. Virág-Kristóf (2005) also confirm the findings of Olmeda and Fernandez’s research and they declare that better results can be achieved with tests involving fewer samples than by applying methods of the discriminant-analysis or logistical regression.
It is important to emphasise that we should be careful to take a stand on the applicability of the models. Imre (2007) says that in case of one-variable indicators it is hard to define the results re-ceived from the applied method, mainly because several indicators might contradict each other.
joc2-2014_v2.indd 58 25.6.2014 14:30:39

��
Virág (2004) agrees with this idea too, as the method does not take into consideration the fact that the constellation of indicators can also forecast bankruptcy, and it does not consider the cor-relation arising among indicators. In connection with Altman’s indicator, Imre (2007) declares that in case companies that do not take a part in the stock-exchange process it is difficult to fore-cast. In connection with the improved method, Altman et al. (1977) say that despite innovations the original model can produce better results.
Against the contention of Altman’s the literature (Yang, 2001, Brédart, 2013, Balogh, 2012) believes that the neural net might be is the best model that could be help the researchers and also the management of firms for bankruptcy prediction. However, it should be noted that the literature has significant reservation regarding to the neural network analysis. A problem in the application of the method is the black box effect, the role of random factors, the possibility of reproduction, the possibility of the exist of more local minimums, the interpretation for practi-cal applications and the difficulties of interpretation of relative contribution of the explanatory variables.
We try to answer the question: ‘What are the possibilities, irrespectively of the profile and activ-ity, to provide relevant information for the management of the enterprise. Additionally, is there a reliable general model that can be applied in case of Hungarian SME sector enterprises?
3. CReaTINg a mODel ON aN INITIal aND valIDaTION sampleOne of the initial or pioneering models of the statistical approach is called Altman Z-score formula (Altman 1968). Perhaps it is the best-known bankruptcy-forecast index. The research makes comparisons with the help of that; and at the same time, it incorporates several further models into the examination. The question is whether it is possible to create a complex indicator based on the statistical examination of the company-indicators one group that is able to forecast the potential bankruptcy of the given enterprise in a much higher rate than a random predic-tion.
There is a need for a proper system of indicators, as the first step of its examination. After the summary of literature, we chose the economic indexes that we can find in the Herczeg-Juhász (2010) literature. It puts 26 pieces methodically proper index into the groups (such as liquidity, profitability, solvency, activity, etc. groups) that are wide well known in the literature.
At the next step, based on the economic data of 55 not bankrupted and 33 bankrupted enterpris-es’ sample, we specify the yearly values, given to the above mentioned indicator number-system. Then, by the help of discriminant-analysis, we try to examine the indicator numbers that show getting into bankruptcy the best. Discriminant analysis is a multiple-variable method, with it we can classify (categorize) the cases (enterprises). We can identify significant distinguishing factors of the examined groups. The initial question of the discriminant-analysis is whether it is possible to estimate a connection to a certain group based on given variables. The discriminant-analysis has several preconditions. Contrary to this, logistical regression is much robust. That is why – if it is necessary – we examine the latter method as well.
joc2-2014_v2.indd 59 25.6.2014 14:30:39
Journal of Competitiveness �0
We try to make the validation of the results in several ways, too. First, we involve five indicators, declared by Altman in the analysis. The indicator was made by using the data of companies oper-ating in different business environment and whose size is different from that of operating in the Hungarian SME sector. Based on this we can presume that the bankruptcy forecast of the exam-ined SME companies can be described better with indicators of different contents. If the analysis produces the Altman-type indicators, this concept can be rejected. We compare the specification received from the given function with the results received from the models introduced earlier so that we can check if models discussed in the literature can give a better result than a new model which is based on the sample containing the data in Hungarian SMEs.
We compare the results on another independent sample containing 30 bankrupted and 30 non-bankrupted companies. We examine what results models mentioned in the literature will pro-duce. We also examine how accurate the model is which is based on the previous sample.
To the further examination of the forecast’s reality we step back a year in the economic data of the validation sample enterprises and we carry out specification of both models found in litera-ture and that of new ones as well. We draw a conclusion based on their results.
As for sampling procedure, we have chosen the random sampling method. It brings up the question of the representation. Because of correct representation, given samples must follow the characteristics of the population in the most important elements. Two questions arise here: Regarding the examination, what are the most important characteristics? How are they divided inside the population? We should know that the companies bankrupted in the given year, in which aspects are different from the rate numbers of all the enterprises. For example, is the rate of the bankrupted enterprises is bigger in a given sized region or in a group of companies op-erating in a given sector? That is, what aspects can have an effect on likelihood of bankruptcy? Moreover, we should know what the rate of the bankrupted enterprises is like in the given year, in the circle of all the bankrupted enterprises. In order to define the above-mentioned questions, there is no public available statistics for us, that is why random sampling can be regarded as a logical choice.
We would like to point out that both Altman and most other developers of the models in litera-ture chose the circle of the examined enterprises in a guided way in order to satisfy the condi-tional system of the chosen statistical examination. This is a huge disadvantage of the statistical methods; there will be reference to this at the review of the results.
Initial sampleAt the initial stage of research we applied random sampling1 (SRS); we examined the balance and profit and loss account of (55 operating, and 33 bankrupted) enterprises. Considering their specification, we created groups based on the balance’s main total. 71.6% of the sample is me-dium sized enterprises; 28.4% of them are small enterprises.
1 - Each member of the sampling frame have been selected the same probability, the availability of all mem-bers of the population was provided by the database of the Hungarian E-report portal and Hungarian Official Journal.
joc2-2014_v2.indd 60 25.6.2014 14:30:39
�1
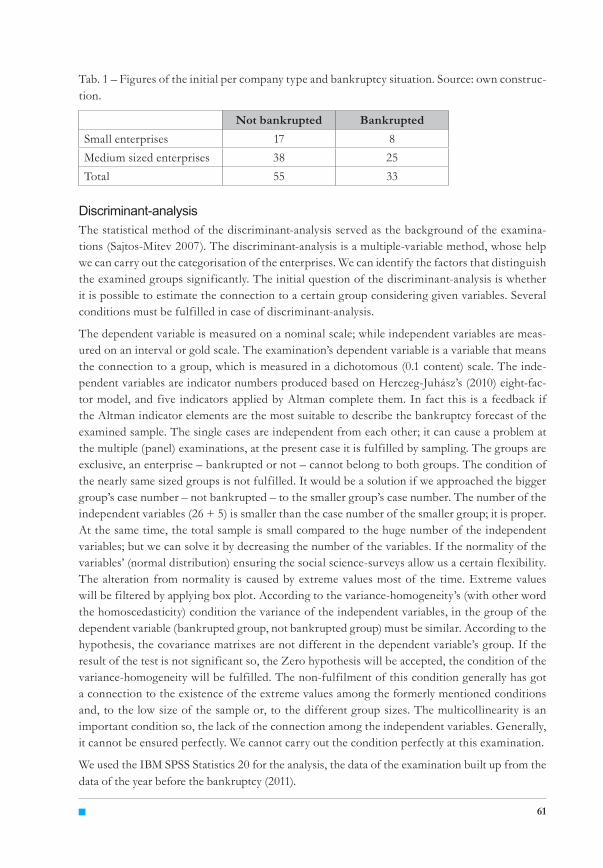
Tab. 1 – Figures of the initial per company type and bankruptcy situation. Source: own construc-tion.
Not bankrupted BankruptedSmall enterprises 17 8Medium sized enterprises 38 25Total 55 33
Discriminant-analysisThe statistical method of the discriminant-analysis served as the background of the examina-tions (Sajtos-Mitev 2007). The discriminant-analysis is a multiple-variable method, whose help we can carry out the categorisation of the enterprises. We can identify the factors that distinguish the examined groups significantly. The initial question of the discriminant-analysis is whether it is possible to estimate the connection to a certain group considering given variables. Several conditions must be fulfilled in case of discriminant-analysis.
The dependent variable is measured on a nominal scale; while independent variables are meas-ured on an interval or gold scale. The examination’s dependent variable is a variable that means the connection to a group, which is measured in a dichotomous (0.1 content) scale. The inde-pendent variables are indicator numbers produced based on Herczeg-Juhász’s (2010) eight-fac-tor model, and five indicators applied by Altman complete them. In fact this is a feedback if the Altman indicator elements are the most suitable to describe the bankruptcy forecast of the examined sample. The single cases are independent from each other; it can cause a problem at the multiple (panel) examinations, at the present case it is fulfilled by sampling. The groups are exclusive, an enterprise – bankrupted or not – cannot belong to both groups. The condition of the nearly same sized groups is not fulfilled. It would be a solution if we approached the bigger group’s case number – not bankrupted – to the smaller group’s case number. The number of the independent variables (26 + 5) is smaller than the case number of the smaller group; it is proper. At the same time, the total sample is small compared to the huge number of the independent variables; but we can solve it by decreasing the number of the variables. If the normality of the variables’ (normal distribution) ensuring the social science-surveys allow us a certain flexibility. The alteration from normality is caused by extreme values most of the time. Extreme values will be filtered by applying box plot. According to the variance-homogeneity’s (with other word the homoscedasticity) condition the variance of the independent variables, in the group of the dependent variable (bankrupted group, not bankrupted group) must be similar. According to the hypothesis, the covariance matrixes are not different in the dependent variable’s group. If the result of the test is not significant so, the Zero hypothesis will be accepted, the condition of the variance-homogeneity will be fulfilled. The non-fulfilment of this condition generally has got a connection to the existence of the extreme values among the formerly mentioned conditions and, to the low size of the sample or, to the different group sizes. The multicollinearity is an important condition so, the lack of the connection among the independent variables. Generally, it cannot be ensured perfectly. We cannot carry out the condition perfectly at this examination.
We used the IBM SPSS Statistics 20 for the analysis, the data of the examination built up from the data of the year before the bankruptcy (2011).
joc2-2014_v2.indd 61 25.6.2014 14:30:40
Journal of Competitiveness ��
The course of the examinationThe examination involved 26 indicators and 5 indicators used by Altman. In order to fulfil the condition of multicollinearity, we have to filter the indicator numbers that correlate closely. That is why some indicator numbers were excluded at the first step; ones that showed a significant correlation (e.g. return on equity, return on assets and the total capital’s return are the indicators that correlate very much, it is enough to keep only one of them in the examination). Because of the strengths of correlation values, the following factors were excluded: return on equity, total capital’s returns and the entrepreneurial profit rate indicator that is proportionated to the entre-preneur’s total capital. The return on assets indicator being in very close correlation with them is remained in the analysis. The gross pre-tax margin ratio and expense ratio were also removed; the indicator of the net pre-tax margin ratio correlating with them remained in the examination. The rate of the own capital showed a close correlation with the Altman X1, X2 and X3 indicators, that is why this indicator was removed as well. We can see a close correlation among the liquidity indicators (current ratio, quick ratio, operating cash flow ratio) and their indebtness ratio, too. No element was excluded here, as they can be important forecast indicators of the bankruptcy-situation, it is worth selecting the most appropriate one.2
We can see also a very close correlation among the Altman-type X1, and X3, X2 and X5 indica-tors. However, we would like to keep them as control items, so they have not been excluded. Regarding the examination, of course, they are considered as a matter of compromise, and are subject to the researcher’s decision. Due to the lack of data, the inventory turnover ratio was also excluded.
Factor analysis would be an elegant statistical solution to compressing dimensions. We could compress the variables connecting to each other into „implicit” factors, reducing the number of the variables in a significant rate. The result, however, would not be less complicated, as we would receive the three-four-five most important factors. In fact, it would not mean that many indicators, but there would be much more of them that should be identified and weighted. There-fore, it is certain that we would not reach the relation that we expected as a result.
Thus, significant indicators that are important because of grouping should be filtered in other way from among 24 in the examination. We have partly referred Altman’s work (1968) and we tried draw conclusions from the observation of different alternatives. All the combinations (par-tial and complete) cannot be tested; so the researcher’s judgement is important in the analysis too. Based on the completed tests, there is need for excluding the extreme values of possible in-dicators, which were produced taking box plots. However, it is not possible to filter the extreme values, because by removing all the extreme values of 24 variables, most cases would remain included (in case of one variable each), and only very few could remain in the analysis. The software running with stepwise method would load variables one by one into the analysis while running a discriminant-analysis; it would be possible to separate the significant indicators.
2 - Noting that these indexes does not necessarily added to the outcome because of this decision. The liquidity ratio is not included in Altman indicators.
joc2-2014_v2.indd 62 25.6.2014 14:30:40
��
ResultsResults arising from several observations, make it possible to describe a proper indicator group, that most determines how certain cases are related to groups.
The rate of the current assets, the rate of the accounts receivable, the coverage ratio of the fixed assets (long-term debt plus equity rated to long-term assets) and the Altman type X4 (market value equity / book value of total debt) indicators have been involved.3
The results of the analysis show that the last mentioned indicator would only be significant at α=0.159. The problem of the multicollinearity does not exist; it can be seen from the correlation-matrix among the groups. The Box’s M-test is very sensitive, at the same time zero hypothesis could only be rejected just at the choice of a very low value, under 0.002, the condition of the variance-homogeneity can be fulfilled. The discriminant function has got a huge value (18.9 relative importance). The huge value of the canonical correlation (0.975) shows that the formed discriminant function explains the difference among the groups at a huge rate. It explains the (0.9752=) 95% of the different variables’ variance. It is the low Wilks’-lambda value of the discri-minant function and its significance that supports the explaining effect of the function is huge.
Relative importance of the variables can be seen from standard discriminant co-efficients. We can also learn from it what we saw in the Wilks’-lambda value. Besides the relative efficiency of the leverage indicator, the other four indicators look small. This makes the biggest difference between the groups. It is also supported by the structure matrix including the Pearson product-moment correlation coefficients.
As a result of the analysis we managed to reach a 100% rate of hit so, all the events will be put into their actual groups by the help of the discriminant function, including the chosen indica-tors, after exclusions. We could reach a 50% rate with estimation; the result we got is worth com-paring with this value. With the help of the software we have also examined the cross-validity of the analysis. The programme carried out the analysis several times, doing ‘leaving-one-out’ observation. At this case, it gave the same result (100%).
The value of the canonical discriminant (Z) function:
Z = 2.121-0.104 * D1 – 1.102 * D2 + 0.238 * D3 + 0.497 * D4 – 0.146 * X4
Where:
D1 = The rate of the current assets
D2 = The rate of the accounts receivable
D3 = the coverage ratio of the fixed assets
D4 = Leverage
X4 = market value equity 4/ book value of total debt5
3 - The number of these indicators became five, not for the reason because there were combinations just for five indicators in the examination, there were tested groups also with more and less elements-numbers4 - We understand under the market value equity, the market value of all the shares, being in the trade, at the small and medium sized enterprises we could use the book value of the own capital.5 - The book value of total debt means the sum of all the short and long term depts.
joc2-2014_v2.indd 63 25.6.2014 14:30:40

Journal of Competitiveness ��
The limit value of connection to the group is Z=0. The value that is less than zero indicates belonging to the “bankruptcy-group”. Applying the function on the total sample produced a bad classification at 3 enterprises in the not-bankrupted group; and at 3 enterprises in the bankrupt-ed group. We carried out the same examination for the five variables, used originally by Altman. On the ground of the results that we received, according to the cross-validity, the 57.6% of the cases were classified with the discriminant-function. We have to add, that excluding the extreme values, took place the five variables that were chosen originally, not according to the Altman indicators. It is important to stress the valid indicator’s role of the leverage in the sample. It is also important to declare that several exclusions did not help the fulfilment of all the conditions of the discriminant-analysis.
Binary logistical regressionAs exclusions of extreme values took place in both groups, the condition of the almost same sized groups (21 vs. 38 cases) was not completed. The value of the Box’s M indicator was con-vincing either; is that another essential condition was not completed either. Thus, besides the discriminant-analysis it is worth examining the relationships between variables with the help of the binary logistical regression. There is no stepwise process here, we examine the formerly cho-sen variables and we enter them into the analysis at the same time (method: enter). This analysis is much robust; it has fewer pre-conditions than the discriminant-analysis. Moreover, it is not sensitive to different group-sizes. We do not have to consider extreme values either; logistical regression is also less sensitive to it. The multicollinearity – examination of the connections among the variables – took place with the help of correlation factors; our case number is big enough. The former exclusions that happened because of the extreme values have been deleted, every case (55 plus 33), is involved in the analysis.
Initially we could estimate with a 62.5% probability (if we do not estimate at random, but we choose the bigger group deliberately each time, we have a chance for 55/88*100=62.5%). In-cluding our variables in the model, we can get an estimated value indicating how big part of the dependent variable’s variance will be explained by the independent variables’ combination. The 87.3% (Nagerle R-square) is considered to be very good. The model classified the group of bankrupted companies, with 90% probability (30 were good, 3 were wrong), and it catego-rised the group of not bankrupted ones with 98.2% probability (54 were good, 1 was wrong). It means a total precision of 95.5% significance and, the Exp (B) indicator that shows the single contribution as, at the discriminant-analysis. The leverage indicator has an important role in the classification.
Neural networkWe used the IBM SPSS Modeler 15.0 for the analysis. According to the literature (Kristóf, 2008) four-layer network with backpropagation algorithm should be used so that the first hidden layer contains six, the second hidden layer includes five neurons. Based on our attempts on the initial sample we found that the MLP (multilayer perceptron) network containing two hidden layer with six and four neurons gives the best overall accuracy. Besides the 2 failure on the initial sample there was the lowest overtraining, namely the best result on the validation sample. This analysis has also showed the leverage indicator the most important.
joc2-2014_v2.indd 64 25.6.2014 14:30:40

��
Utilizing the possibilities of the software we ran some analysis (e.g. discriminant analysis, lo-gistic regression, neural networks) parallel. This result confirm the literature (Imre, 2008), the neural network is shown to be the best method. Decision tree algorithms (recursive partitioning algorithm) was run, of which the C5.0 gave the best results, it gave also 2 incorrect classification resulted on the initial sample, but the classification results on the validation sample is worse than the neural network’s.
Comparing models to the initial sampleThe sample has been applied to most models published in literature. The results are shown in table 2.
Tab. 2 – How to understand the results. Source: own construction.
Valid classification into a group
The group classification given back by the model
Bankrupted Operating
Bankrupted OK H1
Not bankrupted (operating)
H2 OK
H1 The bankrupted group indicated their sum any enterprises, as operating ones so, they are not indicated among the bankrupted ones.
H2 The operating indicated its some enterprises as bankrupted ones so, they are indicated among the operating ones.
H1 and H2 can be called type I and type II errors.
In connection with the operating enterprises one of the lowest mistake-value was given by the Hungarian regression model, which is connection with Virág-Kristóf. However, in case of bank-rupted enterprises, 28 of 33 were defined in a wrong way. Thus, the indicator is not sensitive enough; altogether it is completely insensitive. In case of most enterprises, it does not indicate a bankruptcy. The Springate and Zmijewski model shows a similar good value but even at this cases the model indicated exactly just at the operating enterprises. It shows 87.9% and a 84.8% failure at the bankrupted group. The Altman’s model shows a medium value as it is working with a 30.9% failure at the operating enterprises and with a 51.5% failure at bankrupted enter-prises. The applied discriminant model reinforced with the binary logistical regression, without exclusion of extreme values, classified 3 companies in case of both operating and bankrupted enterprises. It meant 5.5% and 9.1% failure. Both of the neural network and the decision tree algorithm bring 2 failure on the whole sample. We can say that the own analysis taken to the actual sample produced almost perfect result. The models preferred by the literature (e.g. neural network) perform better among the own models.
joc2-2014_v2.indd 65 25.6.2014 14:30:40

Journal of Competitiveness ��
Tab. 3 – The failure values of the crisis management’s models, projected onto the initial sample. Source: own construction.
Indicated among the op-
erative ones
Percentage (%)
Not indicated among the
bankrupted ones
Percentage (%)
Altman 17 30.9 17 51.5Springate 3 5.5 29 87.9Comerford 24 43.6 15 45.5Ohlson 30 54,5 13 39.4Zmijewski 3 7.3 28 84.8Virág-Hajdú discriminant 14 25.5 26 78.8Virág-Hajdú regression 1 1.8 28 84.8Own discriminant model 3 5.5 3 9.1Own logistical regression model 1 1.8 3 9.1Own neural network model 2 (2.3%)Own decision tree (C5.0) model 2 (2.3%)
Eventually, we came to a conclusion that any of the indicators would indicate the fact relatively well that an enterprise that is operating. However, in connection with the bankruptcy almost all the indicators insensitive; they do not react in a right way; they are not proper for forecast either. In case we need a forecast, none of the models in the literature is reliable. Most probably, they will not be able to forecast the bankruptcy where it would be necessary. However, our own model was able to produce quite accurate value. In order to confirm or reject the validity of the model we have applied a validity sample to the above-mentioned models.
The validity sampleWe have applied the method of random sampling at collecting samples. As you can see (table 4) we have analysed data of 60 companies from the year of 2011 (30 operating and 30 bankrupted ones).
Tab. 4 – The validity sample’s values understood for company type and bankruptcy. Source: own construction.
Not bankrupted Bankrupted
Small enterprise 7 12Medium sized enterprise 23 18Total 30 30
Comparison of the modelsWe have also applied some crisis forecast models available in the literature. The results are as follows (table 5):
joc2-2014_v2.indd 66 25.6.2014 14:30:40
��
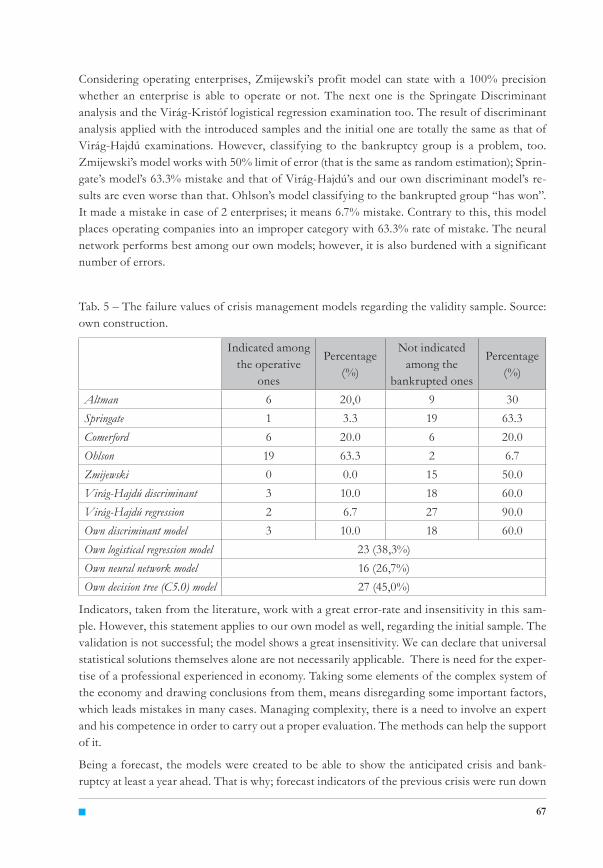
Considering operating enterprises, Zmijewski’s profit model can state with a 100% precision whether an enterprise is able to operate or not. The next one is the Springate Discriminant analysis and the Virág-Kristóf logistical regression examination too. The result of discriminant analysis applied with the introduced samples and the initial one are totally the same as that of Virág-Hajdú examinations. However, classifying to the bankruptcy group is a problem, too. Zmijewski’s model works with 50% limit of error (that is the same as random estimation); Sprin-gate’s model’s 63.3% mistake and that of Virág-Hajdú’s and our own discriminant model’s re-sults are even worse than that. Ohlson’s model classifying to the bankrupted group “has won”. It made a mistake in case of 2 enterprises; it means 6.7% mistake. Contrary to this, this model places operating companies into an improper category with 63.3% rate of mistake. The neural network performs best among our own models; however, it is also burdened with a significant number of errors.
Tab. 5 – The failure values of crisis management models regarding the validity sample. Source: own construction.
Indicated among the operative
ones
Percentage (%)
Not indicated among the
bankrupted ones
Percentage (%)
Altman 6 20,0 9 30Springate 1 3.3 19 63.3Comerford 6 20.0 6 20.0Ohlson 19 63.3 2 6.7Zmijewski 0 0.0 15 50.0Virág-Hajdú discriminant 3 10.0 18 60.0Virág-Hajdú regression 2 6.7 27 90.0Own discriminant model 3 10.0 18 60.0Own logistical regression model 23 (38,3%)Own neural network model 16 (26,7%)Own decision tree (C5.0) model 27 (45,0%)
Indicators, taken from the literature, work with a great error-rate and insensitivity in this sam-ple. However, this statement applies to our own model as well, regarding the initial sample. The validation is not successful; the model shows a great insensitivity. We can declare that universal statistical solutions themselves alone are not necessarily applicable. There is need for the exper-tise of a professional experienced in economy. Taking some elements of the complex system of the economy and drawing conclusions from them, means disregarding some important factors, which leads mistakes in many cases. Managing complexity, there is a need to involve an expert and his competence in order to carry out a proper evaluation. The methods can help the support of it.
Being a forecast, the models were created to be able to show the anticipated crisis and bank-ruptcy at least a year ahead. That is why; forecast indicators of the previous crisis were run down
joc2-2014_v2.indd 67 25.6.2014 14:30:40

Journal of Competitiveness ��
on the validity figures of 2010 (table 6). The results were similar to those of the 2011 sample. Zmijewski’s model classifies the operating enterprises into the operating groups with a 100% accuracy. However, it works with a 70% failure regarding the bankrupted group. At the present case even the Springate, Virág-Hajdú and our own discriminant models produce 1 failure among operating enterprises. It makes a failure in the other group with a 63.6%, 60% and 66.7% prob-ability. Focusing on the accuracy of the bankrupted group, Ohlson’s model turns out to be the most accurate. It did not indicate bankruptcy at 6 enterprises, which means 20% failure. How-ever, it produces higher than 60% failure among operating ones.
Therefore, we can conclude that considering either the present year or the previous one, the models are insensitive; they do not forecast the bankruptcy in a proper way, and they produce a high rate of type I and type II errors.
Tab. 6 – The failure values of the crisis management models regarding the validity sample (previ-ous year’s data). Source: own construction.
Indicated among the operative
ones
Percentage (%)
Not indicated among the
bankrupted ones
Percentage (%)
Altman 7 13.3 1 36.7Springate 1 3.3 9 63.3Comerford 4 13.3 10 33.3Ohlson 20 66.7 6 20.0Zmijewski 0 0.0 21 70Virág-Hajdú discriminant 1 3.3 18 60.0Virág-Hajdú regression 2 6.7 29 96.7Own discriminant model 1 3.3 20 66.7
Discriminant analysis and logistical regression in a validity sampleAs the results of the validation are not proper, a question remains: which factors might be de-terminant at the classification. The discriminant analysis was also tested on the validity sample in the above-described way. It was carried out in order to highlight the most important factors of grouping within the relevant sample. Exclusion of extreme values would have shortened the sample very much; moreover, the Box’s M indicator’s value was convincing either, we had com-pleted the examination with binary logistical regression. As a result:
the indicator of the long term dynamic liquidity,
the indicator of average pre-tax margin ratio,
and the Altman type X2 indicator got into the analysis.
They are the most important ones; involving other indicators will not improve the classification, or just to a very little extent. According to Nagerle R-square indicator, the combination of three indicators (as independent variables), explains a 61.1% rate of the variance of the dependent
joc2-2014_v2.indd 68 25.6.2014 14:30:40

��
variable. On the ground of the conducted analysis (binary logistical regression), in case of bank-rupted enterprises, the model classified 8 of 30 into a wrong place (73.3% accuracy). In case of the not bankrupted enterprises, it categorized 3 (also from 30, it is a 90% accuracy). Altogether, this means 81.7% accuracy.
It is worth seeing what classification would the model produce in the initial sample. The result of the binary regression: the value of the Nagerle R-square is just 28.7%. Regarding bankrupted enterprises, the model classifies 21 of 33 them into a wrong place (36.4% accuracy). In case of not bankrupted enterprises, this is 2 (also from 55, it is 96.4% accuracy). Altogether, it is 73.9% accuracy.
This summary seems to be nice but considering it to be the 62.5% minimum value, explained at the analysis of the initial starting sample, it cannot be regarded as extreme. (Because of equal sample sizes at random validity sample, the probability is 50%. The result of 81.7% has to be re-lated to this.) Furthermore, the model is wrong on the one hand: it is not sensitive enough; it does not really indicate in case of a bankruptcy. Therefore, we cannot come to universally applicable solution at the analysis of the validity sample. Testing the model on the initial sample produced worse results than expected.
4. OUTCOmes, DeDUCTIONs, CONClUsIONsThe research explains and examines bankrupted and operating enterprises with discriminant analysis and logistical regression method. Taking an initial sample, it tests the efficiency of the bankruptcy forecast models of literature on random samples from the Hungarian SME sector. Our own models are also tested on the samples. The fact that our own models are applicable only on the initial sample with an outstanding result was justified on one validation sample. In addi-tion, it has been proven that the devised models are just as insensitive to bankruptcy forecast as the ones in the literature. Our aim was not to create a unique model in this paper, so not to strive in order to refine our models, we tried to show that when examining specific companies (e.g. banking practice) the different methods should not be used automated. It has also been proven that complex statistical solutions themselves will not surely reach the aims; there is a need for the experienced expert’s competence. Picking some items, and drawing conclusions on their basis will lead to type I and type II errors in several cases. Taking it into consideration, it has been emphasised that statistics can provide crucial information for the management of a company. However, the efficiency of bankruptcy forecast more dependent on complex evaluation based experts’ experience rather than on numeric values of equations.
Of course, the research does not say that the bankruptcy methods used in literature have abso-lutely lost their genuineness. It just draws attention to the fact that (1.) economic circumstances of Hungarian enterprises cannot be compared to that of big foreign companies. Thus, they cannot help with accurate decision-making regarding SMEs. (2.) Significant narrowing of the complexity of economic features, formalised decision-making can lead to faulty results in many cases.
joc2-2014_v2.indd 69 25.6.2014 14:30:40
Journal of Competitiveness �0
The research introduces two overall conclusions:
The examined critical indicators are partly suitable for the analysis of the current situation of the enterprise. However, they do not forecast the bankruptcy on their own. Crisis man-agement models, however, are rather insensitive regarding classification to the bankruptcy-group. Elimination of greater type I and type II errors cannot be solved.
Models can be created based on statistics, but these models turned out to be rather inac-curate regarding examination of single enterprises.
Drawing a conclusion from the mentioned suppositions, we can say that on the one hand it was justified that with the use of statistical methods it is not possible to create an indicator that pro-duces a general forecast relevant to enterprises in the sector. The own models proved that with the help of complex synthesis of economic data it is possible to create a model on a given sample that forecasts the risk of bankruptcy more accurately. However, its general extension did not prove to be successful. Most indicators cited in literature have produced almost the same result. Most of the models prove the exactly the fact: if an enterprise is able for the operation; and it will classify that into this group. However, regarding bankrupted enterprises it cannot say much more accurately than random estimation (50% probability) whether enterprises have actually gone bankrupt.
On the other hand, it has been proved that none of the indicator results has changed compared to the previous year. Neither formerly published literature models, nor our discriminant model created on our own initial sample is able to forecast whether an enterprise will actually go bank-rupt in a year’s time. Models take place with a big number of errors in the bankrupted group and they are wrong at the examination of the previous year’s data mostly at the same enterprises. Altogether, we can say that the models do not give the necessary information in connection with the bankruptcy-situation. Suggestions of the models can only be used with professional evalua-tion of an expert.
ACKNOWLEDGEMENTSThanks for Dr. Imre Balogh help in the use of SPSS Modeler.This research is supported by the European Union and Hungary, the European Social Fund co-financed by the number of identifying TÁMOP 4.2.4.A62-11-1-2012-0001 National Excellence Program – The establishment and operation system for domestic students, researchers and support staff „implemented within the framework of priority project entitled” Convergence Program.
ReferencesAntal-Pomázi, K. (2011). A finanszírozási források szerepe a kis- és középvállalkozások növekedésében. Közgazdasági Szemle, March 2011, 275-295.
Altman, E. I. (1968). Financial ratios, discriminant analysis and the prediction of corporate bankrupcy. The Journal of Finance, 23(4), 589-609.
Altman, E. I., Haldeman, R., & Narayanan, P. (1977). Zeta Analysis: A New Model to Identify Bankruptcy Risk of Corporations. Journal of Banking & Finance, 1(1), 29-54. http://dx.doi.org/10.1016/0378-4266(77)90017-6
Arutyunjan, A. (2002). A mezőgazdasági vállalatok fizetésképtelenségének előrejelzése. Dissertation thesis. Gödöllő: Széchenyi István Doktoral School.
1.
2.
1.
2.
3.
4.
joc2-2014_v2.indd 70 25.6.2014 14:30:40
�1
Andrew, Y. A. (2006). Predicting financial distress of Spanish companies. Barcelona: University of Barcelona.
Atiya, A. F. (2001). Bankruptcy Prediction for Credit Risk Using Neural Networks: A Survey and a New Results. IEEE Transaction on Neural Networks, 12(4), 929-935. http://dx.doi.org/10.1109/72.935101
Avenhuis, J. O. (2013). Testing the Generalizability of the Bankruptcy Prediction Models of Altman, Ohlson and Zmijewski for Dutch Listed and Large non-Listid Firms. Enschede, Netherlands: The School of Management and Governance, University of Twente.
Back, B., Laitinen, T., Sere, K., & van Wezel, M. (1996). Choosing bankruptcy predictors using discriminant analysis, logit analysis, and genetic algorithms. Turku Centre for Computer Science Technical Report 40. Retrieved June 18, 2014 from http://intes-group.narod.ru/books/choosing_predictors.pdf
Balogh, I. (2012). Application of Neural Network Algorithm for Solving Management Problems. In: A gazdasági fejlődés fő hajtóerői (munkahelyteremtés – hatékonyság – innováció), International Scientific Conference, Sopron.
Beaver, W. H (1966). Financial Ratios as Predictors of Failures. Empirical Research in Accounting. Selected Studies. Retrieved June 18, 2014 from http://www.jstor.org/discover/10.2307/2490171?uid=3738216&uid=2&uid=4&sid=21101620930377
Bernhardsen, E. (2001). A model of Bankruptcy Prediction. Working Paper. Oslo: Norges Bank, Financial Analysis and Structure Department, Research Department.
Bíró, T., Kresalek, P., Pucsek, J., & Sztanó, I. (2007). A vállalkozások tevékenységének komplex elemzése. Budapest: Perfekt Kiadó.
Blum, M. (1974). Failing company discriminant analysis. Journal of Accounting Research, 12(1), 1-25. http://dx.doi.org/10.2307/2490525
Brédart, X. (2014). Bankruptcy Prediction Model Using Neural Networks. Accounting and Finance Research, 3(2), 124-129. http://dx.doi.org/10.5430/afr.v3n2p124
Chestari, G. et al. (2013). Bankruptcy Prediction Models: Preliminary Thoughts on the Determination of Parameters for the Evaluation of Effctiveness and Efficiency. European Scientific Journal, 9(16), 265-291.
Charitou, A., Neophytou, E., & Charalamsons, G. (2004). Predicting corporate failure. Empirical evidence for the UK. European Accounting Review, 13(3), 465-497. http://dx.doi.org/10.1080/0963818042000216811
Dankovic, R., Czado, C., & Berg, D. (2007). Bankcruptcy prediction in Norway: a comparative study. Statistical Research Report No. 4. Oslo: Department of Mathematics, University of Oslo.
Deakin, E.B. (1972). A Discriminant analysis of predictors of business failure. Journal of Accounting Research, 10(1), 167-179. http://dx.doi.org/10.2307/2490225
Illés, M. (2008). Vezetői gazdaságtan. Budapest: Kossuth Kiadó
Imre, B. (2007). Csődmodellek története és fejlődése, E-tudomány, 2007(3).
5.
6.
7.
8.
9.
10.
11.
12.
13.
14.
15.
16.
17.
18.
19.
20.
joc2-2014_v2.indd 71 25.6.2014 14:30:40
Journal of Competitiveness ��
Imre, B. (2008). Bázel II definíciókon alapuló nemfizetés-előrejelzési modellek mag yarországi vállalati mintán (2002-2006). Dissertation Thesis. Miskolc: University of Miskolc.
Herczeg, J., & Juhász, L. (2010). Az üzleti tervezés gyakorlata. Budapest: Aula Kiadó.
Kotormán, A. (2009). A mezőgazdasági vállalkozások felszámolásához vezető okok elemzése. Dissertation Thesis. Debrecen: University of Debrecen.
Kristóf, T. (2008). Gazdasági szervezetek fennmaradásának és fizetőképességének előrejelzése. Dissertation Thesis. Budapest: BCE.
Martin, A. et al. (2014). An Analysis on Qualitative Bankruptcy Prediction Rules Using Ant-Miner. International Journal of Intelligent Systems and Applications, 6(1), 36-44. http://dx.doi.org/10.5815/ijisa.2014.01.05
Némethné Gál, A. (2010). A kis- és középvállalkozások versenyképessége – egy lehetséges elemzési keretrendszer. Közgazdasági Szemle, Febr. 2010, 181-193.
Noszkay, E. (2002). A válságmenedzsment és hazai g yakorlata. Budapest: SZIE-GTK-VTI, egyetemi jegyzet.
Nyitrai, J. (ed.) (2011). A kis- és középvállalkozások helyzete a régióban. Retrieved June 18, 2014 from http://www.ksh.hu/docs/hun/xftp/idoszaki/regiok/gyorkkv.pdf
Ohlson, J. A. (1980). Financial Ratios and the Probabilistic Prediction of Bankruptcy. Journal of Accounting Research, 18(1), 109-131. http://dx.doi.org/10.2307/2490395
Olmeda, I., & Fernandez, E. (1997). Hybrid Classifiers for Financial Multicriteria Decision Making: The Case of Bankruptcy Prediction. Computational Economics, 10(4), 317-335. http://dx.doi.org/10.1023/A:1008668718837
Pang, J., & Kogel, M. (2013). Retail Bankruptcy Prediction. American Journal of Economics and Business Administrations, 5(1), 29-47. http://dx.doi.org/10.3844/ajebasp.2013.29.46
Sajtos, L., & Mitev, A. (2007). SPSS kutatási és adatelemzési kézikönyv. Budapest: Alinea Kiadó.
Szerb, L. (2008). A hazai kis- és középvállalkozások fejlődését és növekedését befolyásoló tényezők a 2000-es évek közepén. Vállalkozás és Innováció, 2(2), 1-35.
Tomescu-Dumitrescu, C., & Holt, A. G. (2013). Evaluation of Bankruptcy Risk Using Econometric Modelling. In. Advances in Accounting, Auditing and Risk Management. University „Constantin Brancusi”, Targu Jin, Romania, pp. 97-100.
Virág, M. (2004). Pénzüg yi elemzés, csődelőrejelzés. Budapest: Aula Kiadó.
Virág, M., & Hajdu O. (1996). Pénzügyi mutatószámokon alapuló csődmodell-számítások. Bankszemle, 15(5), 42-53.
Virág, M., & Hajdu O. (1998). Pénzügyi viszonyszámok és a csődelőrejelzés. Bankról, pénzről, tőzsdéről. Válogatott előadások a Bankárképzőben 1988-1998, 440-457.
Virág, M., & Kristóf T. (2005). Az első hazai csődmodell újraszámítása neurális hálók segítségével. Közgazdasági Szemle, 52(2), 144-162.
Yang, Z. (2001). A new methods for company failure prediction using probabilistic neural networks. Exeter: Exeter University.
21.
22.
23.
24.
25.
26.
27.
28.
29.
30.
31.
32.
33.
34.
35.
36.
37.
38.
39.
joc2-2014_v2.indd 72 25.6.2014 14:30:40

��
Zmijewski, M. E. (1984). Methodological Issues Related to the Estimation of Financial Distress Prediction Models. Journal of Accounting Research, 22, 59-82. http://dx.doi.org/10.2307/2490859
Contact informationKristóf Szeverin Ékes (MSc student)Faculty of Economics of University of West HungaryEmail: [email protected]
László Koloszár (associate professor)Faculty of Economics of University of West Hungary
40.
joc2-2014_v2.indd 73 25.6.2014 14:30:40


![Modeli za ocjenu rizičnosti...[Zmijewski, M., E., Methodological issues related to the estimation of financial distress prediction models, Journal of accounting research 24] Springate](https://img.pdfslide.us/doc/110x75/5e92f67d1718fc0f8c4a125f/modeli-za-ocjenu-rizi-zmijewski-m-e-methodological-issues-related-to.jpg)