Embed Size (px)
Citation preview

Proceedings of the Canadian Multidisciplinary Road Safety Conference XII; June 10-13, 2001; London, OntarioActes de la XIIe Conférence canadienne multidisciplinaire en sécurité routière; 10-13 juin 2001; London, Ontario
1
UTILIZING DATA FROM AUTOMOTIVEEVENT DATA RECORDERS
Joe T. CorreiaKen A. IliadisEd S. McCarronMario A. Smolej
Hastings, Boulding, CorreiaConsulting Engineers
Abstract
In March 2000, Vetronix Corporation unveiled aCrash Data Retrieval (CDR) system that allows usersto download data from certain GM vehicles subjectedto a crash event involving the deployment or neardeployment of an airbag. The recording of crashevent data is a by-product of the introduction ofairbags and the need to measure or sense the severityof a crash by automobile manufacturers. GM hasbeen using a Sensing and Diagnostic Module (SDM)to measure crash severity since 1994 and startedrecording pre-crash data, such as vehicle speed,engine RPM, throttle position, and brake status withsome 1999 model year vehicles. This paper reviewsthe evolution of automatic recording devices intransportation, including the automotive Event DataRecorder (EDR). The recording and retrieval of datain the GM and Vetronix systems are examined withparticular attention on using the data for accidentreconstruction purposes. Twelve low speed testsinvestigate the current threshold and sensitivity forrecording data, while five case studies investigate theusefulness and limitations of the recorded data.
Résumé
En mars 2000, Vetronix Corporation a dévoilé unsystème qui permet aux usagers de télécharger desdonnées de certains véhicules GM assujetti à unecollision avec déploiement ou quasi-déploiement decoussin gonflable. L’enregistrement des donnéesd’une collision est un sous produit de l’introduction
des coussins gonflable et un besoin de mesurer et dedétecter la sévérité d’un impact par les manufacturiersautomobiles. GM utilise un module de détection et dediagnostic « Sensing and Diagnostic Module (SDM) »pour mesurer la sévérité d’une collision depuis 1994et enregistre des données d’avant collision tel que,vitesse du véhicule, révolution moteur, position del’accélérateur et statu du frein sur certains modèles1999. Cet article revise l’évolution des dispositifsd’enregistrement automatique dans le transport, enautre le « Event Data Recorder (EDR) ».L’enregistrement et l’acquisition de données dans lesystème GM et Vetronix sont examinés avec uneattention particulière sur les données utilisable pourfin de reconstruction d’accident. Douze essais àfaible vitesse ont été effectués afin d’enquêter sur leseuil et la sensibilité de l’enregistrement et cinqétudes examinent l’utilité et les limites des donnéesenregistrées.
Evolution of Data Recorders
Event Data Recorders (EDRs), or automatic recordingdevices that can capture information regarding anevent, have existed in the transportation industry formore than half a century. The devices mostsynonymous with EDR technology are the “blackboxes” used in aviation. The first practical FlightData Recorder (FDR) was introduced in 1953. [1]However, the earliest transportation recording deviceis the tachograph found on heavy trucks, invented in1921. [2] Both of these early EDR instruments weremechanical analog devices. The first generation ofFDRs used styli to generate oscillograph traces onmetal foil to record a plane’s airspeed, altitude,heading and vertical accelerations with respect totime. Similarly, the tachograph records vehiclespeed, engine RPM and distance travelled onto arotating circular chart.
Table 1 contains a condensed summary of the activityby safety boards and regulatory authorities on EDRsfor the four modes of transportation involving themovement of people - aviation, marine, railway andhighway.

Proceedings of the Canadian Multidisciplinary Road Safety Conference XII; June 10-13, 2001; London, OntarioActes de la XIIe Conférence canadienne multidisciplinaire en sécurité routière; 10-13 juin 2001; London, Ontario
2
Mode Recorder Date Authority / Reference Details / Parameters
Aviation FlightDataRecorder(FDR)
Early 1940's CAB Regulation [1] Call for flight recording device, but later rescindedJuly 1, 1958 CAA Regulation [1] Analog FDR to record 5 parameters: time, altitude, airspeed,
vertical accelerations, and headingDec. 10, 1972 FAA Regulation
14 CFR 121.343Digital FDR (DFDR) required on transports ($20 passengers)certified after 1969 to record minimum 17 parameters
Sep. 12, 1997 FAA Regulation14 CFR 121.344
Transports built after Aug. 8, 2002 required to record minimum88 parameters
CockpitVoiceRecorder(CVR)
Prior 1960 CAB Recommendation [1] Recommend that flight crew conversations be recordedJan. 1, 1967 FAA Regulation
14 CFR 121.359Airplanes required to carry CVR capable of recording last 30minutes of conversations
Mar. 9, 1999 NTSB RecommendationA-99-17 to FAA
Require 2 (1 fore/1 aft) solid state CVR/DFDR with independentpower supply after Jan. 1, 2003
Marine VoyageDataRecorder(VDR)
Mar. 2, 1976 NTSB RecommendationM-76-8 to US Coast Guard
Require the installation of an automatic recording device topreserve vital navigational information aboard oceangoing ships
July 17, 1995 NTSB RecommendationM-95-6 to US Coast Guard
Propose to IMO that it require all vessels over 500 gross tons beequipped with VDR
Nov. 27, 1997 IMO ResolutionA.861(20)
Performance standards established for 14 data items, including:date and time, position, speed, heading, radar data, wind speedand direction, bridge and communications audio, etc.
Dec. 6, 2000 SOLAS Chapter V,Regulation 20
Passenger ships constructed after July 1, 2002 to carry VDRscapable of recording minimum 12 hours of data identified inperformance standards
Railway LocomotiveEventRecorder(LER)
May 26, 1995 FRA Regulation 49 CFR 229.5 and 135
Lead locomotive of any train operated over 30 mph to recordspeed, direction, time, distance, throttle, brake application andoperations, as well as cab signals over last 48 hours
Aug. 28, 1997 NTSB RecommendationR-97-9 to FRA
Require the recording of crew’s voice communications forexclusive use in accident investigations and with appropriatelimitations on public release of recordings
Highway On-BoardRecorder(OBR)
Sep. 30, 1988 FHWA Regulation 49 CFR 395.15
Hours-of-Service rules for commercial vehicle drivers allow useof OBR to record duty status, distance and hours driven
Feb. 5, 1990 NTSB RecommendationH-90-28 to FHWA
Require automated/tamper-proof on-board recording devices,such as tachographs or computerized logs
Aug. 5, 1998 NTSB RecommendationH-98-23 to Truck Groups
Advise members to equip fleets with automated and tamperproof on-board recording devices
EventDataRecorder(EDR)
July 1, 1997 NTSB RecommendationsH-97-18 to NHTSA andH-97-21 to Automakers
Develop and implement a plan to gather better information oncrash pulses & other crash parameters in actual crashes, utiliz- ingcurrent or augmented crash sensing and recording devices
Nov. 2, 1999 NTSB RecommendationsH-99-53 and H-99-54to NHTSA
Require school buses & motor coaches built after Jan. 1, 2003 torecord minimum 17 parameters and to develop and implementstandards for the recording of crash data
CAA - Civil Aviation Authority FRA - Federal Railroad AdministrationCAB - Civil Aeronautics Board IMO - International Marine OrganizationCFR - Code of Federal Regulations NHTSA - National Highway Traffic Safety AdministrationFAA - Federal Aviation Administration NTSB - National Transportation Safety BoardFHWA - Federal Highway Administration SOLAS - International Convention for Safety of Life at Sea
Table 1 - Condensed Summary of Activity on EDRs by Mode of Transportation

Proceedings of the Canadian Multidisciplinary Road Safety Conference XII; June 10-13, 2001; London, OntarioActes de la XIIe Conférence canadienne multidisciplinaire en sécurité routière; 10-13 juin 2001; London, Ontario
3
The table includes recommendations from the safetyboards to various regulatory bodies and groups callingfor EDR technology and/or improvements, as well assome of the key regulations mandating the use andperformance of EDRs. The table is intended toprovide an overview of the evolution of EDRs in thefour modes of transportation.
For comparison, Table 2 contains accident statisticsfrom the Transportation Safety Board of Canada andTransport Canada for the four transportationmodes. [3,4] Motor vehicle accidents on the highwayaccount for 93 % of all transportation fatalities.
Accidents Injuries Fatalities
Aviation 5,895 856 1870
Marine 6,612 712 248
Railway 13,906 3,992 1521
Highway 2,273,721 3,274,955 47,225
Table 2 - Accident Statistics (1986 through 1998)
All four major transportation groups continue todevelop and further the evolution of EDRs for theirindustry. At present, automotive EDRs remain theonly group not covered by government regulations orany performance standards.
Background on Automotive EDRs
Although airbags first appeared on a limited numberof vehicles in the 1970's, it was not until the late1980's that U.S. regulations began the phasing in ofairbags on passenger vehicles. The technologicaladvancements introduced to determine when anairbag should deploy have opened the doors torecording crash event data.
In December 1996, the National Highway TrafficSafety Administration (NHTSA) and NationalAeronautics Space Administration (NASA) agreed tocooperate in applying their advanced technologies to
improving airbag safety. In its April 1998 report,NASA’s Jet Propulsion Laboratory (JPL) outlined“The Need for Better Real-World Data.” [5] Thereport recommended that NHTSA “study thefeasibility of installing and obtaining crash data forsafety analyses from crash recorders on vehicles.” Itfurther noted that “crash recorders exist already onsome vehicles with electronic airbag sensors, but thedata recorded is determined by the OEMs.”
During the same period of time, the NationalTransportation Safety Board (NTSB) maderecommendations H-97-18 to NHTSA and H-97-21 todomestic and international automobile manufacturers.These recommendations followed a public forum onAir Bags and Child Passenger Safety in March 1997.The NTSB recommended that they “develop andimplement, in conjunction with [each other], a plan togather better information on crash pulses and othercrash parameters in actual crashes, utilizing current oraugmented crash sensing and recording devices.” [6]
NHTSA subsequently formed an EDR WorkingGroup under the Crashworthiness Subcommittee ofthe Motor Vehicle Safety Research AdvisoryCommittee (MVSRAC), holding its first meeting inOctober 1998. [7] The overall objective of theworking group was to “facilitate the collection andutilization of collision avoidance and crashworthinessdata from on-board EDRs.” The meetings dealt withthe following specific objectives:
1) Status of EDR technology2) Data elements to record3) Collection & storage of data4) Retrieval of data5) Responsibility for permanent record6) Data ownership & privacy7) Customers of EDR data8) EDR demonstrations.
On May 31, 1999 the charter for the MVSRACexpired, but the EDR Working Group continuedmeeting under NHTSA’s Office of Research andDevelopment (R&D) and is currently in the process ofdrafting a final report.

Proceedings of the Canadian Multidisciplinary Road Safety Conference XII; June 10-13, 2001; London, OntarioActes de la XIIe Conférence canadienne multidisciplinaire en sécurité routière; 10-13 juin 2001; London, Ontario
4
An International Symposium on TransportationRecorders was held in May 1999. The symposiumwas sponsored by the NTSB and the InternationalTransportation Safety Association (ITSA) with a goalof “sharing knowledge and experience gained fromthe use of recorded information to improvetransportation safety and efficiency.” The symposiumsaw papers presented by participants from all of thetransportation groups. [8]
The NTSB also made recommendations to thetrucking industry regarding recording devices. In aJuly 1998 report, the NTSB issued recommendationH-98-23 to various truck groups to “advise yourmembers to equip their commercial vehicle fleets withautomated and tamper-proof on-board recordingdevices, such as tachographs or computerizedrecorders, to identify information concerning bothdriver and vehicle operating characteristics.” [9] Thisfollowed a similar recommendation (H-90-28) to theFederal Highway Administration (FHWA) in 1990.
The NTSB issued two more recommendations onrecorders to NHTSA following a September 1999special investigation report on bus crashworthinessissues. Recommendation H-99-53 would “requirethat all school buses and motorcoaches manufacturedafter January 1, 2003, be equipped with on-boardrecording systems” to record at minimum:longitudinal, lateral, and vertical acceleration;heading; vehicle and engine speed; braking andsteering input; as well as the status of various vehiclesystems. [10] Recommendation H-99-54 was to“develop and implement ... the standards for on-boardrecorders,” addressing such items as the parameters,sampling rates and duration of data to be recorded.
A Truck and Bus EDR Working Group wasestablished under NHTSA’s Office of R&D, holdingits first meeting in June 2000. [11] It was suggestedthat this group coordinate its efforts with a task forceset up under The Maintenance Council (TMC) of theAmerican Trucking Associations (ATA) in March2000. The task force is also addressing the issue ofEDRs with the intent of developing a RecommendedPractice for TMC.
Types of Automotive EDRs
Automotive EDRs can be divided into aftermarketsystems and original equipment manufacturer (OEM)systems. A variety of aftermarket and OEM EDRsare currently available in the automotive industry.The data collected and the type of event recordedvaries from system to system. The following is anoverview of various EDR devices.
Aftermarket Systems
Tachographs
Invented in 1921, tachographs are mechanical deviceswhich generally display a clock, speedometer andodometer. They are used primarily in Europe onheavy trucks, buses and emergency vehicles. A clockmechanism rotates a circular chart inside the unit andstyli can record data on the front and back of the chart.Vehicle speed, distance, engine RPM and time arerecorded continuously on a 24 hour chart. Followingan accident, tachograph charts can be evaluatedmicroscopically with computer-aided analysis of thepolar co-ordinate data to the nearest second. [12]
Electronic Recorders
A digital electronic recorder for transport vehicleswas first discussed in a 1984 paper. [13] These on-board recording devices, also referred to as triprecorders, are electronic versions of the tachograph,recording similar data to the conventional tachograph.However, much more extensive and detailed reportingis available with an electronic recorder. Althoughthese devices are used primarily to monitor acommercial vehicle driver’s duty status, they can beprogrammed to record data upon manual activation bya driver or automatically in rapid deceleration oraccident events.
Accident Data Recorders
One of the earliest accident or crash data recorderswas a magnetic disc recorder developed by NHTSAwhich measured triaxial acceleration/time histories.

Proceedings of the Canadian Multidisciplinary Road Safety Conference XII; June 10-13, 2001; London, OntarioActes de la XIIe Conférence canadienne multidisciplinaire en sécurité routière; 10-13 juin 2001; London, Ontario
5
These recorders were installed on approximately 1050vehicles between 1972 and 1974, during which time23 accidents were analyzed with speed changes up to32 km/h. [14]
Accident data recorders (ADRs) with longitudinal andlateral accelerometers plus a magnetic yaw sensorhave been fitted to vehicles in several fleets. [15, 16]The ADR device also accepts a speed input from avehicle’s speedometer and the status of up to 10vehicle system parameters, such as brakes, lamps andindicators. The system continuously records data andwill automatically (or manually) store up to threeaccident events with 30 seconds of data prior to anevent and 15 seconds of data after an event, with thesampling rate varying for the different elementsrecorded.
ADRs have also been used in the field of motorsports.Starting in 1993, Indy-type race cars were fitted withimpact recorders to measure triaxial accelerationsduring a crash. [17] Formula 1 race cars began usingADRs in 1997. [18] The latest version of theserecorders contain a set of high-g (+ 250 g) and low-g(+ 10 g) triaxial accelerometers, as well as a yaw ratesensor. Additional inputs are provided to the unitfrom speed, throttle and steering sensors on the cars.
Video Recorders
Another group of aftermarket EDRs are videorecording systems, which can visually capture theevents leading up to and after any incident. Althoughvideo recording can be manually triggered at anytime, a video recording system must rely on an ADRin order to automatically activate video recording andto record vehicle parameters during an event.
OEM Systems
Electronic Control Modules
Electronic Control Modules (ECM) were introducedon diesel engines in the 1980's. [19] ECMs aretypically mounted on the engine block of a heavyvehicle and control the engine’s operation to
maximize fuel efficiency and engine performance.Sensors on the vehicle and engine provide signals tothe ECM, such as vehicle speed, engine speed,throttle position, as well as the status of brake, clutchand cruise switches. Current ECMs have built inmemory capacity to record historical data about thevehicle’s operation. ECMs can automatically recorddata upon rapid deceleration. The data is recorded in1 second intervals up to 60 seconds prior to an eventand up to 15 seconds after an event. The data can bedownloaded using proprietary software.
Electronic Airbag Sensors
With the introduction of airbags, vehicles must sensethe conditions of a crash in order to determinewhether airbag deployment is warranted. In frontalimpacts, these decisions typically need to be madewithin 15 to 50 milliseconds. [20] Therefore, sensingsystems need to predict the eventual magnitude of avehicle’s speed change within a very short time fromthe onset of a collision.
Early systems incorporating multiple mechanical typesensors have given way to single solid-state sensorsutilizing microelectromechanical systems (MEMS)technology. These ‘smart’ sensors combine anaccelerometer’s crash sensing function with electroniccircuitry and algorithms for processing and analysingcrash signals.
Some automobile manufacturers have startedrecording events (which may or may not lead to thedeployment of an airbag) with airbag sensingmodules. Data of particular interest is the severity ofimpact and the performance of restraint systems.Additional information monitored by electroniccontrol modules for engines, powertrains and anti-lock brake (ABS) systems can also be recorded.
Currently, only GM has made the data recorded bytheir airbag sensors readily accessible to the accidentinvestigation community. As such, the remainingsections of this paper focus on the recording andretrieval of data from airbag modules found in certainGM vehicles.

Proceedings of the Canadian Multidisciplinary Road Safety Conference XII; June 10-13, 2001; London, OntarioActes de la XIIe Conférence canadienne multidisciplinaire en sécurité routière; 10-13 juin 2001; London, Ontario
6
Data Recording with SDMs
Since 1994, GM vehicles have been using electronicsensors called Sensing and Diagnostic Modules(SDM) which have the capability of recording eventdata. Although a number of different SDM types havebeen used in various GM vehicles since that time,there are currently two predominant SDM types thatcan be accessed with the data retrieval system fromVetronix. Those SDMs are: (i) the SDM-R, found onthe majority of 1996 through 1999 GM vehicles, and(ii) the SDM-G, found on most GM vehiclesmanufactured since 1999. A third SDM, found incertain Cadillac and Buick vehicles, can also beaccessed, but the following discussion deals primarilywith the SDM-R and SDM-G shown in Figure 1.
Figure 1 - SDM-G (left) and SDM-R (right)
The information recorded by the SDMs consist ofboth discrete and variable data for both deploymentand near deployment events. A deployment eventoccurs when conditions are met to warrant an airbagdeployment. A near deployment event is defined asany event severe enough to ‘wake-up’ or enable thealgorithm in the SDM. The SDM-R stores the neardeployment event with the greatest speed change,while the SDM-G stores the most recent neardeployment event.
Information on the various parameters recorded by theSDMs are outlined in a paper presented by NHTSAand GM at the NTSB symposium on recorders, aswell as in the documentation from Vetronix. [21, 22]The following outlines the basic parameters recorded.
System Status Parameters
All of the SDM types record the status of thefollowing restraint and vehicle system parameters forboth deployment and near deployment events:
1. Driver’s Seat Belt - The status of the driver’s seatbelt switch circuit is determined as closed or openvia direct wiring to the SDM in most vehicles, butmay be transmitted through the Body ControlModule (BCM) on some vehicles. The driver’sseat belt is recorded as buckled or unbuckled,however, the status may be incorrectly reportedon some vehicles if the electrical system iscompromised during a crash.
2. SIR Warning Lamp - The status of thesupplemental inflatable restraint (SIR) warninglamp is recorded directly by the SDM as on or offat the time of an event.
3. RF Airbag Suppression - The status of the rightfront passenger’s airbag suppression switchcircuit, wired directly to the SDM, is determinedas on or off for any deployment or neardeployment event.
4. Ignition Cycles @ Event(s) - The number ofignition cycles at the time of both deployment andnear deployment events are recorded.
5. Ignition Cycles @ Investigation(s) - The numberof ignition cycles at the time of any download isalso recorded.
Crash Parameters
The following crash parameters are recorded by boththe SDM-R and SDM-G modules:
1. Forward )V - The change in forward velocity isdetermined by integrating the average of four0.312 millisecond acceleration samples and isrecorded every 10 milliseconds. The change inspeed is recorded for up to 300 milliseconds onSDM-R modules in both deployment and near

Proceedings of the Canadian Multidisciplinary Road Safety Conference XII; June 10-13, 2001; London, OntarioActes de la XIIe Conférence canadienne multidisciplinaire en sécurité routière; 10-13 juin 2001; London, Ontario
7
deployment events. In SDM-G modules, speedchange is recorded for up to 150 millisecondsduring deployment events and is adjusted upondownload to compensate for a +1 g bias appliedby the sensing algorithm to prevent inadvertentairbag deployments in certain situations.
2. Time to Deployment - The time (in milliseconds)is measured from algorithm enable (defined bytwo consecutive acceleration samples ofapproximately 2 g’s) to the command for airbagdeployment (and pretensioner deployment, if avehicle is so equipped).
3. Time Between Events - The time (in seconds)between a deployment event and a neardeployment event is recorded, if the neardeployment event occurred less than 5 secondsbefore a deployment event.
4. Time to Maximum )V - In the SDM-R module,the time (in milliseconds) from algorithm enableto maximum speed change in near deploymentevents is also recorded.
Pre-Crash Parameters
The following pre-crash parameters are also recordedon SDM-G modules for both deployment and neardeployment events:
1. Vehicle Speed - The speed of a vehicle (fittedwith specification tires and final drive axle ratio)is picked up by a sensor and transmitted from thePowertrain Control Module (PCM) every secondfor up to 5 seconds prior to any event.
2. Engine RPM - The engine speed or revolutionsper minute (RPM) is also picked up by a sensorand transmitted from the PCM along with thevehicle speed.
3. Percent Throttle - Throttle position is determinedby a rotary potentiometer as a percentage of wideopen throttle and transmitted from the PCM alongwith the vehicle and engine speeds.
4. Brake Status - Depending on a vehicle’s options,the status of the brake switch circuit is determinedas on or off and transmitted by either the PCM orABS module every second. The brake status dataindicates whether the brake pedal was depressedbut does not indicate the amount of braking andmay or may not be synchronized with the otherpre-crash data.
5. Data Validity - The result of a pre-crashelectronic validity check is recorded to indicate ifany of the four pre-crash parameters are out ofrange or if any faults are diagnosed.
It is important to note that the pre-crash data is notsynchronized with the start of the crash data,therefore, the pre-crash data may be skewed from thecrash data by up to one second.
Data Retrieval using CDR
Vetronix Corporation developed its first Event DataRetrieval Unit (EDRU) in 1990 for GM to use as aproprietary tool to access and download crash eventdata from their Diagnostic and Energy ReserveModules (DERM). DERMs were installed on GMvehicles starting in 1990, prior to the use of SDMs.The EDRU unit was also used by GM to access anddownload data from SDMs starting in 1994.
In March 2000, Vetronix unveiled a Crash DataRetrieval (CDR) system which was developed as anaftermarket tool. The CDR system allows accidentinvestigators to access and download crash event datafrom various airbag modules. At present only certainSDMs in GM vehicles can be accessed, but the intentis to include the other SDMs and the earlier DERMs.
In November 2000, Ford agreed to let Vetronixdevelop software to enable CDR users to downloadcrash data from Restraint Control Modules (RCM)found on selected Ford vehicles. Software updatesand cables are expected before the end of 2001,providing access to crash data recorded on certainFord vehicles.
Proceedings of the Canadian Multidisciplinary Road Safety Conference XII; June 10-13, 2001; London, OntarioActes de la XIIe Conférence canadienne multidisciplinaire en sécurité routière; 10-13 juin 2001; London, Ontario
8
Vehiclesupported?
Start CDR No datacurrentlyavailable
Enter VIN& case info
Connect CDR toCOM port on PC
No
Connect CDRto DLC
Turn ignition on(Do Not Start)
12 or 120 v?
ConnectCDR to DC
ConnectCDR to AC
Connect CDRto SDM
Download& save data
Yes
Yes No
12v 120v
Electricalintact?
Figure 2 - Flowchart of CDR Operation
Figure 3 - CDR Connected to DLC
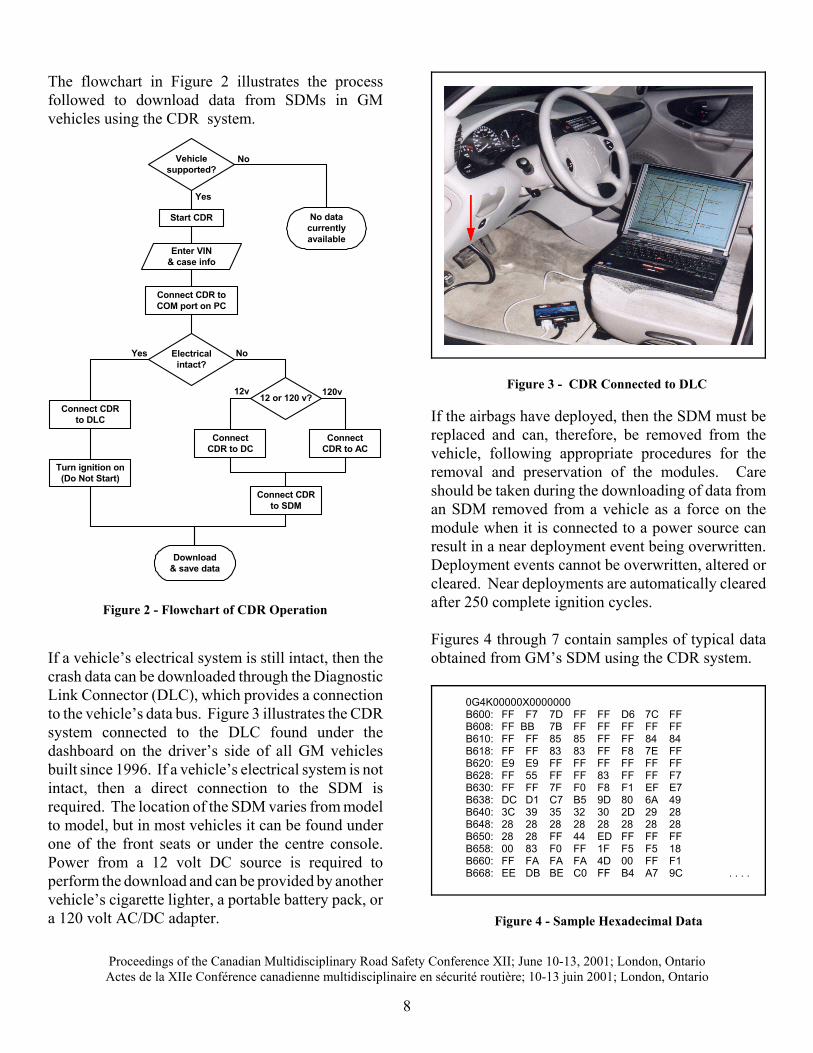
0G4K00000X0000000B600: FF F7 7D FF FF D6 7C FF B608: FF BB 7B FF FF FF FF FF B610: FF FF 85 85 FF FF 84 84 B618: FF FF 83 83 FF F8 7E FF B620: E9 E9 FF FF FF FF FF FF B628: FF 55 FF FF 83 FF FF F7 B630: FF FF 7F F0 F8 F1 EF E7 B638: DC D1 C7 B5 9D 80 6A 49 B640: 3C 39 35 32 30 2D 29 28 B648: 28 28 28 28 28 28 28 28 B650: 28 28 FF 44 ED FF FF FF B658: 00 83 F0 FF 1F F5 F5 18 B660: FF FA FA FA 4D 00 FF F1 B668: EE DB BE C0 FF B4 A7 9C . . . .
Figure 4 - Sample Hexadecimal Data
The flowchart in Figure 2 illustrates the processfollowed to download data from SDMs in GMvehicles using the CDR system.
If a vehicle’s electrical system is still intact, then thecrash data can be downloaded through the DiagnosticLink Connector (DLC), which provides a connectionto the vehicle’s data bus. Figure 3 illustrates the CDRsystem connected to the DLC found under thedashboard on the driver’s side of all GM vehiclesbuilt since 1996. If a vehicle’s electrical system is notintact, then a direct connection to the SDM isrequired. The location of the SDM varies from modelto model, but in most vehicles it can be found underone of the front seats or under the centre console.Power from a 12 volt DC source is required toperform the download and can be provided by anothervehicle’s cigarette lighter, a portable battery pack, ora 120 volt AC/DC adapter.
If the airbags have deployed, then the SDM must bereplaced and can, therefore, be removed from thevehicle, following appropriate procedures for theremoval and preservation of the modules. Careshould be taken during the downloading of data froman SDM removed from a vehicle as a force on themodule when it is connected to a power source canresult in a near deployment event being overwritten.Deployment events cannot be overwritten, altered orcleared. Near deployments are automatically clearedafter 250 complete ignition cycles.
Figures 4 through 7 contain samples of typical dataobtained from GM’s SDM using the CDR system.

Proceedings of the Canadian Multidisciplinary Road Safety Conference XII; June 10-13, 2001; London, OntarioActes de la XIIe Conférence canadienne multidisciplinaire en sécurité routière; 10-13 juin 2001; London, Ontario
9
Figure 5 - Sample Data Summary
Figure 6 - Sample Crash Delta V Graph
Figure 7 - Sample Pre-Crash Graph
In addition to the above data and graphs, the CDRsystem also prints out an ‘SDM Data Limitations’page stating the limitations in the data for each SDM,which should be consulted after downloading the data.
Testing
Twelve low speed rear end vehicle-to-vehiclecollisions were staged using two different GM bulletvehicles. The purpose of the tests was to examine thethreshold and sensitivity for data recorded by theSDMs and to compare the SDM data with resultsfrom other instrumentation. Table 3 summarizes theinformation about the vehicles used in the tests.
1st Series 2nd Series
Bullet Vehicle 2000 ChevroletMalibu
1997 ChevroletCavalier
Mass 1384 kg 1265 kg
SDM SDM-G SDM-R
Target Vehicle 1984 VWRabbit GTI
1994 HondaAccord
Mass 898 kg 1305 kg
SDM n/a n/a
Table 3 - Summary of Test Vehicles
Test Procedure
A vehicle mounted fifth wheel was used to record thespeed of the bullet vehicle. The fifth wheel loggedvehicle position versus time in 32 millimetreincrements and was calibrated at the start of the tests.The fifth wheel data was captured using a QuatechDAQP-12H capture card sampling at 1000 Hz. Thebullet vehicle was also fitted with a strip chart and itsposition was recorded at 0.5 centimetre intervals for100 centimetres pre and post impact using a digitalvideo camera at 30 frames per second with a shutterspeed of 1/2000th of a second.
The bullet vehicle in the first series was in ‘neutral’for the first three runs, as was the bullet vehicle for allthe runs in the second series of tests. For these runs,the bullet vehicle was allowed to roll forward along asloped grade into the rear of the target vehicle whichwas also in ‘neutral’. The bullet vehicle was placedin ‘drive’ for the final two runs of the first series andallowed to idle forward into the rear of the targetvehicle. There was no pre-impact braking.

Proceedings of the Canadian Multidisciplinary Road Safety Conference XII; June 10-13, 2001; London, OntarioActes de la XIIe Conférence canadienne multidisciplinaire en sécurité routière; 10-13 juin 2001; London, Ontario
10
s19.5 20.0 20.5 21.0
Cavalier 7
km/h
9
8
7
6
5
4
3
2
1
0
Cavalier 7
Figure 8 - Typical Vehicle Speed vs. Time Plot
Figure 8 shows a typical plot of vehicle speed versustime for the bullet vehicle, pre and post impact, asrecorded by the fifth wheel.
1st Series of Tests (with SDM-G)
The results from the first series of tests involving fiveruns with the 2000 Chevrolet Malibu as the bulletvehicle are contained in Table 4 below. There is nospeed change data provided by the SDM-G module inthe 2000 Chevrolet Malibu and only the pre-crashspeed is considered.
Run
ImpactSpeed
SpeedChange Speed @ -1 second New
NearDeployEvent
5th Wheel(km/h)
5th Wheel(km/h)
5th wheel(km/h)
SDM(km/h)
1 2.7 1.7 2.2 n/a n/a
2 4.4 2.6 4.0 0 Yes
3 5.6 3.4 5.3 0 Yes
4 6.0 3.5 4.4 3.2 Yes
5 5.6 3.4 3.9 3.2 Yes
Table 4 - Results of 1st Test Series (2000 Chevrolet Malibu)
The first run resulted in a speed change of 1.7 km/hfor the Malibu and did not produce a near deploymentevent, while the second run resulted in a speed changeof 2.6 km/h and did produce a near deployment event.Each of the subsequent runs also produced a neardeployment event, even in the last run which was
conducted at an impact speed of 5.6 km/h, or belowthe impact speed of 6.0 km/h in the previous run.This is consistent with the data limitation informationfor the SDM-G module in the 2000 Chevrolet Malibu,which indicates that the most recent near deploymentevent will be stored.
The vehicle’s pre-crash speed was not recorded by theSDM when the Malibu rolled forward in ‘neutral’.Only when the transmission was in ‘drive’ for the lasttwo runs was a speed recorded by the SDM. Since thepre-crash data is only recorded up to 1 second prior toalgorithm enable, the speed recorded by the fifthwheel at 1 second prior to impact was compared to theSDM recorded speed. Table 4 lists the SDM speedconverted to km/h, although the actual SDM data wasdisplayed as an integer speed in mph. The SDM datashowed a speed of 2 mph for both of the last two runs.The speeds recorded by the fifth wheel were 4.4 km/h(2.7 mph) and 3.9 km/h (2.4 mph). Part of thedifference can be explained by rounding error.
2nd Series of Tests (with SDM-R)
The results for the second series of tests involvingseven runs with the 1997 Chevrolet Cavalier as thebullet vehicle are contained in Table 5 below. Thereis no pre-crash data recorded by the SDM-R modulein the 1997 Chevrolet Cavalier and only speed changeversus time is considered.
Run
ImpactSpeed Speed Change Duration
of DataNewNear
DeployEvent
5th Wheel(km/h)
5th Wheel(km/h)
SDM(km/h)
SDM(ms)
1 2.6 2.1 n/a n/a n/a
2 3.4 2.7 n/a n/a n/a
3 4.5 3.5 n/a n/a n/a
4 6.6 5.0 2.8 40 Yes
5 7.2 5.5 4.2 60 Yes
6 7.1 5.4 - - No
7 8.4 6.4 4.9 60 Yes
Table 5 - Results of 2nd Test Series (1997 Chevrolet Cavalier)

Proceedings of the Canadian Multidisciplinary Road Safety Conference XII; June 10-13, 2001; London, OntarioActes de la XIIe Conférence canadienne multidisciplinaire en sécurité routière; 10-13 juin 2001; London, Ontario
11
The first three runs, resulting in speed changes of 2.1,2.7 and 3.5 km/h for the Cavalier, did not produce anear deployment event. However, it was noted that aprevious near deployment event had been recorded bythe Cavalier’s SDM, prior to any of the tests beingconducted. The previously stored event registered amaximum SDM recorded speed change of 0.3530km/h (0.2194 mph) 7.5 milliseconds after algorithmenable. The fact that this event was not overwritten inthe first three runs indicates that the speed change ofthat event, over a finite time, was not exceeded.
The fourth and fifth runs with the Cavalier resulted inspeed changes of 5.0 and 5.5 km/h, respectively, anddid produce near deployment events each time. Thesixth run resulted in a speed change of 5.4 km/h anddid not produce a new near deployment event, as thepreviously recorded speed change was not exceeded.This is consistent with the data limitation informationfor the SDM-R module in the 1997 ChevroletCavalier. The seventh and final run produced a newnear deployment event as the 6.4 km/h speed changerecorded was greater than previously stored.
The speed change recorded by the SDM-R module inthe Cavalier was lower than the speed changemeasured by the fifth wheel. However, in the threeruns (4, 5 and 7) where a new near deployment eventwas recorded, the speed change was only recorded for40 to 60 milliseconds by the SDM. The fifth wheeldata and strip chart analysis from these three runsindicated impact durations over 100 milliseconds.Previous studies have also shown typical impactdurations of 100 to 300 milliseconds in low speedvehicle-to-vehicle rear impacts. [23] These resultssuggest that only a portion of the crash pulse wascaptured by the SDM-R in the 1997 ChevroletCavalier used in the second series of low speed tests.
In the fourth run, the SDM only recorded speedchange for 40 milliseconds and was 2.2 km/h less thanthe speed change measured at the fifth wheel. In thefifth and seventh runs, where 60 milliseconds of datawas collected, the SDM data more closely matchedthe fifth wheel speed change, underestimating thespeed change by 1.3 and 1.5 km/h, respectively.
Case Studies
Since EDR technology is still evolving and only thedata from SDMs on certain GM vehicles are readilyaccessible, there are relatively few cases with EDRdata to consider. Even if a vehicle equipped with anEDR is involved in a collision, the data may belimited due to the nature of the crash. Refer toTable 6 for a summary of cases in this study involvingvehicles equipped with an EDR and the data that hasbeen downloaded from them.
# Vehicle SDM CrashType
Pre-crashSpeed(km/h)
SpeedChange(km/h)
BeltUse
1 2000 BuickRegal G Angled
impact 24 12.7 Yes
2 1999 PontiacSunfire R Narrow
impact n/a 6.0 No
3 1998 SaturnSC2 R Side-
swipe n/a 0 Yes
4 1997 ChevroletMonte Carlo R Side
impact n/a 0 Yes
5 1996 PontiacGrand Am R Multi-
event n/a 0 Yes
Table 6 - Summary of Case with EDR Data
Only the first two cases are discussed below. Theother three cases did not result in recorded speed datafor the event of interest, however, the algorithms wereenabled and seatbelt usage by the drivers recorded.
Case # 1
This case involved a 2000 Buick Regal, initiallystopped at an intersection, turning left in front of a1997 Plymouth Voyager travelling at approximately60 km/h. The front end of the Voyager struck theright front side of the Regal. The airbags in bothvehicles deployed and minimal injuries weresustained. The resultant damage to the vehicles fromthe primary impact is illustrated in Figure 9. Therewas evidence of subsequent contact between thevehicles during the separation phase.

Proceedings of the Canadian Multidisciplinary Road Safety Conference XII; June 10-13, 2001; London, OntarioActes de la XIIe Conférence canadienne multidisciplinaire en sécurité routière; 10-13 juin 2001; London, Ontario
12
2000 Buick Regal 1997 Plymouth Voyager
Figure 9 - Diagram Showing Damage to Vehicles
Figure 10 - Pre-Crash Data from 2000 Buick Regal
-100
-80
-60
-40
-20
0
20
40
60
80
100
% V
aria
nce
in F
orw
ard
Del
ta V
0 10 20 30 40 50 60 70 80 90PDOF (Degrees)
+/- 5 degrees +/- 10 degrees
Figure 11 - Variance in Velocity Change vs. PDOF
The Regal was equipped with an SDM-G module thatrecorded both pre-crash and crash data. Refer toFigure 10 for the pre-crash data downloaded from theRegal. The SDM did not capture the entireacceleration sequence of the Regal, however, the datadid reveal that the Regal accelerated from a speed of13 km/h (8 mph) at the -5 second reading up to amaximum speed of 24 km/h (15 mph) at the -2 secondreading. This data represents an average accelerationof 0.1 g.
The pre-crash data also revealed that the brake pedalwas applied up to 1 second prior to algorithm enable.Since the pre-crash data is not synchronized with theenabling of the algorithm and there is uncertainty inthe amount of braking that may have occurred, theactual vehicle speed at impact could still varybetween 0 and 23 km/h.
The SDM crash data showed a 12.7 km/h adjustedalgorithm velocity change 80 milliseconds after theSDM algorithm was enabled on the Regal. Since thecrash data only presents the forward component ofvelocity change and is an adjusted value, the physicalevidence from the scene and vehicle still need to beassessed. A PC-Crash simulation of the accidentyields a principal direction of force (PDOF) ofapproximately 50 degrees for the Regal, resulting ina longitudinal speed change of 13 km/h for the Regalwhen combined with an analysis of the damage usingWinCrash.
An accurate PDOF is important in assessing theforward or longitudinal velocity change in an angledimpact. Figure 11 illustrates the variance that mayresult in under or over estimating the PDOF in anangled impact. In this case, using a PDOF of 45 to 55degrees in the analysis would have resulted in alongitudinal speed change between 11 and 14 km/h.
Case # 2
This case involved a narrow impact by an oncomingvehicle at the left front of a 1999 Pontiac Sunfire.Figure 12 illustrates the damage sustained by theSunfire. The airbags deployed and data was recorded.Since there is no pre-crash data for the SDM-Rmodule in the Sunfire, only crash data is considered.Figure 13 contains a graph of the SDM recordedspeed change for the deployment event.

Proceedings of the Canadian Multidisciplinary Road Safety Conference XII; June 10-13, 2001; London, OntarioActes de la XIIe Conférence canadienne multidisciplinaire en sécurité routière; 10-13 juin 2001; London, Ontario
13
Figure 12 - 1999 Pontiac Sunfire Damage
-10
-9
-8
-7
-6
-5
-4
-3
-2
-1
0
Velo
city
Cha
nge
(km
/h)
0 30 60 90 120 150 180 210 240 270 300Time (milliseconds)
Figure 13 - SDM Recorded Velocity Change
-10
-9
-8
-7
-6
-5
-4
-3
-2
-1
0
1
2
3
4
5
Acc
eler
atio
n (g
's)
0 30 60 90 120 150 180 210 240 270 300Time (milliseconds)
Figure 14 - Calculated Acceleration
The maximum recorded velocity change of 6.0 km/his less than the severity of a barrier equivalent speedof 13 to 22 km/h (8 to 14 mph) typically referenced asa threshold range for airbag deployments. This caseillustrates that speed change is not the sole variable orcriteria used to make a decision to deploy airbags.Reference 20 discusses various sensing algorithmsused with electronic sensors, which include suchcommon variables as speed change, acceleration, jerk,energy and displacement.
Figure 14 contains the corresponding accelerationscalculated over the 10 millisecond intervals in theSDM data.
The data commences with a -2 g acceleration andreaches a maximum of -7 g within 60 milliseconds,before registering a +2 g acceleration 20 millisecondslater. All of the accelerations are integer values.
Discussion
Motor vehicle accidents may be investigated by lawenforcement personnel, government and academicresearchers, vehicle manufacturers, and consultants tothe insurance/legal industry. Although each of theseentities may investigate an accident for a differentpurpose, all have a common goal - to determine whathappened in the accident.
In the pursuit of that goal, accident investigators haveutilized data recorded by various types of EDRs in thepast. The source of recorded data has previouslyincluded tachographs, electronic recorders, enginecontrol modules, and aftermarket accident datarecorders, all used to monitor driver and/or vehicleperformance.
The introduction of airbags and the use of electronicsensors to sense and process crash signals, has madecommon recording of crash event data more feasible.This opportunity was highlighted in recommendationsfrom JPL and NTSB to NHTSA and the automotiveindustry to collect better real world crash data.

Proceedings of the Canadian Multidisciplinary Road Safety Conference XII; June 10-13, 2001; London, OntarioActes de la XIIe Conférence canadienne multidisciplinaire en sécurité routière; 10-13 juin 2001; London, Ontario
14
The potential uses and benefits of EDR data fromairbag sensing modules include:
Real Time - Use of EDR data in conjunction withautomatic collision notification (ACN) systems wouldaid in quickly locating crashes and dispatchingemergency personnel with better crash information inadvance.
Law Enforcement - Obtaining impartial EDR datafrom a collision would help in more accuratedetermination of facts surrounding an incident.
Government - Collection of EDR data facilitatesgovernment in furthering regulatory initiatives to helpreduce fatalities, injuries and property loss.
Vehicle Design - EDRs allow manufacturers tocollect better real world data to monitor systemperformance and improve vehicle design.
Highway Design - The use of EDR data can assist inassessing roadside safety and managing roadwaysystems.
Insurance/Legal - Additional objective dataprovided by EDRs advance quicker and fairerresolution of insurance and liability issues.
Research - EDR data could provide objectivedatabases on driver behaviour and performance, aswell as other research related topics.
Owners/Drivers - EDRs can help fleet owners anddrivers monitor vehicle and driver performance toensure the safe and efficient movement of people andcargo.
There are undoubtedly numerous benefits to be gainedfrom the data that can be provided by automotiveEDRs, including electronic airbag sensing modules.A crash data retrieval system, such as the CDR toolfrom Vetronix, brings those benefits to all accidentinvestigators in the form of additional objective datato utilize in the analysis and reconstruction of motorvehicle accidents.
Conclusions
The following conclusions are derived from thisstudy:
1. The evolution of transportation EDRs suggeststhat electronic airbag sensors will be used onmore vehicles to routinely record crash events andthat CDR systems will become a mainstream toolfor accident investigators.
2. Recorded event data is currently available from avariety of aftermarket EDR systems and OEMrecording devices, such as electronic controlmodules on diesel engines and electronic airbagsensors in certain vehicles.
3. GM’s SDM provides additional objective data toaccident investigators for vehicles involved incrashes where a sufficient forward change invelocity is experienced, however, physicalevidence from the vehicle and scene still needs tobe analysed.
4. In the low speed tests conducted during this study,the threshold for data recording with an SDM-Gmodule on a 2000 Chevrolet Malibu was between1.7 and 2.6 km/h. Some underestimation was alsoobserved in the lower speed changes recorded bythe SDM-R module on a 1997 Chevrolet Cavalier.Additional testing is required to furtherinvestigate and qualify the data recorded invarious collisions and conditions.
5. At present, the data elements recorded by GM’sSDMs are limited to select pre-crash and crashparameters for limited times during an accidentsequence. EDR technology needs to be adoptedby more manufacturers with standardized dataelements and performance criteria to providemore widespread and well defined data forinvestigators and researchers.
Proceedings of the Canadian Multidisciplinary Road Safety Conference XII; June 10-13, 2001; London, OntarioActes de la XIIe Conférence canadienne multidisciplinaire en sécurité routière; 10-13 juin 2001; London, Ontario
15
References
References identified in the paper are listed below andwhere applicable a URL link to the reference has beenprovided, current as of May 2001.
1. Grossi, D.R.; Aviation Recorder Overview:Proceedings from the International Symposium onTransportation Recorders; pp. 153-164; 1999(http://www.ntsb.gov/Events/symp_rec/proceedings/authors/grossi.htm)
2. Tachographs: Fleet Systems; VDO NorthAmerica; 2000
(http://www.vdona.com/fleet/fleet tacho frames.html)
3. Transportation Safety Board of Canada; TSBStatistical Summary of Aviation, Marine andRailway Occurrences; 1998(http://www.tc.gc.ca/pol/en/t-facts_e/Safety_Data_Menu.htm)
4. Transport Canada; Canadian Motor VehicleTraffic Collision Statistics; TP3322; 1999(http://www.tc.gc.ca/roadsafety/tp/tp3322/1999/en/page1_e.htm)
5. Phen, R.L., et al; Advanced Air Bag TechnologyAssessment; Jet Propulsion Laboratory; JPLPublication 98-3; 1998(http://csmt.jpl.nasa.gov/airbag/index.html)
6. National Transportation Safety Board;Proceedings of the NTSB Public Forum onAirbags and Child Passenger Safety; 1997(http://www.ntsb.gov/Publictn/1997/RP9701.htm)
7. National Highway Traffic Safety Administration;Event Data Recorder Working Group Minutes;U.S. D.O.T. Docket NHTSA-1999-5218(http://dms.dot.gov/) & Search ‘5218'
8. National Transportation Safety Board;Proceedings from the International Symposium onTransportation Recorders; 1999(http://www.ntsb.gov/Events/symp_rec/proceedings/symp_rec.htm)
9. National Transportation Safety Board; MultipleVehicle Crossover Accident: Highway AccidentReport; NTSB/HAR-98/01; 1998(http://www.ntsb.gov/Publictn/1998/HAR9801.htm)
10. National Transportation Safety Board; BusCrashworthiness Issues: Highway SpecialInvestigation Report; NTSB/SIR-99/04; 1999(http://www.ntsb.gov/Publictn/1999/SIR9904.htm)
11. National Highway Traffic Safety Administration;Truck and Bus EDR Working Group; U.S. D.O.T.Docket NHTSA-2000-7699(http://dms.dot.gov/) & Search ‘7699'
12. Manual for the Evaluation and Use of the OriginalKienzle Tachograph Chart; VDO, Germany; 1998(http://www.vdokienzle.com/download/flotte/leitf_en.pdf)
13. Blevins, J.R. and McQuillan, C.M.; A PortableElectronic Vehicle Use Recorder; SAE Paper840312
14. Teel, S.S., Peirce, S.J., and Lutkefedder, N.W.;Automotive Recorder Research - A Summary ofAccident Data and Test Results; SAE Paper740566
15. Fincham, W.F., Kast A., and Lambourn, R.F.;The Use of a High Resolution Accident DataRecorder in the Field; SAE Paper 950351
16. Lehmann, G. and Cheale A.; The Contribution ofOnboard Recording Systems to Road Safety andAccident Analysis: 16th International TechnicalConference on the Enhanced Safety of Vehicles;pp. 462-465; 1998
17. Melvin, J.W., et al; Investigation of Indy CarCrashes Using Impact Recorders; SAE Paper962522
18. Wright, P.G.; The Analysis of Accident DataRecorder (ADR) Data in Formula 1; SAE Paper2000-01-3551
Proceedings of the Canadian Multidisciplinary Road Safety Conference XII; June 10-13, 2001; London, OntarioActes de la XIIe Conférence canadienne multidisciplinaire en sécurité routière; 10-13 juin 2001; London, Ontario
16
19. Goebelbecker, J.M. and Ferrone, C.; UtilizingElectronic Control Module Data in AccidentReconstruction; SAE Paper 2000-01-0466
20. Chan, C-Y; Fundamentals of Crash Sensing inAutomotive Air Bag Systems; Society ofAutomotive Engineering, Warrendale, PA; 2000
21. Chidester, A., et al; Recording Automotive CrashEvent Data: Proceedings from the InternationalSymposium on Transportation Recorders; pp. 85-98; 1999(http://www.ntsb.gov/Events/symp_rec/proceedings/authors/chidester.htm)
22. Vetronix Crash Data Retrieval Tool; Version1.19; Vetronix Corporation; 2000(http://www.invehicleproducts.com/cdr.html)
23. Siegmund, G.P., Bailey, M.N., and King, D.J.;Characteristics of Specific Automobile Bumpersin Low-Velocity Impacts; SAE Paper 940916