Embed Size (px)
Citation preview
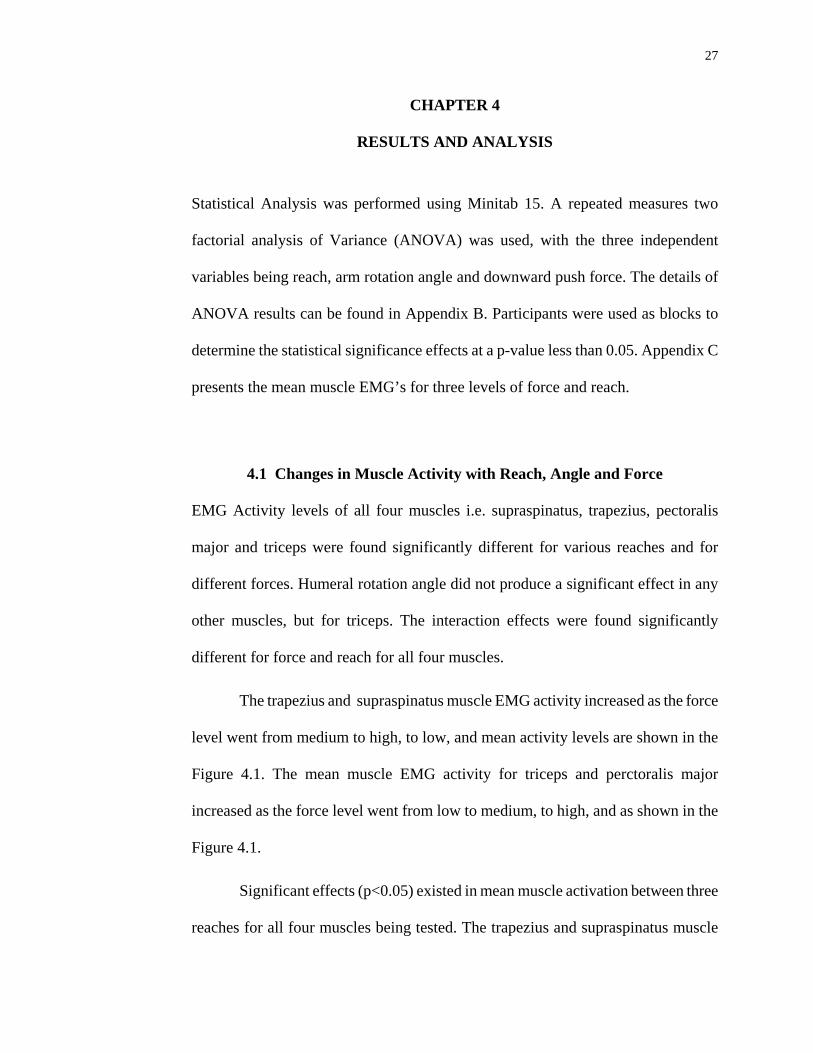
ABSTRACT
ERGONOMIC EVALUATION OF SHOULDER MUSCLE ACTIVATION DURING LIGHT WEIGHT HAND TOOL EXERTION TASK
by
Gul Ahmed
A study was conducted to evaluate the effect of shoulder muscle activation during hand
exertion tasks using a light weight hand tool by working individuals. Electromyography
(EMG) of trapezius, supraspinatus, triceps, and pectoralis major was conducted for 45o, 0o
and -45o arm angles, for three different reaches i.e. normal, maximum and extreme and three
different push forces low, medium and high. Ten volunteers participated in the experimental
study. The effects of push force and reach distance were found to be statistically significant
for all four muscles. However the effect of change of angle was not found to be statistically
significant, except for triceps. The only interaction effect that was found to be significant
was between force and reach for all four muscles.
The interaction effect between force and reach shows higher trapezius and
supraspinatus activity at low force and extreme reach levels and hence shows that the
postures which require lower forces and farther reach levels are potentially more likely to
cause or enhance injuries in shoulder muscles. This study for the first time used a shoulder
and arm muscle activation pattern for manual tasks with a downward push force and it is
relevant to the work in medical imaging sonography.
ERGONOMIC EVALUATION OF SHOULDER MUSCLE ACTIVATION DURING LIGHT WEIGHT HAND TOOL EXERTION TASK
by Gul Ahmed
A Thesis Submitted to the Faculty of
New Jersey Institute of Technology in Partial Fulfillment of the Requirements for the Degree of
Master of Science in Occupational Safety and Health Engineering
Department of Mechanical and Industrial Engineering
August 2012

Copyright © 2012 by Gul Ahmed
ALL RIGHTS RESERVED
APPROVAL PAGE
ERGONOMIC EVALUATION OF SHOULDER MUSCLE ACTIVATION DURING LIGHT WEIGHT HAND TOOL EXERTION TASK
Gul Ahmed
Dr. Arijit K Sengupta, Thesis Advisor Date Program Director Occupational Safety and Health Engineering Department of Mechanical and Industrial Engineering, NJIT Dr. Athanassios Bladikas, Committee Member Date Associate Professor Department of Mechanical and Industrial Engineering, NJIT Dr. George W. Olsen, Committee Member Date Adjunct Professor Occupational Safety and Health Engineering Department of Mechanical and Industrial Engineering, NJIT


iv
BIOGRAPHICAL SKETCH Author: Gul Ahmed
Degree: Master of Science
Date: August 2012
Date of Birth: May 06, 1979
Place of Birth: Chakwal, Pakistan
Undergraduate and Graduate Education:
• Master of Science in Occupational Safety and Health Engineering, New Jersey Institute of Technology, Newark, NJ, 2012
• Bachelor of Science in Chemical Engineering,
University of Engineering and Technology Lahore, Pakistan, 2004
Major: Occupational Safety and Health Engineering Presentations and Publications: Gul Ahmed, “Ergonomic Evaluation of Shoulder Muscle Activation during Light Weight Hand Tool Exertion Task,” Presented on NIOSH ERC Student/Resident Research Day, Mechanical Engineering Center Room 224, New Jersey Institute of Technology, Newark, NJ, April 25, 2012.

v
To my beloved parents

vi
ACKNOWLEDGMENT
I would like to express my deepest appreciation to Dr Arijit K. Sengupta, director
of the Occupational Safety and Health Engineering Program, for serving as my thesis
advisor. He not only provided me with valuable and countless resources, insight, and
intuition, but also constantly gave me support, encouragement, and reassurances when I
needed it most.
Special thanks to Dr. George W Olsen and Dr. Athanassios Bladikas, for actively
participating in my committee. I want to thank Dr. Mayer of Mount Sinai School of
Medicine, for his support in providing me literature I needed the most.
I would also like to thank all my fellow students who helped me accomplish this
study. Special thanks to all NIOSH Educational Research Center (NJ/NY region) and
NIOSH for providing financial support for my MS research.
Finally, I acknowledge my wife Javeria’s constant support and encouragement
without which I would never have been able to complete my thesis.

vii
TABLE OF CONTENTS
Chapter Page
1 INTRODUCTION……............................…………………..…………………………
1
1.1 Background..…............................………………..……………………………... 1
1.2 Objectives and Hypotheses………….…………………………………….…..... 7
2 LITERATURE SURVEY…………………………………………………………... 8
2.1 Biomechanical Studies………………………………………………………….. 8
2.2 Psychophysical Studies…………………………………………………………. 14
3 EXPERIMENTAL METHODS.................................………………………………. 19
3.1 Participants……….……………………………………………………………... 19
3.2 Electromyography……………. …………………………………………………. 20
3.3 Experimental Design.…………………………………………………………… 21
3.4 Electrode Placement…………………………..……………………………...…. 23
3.5 Experimental Procedure……………………………………………………….... 24
3.6 Processing of EMG and Force Data……………………………………………….. 25
4 RESULTS AND ANALYSIS..…..……………………………………………….....
27
4.1 Changes in Muscle Activity with Reach, Angle and Force……………………..
27
4.2 Discussion…………...…………………………………………………..……… 29
4.2.1 EMG Activity Changes in Trapezius………....……………..…............... 29
4.2.2 EMG Activity Changes in Supraspinatus……….…………..…............... 30
4.2.3 EMG Activity Changes in Triceps……….….....……………..…............ 31
4.2.4 EMG Activity Changes in Pectoralis Major………...………..….............
31
viii
TABLE OF CONTENTS (Continued)
Chapter Page
4.2.5 Implications of the Results……………………………………………... 32
4.3 Limitations……………………………………………………………………… 34
5 CONCLUSIONS.…………….……………………………………………………... 35
APPENDIX A: EMG Data for All Subjects…..………………………………………..
36
APPENDIX B: Minitab Output…………………………...…………………………… 44
APPENDIX C: Descriptive Statistics for Muscle EMG (%MVC)…………………….. 54
REFERENCES ………………………………………………………………………... 55

ix
LIST OF TABLES
Table Page
3.1 Anthropometric and Demographic Data of Participants …..……………………. 19

x
LIST OF FIGURES
Figure Pa
ge
1.1 Biomechanical model of shoulder joint: (a) abducted arm and (b) abducted arm
with an upward force is acting on distal end of hand.…....……………………….
5
2.1 Experimental set up employed by Brookham et al. (2010) to evaluate shoulder
muscles activity for sub-maximal tasks performed in horizontal direction.……
10
2.2 Experimental set up employed by Sporrong et al.
(1998).…………………………..
12
3.1 Biometrics Datalink hardware system configuration…………………………... 20
3.2 Strain gage with installed handle to simulate sonography probe……………… 21
3.3 Illustration of normal, maximum and extreme reach positions………………... 22
3.4 Electrode placement……………………………………………………………… 24
3.5 Typical EMG activity of trapezius muscle and push force in an experimental trial.……………………………………………………………………………….
26
4.1 % MVC of the four muscles with varying force levels……….…………………. 28
4.2 % MVC of the four muscles with varying reach levels………………………. 28
4.3 Mean muscle activity of trapezius for varying force and reach……………… 30
4.4 Mean muscle activity of supraspinatus for varying force and reach.………… 30
4.5 Mean muscle activity of triceps for varying force and reach ..………………. 31
4.6 Mean muscle activity of pectoralis major for varying force and reach…...….. 32

xi

xii
LIST OF SYMBOLS
BLS Bureau of Labor Statistics
EMG Electromyography
MSD Musculoskeletal Disorder
MVC Maximum Voluntary Contraction
NIOSH National Institute of Occupational Safety and Health
OSHA Occupational Safety and Health Administration

1
CHAPTER 1
INTRODUCTION
1.1 Background
Musculoskeletal disorders (MSD) are one of the most common types of workplace illnesses.
They are recognized as a major cause of workers’ absences. OSHA defined work related
musculoskeletal disorders (WMSDs) are caused or enhanced by activities at the workplace
and are characterized by pain or discomfort of nerves, tendons, muscles, and supporting
structures of the body (Burnett and Campbell-Kyureghyan 2010). For example, 73% of all
compensable claims in the health care industry between 1994 and 1998 in British Columbia,
Canada resulted from WMSDs with the direct costs of these claims approaching $113
million (Burnett and Campbell-Kyureghyan 2010).
Medical Sonography is one of the areas where WMSDs are frequently encountered.
Over the past ten years, studies have indicated an 80% incidence rate of musculoskeletal
symptoms among sonographers (Horkey and King 2004). The above mentioned 80% of
sonographers have been scanning in pain/discomfort for almost half of their career and 20%
of them would ultimately end their career for the same reason. According to a study, between
84% and 93% of sonographers in United States, Canada and Australia have reported work
related musculoskeletal injuries (Bravo et al. 2005). Another study suggests that while the
prevalence of neck and upper limb pain for the general population is 13% to 22%, for
sonographers it is between 63% and 91% (Village and Trask 2007). Injury rates compiled
from questionnaires suggest that 65 to 91% of sonographers were affected by some kind of
Musculoskeletal pain (Burnett and Campbell-Kyureghyan 2010).

2
One of the major causes of injuries to sonographers is believed to be the static and
sustained muscle contraction at shoulders, upper back and upper extremities, which is
required to maintain the extended arm position during medical sonography (Bastian et al.
2009). Additional risk factors identified are application of downward push force on the
transducer, repetitive movements of the shoulder, arm, forearm, wrist, hand and fingers
along with awkward postures of the upper arm (Village and Trask 2007; Burnett and
Campbell-Kyureghyan 2010). Varying degrees of a downward pushing force are needed to
manipulate the image, which also vary with scan type and depth of adipose tissue (Burnett
and Campbell-Kyureghyan 2010).
Ergonomic factors, such as the reach distance and orientation of a sonographer with
respect to the patient position determines the upper arm elevation and rotation requirement of
the sonographer during scans. Since the scan times last anywhere between 12 to 30 minutes
(Village and Trask 2007), low level activation of shoulder and upper arm muscles from
sustained arm elevation may induce muscle fatigue. Failure to address ergonomic issues on
a workstation may cost up to $580,000 in revenue loss, medical bills, average cost of a
worker’s compensation claims and new staff recruitment. Temporary staffing from an
agency can cost an additional $80,000 (Society of Diagnostic Medical Sonography. 2003).
Two EMG based studies on Sonography have been reported in the literature that
quantified muscular load in the shoulder region. Village and Trask (2007), measured surface
EMG of three neck/shoulder muscles (trapezius, supraspinatus and infraspinatus) for three
sonographers performing seven scans on patients. They collected EMG data from three
sonographers performing abdominal carotid, echocardiogram, abdominal, renal and leg scans
3
totaling 183 minutes. They determined 10, 50 and 90 percentile amplitude of probability
distribution functions (APDFs) of EMGs to characterize the static, median and peak muscle
activity during scanning. The mean 10 percentile APDF of all three shoulder muscles
exceeded 3% MVC corresponding to a ‘‘low’’ risk rating for shoulder–neck MSDs. Also, for
two of the seven sonographers, static, median and peak trapezius activity exceeded the limits
of muscle activity corresponding to risk of shoulder MSDs. During their study, they
observed long durations of static and awkward shoulder abduction and outward rotation of
upper arm and high and sustained grip forces, which were consistent with the high
prevalence of neck and upper limb musculoskeletal disorders and symptoms. Their study
provided a detailed quantification of objective risk factors in terms of EMG and posture
evaluation, and suggested strongly the need of effective control measures on posture to
reduce the risk of injury.
In the second EMG-based study, Murphey and Milkowski (2006) evaluated the
effects of various commonly found arm postures related to the sonography task. Twenty-two
experienced sonographers participated in the study. Researchers measured EMG from the
trapezius and suprascapular fossa of the shoulder region at upper arm postures of (i) two
levels of shoulder flexion (0° & 50°), (ii) two levels of shoulder abduction (30° and 75°), and
(iii) one level of shoulder abduction at 30° with a soft support under the elbow. Their study
showed large and statistically significant reductions in muscle activity can be obtained by
modifying the scanning technique and workstation arrangement. The trapezius muscle
activity decreased 65% by changing from a 50° forward shoulder flexion, (which is effected
by the medial reach requirement by a sonographer) to a neutral (0° flexion) position. The
right suprascapular fossa activity was reduced by 46% when the abduction (reaching
4
laterally) was reduced from 75° to 30°. They found an even more dramatic reduction of 78%
by providing support under the forearm at the same 30° abduction level. The total reduction
from 75° abduction to 30° abduction with support was demonstrated to be an 88% decrease
in muscular activity. Based on the above results, the authors recommended using an
adjustable ergonomic chair, exam table heights, and an adjustable ultrasound console to
achieve improved patient positioning. The study showed that when sonographers utilize
extended reach, either laterally or medially, stressful forces in the muscles of the shoulder
joint increase. The further away the reach was, the greater the force was required by the
shoulder muscles to counter the action of gravity on the extended arm. Although, the above
study identified the favorable upper postures that minimize shoulder muscle stress, this study
did not take into account the combined effect of arm reach and downward push force that the
sonographers need to apply on the transducer to obtain an image.
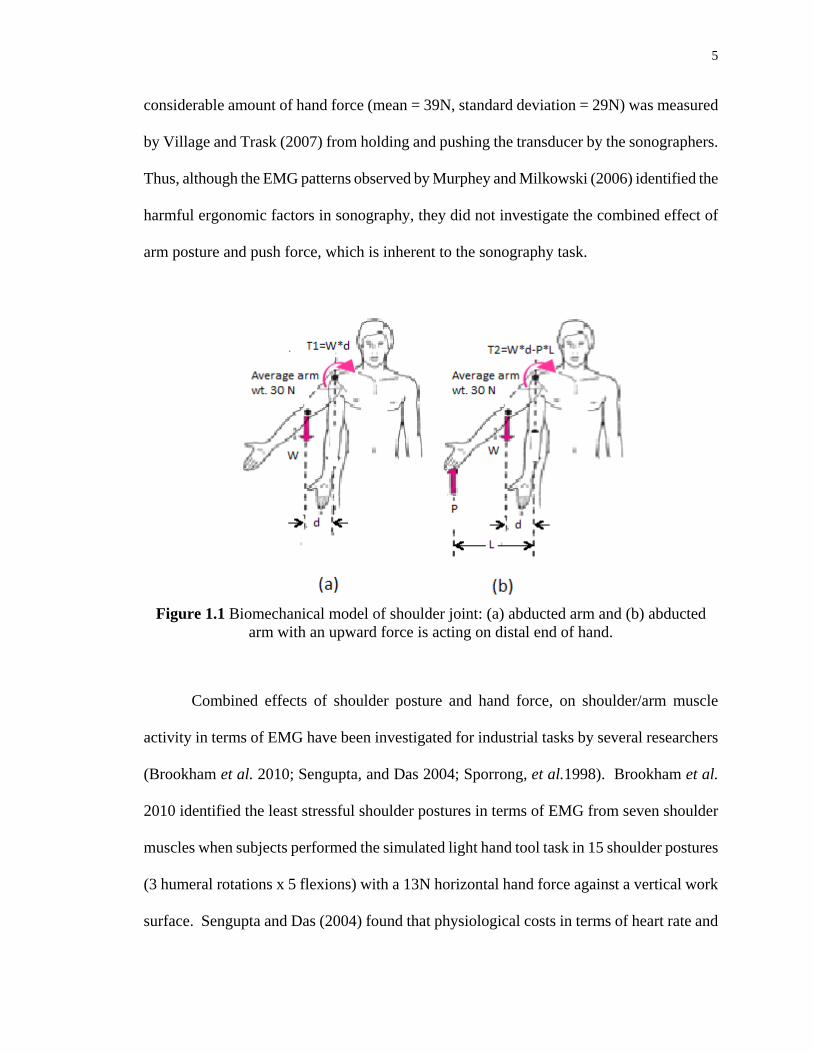
A simple biomechanical model of shoulder joint (Figure 1.1) provides insight on how
the activities of the shoulder muscles are influenced by the upward push force at the hand
from the transducer. When the arm is abducted (or extended) the center of gravity of the arm
segment shifts by a distance d from the shoulder joint (Figure 1.1a). To maintain rotational
equilibrium of the shoulder joint, a reactive torque T1 must be generated by the shoulder
muscle complex to counter the rotational moment (T1=W*d) from the abducted (or
extended) arm. However, when an upward force P (up to a certain magnitude) acts on the
distal end of the hand (Figure 1.1b), the reactive muscle torque (T2) should decrease
(T2<T1), as T2=W*d-P*L. For increasing P, the rotational moment due to P (P*L) may
exceed that of the arm weight (P*L>W*d), and the magnitude of the muscle reaction torque
T2 could again be increasing in the opposite (counter clockwise) direction of T1. A
5
considerable amount of hand force (mean = 39N, standard deviation = 29N) was measured
by Village and Trask (2007) from holding and pushing the transducer by the sonographers.
Thus, although the EMG patterns observed by Murphey and Milkowski (2006) identified the
harmful ergonomic factors in sonography, they did not investigate the combined effect of
arm posture and push force, which is inherent to the sonography task.
Figure 1.1 Biomechanical model of shoulder joint: (a) abducted arm and (b) abducted
arm with an upward force is acting on distal end of hand.
Combined effects of shoulder posture and hand force, on shoulder/arm muscle
activity in terms of EMG have been investigated for industrial tasks by several researchers
(Brookham et al. 2010; Sengupta, and Das 2004; Sporrong, et al.1998). Brookham et al.
2010 identified the least stressful shoulder postures in terms of EMG from seven shoulder
muscles when subjects performed the simulated light hand tool task in 15 shoulder postures
(3 humeral rotations x 5 flexions) with a 13N horizontal hand force against a vertical work
surface. Sengupta and Das (2004) found that physiological costs in terms of heart rate and
6
EMG from four upper body muscles were reduced significantly when repetitive manual
handling tasks were performed in smaller reach distances. In their study, the force acting on
the hand was a gravitational force of a box being handled over a horizontal work surface.
Sporrong, et al.(1998) evaluated five different shoulder postures and found that the precision
requirement from a light hand tool increases the shoulder muscle activity significantly. In
their study the subjects carried a special positioning tool which exerted a downward force on
the hand.
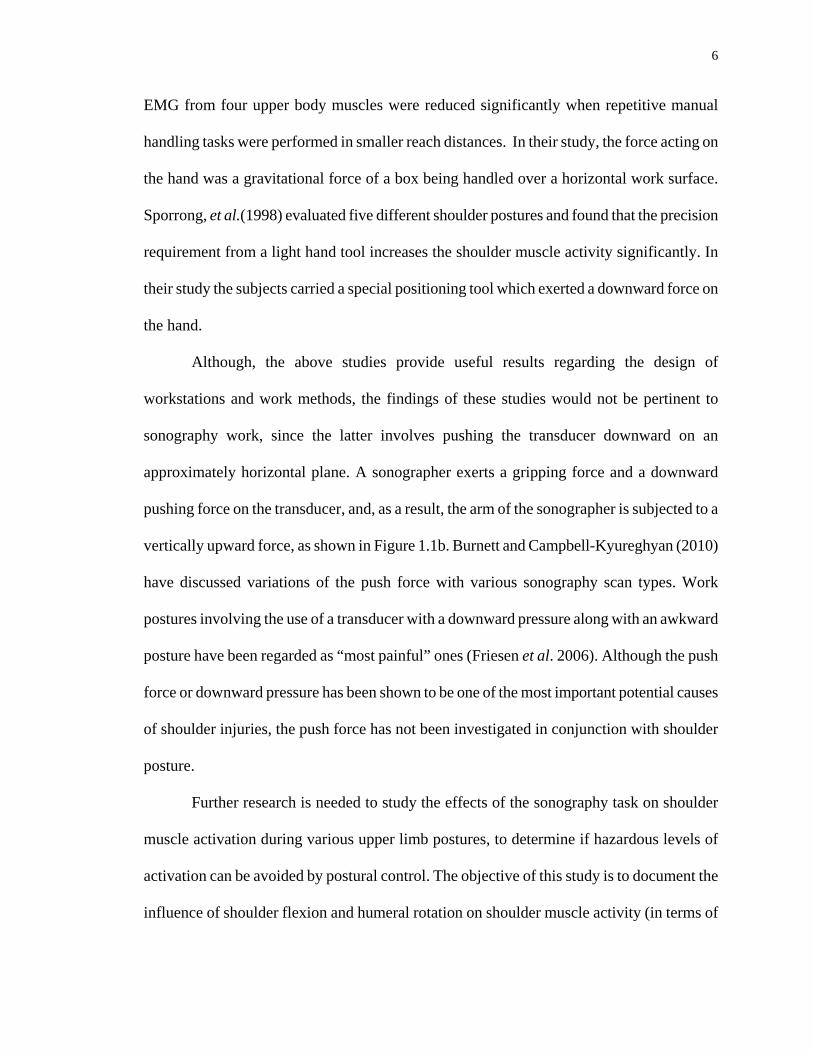
Although, the above studies provide useful results regarding the design of
workstations and work methods, the findings of these studies would not be pertinent to
sonography work, since the latter involves pushing the transducer downward on an
approximately horizontal plane. A sonographer exerts a gripping force and a downward
pushing force on the transducer, and, as a result, the arm of the sonographer is subjected to a
vertically upward force, as shown in Figure 1.1b. Burnett and Campbell-Kyureghyan (2010)
have discussed variations of the push force with various sonography scan types. Work
postures involving the use of a transducer with a downward pressure along with an awkward
posture have been regarded as “most painful” ones (Friesen et al. 2006). Although the push
force or downward pressure has been shown to be one of the most important potential causes
of shoulder injuries, the push force has not been investigated in conjunction with shoulder
posture.
Further research is needed to study the effects of the sonography task on shoulder
muscle activation during various upper limb postures, to determine if hazardous levels of
activation can be avoided by postural control. The objective of this study is to document the
influence of shoulder flexion and humeral rotation on shoulder muscle activity (in terms of

7
EMG) during submaximal downward pushing tasks similar to the sonography task.
Electromyography is regarded as one of the most objective and accurate methods of directly
measuring muscular stress, as evidenced from the research studies discussed in this section.
1.2 Objectives and Hypotheses
The specific objectives of this study are:
1. Conduct a literature review related to musculoskeletal injuries in the field of Medical
Sonography.
2. To systematically evaluate the effect that reach distance, humeral rotation and
downward force have on an upper extremity muscle EMG when a light downward push is
exerted on a horizontal plane. Muscular loads involved are monitored by measuring
electromyography (EMG) of four shoulder muscles (middle trapezius, triceps, pectoralis
major and supraspinatus) while applying a vertically downward push force that would be
measured through a strain gage.
It is hypothesized that:
1. EMG will be significantly affected by the reach distance
2. EMG will be significantly affected by humeral rotation
3. EMG will be significantly affected by the exerted push force
8
CHAPTER 2
LITERATURE REVIEW
The following two sections describe the current biomechanical and psychophysical research
on Sonography Profession related MSDs of Sonographers.
2.1 Biomechanical Studies
Village and Trask (2007) investigated the postural loads involved in performing ultrasound
sonography scans to identify the extent of abduction and outward rotation of the shoulder,
unsupported shoulder postures and neck bending/twisting. They conducted a video-based
postural analysis at six hospital facilities involving a total of 11 different ultrasound
sonographers for 24 full scans totaling 528 minutes of scan duration.
Their video analysis results showed that on average sonographers spent 66% of the
scanning time with the shoulder abducted more than 30o and 45% of the time at more than
45o. The static or unsupported arm postures of the right shoulder to hold the weight of the
arm and transducer was found to be on average for 73% of scanning time. According to
Jarvholm et al. (1988, 1989), a 30o shoulder abduction causes significant impedance of blood
flow in the supraspinatus muscle. High shoulder abduction coupled with prolonged
unsupported static upper arm posture was identified as significant risk factors for MSDs at
the shoulder region. On average, sonographers spent 63% of their scanning time with the
shoulder outwardly rotated more than 30o and 43% of the time at more than 45o. This
shoulder posture loads specifically the supraspinatus muscle (Village and Trask 2007). They
found that the neck was bent forward, laterally or twisted more than 20o for an average of
37% of the scanning time.
9
In their second part of the study they measured muscle loads in terms of
electromyography (EMG) of three neck/shoulder muscles (trapezezius, supraspinatus and
infraspinatus) as well as the gripping force of the flexicarpi ulnaris holding the transducer.
They collected EMG during one full shift at one of the six hospital facilities, when three
sonographers performed 2–3 scans each (a total of seven scans) on patients.
All three shoulder muscles were found to work 90% of the time statically at or above
a mean contraction of 3% to 10% of MVC, which corresponds to a medium risk rating for
shoulder-neck MSDs. Mean forearm flexor (FCU) EMG was 3.96 kg (SD 2.94), with
occasional peak forces as high as 27.6 kg. The study confirmed that ergonomic risk factors,
such as long durations of static loads on shoulder muscles are accurate representatives of
high prevalence of neck and shoulder injuries and symptoms as reported by many studies
conducted on Sonographers.
Brookham et al. (2010) investigated the effects of light hand tool exertion task on the
activation of nine shoulder muscles (right superior, middle and inferior trapezius, anterior,
middle and posterior deltoid, pectoralis major, infraspinatus and latissimus dorsi) during
different shoulder flexion postures and three angles of humeral rotation. Tasks were
performed at 15 different postures: shoulder flexion of 0o, 60o, 70o, 80o, and 90o, and humeral
rotation of -45o, 0o, and 45o. The elbow was flexed to 90o during all postures. Subjects
performed two simultaneous tasks - producing a gripping force of 30% MVC and exerted a
forward push force at 13N with a hand dynamometer. The subjects exerted a force
horizontally, similar to a drilling task.
The results suggested that in order to reduce risky levels of inferior trapezius
activation, light hand tool tasks should be performed at neutral elevation and 45o internal
10
rotation, or for slightly higher activations (but still low risk) at 60o shoulder flexion and 45o
internal rotation. Another important finding of the study was that light hand tool tasks cause
shoulder muscle activation at levels close to or exceeding the recommended threshold of 10-
14% MVC for long lasting intermittent or dynamic work.
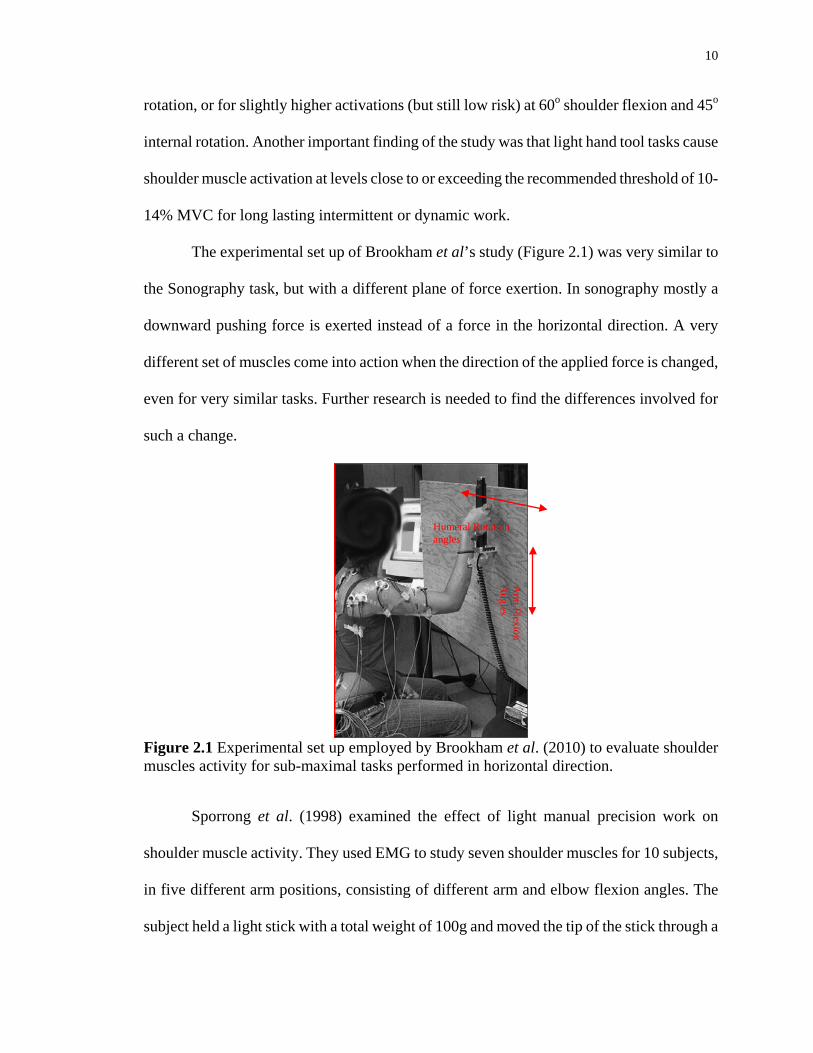
The experimental set up of Brookham et al’s study (Figure 2.1) was very similar to
the Sonography task, but with a different plane of force exertion. In sonography mostly a
downward pushing force is exerted instead of a force in the horizontal direction. A very
different set of muscles come into action when the direction of the applied force is changed,
even for very similar tasks. Further research is needed to find the differences involved for
such a change.
Figure 2.1 Experimental set up employed by Brookham et al. (2010) to evaluate shoulder muscles activity for sub-maximal tasks performed in horizontal direction.
Sporrong et al. (1998) examined the effect of light manual precision work on
shoulder muscle activity. They used EMG to study seven shoulder muscles for 10 subjects,
in five different arm positions, consisting of different arm and elbow flexion angles. The
subject held a light stick with a total weight of 100g and moved the tip of the stick through a
Humeral Rotation angles
Arm
Flexion A
ngles
11
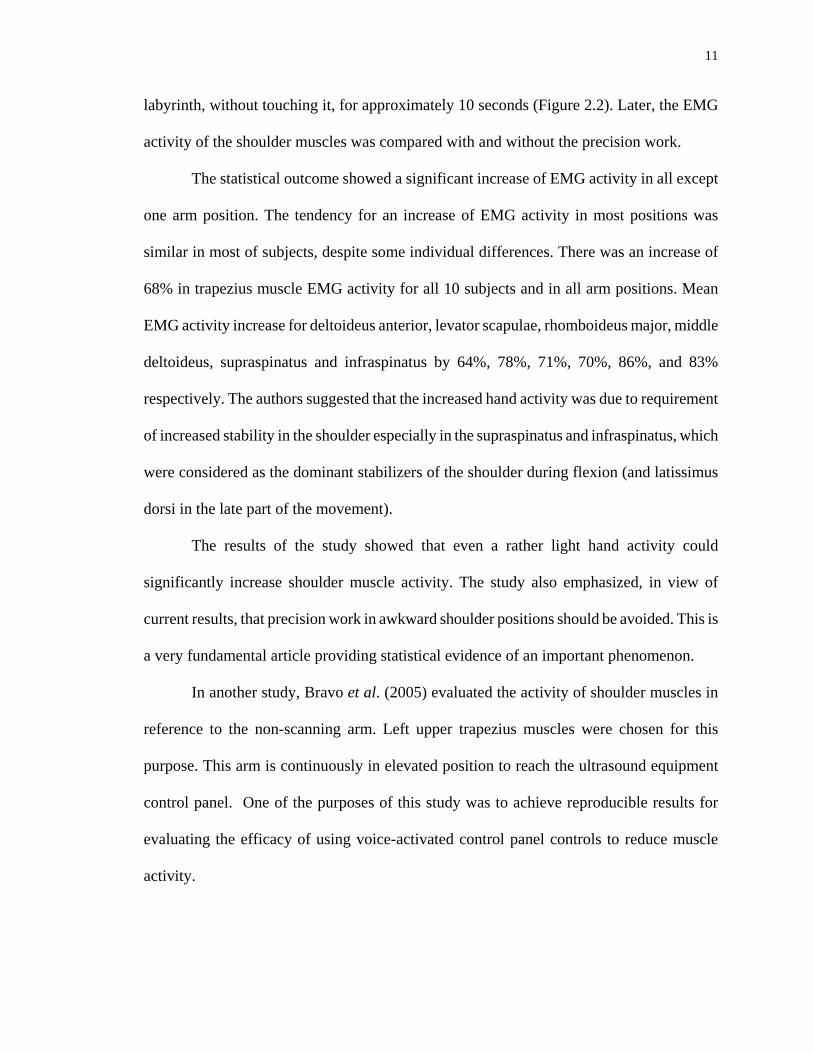
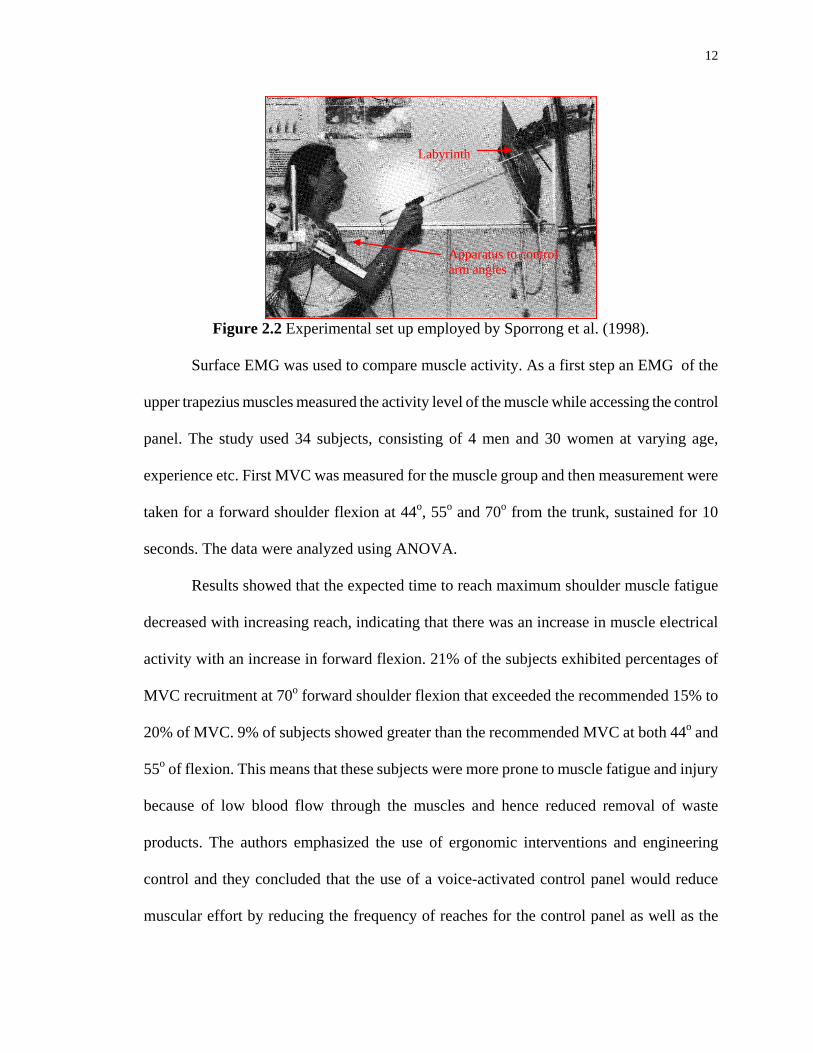
labyrinth, without touching it, for approximately 10 seconds (Figure 2.2). Later, the EMG
activity of the shoulder muscles was compared with and without the precision work.
The statistical outcome showed a significant increase of EMG activity in all except
one arm position. The tendency for an increase of EMG activity in most positions was
similar in most of subjects, despite some individual differences. There was an increase of
68% in trapezius muscle EMG activity for all 10 subjects and in all arm positions. Mean
EMG activity increase for deltoideus anterior, levator scapulae, rhomboideus major, middle
deltoideus, supraspinatus and infraspinatus by 64%, 78%, 71%, 70%, 86%, and 83%
respectively. The authors suggested that the increased hand activity was due to requirement
of increased stability in the shoulder especially in the supraspinatus and infraspinatus, which
were considered as the dominant stabilizers of the shoulder during flexion (and latissimus
dorsi in the late part of the movement).
The results of the study showed that even a rather light hand activity could
significantly increase shoulder muscle activity. The study also emphasized, in view of
current results, that precision work in awkward shoulder positions should be avoided. This is
a very fundamental article providing statistical evidence of an important phenomenon.
In another study, Bravo et al. (2005) evaluated the activity of shoulder muscles in
reference to the non-scanning arm. Left upper trapezius muscles were chosen for this
purpose. This arm is continuously in elevated position to reach the ultrasound equipment
control panel. One of the purposes of this study was to achieve reproducible results for
evaluating the efficacy of using voice-activated control panel controls to reduce muscle
activity.
12
Figure 2.2 Experimental set up employed by Sporrong et al. (1998).
Surface EMG was used to compare muscle activity. As a first step an EMG of the
upper trapezius muscles measured the activity level of the muscle while accessing the control
panel. The study used 34 subjects, consisting of 4 men and 30 women at varying age,
experience etc. First MVC was measured for the muscle group and then measurement were
taken for a forward shoulder flexion at 44o, 55o and 70o from the trunk, sustained for 10
seconds. The data were analyzed using ANOVA.
Results showed that the expected time to reach maximum shoulder muscle fatigue
decreased with increasing reach, indicating that there was an increase in muscle electrical
activity with an increase in forward flexion. 21% of the subjects exhibited percentages of
MVC recruitment at 70o forward shoulder flexion that exceeded the recommended 15% to
20% of MVC. 9% of subjects showed greater than the recommended MVC at both 44o and
55o of flexion. This means that these subjects were more prone to muscle fatigue and injury
because of low blood flow through the muscles and hence reduced removal of waste
products. The authors emphasized the use of ergonomic interventions and engineering
control and they concluded that the use of a voice-activated control panel would reduce
muscular effort by reducing the frequency of reaches for the control panel as well as the
Labyrinth
Apparatus to control arm angles
13
necessity to maintain an extended reach. The study did not consider various rotation angles,
which are frequently used by sonographers with the scanning arm. More muscles might also
have been included to evaluate the impact of the intervention on them.
Murphey and Milkowski (2006) compared EMG measurement, for upper trapezius
muscles and rotator cuff for standard and improved postures for both right and left sides. The
study used 22 subjects (sonographers), consisting of 6 males and 16 females. Adaptive
cushions used to support the scanning arm in 30o supported position. A 64% reduction in
mean exertion of the left upper trapezius muscle was found, for extended versus a neutral
position, which may be achieved by using an adjustable control panel or a similar
intervention.
For the right rotator cuff, three different positions were analyzed; 75o angle of
abduction, which is very common to sonographers, 30o angle of abduction, which is the
recommended posture and 30o abduction with the addition of a support cushion placed under
the right forearm.
Reducing the angle from 75o to 30o resulted in a 46% decrease in firing of the
muscles tested. The firing reduced further to 78% by supporting the forearm. The overall
reduction between the first position and third one (a position of 30 degrees abduction with
the addition of support cushions) was 88% decrease of muscle activity. This study concluded
that shoulder muscle activity can be dramatically reduced through proper technique and
equipment.
Although the outcome of the study was very obvious, it confirmed that reach plays a
very important role in shoulder muscle activity and the later may be greatly reduced by
keeping the reach angles as small as possible.
14
2.2 Psychophysical Studies
In the field of Medical Sonography questionnaires or surveys are a common method to assess
the prevalence of work related MSDs and the existence of perceived risk factors for injuries.
Burnett and Campbell-Kyureghyan (2010) investigated sonography scan-specific risk factors
for shoulder muscles through such questionnaires. They also performed job evaluations and
tried to quantify those evaluations through quantitative analysis of upper extremity joint
biomechanics.
They used the Standardized Nordic Questionnaire (SNQ), (which was developed to
analyze low back, neck, shoulder and general complaints for use in epidemiological studies)
and customized it to gather specific details related to the trunk and upper extremities.
Questions about lifetime prevalence, work-relatedness, causality, severity and duration of
MSDs were also included.
All seven respondents of the survey perceived sustained shoulder abduction,
sustained transducer usage and scanning large or obese patients to be risk-factors for
occupational injury. Six responders reported musculoskeletal pain in at least one upper
extremity joint. Although sample size was small, this high injury rate was quite consistent
with that found in the other studies.
Second part of the study constituted an ergonomic analysis for five scan types,
chosen on the basis of high frequency of scans at the facility where the evaluation was
performed, and because they involved a variety of extremity and trunk postures and various
push force requirements. The RULA (Rapid Upper Limb Assessment) method was
employed for evaluation and electrogonio-meters were used to measure joint angles. Video
15
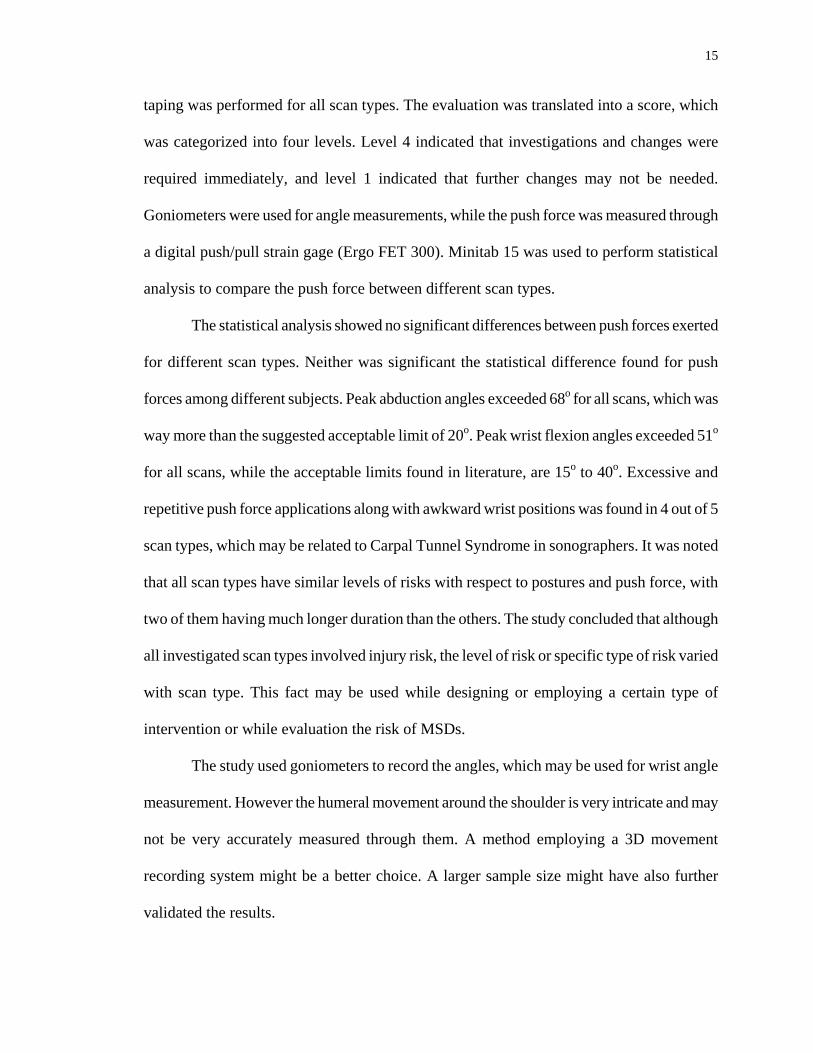
taping was performed for all scan types. The evaluation was translated into a score, which
was categorized into four levels. Level 4 indicated that investigations and changes were
required immediately, and level 1 indicated that further changes may not be needed.
Goniometers were used for angle measurements, while the push force was measured through
a digital push/pull strain gage (Ergo FET 300). Minitab 15 was used to perform statistical
analysis to compare the push force between different scan types.
The statistical analysis showed no significant differences between push forces exerted
for different scan types. Neither was significant the statistical difference found for push
forces among different subjects. Peak abduction angles exceeded 68o for all scans, which was
way more than the suggested acceptable limit of 20o. Peak wrist flexion angles exceeded 51o
for all scans, while the acceptable limits found in literature, are 15o to 40o. Excessive and
repetitive push force applications along with awkward wrist positions was found in 4 out of 5
scan types, which may be related to Carpal Tunnel Syndrome in sonographers. It was noted
that all scan types have similar levels of risks with respect to postures and push force, with
two of them having much longer duration than the others. The study concluded that although
all investigated scan types involved injury risk, the level of risk or specific type of risk varied
with scan type. This fact may be used while designing or employing a certain type of
intervention or while evaluation the risk of MSDs.
The study used goniometers to record the angles, which may be used for wrist angle
measurement. However the humeral movement around the shoulder is very intricate and may
not be very accurately measured through them. A method employing a 3D movement
recording system might be a better choice. A larger sample size might have also further
validated the results.
16
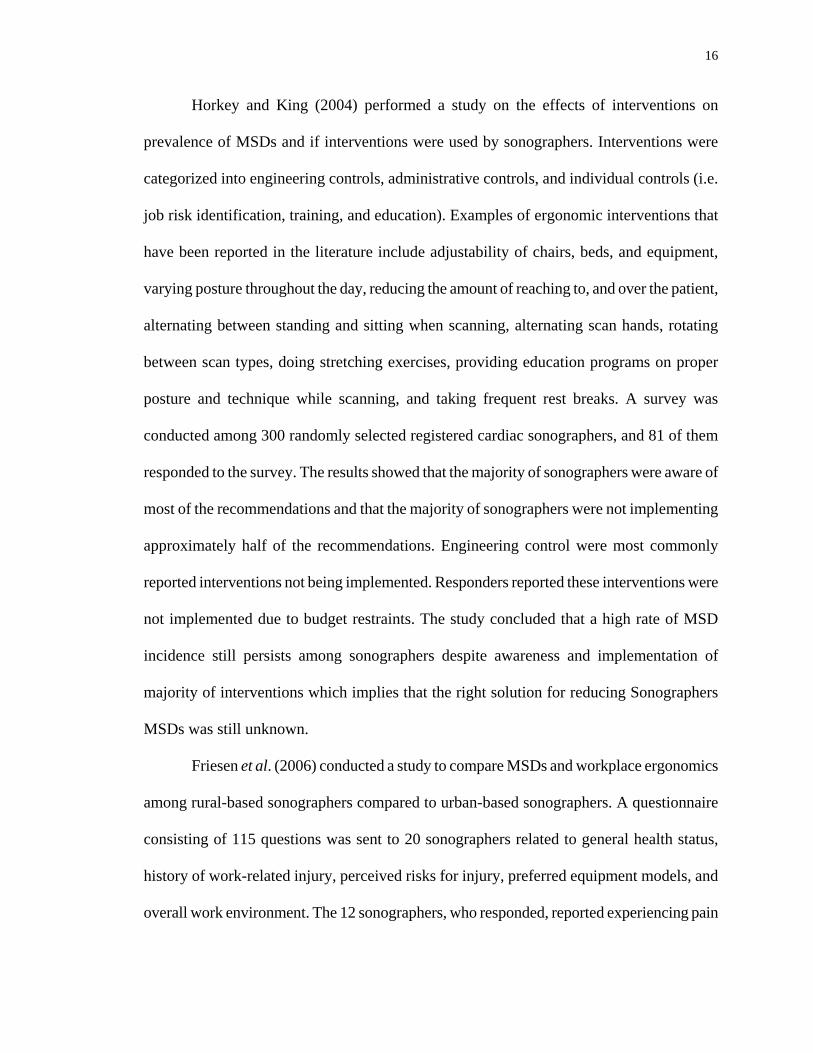
Horkey and King (2004) performed a study on the effects of interventions on
prevalence of MSDs and if interventions were used by sonographers. Interventions were
categorized into engineering controls, administrative controls, and individual controls (i.e.
job risk identification, training, and education). Examples of ergonomic interventions that
have been reported in the literature include adjustability of chairs, beds, and equipment,
varying posture throughout the day, reducing the amount of reaching to, and over the patient,
alternating between standing and sitting when scanning, alternating scan hands, rotating
between scan types, doing stretching exercises, providing education programs on proper
posture and technique while scanning, and taking frequent rest breaks. A survey was
conducted among 300 randomly selected registered cardiac sonographers, and 81 of them
responded to the survey. The results showed that the majority of sonographers were aware of
most of the recommendations and that the majority of sonographers were not implementing
approximately half of the recommendations. Engineering control were most commonly
reported interventions not being implemented. Responders reported these interventions were
not implemented due to budget restraints. The study concluded that a high rate of MSD
incidence still persists among sonographers despite awareness and implementation of
majority of interventions which implies that the right solution for reducing Sonographers
MSDs was still unknown.
Friesen et al. (2006) conducted a study to compare MSDs and workplace ergonomics
among rural-based sonographers compared to urban-based sonographers. A questionnaire
consisting of 115 questions was sent to 20 sonographers related to general health status,
history of work-related injury, perceived risks for injury, preferred equipment models, and
overall work environment. The 12 sonographers, who responded, reported experiencing pain
17
most frequently in the neck and shoulders. The most painful or stressful work posture
involved the use of the transducer with downward pressure, firm grip, and flexed wrist
combined with shoulder abduction and forearm pronation or supination. 81% of them
reported pain in the neck and shoulder that involves the upper trapezius and shoulder
muscles.
Based on the survey results, rural-based sonographers appeared to have greater work
stress and risk of musculoskeletal injuries. Among a variety of factors identified as
contributing towards increased risk of MSDs were outdated equipment, longer reach and
strong grip requirements for scanning obese patients, and push force requirement. Heavy
work load (number of scans per day) also contributed to more injuries. The reason for heavy
loads may be the lack of strong support networks and inadequate political power due to their
small number.
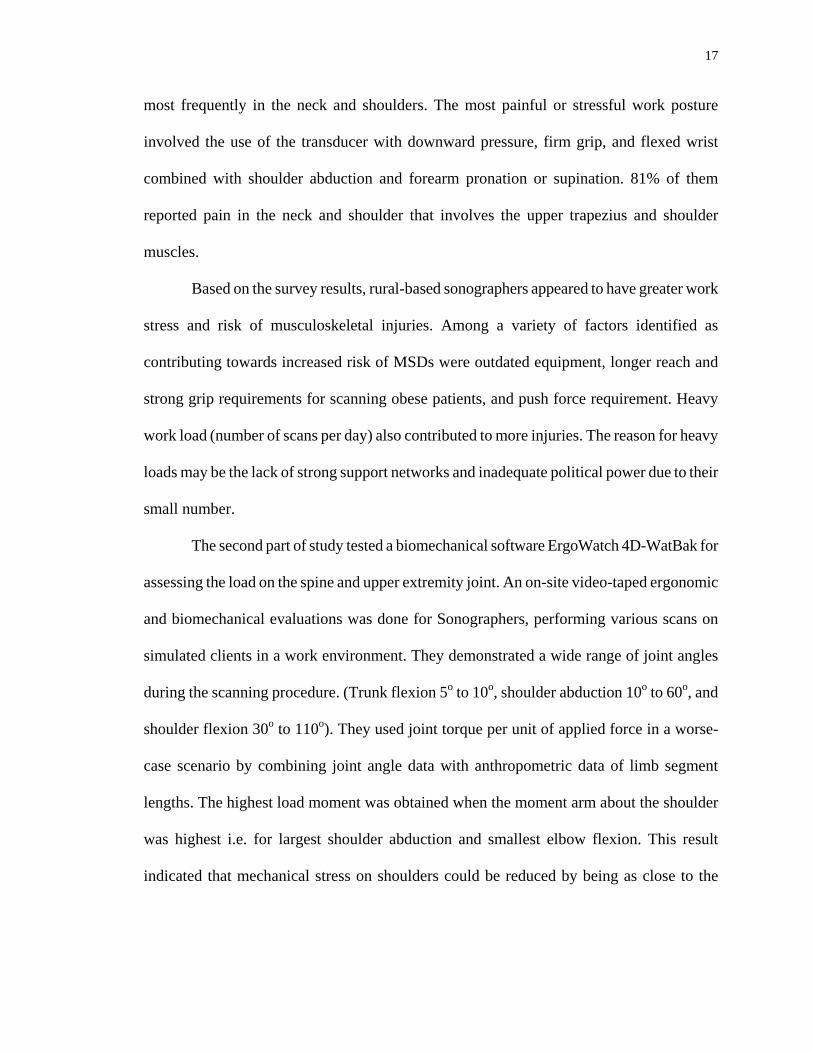
The second part of study tested a biomechanical software ErgoWatch 4D-WatBak for
assessing the load on the spine and upper extremity joint. An on-site video-taped ergonomic
and biomechanical evaluations was done for Sonographers, performing various scans on
simulated clients in a work environment. They demonstrated a wide range of joint angles
during the scanning procedure. (Trunk flexion 5o to 10o, shoulder abduction 10o to 60o, and
shoulder flexion 30o to 110o). They used joint torque per unit of applied force in a worse-
case scenario by combining joint angle data with anthropometric data of limb segment
lengths. The highest load moment was obtained when the moment arm about the shoulder
was highest i.e. for largest shoulder abduction and smallest elbow flexion. This result
indicated that mechanical stress on shoulders could be reduced by being as close to the

18
patients as possible to reduce the reach and hence moment arm. This may also be achieved
by having some degree of flexion in the elbow.
The authors concluded that the software could only be used for load assessments in
sagittal planes and not for multi-plane joint evaluation, and hence, it was minimally
effective. The authors did not provide experimental procedure details and method of
analysis. Also, the use of a device to exactly measure the push force could have been more
useful.
19
CHAPTER 3
EXPERIMENTAL METHODS
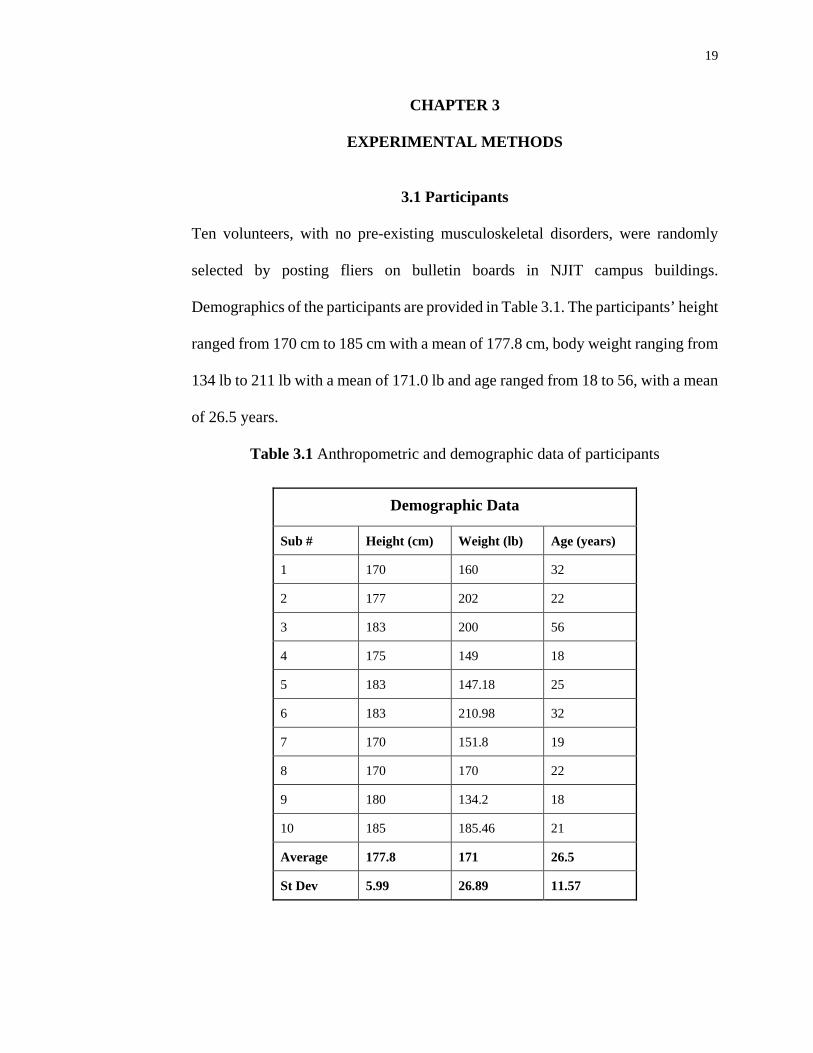
3.1 Participants
Ten volunteers, with no pre-existing musculoskeletal disorders, were randomly
selected by posting fliers on bulletin boards in NJIT campus buildings.
Demographics of the participants are provided in Table 3.1. The participants’ height
ranged from 170 cm to 185 cm with a mean of 177.8 cm, body weight ranging from
134 lb to 211 lb with a mean of 171.0 lb and age ranged from 18 to 56, with a mean
of 26.5 years.
Table 3.1 Anthropometric and demographic data of participants
Demographic Data
Sub # Height (cm) Weight (lb) Age (years)
1 170 160 32
2 177 202 22
3 183 200 56
4 175 149 18
5 183 147.18 25
6 183 210.98 32
7 170 151.8 19
8 170 170 22
9 180 134.2 18
10 185 185.46 21
Average 177.8 171 26.5
St Dev 5.99 26.89 11.57

20
3.2 Electromyography (EMG)
The experiment was done in NJIT’s Safety Lab. EMG activity of the four shoulder
muscles was monitored using type SX230 bipolar differential surface electrodes,
manufactured by Biometrics Ltd. These electrodes were adhered to the participant’s
skin with Biometrics Ltd medical grade adhesive tape. The design of these electrodes
includes a pre-amplifier. The area of the skin, where an electrode was to be attached,
was first cleaned and abraded and then an electrode conductive gel was applied.
EMG was measured for right side of each subject. EMG activity was transmitted
through an 8-channel remote patient data acquisition unit, which was attached to
subjects’ belts. This acquisition unit was connected to a DLK800 Base unit. The
Base unit was connected to the PC, which processes data using Biometrics Datalink
Pc Software Version 2.0 as well as stored it. The EMG hardwire configuration is
illustrated in Figure 3.1. EMG was recorded at a rate of 1000 Hz for the entire
experimental procedure.
Figure 3.1 Biometrics Datalink hardware system configuration.
21
3.3 Experimental Design
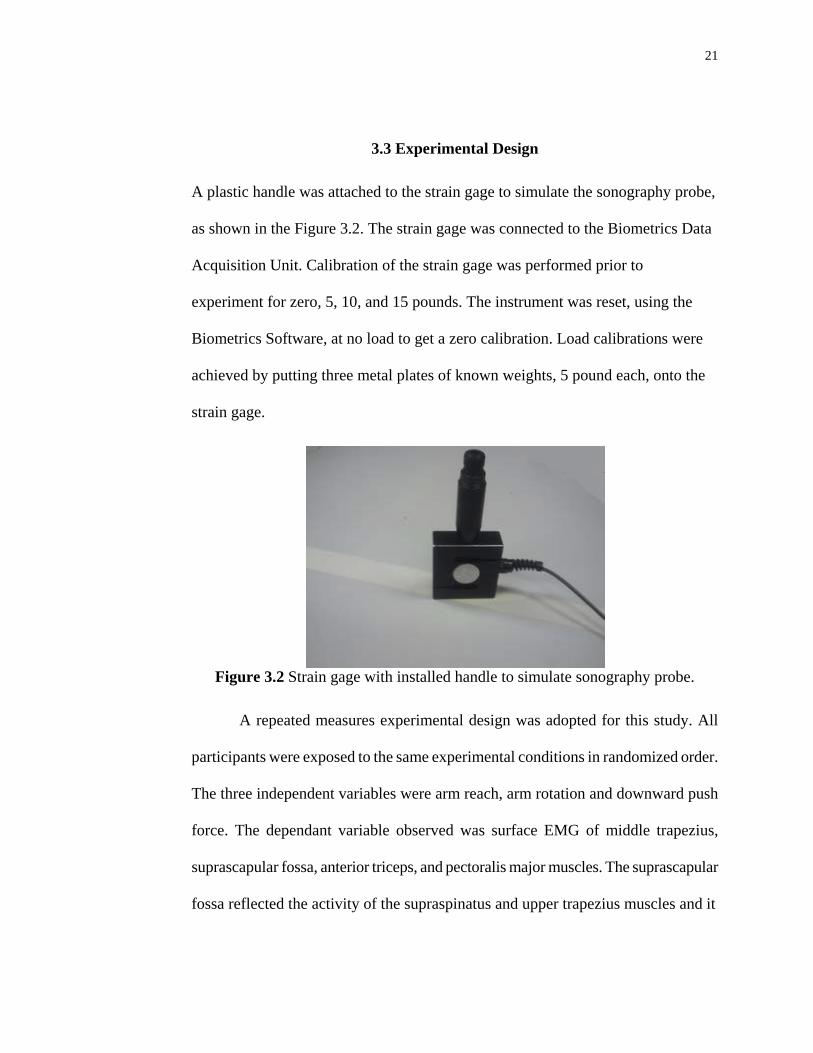
A plastic handle was attached to the strain gage to simulate the sonography probe,
as shown in the Figure 3.2. The strain gage was connected to the Biometrics Data
Acquisition Unit. Calibration of the strain gage was performed prior to
experiment for zero, 5, 10, and 15 pounds. The instrument was reset, using the
Biometrics Software, at no load to get a zero calibration. Load calibrations were
achieved by putting three metal plates of known weights, 5 pound each, onto the
strain gage.
Figure 3.2 Strain gage with installed handle to simulate sonography probe.
A repeated measures experimental design was adopted for this study. All
participants were exposed to the same experimental conditions in randomized order.
The three independent variables were arm reach, arm rotation and downward push
force. The dependant variable observed was surface EMG of middle trapezius,
suprascapular fossa, anterior triceps, and pectoralis major muscles. The suprascapular
fossa reflected the activity of the supraspinatus and upper trapezius muscles and it
22
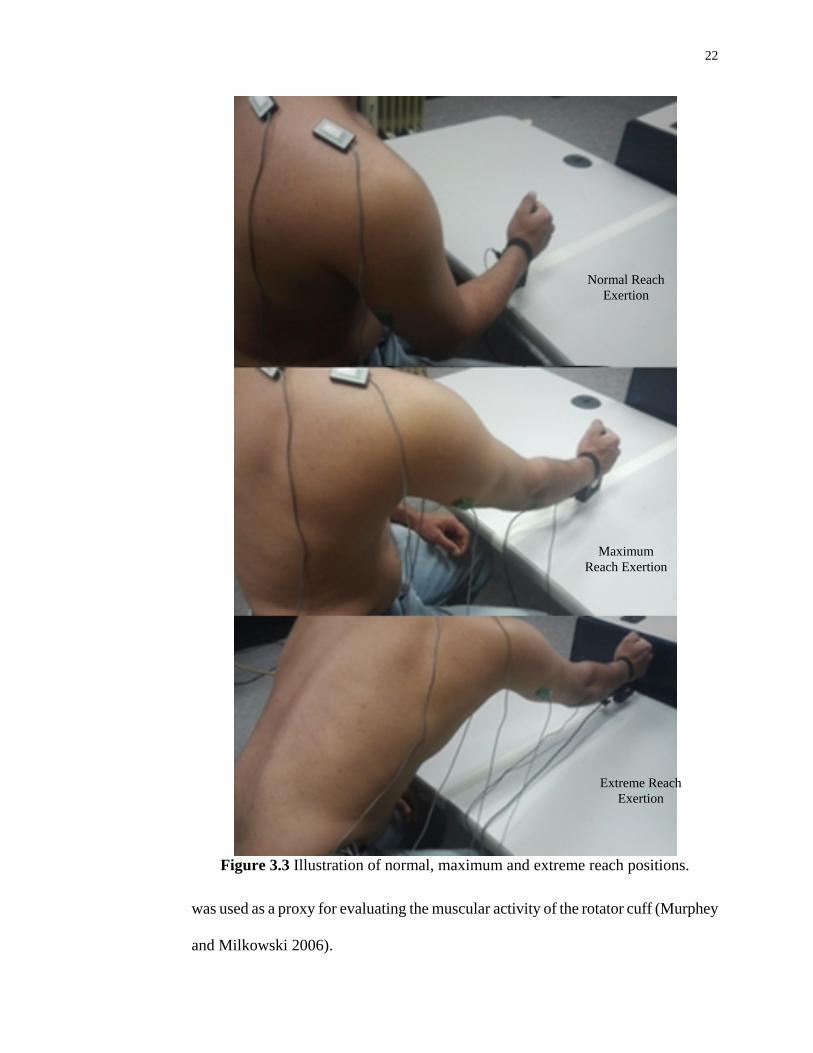
Figure 3.3 Illustration of normal, maximum and extreme reach positions.
was used as a proxy for evaluating the muscular activity of the rotator cuff (Murphey
and Milkowski 2006).
Extreme Reach Exertion
Maximum Reach Exertion
Normal Reach Exertion

23
The three reach lengths were adopted as described by Sengupta and Das (2004) as a)
the normal reach on a work surface, which was attained by the sweep of the forearm,
while the upper arm and torso are kept close to vertical, b) the maximum reach on the
work surface, which was attained by the movement of extended arm with a vertical
torso, and c) the extreme reach, that is the farthest possible distance from where the
task could be performed; i.e. torso can be bent while the arm was extended. Figure
3.3 illustrate the three arm reaches. Arm rotation angles were selected as -45o internal
rotation, neutral, and 45o external rotation as selected by Brookham et al. (2010).
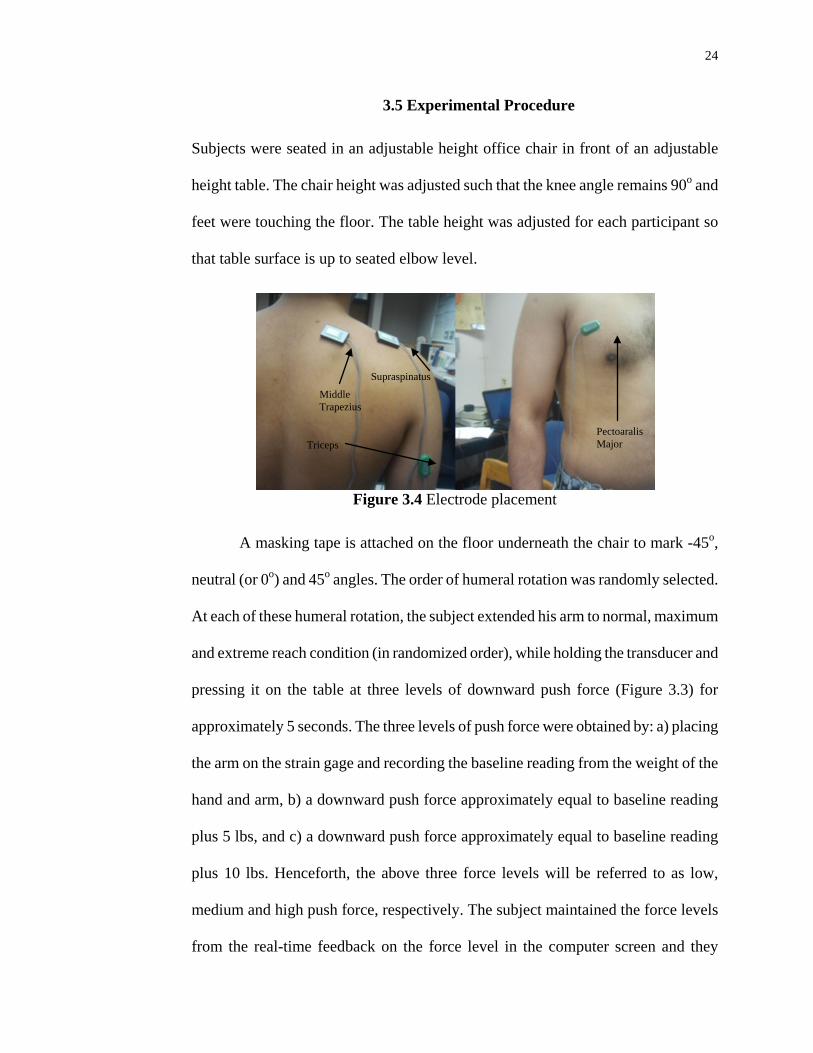
3.4 Electrode Placement
The electrode placement for middle trapezius, suprascapular fossa, triceps and
pectoralis major muscles are illustrated in Figure 3.4 and the placement sites were
according to the recommendations from Village and Trask (2007), and Cram &
Kasman (1998).
For the middle trapezius muscle, the electrode was placed 2 cm laterally from
the mid-point of a line from the spinous process of C7 to the acromion process of the
scapula. For the supraspinatus muscle the electrode was placed directly above the
spine of the scapula, over the suprascapular fossa, after palpating the spine of the
spacula, locating its lateral distal aspect. For the triceps muscles electrode was placed
over the belly of the muscle. For the pectoralis major muscle, electrode was placed
horizontally on the chest wall over the muscle mass that arises approximately 2 cm
out from the auxiliary fold.
24
3.5 Experimental Procedure
Subjects were seated in an adjustable height office chair in front of an adjustable
height table. The chair height was adjusted such that the knee angle remains 90o and
feet were touching the floor. The table height was adjusted for each participant so
that table surface is up to seated elbow level.
Figure 3.4 Electrode placement
A masking tape is attached on the floor underneath the chair to mark -45o,
neutral (or 0o) and 45o angles. The order of humeral rotation was randomly selected.
At each of these humeral rotation, the subject extended his arm to normal, maximum
and extreme reach condition (in randomized order), while holding the transducer and
pressing it on the table at three levels of downward push force (Figure 3.3) for
approximately 5 seconds. The three levels of push force were obtained by: a) placing
the arm on the strain gage and recording the baseline reading from the weight of the
hand and arm, b) a downward push force approximately equal to baseline reading
plus 5 lbs, and c) a downward push force approximately equal to baseline reading
plus 10 lbs. Henceforth, the above three force levels will be referred to as low,
medium and high push force, respectively. The subject maintained the force levels
from the real-time feedback on the force level in the computer screen and they
Middle Trapezius
Supraspinatus
Triceps Pectoaralis Major

25
practiced the trials prior to actual experiment. For each combination of rotation angle
and reach trial, EMG and force data were collected digitally at 1000 Hz and stored in
separate digital files for further analysis.
EMG data for maximal voluntary contractions (MVCs) were collected for
each of four muscle groups. Calibration of the middle trapezius and supraspinatus
was followed according to Village and Trask (2007). Each subject was asked to
elevate their shoulder as hard as possible against a resistance provided manually by
research assistant. Supraspinatus calibration was achieved by restricting the
participant’s wrist while the arm was laterally abducted at a 45o angle, and asking the
participant to abduct against the resistance with full effort. For the MVC of the
pectoralis major, participants were asked to pull their arm medially with full effort
and participants were asked to push the forearm downward, as hard as possible, to
find out MVC of the triceps muscle.
3.6 Processing of EMG and Force Data
A typical EMG activity for trapezius muscle in millivolt (mv), superimposed by the
push force recording is shown in the Figure 3.5. In this trial, the EMG amplitude
increased as the level of push force was increased. EMG and force data were
processed in the ‘Datalog’ PC software version 8.0, provided by Biometrics Ltd. For
each force level, a representative window of 2-3 second was selected, and the
average force level within the window represented the applied force. For the selected
window, the individual muscle EMG data were first filtered by applying the RMS
(Root Mean Square) filter with a time constant of 50ms, and then were averaged to
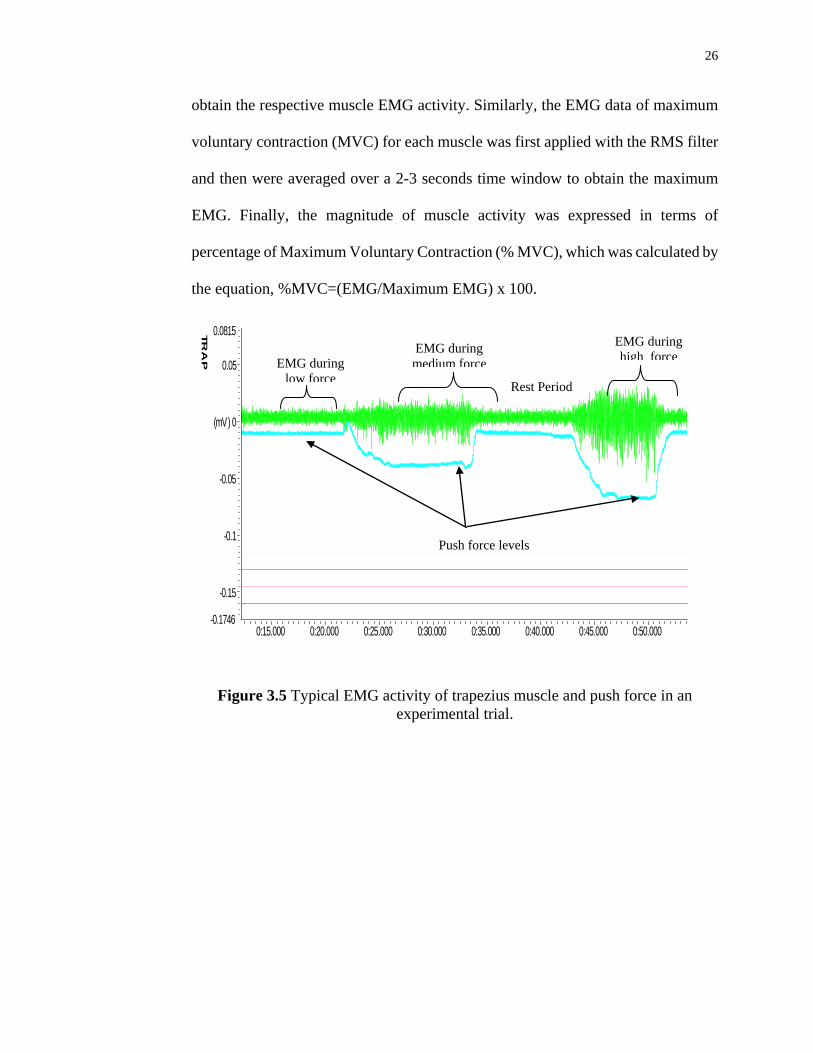
26
obtain the respective muscle EMG activity. Similarly, the EMG data of maximum
voluntary contraction (MVC) for each muscle was first applied with the RMS filter
and then were averaged over a 2-3 seconds time window to obtain the maximum
EMG. Finally, the magnitude of muscle activity was expressed in terms of
percentage of Maximum Voluntary Contraction (% MVC), which was calculated by
the equation, %MVC=(EMG/Maximum EMG) x 100.
TR
AP
0:15.000 0:20.000 0:25.000 0:30.000 0:35.000 0:40.000 0:45.000 0:50.000
0.0815
-0.1746
-0.15
-0.1
-0.05
(mV) 0
0.05
Figure 3.5 Typical EMG activity of trapezius muscle and push force in an
experimental trial.
EMG during low force Rest Period
EMG during medium force
EMG during high force
Push force levels
27
CHAPTER 4
RESULTS AND ANALYSIS
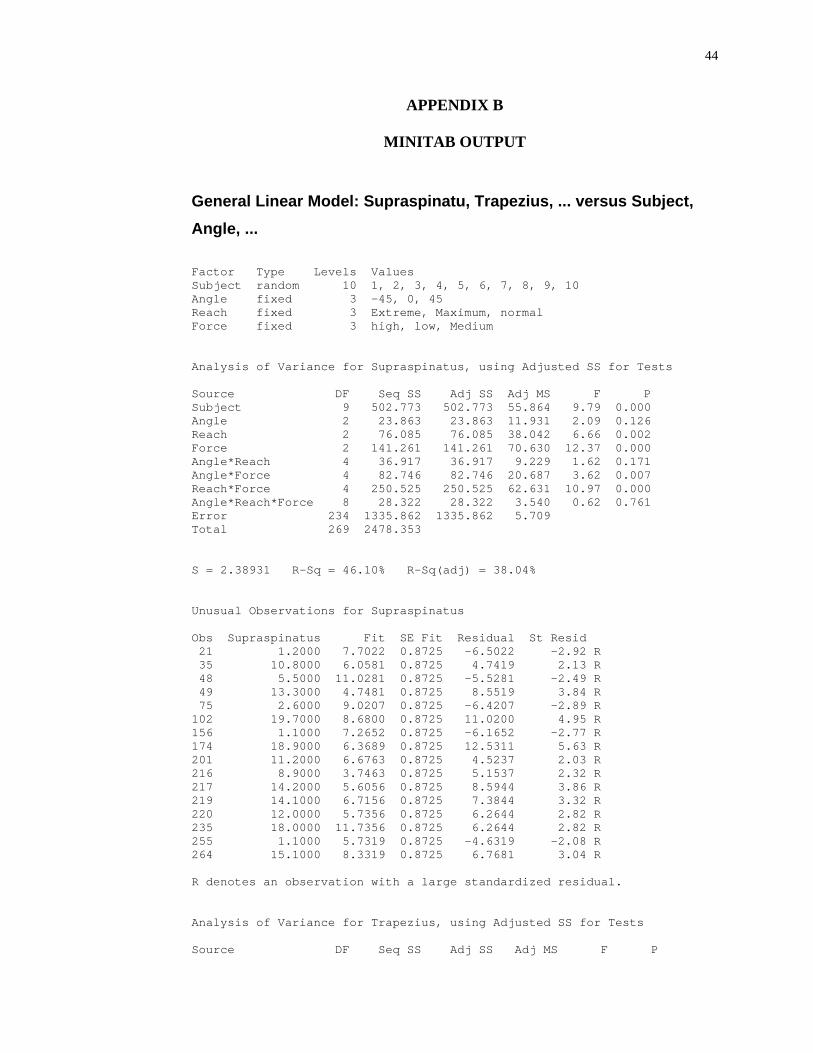
Statistical Analysis was performed using Minitab 15. A repeated measures two
factorial analysis of Variance (ANOVA) was used, with the three independent
variables being reach, arm rotation angle and downward push force. The details of
ANOVA results can be found in Appendix B. Participants were used as blocks to
determine the statistical significance effects at a p-value less than 0.05. Appendix C
presents the mean muscle EMG’s for three levels of force and reach.
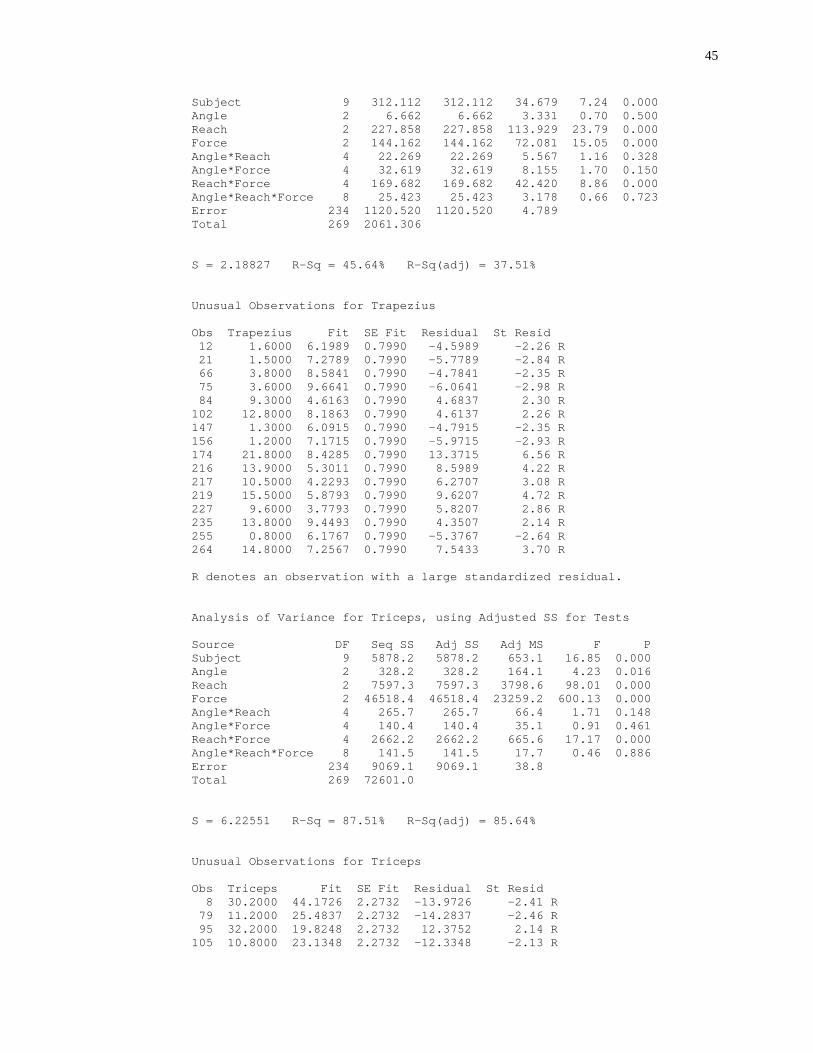
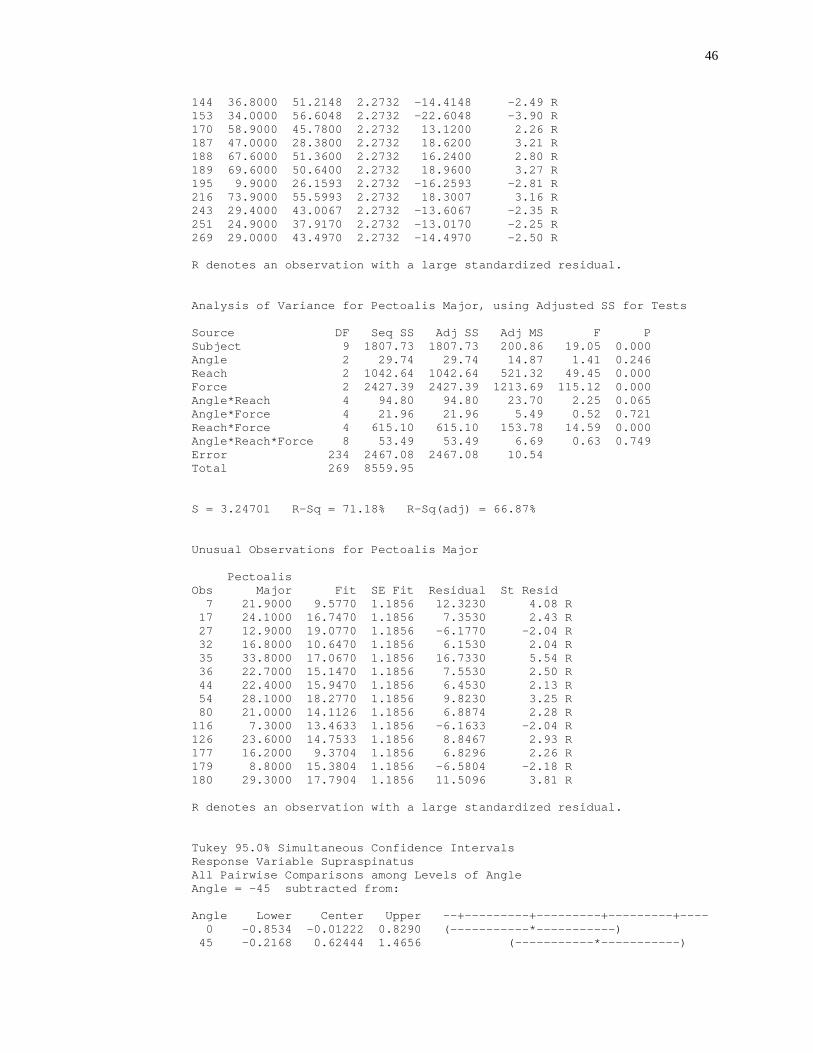
4.1 Changes in Muscle Activity with Reach, Angle and Force
EMG Activity levels of all four muscles i.e. supraspinatus, trapezius, pectoralis
major and triceps were found significantly different for various reaches and for
different forces. Humeral rotation angle did not produce a significant effect in any
other muscles, but for triceps. The interaction effects were found significantly
different for force and reach for all four muscles.
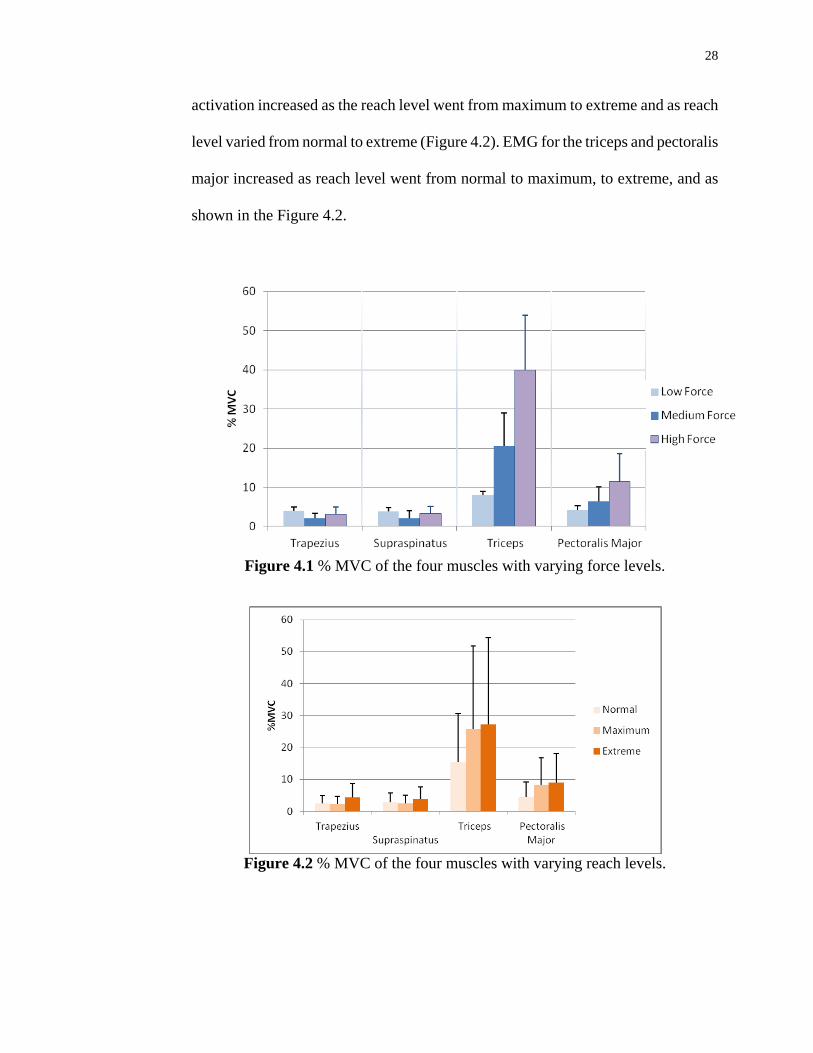
The trapezius and supraspinatus muscle EMG activity increased as the force
level went from medium to high, to low, and mean activity levels are shown in the
Figure 4.1. The mean muscle EMG activity for triceps and perctoralis major
increased as the force level went from low to medium, to high, and as shown in the
Figure 4.1.
Significant effects (p<0.05) existed in mean muscle activation between three
reaches for all four muscles being tested. The trapezius and supraspinatus muscle
28
activation increased as the reach level went from maximum to extreme and as reach
level varied from normal to extreme (Figure 4.2). EMG for the triceps and pectoralis
major increased as reach level went from normal to maximum, to extreme, and as
shown in the Figure 4.2.
Figure 4.1 % MVC of the four muscles with varying force levels.
Figure 4.2 % MVC of the four muscles with varying reach levels.
29
Humeral rotation angle effect was not found statistically significant for any of
the muscles except for triceps. External rotation (45o) caused 2.6% of MVC increase
as compared to internal rotation (-45o) for the triceps EMG.
4.2 Discussion
The purpose of this study was to investigate the effect of arm reach, push force and
humeral rotation angle on four muscle activation levels. One would think that with
increasing force and the reach, muscle activations will increase proportionately.
Similarly the muscle activations were thought to be affected by different humeral
rotation angles, but statistically EMG activities with varying angle were not found to
be significantly different for any of the shoulder muscles. Since the interaction
effects for force and reach were found to be significant, the changes in muscle
activity with the changes in force and reach levels are explained below.
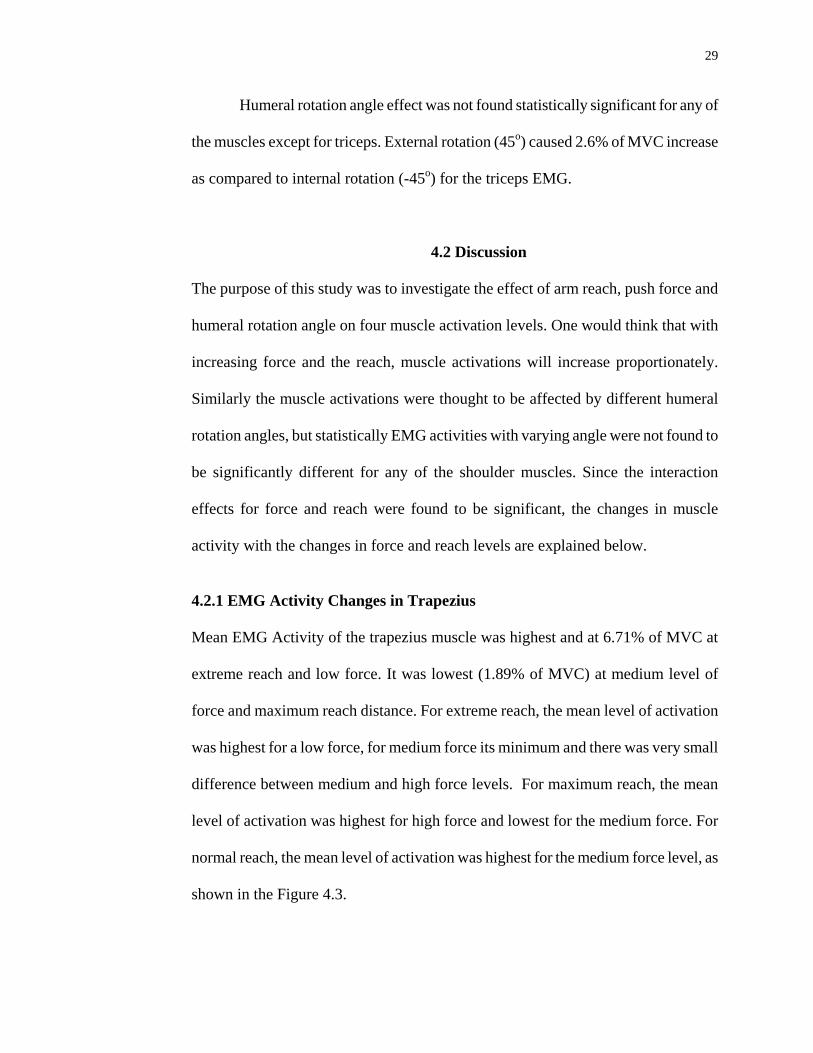
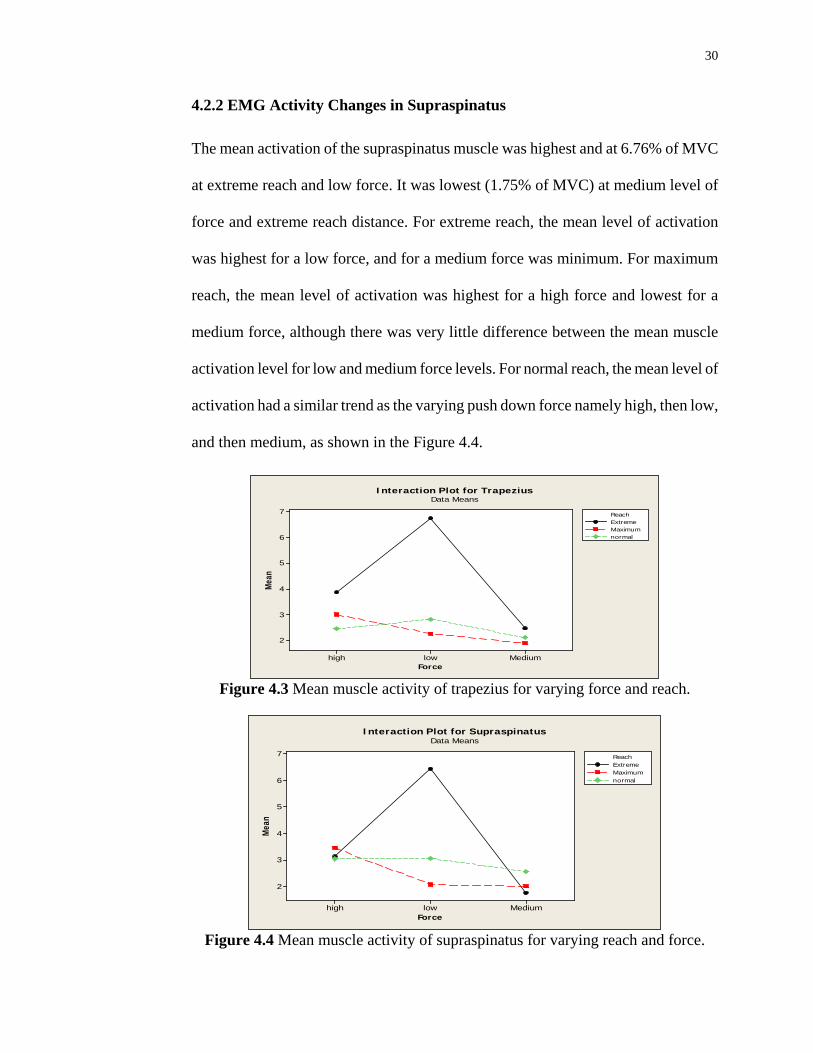
4.2.1 EMG Activity Changes in Trapezius
Mean EMG Activity of the trapezius muscle was highest and at 6.71% of MVC at
extreme reach and low force. It was lowest (1.89% of MVC) at medium level of
force and maximum reach distance. For extreme reach, the mean level of activation
was highest for a low force, for medium force its minimum and there was very small
difference between medium and high force levels. For maximum reach, the mean
level of activation was highest for high force and lowest for the medium force. For
normal reach, the mean level of activation was highest for the medium force level, as
shown in the Figure 4.3.
30
4.2.2 EMG Activity Changes in Supraspinatus
The mean activation of the supraspinatus muscle was highest and at 6.76% of MVC
at extreme reach and low force. It was lowest (1.75% of MVC) at medium level of
force and extreme reach distance. For extreme reach, the mean level of activation
was highest for a low force, and for a medium force was minimum. For maximum
reach, the mean level of activation was highest for a high force and lowest for a
medium force, although there was very little difference between the mean muscle
activation level for low and medium force levels. For normal reach, the mean level of
activation had a similar trend as the varying push down force namely high, then low,
and then medium, as shown in the Figure 4.4.
Mediumlowhigh
7
6
5
4
3
2
Force
Mean
ExtremeMaximumnormal
Reach
Interaction Plot for TrapeziusData Means
Figure 4.3 Mean muscle activity of trapezius for varying force and reach.
Mediumlowhigh
7
6
5
4
3
2
Force
Mea
n
ExtremeMaximumnormal
Reach
Interaction Plot for SupraspinatusData Means
Figure 4.4 Mean muscle activity of supraspinatus for varying reach and force.
31
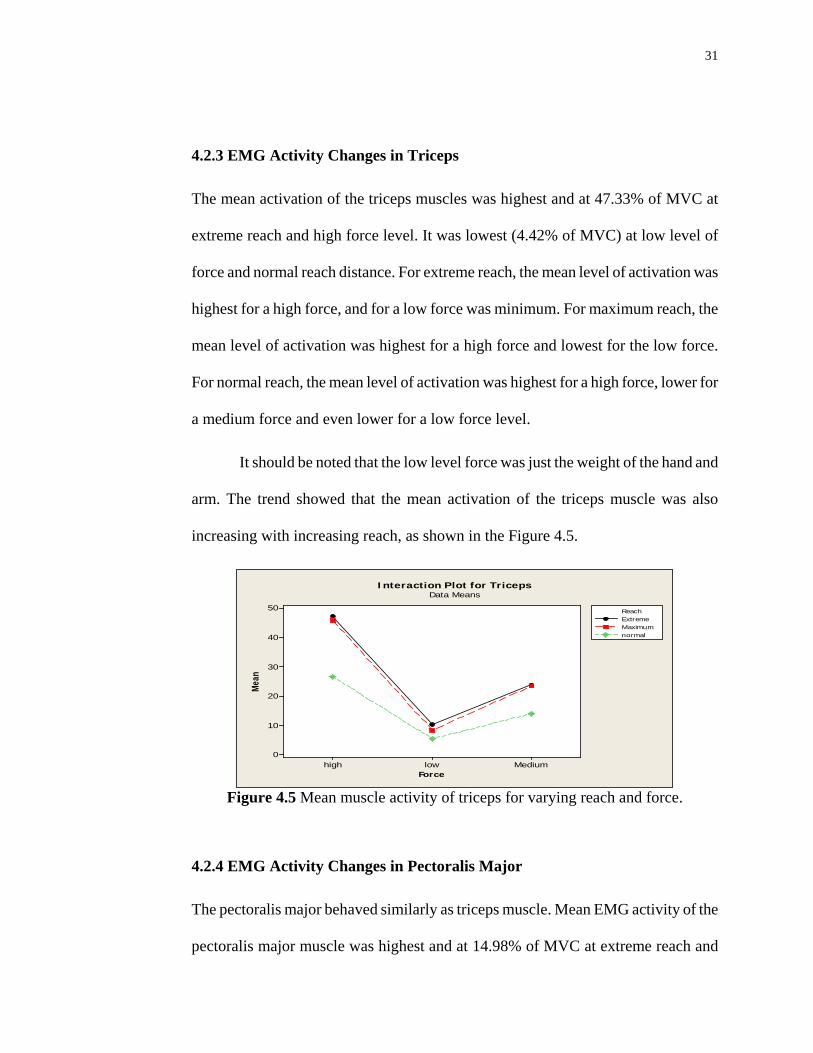
4.2.3 EMG Activity Changes in Triceps
The mean activation of the triceps muscles was highest and at 47.33% of MVC at
extreme reach and high force level. It was lowest (4.42% of MVC) at low level of
force and normal reach distance. For extreme reach, the mean level of activation was
highest for a high force, and for a low force was minimum. For maximum reach, the
mean level of activation was highest for a high force and lowest for the low force.
For normal reach, the mean level of activation was highest for a high force, lower for
a medium force and even lower for a low force level.
It should be noted that the low level force was just the weight of the hand and
arm. The trend showed that the mean activation of the triceps muscle was also
increasing with increasing reach, as shown in the Figure 4.5.
Mediumlowhigh
50
40
30
20
10
0
Force
Mean
ExtremeMaximumnormal
Reach
Interaction Plot for TricepsData Means
Figure 4.5 Mean muscle activity of triceps for varying reach and force.
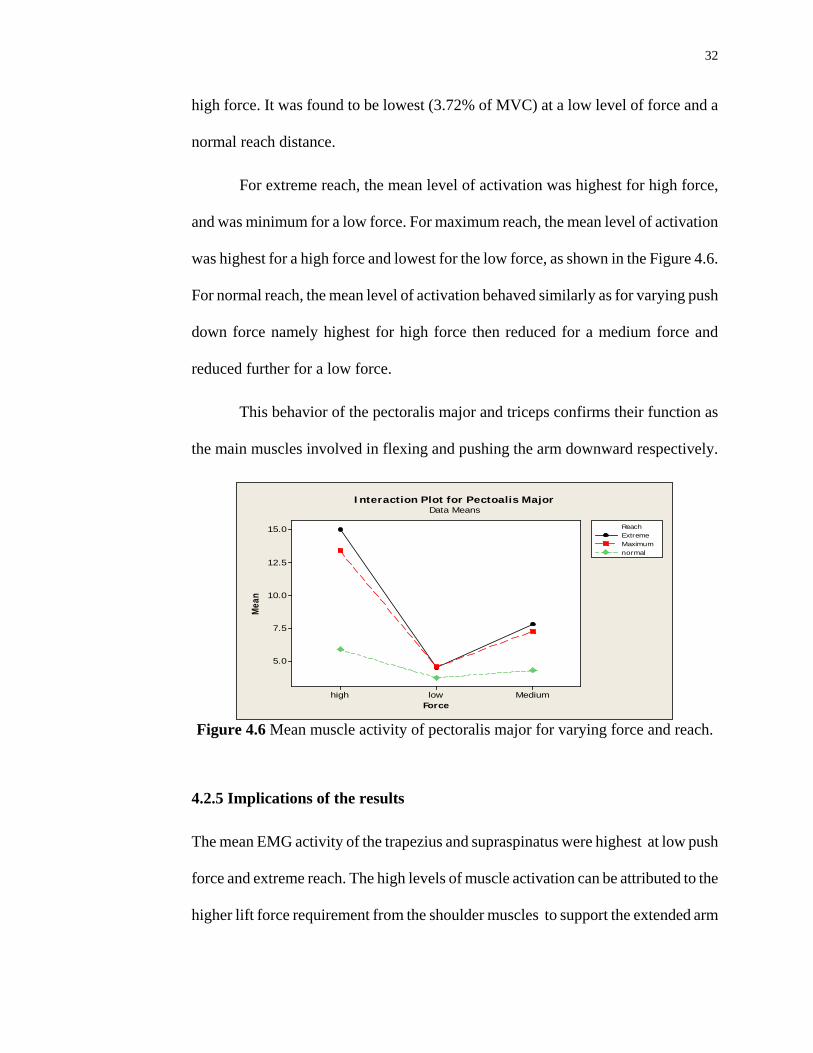
4.2.4 EMG Activity Changes in Pectoralis Major
The pectoralis major behaved similarly as triceps muscle. Mean EMG activity of the
pectoralis major muscle was highest and at 14.98% of MVC at extreme reach and
32
high force. It was found to be lowest (3.72% of MVC) at a low level of force and a
normal reach distance.
For extreme reach, the mean level of activation was highest for high force,
and was minimum for a low force. For maximum reach, the mean level of activation
was highest for a high force and lowest for the low force, as shown in the Figure 4.6.
For normal reach, the mean level of activation behaved similarly as for varying push
down force namely highest for high force then reduced for a medium force and
reduced further for a low force.
This behavior of the pectoralis major and triceps confirms their function as
the main muscles involved in flexing and pushing the arm downward respectively.
Mediumlowhigh
15.0
12.5
10.0
7.5
5.0
Force
Mea
n
ExtremeMaximumnormal
Reach
Interaction Plot for Pectoalis MajorData Means
Figure 4.6 Mean muscle activity of pectoralis major for varying force and reach.
4.2.5 Implications of the results
The mean EMG activity of the trapezius and supraspinatus were highest at low push
force and extreme reach. The high levels of muscle activation can be attributed to the
higher lift force requirement from the shoulder muscles to support the extended arm
33
(Figure 1.1a). This is one of the reasons previous studies have suggest using of some
kind of support in relieving the shoulder muscle strain (Murphy and Oliver 2011)
.Ergonomic guidelines suggest that during sub-maximal hand exertion tasks, the
shoulder muscle activation should be limited to 10%-14% of MVC for long lasting
intermittent or dynamic work. The EMG activity of the trapezius and supraspinatus
muscles for many of the experimental subjects were well above this limit, which
may be risk factor for shoulder MSD. The muscle EMG activity for triceps muscles
increased with the force increase from low to medium, to high. This result confirms
the current understanding of the function of the triceps muscle that it is primarily
involved when a downward push force is applied. The pectoralis major muscle
increased similarly with increasing force and also contributed in applying a
downward force.
The two pairs of muscles i.e. trapezius-supraspinatus and triceps-pectoralis
major showed that muscle load shifts from the first pair to the second as the reach
was increased and at extreme reach levels the former pair was most active.
Ergonomists recommend as low an arm flexion as possible to avoid risky muscle
activation levels. The Society of Diagnostic Medical Sonography (SDMS)
recommends working under 30o (Hill et al. 2007).
Results of this study imply that the arm reach should be kept within the
normal reach boundary, or as closer to the body as possible in order to avoid risky
levels of muscle activation. The study more specifically indicates that extreme
reaches should be avoided where a low push force is required. In this combination of
push force and reach distance should an arm support may be most effective.
34
These results of this study is consistent with those of previous studies.
Previous researchers emphasized a straight body posture to avoid injuries.
Vanderpool et al. (1993) reported that an upright posture correlated negatively with
back pain symptoms, since a balanced posture causes the least stress at the spinal
discs, joints, muscles, and ligaments. Similarly, Magnavita et al. (1999) concluded
that the use of a chair and upright body position were apparently protective against
neck and back pain (Burnett and Campbell-Kyureghyan 2010). Margaret et al.
(2006) also suggested that sonographers could reduce stress on their shoulders by
positioning themselves as close to clients as possible to reduce reach. They further
suggested that reach can be reduced by moving to the other side of the client, rather
than reaching across, or by re-positioning the client.
4.3 Limitations
The results of the experiment could have been more specifically related to
sonographers if the experimental tasks were performed by actual professional
sonographers with the actual set up as found in ultrasound rooms. But due to a
limitation of resources this could not be done. Further studies may be performed on
actual sonographers in a medical facility setting.
35
CHAPTER 5
CONCLUSIONS
Interaction effects between force and reach show that the scanning task performed at
farthest reach with low push force requires the highest mean trapezius and
supraspinatus muscle activity and hence are potentially more likely to cause or
enhance injuries in shoulder muscles. The second highest mean EMG activity levels
for these two muscles were generated during a maximum reach level and a high push
force. This situation is more likely to occur while scanning obese patients. This is
consistent with previous research where an increasing numbers of obese patients to
be scanned was identified as an organizational risk factor. Scanning obese patients
was also stated as one of the possible work-related risk factors that are commonly
reported (Brown and Baker. 2004).
For medium force levels, the mean EMG activity was minimum because the
hand weight counterbalanced the force required to push. EMG activity started to rise
again for these muscles as the push force was increased from medium to high level.
The study indicates that extreme reach postures should be avoided as much as
possible, especially at low push force requirements, either with engineering, or with
administrative controls. For example, the use of arm support may be beneficial for
situations where it is likely to scan at higher reach distances and low push force
requirements.
36
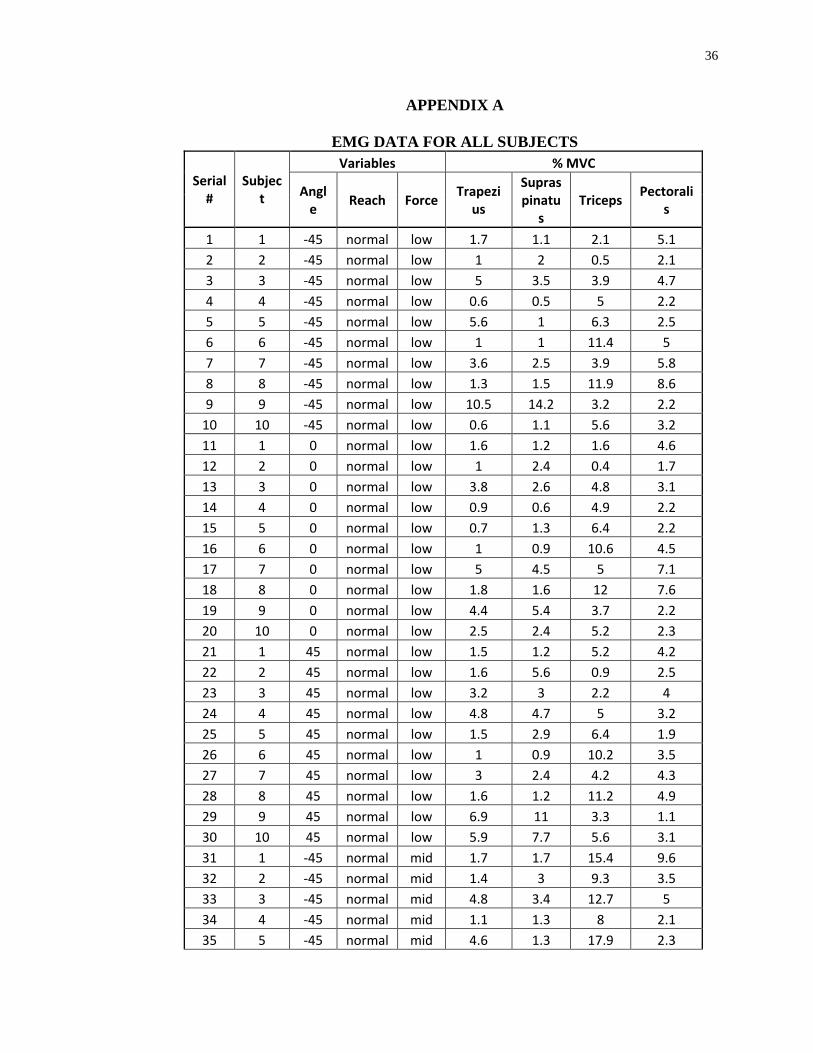
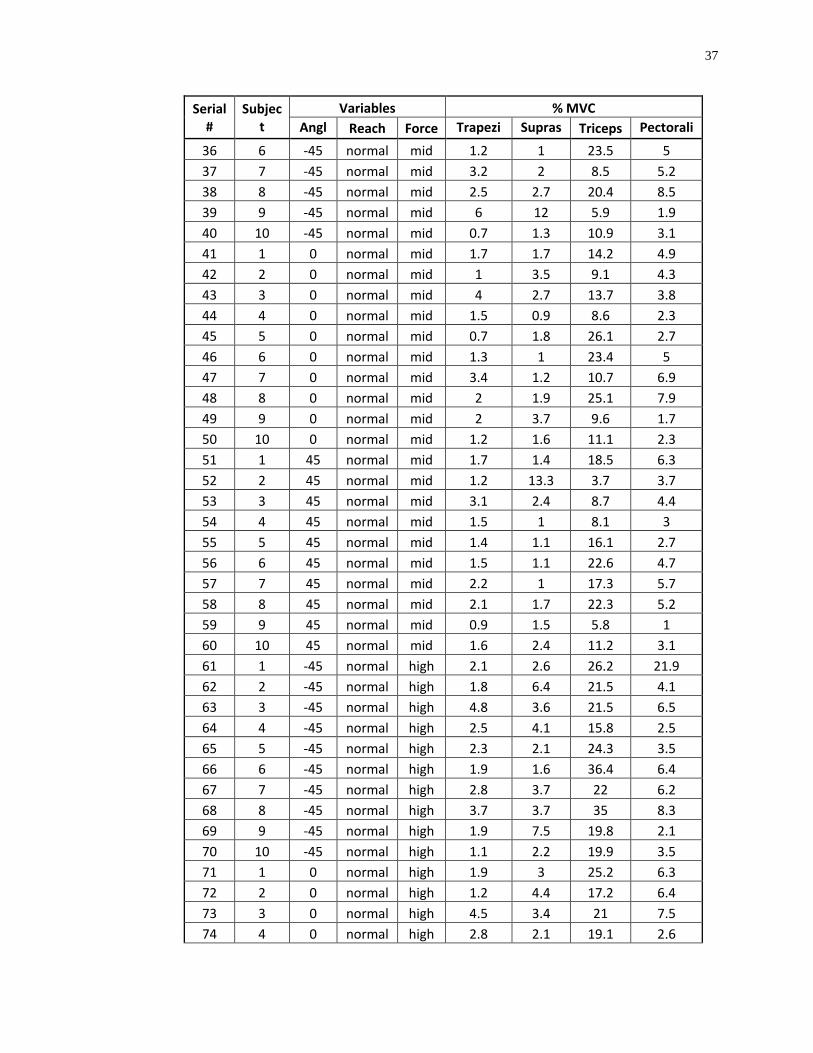
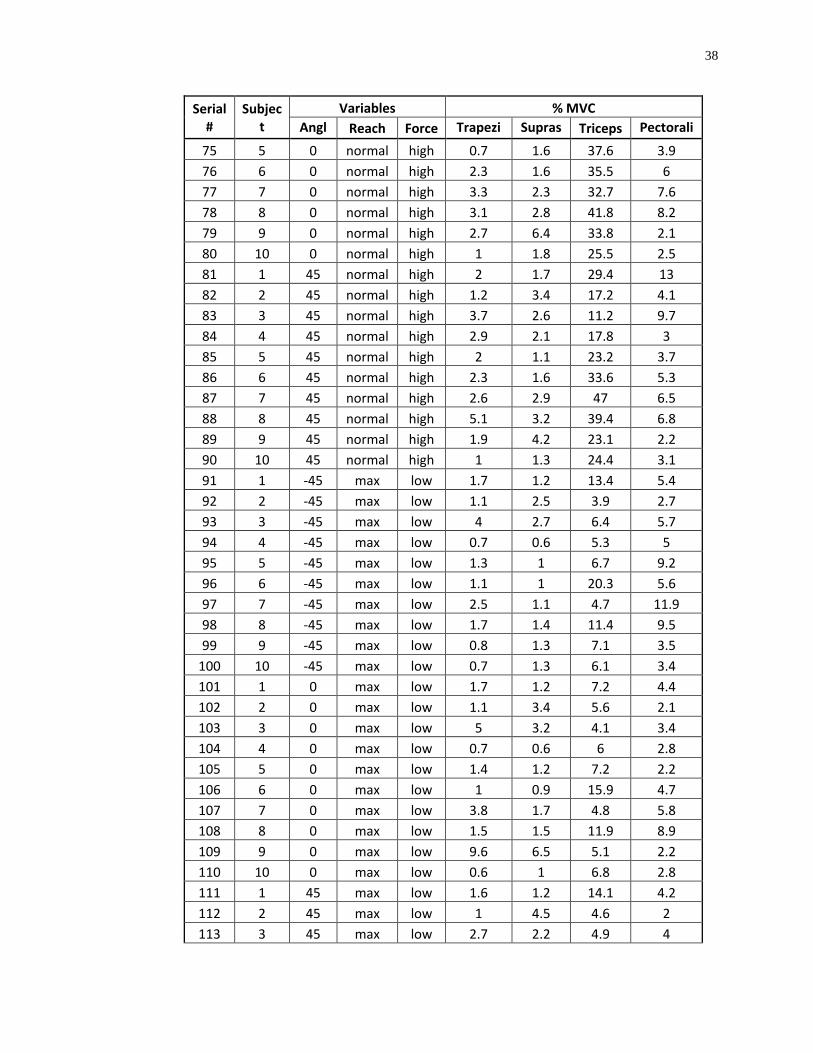
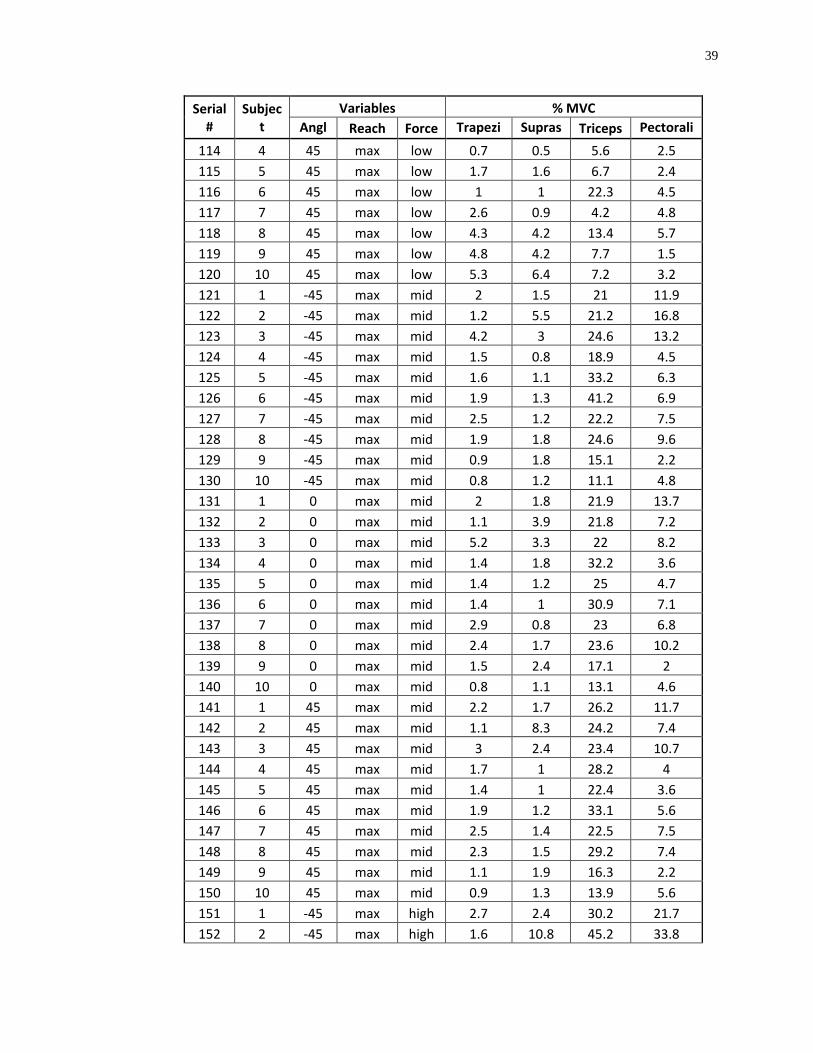
APPENDIX A
EMG DATA FOR ALL SUBJECTS
Serial #
Subject
Variables % MVC
Angle Reach Force Trapezi
us
Supraspinatu
s Triceps Pectorali
s
1 1 -45 normal low 1.7 1.1 2.1 5.1 2 2 -45 normal low 1 2 0.5 2.1 3 3 -45 normal low 5 3.5 3.9 4.7 4 4 -45 normal low 0.6 0.5 5 2.2 5 5 -45 normal low 5.6 1 6.3 2.5 6 6 -45 normal low 1 1 11.4 5 7 7 -45 normal low 3.6 2.5 3.9 5.8 8 8 -45 normal low 1.3 1.5 11.9 8.6 9 9 -45 normal low 10.5 14.2 3.2 2.2
10 10 -45 normal low 0.6 1.1 5.6 3.2 11 1 0 normal low 1.6 1.2 1.6 4.6 12 2 0 normal low 1 2.4 0.4 1.7 13 3 0 normal low 3.8 2.6 4.8 3.1 14 4 0 normal low 0.9 0.6 4.9 2.2 15 5 0 normal low 0.7 1.3 6.4 2.2 16 6 0 normal low 1 0.9 10.6 4.5 17 7 0 normal low 5 4.5 5 7.1 18 8 0 normal low 1.8 1.6 12 7.6 19 9 0 normal low 4.4 5.4 3.7 2.2 20 10 0 normal low 2.5 2.4 5.2 2.3 21 1 45 normal low 1.5 1.2 5.2 4.2 22 2 45 normal low 1.6 5.6 0.9 2.5 23 3 45 normal low 3.2 3 2.2 4 24 4 45 normal low 4.8 4.7 5 3.2 25 5 45 normal low 1.5 2.9 6.4 1.9 26 6 45 normal low 1 0.9 10.2 3.5 27 7 45 normal low 3 2.4 4.2 4.3 28 8 45 normal low 1.6 1.2 11.2 4.9 29 9 45 normal low 6.9 11 3.3 1.1 30 10 45 normal low 5.9 7.7 5.6 3.1 31 1 -45 normal mid 1.7 1.7 15.4 9.6 32 2 -45 normal mid 1.4 3 9.3 3.5 33 3 -45 normal mid 4.8 3.4 12.7 5 34 4 -45 normal mid 1.1 1.3 8 2.1 35 5 -45 normal mid 4.6 1.3 17.9 2.3
37
Serial #
Subject
Variables % MVC Angl
Reach Force Trapezi
Supras
Triceps Pectorali 36 6 -45 normal mid 1.2 1 23.5 5
37 7 -45 normal mid 3.2 2 8.5 5.2 38 8 -45 normal mid 2.5 2.7 20.4 8.5 39 9 -45 normal mid 6 12 5.9 1.9 40 10 -45 normal mid 0.7 1.3 10.9 3.1 41 1 0 normal mid 1.7 1.7 14.2 4.9 42 2 0 normal mid 1 3.5 9.1 4.3 43 3 0 normal mid 4 2.7 13.7 3.8 44 4 0 normal mid 1.5 0.9 8.6 2.3 45 5 0 normal mid 0.7 1.8 26.1 2.7 46 6 0 normal mid 1.3 1 23.4 5 47 7 0 normal mid 3.4 1.2 10.7 6.9 48 8 0 normal mid 2 1.9 25.1 7.9 49 9 0 normal mid 2 3.7 9.6 1.7 50 10 0 normal mid 1.2 1.6 11.1 2.3 51 1 45 normal mid 1.7 1.4 18.5 6.3 52 2 45 normal mid 1.2 13.3 3.7 3.7 53 3 45 normal mid 3.1 2.4 8.7 4.4 54 4 45 normal mid 1.5 1 8.1 3 55 5 45 normal mid 1.4 1.1 16.1 2.7 56 6 45 normal mid 1.5 1.1 22.6 4.7 57 7 45 normal mid 2.2 1 17.3 5.7 58 8 45 normal mid 2.1 1.7 22.3 5.2 59 9 45 normal mid 0.9 1.5 5.8 1 60 10 45 normal mid 1.6 2.4 11.2 3.1 61 1 -45 normal high 2.1 2.6 26.2 21.9 62 2 -45 normal high 1.8 6.4 21.5 4.1 63 3 -45 normal high 4.8 3.6 21.5 6.5 64 4 -45 normal high 2.5 4.1 15.8 2.5 65 5 -45 normal high 2.3 2.1 24.3 3.5 66 6 -45 normal high 1.9 1.6 36.4 6.4 67 7 -45 normal high 2.8 3.7 22 6.2 68 8 -45 normal high 3.7 3.7 35 8.3 69 9 -45 normal high 1.9 7.5 19.8 2.1 70 10 -45 normal high 1.1 2.2 19.9 3.5 71 1 0 normal high 1.9 3 25.2 6.3 72 2 0 normal high 1.2 4.4 17.2 6.4 73 3 0 normal high 4.5 3.4 21 7.5 74 4 0 normal high 2.8 2.1 19.1 2.6
38
Serial #
Subject
Variables % MVC Angl
Reach Force Trapezi
Supras
Triceps Pectorali 75 5 0 normal high 0.7 1.6 37.6 3.9
76 6 0 normal high 2.3 1.6 35.5 6 77 7 0 normal high 3.3 2.3 32.7 7.6 78 8 0 normal high 3.1 2.8 41.8 8.2 79 9 0 normal high 2.7 6.4 33.8 2.1 80 10 0 normal high 1 1.8 25.5 2.5 81 1 45 normal high 2 1.7 29.4 13 82 2 45 normal high 1.2 3.4 17.2 4.1 83 3 45 normal high 3.7 2.6 11.2 9.7 84 4 45 normal high 2.9 2.1 17.8 3 85 5 45 normal high 2 1.1 23.2 3.7 86 6 45 normal high 2.3 1.6 33.6 5.3 87 7 45 normal high 2.6 2.9 47 6.5 88 8 45 normal high 5.1 3.2 39.4 6.8 89 9 45 normal high 1.9 4.2 23.1 2.2 90 10 45 normal high 1 1.3 24.4 3.1 91 1 -45 max low 1.7 1.2 13.4 5.4 92 2 -45 max low 1.1 2.5 3.9 2.7 93 3 -45 max low 4 2.7 6.4 5.7 94 4 -45 max low 0.7 0.6 5.3 5 95 5 -45 max low 1.3 1 6.7 9.2 96 6 -45 max low 1.1 1 20.3 5.6 97 7 -45 max low 2.5 1.1 4.7 11.9 98 8 -45 max low 1.7 1.4 11.4 9.5 99 9 -45 max low 0.8 1.3 7.1 3.5
100 10 -45 max low 0.7 1.3 6.1 3.4 101 1 0 max low 1.7 1.2 7.2 4.4 102 2 0 max low 1.1 3.4 5.6 2.1 103 3 0 max low 5 3.2 4.1 3.4 104 4 0 max low 0.7 0.6 6 2.8 105 5 0 max low 1.4 1.2 7.2 2.2 106 6 0 max low 1 0.9 15.9 4.7 107 7 0 max low 3.8 1.7 4.8 5.8 108 8 0 max low 1.5 1.5 11.9 8.9 109 9 0 max low 9.6 6.5 5.1 2.2 110 10 0 max low 0.6 1 6.8 2.8 111 1 45 max low 1.6 1.2 14.1 4.2 112 2 45 max low 1 4.5 4.6 2 113 3 45 max low 2.7 2.2 4.9 4
39
Serial #
Subject
Variables % MVC Angl
Reach Force Trapezi
Supras
Triceps Pectorali 114 4 45 max low 0.7 0.5 5.6 2.5
115 5 45 max low 1.7 1.6 6.7 2.4 116 6 45 max low 1 1 22.3 4.5 117 7 45 max low 2.6 0.9 4.2 4.8 118 8 45 max low 4.3 4.2 13.4 5.7 119 9 45 max low 4.8 4.2 7.7 1.5 120 10 45 max low 5.3 6.4 7.2 3.2 121 1 -45 max mid 2 1.5 21 11.9 122 2 -45 max mid 1.2 5.5 21.2 16.8 123 3 -45 max mid 4.2 3 24.6 13.2 124 4 -45 max mid 1.5 0.8 18.9 4.5 125 5 -45 max mid 1.6 1.1 33.2 6.3 126 6 -45 max mid 1.9 1.3 41.2 6.9 127 7 -45 max mid 2.5 1.2 22.2 7.5 128 8 -45 max mid 1.9 1.8 24.6 9.6 129 9 -45 max mid 0.9 1.8 15.1 2.2 130 10 -45 max mid 0.8 1.2 11.1 4.8 131 1 0 max mid 2 1.8 21.9 13.7 132 2 0 max mid 1.1 3.9 21.8 7.2 133 3 0 max mid 5.2 3.3 22 8.2 134 4 0 max mid 1.4 1.8 32.2 3.6 135 5 0 max mid 1.4 1.2 25 4.7 136 6 0 max mid 1.4 1 30.9 7.1 137 7 0 max mid 2.9 0.8 23 6.8 138 8 0 max mid 2.4 1.7 23.6 10.2 139 9 0 max mid 1.5 2.4 17.1 2 140 10 0 max mid 0.8 1.1 13.1 4.6 141 1 45 max mid 2.2 1.7 26.2 11.7 142 2 45 max mid 1.1 8.3 24.2 7.4 143 3 45 max mid 3 2.4 23.4 10.7 144 4 45 max mid 1.7 1 28.2 4 145 5 45 max mid 1.4 1 22.4 3.6 146 6 45 max mid 1.9 1.2 33.1 5.6 147 7 45 max mid 2.5 1.4 22.5 7.5 148 8 45 max mid 2.3 1.5 29.2 7.4 149 9 45 max mid 1.1 1.9 16.3 2.2 150 10 45 max mid 0.9 1.3 13.9 5.6 151 1 -45 max high 2.7 2.4 30.2 21.7 152 2 -45 max high 1.6 10.8 45.2 33.8
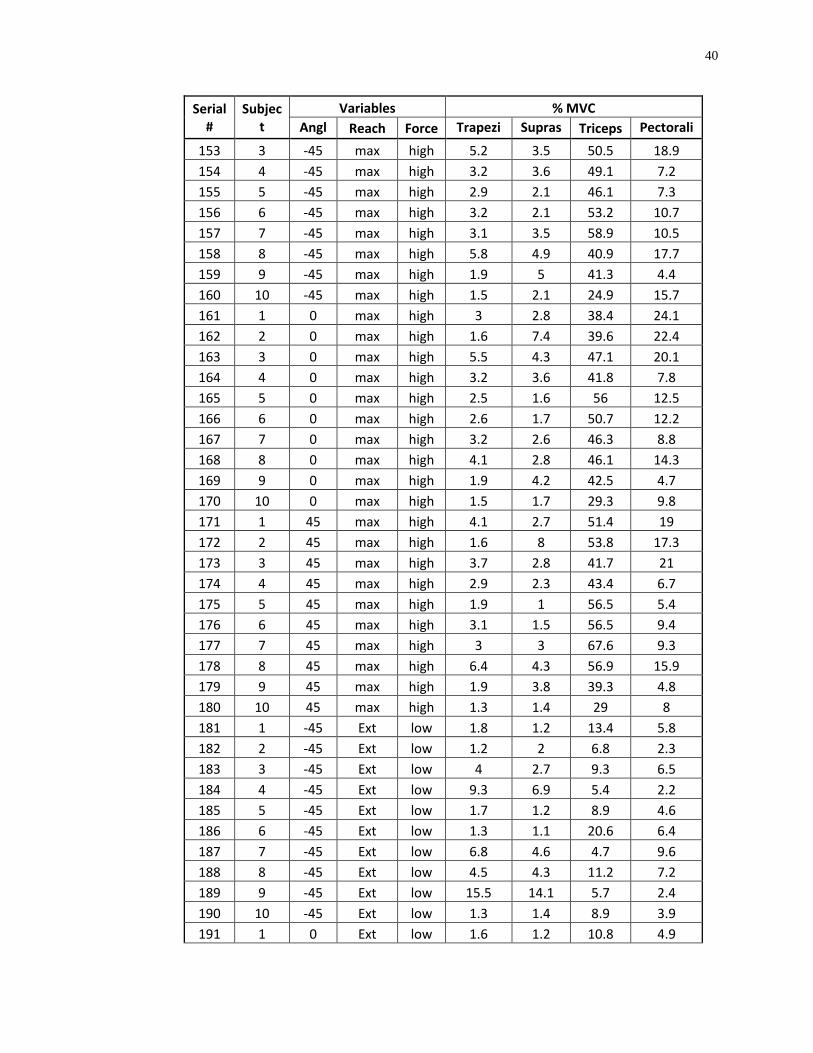
40
Serial #
Subject
Variables % MVC Angl
Reach Force Trapezi
Supras
Triceps Pectorali 153 3 -45 max high 5.2 3.5 50.5 18.9
154 4 -45 max high 3.2 3.6 49.1 7.2 155 5 -45 max high 2.9 2.1 46.1 7.3 156 6 -45 max high 3.2 2.1 53.2 10.7 157 7 -45 max high 3.1 3.5 58.9 10.5 158 8 -45 max high 5.8 4.9 40.9 17.7 159 9 -45 max high 1.9 5 41.3 4.4 160 10 -45 max high 1.5 2.1 24.9 15.7 161 1 0 max high 3 2.8 38.4 24.1 162 2 0 max high 1.6 7.4 39.6 22.4 163 3 0 max high 5.5 4.3 47.1 20.1 164 4 0 max high 3.2 3.6 41.8 7.8 165 5 0 max high 2.5 1.6 56 12.5 166 6 0 max high 2.6 1.7 50.7 12.2 167 7 0 max high 3.2 2.6 46.3 8.8 168 8 0 max high 4.1 2.8 46.1 14.3 169 9 0 max high 1.9 4.2 42.5 4.7 170 10 0 max high 1.5 1.7 29.3 9.8 171 1 45 max high 4.1 2.7 51.4 19 172 2 45 max high 1.6 8 53.8 17.3 173 3 45 max high 3.7 2.8 41.7 21 174 4 45 max high 2.9 2.3 43.4 6.7 175 5 45 max high 1.9 1 56.5 5.4 176 6 45 max high 3.1 1.5 56.5 9.4 177 7 45 max high 3 3 67.6 9.3 178 8 45 max high 6.4 4.3 56.9 15.9 179 9 45 max high 1.9 3.8 39.3 4.8 180 10 45 max high 1.3 1.4 29 8 181 1 -45 Ext low 1.8 1.2 13.4 5.8 182 2 -45 Ext low 1.2 2 6.8 2.3 183 3 -45 Ext low 4 2.7 9.3 6.5 184 4 -45 Ext low 9.3 6.9 5.4 2.2 185 5 -45 Ext low 1.7 1.2 8.9 4.6 186 6 -45 Ext low 1.3 1.1 20.6 6.4 187 7 -45 Ext low 6.8 4.6 4.7 9.6 188 8 -45 Ext low 4.5 4.3 11.2 7.2 189 9 -45 Ext low 15.5 14.1 5.7 2.4 190 10 -45 Ext low 1.3 1.4 8.9 3.9 191 1 0 Ext low 1.6 1.2 10.8 4.9
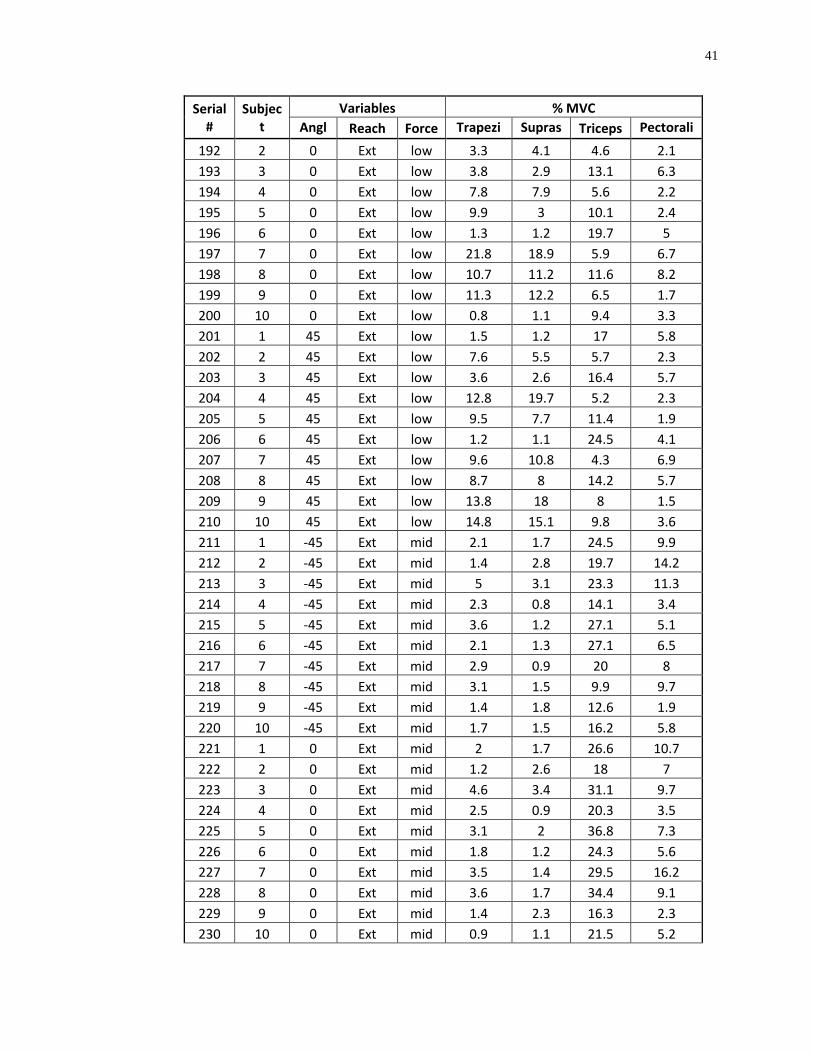
41
Serial #
Subject
Variables % MVC Angl
Reach Force Trapezi
Supras
Triceps Pectorali 192 2 0 Ext low 3.3 4.1 4.6 2.1
193 3 0 Ext low 3.8 2.9 13.1 6.3 194 4 0 Ext low 7.8 7.9 5.6 2.2 195 5 0 Ext low 9.9 3 10.1 2.4 196 6 0 Ext low 1.3 1.2 19.7 5 197 7 0 Ext low 21.8 18.9 5.9 6.7 198 8 0 Ext low 10.7 11.2 11.6 8.2 199 9 0 Ext low 11.3 12.2 6.5 1.7 200 10 0 Ext low 0.8 1.1 9.4 3.3 201 1 45 Ext low 1.5 1.2 17 5.8 202 2 45 Ext low 7.6 5.5 5.7 2.3 203 3 45 Ext low 3.6 2.6 16.4 5.7 204 4 45 Ext low 12.8 19.7 5.2 2.3 205 5 45 Ext low 9.5 7.7 11.4 1.9 206 6 45 Ext low 1.2 1.1 24.5 4.1 207 7 45 Ext low 9.6 10.8 4.3 6.9 208 8 45 Ext low 8.7 8 14.2 5.7 209 9 45 Ext low 13.8 18 8 1.5 210 10 45 Ext low 14.8 15.1 9.8 3.6 211 1 -45 Ext mid 2.1 1.7 24.5 9.9 212 2 -45 Ext mid 1.4 2.8 19.7 14.2 213 3 -45 Ext mid 5 3.1 23.3 11.3 214 4 -45 Ext mid 2.3 0.8 14.1 3.4 215 5 -45 Ext mid 3.6 1.2 27.1 5.1 216 6 -45 Ext mid 2.1 1.3 27.1 6.5 217 7 -45 Ext mid 2.9 0.9 20 8 218 8 -45 Ext mid 3.1 1.5 9.9 9.7 219 9 -45 Ext mid 1.4 1.8 12.6 1.9 220 10 -45 Ext mid 1.7 1.5 16.2 5.8 221 1 0 Ext mid 2 1.7 26.6 10.7 222 2 0 Ext mid 1.2 2.6 18 7 223 3 0 Ext mid 4.6 3.4 31.1 9.7 224 4 0 Ext mid 2.5 0.9 20.3 3.5 225 5 0 Ext mid 3.1 2 36.8 7.3 226 6 0 Ext mid 1.8 1.2 24.3 5.6 227 7 0 Ext mid 3.5 1.4 29.5 16.2 228 8 0 Ext mid 3.6 1.7 34.4 9.1 229 9 0 Ext mid 1.4 2.3 16.3 2.3 230 10 0 Ext mid 0.9 1.1 21.5 5.2
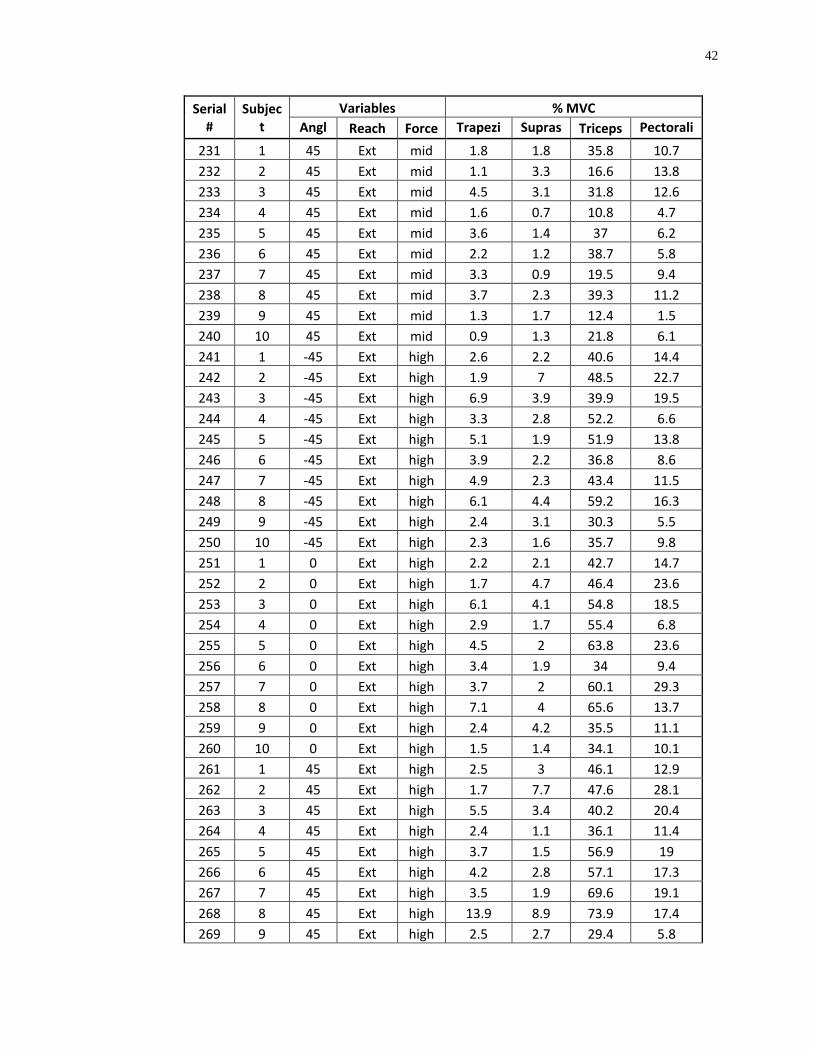
42
Serial #
Subject
Variables % MVC Angl
Reach Force Trapezi
Supras
Triceps Pectorali 231 1 45 Ext mid 1.8 1.8 35.8 10.7
232 2 45 Ext mid 1.1 3.3 16.6 13.8 233 3 45 Ext mid 4.5 3.1 31.8 12.6 234 4 45 Ext mid 1.6 0.7 10.8 4.7 235 5 45 Ext mid 3.6 1.4 37 6.2 236 6 45 Ext mid 2.2 1.2 38.7 5.8 237 7 45 Ext mid 3.3 0.9 19.5 9.4 238 8 45 Ext mid 3.7 2.3 39.3 11.2 239 9 45 Ext mid 1.3 1.7 12.4 1.5 240 10 45 Ext mid 0.9 1.3 21.8 6.1 241 1 -45 Ext high 2.6 2.2 40.6 14.4 242 2 -45 Ext high 1.9 7 48.5 22.7 243 3 -45 Ext high 6.9 3.9 39.9 19.5 244 4 -45 Ext high 3.3 2.8 52.2 6.6 245 5 -45 Ext high 5.1 1.9 51.9 13.8 246 6 -45 Ext high 3.9 2.2 36.8 8.6 247 7 -45 Ext high 4.9 2.3 43.4 11.5 248 8 -45 Ext high 6.1 4.4 59.2 16.3 249 9 -45 Ext high 2.4 3.1 30.3 5.5 250 10 -45 Ext high 2.3 1.6 35.7 9.8 251 1 0 Ext high 2.2 2.1 42.7 14.7 252 2 0 Ext high 1.7 4.7 46.4 23.6 253 3 0 Ext high 6.1 4.1 54.8 18.5 254 4 0 Ext high 2.9 1.7 55.4 6.8 255 5 0 Ext high 4.5 2 63.8 23.6 256 6 0 Ext high 3.4 1.9 34 9.4 257 7 0 Ext high 3.7 2 60.1 29.3 258 8 0 Ext high 7.1 4 65.6 13.7 259 9 0 Ext high 2.4 4.2 35.5 11.1 260 10 0 Ext high 1.5 1.4 34.1 10.1 261 1 45 Ext high 2.5 3 46.1 12.9 262 2 45 Ext high 1.7 7.7 47.6 28.1 263 3 45 Ext high 5.5 3.4 40.2 20.4 264 4 45 Ext high 2.4 1.1 36.1 11.4 265 5 45 Ext high 3.7 1.5 56.9 19 266 6 45 Ext high 4.2 2.8 57.1 17.3 267 7 45 Ext high 3.5 1.9 69.6 19.1 268 8 45 Ext high 13.9 8.9 73.9 17.4 269 9 45 Ext high 2.5 2.7 29.4 5.8
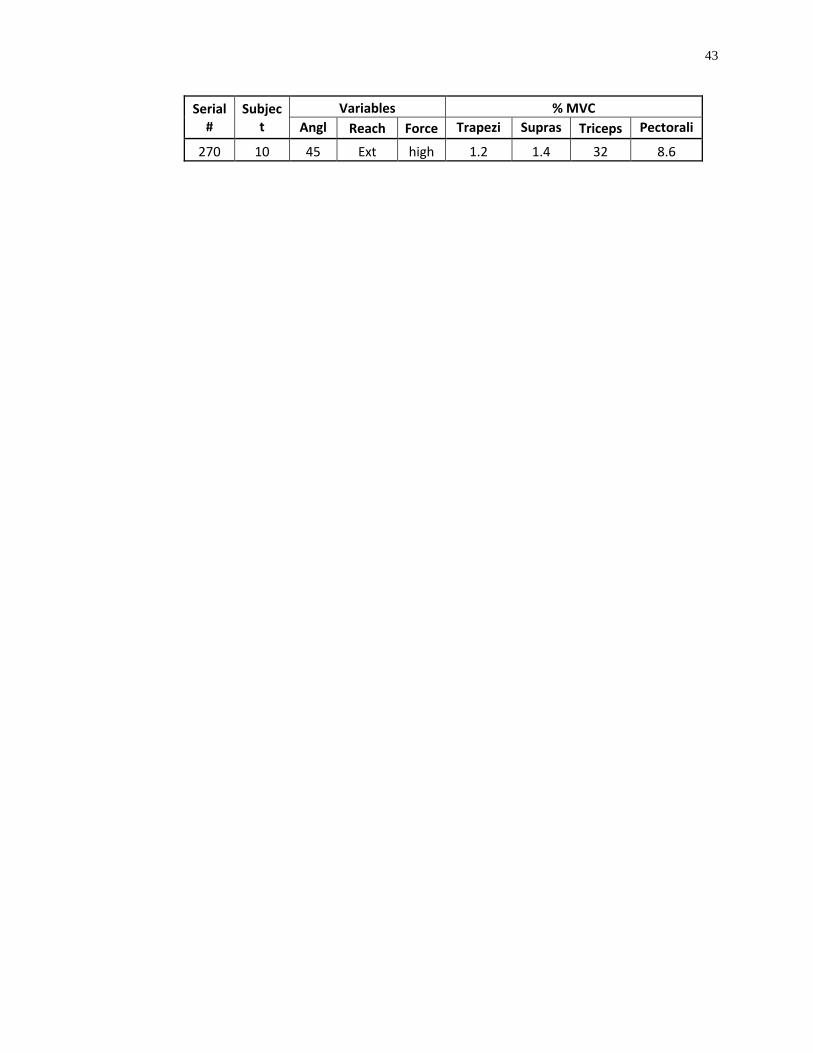
43
Serial #
Subject
Variables % MVC Angl
Reach Force Trapezi
Supras
Triceps Pectorali 270 10 45 Ext high 1.2 1.4 32 8.6
44
APPENDIX B
MINITAB OUTPUT
General Linear Model: Supraspinatu, Trapezius, ... versus Subject, Angle, ... Factor Type Levels Values Subject random 10 1, 2, 3, 4, 5, 6, 7, 8, 9, 10 Angle fixed 3 -45, 0, 45 Reach fixed 3 Extreme, Maximum, normal Force fixed 3 high, low, Medium Analysis of Variance for Supraspinatus, using Adjusted SS for Tests Source DF Seq SS Adj SS Adj MS F P Subject 9 502.773 502.773 55.864 9.79 0.000 Angle 2 23.863 23.863 11.931 2.09 0.126 Reach 2 76.085 76.085 38.042 6.66 0.002 Force 2 141.261 141.261 70.630 12.37 0.000 Angle*Reach 4 36.917 36.917 9.229 1.62 0.171 Angle*Force 4 82.746 82.746 20.687 3.62 0.007 Reach*Force 4 250.525 250.525 62.631 10.97 0.000 Angle*Reach*Force 8 28.322 28.322 3.540 0.62 0.761 Error 234 1335.862 1335.862 5.709 Total 269 2478.353 S = 2.38931 R-Sq = 46.10% R-Sq(adj) = 38.04% Unusual Observations for Supraspinatus Obs Supraspinatus Fit SE Fit Residual St Resid 21 1.2000 7.7022 0.8725 -6.5022 -2.92 R 35 10.8000 6.0581 0.8725 4.7419 2.13 R 48 5.5000 11.0281 0.8725 -5.5281 -2.49 R 49 13.3000 4.7481 0.8725 8.5519 3.84 R 75 2.6000 9.0207 0.8725 -6.4207 -2.89 R 102 19.7000 8.6800 0.8725 11.0200 4.95 R 156 1.1000 7.2652 0.8725 -6.1652 -2.77 R 174 18.9000 6.3689 0.8725 12.5311 5.63 R 201 11.2000 6.6763 0.8725 4.5237 2.03 R 216 8.9000 3.7463 0.8725 5.1537 2.32 R 217 14.2000 5.6056 0.8725 8.5944 3.86 R 219 14.1000 6.7156 0.8725 7.3844 3.32 R 220 12.0000 5.7356 0.8725 6.2644 2.82 R 235 18.0000 11.7356 0.8725 6.2644 2.82 R 255 1.1000 5.7319 0.8725 -4.6319 -2.08 R 264 15.1000 8.3319 0.8725 6.7681 3.04 R R denotes an observation with a large standardized residual. Analysis of Variance for Trapezius, using Adjusted SS for Tests Source DF Seq SS Adj SS Adj MS F P
45
Subject 9 312.112 312.112 34.679 7.24 0.000 Angle 2 6.662 6.662 3.331 0.70 0.500 Reach 2 227.858 227.858 113.929 23.79 0.000 Force 2 144.162 144.162 72.081 15.05 0.000 Angle*Reach 4 22.269 22.269 5.567 1.16 0.328 Angle*Force 4 32.619 32.619 8.155 1.70 0.150 Reach*Force 4 169.682 169.682 42.420 8.86 0.000 Angle*Reach*Force 8 25.423 25.423 3.178 0.66 0.723 Error 234 1120.520 1120.520 4.789 Total 269 2061.306 S = 2.18827 R-Sq = 45.64% R-Sq(adj) = 37.51% Unusual Observations for Trapezius Obs Trapezius Fit SE Fit Residual St Resid 12 1.6000 6.1989 0.7990 -4.5989 -2.26 R 21 1.5000 7.2789 0.7990 -5.7789 -2.84 R 66 3.8000 8.5841 0.7990 -4.7841 -2.35 R 75 3.6000 9.6641 0.7990 -6.0641 -2.98 R 84 9.3000 4.6163 0.7990 4.6837 2.30 R 102 12.8000 8.1863 0.7990 4.6137 2.26 R 147 1.3000 6.0915 0.7990 -4.7915 -2.35 R 156 1.2000 7.1715 0.7990 -5.9715 -2.93 R 174 21.8000 8.4285 0.7990 13.3715 6.56 R 216 13.9000 5.3011 0.7990 8.5989 4.22 R 217 10.5000 4.2293 0.7990 6.2707 3.08 R 219 15.5000 5.8793 0.7990 9.6207 4.72 R 227 9.6000 3.7793 0.7990 5.8207 2.86 R 235 13.8000 9.4493 0.7990 4.3507 2.14 R 255 0.8000 6.1767 0.7990 -5.3767 -2.64 R 264 14.8000 7.2567 0.7990 7.5433 3.70 R R denotes an observation with a large standardized residual. Analysis of Variance for Triceps, using Adjusted SS for Tests Source DF Seq SS Adj SS Adj MS F P Subject 9 5878.2 5878.2 653.1 16.85 0.000 Angle 2 328.2 328.2 164.1 4.23 0.016 Reach 2 7597.3 7597.3 3798.6 98.01 0.000 Force 2 46518.4 46518.4 23259.2 600.13 0.000 Angle*Reach 4 265.7 265.7 66.4 1.71 0.148 Angle*Force 4 140.4 140.4 35.1 0.91 0.461 Reach*Force 4 2662.2 2662.2 665.6 17.17 0.000 Angle*Reach*Force 8 141.5 141.5 17.7 0.46 0.886 Error 234 9069.1 9069.1 38.8 Total 269 72601.0 S = 6.22551 R-Sq = 87.51% R-Sq(adj) = 85.64% Unusual Observations for Triceps Obs Triceps Fit SE Fit Residual St Resid 8 30.2000 44.1726 2.2732 -13.9726 -2.41 R 79 11.2000 25.4837 2.2732 -14.2837 -2.46 R 95 32.2000 19.8248 2.2732 12.3752 2.14 R 105 10.8000 23.1348 2.2732 -12.3348 -2.13 R
46
144 36.8000 51.2148 2.2732 -14.4148 -2.49 R 153 34.0000 56.6048 2.2732 -22.6048 -3.90 R 170 58.9000 45.7800 2.2732 13.1200 2.26 R 187 47.0000 28.3800 2.2732 18.6200 3.21 R 188 67.6000 51.3600 2.2732 16.2400 2.80 R 189 69.6000 50.6400 2.2732 18.9600 3.27 R 195 9.9000 26.1593 2.2732 -16.2593 -2.81 R 216 73.9000 55.5993 2.2732 18.3007 3.16 R 243 29.4000 43.0067 2.2732 -13.6067 -2.35 R 251 24.9000 37.9170 2.2732 -13.0170 -2.25 R 269 29.0000 43.4970 2.2732 -14.4970 -2.50 R R denotes an observation with a large standardized residual. Analysis of Variance for Pectoalis Major, using Adjusted SS for Tests Source DF Seq SS Adj SS Adj MS F P Subject 9 1807.73 1807.73 200.86 19.05 0.000 Angle 2 29.74 29.74 14.87 1.41 0.246 Reach 2 1042.64 1042.64 521.32 49.45 0.000 Force 2 2427.39 2427.39 1213.69 115.12 0.000 Angle*Reach 4 94.80 94.80 23.70 2.25 0.065 Angle*Force 4 21.96 21.96 5.49 0.52 0.721 Reach*Force 4 615.10 615.10 153.78 14.59 0.000 Angle*Reach*Force 8 53.49 53.49 6.69 0.63 0.749 Error 234 2467.08 2467.08 10.54 Total 269 8559.95 S = 3.24701 R-Sq = 71.18% R-Sq(adj) = 66.87% Unusual Observations for Pectoalis Major Pectoalis Obs Major Fit SE Fit Residual St Resid 7 21.9000 9.5770 1.1856 12.3230 4.08 R 17 24.1000 16.7470 1.1856 7.3530 2.43 R 27 12.9000 19.0770 1.1856 -6.1770 -2.04 R 32 16.8000 10.6470 1.1856 6.1530 2.04 R 35 33.8000 17.0670 1.1856 16.7330 5.54 R 36 22.7000 15.1470 1.1856 7.5530 2.50 R 44 22.4000 15.9470 1.1856 6.4530 2.13 R 54 28.1000 18.2770 1.1856 9.8230 3.25 R 80 21.0000 14.1126 1.1856 6.8874 2.28 R 116 7.3000 13.4633 1.1856 -6.1633 -2.04 R 126 23.6000 14.7533 1.1856 8.8467 2.93 R 177 16.2000 9.3704 1.1856 6.8296 2.26 R 179 8.8000 15.3804 1.1856 -6.5804 -2.18 R 180 29.3000 17.7904 1.1856 11.5096 3.81 R R denotes an observation with a large standardized residual. Tukey 95.0% Simultaneous Confidence Intervals Response Variable Supraspinatus All Pairwise Comparisons among Levels of Angle Angle = -45 subtracted from: Angle Lower Center Upper --+---------+---------+---------+---- 0 -0.8534 -0.01222 0.8290 (-----------*-----------) 45 -0.2168 0.62444 1.4656 (-----------*-----------)
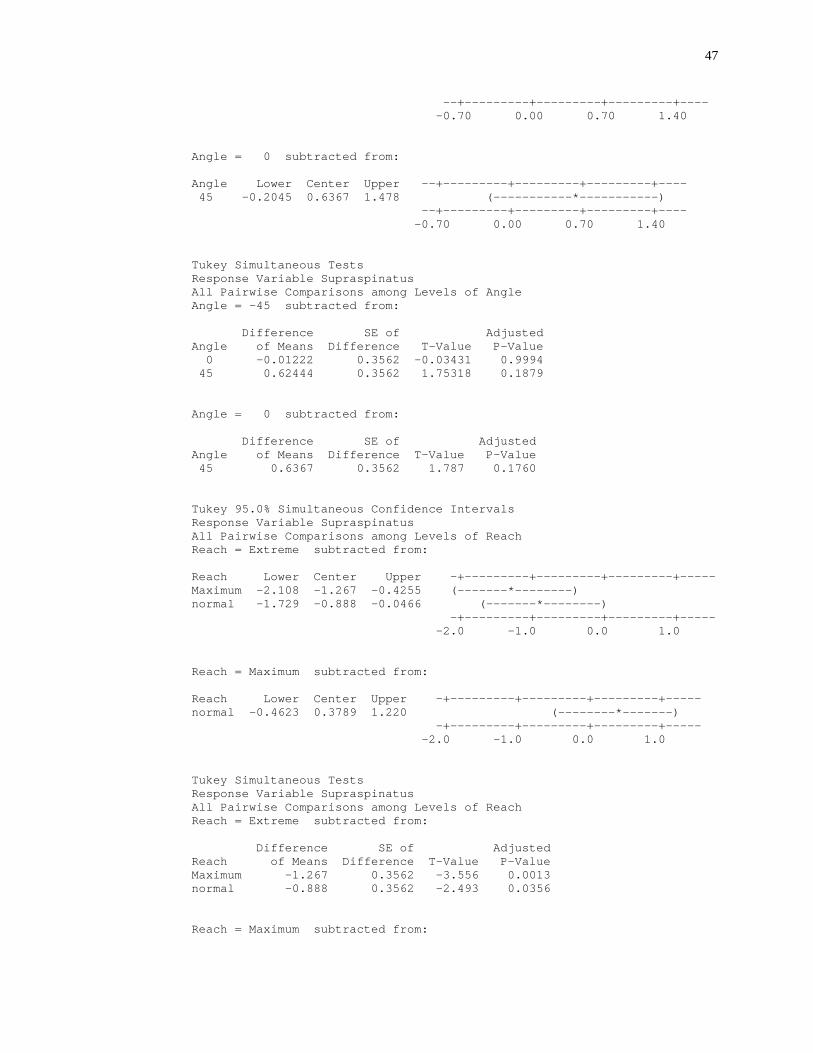
47
--+---------+---------+---------+---- -0.70 0.00 0.70 1.40 Angle = 0 subtracted from: Angle Lower Center Upper --+---------+---------+---------+---- 45 -0.2045 0.6367 1.478 (-----------*-----------) --+---------+---------+---------+---- -0.70 0.00 0.70 1.40 Tukey Simultaneous Tests Response Variable Supraspinatus All Pairwise Comparisons among Levels of Angle Angle = -45 subtracted from: Difference SE of Adjusted Angle of Means Difference T-Value P-Value 0 -0.01222 0.3562 -0.03431 0.9994 45 0.62444 0.3562 1.75318 0.1879 Angle = 0 subtracted from: Difference SE of Adjusted Angle of Means Difference T-Value P-Value 45 0.6367 0.3562 1.787 0.1760 Tukey 95.0% Simultaneous Confidence Intervals Response Variable Supraspinatus All Pairwise Comparisons among Levels of Reach Reach = Extreme subtracted from: Reach Lower Center Upper -+---------+---------+---------+----- Maximum -2.108 -1.267 -0.4255 (-------*--------) normal -1.729 -0.888 -0.0466 (-------*--------) -+---------+---------+---------+----- -2.0 -1.0 0.0 1.0 Reach = Maximum subtracted from: Reach Lower Center Upper -+---------+---------+---------+----- normal -0.4623 0.3789 1.220 (--------*-------) -+---------+---------+---------+----- -2.0 -1.0 0.0 1.0 Tukey Simultaneous Tests Response Variable Supraspinatus All Pairwise Comparisons among Levels of Reach Reach = Extreme subtracted from: Difference SE of Adjusted Reach of Means Difference T-Value P-Value Maximum -1.267 0.3562 -3.556 0.0013 normal -0.888 0.3562 -2.493 0.0356 Reach = Maximum subtracted from:
48
Difference SE of Adjusted Reach of Means Difference T-Value P-Value normal 0.3789 0.3562 1.064 0.5375 Tukey 95.0% Simultaneous Confidence Intervals Response Variable Supraspinatus All Pairwise Comparisons among Levels of Force Force = high subtracted from: Force Lower Center Upper --+---------+---------+---------+---- low -0.192 0.649 1.4901 (------*------) Medium -1.945 -1.103 -0.2621 (------*------) --+---------+---------+---------+---- -2.4 -1.2 0.0 1.2 Force = low subtracted from: Force Lower Center Upper --+---------+---------+---------+---- Medium -2.593 -1.752 -0.9110 (------*------) --+---------+---------+---------+---- -2.4 -1.2 0.0 1.2 Tukey Simultaneous Tests Response Variable Supraspinatus All Pairwise Comparisons among Levels of Force Force = high subtracted from: Difference SE of Adjusted Force of Means Difference T-Value P-Value low 0.649 0.3562 1.822 0.1647 Medium -1.103 0.3562 -3.098 0.0062 Force = low subtracted from: Difference SE of Adjusted Force of Means Difference T-Value P-Value Medium -1.752 0.3562 -4.920 0.0000 Tukey 95.0% Simultaneous Confidence Intervals Response Variable Trapezius All Pairwise Comparisons among Levels of Angle Angle = -45 subtracted from: Angle Lower Center Upper ---+---------+---------+---------+--- 0 -0.6326 0.1378 0.9082 (---------------*--------------) 45 -0.3904 0.3800 1.1504 (---------------*--------------) ---+---------+---------+---------+--- -0.50 0.00 0.50 1.00 Angle = 0 subtracted from: Angle Lower Center Upper ---+---------+---------+---------+--- 45 -0.5282 0.2422 1.013 (---------------*--------------) ---+---------+---------+---------+--- -0.50 0.00 0.50 1.00
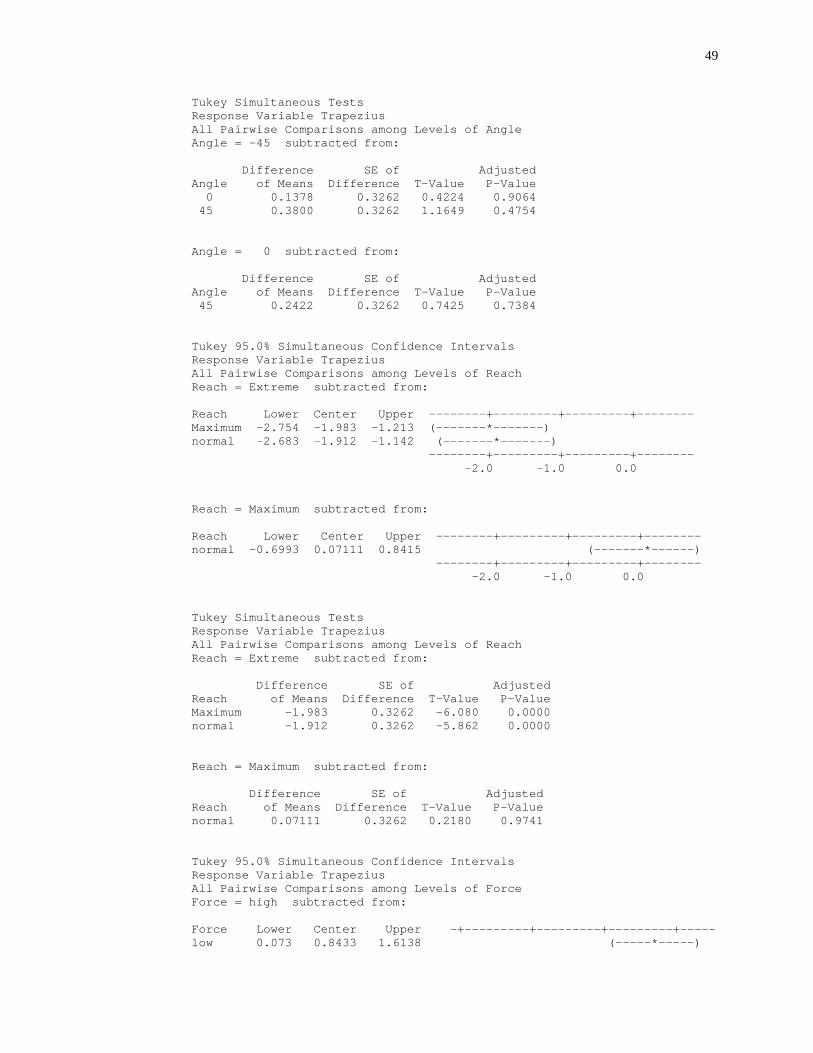
49
Tukey Simultaneous Tests Response Variable Trapezius All Pairwise Comparisons among Levels of Angle Angle = -45 subtracted from: Difference SE of Adjusted Angle of Means Difference T-Value P-Value 0 0.1378 0.3262 0.4224 0.9064 45 0.3800 0.3262 1.1649 0.4754 Angle = 0 subtracted from: Difference SE of Adjusted Angle of Means Difference T-Value P-Value 45 0.2422 0.3262 0.7425 0.7384 Tukey 95.0% Simultaneous Confidence Intervals Response Variable Trapezius All Pairwise Comparisons among Levels of Reach Reach = Extreme subtracted from: Reach Lower Center Upper --------+---------+---------+-------- Maximum -2.754 -1.983 -1.213 (-------*-------) normal -2.683 -1.912 -1.142 (-------*-------) --------+---------+---------+-------- -2.0 -1.0 0.0 Reach = Maximum subtracted from: Reach Lower Center Upper --------+---------+---------+-------- normal -0.6993 0.07111 0.8415 (-------*------) --------+---------+---------+-------- -2.0 -1.0 0.0 Tukey Simultaneous Tests Response Variable Trapezius All Pairwise Comparisons among Levels of Reach Reach = Extreme subtracted from: Difference SE of Adjusted Reach of Means Difference T-Value P-Value Maximum -1.983 0.3262 -6.080 0.0000 normal -1.912 0.3262 -5.862 0.0000 Reach = Maximum subtracted from: Difference SE of Adjusted Reach of Means Difference T-Value P-Value normal 0.07111 0.3262 0.2180 0.9741 Tukey 95.0% Simultaneous Confidence Intervals Response Variable Trapezius All Pairwise Comparisons among Levels of Force Force = high subtracted from: Force Lower Center Upper -+---------+---------+---------+----- low 0.073 0.8433 1.6138 (-----*-----)
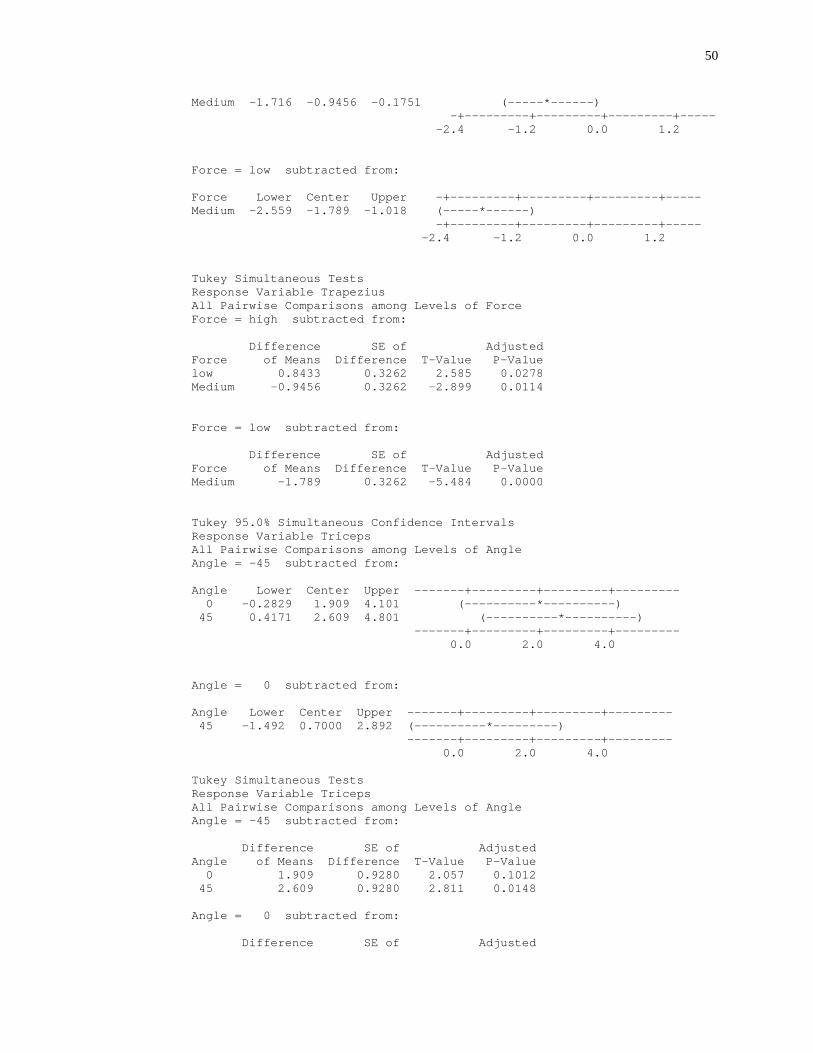
50
Medium -1.716 -0.9456 -0.1751 (-----*------) -+---------+---------+---------+----- -2.4 -1.2 0.0 1.2 Force = low subtracted from: Force Lower Center Upper -+---------+---------+---------+----- Medium -2.559 -1.789 -1.018 (-----*------) -+---------+---------+---------+----- -2.4 -1.2 0.0 1.2 Tukey Simultaneous Tests Response Variable Trapezius All Pairwise Comparisons among Levels of Force Force = high subtracted from: Difference SE of Adjusted Force of Means Difference T-Value P-Value low 0.8433 0.3262 2.585 0.0278 Medium -0.9456 0.3262 -2.899 0.0114 Force = low subtracted from: Difference SE of Adjusted Force of Means Difference T-Value P-Value Medium -1.789 0.3262 -5.484 0.0000 Tukey 95.0% Simultaneous Confidence Intervals Response Variable Triceps All Pairwise Comparisons among Levels of Angle Angle = -45 subtracted from: Angle Lower Center Upper -------+---------+---------+--------- 0 -0.2829 1.909 4.101 (----------*----------) 45 0.4171 2.609 4.801 (----------*----------) -------+---------+---------+--------- 0.0 2.0 4.0 Angle = 0 subtracted from: Angle Lower Center Upper -------+---------+---------+--------- 45 -1.492 0.7000 2.892 (----------*---------) -------+---------+---------+--------- 0.0 2.0 4.0 Tukey Simultaneous Tests Response Variable Triceps All Pairwise Comparisons among Levels of Angle Angle = -45 subtracted from: Difference SE of Adjusted Angle of Means Difference T-Value P-Value 0 1.909 0.9280 2.057 0.1012 45 2.609 0.9280 2.811 0.0148 Angle = 0 subtracted from: Difference SE of Adjusted
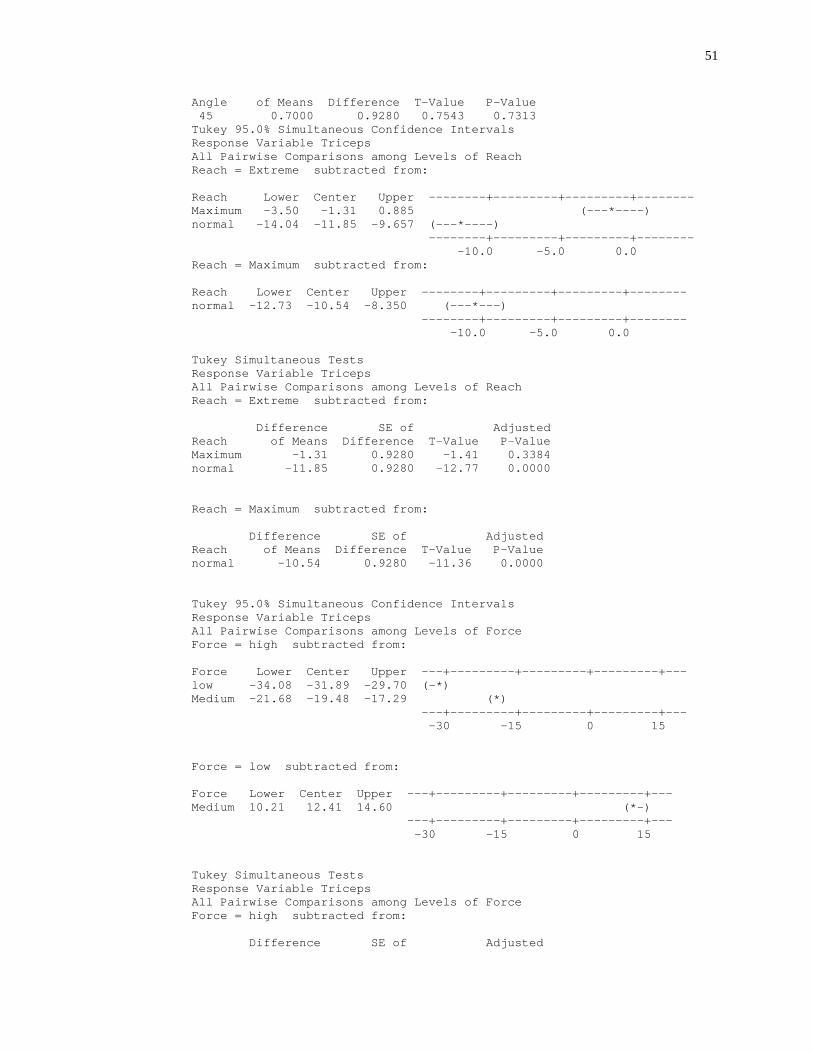
51
Angle of Means Difference T-Value P-Value 45 0.7000 0.9280 0.7543 0.7313 Tukey 95.0% Simultaneous Confidence Intervals Response Variable Triceps All Pairwise Comparisons among Levels of Reach Reach = Extreme subtracted from: Reach Lower Center Upper --------+---------+---------+-------- Maximum -3.50 -1.31 0.885 (---*----) normal -14.04 -11.85 -9.657 (---*----) --------+---------+---------+-------- -10.0 -5.0 0.0 Reach = Maximum subtracted from: Reach Lower Center Upper --------+---------+---------+-------- normal -12.73 -10.54 -8.350 (---*---) --------+---------+---------+-------- -10.0 -5.0 0.0 Tukey Simultaneous Tests Response Variable Triceps All Pairwise Comparisons among Levels of Reach Reach = Extreme subtracted from: Difference SE of Adjusted Reach of Means Difference T-Value P-Value Maximum -1.31 0.9280 -1.41 0.3384 normal -11.85 0.9280 -12.77 0.0000 Reach = Maximum subtracted from: Difference SE of Adjusted Reach of Means Difference T-Value P-Value normal -10.54 0.9280 -11.36 0.0000 Tukey 95.0% Simultaneous Confidence Intervals Response Variable Triceps All Pairwise Comparisons among Levels of Force Force = high subtracted from: Force Lower Center Upper ---+---------+---------+---------+--- low -34.08 -31.89 -29.70 (-*) Medium -21.68 -19.48 -17.29 (*) ---+---------+---------+---------+--- -30 -15 0 15 Force = low subtracted from: Force Lower Center Upper ---+---------+---------+---------+--- Medium 10.21 12.41 14.60 (*-) ---+---------+---------+---------+--- -30 -15 0 15 Tukey Simultaneous Tests Response Variable Triceps All Pairwise Comparisons among Levels of Force Force = high subtracted from: Difference SE of Adjusted
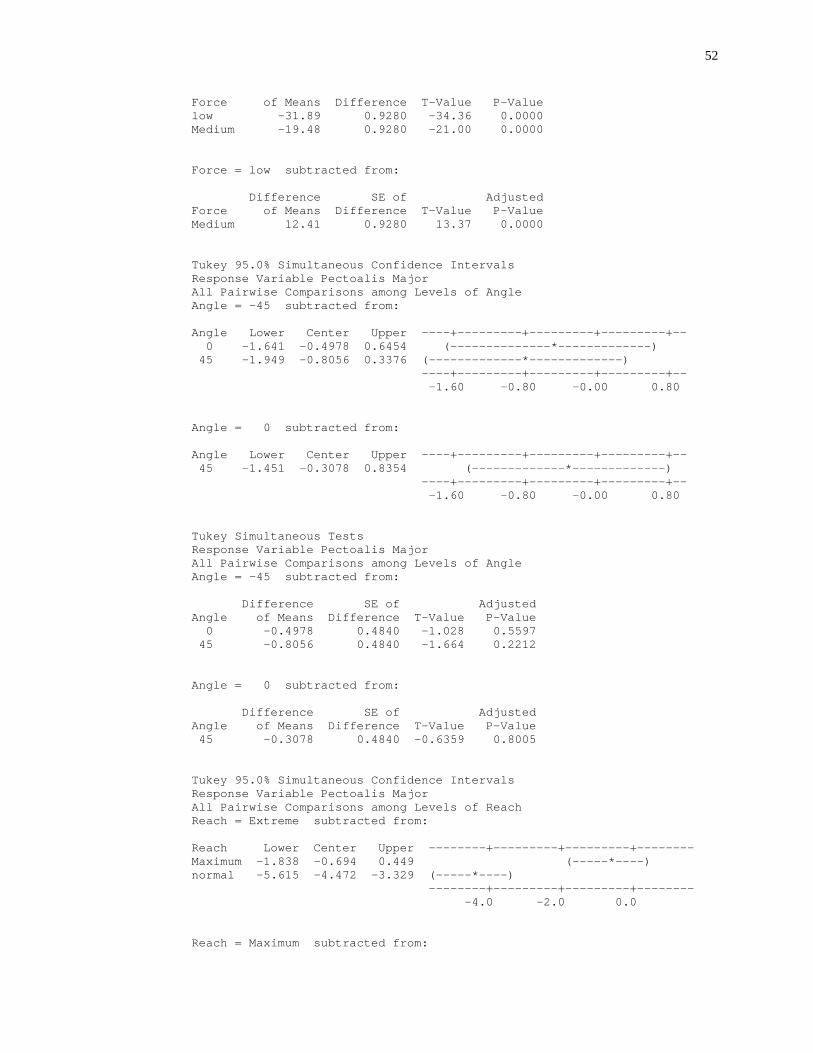
52
Force of Means Difference T-Value P-Value low -31.89 0.9280 -34.36 0.0000 Medium -19.48 0.9280 -21.00 0.0000 Force = low subtracted from: Difference SE of Adjusted Force of Means Difference T-Value P-Value Medium 12.41 0.9280 13.37 0.0000 Tukey 95.0% Simultaneous Confidence Intervals Response Variable Pectoalis Major All Pairwise Comparisons among Levels of Angle Angle = -45 subtracted from: Angle Lower Center Upper ----+---------+---------+---------+-- 0 -1.641 -0.4978 0.6454 (--------------*-------------) 45 -1.949 -0.8056 0.3376 (-------------*-------------) ----+---------+---------+---------+-- -1.60 -0.80 -0.00 0.80 Angle = 0 subtracted from: Angle Lower Center Upper ----+---------+---------+---------+-- 45 -1.451 -0.3078 0.8354 (-------------*-------------) ----+---------+---------+---------+-- -1.60 -0.80 -0.00 0.80 Tukey Simultaneous Tests Response Variable Pectoalis Major All Pairwise Comparisons among Levels of Angle Angle = -45 subtracted from: Difference SE of Adjusted Angle of Means Difference T-Value P-Value 0 -0.4978 0.4840 -1.028 0.5597 45 -0.8056 0.4840 -1.664 0.2212 Angle = 0 subtracted from: Difference SE of Adjusted Angle of Means Difference T-Value P-Value 45 -0.3078 0.4840 -0.6359 0.8005 Tukey 95.0% Simultaneous Confidence Intervals Response Variable Pectoalis Major All Pairwise Comparisons among Levels of Reach Reach = Extreme subtracted from: Reach Lower Center Upper --------+---------+---------+-------- Maximum -1.838 -0.694 0.449 (-----*----) normal -5.615 -4.472 -3.329 (-----*----) --------+---------+---------+-------- -4.0 -2.0 0.0 Reach = Maximum subtracted from:
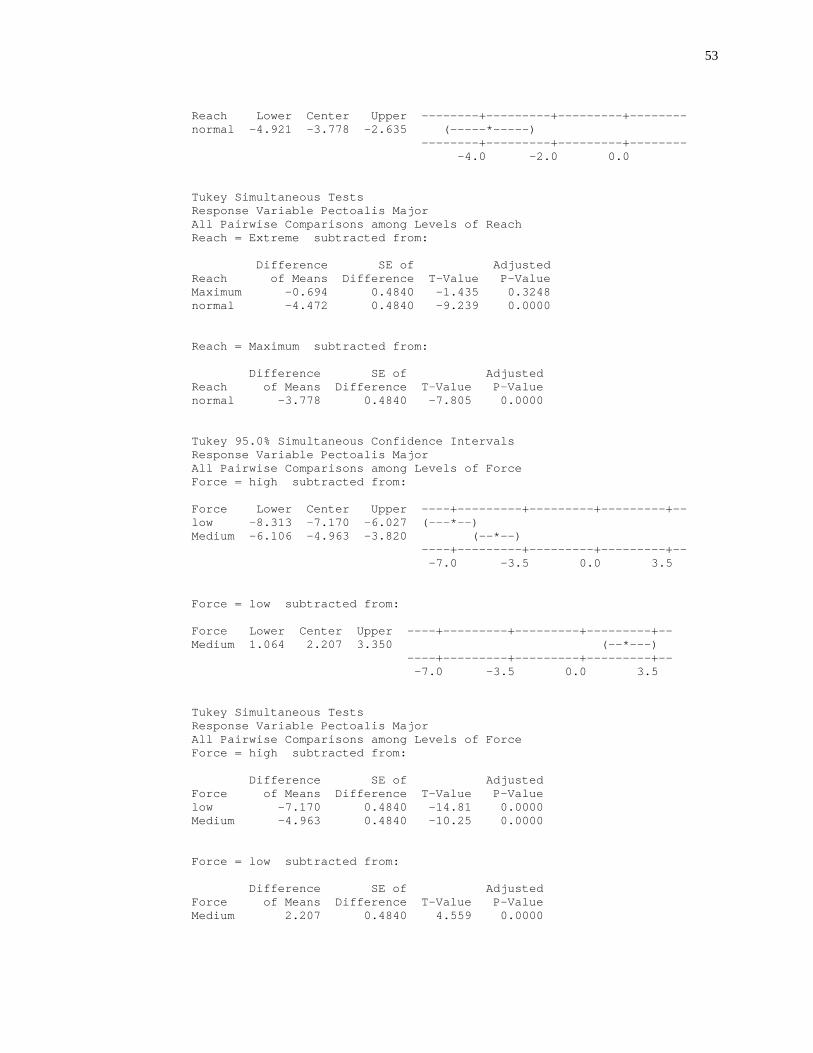
53
Reach Lower Center Upper --------+---------+---------+-------- normal -4.921 -3.778 -2.635 (-----*-----) --------+---------+---------+-------- -4.0 -2.0 0.0 Tukey Simultaneous Tests Response Variable Pectoalis Major All Pairwise Comparisons among Levels of Reach Reach = Extreme subtracted from: Difference SE of Adjusted Reach of Means Difference T-Value P-Value Maximum -0.694 0.4840 -1.435 0.3248 normal -4.472 0.4840 -9.239 0.0000 Reach = Maximum subtracted from: Difference SE of Adjusted Reach of Means Difference T-Value P-Value normal -3.778 0.4840 -7.805 0.0000 Tukey 95.0% Simultaneous Confidence Intervals Response Variable Pectoalis Major All Pairwise Comparisons among Levels of Force Force = high subtracted from: Force Lower Center Upper ----+---------+---------+---------+-- low -8.313 -7.170 -6.027 (---*--) Medium -6.106 -4.963 -3.820 (--*--) ----+---------+---------+---------+-- -7.0 -3.5 0.0 3.5 Force = low subtracted from: Force Lower Center Upper ----+---------+---------+---------+-- Medium 1.064 2.207 3.350 (--*---) ----+---------+---------+---------+-- -7.0 -3.5 0.0 3.5 Tukey Simultaneous Tests Response Variable Pectoalis Major All Pairwise Comparisons among Levels of Force Force = high subtracted from: Difference SE of Adjusted Force of Means Difference T-Value P-Value low -7.170 0.4840 -14.81 0.0000 Medium -4.963 0.4840 -10.25 0.0000 Force = low subtracted from: Difference SE of Adjusted Force of Means Difference T-Value P-Value Medium 2.207 0.4840 4.559 0.0000
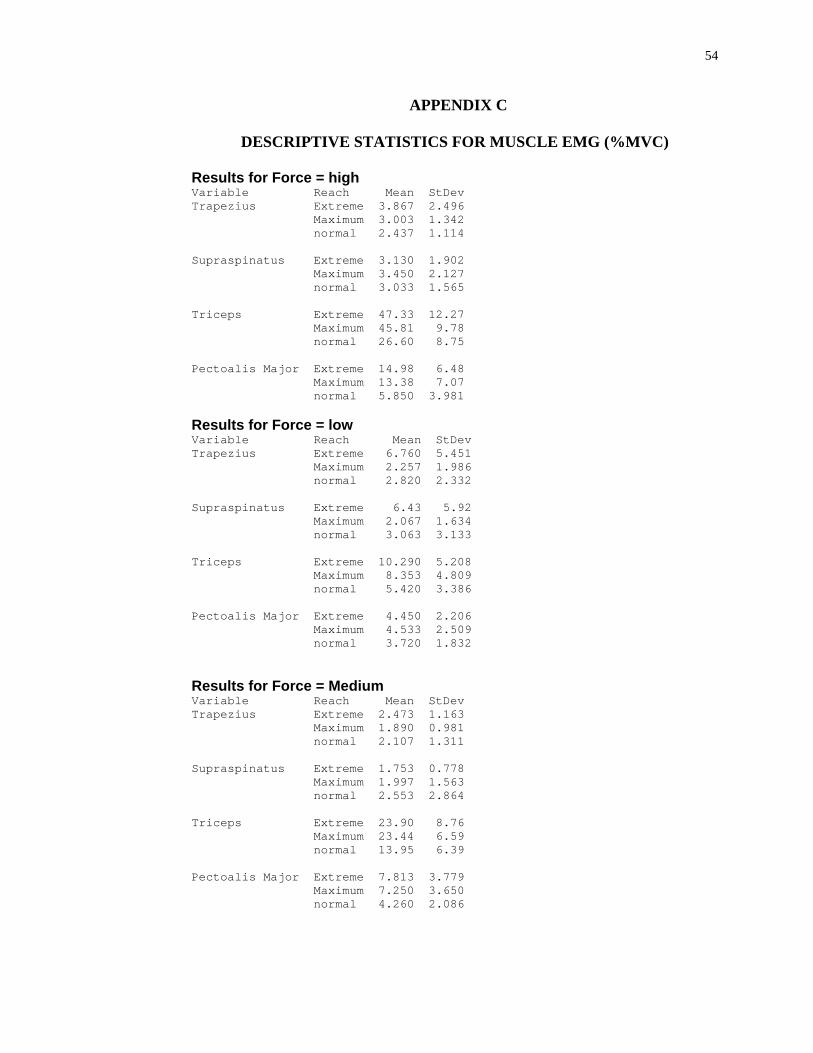
54
APPENDIX C
DESCRIPTIVE STATISTICS FOR MUSCLE EMG (%MVC)
Results for Force = high Variable Reach Mean StDev Trapezius Extreme 3.867 2.496 Maximum 3.003 1.342 normal 2.437 1.114 Supraspinatus Extreme 3.130 1.902 Maximum 3.450 2.127 normal 3.033 1.565 Triceps Extreme 47.33 12.27 Maximum 45.81 9.78 normal 26.60 8.75 Pectoalis Major Extreme 14.98 6.48 Maximum 13.38 7.07 normal 5.850 3.981 Results for Force = low Variable Reach Mean StDev Trapezius Extreme 6.760 5.451 Maximum 2.257 1.986 normal 2.820 2.332 Supraspinatus Extreme 6.43 5.92 Maximum 2.067 1.634 normal 3.063 3.133 Triceps Extreme 10.290 5.208 Maximum 8.353 4.809 normal 5.420 3.386 Pectoalis Major Extreme 4.450 2.206 Maximum 4.533 2.509 normal 3.720 1.832 Results for Force = Medium Variable Reach Mean StDev Trapezius Extreme 2.473 1.163 Maximum 1.890 0.981 normal 2.107 1.311 Supraspinatus Extreme 1.753 0.778 Maximum 1.997 1.563 normal 2.553 2.864 Triceps Extreme 23.90 8.76 Maximum 23.44 6.59 normal 13.95 6.39 Pectoalis Major Extreme 7.813 3.779 Maximum 7.250 3.650 normal 4.260 2.086

55
REFERENCES
Bastian EJ, Kits JK, Weaver JD, Joel K. Kits, Joshua D. Weaver, John R. Stevenson, Lynn Carlton, Susan A. Raaymakers, Jennifer Vanderpoel (2009). Effects of work experience, patient size, and hand preference on the performance of sonography studies. Journal of Diagnostic Medical Sonography, 25, 25–37
Bravo, K. L., Coffin, C. T., & Murphey, S. L. (2005). The potential reduction in musculoskeletal injury in the nonscanning arm by using voice Scan technology during sonographic examinations. Journal of Diagnostic Medical Sonography, 21(4), 304-308
Brookham, R. L., Wong, J. M., & Dickerson, C. R. (2010). Upper limb posture and submaximal hand tasks influence shoulder muscle activity. International Journal of Industrial Ergonomics, 40(3), 337-344
Brown, G., Baker, J., (2004). Work-related musculoskeletal disorders in sonographers. Journal of Diagnostic Medical Sonographers, 20, 85–93
Burnett, D. R., & Campbell-Kyureghyan, N. H. (2010). Quantification of scan-specific ergonomic risk-factors in medical sonography. International Journal of Industrial Ergonomics, 40(3), 306-314
Cram, J. R., Kasman, G. S., & Holtz, J. (1998). Introduction to Surface Electromyography. Gaithersburg, Maryland: Aspen Publication.
Friesen, M. N., Friesen, R., Quanbury, A., & Arpin, S. (2006). Musculoskeletal injuries among ultrasound sonographers in rural manitoba: A study of workplace ergonomics. AAOHN Journal : Official Journal of the American Association of Occupational Health Nurses., 54(1), 32-37
Hill III, J. J., Slade, M. D., & Russi, M. B. (2009). Anthropometric measurements, job strain, and prevalence of musculoskeletal symptoms in female medical sonographers. Work, 33(2), 181-189
Horkey, J., & King, P. (2004). Ergonomic recommendations and their role in cardiac sonography. Work, 22(3), 207-218
Jarvholm, U., Palmerud, G., Styf, J., Herberts, P., & Kadefors, R. (1988). Intramuscular pressure in the supraspinatus muscle. Journal of Orthopaedic Research, 6(2), 230-238
Jarvholm, U., Palmerud, G., Herberts, P., Högfors, C., & Kadefors, R. (1989). Intramuscular pressure and electromyography in the supraspinatus muscle at shoulder abduction. Clinical Orthopaedics and Related Research, (245), 102-109
Magnavita N, Bevilacqua L., Mirk P., Fileni A., Castellino N. (1999). Work-related musculoskeletal complaints in sonologists. J Occup Environ Med, 41, 981–988
56
Murphy, T., & Oliver, M. L. (2011). Evaluation of a dynamic armrest for hydraulic-actuation controller use. Applied Ergonomics, 42(5), 692-698
Murphey, S. L., & Milkowski, A. (2006). Surface EMG evaluation of sonographer scanning postures. Journal of Diagnostic Medical Sonography, 22(5), 298-305
Sengupta, A. K., & Das, B. (2004). Determination of worker physiological cost in workspace reach envelopes. Ergonomics, 47(3), 330-342
Society of Diagnostic Medical Sonographers (SDMS) (2003). Industry standards for the prevention of work-related musculoskeletal disorders in sonography: consensus conference on workrelated musculoskeletal disorders in sonography. http://www.osha.gov/dcsp/alliances/sdms/sdms.html
Sporrong, H., Palmerud, G., Kadefors, R., & Herberts, P. (1998). The effect of light manual precision work on shoulder muscles-an EMG analysis. Journal of Electromyography and Kinesiology, 8(3), 177-184
Vanderpool, H.E., Friis, E.A., Smith, B.S., Harms, K.L. (1993). Prevalence of carpal tunnel syndrome and other work-related musculoskeletal problems in cardiac sonographers. Journal of Occupational Medicine 35(6), 604–610
Village, J., & Trask, C. (2007). Ergonomic analysis of postural and muscular loads to diagnostic sonographers. International Journal of Industrial Ergonomics, 37(9-10), 781-789