Embed Size (px)
Citation preview

ABSTRACT
Title of Document: ON-FARM DRY MATTER ANALYSIS FOR
FEEDING PRECISION ON DAIRY FARMS Karin R. French, MS, 2011 Directed By: Professor Richard A. Kohn
Department of Animal and Avian Sciences Uncertainty in dairy ration content impacts feed efficiency, milk production,
expenses, and environmental losses. When measuring silage by weight, unknown
changes in dry matter (DM) may change the total mixed ration. The objective of this
study was to measure variation in silage DM on selected farms and evaluate an
electronic method of on-farm DM analysis. Of 31 Maryland farms surveyed, 63%
reported DM analysis by an on-farm method, 83% by any method including
laboratory measurement. Eight producers performed DM analysis daily for 21 days
using a Farmex 1210 Electronic Silage Tester (on-farm) and they recorded
precipitation; matching samples were analyzed for DM in a laboratory after oven
drying (“standard” method, 55°C followed by 100°C) and by using a Farmex 1210
(laboratory). The standard deviation of mean silage DM varied from 0.72% to 3.33%
DM, depending on farm. The electronic method compared poorly to standard DM
analysis for most farms.

ON-FARM DRY MATTER ANALYSIS TO IMPROVE FEED DELIVERY PRECISION ON DAIRY FARMS
By
Karin R. French
Thesis submitted to the Faculty of the Graduate School of the University of Maryland, College Park, in partial fulfillment
of the requirements for the degree of Master of Animal Science
2011 Advisory Committee: Professor Richard A. Kohn, Chair Professor Mark A. Varner Assistant Professor Frank Siewerdt

© Copyright by Karin R. French
2011

ii
Dedication
To all struggling graduate students.
iii
Acknowledgements
This work was completed with the kind patience and help of Rick Kohn, Catherine
Powell, Robbie Miller, Telmo Oleas, and the staff of the University of Maryland
Department of Animal and Avian Sciences.
iv
Table of Contents Dedication .....................................................................................................................ii Acknowledgements ..................................................................................................... iii Table of Contents .........................................................................................................iv List of Tables.................................................................................................................v List of Figures ..............................................................................................................vi Chapter 1: Introduction .................................................................................................1 Chapter 2: Review of Literature ....................................................................................8 Chapter 3: Methods .....................................................................................................23 Chapter 4: Results .......................................................................................................29 Chapter 5: Discussion..................................................................................................52 Appendices ..................................................................................................................65 Glossary.......................................................................................................................69 Bibliography................................................................................................................71

v
List of Tables Table 1. Components of variance in feed analysis. Table 2. Pearson correlation of adjusted dry matter density in bunker silos to management practices during ensiling (Muck and Holmes, 2000). Table 3. Major advantages and disadvantages DM analysis technologies for on-farm use. Table 4. Dry matter analysis and feeding practices of 31 dairy farms. Table 5. Reported DM analysis practices and herd information for on-farm DM study participants. Table 6. On-farm DM sampling dates and number of days sampled. Table 7. Mean and SD of DM (oven method) and NDF for each farm and silage type. Table 8. Dry matter (DM %) measured two ways by the electronic method minus DM measured by the standard method. Table 9. Mean of differences between on-farm DM and standard DM values and the mean of the averages of on-farm DM and standard DM for each farm. Table 10. Sources of variation by method, when compared to standard (oven) method. Table 11. TMR DM and NDF values and number of samples for each ration evaluation study farm. Table 12. TMR crude protein values and Ca:P Ratio and number of samples for each ration evaluation study farm. Table 13. Differences between formulated ration and analysis for DM and NDF for each ration evaluation study farm. Table 14. Differences between formulated ration and analysis for crude protein values and Ca:P ratio for each ration evaluation study farm. Table 15. Correlation between changes in ration DM, NDF, CP, and Ca:P (n=103 TMR samples).

vi
List of Figures
Figure 1. The animal farm nutrient system. Figure 2. Stacked chart of US milk cow operations (U.S. Department of Agriculture, 2010). Figure 3. Methods of on-farm DM analysis used on 31 surveyed farms. Koster Moisture Tester, Koster Moisture Tester Inc, Brunswick, OH. Figure 4. Frequency of DM analysis vs. milking herd size. Figure 5. Dry matter (oven method) and NDF for each farm over 21 days. Figure 6. In-lab electronic method minus standard method DM values versus their average. Figure 7. On-farm electronic method minus standard method DM values versus their average. Figure 8. Frequency distribution of samples by number of days between TMR formulation and ration evaluation analysis. Figure 9. Two cases: differences in adjusted and unadjusted ration for measured component of TMR. Figure 10. Distribution of 31 surveyed farms versus distribution of 663 dairy farms in Maryland from the 2007 Census of Agriculture, USDA Agriculture Statistics Service.

1
Chapter 1: Introduction
Dairy farm operations are under ever-increasing economic and political pressure to
operate more efficiently. Precision feeding is a management strategy that is meant to
address some economic and environmental concerns through animal nutrition. The
premise of precision feeding is that the animals are fed to their physiological
requirements for health and milk production without exceeding those requirements.
Precision feeding attempts to minimize excess inputs from supplements and feed,
consequently reducing nutrients lost to the environment as leaching, volatilization,
and runoff. Excess nutrients that are not used by the animal will be excreted in feces
and urine, increasing the potential for lost nutrients when the excreta are stored and
recycled as fertilizer (Figure 1). Feeding to requirements reduces excess nutrients and
prevents environmentally problematic nutrients, particularly nitrogen and phosphorus,
from leaving the farm system.
Animal feeding and nutrition represent the largest ongoing expenditure of a dairy
farm operation. Consider a typical farm that is milking 100 Holstein cows. Each cow
may weigh 410 to 725 kg (900 to 1600 lb), with most of the cows weighing about 680
kg (1500 lb) on this farm. Sustaining the production of milk, which is rich in butterfat
and protein, plus regular metabolism may require a dairy cow to eat the equivalent of
4 percent of her body weight in feed dry matter each day (Chase, 1993), depending on
how much milk she is producing and other factors. By this rough estimate, the
workers on this farm are handling about 6000 lb of feed dry matter per day.

2
Figure 1. The animal farm nutrient system.
On most modern dairy farms, the animals are fed using a total mixed ration (TMR),
which is meant to contain a uniform mix of all nutrients required by the animal. A
dairy nutritionist or a knowledgeable farm worker will use a computer program to
formulate the composition of the TMR based on the analyzed composition of
available feed components and the physiological status of the herd. Feed components
may include grains, by-product feeds, vitamins and minerals, as well as corn silage,
alfalfa (legume) silage, grass silages, and other forages. For large herds where
animals may be fed in groups, each group may receive a slightly different mixture of
TMR components.
Ideally, the as-fed ration error (the difference between the fed ration and the
formulation) will not be large enough to cause significant adverse changes in feed

3
efficiency and consequently in milk production, feed expenses, or environmental
losses. However, as-fed ration error can be difficult to control in farm environments,
where feed storage conditions, turnover of ration components, normal feed variation,
and nonuniform management practices can introduce unknown variation in feed
composition and moisture content. In practice, the content of the TMR that is
presented to the animals varies from the formulation followed to prepare the ration.
Some sources of this variation are the error associated with feed composition analysis
(sampling error and laboratory error), variation within an analyzed feed component,
the use of different feed components without reformulating the ration, and error
associated with mixing and delivering the TMR. For example, perhaps a farm has
secured a large shipment of whole cottonseed as a TMR component and sends a
representative sample to a laboratory for compositional analysis. Information from
the analysis, such as protein, fiber, and fat content, is then used to incorporate the
component “cottonseed” into a TMR formulation, which a worker will use to prepare
the TMR. The variation within the shipment of whole cottonseed and the error
associated with the composition values provided by the laboratory are ignored for the
purposes of formulation, but will result in variation in the as-fed TMR from the
formulation. Furthermore, the feed composition may change over time during storage
or, if the feed runs out before a new formulation is made, a different feed may be
substituted in the TMR, resulting in further variation.

4
For farms that feed a TMR, silage is the largest component of the ration, and is thus a
reasonable target for decreasing variation and increasing precision of feeding. Silage
is forage that is preserved through anaerobic fermentation; forage is sealed in an
anaerobic containment system (silo) with enough moisture to allow fermentation.
Large silos can contain several months’ worth of feed and each silo will be used until
the feed is gone, meaning that the variability of a particular batch of silage may affect
the ration for extended periods of time.
On farms where silage is measured by weight for inclusion in the TMR, changes in
silage dry matter (DM) may significantly affect TMR nutrient content. For example, a
formulation may specify 22 lb of silage DM for each animal (only DM intake counts
because water is supplied ad libitum). The wet weight of silage with that was 35%
DM would be about 63 lb, while that of silage that was 40% DM would be 55 lb
because of the decreased weight of water (increased nutrient density). In a herd of
100, the difference in wet weight between these silages would be about 786 lb.
Failure to account for this 5% difference in silage dry matter may result in
overfeeding or underfeeding by as much as 786 lb of silage per day.
Because determination of DM is a relatively simple analytical procedure, on-farm
determination of silage dry matter could be a practical and effective means of
reducing ration variation to increase precision in feeding. Various recommendations
have been made for on-farm DM analysis, including suggestions to perform analysis
“once or twice weekly” (Mertens et al, 2004) and after rainfall or other precipitation
5
(Anonymous, 2011, Mertens et al, 2004). However, there is little evidence supporting
such recommendations. In a search of literature, no references were found that
elucidated the magnitude of silage dry matter variation on any timescale, how this
variation affects ration consistency, or how silage varies under laboratory conditions
versus field conditions. Only one reference was found that evaluated different
technologies for on-farm DM analysis (Oetzel et al, 1993).
The question of the value of on-farm DM analysis is especially significant for smaller
farms, which do not benefit from economies of scale that allow additional time and
resources to be spent on activities that are not absolutely essential to farm survival.
Census data suggest that, while the total number of farms has been decreasing for
decades, smaller farms are more susceptible to dropping out of the dairy business than
larger farms. Larger farms have tended to increase as a proportion of total dairy farm
operations in the U.S (Figure 2); some of that increase is represented by smaller
farms that have expanded the herd.

6
Figure 2. Stacked chart of US milk cow operations (U.S. Department of
Agriculture, 2010). From bottom to top: farms with 1 to 49 head, farms with 50
to 99 head, farms with 100 head or more.
Several initial questions should be asked in a study of on-farm DM analysis for dairy
farms. It would be useful to evaluate whether some farms already use on-farm DM
analysis more than others, characterize the variation in silage DM values on various
farms, and look at the potential effect of that variation on the nutrient content of the
ration. How variable are DM values for silage as it is fed out of the silo from day to
day, and are there differences in variability from farm to farm? In this study, data to
answer such questions was captured through a survey of Maryland farms, followed by
21 days of on-farm DM data collection on eight of the surveyed farms.

7
Because there is little data regarding on-farm DM analysis methods, the use of a
“quick” and inexpensive method of analysis DM on the farm was evaluated. The
Farmex 1210 Portable Electronic Silage Tester (Farmex Inc, Streetsboro, OH), which
can be purchased for approximately $200 and takes approximately 15 minutes to use
for DM analysis, claims accuracy to within “2% (average) for silage under 50%
moisture” and “3% (average) for silage over 50% moisture.” For a DM measurement
to be meaningful, the measurement must be accurate, and the variation in the
measurement must be less than the variation in the silage on the farm using the
method. In this study, the electronic method was compared to a standard method to
evaluate accuracy, and the variation measured by the on-farm data collection was
used to evaluate potential meaningfulness on real farms.

8
Chapter 2: Review of Literature
This review addresses literature pertaining to use of on-farm dry matter analysis
methods and uncertainty in delivered nutrient content.
A. Models used in formulating dairy rations
Various mathematical models, most notably NRC (National Research Council, 1989,
2001), Cornell Net Carbohydrate and Protein System (Fox et al. 2004)), and St-Pierre
(2007), have been proposed to create targeted feeding regimens for dairy cattle in
various conditions and at various stages of lactation. Such models can greatly
increase the efficiency of feeding, both in tons fed and money spent.
The NRC and Cornell models use a frequentist framework, which defines variables as
unique values; these models have deterministic outputs in that they imply that
solutions are exact, often targeted to the requirements of the average animal in a herd.
Calculations for lead factors that adjust the target upward, particularly to the 83rd
percentile (based on milk production) of animals in the herd, were recommended as
an option to increase the applicability of these models (Stallings and McGilliard,
1984). Additionally, grouping of animals by age or production level has been used to
manage problems arising from undesirable social behavior of larger cows (Grant and
Albright, 2001), which enables creating a ration targeted to the needs of each group of
animals.

9
The St-Pierre model uses a Bayesian framework, which attempts to account for
probability distributions associated with the parameters that are used as inputs for the
model. This kind of stochastic model allows multiple solutions by letting parameter
values vary randomly according to their probability distributions, and would provide
estimates of the uncertainty of predictions. St-Pierre has argued that assumptions
underlying frequentist methods, especially constant physiological status of the
animals and lack of uncertainty in nutrient analysis, are invalid (St-Pierre, 2007; St-
Pierre and Cobanov, 2007; St-Pierre and Thraen, 1999). However, much of the data
needed to calculate probability distributions for a stochastic model, such as the DM
variability data in the present study, have not been collected.
When a ration is formulated, a dairy nutritionist will typically use software
incorporating one of the frequentist animal nutrition models. As inputs for the model,
the nutritionist will use estimates of the body condition of the herd, the production of
the herd, and the composition of the feed components to be incorporated. A ration is
typically reformulated either by an arbitrary fixed schedule or according to observed
changes in feed components or production. However, because there are no established
practical methods to distinguish meaningless background variation (noise), detection
of meaningful changes in feed component analysis is left to the discretion of the dairy
nutritionist or producer.

10
A model for determining the most economically efficient frequency of ration analysis
and reformulation, based on quality control charts, has been examined by St. Pierre
and Cobanov (2007), who concluded:
A model with 16 input variables and 3 design parameters can be
used to calculate the total quality cost per unit of time of any renewal
reward process based on X-bar quality charts. When applied to the
control of forage variation, the model reduces to 13 input variables
and 3 design parameters. The current practice of taking one forage
sample per month and intervening when the results differ by more
than 2 SD from the expected value appears to be close to the optimal
sampling design in small herds (50 cows). However, it appears to be
incorrect in large herds, in which the optimal design requires taking
2 samples every 4 d and intervening if the average of the 2 samples
differ by more than 1.2 SD from expectation. This optimal design
reduces daily costs by about $250.
Failure to detect meaningful changes in feed composition is associated with reduced
feed efficiency, and unnecessary reformulation of the ration is associated with
increased labor and analysis costs (Kohn, 2008). In an attempt to prevent production
losses due to possible underfeeding of nutrients, nutritionists may overestimate the
requirements of the animals when formulating a ration (Kohn, 2008). Ration
components change over time, and rations may not be reformulated to reflect these
changes. However, there is little information to indicate the actual magnitude of
11
change that should be expected for specific components or the amount of change to
be expected over time.
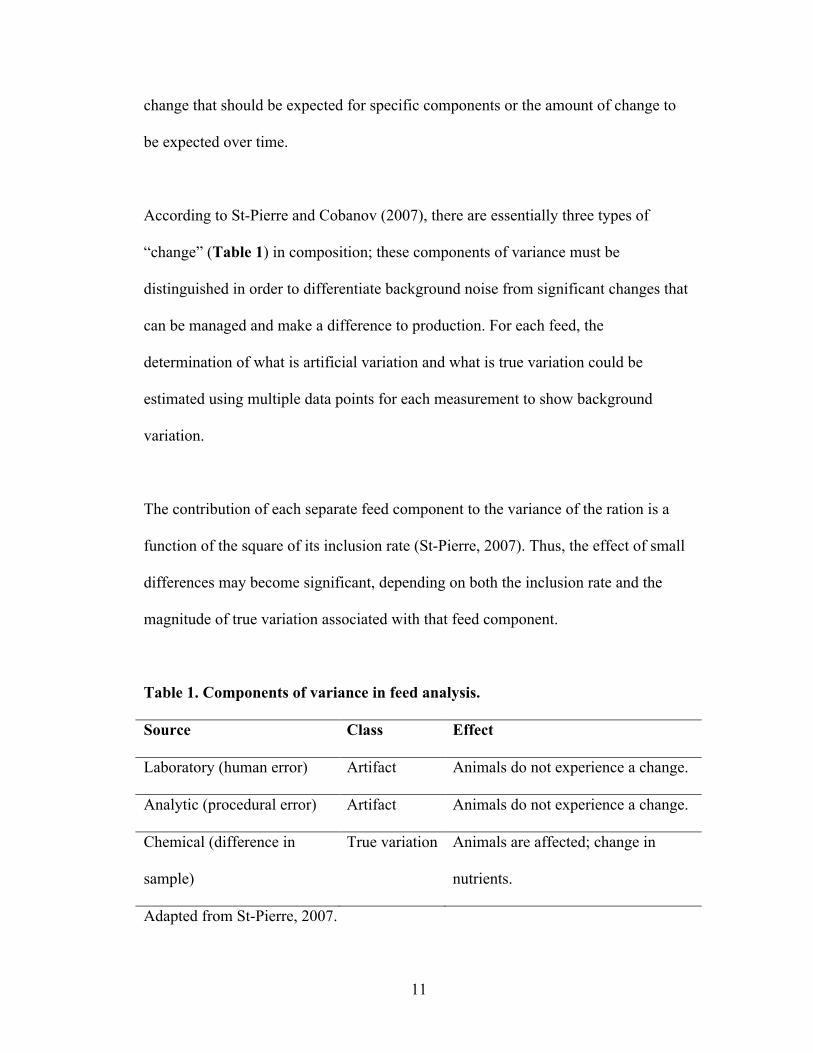
According to St-Pierre and Cobanov (2007), there are essentially three types of
“change” (Table 1) in composition; these components of variance must be
distinguished in order to differentiate background noise from significant changes that
can be managed and make a difference to production. For each feed, the
determination of what is artificial variation and what is true variation could be
estimated using multiple data points for each measurement to show background
variation.
The contribution of each separate feed component to the variance of the ration is a
function of the square of its inclusion rate (St-Pierre, 2007). Thus, the effect of small
differences may become significant, depending on both the inclusion rate and the
magnitude of true variation associated with that feed component.
Table 1. Components of variance in feed analysis.
Source Class Effect
Laboratory (human error) Artifact Animals do not experience a change.
Analytic (procedural error) Artifact Animals do not experience a change.
Chemical (difference in
sample)
True variation Animals are affected; change in
nutrients.
Adapted from St-Pierre, 2007.

12
Further refinement could be made by establishing, for each feed component, the
magnitude of true variation that will significantly affect production. By being able to
differentiate true variation from background noise, and being able to understand what
magnitude of true variation is nutritionally meaningful, an observer could more
objectively and reliably interpret when to reformulate a ration.
B. Management practices related to variability in forage content
Literature related to forage or silage management deals primarily with optimizing and
preserving nutrient quality and digestibility; little published work pertaining to
management of forage variability in nutrient content was found. No peer-reviewed
articles were found that elucidated the magnitude of silage dry matter variation on
any timescale, how this variation affects ration consistency, or how silage varies
under experimental conditions versus field conditions. However, some research in
silage management is relevant to variability in forage content.
Silage is forage that is preserved through anaerobic fermentation. Forage is sealed in
an airtight container (silo) with enough moisture to allow fermentation. The forage
then goes through stages of ensiling: 1. an aerobic phase, in which aerobic microbes
produce heat and use oxygen that exists between particles of forage; 2. an anaerobic
fermentation phase, in which anaerobic microbes ferment available substrate and pH
drops to around four; and 3. a stable low-pH phase assumed to last until feed-out. An
13
underlying precept of creating high quality silage is limitation of the aerobic phase,
which can deplete substrate needed for anaerobic fermentation. Some
recommendations for limiting this phase are proper initial moisture content, which
depends partly on the type of forage being ensiled, and dense packing of the silo to
limit initial oxygen availability. It stands to reason that evenly dense packing of the
silo could improve consistency of fermentation and therefore consistency of silage.
As described by Tyler and Ensminger (2006), various types of silos are used to create
silage:
• conventional upright (tower) silos,
• gas-tight (oxygen-limiting) silos,
• pit silos (similar to a sunken upright silo),
• horizontal concrete (trench or bunker) silos, and
• temporary silos such as enclosed stacks, open stacks, modified trench-stacks,
plastic or polyethylene bags, and round bale bagged or wrapped silage.
In terms of consistency of silage produced, each kind of silo may have a different
profile. For example, upright silos are more densely packed at the bottom, and
moisture may tend to drain from the top, resulting in greater seepage losses for taller
structures (Tyler and Ensminger, 2006). Horizontal bunker silos may be more evenly
dense from bottom to top, but may be more susceptible to groundwater damage in
high water table areas. Muck and Holmes (2000) undertook a study of recommended,
but under-researched, management practices that seek to increase the silage density of
168 Wisconsin bunker silos that were packed with tractors. Density, in DM weight

14
per unit volume, was measured in 5-cm by 30-cm cores taken at four places across the
silage face, mathematically adjusted for distance below the top of the silage face, and
correlated with various recorded management practices (Table 2).
Some practices showing a positive correlation with density were weight of packing
tractors, smaller initial forage layer thickness, tractor tire condition, and forage
particle size. The type of silage (corn or alfalfa) was not found to have a strong
relationship with packing density. Alfalfa silage was found to have a higher DM
content (42 ± 9.5%) than corn silage (34 ± 4.8%). The wet physical density of packed
corn silage was found to be higher than that of packed alfalfa silage because of the
lower DM content of corn silage.
Some management practices have also been evaluated in nutrient management
research. In a mail survey of 2,500 farms in the mid-Atlantic region of the United
States (New York, Pennsylvania, Delaware, Maryland, Virginia), Dou et al (2003)
found a positive correlation between “no. of lactating cows” (numbering 50 to 1000)
and probability of reporting the use of professional ration formulation and regular
forage analysis. In a mail survey and milk data analysis of 472 dairies in the
Chesapeake Bay watershed (including Delaware, Maryland, Pennsylvania, Virginia,
and West Virginia), Jonker et al (2002) found positive relationships between farm
nitrogen utilization efficiency and reported use of bovine somatotropin (bST), use of
photoperiod techniques, and membership in a Dairy Herd Improvement Association.

15
Table 2. Pearson correlation of adjusted dry matter density in bunker silos to
management practices during ensiling (Muck and Holmes, 2000).
Factor Correlation Coefficient
Initial layer thickness –0.279*
Average packing tractor weight 0.262*
Average wheel load 0.224*
Dry matter content 0.209*
Total weight of packing tractors 0.200*
Tire condition (1=new, 3=bald) 0.195*
Average particle size 0.194*
Packing time (min/t as-fed) 0.162*
Speed of packing (1 ≥8 km/h; 4 ≤1.6 km/h) 0.147
Number of packing tractors 0.146
Wheels per packing tractor 0.126
Slip during packing (1=none, 3=frequently) 0.101
Tire pressure 0.098
Crop (1 = corn; 2 = alfalfa) 0.086
Packing time (min/t DM) 0.078
Front wheel drive (front wheel drive, assist; rear wheel
drive)
0.075
Packing method (horizontal, progressive wedge,
distribute)
–0.068
Delivery wagon or truck drives over pile (1 = yes) 0.059
* Significant correlations (P< 0.05).
Adapted from Muck and Holmes, 2000.

16
C. Dry matter analysis methods
The National Forage Testing Association has published recommended procedures for
forage dry matter determination (Undersander, Mertens, and Thiex, 1993) including:
• Oven drying for 2 hours at 135°C, followed by hot weighing,
• Oven drying at 100°C for 24 hours or 105°C for 16 hours, followed by hot
weighing,
• Oven drying at 55°C for 16 to 24 hours, grinding of sample, and drying at
100°C followed by hot weighing,
• Microwave drying to constant weight,
• Near infrared reflectance spectroscopy (NIRS), and
• Distillation with toluene (recommended for fermented forage samples such as
silage).
The oven methods involve weighing the sample before and after drying to determine
moisture content. The higher the temperature, the greater the risk of loss in DM by
evaporation of volatile chemicals, as well as loss of usefulness of the sample for
further compositional analyses. When samples are heated, it is inevitable that “dry
matter” composed of nutritionally important volatile chemicals such as acetic acid,
propionic acid, butyric acid, and lactic acid will be lost with water evaporation,
especially for fermented feeds that have lower pH and more volatile chemicals (Petit
et al, 1997; Porter and Murray, 2001). Coefficients are sometimes used to adjust the
results of oven methods (Haigh, 1979; Petit et al, 1997). Although oven drying can be

17
completed in 2 hours, higher heat can increase loss of DM and loss of sample
integrity, thus the lower temperature options for oven drying may be used, though
they can take up to 3 days to complete.
The microwave method also works by heating the sample. The method involves
weighing the sample, heating for 3 minutes, mixing the sample up, and heating again
for 3 minutes, and repeated weighing and heating, 30 seconds or 1 minute at a time,
until a relatively constant weight is achieved (Oetzel et al, 1993; Undersander,
Mertens, and Thiex, 1993). While in theory it is possible for this method to take less
than 15 minutes to complete, without excessive care, low heat settings, and short
heating periods, it is easy to burn the sample (Oetzel et al, 1993). Burning or charring
the sample causes weight loss other than moisture; if the sample is burned, the entire
procedure must be repeated with a new sample.
In NIRS, special instrumentation is used to measure reflected infrared light from the
sample and the results are electronically compared to results of similar samples of
known moisture content (calibration samples). Equations selected based on
calibration statistics are used to calculate the dry matter content of the sample.
Assuming calibration is already completed, NIRS is the quickest of all the methods,
and can be done in minutes, with very little manipulation of the sample. Chemical
methods such as distillation with toluene, gas chromatography, and Karl Fisher
titration are used to analyze samples for calibration of NIRS and result validation
(Windham et al, 1987).
18
For distillation with toluene, the sample is weighed and then boiled in toluene while
water is distilled off and trapped under a layer of toluene in a graduated receiving
container; the water fraction’s volume is then measured to determine the total
moisture content of the sample. Developed in 1960, this method gained wide use for
fermented feeds because fewer volatile chemicals are lost compared to the oven; one
study reported a 14.6% increase in DM compared to a 100°C oven (Brahmakshatriya
and Donker, 1971). Haigh (1979), in a paper developing a correction coefficient for
100°C oven values, reported that for corn silage samples toluene distillation gave
values from 3.5% to 18.9% higher than drying by 100°C oven. However, toluene
distillation is a procedure that requires 1.5 to 8 hours to complete, depending on the
sample. Additionally, toluene distillation may overestimate water when compared to
Karl Fisher titration and gas chromatography methods; when there are large amounts
of ethanol, ammonia, and volatile fatty acids in the sample, these may end up in the
distillate and increase the apparent water fraction (Petit et al, 1997).
Karl Fischer distillation and gas chromatography are both water-specific methods
(Petit et al, 1997), which largely avoid the problem of other volatile chemicals being
mixed in with water. They are also relatively quick methods, requiring less than half
an hour. The specificity of Karl Fischer titration relies on the oxidation of sulphur
dioxide by iodine in the presence of water, using a titration cell containing an
electrode. The gas chromatography method uses anhydrous alcohol to extract the
water from the sample, then separation of the water fraction with a thermal
19
conductivity detector (Petit et al, 1997). Gas chromatography is quick and the most
accurate method available, but requires very expensive equipment. Karl Fischer
titration is also very quick, but is also relatively inexpensive.
Forage analysis laboratories typically determine dry matter by either commercial
drying ovens or NIRS. A laboratory offers a controlled environment, trained
operators, and freedom to follow specific protocols. In the field, as opposed to in the
laboratory, there is considerable variation in temperature and ambient moisture over
the course of each day, exact procedures may not be followed, and sampling may not
be ideal. The major concerns when performing dry matter analyses in the field are
speed, reliability, and sturdiness for the dairy farm environment. Only one peer-
reviewed article was found that addressed technologies for on-farm dry matter
analysis. Oetzel et al (1993) compared determination of feed dry matter by
commercial drying oven (48 hours at 100°C) to three methods of on-farm forage dry
matter analysis: Koster Moisture Tester (forced air drying device), 1210 Silage Tester
(electronic DM analysis device), and microwave oven.
Oetzel et al (1993) found all four methods to be repeatable within themselves, with
coefficients of variation of 1.3, 1.4, 2.0, and 2.1% for the microwave, 100°C oven,
Koster, and electronic methods, respectively. Relative to the mean DM for the oven
method (34.2% for corn silage, 45.3% for alfalfa silage), DM was overestimated by
both the Koster method (37.4% for corn silage, 47.9% for alfalfa silage) and the
microwave method (36.0% for corn silage, 48.2% for alfalfa silage). The electronic

20
method underestimated corn silage (27.5%) but overestimated alfalfa silage (48.5%).
The authors concluded that the microwave method was the most accurate relative to
the drying oven, but required the most operator skill and time; the electronic method
required the least skill and time, but may have inaccuracies in some of the conversion
tables used to determine DM from capacitance.
In the Koster and microwave methods, the operator weighs a sample and then dries
the sample repeatedly until two subsequent dry weights are equal (Undersander,
Mertens, and Thiex, 1993; Koster Moisture Tester, Inc, 2011). The 1210 Silage
Tester sends a current through the sample and provides a reading of the capacitance
of the sample, which is assumed to be water content. The 1210 Silage Tester method
involves measuring the temperature of the sample with an analog thermometer, using
a screw-down knob to compress the sample in the device, reading the capacitance,
and using a chart with temperature adjustments to convert the measurements into an
estimate of DM content (Farmex, Inc, 2008).
Various recommendations have been made for the use of on-farm DM analysis.
Mertens et al (2004) recommended analysis "once or twice weekly." Various sources
recommend the use of on-farm DM analysis after rainfall or other precipitation
(Anonymous, 2011, Mertens et al, 2004). Several others simply recommend
performing DM analysis routinely with the use of the microwave method or
commercial DM analysis equipment such as the Koster Moisture Tester (Bernard,
2010; Gay, 2009).

21
Table 3. Major advantages and disadvantages DM analysis technologies for on-
farm use.
1Koster Moisture Tester, Koster Moisture Tester Inc, Brunswick, OH.
2Farmex 1210 Silage Tester, Farmex Inc, Streetsboro, OH.
It is generally acknowledged that DM analyses take up valuable time, and
recommendations have been made to circumvent allocating too much time to follow
the recommendation for routine analysis. A common recommendation is to use a
Method Advantages for farm use Disadvantages for farm use
Microwave Accuracy, relatively short
time
Needs operator skill, attention
Koster 1 Ease, relatively short
drying time
None
Electronic 2 Ease, portability, speed Relies on tables made based on
unknown calibration
Oven (home) Reliability Long drying time, inconvenient
Forced air oven Reliability Long drying time, specialized
equipment
NIRS Portable units available Specialized equipment, expensive
Chemical
analyses
None Needs operator training, specialized
equipment, may use hazardous
substances
22
“squeeze test,” in which one squeezes a handful of forage to estimate moisture
content based on whether any liquid comes out and how well the “ball” of forage
holds together in the open palm of the hand (Chambliss, 2007; Tyler and Ensminger,
2006). Other recommendations include weighing a set volume of wet silage (e.g. 1
liter) on a regular basis to determine if a change has occurred (Anonymous, 2011);
Mertens et al (2004) recommended using a food dehydrator, which would allow the
sample to be safely left alone for several hours while drying.

23
Chapter 3: Methods
A. Overview
The research methodologies include a survey, on-farm DM and forage sample
collection by Maryland dairy producers, and analysis of ration data collected from
Maryland farms. Maryland farms were surveyed to examine relationships between
current DM analysis implementation and milking herd size. Eight of the surveyed
farms were asked to perform on-farm DM analysis for 21 days using a Farmex 1210
Electronic Silage Tester (electronic method; Farmex Inc, Streetsboro, OH) and
provide corresponding forage samples for comparison to laboratory results.
Survey, farm, and laboratory data were graphed and visually inspected. Outliers and
trends were noted for further inspection at the end of other analyses. JMP 4 Software
(SAS Institute, Cary, NC) was used to conduct statistical analysis. In the analysis of
ration data, ration formulation values were compared to ration analysis values, and
the differences described.
B. Survey of on-farm dry matter practices in Maryland
A limited in-person survey of on-farm dry matter practices in Maryland was
conducted. One operator from each farm was interviewed in-person using an
interview form. Interviewees were found via unannounced farm visits and in-person
24
meetings at public dairy-related events. A total of 31 dairy producers were
interviewed on dairy farms in four Maryland counties (Washington County, Frederick
County, Carroll County), at the 2008 Montgomery County Fair, or at the 2008
Maryland State Fair.
About two-thirds of the 31 farms surveyed were found through unannounced farm
visits. Visited farms were randomly selected within the surveyed counties of
Washington County, Frederick County, and Carroll County, in which there is a
geographical concentration of dairy farms. Farm addresses were obtained from a list
provided by the Maryland Dairy Industry Association for university extension work.
Of the 35 farms visited, approximately 30% were not surveyed because no farm
operators were available to interview. The remaining one-third of surveyed farms
were found and interviewed at the Montgomery County Fair and at the Maryland
State Fair; no farm operators approached at these events refused to be interviewed for
the survey.
The survey served two functions: 1. a way to observe possible relationships between
on-farm dry matter determination and other management parameters, and 2. a
mechanism of finding dairy producers to participate in on-farm data collection.
The query objectives were as follows:
1. Frequency of forage DM analysis
25
2. Method of DM analysis (e.g., microwave, Koster dryer, oven, electronic,
laboratory)
3. Types of forages routinely fed
4. Feed delivery methods (e.g., TMR, complete feed, pasture, top dressing)
5. Number of cows in the milking herd milk production
6. Approximate rolling herd average
7. Milk cooperative membership
8. Willingness to perform on-farm DM for 21 days if provided an electronic DM
analysis device
The survey collected information on the current implementation of DM on 31
Maryland dairy operations, and the relationships of “number of cows” to
implementation of DM analysis was assessed by Spearman correlation. The survey
focused on the frequency of dry matter determination, methods of dry matter
determination, types of forages fed, and the possibility of further collaboration in the
study of on-farm dry matter. All information identifying each farm or producer
remained confidential according to the will of the participants.
C. Silage samples from Maryland farms
Eight Maryland producers were asked to perform on-farm DM using a Farmex 1210
Electronic Silage Tester (Farmex Inc, Streetsboro, OH). These producers, based on
survey responses, were interested in participating in an on-farm trial, fed a TMR, and
26
used silage. The Farmex device was provided permanently to the producer as an
incentive to participate. This electronic device has previously been evaluated against
other methods (Oetzel 1993). Training and detailed instructions on the use of the
electronic DM analysis device were provided. Pre-labeled sample bags were provided
and work such as calculations were minimized to improve compliance.
For up to 21 days, each producer performed daily DM analysis using the electronic
device, recorded observations on rain events, and recorded ration changes related to
the daily DM analysis. Daily silage samples corresponding to each daily DM analysis
were retained frozen or refrigerated in airtight, re-sealable bags, then transported to
the lab, and remained frozen until they were dried and ground. Further laboratory
analysis of samples for DM by oven and electronic DM device, neutral detergent
fiber, and ash were then performed. Information on prevailing weather conditions
were obtained from local weather stations operated by one of the following: the
Maryland Department of Transportation, an airport, a city, or a hobbyist participating
in a quality control program.
I. C.1. Sample collection and on-farm dry matter determination
Producers were given training on how to use the Farmex 1210 Electronic Silage
Tester and were asked to follow a simple protocol for sample collection and data
recording. For each day of up to 21 days, a sample of silage was collected and
immediately analyzed for moisture content using the electronic device (hereafter

27
referred to as “on-farm DM”). Analysis results were recorded on a data chart, along
with observations about rain and whether DM analysis results influenced amount of
silage used in the producer’s subsequent rations. The producers were asked to keep
the samples in cold storage until they were moved to the laboratory freezer. Producers
chose the day to start DM data and sample collection, and were asked to time the start
day so that feed bunkers or bags would not be switched out during collection.
I. C.2. Laboratory sample processing
Samples were kept refrigerated or frozen on farms until they were picked up. Samples
were picked up within one to two weeks of initial collection, were kept cold, and
were kept frozen until dry matter analyses were performed.
Samples were weighed, dried in a forced-air oven at 55 C for at least 48 hours,
weighed back cold to determine partial oven DM, ground using a Wiley Mill (1-mm
screen; Arthur H. Thomas, Philadelphia, PA), and stored in sealed containers at room
temperature for further analysis.
Total dry matter was determined by the two-step oven method (Undersander,
Mertens, and Thiex, 1993). Partial DM was determined as described above. To
determine Laboratory DM, 0.5g of ground sample were dried in ceramic crucibles at
100 C for 24 hours and weighed back hot. Total DM was determined by multiplying
Partial DM by decimal percent Laboratory DM.

28
Each daily silage sample was analyzed using the Farmex 1210 device in the
laboratory, in duplicate representative samples (hereafter referred to as “in-lab DM”).
Performance this task was limited to one operator to reduce the contribution of
operator bias between the samples.
NDF was determined by the Van Soest method (Van Soest and Wine, 1967) on each
sample in duplicate. The samples were analyzed for ash using a muffle furnace at
500°C.
D. Ration evaluation: comparing rations with formulations
Data from a previous joint study with Dou et al (2003) were used to examine
differences between offered Rations and Formulations from 2002-2005. During the
study, ration information and TMR samples were collected every 3 months. Records
from the 30 Maryland farms whose rations were collected and analyzed were mined
for TMR formulations with corresponding TMR laboratory analysis (Cumberland
Valley Analytical Services, Hagerstown, MD). For the 16 farms with appropriate
records, the percentages of DM, NDF, CP, and Ca:P ratio predicted by formulated
rations were compared to the corresponding laboratory measurements in TMR. The
differences between formulation and measured ration (as-fed ration error) were
summarized.

29
Chapter 4: Results
Survey of on-farm dry matter practices in Maryland
Of the 31 farms surveyed, most used TMR and most analyzed forage DM either on-
farm or off-farm, sending samples to a laboratory through a dairy nutritionist. Table 4
shows a summary of reported feeding practices and DM analysis practices.
Table 4. Dry matter analysis and feeding practices of 31 dairy farms.
Characteristic % “Yes” Confidence interval 1
Analyze DM more than once per year
(on- or off-farm) 84 13
Analyze On-Farm DM 39 17
Use Total Mixed Ration 71 16
Feeds used:
Pasture 29 16
Corn silage 90 11
Alfalfa silage 39 17
Haylage 16 13
Small grain silage 10 11
Alfalfa hay 55 18
Grass hay 58 17
Balage 26 15
Sorghum 6 8
Other forage 35 17 1 95% Confidence interval for 31 farms.

30
Most (61%) of surveyed farms did not analyze forage DM themselves on-farm. As
seen in Figure 3, of the 39% of surveyed farms who analyzed on-farm forage DM,
none used any available electronic method. Those who analyzed DM used either a
microwave oven or a Koster Moisture Tester, which is a forced-air drying device sold
for the express purpose of forage DM analysis.
Figure 3. Methods of on-farm DM analysis used on 31 surveyed farms. Koster
Moisture Tester, Koster Moisture Tester Inc, Brunswick, OH.
The reported mean rolling herd average (RHA) of milk production was 22,100 lb, and
reported RHA ranged from 7,000 to 31,000 lb. Except for one farm, which reported
keeping milk for cheese-making, each farm sent milk to one of five different
cooperatives. The farms that did analyze DM on-farm had an average milking herd
size of 146 cows, which was significantly larger (Welch’s t-test for means with

31
unequal variances, p=0.0423) than the average herd size, 76 cows, of those that did
not perform on-farm DM analysis.
A test using Spearman’s ranked correlation coefficient indicated that there was a
positive correlation (p=0.0010) between milking herd size and frequency of DM
analysis (on-farm or off-farm). The data is shown in Figure 4.
Figure 4. Frequency of DM analysis vs. milking herd size.
A. On-Farm DM Data Collection
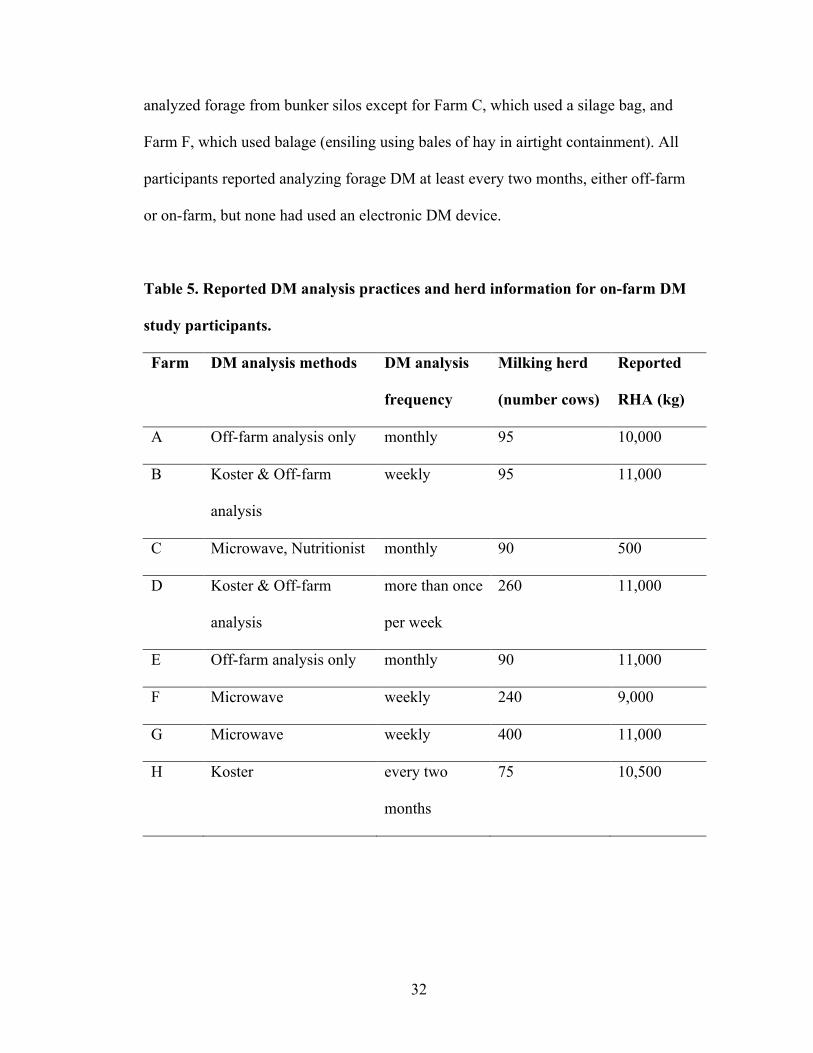
Eight dairy producers participated in on-farm DM data collection; the DM analysis
practices and dairy size information of each are shown in Table 5. All producers
32
analyzed forage from bunker silos except for Farm C, which used a silage bag, and
Farm F, which used balage (ensiling using bales of hay in airtight containment). All
participants reported analyzing forage DM at least every two months, either off-farm
or on-farm, but none had used an electronic DM device.
Table 5. Reported DM analysis practices and herd information for on-farm DM
study participants.
Farm DM analysis methods DM analysis
frequency
Milking herd
(number cows)
Reported
RHA (kg)
A Off-farm analysis only monthly 95 10,000
B Koster & Off-farm
analysis
weekly 95 11,000
C Microwave, Nutritionist monthly 90 500
D Koster & Off-farm
analysis
more than once
per week
260 11,000
E Off-farm analysis only monthly 90 11,000
F Microwave weekly 240 9,000
G Microwave weekly 400 11,000
H Koster every two
months
75 10,500

33
Sampling dates and silage types for each farm are shown in Table 6. All farms
sampled at least 19 to 21 days except for Farm C, which only sampled on 13 days and
stopped collection at day 18 upon emptying the silage bag that was being used during
the trial.
Table 6. On-farm DM sampling dates and number of days sampled.
Farm Silage type Sampling start Sampling end Days sampled
A Corn 15-Sep-2008 5-Oct-2008 21
B Corn 15-Sep-2008 5-Oct-2008 19
C Corn 16-Sep-2008 6-Oct-2008 13
D Corn 21-Sep-2008 11-Oct-2008 21
E Corn 22-Sep-2008 12-Oct-2008 20
F Alfalfa 6-Oct-2008 26-Oct-2008 21
G Corn and Alfalfa 15-Oct-2008 4-Nov-2008 19
H Corn 17-Oct-2008 6-Nov-2008 21
The total percentage of DM depends on water content alone, while NDF may be
independent of water content. The absence of a relationship between NDF and DM
may indicate that changes in DM may be influenced by other factors than inherent
properties in the silage. Table 7 shows the mean and SD of DM and NDF during the
trial for each farm.

34
Table 7. Mean and SD of DM (oven method) and NDF for each farm and silage
type.
DM % NDF DM%
Farm Silage Type Mean SD Mean SD
A Corn 37.30 0.72 40.19 1.58
B Corn 33.13 3.00 37.24 2.09
C Corn 33.38 2.90 43.60 3.88
D Corn 31.96 2.02 39.24 3.02
E Corn 36.57 2.48 40.94 1.43
F Alfalfa 32.56 3.33 39.40 1.06
G Alfalfa 35.82 3.20 38.89 1.06
G Corn 35.19 1.55 33.61 1.46
H Corn 29.72 1.83 42.11 2.33
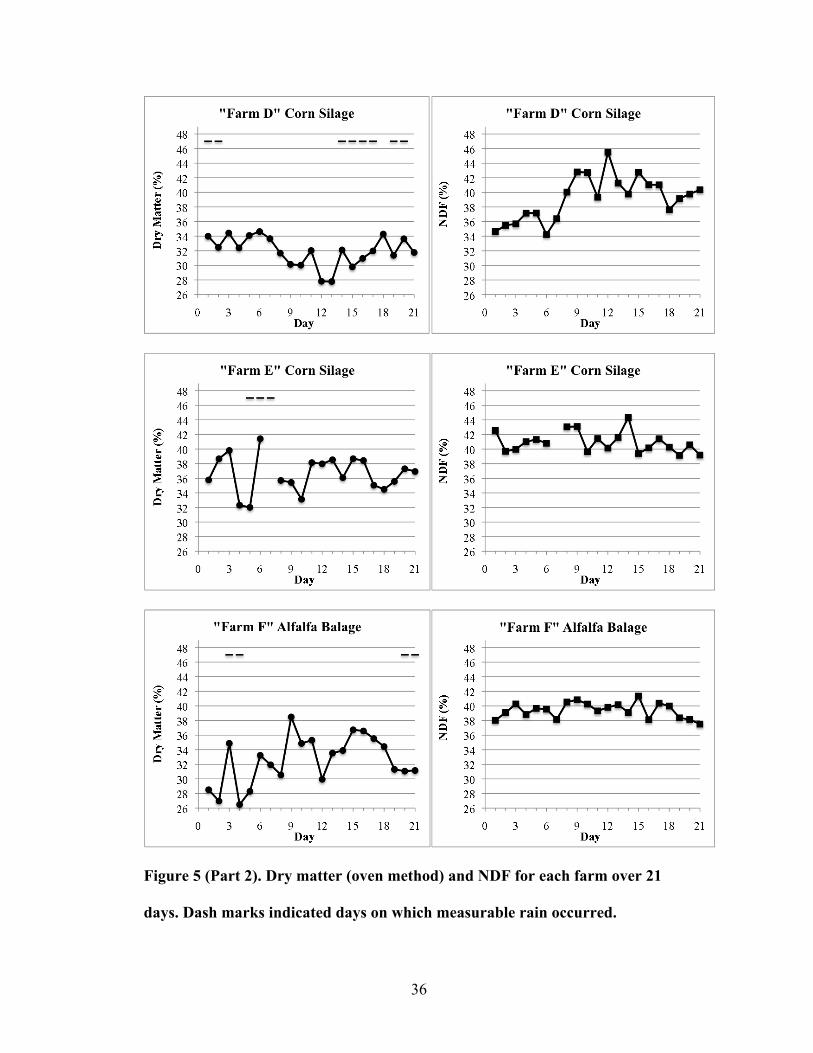
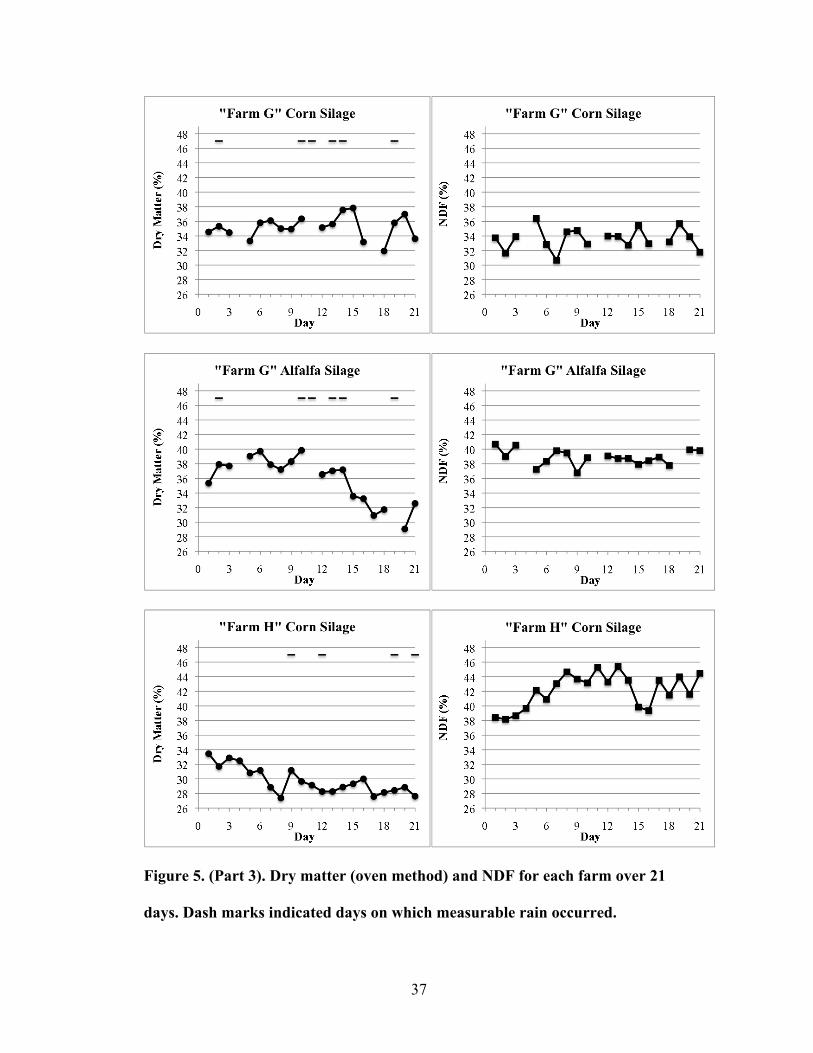
Each farm showed a unique pattern in DM (standard method) and NDF over the
course of 21 days (Figure 5). NDF values as a percentage of DM were regressed
against standard DM values determined by the standard method. Over all farms and
silage types, NDF decreased as DM increased (p<0.001). The overall significance of
this relationship may have been disproportionally leveraged by Farm H (p<0.0001)
Farm D (p<0.0001). Farm F showed a positive relationship between NDF and DM
(p= 0.0370). No relationship (Spearman correlation) was found between the
variability of the NDF and the variability of the DM values across farms and silage
types.

35
Figure 5 (Part 1). Dry matter (oven method) and NDF for each farm over 21
days. Dash marks indicated days on which measurable rain occurred.
36
Figure 5 (Part 2). Dry matter (oven method) and NDF for each farm over 21
days. Dash marks indicated days on which measurable rain occurred.
37
Figure 5. (Part 3). Dry matter (oven method) and NDF for each farm over 21
days. Dash marks indicated days on which measurable rain occurred.

38
Weather data were evaluated as a possible influence on changes in DM. Precipitation
as rain averaged 1.91 inches for each farm over the course of 21 days, with an
average of 4.9 days with rain, and prevailing temperature averaged 58.1°F (14.1 °C)
as measured by weather stations within 4 miles of each farm. The effect of rain on
changes in DM was evaluated using Students t-test to compare the mean DM change
from the previous day when rain occurred to the mean DM change from the previous
day when rain did not occur. The Shapiro-Wilk test was used to verify that the data
within each silage type were not inconsistent with the normal distribution. Rain did
not decrease DM across all farms and silage types. For each group with rain the
previous day or no rain the previous day, rain did decrease DM by a very small
amount (-0.13 change in % DM) from previous day for corn silage treatments. As a
test, NDF was subjected to the same procedure and was not found to show any
change due to rain the previous day. Prevailing temperature was not found to have an
effect on DM changes.
B. Method comparisons
For evaluative purposes, the oven two-step method for total dry matter determination
was assumed most accurate and was used as the standard to which measurements
made using the electronic method were compared. The electronic DM device, using
data gathered both on-farm and in-lab, was compared to the standard DM method.
Two data points from the on-farm DM data set were removed as outliers, as they were

39
outside the 95% confidence interval in the Grubbs test for outliers and appeared to be
inconsistent with the rest of the data.
Because the electronic DM analysis equipment was not in use on any of the farms
prior to this study, the possibility of a “learning curve” among farm operators of the
electronic DM device was evaluated. A “learning curve” was defined as a decrease in
the absolute value of residuals (on-farm DM minus standard DM) over the course of
the trial. The residuals became significantly smaller over time for Farm H (p=0.0004)
and Farm E (p=0.0271), indicating a possible learning curve for these farms, but the
change was not significant over all farms and silage types.
As an indication of mean bias relative to the standard method, the differences
between measurements made with the electronic method and the standard method
were calculated, and the means and standard deviations of the differences are shown
in Table 8. Reporting the limits of agreement (the mean difference plus or minus 1.96
SD) when comparing two methods was recommended by Bland and Altman (1995) to
indicate “how far apart measurements by the two methods were likely to be for most
individuals.” The limits of agreement indicate the expectation that 95% of samples by
the electronic method would be greater than the standard value plus the lower limit
and less than the standard value plus the upper limit (Bland and Altman, 1995). For
example, if DM were 40% by the standard method, 95% of the results found by the
electronic method on-farm could be expected to fall within 32.03% and 51.60%.

40
Table 8. Dry matter (DM %) measured two ways by the electronic method
minus DM measured by the standard method.
Method
Mean
difference SD
Lower limit of
agreement
Upper limit of
agreement
Electronic, In-Lab 0.65 4.25 -7.68 8.97
Electronic, On-
Farm
1.82 4.99 -7.97 11.60
For 95% of samples, the measurement by the indicated method will be greater than
the lower limit (reference value minus value indicated) and less than the higher limit
(reference value plus the value indicated) relative to a measurement by the standard
method; Limits = 1.96 (SD) ± mean difference (Bland and Altman, 1995).
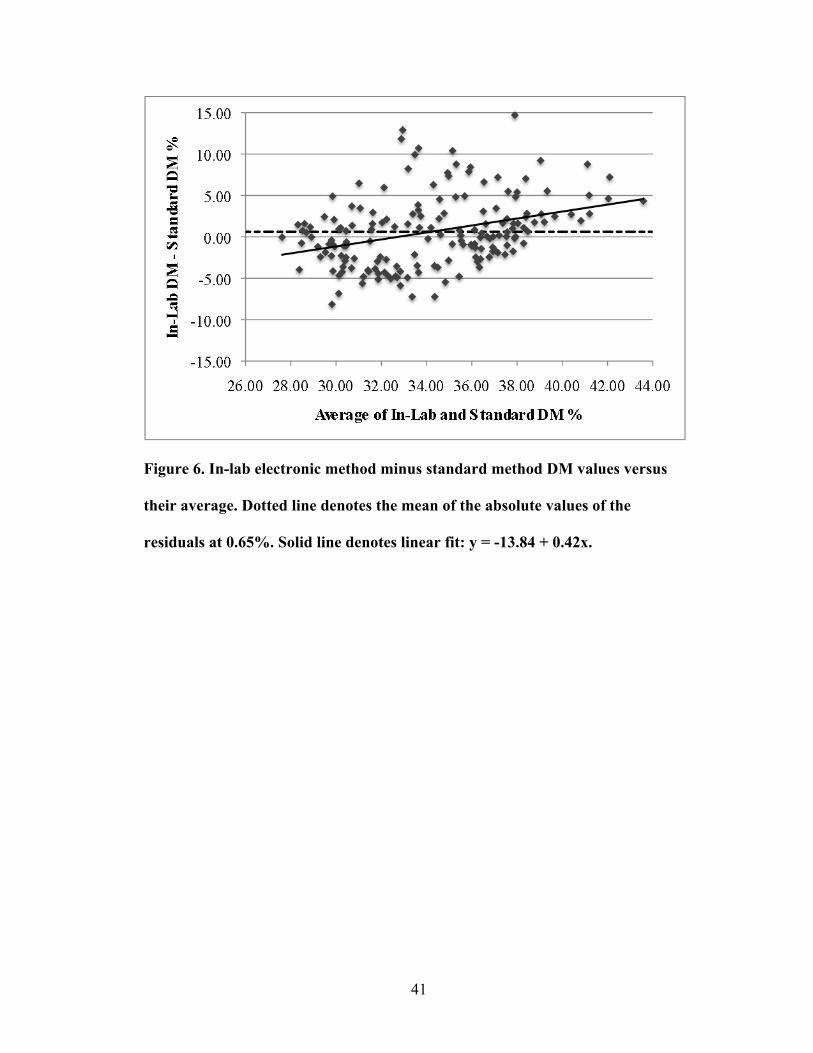
As an indication of linear bias, the differences between the electronic method and
standard method were regressed against the mean of the observed DM by each
method for each sample (Bland and Altman, 1995). As seen in Figure 6 and Figure
7, the electronic method tended to underestimate lower values of DM and
overestimate higher values of DM, with the inflection falling around 32%. Regression
against the mean of methods, rather than against the value from the reference method
alone, is thought to reduce the potential for variance in the reference measurements to
skew the estimate of linear bias (Altman and Bland 1983).
41
Figure 6. In-lab electronic method minus standard method DM values versus
their average. Dotted line denotes the mean of the absolute values of the
residuals at 0.65%. Solid line denotes linear fit: y = -13.84 + 0.42x.

42
Figure 7. On-farm electronic method minus standard method DM values versus
their average. Dotted line denotes the mean of the absolute values of the
residuals at 1.82%. Solid line denotes linear fit: y = -21.40 + 0.67x.
The mean differences of farm DM value minus standard DM value were different for
each farm, as can be seen in Table 9.
43
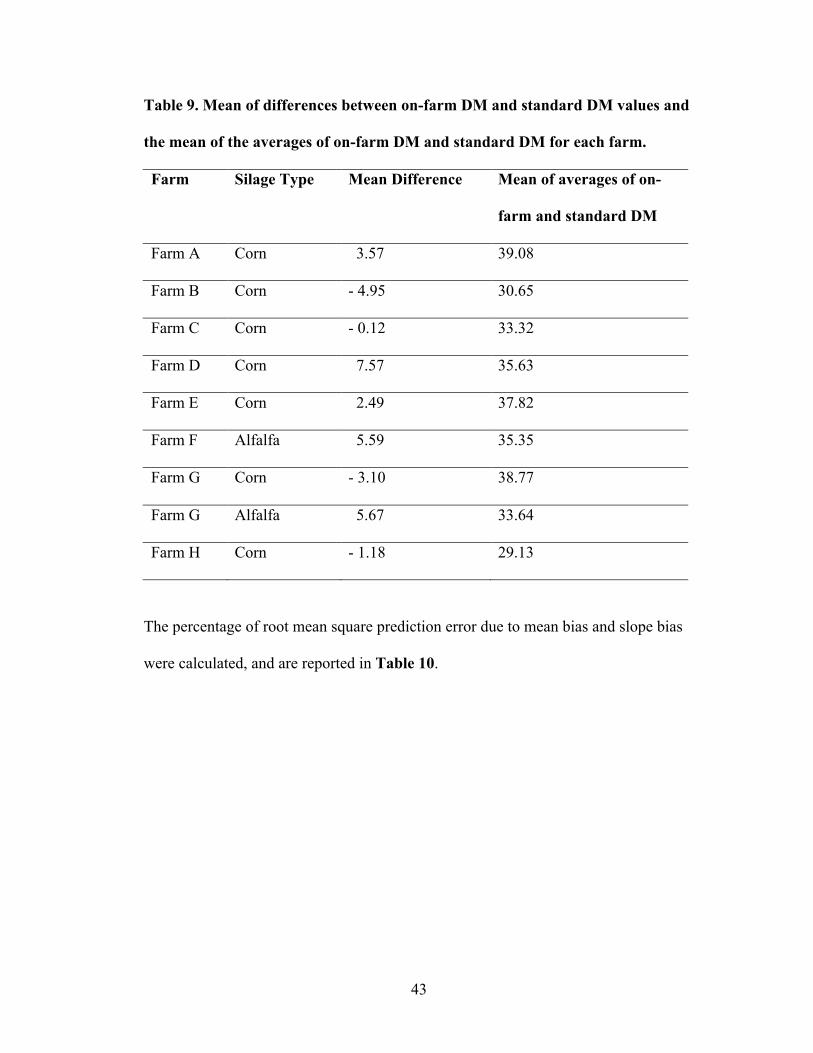
Table 9. Mean of differences between on-farm DM and standard DM values and
the mean of the averages of on-farm DM and standard DM for each farm.
Farm Silage Type Mean Difference Mean of averages of on-
farm and standard DM
Farm A Corn 3.57 39.08
Farm B Corn - 4.95 30.65
Farm C Corn - 0.12 33.32
Farm D Corn 7.57 35.63
Farm E Corn 2.49 37.82
Farm F Alfalfa 5.59 35.35
Farm G Corn - 3.10 38.77
Farm G Alfalfa 5.67 33.64
Farm H Corn - 1.18 29.13
The percentage of root mean square prediction error due to mean bias and slope bias
were calculated, and are reported in Table 10.

44
Table 10. Sources of variation by method, when compared to standard (oven)
method.
Variation due to:
Method Mean SD Mean bias Slope bias Error
Electronic, In-Lab 34.53 4.63 2.3% 11.6% 86.1%
Electronic, On-
Farm
35.78 5.70 11.7% 24.6% 63.7%
C. Ration evaluation study (data from Dou et al, 2003)
Information from the ration evaluation study provides a wider perspective on the
variation seen in TMR DM and the potential for variation of the fed ration from the
formulated ration. For the 16 farms whose TMR formulations and corresponding
analyses were compared, the number of samples ranged from 2 to 15. The number of
lactating cows on each farm ranged from 45 to 800, and averaged 169 cows. Number
of days from ration formulation to Dou study analysis ranged from 0 to 150 days and
averaged 24 days. The mean and SD of analyzed TMR DM, NDF, CP, and Ca:P ratio
are shown in Table 11 and Table 12. When NDF values were regressed against DM,
NDF was found to decrease as DM increased (p<0.001).

45
Table 11. TMR DM and NDF values and number of samples for each ration
evaluation study farm.
DM % NDF %
Farm Samples Mean SD Mean SD
1 7 42.79 4.85 32.57 1.86
2 5 46.06 5.15 34.16 2.69
3 15 47.31 5.17 33.29 3.96
4 9 45.80 5.31 31.41 3.60
5 4 49.88 2.35 32.45 2.35
6 4 39.28 4.69 36.20 2.71
7 2 37.95 2.47 37.40 0.14
8 8 43.44 4.91 31.20 2.80
9 2 49.10 10.32 31.20 2.26
10 4 43.30 5.56 34.88 6.26
11 2 45.70 1.41 32.55 1.63
12 6 47.55 5.14 27.58 3.04
13 7 43.43 3.77 31.30 1.71
14 9 40.17 3.49 33.69 3.33
15 7 42.17 5.44 32.74 3.51
16 12 45.06 4.97 31.93 2.88
Data from Dou et al, 2003.
46
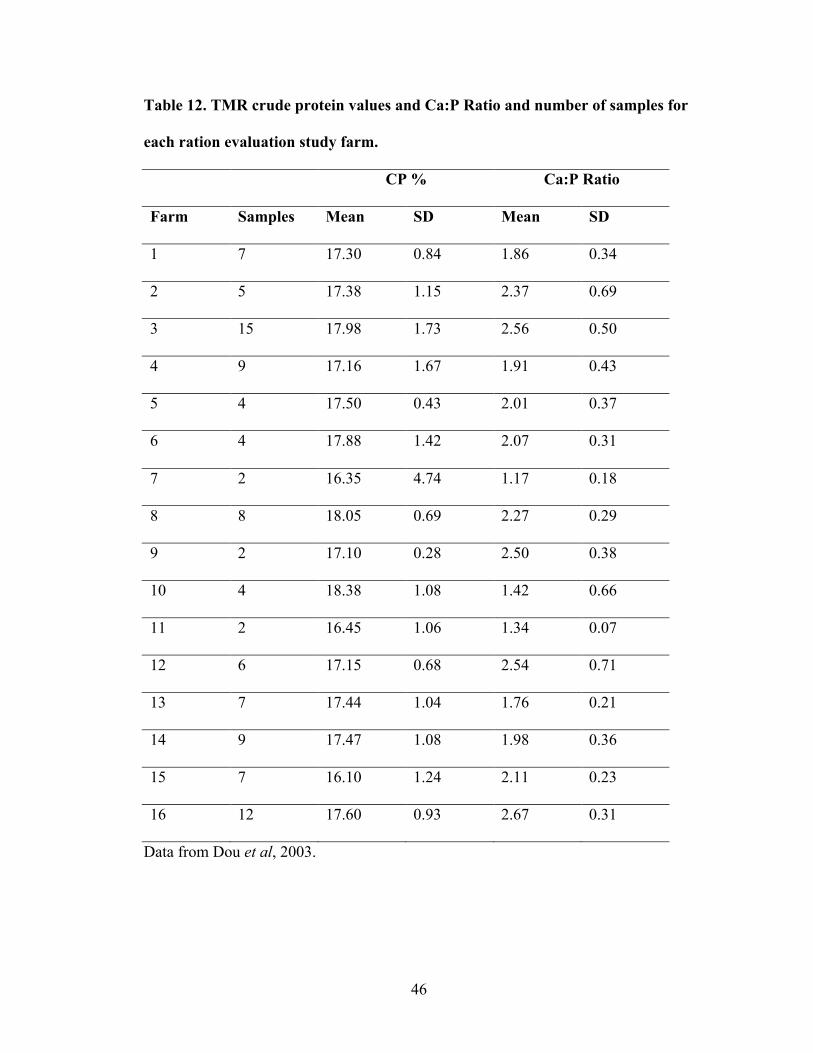
Table 12. TMR crude protein values and Ca:P Ratio and number of samples for
each ration evaluation study farm.
CP % Ca:P Ratio
Farm Samples Mean SD Mean SD
1 7 17.30 0.84 1.86 0.34
2 5 17.38 1.15 2.37 0.69
3 15 17.98 1.73 2.56 0.50
4 9 17.16 1.67 1.91 0.43
5 4 17.50 0.43 2.01 0.37
6 4 17.88 1.42 2.07 0.31
7 2 16.35 4.74 1.17 0.18
8 8 18.05 0.69 2.27 0.29
9 2 17.10 0.28 2.50 0.38
10 4 18.38 1.08 1.42 0.66
11 2 16.45 1.06 1.34 0.07
12 6 17.15 0.68 2.54 0.71
13 7 17.44 1.04 1.76 0.21
14 9 17.47 1.08 1.98 0.36
15 7 16.10 1.24 2.11 0.23
16 12 17.60 0.93 2.67 0.31
Data from Dou et al, 2003.

47
Analysis of DM is a tool to reduce the differences between the formulated ration and
the fed ration (as-fed ration error). The magnitude of as-fed ration errors seen on the
ration evaluation study farms for DM, NDF, CP, and Ca:P ratio are listed in Table 13
and Table 14.
48
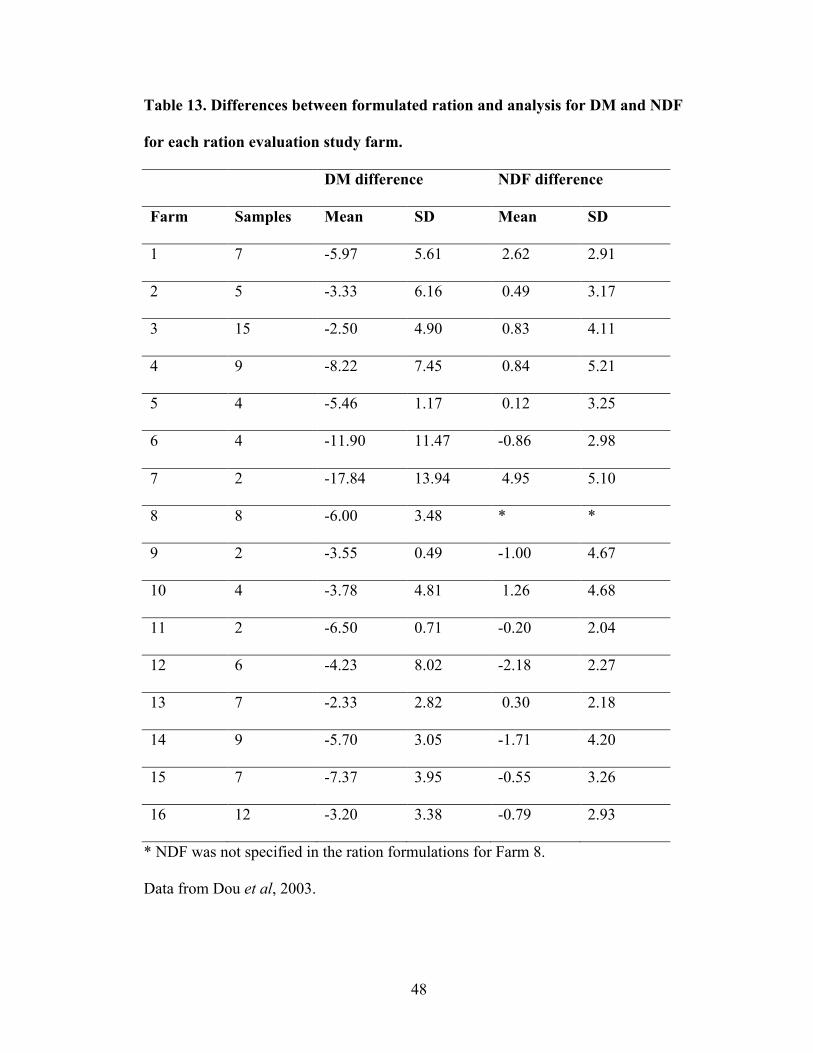
Table 13. Differences between formulated ration and analysis for DM and NDF
for each ration evaluation study farm.
DM difference NDF difference
Farm Samples Mean SD Mean SD
1 7 -5.97 5.61 2.62 2.91
2 5 -3.33 6.16 0.49 3.17
3 15 -2.50 4.90 0.83 4.11
4 9 -8.22 7.45 0.84 5.21
5 4 -5.46 1.17 0.12 3.25
6 4 -11.90 11.47 -0.86 2.98
7 2 -17.84 13.94 4.95 5.10
8 8 -6.00 3.48 * *
9 2 -3.55 0.49 -1.00 4.67
10 4 -3.78 4.81 1.26 4.68
11 2 -6.50 0.71 -0.20 2.04
12 6 -4.23 8.02 -2.18 2.27
13 7 -2.33 2.82 0.30 2.18
14 9 -5.70 3.05 -1.71 4.20
15 7 -7.37 3.95 -0.55 3.26
16 12 -3.20 3.38 -0.79 2.93
* NDF was not specified in the ration formulations for Farm 8.
Data from Dou et al, 2003.
49
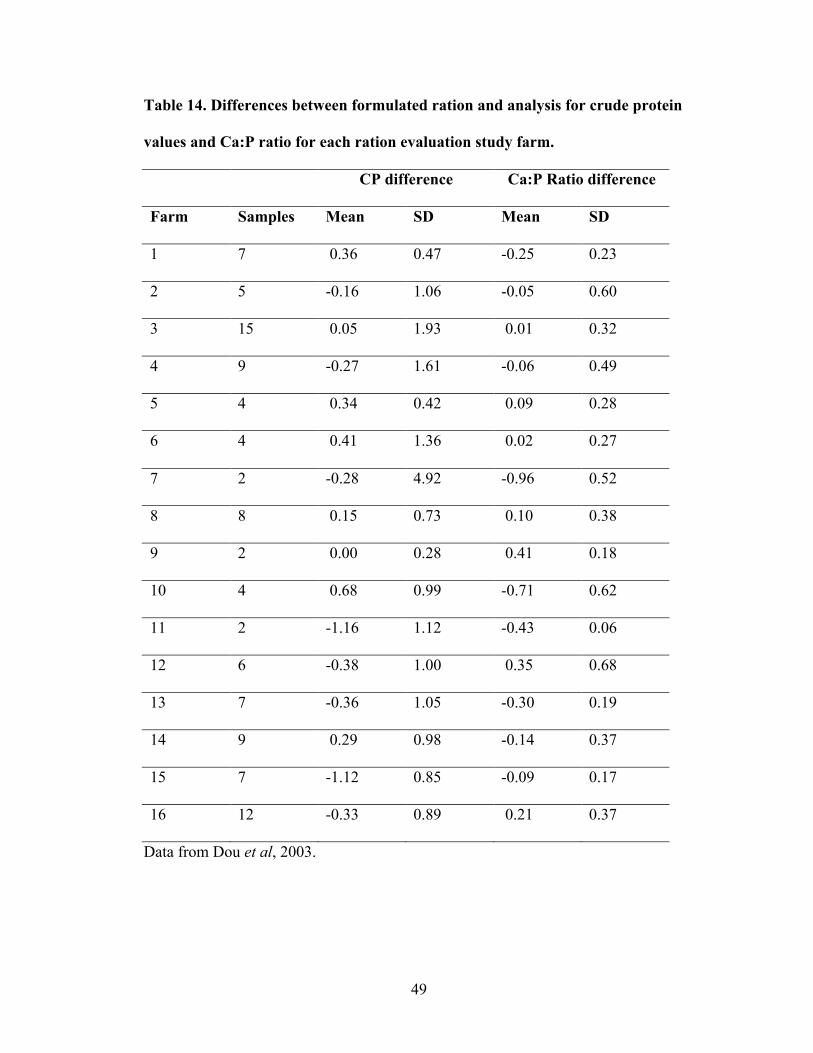
Table 14. Differences between formulated ration and analysis for crude protein
values and Ca:P ratio for each ration evaluation study farm.
CP difference Ca:P Ratio difference
Farm Samples Mean SD Mean SD
1 7 0.36 0.47 -0.25 0.23
2 5 -0.16 1.06 -0.05 0.60
3 15 0.05 1.93 0.01 0.32
4 9 -0.27 1.61 -0.06 0.49
5 4 0.34 0.42 0.09 0.28
6 4 0.41 1.36 0.02 0.27
7 2 -0.28 4.92 -0.96 0.52
8 8 0.15 0.73 0.10 0.38
9 2 0.00 0.28 0.41 0.18
10 4 0.68 0.99 -0.71 0.62
11 2 -1.16 1.12 -0.43 0.06
12 6 -0.38 1.00 0.35 0.68
13 7 -0.36 1.05 -0.30 0.19
14 9 0.29 0.98 -0.14 0.37
15 7 -1.12 0.85 -0.09 0.17
16 12 -0.33 0.89 0.21 0.37
Data from Dou et al, 2003.

50
The differences between fed and formulated rations were examined for relationships
using a test of Spearman’s rank correlation coefficient, listed in Table 15. Changes in
NDF were found to have an inverse relationship to DM, CP, and Ca:P ratio. Changes
in DM were found to have a positive statistical relationship to Ca:P ratio.
Table 15. Correlation between changes in ration DM, NDF, CP, and Ca:P
(n=103 TMR samples).
Variables Correlation coefficient Prob. > |Spearman’s Rho|
DM, NDF -0.1292 0.0366
DM, Ca:P ratio 0.2781 0.0290
NDF, CP -0.2407 0.0313
NDF, Ca:P ratio -0.2157 0.0154
Data from Dou et al, 2003.
Time intervals between formulation and ration evaluation study ranged from 0 to 149
days; the distribution of time intervals, as measured in “number of days since
formulation,” is shown in Figure 8. No relationship was found between number of
days since formulation and magnitude of as-fed ration error for values of DM, NDF,
crude protein, or Ca:P ratio; absolute values and squares of the differences were also
tested.

51
Figure 8. Frequency distribution of samples by number of days between TMR
formulation and ration evaluation analysis.
52
Chapter 5: Discussion
A. Utility of on-farm DM analysis
By enabling the producer to account for changes in forage moisture weight, on-farm
forage DM analysis can improve efficiency of the feeding regimen on dairy farms
that weigh out forage (usually silage) for use in TMRs. Adjusting for changes in DM
to find the correct weight of feed can prevent underfeeding, which may cause
production losses, and overfeeding, which may increase wasted nutrients. Monitoring
and adjusting for changes in forage DM, especially when there are multiple forages to
be analyzed per farm, needs to have a pay-off that exceeds the cost in time and
resources needed to perform the analysis required to enable adjustments.
Recommendations that encourage on-farm DM analysis may be improved by
including caveats about when usage may have a net benefit. For less frequent uses of
on-farm DM analysis, such as checking forage moisture prior to ensiling, the same
caveats would not necessarily apply.
The on-farm DM data collection demonstrated that a variety of patterns exist for
silage DM over time; such patterns may not be predictable. For example, Farm A and
Farm B milked 95 cows each, primarily fed corn silage, and reported 22,000 lb and
25,000 lb for RHA milk production, respectively. However, Farm A appeared to have
very consistent silage DM over 21 days (37.30 ± 0.72%), while Farm B silage DM
fell from approximately 37% to 31% over the course of 21 days. Similarly, the NDF
of silage on Farm A appeared to vary less (40.19 ± 1.58%) than that of Farm B (37.24
53
± 2.09%). Changes in NDF may indicate changes in other properties of the feed, such
as protein and mineral content.
In the case of Farm A, on-farm analysis may not have a net benefit simply because, if
the DM and NDF patterns remain consistent beyond the trial, the silage does not
change much. In the case of Farm B, a net benefit of on-farm DM analysis may be
seen if silage DM changes more than silage NDF over time. If both DM and NDF are
fluctuating greatly, DM analysis may still be beneficial; adjusting for changes in DM
does not account for changes in NDF, but variation in DM may compound variation
in NDF or other properties of the forage.
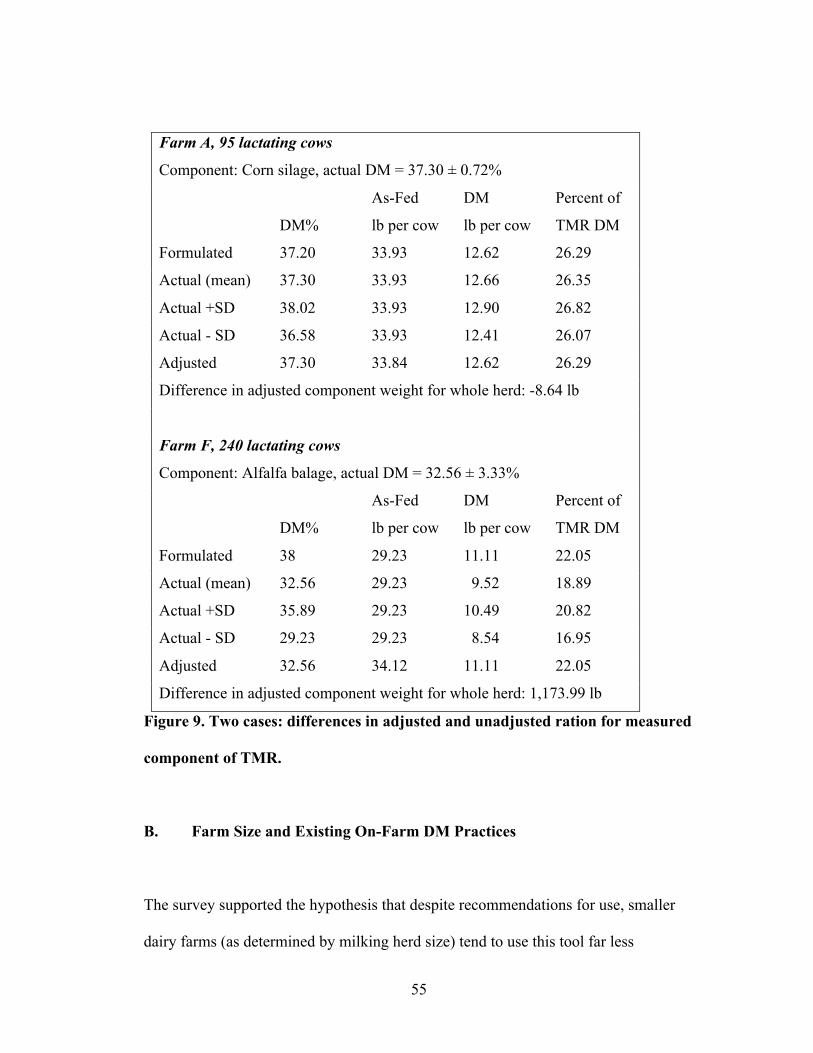
A third case is demonstrated by Farm F, which milked 240 cows, reported 20,000 lb
for RHA milk production, and fed alfalfa balage at the time of the trial. The DM of
the forage appeared to fluctuate daily (32.56 ± 3.33%), and an upward trend from
approximately 28% to 35% was seen over the course of the trial. Meanwhile, NDF
remained consistent at 39.40 ± 1.06% over 21 days. Assuming a negligible sampling
error, Farm F may see a net benefit from routine on-farm DM analysis. From the data
shown in Figure 9, alfalfa balage was formulated at 38% DM, and Farm F was
underfeeding alfalfa balage by about 1.5 lb DM per cow per day on average.
For farms from the ration evaluation study, there were differences between expected
(formulated) and observed (analyzed) DM for TMR samples; the lowest SD of DM
was 1.41% and the highest was 10.32%, but observed SD was less than 5.56% for
54
most of the 16 farms. This variation is slightly larger (1-2%) than the variation seen in
the eight farms that participated in the on-farm DM trial. It is possible that this
difference is due to the fact that TMR contains ingredients of varying moisture
content, in addition to silage. Interestingly, no correlation was found between the time
between formulation and analysis and the size of the difference between DM values,
when looking at the ration evaluation study farms as a group.
One of the more conspicuous factors suspected of affecting forage DM is
precipitation. In the on-farm DM trial, precipitation as was found to increase moisture
by a small amount (-0.13% in DM) from one day to the next for corn silage.
However, it is unknown whether this effect was due to moisture on the silage face or
a more substantial change. Covering the silage face and ensuring that rainwater does
not drain into the silo may be ways to prevent any changes due to precipitation. The
practice of analyzing DM after rain may also help ensure that DM is known.
55
Farm A, 95 lactating cows
Component: Corn silage, actual DM = 37.30 ± 0.72%
DM%
As-Fed
lb per cow
DM
lb per cow
Percent of
TMR DM
Formulated 37.20 33.93 12.62 26.29
Actual (mean) 37.30 33.93 12.66 26.35
Actual +SD 38.02 33.93 12.90 26.82
Actual - SD 36.58 33.93 12.41 26.07
Adjusted 37.30 33.84 12.62 26.29
Difference in adjusted component weight for whole herd: -8.64 lb
Farm F, 240 lactating cows
Component: Alfalfa balage, actual DM = 32.56 ± 3.33%
DM%
As-Fed
lb per cow
DM
lb per cow
Percent of
TMR DM
Formulated 38 29.23 11.11 22.05
Actual (mean) 32.56 29.23 9.52 18.89
Actual +SD 35.89 29.23 10.49 20.82
Actual - SD 29.23 29.23 8.54 16.95
Adjusted 32.56 34.12 11.11 22.05
Difference in adjusted component weight for whole herd: 1,173.99 lb
Figure 9. Two cases: differences in adjusted and unadjusted ration for measured
component of TMR.
B. Farm Size and Existing On-Farm DM Practices
The survey supported the hypothesis that despite recommendations for use, smaller
dairy farms (as determined by milking herd size) tend to use this tool far less

56
frequently than larger farms, which agreed with previous a previous finding by Dou et
al (2003). This could be explained in part by the fact that smaller farms do not benefit
from economies of scale, and have limited economic resources and limited manpower
available for nonessential tasks.
The survey results were more skewed toward larger farms than the latest census data
(2007) indicated for the population of farms in Maryland. This skew, visible in
Figure 10, may reflect the fact that the survey was not designed to be truly
representative and may have overrepresented farms that were in “higher producing”
dairy counties and farms that were members of Maryland Dairy Industry Association
(from which addresses were obtained). However, a possibility exists that these data
reflect the continuation of the modern historical trend toward larger farms.
For those farms that did analyze forage DM on-farm, the Koster Moisture Tester and
microwave oven methods were used, but not any kind of electronic DM analysis
device. This could have been due to cost and perceived reliability. Microwave ovens
are very common in home and workplace settings, and are likely to have been
purchased primarily for uses other than DM analysis, thus incurring no extra cost
other than electricity. At the time of the survey, the price of a Koster unit was
approximately $350, compared to $200 for the Farmex 1210 Electronic Silage Tester,
which was the least expensive electronic silage DM analysis device found.

57
Figure 10. Distribution of 31 surveyed farms versus distribution of 663 dairy
farms in Maryland from the 2007 Census of Agriculture, USDA Agriculture
Statistics Service.
Though microwave ovens can vary in heating power and interface complexity, most
operators can be assumed to be familiar with the procedure of using microwave
ovens. Similarly, the Koster method is straightforward and intuitive, as it simply uses
hot air to dry the sample. While the Farmex 1210 electronic device was less
expensive than a Koster unit and requires less time to operate (15-20 minutes vs. 40-
90 minutes), most operators would find that the electronic device has both an
unfamiliar procedure and an unclear mechanism of action, which would work against
purchase of the of the electronic device. Additionally, feedback from operators

58
indicates that compressing the sample in the Farmex 1210 device is physically
strenuous.
The eight farms that participated in on-farm DM data collection were heterogeneous
according to their survey statistics, representing several herd sizes, two common
silage types, and all three on-farm DM analysis behaviors (use of Koster Moisture
Tester, microwave, or no on-farm analysis). Although heterogeneity can make
interpretation more challenging, heterogeneity also increases the robustness of
statistical trends found, and helps to ensure that the scope of the study results is not
limited to these specific farms. Results may be most readily applicable to farms of the
north-eastern US type, which tend to grow their own feed, tend to have small herds,
and exist in a climate with four distinct seasons.
C. Utility of Farmex 1210 Portable Electronic Silage Tester
For a DM measurement to be meaningful, the uncertainty in the measurement would
need to be less than the uncertainty in the silage. The Farmex 1210 device seemed
promising as an affordable, efficient tool. Farmex product literature claims that the
device is accurate within “2% (average) for silage under 50% moisture” and within
“3% (average) for silage over 50% moisture.” For the Farmex 1210 electronic devices
used in the trial, the uncertainty around the measurements exceeded variation in the
silage even for farms with the greatest variation (e.g. Farm F, with a standard
deviation of 3.33% for alfalfa balage DM).

59
The Farmex 1210 silage DM analysis device did not compare well to the standard
method (two-step oven method). The limits of agreement (Results Table 8) with the
standard method were very broad. If a DM measurement was 40% by the standard
method, 95% of the results found by the electronic method could be expected to fall
somewhere 32.32% and 48.97% in-lab or 32.03% and 51.60% on-farm. Although the
device may present some advantage in price and the brevity of its procedure, the
device does not appear to be useful for the purpose of analyzing silage DM on farms
like the ones in the trial. As could be expected, the in-lab measurements showed a
slightly smaller difference (0.65 ± 4.25%) from standard DM than the on-farm
measurements (1.82 ± 4.99%).
Despite unfamiliarity with the procedure, there was no observable “learning curve”
for on-farm operators using the Farmex 1210 device on six of the eight farms that
performed DM data collection. Two explanations for this outcome could be: 1) the
device is easy enough to use that there was no need for “learning” or 2) the device
was difficult to use, and therefore “learning” was too difficult over 21 days. The fact
that two operators seemed to demonstrate “learning” over the course of the trial
would seem to be evidence for the second explanation. The smaller SD exhibited in
the in-lab DM results could also support the second possibility, as the lab operator
had more thorough training and more experience using the device in general.
However, there is no way to truly distinguish whether either of the explanations is
true from the data gathered. If it were necessary, such information might be gleaned

60
from a longer trial than 21 days. A third possibility may be that the device itself
changed with use over time, or the forage changed, causing the two farms (Farm E
and Farm H) to exhibit a false “learning curve.”
A possible flaw in the design of the on-farm DM trial was failure to pre-test all of the
individual devices used in the lab and in the field to make sure that they were all fully
operational and acted in a similar way to each other. It is possible that the accuracy of
each device varies. However, except for Farm G (corn silage), the mean difference
between on-farm DM and standard DM for each farm does tend to tend increase as
the mean of the averages of the values increases, suggesting that the devices did
exhibit similar behavior.
D. Relationship Between NDF and DM
Changes in DM reflect changes in water or moisture content only, while changes in
NDF tend to reflect changes in the nutrient content of the DM itself. The inverse
relationship between DM and NDF, seen in both the on-farm DM trial and the ration
evaluation study, makes sense biologically; NDF tends to decrease as a percentage of
total DM as corn plants age. However, the statistical analysis on data from the ration
evaluation study and from the on-farm DM trial suggested that the amount of
variability of DM was not necessarily related to amount of variability of NDF.
Therefore, measuring them independently may be necessary for each farm.

61
Some farms in the on-farm DM trial had far greater variation in DM than others. The
alfalfa silage (Farm F and Farm G) in particular exhibited the greatest variation in
DM, but had the lowest variation in NDF. The alfalfa balage from Farm F showed a
positive correlation between DM and NDF, likely because the alfalfa was cut and
baled while in the young vegetative stage when NDF comprises a larger portion of
DM. The lack of a positive correlation of DM and NDF for alfalfa could also result
from the fact that alfalfa may be pre-wilted before ensiling, unlike whole-plant corn.
Because of its relatively small initial size, alfalfa may be less likely to be chopped
into small pieces prior to ensiling, as was true with the alfalfa balage. This may cause
a larger variety of particle sizes and greater difficulty in truly representative sampling.
Alfalfa particles may also simply be less absorbent than corn particles, leading to a
pooling effect of moisture, which would increase the necessity of taking a larger
initial sample and subsampling correctly for these silages.
For farms in the on-farm DM trial, corn silage seemed to be more even in moisture
than alfalfa, but more likely to vary in NDF. It is possible that this is due to the
difference in size and age between corn and alfalfa plants; individual corn plants in a
crop may vary from each other more than individual alfalfa plants.

62
E. Future Directions
Because patterns of DM and NDF variation differ from farm to farm, or from silo to
silo, it may be beneficial for farms to analyze silage to establish what pattern is
specifically applicable. More research is needed to determine whether these patterns
hold over extended periods of time. For example, do bunker silos, which may contain
several months’ feed tend to show the same pattern of DM and NDF variability all the
way through? Additionally, would variability depend on silage type or some other
identifiable silage management practice?
Some farms in the on-farm DM trial had silage DM that varied from day to day or
sample to sample while the mean DM did not change from week to week. More
research is needed to determine the effect of this kind of day-to-day variability on
nutrient utilization efficiency and milk production. Some research has shown that
when crude protein is changed from “high” to “low” around a target mean every 48
hours, nitrogen utilization efficiency increases in growing lambs and finishing cattle
(Archibeque et al, 2007; Doranalli et al, 2011). Additional research is needed to
determine the effects of such variation on dairy cattle, especially fully grown animals.
If day-to-day variability does not cause adverse changes to health, milk production, or
nutrient utilization efficiency, adjusting DM daily should not be recommended.
Instead, the goal of on-farm DM analysis would be to ensure that the mean DM is on
target over the course of several days.

63
For those farms that stand to benefit from routine on-farm DM measurement, an
accurate method is necessary. Repeating the current on-farm DM study using the
Koster Silage Moisture Tester, microwave, or other similar device could be useful.
Oetzel et al. found that the microwave method to be “most repeatable” and “most
accurate” compared the 100°C oven when the microwave, Koster, and electronic
silage DM devices were tested in the laboratory; research is needed to replicate such
results and determine whether they would remain valid in a field setting.
Different forages show different variability in DM and in other measurements of
nutrient content. Currently, there are no models available to accurately predict
variability in forages. Development of such models for different forages (e.g.
legumes, grasses, and corn) would provide guidance in discerning when on-farm DM
measurement of specific forages may be beneficial. Before models can be developed,
however, research is needed to determine the extent to which different forages vary.
Silage consistency may be improved with better silage management and special care
during the ensiling process. Feed that is ensiled at an appropriate maturity and DM
and that is packed consistently well may be more consistent in DM throughout the
store. Using the appropriate techniques for the type of silo (e.g. bunker, bag, bale, or
upright) can also be important. Intuitively, improved silage management should
improve consistency of silage, and increase the certainty of DM and other properties
of the silage. More data needs to be collected regarding consistency of silage
throughout the silo, regardless of the quality of management factors.
64
For farms where silage consistency in DM, but not in other silage properties, is a
significant problem, measuring by volume may be a better solution than continually
measuring silage DM. More research would be needed establish recommendations for
this solution, if appropriate.
F. Conclusion
The DM of forages was observed to vary from day to day and week to week on farms
of the size seen in Maryland. This variation differs among individual farms and
forage types. The magnitude of variation in TMR DM in the ration evaluation study
was not dissimilar to the magnitude of variation in DM of silage in the on-farm DM
study. In order for recommendations regarding on-farm DM analysis to be worth
following, they must address specific farm circumstances and feeding regimens, and
proper sampling must be stressed. Further research is needed regarding the variability
of specific forages, which can inform recommendations. When on-farm DM analysis
is appropriate, the Farmex 1210 Portable Electronic Silage Tester was not found to be
a suitable tool.
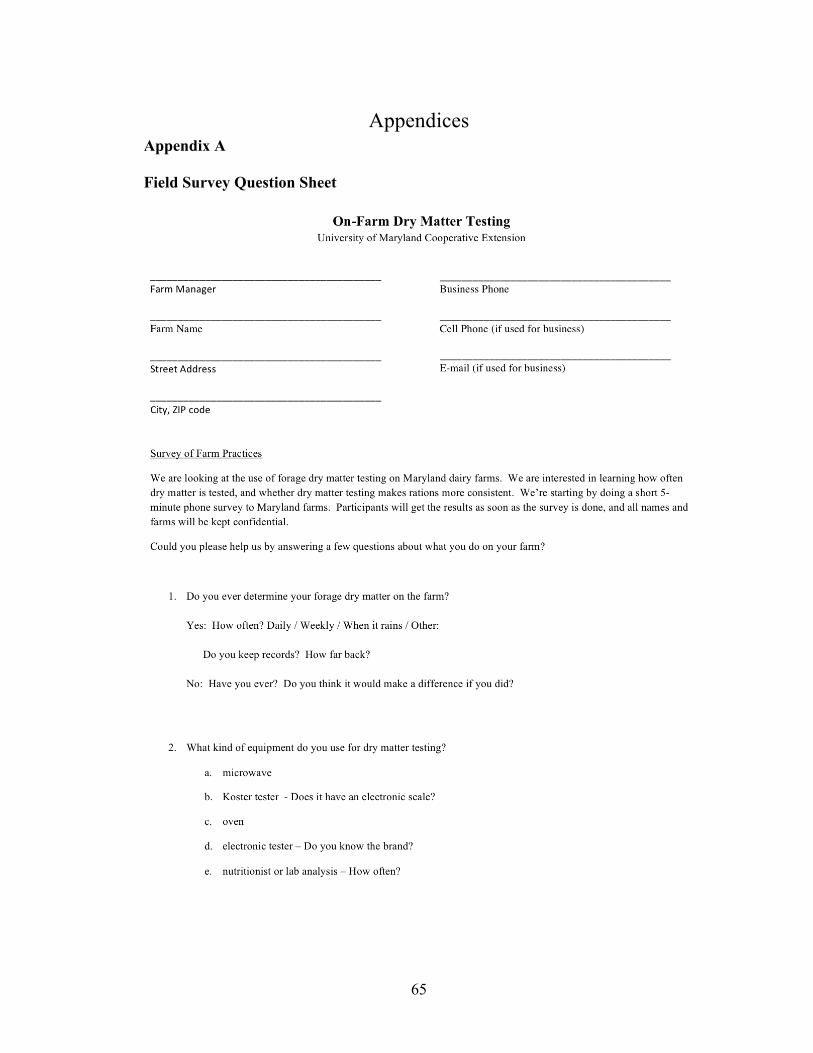
65
Appendices Appendix A
Field Survey Question Sheet

66
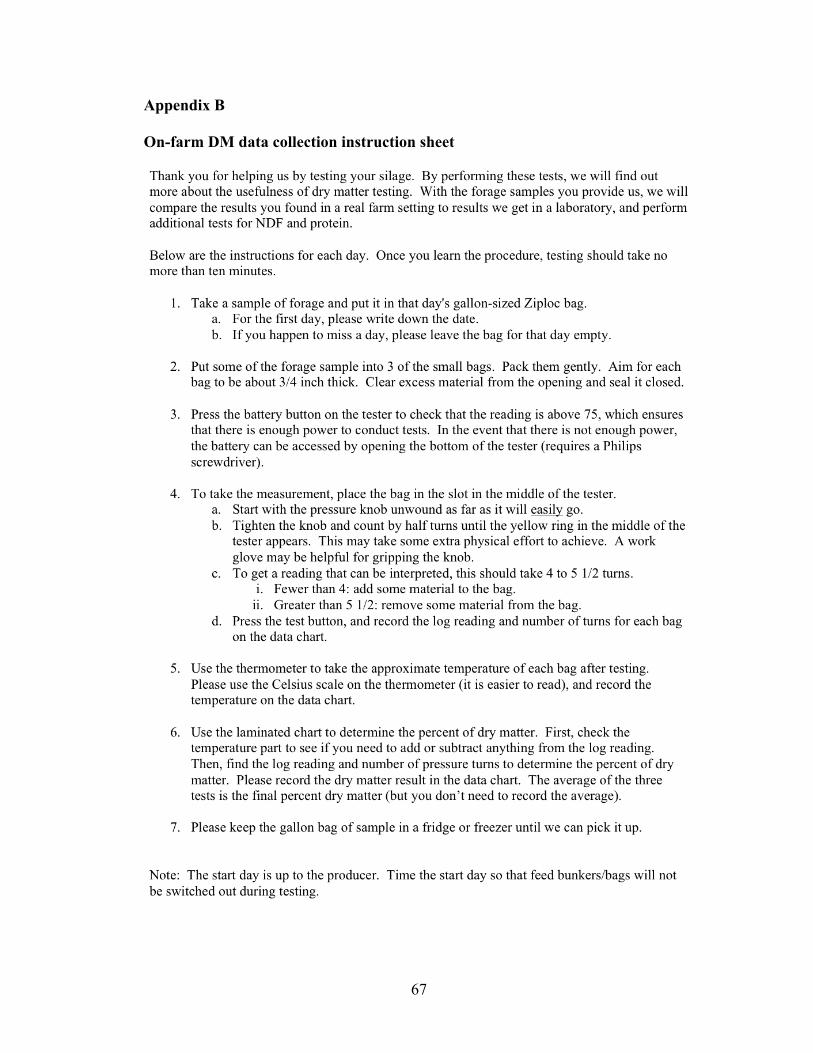
67
Appendix B On-farm DM data collection instruction sheet
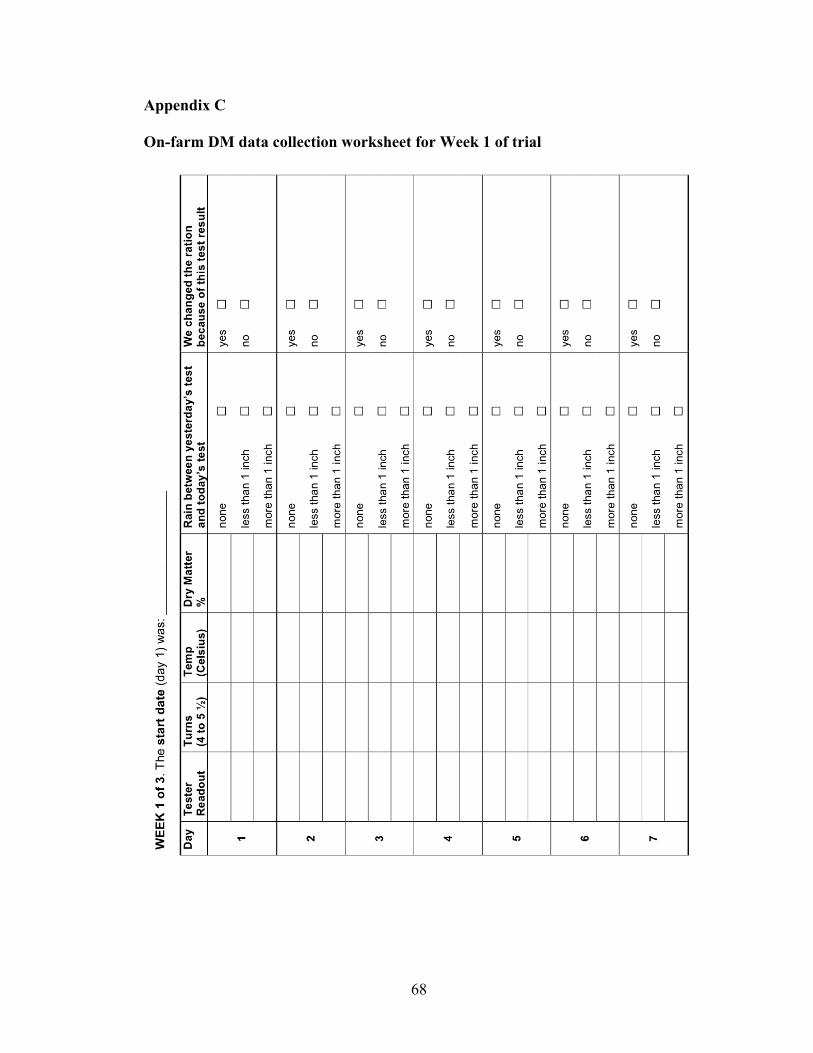
68
Appendix C On-farm DM data collection worksheet for Week 1 of trial

69
Glossary
capacitance the ratio of an impressed electrical charge on a conductor (e.g. water) to the corresponding change in electrical potential Ca:P ratio the total ratio of calcium to phosphorus crude protein (CP) percentage of dry mater consisting of protein, estimated by nitrogen content dry matter (DM) non-water content of a feed or forage
on-farm analysis of - analysis of dry matter content performed on the premises of the farm, usually by farm personnel, with results immediately available for use. off-farm analysis of - analysis of dry matter content performed by an outside agency (e.g. dairy nutritionist, forage laboratory) not on the premises of the farm, with results available upon communication with the laboratory or outside agent
forage cut plant matter, such as hay or silage, fed to grazing animals neutral detergent fiber (NDF) percentage of dry matter comprised by insoluble fiber, assumed to be composed primarily of cellulose, hemicellulose, and lignin from the plant cell wall, as determined by the Van Soest method Rolling Herd Average (RHA) a 365-day trailing average of milk produced per year per cow in a herd
70
silage forage preserved by anaerobic fermentation in a silo (i.e. made by ensiling)
balage silage made by sheathing bales of plant matter with airtight plastic haylage silage made with grass or legume plant matter that has been cut and partially desiccated, e.g. alfalfa hay
total mixed ration (TMR) a method of feeding in which all components of a nutritionally complete diet are fed as a relatively uniform mixture
71
Bibliography
Altman, D.G. and J.M. Bland. 1983. Measurement in medicine: the analysis of method comparison studies. The Statistician. Institute of Statisticians. 307-317. Anonymous (Editor). 2011. A quick test for adjusting silage feeding rate. Forage. http://progressiveforage.com/index.php?option=com_content&view=article&id=466:0107. Accessed 2/3/2011. Archibeque, S.L., H.C. Freetly, N.A. Cole, and C.L. Ferrell. 2007. The influence of oscillating dietary protein concentrations on finishing cattle. II. nutrient retention and ammonia emissions. J. Anim. Sci. 85:1496-1503. Bernard, J.K. 2010. Measuring the Dry Matter Content of Feeds SB 58. University of Georgia. http://www.caes.uga.edu/publications/pubDetail.cfm? pk_id=7730. Accessed 2/3/2011. Bland, J.M. and D.G. Altman. 1995. Comparing methods of measurement: Why plotting difference against a standard method is misleading. Lancet. 346:1085-1087. Brahmakshatriya, R. D., and J. D. Danker. 1971. Five methods for determination of silage dry matter. J. Dairy Sci. 54:1470. Broderick, G.A. 2003. Effects of varying dietary protein and energy levels on the production of lactating dairy cows. J. Dairy Sci. 86:1370–1381. Burgos, S.A., J.G. Fadel, and E.J. DePeters. Prediction of Ammonia Emission from Dairy Cattle Manure Based on Milk Urea Nitrogen: Relation of Milk Urea Nitrogen to Urine Urea Nitrogen Excretion. J. Dairy Sci. 90:599-5508. Chase, LE. 1993. Developing nutrition programs for high producing dairy herds. J Dairy Sci. 76:3287-3293.

72
Chambliss, C.G. and Y.C. Newman. 2007. Forage moisture testing. University Cooperative Extension Program, University of Florida. http://edis.ifas.ufl.edu/ag181. Accessed 2/3/2011. Doranalli, K., G.B. Penner, and T. Mutsvangwa. 2011. Feeding oscillating dietary crude protein concentrations increases nitrogen utilization in growing lambs and this response is partly attributable to increased urea transfer to the rumen. J. Nutr. 141:560-567. Dou, Z., J.D. Ferguson, J. Fiorini, J.D. Toth, S.M. Alexander, L.E. Chase, C.M. Ryan, K.F. Knowlton, R.A. Kohn, A.B. Peterson, J.T. Sims, and Z. Wu. 2003. Phosphorus Feeding Levels and Critical Control Points on Dairy Farms. J. Dairy Sci. 86:3787-3795. Farmex, Inc. 2008. 1210 Portable Silage Tester Features. http://worendsgroup.com/electronics/. Accessed 7/29/2008. Farmex, Inc. 2008. Farmex Model 1210 Silage Tester Owner’s Manual. Streetsboro, OH. Fox, D. G., L. O. Tedeschi, T. P. Tylutki, J. B. Russell, M. E. Van Amburgh, L. E. Chase, A. N. Pell, and T. R. Overton. 2004. The Cornell Net Carbohydrate and Protein System model for evaluating herd nutrition and nutrient excretion. Anim. Feed Sci. Technol. 112(1-4):29-78. Gay, S.W. 2009. Determining forage moisture concentration. Virginia Cooperative Extension, Virginia Tech. http://pubs.ext.vt.edu/442/442-106/442-106.html. Accessed 2/3/2011. Grant, R.J. and J.L. Albright. 2001. Effect of Animal Grouping on Feeding Behavior and Intake of Dairy Cattle. J. Dairy Sci. 84:156-163. Haigh, P.M. 1979. A short note on the relationship between oven and toluene dry matter in maize silage. Journal of the Science of Food and Agriculture. 30:543-545. Holter, J. B. 1983. Aspects of storing and sampling ensiled forages. J. Dairy Sci. 66:1403.
73
Jonker, J.S., R.A. Kohn, and J. High. 2002. Dairy herd management practices that impact nitrogen utilization efficiency. J. Dairy Sci. 85:1218-1226. Jonker, J.S., R.A. Kohn, and J. High. 2002. Use of milk urea nitrogen to improve dairy cow diets. J. Dairy Sci. 85:939-946. Kohn, R.A. 2007. Invited symposium paper: How dairy cattle diet formulation can deal with uncertainty. The Professional Animal Scientist. 23. Kohn, R.A. 2008. Invited Symposium Paper: How Dairy Cattle Diet Formulation Can Deal with Uncertainty. Prof. Anim. Sci. 23:272-276. Kohn, R. A., K. F. Kalscheur, and E. Russek-Cohen. 2002. Evaluation of models to estimate urinary nitrogen and expected milk urea nitrogen. J. Dairy Sci. 85:227–233. Kohn, R. A., K. R. French, and E. Russek-Cohen. 2004. A comparison of instruments and laboratories used to measure milk urea nitrogen in bulk-tank milk samples. J. Dairy Sci. 87:1848–1853. Kohn, R.A., M.M. Dinneen, and E. Russek-Cohen. 2005. Using blood urea nitrogen to predict nitrogen excretion and efficiency of nitrogen utilization in cattle, sheep, goats, horses, pigs, and rats. J. Anim. Sci. 83:879-889. Koster Moisture Tester, Inc. Instructions for preparing your crops. http://www.kostercroptester.net/directionsforuse.html. Accessed 2/15/2011. Lorenzen, T. J., and L. C. Vance. 1986. The economic design of control charts: A unified approach. Technometrics 28:3–10. Mertens, D.R., K. Bolton, and M. Jorgensen. 2004. Measure dry matter routinely on the farm and make rations more consistent. Using a food dehydrator helps. United States Dairy Forage Research Center, Madison, WI. 49-52. Muck, R.E. and B.J. Holmes. 2000. Factors affecting bunker silo densities. Appl. Eng. Agric. 16:613-619.
74
Oetzel, G.R., F.P. Villalba, W.K. Goodger, and K.V. Nordlund. 1993. A comparison of on-farm methods for estimating the dry matter content of feed ingredients. J. Dairy Sci. 76:293-299. National Agricultural Statistics Service. 2007. Milk cow herd size by inventory and sales. United States Department of Agriculture 2007 Census of Agriculture. National Research Council. 2001. Nutrient Requirements of Dairy Cattle. 7th rev. ed. Natl. Acad. Sci., Washington, D.C. Natural Resources Conservation Service. 2001. Nutrient management. Natural Resources Conservation Service Conservation Practice Standard Code 590-1. USDA-NRCS. Spokane, WA. Peterson, A.B., K.R. French, E. Russek-Cohen, and R.A. Kohn. 2004. Comparison of analytical methods and the influence of milk components on milk urea nitrogen recovery. J. Dairy Sci. 87:1747-1750. Petit, H.V., C. Lafreniere, and D.M. Veira. 1997. A comparison of methods to determine dry matter in silages. J. Dairy Sci. 80:558-562. Porter, M.G. and R.S. Murray. 2001. The volatility of components of grass silage on oven drying and the inter-relationship between dry matter content estimated by different analytical methods. Grass and Forage Science. 56:405-411. Stallings, C.C. and M.M. McGilliard. 1984. Lead factors for a total mixed ration formulation. J. Dairy Sci. 67:902-907. St-Pierre, N.R. and B. Cobanov. 2007. A model to determine the optimal sampling schedule of diet components. J. Dairy Sci. 90:5383-5394. St-Pierre, N.R. and B Cobanov. 2007. Optimal sampling schedule of diet components: model robustness to departure from assumptions. J. Dairy Sci. 90:5395-5404.

75
St-Pierre, N. 2007. Stochastic Modeling of Biological Systems. Mathematical Modeling in Nutrition and Agriculture. M. D. Hanigan, J. A. Novotny, and C. L. Marstaller eds., Virginia Tech, Blacksburg, VA. 51-67. St-Pierre, N. R., and C. S. Thraen. 1999. Animal grouping strategies, sources of variation, and economic factors affecting nutrient balance on dairy farms. J. Anim. Sci. 77(Suppl. 2):72–83. Tozer, P. R. 2000. Least-cost ration formulations for Holstein dairy heifers by using linear and stochastic programming. J. Dairy Sci. 83:443–451. Tyler, H.D. and M.E. Ensminger. 2006. Dairy Cattle Science, 4th Ed. Pearson Prentice Hall. Upper Saddle River, NJ. Undersander, D., D.R. Mertens, and N. Thiex. 1993. Forage Analysis Procedures. National Forage Testing Association, Omaha, NE. U.S. Department of Agriculture, National Agricultural Statistics Service, Milk Disposition and Income Final Estimates 1998-2002, May 2004; Milk Disposition and Income Final Estimates 2003-2007, May 2009; Milk Cows and Production, Final Estimates 2003-2007, March 2009; and Milk: Production, Disposition, and Income 2009 Summary, April 2010. Windham, W.R., J.A. Robertson, and R.G. Leffler. A comparison of methods for moisture determination of forages for near infrared reflectance spectroscopy calibration and validation. 1987. Crop Sci. 27:777-783.


![Feeding the World - APES · 2019-08-13 · Feeding the World [Notes/Highlighting] Joel Salatin at his Polyface Farm. A Farm Where Animals Do Most of the Work I . t is common for a](https://img.pdfslide.us/doc/110x75/5edb42a5ad6a402d666561cf/feeding-the-world-apes-2019-08-13-feeding-the-world-noteshighlighting-joel.jpg)