Embed Size (px)
Citation preview

ABSTRACT
Title of Document: EXTENSIVE GREEN ROOF SUBSTRATE
COMPOSITION: EFFECTS OF PHYSICAL
PROPERTIES ON MATRIC POTENTIAL,
HYDRAULIC CONDUCTIVITY, PLANT
GROWTH, AND STORMWATER
RETENTION IN THE MID-ATLANTIC.
Whitney Nicole Griffin,
Doctor of Philosophy, 2014
Directed By: Professor, John D. Lea-Cox, Department of Plant
Science and Landscape Architecture
and
Professor of Practice, Steven M. Cohan,
Department of Plant Science and Landscape
Architecture
While green roof (GR) systems have gained popularity as storm water
management tools, more emphasis has been applied to studying performance aspects,
including stormwater retention. Of particular importance is the substrate layer in
which the vegetation grows, which contributes the majority of stormwater retention
capabilities. This research investigated many aspects of GR substrate performance,
including component durability and component effects on hydraulic conductivity,

matric potential, and plant growth. Several commercial substrate blends were tested
for durability against successive freeze/thaw cycles with before and after-treatment
granulometric distribution analyses. All substrate blends showed significant (p<0.05)
particle degradation after 30 freeze-thaw cycles, compared to German (FLL)
guidelines. The hydraulic conductivity and matric potential of three experimental GR
substrates with increasing volumetric proportions (10%, 20%, 40%) of organic matter
(OM), were determined using the HYPROP© method, which extends the traditional
measurement range for soils. However, the high porosity of GR substrates resulted in
tensiometer water column cavitation near -30kPa. Further studies with the same
experimental substrates and OM ratios included both growth chamber studies to
rigorously quantify the effects on plant growth and evapotranspiration and outdoor
platform experiments to determine effects of OM content on stormwater retention.
Growth chamber studies with Sedum kamptschaticum showed that increasing
substrate OM increased plant root and shoot biomass. Consecutive periods of water
stress showed no differences in evapotranspiration between planted substrate OM
treatments levels, but greater water loss was noted from the planted treatments
compared to unplanted controls (p<0.05). Substrate volumetric water content (VWC)
during the stress periods reached 5% VWC for all planted treatments and all dry-
down periods, highlighting differences in plant-available water between these and the
laboratory results. While outdoor platform studies showed no effects of OM content
on stormwater retention, increasing organic content increased plant canopy coverage
(p<0.05). It is likely that differences in retention will be more defined over time as the
system matures. Stormwater retention data represented the second growing season for

the experimental platforms; given the effects of organic matter on plant growth,
analysis of three- or even five-year retention will likely better predict the effects of
organic matter on stormwater performance.

EXTENSIVE GREEN ROOF SUBSTRATE COMPOSITION: EFFECTS OF
PHYSICAL PROPERTIES ON MATRIC POTENTIAL, HYDRAULIC
CONDUCTIVITY, PLANT GROWTH, AND STORMWATER RETENTION IN
THE MID-ATLANTIC
By
Whitney Nicole Griffin
Dissertation submitted to the Faculty of the Graduate School of the
University of Maryland, College Park, in partial fulfillment
of the requirements for the degree of
Doctor of Philosophy
2014
Advisory Committee:
Professor John D. Lea-Cox, Co-Chair
Professor Steven M. Cohan, Co-Chair
Professor Allen P. Davis
Professor Andrew G. Ristvey
Professor Joseph H. Sullivan

© Copyright by
Whitney Nicole Griffin
2014
ii
Dedication For my grandmother Marcelle, who watched the final year of this journey from a
happier place.
“Our hearts would lose their tenderness if we never shed a tear” – Marcelle Waldrep

iii
Acknowledgements
I would like to acknowledge the support and love from my parents, family, and
friends throughout the completion of this work. I want to specifically thank my
mentor, Dr. Joe Eakes, who took the time to nurture and inspire me, even 800 miles
away. I thank my devoted and supportive committee: Dr. Allen Davis, Dr. Andrew
Ristvey, and Dr. Joseph Sullivan for excellent feedback and guidance throughout the
completion of this work. My major advisors, Dr. Steve Cohan and Dr. John Lea-Cox
were integral to my success – they provided encouragement and support throughout
this process, from securing funding to writing the dissertation.
Leo Rivera at Decagon Devices went above and beyond, helping me troubleshoot
software issues and file compatibility issues for the HYPROP© system. Without his
help the learning curve for this instrument would have been doubled. Dr. Olyssa
Starry at Portland State University shared her extensive knowledge of green roof
hydrology with me and provided excellent feedback and support throughout the
completion of this work. Countless other colleagues have offered support, ideas, and
feedback – Clark DeLong, Dr. Elizabeth Fassman-Beck and Dr. Robyn Simcock
especially.
This work was funded by the Maryland Department of Natural Resources through the
Maryland Industrial Partnerships Program. I also received funding from the Wallace
Bailey Endowment and the Maryland Water Resources Fund. Special thanks to
Emory Knoll Farms and Ed Snodgrass, and to Furbish and Michael Furbish for
donating materials and more importantly, industry perspective.

iv
Table of Contents
Dedication ..................................................................................................................... ii
Acknowledgements ...................................................................................................... iii List of Tables…………………………………………………………………………vi List of Figures………………………………………………………………………..vii
Chapter 1: Literature Review………………………………………………………...16
1.1 Urbanization and its effects on stormwater .......................................................... 16
1.3 Green Roof Substrates .......................................................................................... 28 1.3.1 Substrate Organic Matter ........................................................................... 31 1.3.2 Inorganic Substrate Materials .................................................................... 34
1.4 Green Roof Plants ................................................................................................. 37
1.5 Statement of Research Objectives ........................................................................ 39 Chapter 2: Evaluating ready-to-plant commercial green roof substrates for durability
to freeze/thaw cycles ................................................................................................... 40 2.1 Introduction ........................................................................................................... 40
2.2 Materials and Methods .......................................................................................... 44 2.2.1 Commercial Substrate Blends .................................................................... 44 2.2.2 Established Green Roof Sampling ............................................................. 46
2.3 Results and Discussion ......................................................................................... 47 2.3.1 Commercial Substrate Blends .................................................................... 47
2.3.2 Established Green Roof Sampling ............................................................. 51 2.4 Discussion ..................................................................................................... 55
2.4 Conclusions ........................................................................................................... 58
Chapter 3: Using the HYPROP© procedure to determine the matric potential and
hydraulic conductivity of extensive green roof substrates .......................................... 59 3.1 Introduction ........................................................................................................... 59
3.1.1 Substrate Water Holding Capacity and Stormwater Regulations ........... 59
3.1.2 Matric Potential, Hydraulic Conductivity, and Plant Available Water ..... 60 3.1.3 Methods for Determining Matric Potential of Soils and Soilless Substrates
............................................................................................................................. 64 3.2 Materials and Methods .................................................................................... 65
3.3 Results and Discussion ......................................................................................... 74 3.3.1 Field Capacity ............................................................................................ 74 3.3.2 Green Roof Substrate Matric Potential ...................................................... 75 3.3.3 Green Roof Substrates and Hydraulic Conductivity .................................. 77
3.4 Conclusions ........................................................................................................... 80 Chapter 4: Growth and rates of evapotranspiration of container-grown Sedum
kamptschaticum grown in four different green roof substrates in a growth chamber. 82
4.1 Introduction ........................................................................................................... 82 4.1.1 Green Roof Substrates ............................................................................... 83 4.1.2 Green Roof Plants ...................................................................................... 85
4.2 Materials and Methods .......................................................................................... 86 4.3 Results and Discussion ......................................................................................... 88
4.3.1 Destructive Harvests .................................................................................. 88
v
4.3.2 Plant Dry Downs ........................................................................................ 94
4.4 Conclusions ......................................................................................................... 105 Chapter 5: A platform-scale study of the effects of green roof substrate organic
content on the rate of substrate dry down following rain events, storm water retention,
and growth of Sedum kamptschaticum. .................................................................... 107 5.1 Introduction ......................................................................................................... 107 5.2 Materials and Methods ........................................................................................ 109
5.2.1 Platform Construction .............................................................................. 109 5.2.3 Non-destructive Harvests ......................................................................... 115
5.3 Results and Discussion ....................................................................................... 120 5.3.1 Non-destructive Harvests ......................................................................... 120 5.3.2 Volumetric Water Content ....................................................................... 129 5.3.3 Stormwater Retention .............................................................................. 136
5.4 Conclusions ......................................................................................................... 145 Chapter 6: Conclusions ............................................................................................ 147
As green roofs gain popularity as stormwater management tools, regulatory agencies
are defining metrics and setting parameters for green roof performance around the
world. Since these systems are dynamic, it is integral to better define the effects of
components, specifically substrate, on plant growth, hydraulic properties, and
stormwater retention. ................................................................................................ 147
Glossary .................................................................................................................... 159 Bibliography ............................................................................................................. 160

vi
List of Tables
Table 1.1. Percent impervious coverage impacts on stream health Source: Davis and
McCuen,2005………………………………………………………… …………...17
Table 1.2 Example soil thickness of intensive and extensive green roofs as defined by
different authors. Source: Berndtsson, 2010………………………………………...23
Table 2.1. Gravimetric percentages of substrate particles falling within designated
particle ranges of three ready-to-plant commercial green roof substrate blends as
received from the manufacturer and after 30 freeze-thaw cycles. Asterisks indicate
significance*p<0.05,**p<0.01,***p<0.001)……… ………………………….….. 49
Table 2.2. Gravimetric percentages of substrate particles falling within designated
particle ranges of substrates sampled from five green roofs ranging from 3 to 7 years
post-installation in the Mid-Atlantic region. Means (n=5) are presented for each
particle diameter range………… ………………………………………….……… 53
Table 3.1. Various methods of determining soil matric potential. After: Brady and
Weil, 2000, page141……… ………..……………………………..…...……… 65
Table 3.2. Presentation of van Genuchten bimodal (Durner, 1994) parameters for
water retention and hydraulic conductivity of three experimental green roof substrate
blends with increasing volumetric proportions of organic matter (10%, 20%, or
40%)……………... 81
Table 5.1. Table of rain events for which runoff from experimental green roof
platforms planted with increasing proportions of organic matter (10%, 20%, and
40%) was captured. Means (n=4) of retention percent are given. Rain events are
delineated by size (small <12.5mm, medium 12.5-62.5mm, large
>62.5mm)………………………………….. .…143

vii
List of Figures
Fig. 1.1. Map of the CSS and MS4 Areas in Washington, D.C. Source: Casey Trees
Green Build Out Model, 2007…………………………………… …………...… 19
Fig. 1.2. Particle size distribution range for extensive and single-layer extensive green
roof substrates per FLL granulometric guidelines……………………………… … 31
Fig. 2.1. Particle size distribution of a ready-to-plant commercial extensive green roof
substrate (Blend A) manufactured in North America, plotted against FLL guidelines.
Red lines indicate “as received” particle size distribution while blue lines indicate
“after 30 freeze-thaw cycle” particle size distribution……………… …………... 50
Fig. 2.2. Particle size distribution of a ready-to-plant commercial extensive green roof
substrate (Blend B) manufactured in North America, plotted against FLL guidelines.
Red lines indicate “as received” particle size distribution while blue lines indicate
“after 30 freeze-thaw cycle” particle size distribution………………………… ….. 50
Fig. 2.3. Particle size distribution of a ready-to-plant commercial extensive green roof
substrate (Blend C) manufactured in North America, plotted against FLL guidelines.
Red lines indicate “as received” particle size distribution while blue lines indicate
“after 30 freeze-thaw cycle” particle size distribution. …… …… ………………. 51
Fig. 2.4. Particle size distribution from a three year old Mid-Atlantic green plotted
against FLL-recommended granulometric distribution for extensive green roofs .. 54
Fig. 2.5. Particle size distribution from a four year old Mid-Atlantic green plotted
against FLL-recommended granulometric distribution for extensive green roofs…. 54
Fig. 2.6. Particle size distribution from a three year old Mid-Atlantic green plotted
against FLL-recommended granulometric distribution for extensive green roofs…. 55
Fig. 2.7. Particle size distribution from a seven year old Mid-Atlantic green plotted
against FLL-recommended granulometric distribution for extensive green roofs… 55
Fig. 2.8. Particle size distribution from a five year old Mid-Atlantic green plotted
against FLL-recommended granulometric distribution for extensive green roofs…. 56
Fig. 3.1. Graph of volumetric water content versus matric potential with designations
for plant-based terms. From Brady and Weil (2000), Fig. 5.23, page 152… .. …. 62
Fig. 3.2. Photograph illustrating an amended packing procedure for HYPROP© cores
for use with coarse substrates………… … ………………………………..……. 68
Fig 3.3. Photograph illustrating an amended packing procedure for HYPROP© cores
for use with coarse substrates…………………………………………………….... 68

viii
Fig. 3.4. Photograph illustrating an amended packing procedure for HYPROP© cores
for use with coarse substrates ..………………………………………………….... 69
Fig. 3.5. Photograph illustrating an amended packing procedure for HYPROP© cores
for use with coarse substrates …………………..……………………………..…... 69
Fig. 3.6. Diagram of the HYPROP© system illustrating tensiometer placement within
sample cores. From Schindler (2010)………………………………………….....… 70
Fig. 3.7. Screen capture taken from the TensioView software program used in
conjunction with the HYPROP© to show the tension measurements during three
consecutive dry-down runs from a single sensor base. Tension increases as the sample
dries. The light blue line represents the top tensiometer readings, the dark blue line
represents the bottom tensiometer readings, and the dashed vertical line shows
column cavitation………………………………………………………………..….. 72
Fig. 3.8. Matric potential of an extensive green roof substrate with 20% organic
matter, as determined by the HYPROP© method. Three HYPROP© instruments were
used to measure matric potential in three consecutive dry-down periods, for a total of
nine retention curves (all plotted here). Between-replicate effects were non-
significant, so results were averaged together for all treatments ………………….. 74
Fig. 3.9. Hydraulic conductivity K(pf) as determined by the HYPROP© method, for
an experimental green roof substrate with 10% organic matter ………….………. 75
Fig. 3.10. Matric potential of three green roof substrates with increasing volumetric
proportions (10%, 20% and 40%) of organic matter, obtained by using the HYPROP©
system. Means (n = 9) are shown for all treatments …………………………… 76
Fig. 3.11. Hydraulic conductivity for three experimental green roof substrates with
increasing (10%, 20%, and 40%) volumetric proportions of organic matter as
determined by the HYPROP© method. Means (n=9) are presented for each
treatment.………………………………………………………………….……..…..80
Fig. 4.1. Leaf area of Sedum kamptschaticum in three green roof substrates with
increasing volumetric proportions (10%, 20%, and 40%) of organic matter plus an
industry standard control (Rooflite™) substrate. Means (n=3) are shown for each
treatment per harvest date. Letters indicate significance at α=0.05 using Scheffe’s
adjustment for multiple means comparisons ………………………………………. 91
Fig. 4.2. Aboveground biomass fresh weight of Sedum kamptschaticum plants grown
in three green roof substrates with increasing volumetric proportions (10%, 20%, and
40%) of organic matter compared to an industry standard control (Rooflite™)
substrate. Means (n=3) are shown for each treatment per harvest date. Letters indicate
significance at α=0.05 using Scheffe’s adjustment for multiple means
comparison………………………………………………………………………...…92
ix
Fig. 4.3. Aboveground biomass dry weight of Sedum kamptschaticum plants grown in
three green roof substrates with increasing volumetric proportions (10%, 20%, and
40%) of organic matter plus an industry standard control (Rooflite™) substrate.
Means (n=3) are shown for each treatment per harvest date. Letters indicate
significance at α=0.05 using Scheffe’s adjustment for multiple means
comparison…………………………………….……………………..…………..….93
Fig. 4.4. Below-ground biomass fresh weight of Sedum kamptschaticum plants grown
in three green roof substrates with increasing volumetric proportions (10%, 20%, and
40%) of organic matter plus an industry standard control (Rooflite™) substrate.
Means (n=3) are shown for each treatment per harvest date. Letters indicate
significance at α=0.05 using Scheffe’s adjustment for multiple means comparison.
…………………………………………………..………………………….………..94
Fig. 4.5. Below-ground biomass dry weight of Sedum kamptschaticum plants grown
in three green roof substrates with increasing volumetric proportions (10%, 20%, and
40%) of organic matter plus an industry standard control (Rooflite™) substrate.
Means (n=3) are shown for each treatment per harvest date. Letters indicate
significance at α=0.05 using Scheffe’s adjustment for multiple means
comparison………………………………………………….………...….….………94
Fig. 4.6. Root succulence of Sedum kamptschaticum plants grown in three green roof
substrates with increasing volumetric proportions (10%, 20%, and 40%) of organic
matter plus an industry standard control (Rooflite™) substrate. Root succulence
determined by dividing total root length (mm) by root fresh weight (g). Means (n=3)
are shown for each treatment per harvest date. Letters indicate significance at α=0.05
using Scheffe’s adjustment for multiple means comparison….………..….………..95
Fig. 4.7. Total cumulative water lost by Sedum kamptschaticum planted in three
different green roof substrates with increasing volumetric proportions (10%, 20%,
and 40%) of organic matter plus an industry standard control (Rooflite™) and
unplanted pots with the same substrate. This represents the sum of averaged water
loss after three separate 100-mL irrigation events, for a total of three dry-down
periods. Means (n=6 and n = 3 for each planted and unplanted treatment,
respectively) are shown for each treatment. P values indicate significance
(α=0.05)……………….…………………….…………………………….……..…..96
Fig. 4.8. Dry mass of Sedum kamptschaticum grown in three different green roof
substrates with increasing volumetric proportions (10%, 20%, and 40%) of organic
matter plus an industry standard substrate (Rooflite™). Means (n = 3) are shown for
each treatment for each harvest
date……………………………………………………………………..…...……….97

x
Fig. 4.9. Cumulative water loss per gram dry weight of plant biomass by container-
grown Sedum kamptschaticum grown in three different green roof substrates with
increasing volumetric proportions (10%, 20%, and 40%) of organic matter plus an
industry standard substrate (Rooflite™) for the first of three dry downs. Means (n =
6) are shown for each treatment at each measurement
interval………………………………..…………………………………..………….98
Fig. 4.10. Cumulative water loss per gram dry weight of plant biomass by container-
grown Sedum kamptschaticum grown in three different green roof substrates with
increasing volumetric proportions (10%, 20%, and 40%) of organic matter plus an
industry standard substrate (Rooflite™) for the second (top) and third (bottom) of
three dry downs. Means (n = 6) are shown for each treatment at each measurement
interval……………………………………………………….………………..……..99
Fig 4.11. Cumulative water loss of unplanted pots with green roof substrates with
increasing volumetric proportions (10%, 20%, and 40%) of organic matter subtracted
from cumulative water loss of pots planted with Sedum kamptschaticum growing in
the same experimental substrate blends for the first of three dry down periods. Means
(n=3 for unplanted and n = 6 for planted) are displayed.…………………………. 101
Fig 4.12. Cumulative water loss of unplanted pots with green roof substrates with
increasing volumetric proportions (10%, 20%, and 40%) of organic matter subtracted
from cumulative water loss of pots planted with Sedum kamptschaticum growing in
the same experimental substrate blends for the second of three dry down periods.
Means (n=3 for unplanted and n = 6 for planted) are displayed….………………..101
Fig 4.13. Cumulative water loss of unplanted pots with green roof substrates with
increasing volumetric proportions (10%, 20%, and 40%) of organic matter subtracted
from cumulative water loss of pots planted with Sedum kamptschaticum growing in
the same experimental substrate blends for the third of three dry down periods. Means
(n=3 for unplanted and n = 6 for planted) are displayed….………………………..102
Fig. 4.14. In-pot volumetric water content for 500 mL containers planted with Sedum
kamptschaticum in three different green roof substrates with increasing volumetric
proportions (10%, 20%, and 40%) of organic matter plus an industry standard control
(Rooflite™) following the first of three 100 mL irrigation events. Means (n=6) are
shown for each treatment at each measurement interval……………...……………105
Fig. 4.15. Water loss from containers planted with Sedum kamptschaticum in three
different green roof substrates with increasing volumetric proportions (10%, 20%,
and 40%) of organic matter plus an industry control (Rooflite™) normalized by total
replicate leaf area in the first of three dry downs. Means (n= 6) are shown for each
treatment at each measurement interval……………………………………………105

xi
Fig. 4.16. In-pot volumetric water content for 500 mL containers planted with Sedum
kamptschaticum in three different green roof substrates with increasing volumetric
proportions (10%, 20%, and 40%) of organic matter plus an industry standard control
(Rooflite™) following the second of three 100 mL irrigation events. Means (n=6) are
shown for each treatment at each measurement interval...…………...…………….106
Fig. 4.17. Water loss from containers planted with Sedum kamptschaticum in three
different green roof substrates with increasing volumetric proportions (10%, 20%,
and 40%) of organic matter plus an industry control (Rooflite™) normalized by total
replicate leaf area in the second of three dry downs. Means (n= 6) are shown for each
treatment at each measurement interval….……………………..…………………..106
Fig. 4.18. In-pot volumetric water content for 500 mL containers planted with Sedum
kamptschaticum in three different green roof substrates with increasing volumetric
proportions (10%, 20%, and 40%) of organic matter plus an industry standard control
(Rooflite™) following the second of three 100 mL irrigation events. Means (n=6) are
shown for each treatment at each measurement interval...…………….…………...107
Fig. 4.19. Water loss from containers planted with Sedum kamptschaticum in three
different green roof substrates with increasing volumetric proportions (10%, 20%,
and 40%) of organic matter plus an industry control (Rooflite™) normalized by total
replicate leaf area in the second of three dry downs. Means (n= 6) are shown for each
treatment at each measurement interval……………………………………………107
Fig. 5.1. Photograph of construction of the experimental green roof platforms at the
Research Greenhouse Complex, University of Maryland, College Park in May
2012……………………………………………………………………………...…113
Fig. 5.2. Photograph illustrating the removal of all propagation media from plug roots
prior to planting..………………………………………….………………………..114
Fig. 5.3. Diagram illustrating sensor placement for the sixteen experimental
platforms...……………………………………………………………………….…115
Fig. 5.4. Photograph illustrating a TB-4 rain gauge installed on one of the sixteen
experimental platforms…...……………………………………………………..….116
Fig. 5.5. Photograph showing the orientation of the weather station in relation to the
experimental green roof platforms at the University of Maryland Research
Greenhouse Complex………………………………………………………….……117
Fig. 5.6. Photograph of weather station detail……………………………………...118
Fig. 5.7. Photograph illustrating overhead picture-taking for canopy coverage
analysis. October 2013……………………………………………………………...119

xii
Fig. 5.8. Photograph illustrating part of the method of measuring root length...…..120
Fig. 5.9. An example of plant canopy coverage analysis using digital photography.
The number of green pixels on the right would be divided by the total pixels on
the left...…………………………………………………………………………….121
Fig. 5.10. Photograph of grid-based random sampling...…………………………..122
Fig. 5.11. Aboveground biomass fresh weight for Sedum kamptschaticum grown in a
platform-scale green roof field study. Means (n = 4) are shown for each treatment,
letters designate significance at α = 0.05, no letters indicate p>0.05………...…….124
Fig. 5.12. Aboveground biomass dry weight for Sedum kamptschaticum grown in a
platform-scale green roof field study. Means (n = 4) are shown for each treatment,
letters designate significance at α = 0.05.………………………………………..…124
Fig. 5.13. Platform canopy coverage for Sedum kamptschaticum grown in a platform-
scale green roof field study. Means (n = 4) are shown for each treatment, letters
designate significance at α = 0.05……………………………………………...…...125
Fig. 5.14. Leaf area for Sedum kamptschaticum grown in a platform-scale green roof
field study. Means (n = 4) are shown for each treatment, letters designate significance
at α = 0.05, no letters indicate p>0.05..………………………………………….….125
Fig. 5.15. Total canopy leaf area of Sedum kamptschaticum grown in a platform-scale
green roof field study. Results were extrapolated from the product of platform canopy
cover and sample leaf area. Means (n = 4) are shown for each treatment, letters
designate significance at α = 0.05, no letters indicate p>0.05...………………...….126
Fig. 5.16. Shoot succulence for Sedum kamptschaticum grown in a platform-scale
green roof field study. Results were extrapolated from by dividing aboveground
biomass fresh weight by aboveground biomass dry weight. Means (n = 4) are shown
for each treatment, letters designate significance at α = 0.05, no letters indicate
p>0.05………………………………………………………...………………….....127
Fig. 5.17. Belowground biomass fresh weight for Sedum kamptschaticum grown in a
platform-scale green roof field study. Means (n = 4) are shown for each treatment,
letters designate significance at α = 0.05, no letters indicate
p>0.05………………………………………………………………………………128
Fig. 5.18. Belowground biomass fresh weight for Sedum kamptschaticum grown in a
platform-scale green roof field study. Means (n = 4) are shown for each treatment,
letters designate significance at α = 0.05, no letters indicate
p>0.05………………………………………………………………………………129

xiii
Fig.5.19. Root succulence of Sedum kamptschaticum grown in a platform-scale green
roof field study. Means (n = 4) are shown for each treatment, letters designate
significance at α = 0.05, no letters indicate p>0.05…………………………….…..130
Fig. 5.20. Root length of Sedum kamptschaticum grown in a platform-scale green
roof field study. Means (n = 4) are shown for each treatment, letters designate
significance at α = 0.05, no letters indicate p>0.05…………………………….…..131
Fig. 5.21. Root density of Sedum kamptschaticum grown in a platform-scale green
roof field study, determined by dividing belowground biomass fresh weight by total
sample volume. Means (n = 4) are shown for each treatment, letters designate
significance at α = 0.05, no letters indicate p>0.05.………………………………..132
Fig. 5.22. Daily substrate volumetric water content (n=16) at 5:00 AM for
experimental green roof platforms for 2013..…………………………………...….134
Fig. 5.23. Daily precipitation totals for 2013………………………………….…....135
Fig. 5.24. Substrate volumetric water content of platform-scale experimental green
roofs with increasing proportions of organic content following a 10.8 mm rain event
which occurred over 4.5 hours on May 11. Means (n = 16) are shown for each
treatment……………………………………………………………………........…136
Fig. 5.25. Substrate volumetric water content of platform-scale experimental green
roofs with increasing proportions of organic content following an 11.2 mm rain event
which occurred on August 1 occurring over 9 hours, and a 3.6 mm rain event on
August 3 occurring for 1.5 hours. Means (n = 16) are shown for each
treatment………………………………………………………..………………….137
Fig.5.26. Substrate volumetric water content of platform-scale experimental green
roofs with increasing proportions of organic content following an 18.4 mm rain event
which occurred on August 13 which occurred over 24 hours, and a 2.2 mm rain event
on August 16 which occurred over 7.25 hours. Means (n = 16) are shown for each
treatment…………………………………………………………………….…..…137
Fig. 5.27. Substrate volumetric water content of platform-scale experimental green
roofs with increasing proportions of organic content following a 15.0 mm rain event
which occurred over 12.25 hours on August 28, followed by 3 mm event lasting 7
hours on September 2, and a 20 mm event lasting 5 hours on September 12. Means (n
= 16) are shown for each treatment………………………………………………...138
Fig. 5.28. Substrate volumetric water content of platform-scale experimental green
roofs with increasing proportions of organic content following a 28.2 mm rain event
which occurred over 7 hours on September 21. Means (n = 16) are shown for each
treatment……………………………………………………………………………138

xiv
Fig. 5.29. Substrate volumetric water content of platform-scale experimental green
roofs with increasing proportions of organic content during Hurricane Sandy, a 108.4
mm rain event which occurred over 4 days from October 9 to October 13. Means (n =
16) are shown for each treatment…………………………………………………...140
Fig. 5.30. Retention by storm size for experimental green roof platforms planted with
substrates with increasing volumetric (10%, 20%, and 40%) proportions of organic
matter. Events ranged from July 12 to October 9, 2013……………………………143
Fig. 5.31. Retention by intensity (total event volume divided by event duration) for
experimental green roof platforms planted with substrates with increasing volumetric
(10%, 20%, and 40%) proportions of organic matter. Events ranged from July 12 to
October 9, 2013……………………………………………………………….…….144
Figure 5.32. Runoff from experimental green roof platforms planted with substrates
with increasing volumetric (10%, 20%, and 40%) organic matter during a rain event
occurring on August 13, 2013, in which 18.4 mm fell over 24 hours. Means (n = 4)
are shown for each treatment.…………………………………………………...….145
Figure 5.33. Runoff from experimental green roof platforms planted with substrates
with increasing volumetric (10%, 20%, and 40%) organic matter during a rain event
occurring on September 12, 2013, in which 20 mm fell over 5 hours. Means (n = 4)
are shown for each treatment……………………………………………………….146
Figure 5.34. Runoff from experimental green roof platforms planted with substrates
with increasing volumetric (10%, 20%, and 40%) organic matter during rain event
occurring on September 21, 2013, in which 28.2 mm fell over 7 hours. Means (n = 4)
are shown for each treatment...…………………………………………….……….147
Figure 5.35. Runoff from experimental green roof platforms planted with substrates
with increasing volumetric (10%, 20%, and 40%) organic matter during Hurricane
Sandy, which lasted from October 9 to October 13, 2013, in which 108.4 mm fell. n
= 4 for each treatment………………………………………………………………149
Figure B.1. Particle size distribution of recycled brick and scoria which made up the
mineral component of the experimental extensive green roof substrate blends. n = 5
for both treatments and differences determined by independent student’s t test at each
particle diameter with α = 0.05. Significance indicated by **, p<0.01.
…………………………………………………………………………………….. 155
Figure B.2. Particle size distribution of three experimental extensive green roof
blends composed of 60:40 recycled brick:scoria and increasing volumetric
proportions of organic matter plus Rooflite ™, an industry standard blend. n = 5 for
all treatments and differences were determined using Scheffe’s adjustment for multi-
comparisons at α = 0.05……………………………………………………..…….. 156

xv
Fig. C.1 Substrate organic content based on loss on ignition analysis. All roots were
removed by hand from samples of planted treatments. The unplanted treatment was
mixed with 10% organic matter initially. Loss on ignition was achieved by burning
samples in a muffle furnace at 530 C for four hours, following the methodology
outlined by Heiri et al. (2001)..……………………………………………………. 157
Fig. D.1. Particle size distribution of recycled brick and scoria which made up the
mineral component of the experimental extensive green roof substrate blends. n = 5
for both treatments and differences determined by independent student’s t test at each
particle diameter with α = 0.05. Significance indicated by **, p<0.01.…………... 159
Fig. D.2. Photograph illustrating the HYPROP© measurement system being used in
conjunction with Decagon Devices Echo-5TM moisture sensors, which are connected
to an EM-50 data logger. The HYPROP© collected measurements at 10 minute
intervals; the logger recorded by-minute averages every 5 minutes………………. 160
Fig E.1. Extrapolated nutrient availability (N,P,K) per gram for the pot-scale growth
chamber study presented in Chapter 4 and the platform-scale field study presented in
Chapter 5..…………………………………………………………………..…….. 161

16
Chapter 1: Literature Review
1.1 Urbanization and its effects on stormwater
The land area for the contiguous United States is approximately 769 million
hectares (Wuerthner, 2002). Of that, 26 million hectares are classified as urban developed
land, and while this comprises only 3% of the total available land of the lower 48 states,
more than 75% of the U.S. population resides within urban / suburban regions (Wuerthner,
2002). This differs somewhat from a report by the USDA’s Economic Research Service,
which reported in 2006 that only 24 million hectares were attributed to urban developed
land (Lubowski et al., 2006). Wuerthner reports another 56 million hectares is categorized
as developed and rural residential land, commonly referred to as urban sprawl. This
fraction comprises rural and semi-rural subdivisions, as well as rural farm houses and
structures (2002); however, the USDA reports that 38 million hectares of land were
estimated to be rural residential areas with 228 million acres categorized as
‘miscellaneous’ (Lubowski et al., 2006). The USDA also reported that since 1945 the
major uses of land in the U.S. show a trend towards growth in special-use and urban areas
with a decline in grazing lands. Between 1997 and 2002 total cropland area reached a new
57-year low, continuing a downward trend since 1978 (Lubowski, et al., 2006). Despite
variation in the specific numbers, the general trend of increased urbanization in the United
States is clear.
Urban development increases the total acreage of impervious surfaces, which are
surfaces impenetrable to rainfall and prevent filtration and percolation of water. The
District of Columbia Water and Sewer Authority defines an impervious surface as ‘a man-

17
made surface that cannot be easily penetrated by water, such as rooftops, driveways,
patios, tennis courts, parking lots, and other paved areas’ (DCWSA, 2011). Forested and
grassland areas usually allow 70% to 90% of a rainfall event to infiltrate, while impervious
surfaces result in storm water runoff (Ferguson, 1998) with the amounts varying from 80%
in suburban housing areas to 10% in large lots with single homes. The amount of runoff in
dense urban areas may approach 95% (Davis and McCuen, 2005). With increasing
population, land use changes are often significant, resulting in major changes to runoff
characteristics of a watershed (Anderson 1970).
Significant overall reduction of stream and wetland health, begins at only 10%
impervious coverage (Arnold and Gibbons, 1996), as measured by criteria such as
pollutant loads, habitat quality, and aquatic species abundance and diversity. Three
numeric thresholds establish stream health based on percent impervious coverage within
the watershed:
Table 1.1. Percent impervious coverage impacts stream health.
Impervious Coverage Stream Health
<10% Protected
10 to 30% Impacted
≥30% Degraded
Source: Davis and McCuen, 2005.
As stormwater runoff flows over impervious surfaces, pollutants are picked up
from roadways, sidewalks, and roof tops. These materials eventually end up in streams and
wetlands, resulting in damage to the natural ecosystems. Roadways alone play host to

18
countless pollutants, and more are built each year. Over 200K hectares are being paved or
repaved in the United States each year (Ferguson, 1996).
Approximately 70% of the water pollution in the U.S. comes from ‘nonpoint’
sources: the excess pollutants that runoff carries from eroding soil, parking lots, roads, and
intensely maintained lawns; however, storm water runoff can become point source
pollution as well. The EPA defines point source pollution as ‘any single identifiable source
of pollution from which pollutants are discharged, such as a pipe, ditch, ship, or factory
smokestack (Hill, 1997).
Combined sewer systems (CSO’s) are designed to collect rainwater runoff,
domestic sewage, and industrial wastewater in one pipe. These systems usually transport
all of their wastewater into a sewage treatment plant, where it is treated and then
discharged into a nearby body of water, usually a lake or stream. But during periods of
heavy rainfall, the water volume in a combined sewer system often exceeds the capacity of
the system, resulting in the overflow and discharge of untreated wastewater directly into
nearby streams, rivers, and other bodies of water (US EPA, 2011). Approximately 772
cities in the United States have combined sewer systems resulting in CSO’s, which are
classified as point source pollution (US EPA, 2011).
The District of Columbia (DC) surrounds the Anacostia and Potomac Rivers, which
feed into the Chesapeake Bay. As shown below, approximately 42% of DC is serviced by a
combined sewer system.

19
Fig. 1.1. Map of the CSS and MS4 Areas in Washington, D.C.
Source: Casey Trees Green Built Out Model.
CSO discharges are common in DC. Eighty-five percent of all rain events are less than 2.5
cm and on average, rain events of 1.25 cm result in CSO’s in some parts of DC (Casey
Trees, 2007). This is largely due to impervious surface coverage of 42% of the land area.
Of that, 15% is attributed to roof tops, 13% to roads, 5% each to parking lots and
sidewalks with the remaining 6% attributed to driveways and alleys (Casey Trees, 2007).
The bay is unique in many respects. The bay itself is 313 kilometers long and
ranges from 6 to 48 kilometers wide, with a total watershed area of 165,000 kilometers.

20
But the Chesapeake is relatively shallow, averaging only 6.4 meters (Horton, 2003).
Across its watershed, the bay has less than one-tenth volume of water of most other coastal
bays, limiting the ability to absorb and dilute whatever pollutants wash into it (Horton,
2003). This ratio equates to over 2700 square kilometers of land for every cubic kilometer
of water received by the bay (Costanza and Daly, 1987). Efforts to restore the bay have
been hampered due to such large land areas which contribute runoff and pollutants to a
relatively small volume of water.
It is estimated that stormwater runoff contributes 10% of the N, 31% of the P and
19% of the sediment pollution (CBF, 2012). Stormwater runoff is arguably the leading
cause of degradation to the bay watershed’s small tributary streams. A survey conducted in
Maryland in the mid-1990’s concluded that approximately 90% of the state’s 14,000
stream kilometers were in fair to poor health (Horton, 2003). Other studies indicate that
hardening, or developing impervious surfaces, in as little as 10-15% of a stream’s
watershed significantly affects water quality (Horton, 2003), which supports data from
Davis and McCuen (Table 1).
While a number of industries can be held liable for the deterioration of the bay -
including agriculture, energy, and tourism – it is generally agreed upon that restoring the
bay will only result from a collaboration between these and other groups. With that in
mind, managing stormwater loads into the Chesapeake Bay watershed will make a
significant impact on the health of the bay.
One way to manage stormwater is with green infrastructure, which the EPA defines
as an approach to stormwater management that is cost-effective, sustainable, and

21
environmentally friendly (US EPA, 2011). Green infrastructure works to harvest, infiltrate,
reuse, and evapotranspire stormwater to incorporate it back into the water cycle. Green
infrastructure also offers economic and social benefits including increased land values,
reduced energy consumption, and pedestrian and bicycle access (US EPA, 2011). Before
the fruition of green infrastructure, most storm water management options centered around
retention ponds and concrete swales to send untreated storm water hastily into nearby
bodies of water. Because of the limitations of on-site detention, infiltration of urban runoff
to control its volume is a primary goal of green infrastructure. Without infiltration,
municipalities in wetter regions of the country will experience drops in local groundwater
levels, declining stream base flows (Wang et al., 2003), with diminished or stopped flows
from springs feeding wetlands and lakes (Leopold, 1968; Ferguson, 1994). Because
scientists now realize that traditional methods of retention and detention contribute to the
degradation of rivers, lakes, and bays, green infrastructure is utilized at ever-increasing
rates by local municipalities across the U.S. For example, in 1993 the city of Portland,
Oregon offered a $53 per household subsidy in selected neighborhoods for those willing to
redirect roof runoff into their lawns and gardens. As of 2005, forty-seven thousand
households are participating in Portland’s Downspout Disconnect Program, removing
about 4.2 million cubic meters (4.2 billion liters) of stormwater per year from the Portland
combined sewer system (PBES, 2006). Similarly, the city of Chicago created a Green Roof
Grant Program and Green Roof Improvement Fund, which in 2007 received $500,000
from the city council as a Green Roof Improvement Fund. The Department of Planning
and Development was then authorized to award grants of up to $100,000 to green roof

22
projects within the Central Loop District (US EPA GI Case Studies, 2010) as a way of
subsidizing green roof installations in the city. Green roofs are one example of green
infrastructure that can be included into low impact designs to achieve environmental
sustainability.
1.2 Green Roofs and Their Advantages
Green roofs are roofs that are vegetated. Green roofs are generally categorized as
intensive or extensive, depending on the total depth of the system although the delineation
between the two varies (Table 1.2).
Table 1.2. Example soil thickness of intensive and extensive green roofs as defined
by different authors.
Intensive (cm) Extensive (cm) Reference
15-20 5-15 Kosareo and Ries (2007)
>50 N/A Kohler et al. (2002)
15-35 3-14 Mentens et al. (2006)
>10 <10 Wong et al. (2007)
>30 N/A Bengtsson et al. (2005)
>10 2-10 Graham and Kim (2005)
Source: Berndtsson, 2010
In general, extensive green roofs are roofs bearing vegetation growing in a thin layer of
substrate while intensive green roofs utilize a much deeper substrate layer, increasing the
capacity of the system to incorporate a more diverse plant palate; typically intensive roofs
require more intensive post-installation maintenance. For the purposes of this dissertation,

23
the following literature will refer exclusively to extensive green roofs. Green roofs are
typically constructed with at least four layers on top of the standard waterproofing
membrane: a drainage layer, filter fabric to prevent substrate loss, substrate, and plant
material layers. In some green roof systems may include a root barrier fabric to prevent
root penetration of the waterproofing membrane or a water retention fabric between the
substrate and filter fabric.
1.2.1 Stormwater Mitigation
Green roofs offer many advantages, one being stormwater retention. Stormwater
runoff is a serious problem in many cities, and most especially in densely urban areas.
Green roofs can make major contributions to alleviating this problem, by reducing peak
flow from runoff events by retaining a portion of the rain fall to cycle it back to the
atmosphere via plant-based evapotranspiration. Kolb (2004) reported 45 – 70% of all
rainfall can be recycled using green roofs, depending on substrate selection. VanWoert et
al. (2005b) reported that green roofs retained 96% of the rainfall from rain events < 2mm,
82% of the rainfall from 2-6mm rain events, and 52% of the rainfall from >6mm rain
events. Overall, 60% of the total rainfall was retained during the 430-day study. Teemusk
and Mander (2007) reported 85% and 94% retention from two separate light rain events,
respectively. Green roofs retain rainfall even at slopes as steep as 25%. Getter et al. (2007)
showed that green roof platforms at 25% slope retained 75% rainfall with those set at 2%
slope retaining 85%. Retention was higher with lighter rain events, consistent with results
from VanWoert et al. (2005b) and Teemusk and Mander (2007).

24
In addition to reducing stormwater runoff quantity, green roofs may improve the
quality of stormwater runoff, although there is less consensus on this from peer-reviewed
literature. Although green roofs retain rain water and reduce negative effects of urban
runoff by decreasing runoff volume and increasing lag to peak flow, they could have the
potential to contribute to nutrient loading due to the organic portion of the substrate as well
as from nutrient applications, which are typically recommended on a yearly basis (FLL,
2008). Studies attributing nutrient loading to green roofs have demonstrated different
results. Green roofs increased phosphorous (P) in green roof runoff according to Bliss et
al. (2009); but in other studies Berndtsson et al. (2006 and 2009), and Hathaway et al.
(2008) green roofs had the lowest mean mass value for phosphate loading when compared
to an asphalt roof in Michigan (Carpenter and Kaluvokolanu, 2011). There were no
differences in runoff P compared to rainfall P in another study (Monterusso et al., 2004).
Kohler et al. (2002) reported green roofs retained 67% of P, and retention increased from
26% in year one to 80% four years after installation.
Results for nitrogen (N) were also varied: Monterusso et al. (2004) reported
increased nitrate-N for sedum green roofs and decreased substrate depths compared to
native plantings and increased substrate depths. Similarly, Hathaway et al. (2008) reported
increased concentrations and total N loading were higher for green roofs compared to
rainfall. Carpenter and Kaluvakolanu (2011) reported no differences for nitrate-N from
green roof effluent compared to rain fall and that a green roof was an N sink when
compared to an asphalt roof. Bliss et al. (2009) found no difference in levels of N in green
roof discharge compared to rainfall. Gregoire and Clausen (2011), Berndtsson et al (2009)

25
and Kohler et al. (2002) all reported green roofs stored nitrate- N, but Gregoire and
Clausen (2011) found green roofs to be a source of ammonium-N. Kohler et al. (2002)
reported increased N storage with increasing roof maturity. Looking past contradictions
within the literature, other point sources of pollution (CSO’s, for instance) pose a greater
threat to the health of the bay than potential green roof nutrient loading.
Regarding green roof runoff quality, a phenomenon to consider is the first flush
effect – because particulates and organic compounds accumulate on and within green roof
systems, the first flush of runoff after a rain event often contains more total nutrients, or a
higher concentration of nutrients, depending on runoff volume. There was no first flush
effect identified by Bliss et al. (2009); however, only first flush events were studied by
Berndtsson et al. (2009). Similarly, runoff volumes affect nutrient concentration in the
effluent. Moderate runoff events resulted in concentrations of total N and P greater than
that of a bituminous roof while heavy rain events concentrations were lower but total
loading was higher (Teemusk and Mander, 2007). Concentrations were also higher during
snowmelt, which the authors attributed to decreased runoff volume. In short, the effects of
green roofs on discharge water quality are not straightforward or well documented.
With regards to the overall goal of reduced stormwater runoff volume, a low
density of green roofs will have little impact; however, a study (Casey Trees and
LimnoTech. 2007) demonstrated the effects of greening large portions of roofs in
Washington, D.C. The Green Build Out Model compared intensive and moderate greening
scenarios within the district with a goal of reducing (CSO) discharges into the Anacostia
River. Combined sewer overflow discharges are the result of excess stormwater flooding

26
the sewer system during heavy rain events and cause untreated sewage to flood into the
Anacostia and nearby feeder streams. The intensive greening scenario assumed green roof
installation wherever it was physically possible; the moderate greening scenario considered
green roofs where it was practical and reasonable to do so (Casey Trees, 2007). In the
model, green roof area was assumed to be equal to the building footprint minus 25% of the
rooftop area needed for HVAC, access, and maintenance. With 75% coverage and the
assumption of no structural or historic preservation issues, the most green roof coverage
possible in D.C. according to the model is approximately 18 million square meters. Based
on the model, installing 5.5 million square meters of green roofs in DC would reduce
combined sewer overflow discharges by 1.6 billion liters (19%) each year. Installing only
3.3 million square meters of green roofs would result in a reduction of 359 million liters
(4.2%) annually (Casey Trees, 2007).
1.2.2 Green roofs and noise and air pollution
Green roofs offer further benefits, including a reduction in noise and air pollution.
Van Renterghem and Botteldooren (2009) reported a numerical evaluation of reductions in
noise pollution by green roofs. The authors reported less-sloped green roofs achieve the
best reduction in noise pollution. In 2011, Van Renterghem and Botteldooren reported a
reduction in noise pollution of over 10 decibels in a study of 5 roofs pre- and post-green
roof installation. Because these measurements were taken under dry conditions, the authors
assert even higher reductions in soundwave transference under wet conditions.
Currie and Bass (2005) estimated that 109 ha of green roofs in Toronto could
remove a total of 7.87 metric tons of air pollutants annually using the Urban Forest Effects

27
(UFORE) Model. The same model was used by Deutsch et al. (2005) in a study of
Washington, DC which showed that 58 metric tons of air pollutants could be removed if all
the roofs in the city were greened. Johnson and Newton (1996) estimate 2000 m2 of uncut
grass on a green roof could remove up to 4000 kg of particulate matter. Extrapolated out
using 0.01 g particulate matter produced by automobiles for every mile driven, one square
meter of green roof could offset the annual particulate matter emissions of one car (City of
Los Angeles, 2006). In Singapore, Tan and Sia (2005) reported sulphur dioxide and nitrous
acid were reduced 37% and 21%, respectively directly above a green roof.
1.2.3 Increased Membrane Lifespan
The benefits of green roofs are not limited to the natural environment. The installation of
green roofs can increase the lifespan of the standard waterproofing membrane, which is
installed on traditional and green roof systems. Approximately 50 German tar paper green
roofs (TPG) built between 1880 and 1914 survived both World Wars and continue to
thrive (Kohler, 2010). Although the construction materials and methods have evolved over
time, the functionality is equivalent. Kohler reported that either primitive 19th century
materials or complex modern materials provide long-lasting roof options. The TPG roofs
demonstrated professionally-installed waterproofing membrane can last in excess of 100
years when combined with a green roof system (Kohler, 2010). The waterproofing
membrane of a traditional roof system breaks down rapidly due to UV radiation, and has a
life span of approximately 20 years (Carter and Keeler, 2008).

28
1.3 Green Roof Substrates
Substrate refers to the material in which plants are grown, and is synonymous with
‘media’, ‘medium’, ‘vegetation support course’ and in some literature ‘soil’. Green roof
substrates are often a mixture of organic and inorganic materials, often combined to
achieve properties pertinent to plant survival as well as the designed roof function. The
substrate is arguably the most important element in a green roof system because the
majority of the water holding capacity of the system is dependent upon the substrate
physical properties. Substrates must be consistent and reproducible while providing
adequate air space, water holding capacity, and support for the plants (Handreck and
Black, 2002) while maintaining a bulk density appropriate for the load bearing capacity of
the roof structure. For this reason, many substrate formulations are composed primarily of
lightweight heat-expanded mineral materials such as clay, shale, or slate. This inorganic
portion is comprised of particles of varying sizes and composition. These particle sizes and
mineral compositions largely determine the nature and behavior of the substrate: the
porosity, the relationship with fluids and solutes, as well as its compressibility, strength,
and chemical properties such as cation exchange capacity.
Currently there is no universally accepted standardization for classifying particle
sizes. For example, the classification set by the United States Department of Agriculture
differs from the International Soil Science Society (ISSS) classification, as well as that of
the American Society for Testing Materials (ASTM) and the Massachusetts Institute of
Technology (MIT). Soil engineers typically follow different standards than soil scientists,
and inconsistencies can be confusing (Hillel, 2004).

29
Measuring and classifying the complete distribution of particle sizes in a sample of
a particular substrate yields the particle size distribution. Particle size distribution is
arguably the most important substrate physical property because it determines the physical
amount of water a substrate can hold through adhesive and cohesive forces (Handreck and
Black, 2002). It also largely determined the porosity of the substrates. The void space
created by substrate particles resting against each other is referred to as pore space. The
pores range in size based on the particle size distribution of the substrate. These pores hold
oxygen and water necessary for plant growth and development. A substrate composed
primarily of large particles will have large pores; water will flow rapidly through the
substrate profile and the majority of the pore space will be occupied by air (Handreck and
Black, 2002). Granular drainage layers are composed primarily of large particles to
expedite the flow of water away out of the system. Conversely, a substrate composed
primarily of small particles will have small pores; water will flow slowly through the
profile. Some pore spaces will hold water (generally smaller or micro pores) while others
will hold air (generally larger or macro pores). The proportion of air to water within the
substrate profile is integral to plant survival and for this reason guidelines for particle size
distribution are available for the green roof industry. Green roof substrates should be
comprised of a mix of large and small particles to provide adequate air space and water
holding capacity.
The Forschungsgesellschaft Landschaftsentwicklung Landschaftsbau (FLL, 2008)
is a German landscape industry manual containing guidelines for the planning, execution,
and upkeep of green roofs. These German guidelines have been adopted nearly world-wide

30
and are used as the industry standard when developing new substrate formulations. The
FLL has set standards for the recommended particle size distribution, percent air and
water, and other substrate physical properties. Substrate particle size distribution for
extensive green roof substrates should fall between two distribution curves, shown in Fig.
1.2 (FLL, 2008).
Although water holding capacity is largely determined by substrate particle size
distribution, the FLL also set standards for the maximum water holding capacity. For
extensive substrates with a separate drainage layer, the FLL recommends water holding
capacity to be ≥ 35% by volume of the substrate. For single layer extensive green roofs,
water holding capacity is recommended to be ≥ 20% by volume. The maximum water
holding capacity should not exceed 65% by volume in any green roof substrate to avoid
water logging (FLL, 2008).
Fig. 1.2 Particle size distribution range for extensive and single-layer extensive green
roof substrates.

31
1.3.1 Substrate Organic Matter
The FLL also sets standards for substrate composition, although these have
changed over the years. In 2002, the FLL’s specifications for total organic content for
extensive systems were based on density. For substrates with density ≤0.8 (units not given
but assumed to be g/L), total organic matter should be ≤8% by mass. For substrates with
bulk densities >0.8, total organic matter should be ≤6% by mass (FLL English Version,
2002). For extensive green roofs, the recommendation is ≤65 g/L organic matter, although
it is noted a greater proportion of organic matter may be required based on plant selection
(FLL English Version, 2008). The change from percent organic matter to a mass: volume
ratio leaves room for inquiry. While substrate recommendations may be given based on
weight and density due to the load bearing requirements of roofs, horticultural substrate
formulations are measured and specified based on volumetric ratios. This discord creates
confusion within the green roof industry, which is evolving into required collaborations
between engineering and horticultural professionals alike. Furthermore, FLL
recommendations are based on green roof systems in Germany. Special attention should be
paid to varying climates and weather patterns. The recommendations which create the best
green roof systems in Germany may not create the best performing green roof systems
elsewhere, for example in the Mid-Atlantic United States.
Substrate composition varies in research studies. A study by Teemusk and Mander
(2007) utilized 66% lightweight aggregate, 30% humus, and 4% clay as an extensive
substrate. Berndtsson et al. (2009) studied an extensive green roof composed of crushed

32
lava, natural calcareous soil, clay, and shredded peat with a total organic content of 5%.
Substrate composition was not detailed in a report by VanWoert et al. (2005a); although a
later study by Getter et al. (2007) utilizing the same experimental platforms reported
organic contents at installation (the time of the VanWoert study) and at maturity (the time
of the Getter study) as 2.33% and 4.25% respectively, based on a loss on ignition test.
Gregoire and Clausen (2011) reported 75% expanded shale, 15% composted biosolids, and
10% perlite (GreenGrid® Northeast Extensive Media). A study of a green roof at the
University of Auckland reported three different substrate formulations, all based on
volumetric ratios, in which the authors reported no differences in stormwater retention
based on substrate composition or depth (Voyde et al., 2010). Emilsson (2008) compared
two generic media composed primarily of crushed roof tiles against a third media,
Roofsoil, and found vegetative cover up to 80% after one year. The report exemplified the
potential for alternative green roof construction materials and methods for the Swedish
green roof industry.
Although organic matter provides nutrients and additional water holding capacity
in soil systems (Hillel, 2004), too much organic matter can result in hydrophobicity or
water repellency which are caused when inorganic soil particles become coated with
hydrophobic organic matter (Quyum, 2000). Although organic material is the direct cause
of soil hydrophobicity, the amount of organic carbon and degree of hydrophobicity are not
correlated (De Bano, et al. 1976). Because hydrophobic soils repel moisture, water
generally runs off for an extended period of time, until the organic coating can be broken.
The initial infiltration rates of hydrophobic soils are very slow or non-existent due to very

33
high initial liquid-solid contact angle (De Bano, 1981; Wallis et al., 1991). Because a green
roof’s capacity to hold stormwater and delay runoff depends solely on the substrate,
hydrophobicity is a soil property that should be avoided.
Recognition of different climates, weather conditions, and material availability may
have led to different countries and municipalities creating independent green roof
guidelines. Despite these efforts, only some region-based – or country specific –
recommendations are available (Voyde et al., 2010; Fassman et al., 2013) and multiple
substrate formulations continue to be recommended. The Introductory Manual for Green
Roofs published by the Canada Public Works departments suggests a growing medium of
1/3 sand, 1/3 pumice, and 1/3 Humus Builder (a product comprised of composted wood
and composted fertilizer), although wood sources are not specified, nor are whether the
ratios are based on weight or volume. Particle size distribution is not addressed at all in the
Canadian manual (Canada Public Works, 2002). The 2010 Sydney City Council Green
Roof Resource Manual recommends humus, citing the FLL’s 6-8% organic matter
guidelines in one paragraph, but then cites research that suggests 75-80% inorganic with
15-20% organic matter (Sydney City Council, 2010). The Seattle specifications require 4%
organic matter by mass for single-course systems, 6% for extensive systems, and 8% for
intensive systems, utilizing the loss on ignition test (City of Seattle, 2010). Clearly there
are no scientifically tested ratios of substrate components in extensive green roofs.
Additionally, it is likely that one recommendation will not be the most efficient or effective
substrate mixture in every climate. For the Mid-Atlantic region no performance-based

34
work has been reported on the use, amounts, or types of organic matter for extensive green
roof formulations.
1.3.2 Inorganic Substrate Materials
The FLL recommendations are also not specific with regard to the primary
substrate component, the inorganic portion. Lightweight aggregates are used often in North
America; usually heat-expanded mineral materials which offer decreased bulk density,
which is important in roof load considerations. One environmental disadvantage to heat-
expanded mineral materials is the extreme heat energy requirements which results in large
carbon footprint. Generally, expanded clays must be heated to extreme temperatures. A
report by Elliott (2007) investigated the carbon footprint of expanded mineral materials
commonly used in green roof substrates. One cubic yard of expanded material expends 1.7
million BTU’s (Elliott, 2007). This number includes the production process from the point
of mining to the point of shipping the final product. One BTU is the energy that raises one
pound of liquid water by one degree, or also the energy released by one match. One point
seven million BTU’s can also be generated by 36.5 kg propane. Burning 1kg propane
releases 3kg CO2. Therefore, burning 36.5 kg propane (which generates 1.7 million BTU’s,
or the amount of heat energy utilized in creating 1 yd3 expanded aggregate) creates 110 kg
CO2. In 2012 the Expanded Shale, Clay, and Slate Institute independently reported the
embodied energy required to manufacture expanded mineral lightweight aggregates
verifying Elliott’s estimations (ESCSI, 2012). The ESCSI report was based on a survey of
13 plants across North America.

35
The carbon cost associated with an expanded slate substrate is equivalent to 0.44 kg
C/kg substrate manufactured. Getter et al. (2009) reported a 6 cm deep substrate with a
density of 1600 kg/cubic meter has 5.7 kg C/ m2. The entire green roof system has a carbon
cost of 6.6 kg C/ m2, meaning 86% of the carbon cost of a green roof is attributed to the
substrate. In 2013 Washington, DC had a reported 232,000 m2 green roof (2.5 million ft2)
(Peck, 2013). Assuming a 6 cm substrate depth with Getter and Rowe’s density
assumptions, the district’s green roofs have a carbon equivalency of consuming over
560,000 liters of gasoline, or burning 635,000 kg of coal. It will take over 33,000 tree
seedlings 10 years to sequester the carbon created from the manufacturing of the district’s
green roof substrates (Carbon Equivalency Calculator, EPA.gov). For this reason,
alternatives have been investigated as a replacement or supplement to heat-expanded
materials in order to decrease the embodied energy of green roofs, including scoria and
crushed brick.
Scoria is a porous basaltic to andesitic lava rock. The porosity of scoria is due to
the escape of volcanic gases during eruption (USGS, 2011). Scoria is heavier than pumice
so it does not float, and it is very durable. In volcanic regions of the U.S., scoria is often
quarried and used as a base material for roads (USGS, 2011). While scoria has not been
reported as a green roof substrate component, it is known to sustain long-term plant growth
and increase species diversity in mine reclamation projects (Prodgers, 2009). A ten-year
study of a southeast Montana coal mine compared plant performance in topsoil, scoria, and
spoil applied over exposed sodic soil after mining operations were completed. The study
found that topsoil had more plant cover than spoil and scoria treatments; however, a

36
drought in 2006 resulted in more plant cover in scoria than in topsoil (Prodgers, 2009).
Scoria was the premier plant species diversity substrate; initially seeded with 12 species,
23 species were present after 10 years. Some of the recruited native species were rarely
ever seen in revegetation efforts (Prodgers, 2009). Treatment analysis found scoria to have
particle sizes equivalent to a sandy loam.
Crushed brick is the U.K. green roof industry standard substrate base (Molineux et
al., 2009). The U.K. green roof industry is built on two different systems: Sedum spp. mats
providing an instant green effect, and substrate-only system composed of waste materials
(broken bricks or demolition waste) to mimic natural brownfield sites. These ‘brown’ roofs
are usually constructed to increase biodiversity and create bird or invertebrate habitat
(Molineux et al., 2009). The same study reported seedlings grown in crushed brick
amended with bark compost (the control treatment) yielded suitable plant height and
biomass, suggesting crushed brick could be utilized a substrate component for traditional
green roof systems planted with seedlings in North America. Crushed brick in the U.K. is
reported to be sourced back to one factory (Molineux et al, 2009); the demand for crushed
brick is relatively high leading to a high cost for the end user. Because the material is
sourced from a single factory, the carbon footprint associated with shipping are extremely
high (Molineux et al., 2009). In the United States, however, waste brick may be available
in certain regions and should be investigated as a potential green roof substrate component.
The carbon footprint associated with substrate materials is important, as is the
substrate density, which is the parameter used to determine whether or not a roof structure
can bear the weight of a green roof. Lightweight materials decrease the total density, which

37
is helpful in retrofitting buildings without the load capacity. If the ability of a roof structure
to sustain a green roof is dependent on the weight of the green roof system, then a lighter-
weight substrate is more desirable. A substrate component that lowers the density of the
substrate without changing the physical properties is crumb rubber. Crumb rubber (CR) is
a granulized rubber product derived from waste tires. Granule size is typically one-quarter
inch (six millimeters). Crumb rubber has been investigated to amend substrates in
horticultural production (Newman et al., 1997), turf grass, and playground installations
(Groenevelt and Grunthal, 1998). Solano (2010) investigated crumb rubber amendments
for green roof substrates. Zinc (Zn) was found to leach from crumb rubber in quantities
that could negatively affect plant growth; however, when paired with a high cation-
exchange-capacity substrate, crumb rubber could be utilized up to 30% by volume without
Zn toxicity to plants. Further testing is necessary to determine the possibility of long-term
Zn leaching even with high cation exchange capacity substrates. Crumb rubber may be a
useful substrate component; however, its use should be further proven through long-term
substrate performance analyses.
1.4 Green Roof Plants
As previously discussed, not all plants are appropriate for green roof systems. The
decreased substrate thickness immediately provides a challenge for plants in terms of water
availability, not to mention growing plants under high environmental stress (high
temperature, light and wind) conditions on roofs. Periods of drought or excessive rainfall
also hinder plant health. Generally, the most successful green roof plants are low-growing,
shallow-rooted perennial plants that are tolerant to various stressors, e.g. heat, cold, sun,

38
wind, drought, salt, insect, and disease (Snodgrass and Snodgrass, 2006). Adjusting
substrate depth can have a positive impact on plant survival and growth. Durhman et al.
(2007) reported increased substrate depth results in faster plant coverage. Similarly,
VanWoert et al. (2005) reported increased Sedum spp. biomass accumulation in 6 cm
substrate compared to 2 cm substrate depth (with and without moisture mat) when watered
at least every 14 days.
A current trend in the green roof industry is the incorporation of native species into
green roof plant palates (Lundholm et al., 2009; MacIvor and Lundholm; 2011;
Monterusso et al., 2005). Monterusso et al. (2005) reported only four of eighteen species
native to the region were suitable for unirrigated extensive green roofs; conversely all nine
Sedum species evaluated were determined to be suitable unirrigated extensive green roofs.
DeLong (2014) reported the Maryland native plant Tradescantia ohioensis demonstrated a
comparable ability to store stormwater and increase biomass when compared to traditional
Sedum species in a study in the Mid-Atlantic region.
Given the harsh conditions to which green roofs are exposed, it is the interaction of
substrate properties, plant species, and environmental conditions that determine the overall
success of a green roof system. “Success” can be perceived multiple ways – the presence
of green vegetation, a measurable decrease in storm water runoff from the rooftop, or a
property manager that is pleased with the aesthetic value of the roof, to name a few. The
factors that dictate the delineation of failure and success are likely driven by the design
intent of the green roof; however, regardless of the measure applied to the system, the

39
relationship between plant, substrate, and environment will ultimately determine the
success of the green roof.
1.5 Statement of Research Objectives
The purpose of this research was three-fold. The first research objective was to
explore the durability of standard heat-expanded substrate materials to freeze-thaw stress.
The Mid-Atlantic region can experience numerous freeze-thaw cycles each winter and
currently no work has been reported regarding substrate durability. The second research
objective was to explore the effects of green roof substrate composition on water retention
and matric potential, especially the effects of increased volumetric proportions of substrate
organic matter on plant available water. Finally, the third objective was to quantify the
effects of green roof substrate composition on plant growth, evapotranspiration, and
stormwater retention. This objective was explored in a controlled-environment growth
chamber study and in a platform-scale field study.

40
Chapter 2: Evaluating ready-to-plant commercial green roof substrates for
durability to freeze/thaw cycles
2.1 Introduction
Green roofs are gaining popularity as storm water management tools (Kohler et al.,
2002; Villarreal and Bengtsson, 2005; Berndtsson et al., 2006; Getter et al., 2007; Voyde
et al., 2010) and are increasingly being incorporated into regulatory policies [Washington,
D.C. (District Department of Environment, 2013); the state of Maryland (Maryland
Department of Environment, 2009), and Auckland, New Zealand (Fassman-Beck and
Simcock, 2013)]. Although green roofs can vary in aesthetic and design, systems designed
for storm water retention are often thin (defined below), extensive green roofs. Green roofs
are generally classified based on substrate depth, although the specific depths
differentiating extensive and intensive systems are undefined: Kohler et al. (2002)
designated intensive substrate depth as greater than 50 cm, while Mentens et al. (2006) site
3-14 cm substrate depth as extensive and 15-35 cm substrate depth as intensive. Wong et
al. (2007) are more conservative, reporting intensive substrate depth to be any depth
greater than 10 cm. Nonetheless, it is agreed that extensive systems are typically lower-
maintenance designs - usually a layer of mineral-based substrate planted with drought- and
heat-tolerant succulent species.
The standards for green roof system design and installation can vary by
municipality and geographic location (Canada Public Works Guidelines, Oberlander et al.,
2002; Seattle, Washington, Seattle Stormwater Code, 2009; Sydney City Council Green
Roof Resource Manual, 2010); however, these generally borrow heavily from the
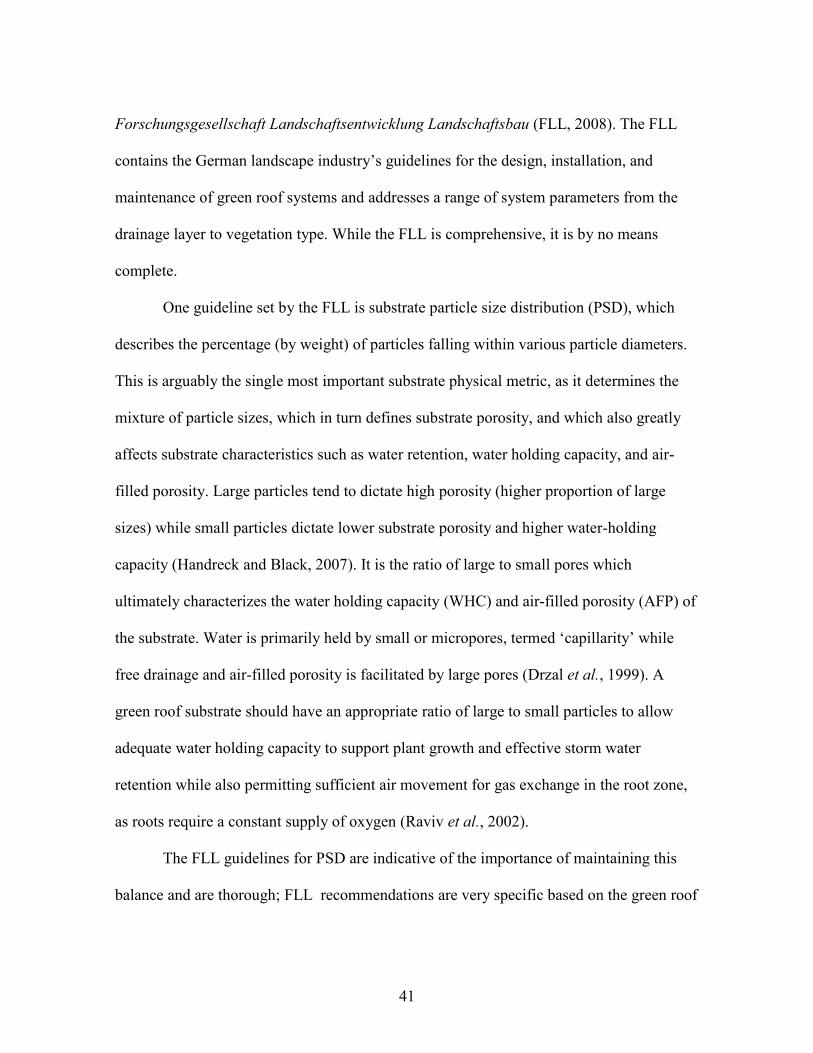
41
Forschungsgesellschaft Landschaftsentwicklung Landschaftsbau (FLL, 2008). The FLL
contains the German landscape industry’s guidelines for the design, installation, and
maintenance of green roof systems and addresses a range of system parameters from the
drainage layer to vegetation type. While the FLL is comprehensive, it is by no means
complete.
One guideline set by the FLL is substrate particle size distribution (PSD), which
describes the percentage (by weight) of particles falling within various particle diameters.
This is arguably the single most important substrate physical metric, as it determines the
mixture of particle sizes, which in turn defines substrate porosity, and which also greatly
affects substrate characteristics such as water retention, water holding capacity, and air-
filled porosity. Large particles tend to dictate high porosity (higher proportion of large
sizes) while small particles dictate lower substrate porosity and higher water-holding
capacity (Handreck and Black, 2007). It is the ratio of large to small pores which
ultimately characterizes the water holding capacity (WHC) and air-filled porosity (AFP) of
the substrate. Water is primarily held by small or micropores, termed ‘capillarity’ while
free drainage and air-filled porosity is facilitated by large pores (Drzal et al., 1999). A
green roof substrate should have an appropriate ratio of large to small particles to allow
adequate water holding capacity to support plant growth and effective storm water
retention while also permitting sufficient air movement for gas exchange in the root zone,
as roots require a constant supply of oxygen (Raviv et al., 2002).
The FLL guidelines for PSD are indicative of the importance of maintaining this
balance and are thorough; FLL recommendations are very specific based on the green roof
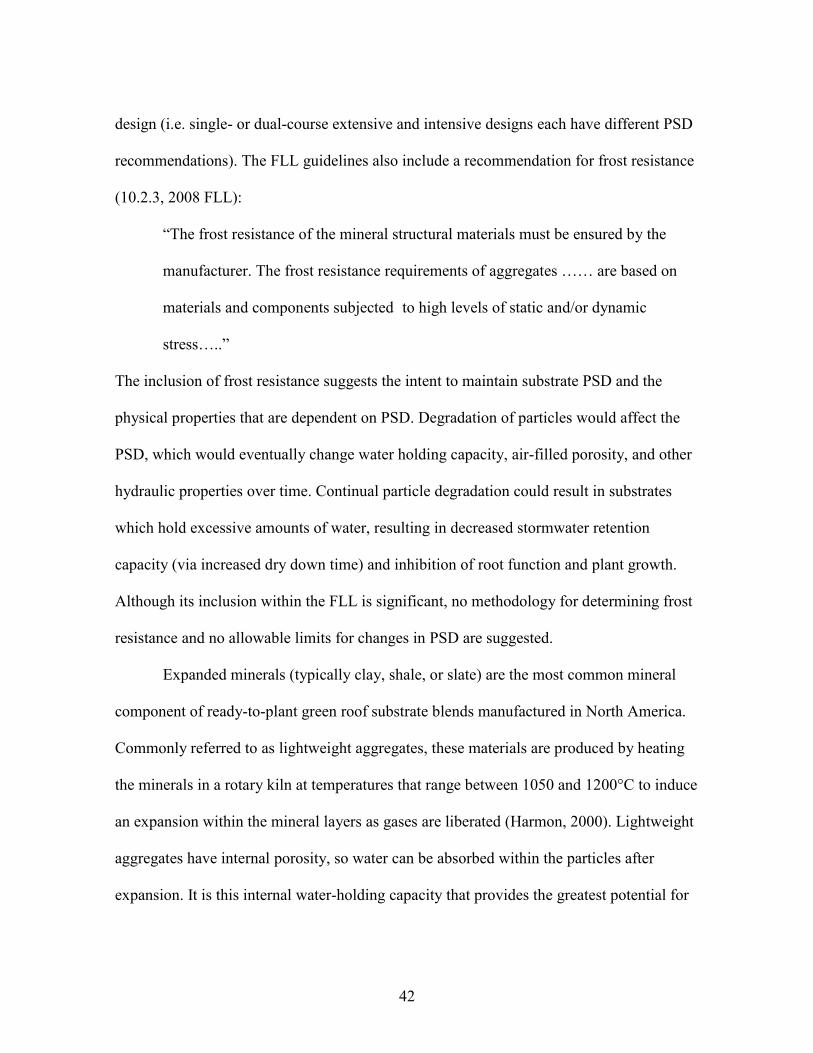
42
design (i.e. single- or dual-course extensive and intensive designs each have different PSD
recommendations). The FLL guidelines also include a recommendation for frost resistance
(10.2.3, 2008 FLL):
“The frost resistance of the mineral structural materials must be ensured by the
manufacturer. The frost resistance requirements of aggregates …… are based on
materials and components subjected to high levels of static and/or dynamic
stress…..”
The inclusion of frost resistance suggests the intent to maintain substrate PSD and the
physical properties that are dependent on PSD. Degradation of particles would affect the
PSD, which would eventually change water holding capacity, air-filled porosity, and other
hydraulic properties over time. Continual particle degradation could result in substrates
which hold excessive amounts of water, resulting in decreased stormwater retention
capacity (via increased dry down time) and inhibition of root function and plant growth.
Although its inclusion within the FLL is significant, no methodology for determining frost
resistance and no allowable limits for changes in PSD are suggested.
Expanded minerals (typically clay, shale, or slate) are the most common mineral
component of ready-to-plant green roof substrate blends manufactured in North America.
Commonly referred to as lightweight aggregates, these materials are produced by heating
the minerals in a rotary kiln at temperatures that range between 1050 and 1200°C to induce
an expansion within the mineral layers as gases are liberated (Harmon, 2000). Lightweight
aggregates have internal porosity, so water can be absorbed within the particles after
expansion. It is this internal water-holding capacity that provides the greatest potential for

43
particle degradation: intra-particle water expands as it freezes, creating outward stress on
the interior walls of the particle. It is conceivable that lightweight aggregate particles could
fracture due to freeze-thaw weathering, especially in climates experiencing significant
temperature fluctuations throughout the winter months. Unfortunately, no literature is
currently available addressing green roof substrate durability in North America.
Furthermore, no methodologies are available for testing green roof substrate durability.
Because manufacturers are responsible for guaranteeing frost resistance, the methods used
are not reported and comparisons between various manufacturers are not reliable. This
work addresses three basic hypotheses for green roof substrates commonly used in the
Mid-Atlantic region of the United States.
1. HO: Ready-to-plant commercial substrate blends meet FLL-based guidelines for
particle diameter ranges when obtained direct from the manufacturer.
HA: Ready-to-plant commercial substrates blends do not meet FLL-based
guidelines for particle diameter ranges when obtained direct from the manufacturer.
2. HO: Ready-to-plant commercial substrate blends maintain particle size distribution
after being subjected to 30 freeze-thaw cycles.
HA: Ready-to-plant commercial substrate blends do not maintain particle size
distribution after being subjected to 30 freeze-thaw cycles.
3. HO: Substrates of established green roofs (3-7 years post-installation) in the Mid-
Atlantic region, representing commonly used ready-to-plant blends, fall within
FLL-based guidelines for particle diameter ranges.
HA: Substrates of established green roofs (3-7 years post-installation) in the Mid-
Atlantic region, representing commonly used ready-to-plant blends, do not fall
within FLL-based guidelines for particle diameter ranges.

44
2.2 Materials and Methods
Three commercial green roof substrates were obtained directly from the
manufacturers. The PSD from ‘as received’ and ‘after 30 freeze-thaw cycles’ were then
determined for each blend. Particle size distribution ranges for both treatments were
compared to FLL-recommended guidelines; independent student t-tests were used to
compare ‘as received’ to ‘after 30 freeze thaw cycles’ for each particle range in each blend,
to determine whether or not any significant (p<0.05) degradation had occurred within any
particle diameter range, as a result of freeze-thaw weathering.
2.2.1 Commercial Substrate Blends
Three ready-to-plant commercial green roof substrate blends were acquired
between September 2011 and April 2012. One blend was shipped as a 2 cubic foot sample
for lab analysis direct from the manufacturer. A second blend was shipped as a 3 cubic
yard bulk order direct from a local blender of the manufacturer’s choice. The bulk order
arrived in two 1.5 cubic yard super sacks, and 11 L of each super sack were taken and
mixed thoroughly to create a 22 L representative sample for lab analysis. The third blend
was received as a 1.5 cubic yard bulk order direct from a local blender of the
manufacturer’s choice. Twenty-two liters of the third blend were taken and mixed
thoroughly for lab analysis. All three blends were stored in 22 L air tight containers in
walk-in cold storage at 6°C for the duration of the study, to slow any microbial-based
degradation of the substrate organic components.
Thirty 100 mL replicate samples were taken from each blend. Fifteen replicates of
each blend were immediately oven-dried at 105°C in a Thelco Laboratory Oven (Precision

45
Instruments, Winchester, VA) for 48 hours prior to sieving. Replicates were sieved with
ASTM sieves #8, 16, 30, 45, 60, 100, and 200 (E.H. Sargent & Co., Chicago, IL) for 20
minutes per sample using a Meinzer 11 shaker (CSC Scientific Company, Inc., Fairfax,
VA). The percent weight of particles retained by each sieve size was averaged across the
15 replicates to obtain the average gravimetric percent of particles falling within each
particle diameter range. The collective distribution of particles retained by each diameter
range constituted the PSD for each blend.
The remaining replicates were placed in aluminum tins with 30 mL deionized
water, and placed in a Thermo Scientific (Waltham, MA) laboratory freezer at -28° Celsius
overnight. Samples were moved to room temperature the following morning for 8 hours,
completing one freeze-thaw cycle. A total of 30 cycles were performed; after the tenth and
twentieth cycles respectively, an additional10 mL deionized water was re-added to each
sample to account for evaporative losses. It has been reported that Baltimore, Maryland
experiences an average of 88 freeze-thaw cycles per year (NIST, 2012) although
unpublished data shows substrate layers in experimental green roof plots at the University
of Maryland experienced anywhere from 8 to 22 freeze-thaw cycles for the 2012-2013
winter. We believe 30 cycles are representative of the minimum number of freeze-thaw
cycles experienced by established roofs in the region (at least 3 years post-installation). I
chose 30 freeze-thaw cycles because it represents the approximate number of freeze-thaw
cycles that a Mid-Atlantic green roof system would experience during establishment (at
least three years). Also, I assumed 30 freeze-thaw cycles would be enough to identify any

46
significant particle degradation without unnecessarily extended the time for the study (each
cycle took one day).
At the end of the thirtieth cycle, replicates were oven-dried at 105°C for 48 hours
prior to sieving as previously described. The resultant PSD for ‘as received’ and ‘after
freeze-thaw’ was plotted for each blend against the FLL-recommended granulometric
distribution for extensive green roof substrates. Gravimetric percentages of each particle
diameter range for each treatment were compared using independent student t-tests
(α=0.05) to determine significance (α=0.05) of losses or gains at each particle diameter
range (SAS version 9.3, SAS Institute INC, Cary, NC).
2.2.2 Established Green Roof Sampling
Substrates from five established (3-7 years post installation) extensive green roofs
in the Mid-Atlantic region were sampled between April and June 2012 to determine
existing substrate PSD for established green roofs. Four roofs represented the three
commercial substrate blends investigated in Section 2.1; the fifth roof was planted with a
blend that was created and mixed to specification by the roof contractor who was awarded
the installation. One sample per thousand square feet of roof area was taken from each roof
and homogenized to reduce variability associated with roof microclimates. Plant roots were
hand-picked from the homogenized samples using tweezers. Five replicates were taken
from each homogenized sample and oven-dried and sieved as described in section 2.1. The
PSD for each established roof was plotted and compared to FLL-recommended
granulometric distribution curves for extensive green roofs, as previously described.

47
2.3 Results and Discussion
2.3.1 Commercial Substrate Blends
Every blend demonstrated significant particle loss (gravimetric percent) in at least
one particle diameter range and a significant gain in the smallest particle diameter range
(Table 2.1) indicative of particle degradation. In addition, none of the commercial blends
analyzed in this study met FLL recommendations for particle diameter ranges when
obtained direct from the manufacturer (Figures 2.1, 2.2, and 2.3).

48
Table 2.1. Gravimetric percentages of substrate particles falling within designated particle ranges of three ready-to-plant commercial
green roof substrate blends as received from the manufacturer and after 30 freeze-thaw cycles. Asterisks indicate significance
(*p<0.05, **p<0.01, ***p<0.001).
ASTM Mesh size Blend 1 Blend 2 Blend 3
Sieve
No. (mm) As Received After Freeze-Thaw As Received After Freeze-Thaw As Received After Freeze-Thaw
8 >2.4 47.68 ±2.61 43.84 ±1.04 *** 73.87 ±1.01 68.22 ±1.58 ** 38.82 ±1.52 36.93 ±2.17
16 1.2-2.4 20.96 ±0.98 20.89 ±0.41
9.44 ±0.54 10.18 ±0.80 *** 16.14 ±1.03 18.03 ±1.57 *
30 0.6-1.2 12.09 ±0.70 13.84 ±0.25 *** 7.84 ±0.35 10.09 ±0.64 ** 15.96 ±0.39 17.45 ±1.98 **
45 0.4-0.6 7.09 ±0.37 6.64 ±0.16 *** 3.44 ±0.12 3.70 ±0.25
8.71 ±1.20 5.75 ±0.41 **
60 0.3-0.4 3.20 ±0.21 2.75 ±0.18 *** 1.36 ±0.58 1.87 ±0.09 ** 4.55 ±0.69 3.22 ±0.19 **
100 0.2-0.3 4.14 ±0.27 4.00 ±0.29
1.26 ±0.06 2.14 ±0.08 *** 4.77 ±0.81 6.29 ±0.21 **
200 0.1-0.2 3.08 ±0.21 4.86 ±0.38 *** 1.17 ±0.89 1.44 ±0.08
5.97 ±1.33 7.72 ±0.45 ***
pan <0.1 1.76 ±0.45 3.20 ±0.57 *** 1.62 ±0.88 2.36 ±0.10 *** 4.39 ±0.33 6.54 ±0.26 ***

49
Figure 2.1. Particle size distribution of a ready-to-plant commercial
extensive green roof substrate (Blend A) manufactured in North
America, plotted against FLL guidelines. Red lines indicate “as
received” particle size distribution while blue lines indicate “after 30
freeze-thaw cycle” particle size distribution. Means and SE (n=5)
for each particle diameter range are presented.
Figure 2.2. Particle size distribution of a ready-to-plant commercial
extensive green roof substrate (Blend B) manufactured in North
America, plotted against FLL guidelines. Red lines indicate “as
received” particle size distribution while blue lines indicate “after
30 freeze-thaw cycle” particle size distribution. Means and SE
(n=5) for each particle diameter range are presented.

50
Figure 2.3. Particle size distribution of a ready-to-plant commercial extensive green roof
substrate (Blend C) manufactured in North America, plotted against FLL guidelines. Red
lines indicate “as received” particle size distribution while blue lines indicate “after 30
freeze-thaw cycle” particle size distribution. Means and SE (n=5) for each particle
diameter range are presented.
Every blend analyzed for freeze-thaw weathering was composed primarily of heat-
expanded minerals (slate, shale, or clay). We hypothesize water entered the expanded
mineral particles as expected, but upon freezing expanded beyond the limits of the
particle’s inner porosity, resulting in fracturing and eventual particle degradation.

51
2.3.2 Established Green Roof Sampling
None of the roofs sampled met FLL guidelines for extensive green roof substrate
granulometric distribution (FLL, 2008) (Table 2.2). When plotted against the FLL particle
diameter curve limits, each substrate demonstrated a decline in the recommended particle
size distribution (Figures 2.4, 2.5, 2.6, 2.7, and 2.8) representative of too many small
particles, or not enough large particles. The substrate particle size distribution of the Roof
A sample fell completely outside of the recommended guidelines. While all of the roofs
fell partially outside of the FLL PSD recommended range, we believe Roof D may have
met those guidelines if we had added a larger sieve (i.e. ASTM Sieve #4) to the analysis to
further separate large particles.

52
Table 2.2. Gravimetric percentages of substrate particles falling within designated particle ranges of substrates sampled
from five green roofs ranging from 3 to 7 years post-installation in the Mid-Atlantic region. Means (n=5) are presented for
each particle diameter range.
ASTM Mesh size
Sieve
No. (mm) Roof A Roof B Roof C Roof D Roof E
8 >2.4 21.80 ±1.04 35.88 ±2.49 55.16 ±1.34 76.76 ±2.26 52.04 ±2.24
16 1.2-2.4 29.95 ±0.87 15.98 ±1.43 17.56 ±1.19 10.51 ±1.43 11.51 ±0.99
30 0.6-1.2 16.49 ±0.43 24.95 ±1.15 11.69 ±0.51 6.39 ±0.52 13.44 ±1.11
45 0.4-0.6 9.09 ±0.28 11.96 ±0.84 4.55 ±0.28 2.28 ±0.11 9.00 ±0.38
60 0.3-0.4 4.72 ±0.18 4.17 ±1.10 2.44 ±0.17 0.79 ±0.11 3.45 ±0.14
100 0.2-0.3 5.68 ±0.13 4.88 ±0.12 3.22 ±0.25 1.45 ±0.17 4.30 ±0.94
200 0.1-0.2 6.29 ±0.38 2.29 ±0.12 2.96 ±0.24 1.05 ±0.12 2.40 ±0.49
pan <0.1 5.97 ±0.43 2.39 ±0.15 2.41 ±0.16 0.78 ±0.06 1.35 ±0.01
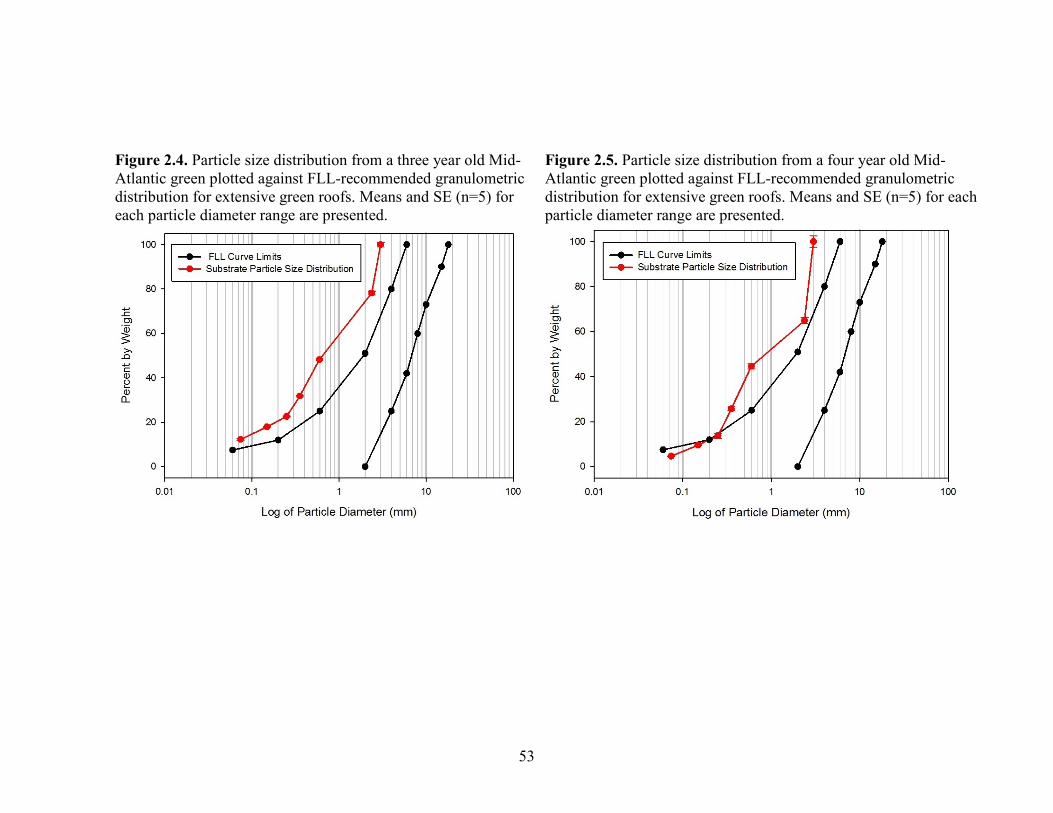
53
Figure 2.4. Particle size distribution from a three year old Mid-
Atlantic green plotted against FLL-recommended granulometric
distribution for extensive green roofs. Means and SE (n=5) for
each particle diameter range are presented.
Figure 2.5. Particle size distribution from a four year old Mid-
Atlantic green plotted against FLL-recommended granulometric
distribution for extensive green roofs. Means and SE (n=5) for each
particle diameter range are presented.

54
Figure 2.6. Particle size distribution from a three year old Mid-
Atlantic green plotted against FLL-recommended granulometric
distribution for extensive green roofs. Means and SE (n=5) for
each particle diameter range are presented.
Figure 2.7. Particle size distribution from a seven year old Mid-
Atlantic green plotted against FLL-recommended granulometric
distribution for extensive green roofs. Means and SE (n=5) for
each particle diameter range are presented.

55
Figure 2.8. Particle size distribution from a five year old Mid-Atlantic green plotted
against FLL-recommended granulometric distribution for extensive green roofs. Means
and SE (n=5) for each particle diameter range are presented.
2.4 Discussion
The freeze-thaw analysis of three major commercial substrate blends that are widely used
in the Mid-Atlantic region demonstrated significant (p<0.05) particle degradation after only 30
freeze-thaw cycles. In addition, substrate samples taken from established extensive green roofs
did not meet FLL granulometric guidelines 3-7 years post-installation. Because I was unable to
obtain substrate samples at the time of installation from any of the established roofs I cannot be
certain that these blends met FLL guidelines prior to installation. Nevertheless, a significant
(p<0.05) particle degradation was observed in the laboratory analyses in these same commercial
blends with just 30 freeze-thaw cycles. In addition to significant loss of particle structure, I

56
observed that manufactured commercial blends did not conform to FLL guidelines in the first
place. These results offer three important reflections on current substrate standards within the
green roof industry.
This study highlights the need for performance-based standards for green roof systems
and their components. While current guidelines make recommendations for green roof system
components, these apparently are not enforced prior to or at the time of installation. More
importantly, while the FLL does have a recommendation for frost resistance (10.2.3, FLL 2008),
there is no recommended allowable particle loss. Furthermore, the frost resistance
recommendation places the responsibility of verification entirely on the manufacturer, with no
suggestions for methodology. Various manufacturers are likely using different techniques to
verify frost resistance, if at all. A standardized methodology would create cohesiveness within
the substrate industry and allow for more reliable comparisons between commercial green roof
substrate blends.
None of the commercial blends met FLL guidelines for granulometric distribution upon
receipt from the manufacturer, even prior to freeze-thaw weathering (Figures 2.1, 2.2, and 2.3). It
is also evident these materials are not maintaining their physical characteristics in climates that
experience numerous freeze-thaw cycles each year. With the advancement of green roof research
and our increased understanding of the science behind these systems, standards and guidelines
based on dynamic performance rather than static component characteristics at the time of
installation would only further benefit the industries and academic communities associated with
them. Furthermore, since green roofs have been accepted as storm water management tools at a
regulatory level, performance-based standards would better inform storm water retention policies

57
and credits. These data call into question the relevancy of component-based rather than
performance-based guidelines and standards.
These results also highlight the need for regionalization of standards. Green roofs in
Auckland, New Zealand are not likely to experience freeze/thaw cycles because their
temperatures rarely fall below freezing (NIWA – New Zealand, 2013). Similarly, green roofs in
Toronto should be expected to freeze but they are likely to stay frozen as a result of daily
maximums remaining below freezing (Canadian Climate Data, 2013), lessening the impacts of
freeze-thaw weathering on substrate particles. The FLL has been adopted worldwide; even
guidelines written at the municipal level have heavily borrowed their recommendations from the
FLL. A more common-sense best practice could be to investigate green roof system performance
regionally to account for the idiosyncrasies created by varying climatic conditions in regional
standards. Furthermore, the FLL guidelines for PSD may not be optimal with respect to storm
water retention potentials. Until the effects of PSD on substrate hydraulic characteristics, plant
growth, and resultant evapotranspiration are quantified, we cannot know the ideal ranges for
particle diameters within a substrate.
These results also demonstrate the need for regionalization of green roof system
components. Given the seasonal differences of green roof stormwater retention performance
(Schroll et al. 2011) and regional variations in climate, one can assume green roof stormwater
retention would vary regionally; such variation would likely apply to the system components as
well. Expanded mineral-based substrate blends may not be appropriate for regions experiencing
repeated freeze-thaw cycling – designers of green roof systems should be mindful of climate and
explore alternatives to these materials in regions experiencing freeze-thaw. Similarly, we believe
our results create an opportunity for manufacturers to respond with alternatives to expanded-

58
mineral components for these regions. A one-size-fits-all approach to system components and
design may not provide optimal or even expected results.
2.4 Conclusions
I have identified a need for further research regarding substrate durability to freeze-thaw
weathering. Studies exploring the rates of particle degradation as well as which particle
diameters and mineral compositions are most susceptible to fracturing are needed. Additionally,
further work is needed to quantify the effects of PSD on substrate hydraulic conductivity and
related storm water retention performance. This study only quantified total gains or losses of
particle sizes after 30 freeze-thaw cycles, but a dynamic approach could provide a better
understanding of the mechanisms and ramifications of substrate PSD and potential particle
weathering on storm water retention potential.

59
Chapter 3: Using the HYPROP© procedure to determine the matric potential and
hydraulic conductivity of extensive green roof substrates
3.1 Introduction
Substrates, or the material in which the vegetation is grown, are one of the most
important components of a green roof system, as they provide the physical and chemical
properties necessary for plant growth. Since the purpose of the substrate is to provide adequate
water, nutrient, and gas exchange for plant growth, substrate physical properties have a direct
effect on plant growth, rates of evapotranspiration, and the resultant potential for storm water
mitigation. As municipalities increasingly recognize green roofs as a primary stormwater
management tool, improving the understanding of substrate water relations will lead to better
quantification of system performance, and more accurate allotments of stormwater credits.
3.1.1 Substrate Water Holding Capacity and Stormwater Regulations
Current guidelines and regulations generally rely heavily on a combination of substrate
depth and water holding capacity (WHC) as a means of determining potential storm water
retention capacity in Maryland (Maryland Department of Environment ESD Manual, 2011);
Washington, DC (District Department of Environment SWM Guide, 2013); Auckland, New
Zealand (Fassman-Beck and Simcock, 2013). Typically, WHC is determined by calculating the
amount of water held by a porous media after gravitational drainage, also termed field capacity
(FC) in field-based agronomic systems, container capacity (CC) in container-based horticultural
systems. It is considered part of the total porosity, with air-filled porosity being the other part of
total porosity. The air-filled porosity is the pore space that drains freely – i.e., the total pore
volume holding air following gravitational drainage (Handreck and Black, 2002). While field- or
container-capacity do provide a starting point for determining potential retention, lab-obtained

60
values may differ from actual in-field values, because samples are often saturated prior to
gravitational drainage in the lab compared to a rain event percolating through the substrate
immediately. Here, I offer a more specific designation of FCsat to represent saturated field
capacity – the WHC of a substrate after at least 24 hours’ saturation and FCunsat, representing
unsaturated field capacity – the WHC of a substrate after water has been applied in volumes to
result in gravitational drainage but without extended periods of saturation.
3.1.2 Matric Potential, Hydraulic Conductivity, and Plant Available Water
Water tends to move from a state of higher energy to a state of lower energy. To determine how
water may move in porous materials, the energy status of the water in the substrate is compared
to that of pure water at a standard pressure and temperature (STP), assumed to be unaffected by
soil and at some reference elevation. The difference in energy between the water in this reference
state and the substrate water is defined as soil water potential (Brady and Weil, 2000). Matric
potential is one component of total soil water potential and is a measure of the attraction of water
to solid surfaces, measured in some unit of pressure (typically bar, kPa, or MPa) and may be
expressed as a positive or negative value. Matric potential is the proportion of total water
potential that is most affected by substrate physical properties.
Matric potential becomes more negative or more positive, depending on the units used, as
a substrate dries down. As the substrate dries, plant water needs may exceed substrate volumetric
water content. The point at which matric potential is so great that plant roots can no longer
extract water out of the soil matrix, and plants permanently wilt, is termed permanent wilting
point (PWP) and is assumed to occur when soil water potential reaches -1500 kPa. Because FC is
assumed to be equal to -10 kPa (mid-point of a column of 20 cm height), plant available water
(PAW) for horticultural substrates is assumed to be the volume of water retained in soils between

61
0 kPa and -10 kPa (Handreck and Black, 2007) (Fig. 3.1). Using PAW to determine storm water
mitigation potential of green roof systems could provide a better estimation of retention potential
because it considers substrate properties as well as plant functionality; however in order to do
this, PAW must be defined for green roof substrates.
Fig. 3.1. Graph of volumetric water content versus matric potential with designations for plant-
based terms. From Handreck and Black (2002), Fig. 9.16, page 76.
Historically, measuring the matric potential of a porous media was time or labor intensive or not
sensitive enough at optimum water contents (Table 3.1), and most methods were developed
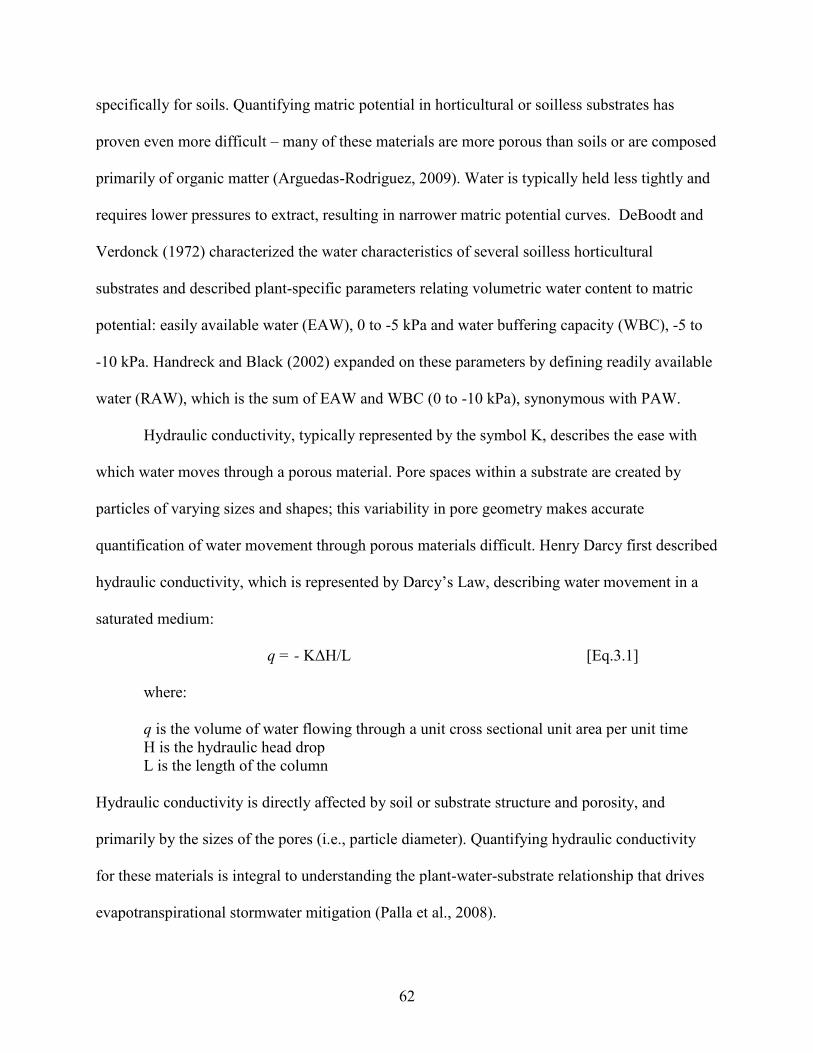
62
specifically for soils. Quantifying matric potential in horticultural or soilless substrates has
proven even more difficult – many of these materials are more porous than soils or are composed
primarily of organic matter (Arguedas-Rodriguez, 2009). Water is typically held less tightly and
requires lower pressures to extract, resulting in narrower matric potential curves. DeBoodt and
Verdonck (1972) characterized the water characteristics of several soilless horticultural
substrates and described plant-specific parameters relating volumetric water content to matric
potential: easily available water (EAW), 0 to -5 kPa and water buffering capacity (WBC), -5 to
-10 kPa. Handreck and Black (2002) expanded on these parameters by defining readily available
water (RAW), which is the sum of EAW and WBC (0 to -10 kPa), synonymous with PAW.
Hydraulic conductivity, typically represented by the symbol K, describes the ease with
which water moves through a porous material. Pore spaces within a substrate are created by
particles of varying sizes and shapes; this variability in pore geometry makes accurate
quantification of water movement through porous materials difficult. Henry Darcy first described
hydraulic conductivity, which is represented by Darcy’s Law, describing water movement in a
saturated medium:
q = - KΔH/L [Eq.3.1]
where:
q is the volume of water flowing through a unit cross sectional unit area per unit time
H is the hydraulic head drop
L is the length of the column
Hydraulic conductivity is directly affected by soil or substrate structure and porosity, and
primarily by the sizes of the pores (i.e., particle diameter). Quantifying hydraulic conductivity
for these materials is integral to understanding the plant-water-substrate relationship that drives
evapotranspirational stormwater mitigation (Palla et al., 2008).

63
Table 3.1. Various methods of determining soil matric potential. After: Brady and Weil, 2000, page 141.

64
Green roof substrates are composed primarily of mineral materials; in this way they are
more similar to soils. However, the particle size distribution is such that that, given their
porosity, they are more similar to horticultural or soilless substrates (Arguedas-Rodriguez, 2009).
Quantifying the matric potential of green roof substrates to define PAW could better inform
estimates of retention capability, offer increased understanding of the plant-substrate-water
relationship, and provide guidance regarding optimal substrate composition.
3.1.3 Methods for Determining Matric Potential of Soils and Soilless Substrates
Recent advances in technology offer a potential method for determining matric potential
of soils beyond -400 kPa using tensiometers (Schindler et al., 2010; Schindler et al., 2010b). This
limit is far beyond the traditional tensiometer limit of -70 to -90 kPa (Schindler et al., 2010b;
Brady and Weil, 2000). The former limitations of tensiometers (Table 3.1) were the result of
water column cavitation, which is particularly a problem in porous soilless substrates (Arguedas-
Rodriguez, 2009; Schindler et al., 2010b). Most often, tension table columns cavitated at
pressures less than 40kPa for a range of soilless substrates, irrespective of column height
(Arguedas-Rodriguez, 2009).
The HYPROP© system was developed by UMS, INC (Munich, Germany) based on the
evaporative method theory (Peters and Durner, 2008) and further described by Schindler et al.
(2010, 2010b). The HYPROP© is intended for use with soils; the recommended methodologies
(Decagon Devices, Inc, Pullman, WA; Schindler et al., 2010, 2010b) were adjusted to account
for increased particle size and porosity of green roof substrates.
This study therefore addressed the following hypotheses:
1. HO: The matric potential of extensive green roof substrates will not be affected by
increasing the proportion (10%, 20%, and 40%) of organic matter in a soilless substrate
blend.
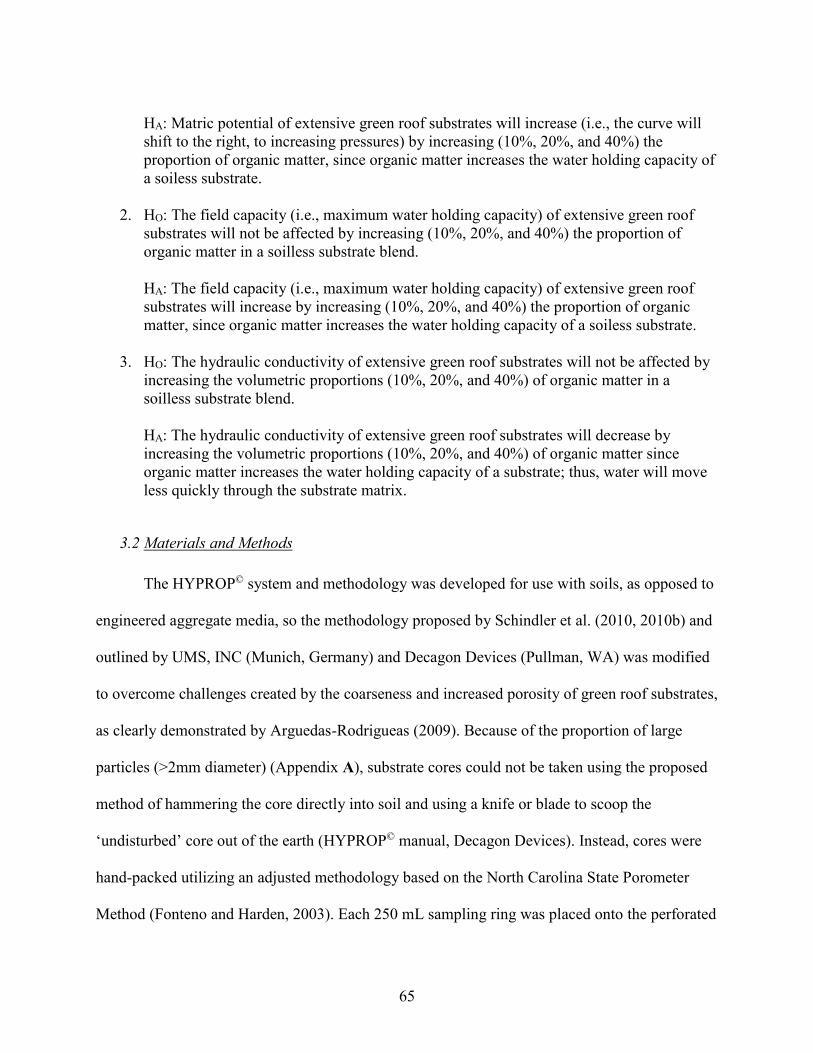
65
HA: Matric potential of extensive green roof substrates will increase (i.e., the curve will
shift to the right, to increasing pressures) by increasing (10%, 20%, and 40%) the
proportion of organic matter, since organic matter increases the water holding capacity of
a soiless substrate.
2. HO: The field capacity (i.e., maximum water holding capacity) of extensive green roof
substrates will not be affected by increasing (10%, 20%, and 40%) the proportion of
organic matter in a soilless substrate blend.
HA: The field capacity (i.e., maximum water holding capacity) of extensive green roof
substrates will increase by increasing (10%, 20%, and 40%) the proportion of organic
matter, since organic matter increases the water holding capacity of a soiless substrate.
3. HO: The hydraulic conductivity of extensive green roof substrates will not be affected by
increasing the volumetric proportions (10%, 20%, and 40%) of organic matter in a
soilless substrate blend.
HA: The hydraulic conductivity of extensive green roof substrates will decrease by
increasing the volumetric proportions (10%, 20%, and 40%) of organic matter since
organic matter increases the water holding capacity of a substrate; thus, water will move
less quickly through the substrate matrix.
3.2 Materials and Methods
The HYPROP© system and methodology was developed for use with soils, as opposed to
engineered aggregate media, so the methodology proposed by Schindler et al. (2010, 2010b) and
outlined by UMS, INC (Munich, Germany) and Decagon Devices (Pullman, WA) was modified
to overcome challenges created by the coarseness and increased porosity of green roof substrates,
as clearly demonstrated by Arguedas-Rodrigueas (2009). Because of the proportion of large
particles (>2mm diameter) (Appendix A), substrate cores could not be taken using the proposed
method of hammering the core directly into soil and using a knife or blade to scoop the
‘undisturbed’ core out of the earth (HYPROP© manual, Decagon Devices). Instead, cores were
hand-packed utilizing an adjusted methodology based on the North Carolina State Porometer
Method (Fonteno and Harden, 2003). Each 250 mL sampling ring was placed onto the perforated

66
Fig. 3.2. Photograph illustrating an amended
packing procedure for HYPROP© cores for use
with coarse substrates.
Fig. 3.3. Photograph illustrating an amended
packing procedure for HYPROP© cores for use
with coarse substrates.
base and filter fabric (both supplied by UMS, Munich, Germany), and 100 mL media poured into
the ring. (Figs. 3.2 and 3.3). The entire assembly was then tapped five times firmly on the table
using equal pressure for each tap. Another 100 mL media were poured into the ring and tapped
five times as before. A final 100 mL media were poured into the ring, overfilling it. After five
taps a metal straight edge was used to carefully remove any remaining media which extended
above the top of the ring (Figs. 3.4 and 3.5).

67
Fig. 3.4. Photograph illustrating an amended packing procedure for
HYPROP© cores for use with coarse substrates.
Fig. 3.5. Photograph illustrating an amended packing procedure for
HYPROP© cores for use with coarse substrates.

68
In this way, replicate cores were packed at the same moisture content to the same bulk density
within treatments. After packing, cores were placed in a water bath for 48 hours to achieve
complete saturation (FCsat). After saturation, cores were allowed to drain for 10 minutes and then
installed onto HYPROP© sensor bases (Fig. 3.6) per standard methodology (Schindler et al.,
2010; Schindler et al., 2010b).
Fig. 3.6.Diagram of the HYPROP© system illustrating tensiometer placement within sample
cores. From Schindler (2010).
After draining, two holes were drilled into the top of the sample using a bore tool
included in the HYPROP© kit; one hole is drilled 3.75 cm into the sample (for the top
tensiometer), the other is drilled 1.25 cm into the sample (for the bottom tensiometer). The hole
depths are determined by the tool, to ensure contact between the ceramic cap of the tensiometers
and the substrate; it is the continuous water column from the sample water through the ceramic

69
cap and tensiometer to the pressure transducer which allows for an accurate pressure reading.
After holes were drilled, the HYPROP© sensor base was inverted and inserted into the substrate
core, taking care not to disturb the sample, and placing the correct tensiometer into the correct
hole. The entire assembly – sensor base, packed core, filter fabric, and perforated base – were
then turned right side up and the perforated base and filter fabric were carefully removed so as
not to disturb the packed sample. The sensor base has two clamps that secure the sampling ring –
these were clamped and the sensor base was then plugged into the computer using via USB,
included in the HYPROP© kit. Each HYPROP© unit was assigned a separate balance [Kern EG
2200, KERN Incorporated, Balingen, Germany; Mettler Toldedo PB3001-S, Mettler-Toledo
INC, Columbus, Ohio; Mettler Toledo XS4002S, Mettler-Toledo INC, Columbus, OH] and
connected to the TensioView software program (UMS INC., Munich, Germany).
Matric potential is measured by the HYPROP© by measuring the suction force of the
tensiometer column through the porous ceramic cap which is in contact with the substrate sample
water. The TensioView program records tensiometer readings from the sensor base and a
simultaneous weight measurement from the balance every ten minutes. Measurement continues
as long as the water column from the pressure transducer to the substrate water remains intact.
As macropores lose water, this continuous column of water is dependent upon water in
micropores and water films at the edges of substrate particles.
The standard methodology allows for a single dry-down period - the cores are allowed to
dry via evaporation until the tensiometer water columns cavitate, at which time the units are
disassembled and cores are oven-dried to quantify soil dry weight. However, since increased
organic content in porous media can result in water repellency (DeBano, 1981), I modified the
methodology in an attempt to quantify between-dry down differences in matric potential and

70
hydraulic conductivity due to differences in water adsorption during re-wetting. Cores were re-
saturated by applying deionized water evenly across the top of the cores in 10 mL increments
using a pipette over one-half hour prior to water column cavitation. The software displays real-
time measurements, so cores were re-hydrated once the tensiometer readings showed inflection,
prior to column cavitation (Fig. 3.7)
Fig. 3.7. Screen capture taken from the TensioView software program used in conjunction with
the HYPROP© to show the tension measurements during three consecutive dry-down runs from a
single sensor base. Tension increases as the sample dries. The light blue line represents the top
tensiometer readings, the dark blue line represents the bottom tensiometer readings, and the
dashed vertical line shows column cavitation.
Each replicate core was re-saturated twice using this procedure, for a total of three dry-down
periods per core per treatment, for a total of nine replicate soil moisture curves per treatment. A
60:40 crushed recycled brick:scoria mineral component was blended with mushroom compost

71
(Frey Brothers, Lancaster, Pennsylvania) at 10%, 20%, or 40% volumetric proportions
(designated as 10%OM, 20%OM, or 40%OM), which constituted the three treatments in this
study. Retention data were analyzed using the HYPROP-FIT© software (UMS INC., Munich,
Germany) and fit using the van Genuchten bimodal/ Mualem model (Durner, 1994; Mualem,
1976):
Eq. 3.2
where
Se is the effective water content (cm3/cm3);
h is the suction head (cm);
wi is a unitless parameter based on weight where all w parameters sum to 1;
α is related to air-entry suction pressure;
n is a measure of the pore-size distribution, n>1; and
mi = 1- 1/ni
This model is the result of Durner’s modification to van Genuchten’s (1980) adjustment to the
Richard’s Equation, which describes water movement in saturated porous media. van
Genuchten’s adjustment considered unsaturated conditions while Durner considered constraints
presented by unequal pore space distribution. The results of the nine replicate dry downs (three
HYPROP© instruments, three dry downs per treatment) were averaged together because there
was no between-rep or between-dry down effect (Fig 3.8).
Fig. 3.8. Matric potential of an extensive green roof substrate with 20% organic matter, as

72
determined by the HYPROP© method. Three HYPROP© instruments were used to measure
matric potential in three consecutive dry-down periods, for a total of nine retention curves (all
plotted here). Between-replicate effects were non-significant, so results were averaged together
for all treatments.
The hydraulic conductivity data output from the HYPROP-fit© software was incorrect.
This was determined by double-checking the output values with the raw data output. Because the
HYPROP© was designed for soil analyses, hydraulic conductivity measurements may not be
reliable for higher porosity media (Leo Rivera, Decagon Devices, Inc. pers. comm.). The
measurement range of hydraulic conductivity may also be limited by the HYPROP© because
measurements are not recorded until a certain difference in the prior measurement has been
reached (determined by the software), s measurements only ranged from about 1.8 to 2.5 pF
(Carlo Bibbiana, University of Pisa, Italy, pers. comm.) Correct values were obtained via hand

73
calculation of the raw data (weight, VWCreal, time, and tension). These data had to be spliced
together to create full hydraulic conductivity curves; an example of one of these curves is
presented in Fig. 3.9.
Fig. 3.9. Hydraulic conductivity K(pf) as determined by the HYPROP© method, for an
experimental green roof substrate with 10% organic matter.
Hydraulic conductivity data were analyzed using the HYPROP-fit© software (UMS INC.,
Munich, Germany) and fit using the Mualem model (Mualem, 1976). Matric potential and
hydraulic conductivity data were analyzed using logarithmic regression via the PROC
LOGISTIC command (SAS 9.3, SAS Institute, INC., Cary, NC) to account for the log scale of
the pF variable.

74
3.3 Results and Discussion
3.3.1 Field Capacity
The starting VWC for 10%OM was 41%, significantly lower than the 46% for 20%OM
and 40%OM (Fig. 3.9). Substrate maximum VWC ranging from 41-46% may be considered
high, considering maximum VWC for a commercial green roof substrate blend was reported as
34% (Starry, 2013) using direct moisture measurements for platform-scale experimental green
roof field research.
Fig. 3.10. Matric potential of three green roof substrates with increasing volumetric proportions
(10%, 20% and 40%) of organic matter, obtained by using the HYPROP© system. Means (n = 9)
are shown for all treatments.
Although Voyde (2011) also reported a range of 40.8 to 49.6% for maximum WHC, this was
based on the recommended FLL method, which like the HYPROP© method requires a saturation

75
period of at least 24 hours. In Voyde’s study the actual substrate VWC was not directly
quantified; rather, the data was estimated using a water-balance approach subtracting discharge
from rainfall using the lab-based WHC metric. In contrast, my results, although based on a truly
saturated sample, present real or actual VWC (VWCreal) values, quantified from direct
gravimetric measurements of the sample throughout the drying process. Nonetheless, the
maximum VWC for an extensive green roof in the Mid-Atlantic region will likely not exceed
30% except in very large, intense rain events where rainfall equals discharge (Mr. Charlie Miller,
P.E. [RoofMeadow], pers. comm.).
For this reason, I have chosen to differentiate between FCsat and FCunat. Since the
substrate cores were saturated 48 hours and allowed to drain gravitationally before initiation of
the experiment, these values refer exclusively to FCsat, while field-observed values would
represent FCunsat, given that green roof substrates are engineered to be drain rapidly and are
unlikely to be saturated for extended periods, except under extreme (flooded) conditions; this is
therefore most likely an artifact of the laboratory protocols currently used. Applying a
delineation between FCsat and FCunsat to regulatory estimations of green roof storm water
mitigation potential based on lab-derived maximum WHC (FCsat) would be a more informed
method of approximating potential retention because green roofs rarely, if ever, reach true
saturation.
3.3.2 Green Roof Substrate Matric Potential
The matric potential of three experimental green roof substrates was characterized for pressures
up to approximately 2.5 pF (approximately -30 kPa), at which point the tensiometer water
columns cavitated, ending the experiment. Although -30 kPa is far below the -1500 kPa (4.2 pF)
assumed value of PWP, it exceeds the -10 kPa maximum attained by Arguedas-Rodriguez (2009)

76
when characterizing the matric potential of pine bark, a soilless substrate with similar maximum
VWC (48%) and porosity, utilizing a tension table method with a 5-cm column. Furthermore, it
far exceeds the -10 kPa designation for plant unavailable water reported by DeBoodt and
Verdonck (1972) and confirmed by Handreck and Black (2002) for horticultural soilless
substrates. In this way, the HYPROP© does somewhat extend the measurement range of matric
potential for porous soilless substrates; however, water column cavitation occurred at
approximately 18% VWC, far above PWP (Arguedas-Rodriguez, 2009). Based on data presented
in Chapter 3, plants were evapotranspiring water from these same experimental substrate blends
below 5% VWC. Despite reaching tensions beyond -30 kPa, unavailable water in green roof
substrates, it seems that this PWP still cannot be well-defined using the HYPROP© method.
There were no differences (p>0.05) in matric potential between any treatment in the tension
range (0.25-2.5 pF) measured. As it is assumed that substrate organic content will mostly affect
the increasingly unavailable water in the substrate at higher (more negative) matric potential than
2.5 pF, I cannot confidently predict the effects of organic content on matric potential with
regards to plant-water relations from these results. From this perspective, it is probably more
reliable to estimate plant water use from the VWC substrate data, as will be illustrated in
Chapters 4 and 5.
The cavitation of the tensiometer water column at tensions around 2.5 pF (± 30 kPa) is
assumed to be a result of the overall porosity of the substrates. Given the proportion of large (>2
mm diameter) particles in the three experimental blends (Appendix B), I assume that macropore
drainage may have contributed to a premature cavitation of the water column. Also of
importance is tensiometer placement within the cores (Fig. 3.5). Because the HYPROP©
apparatus uses on the evaporative theory (Peters and Durner, 2008), tensiometers take

77
measurements continuously as cores dry via evaporation from the top of the sample. Because the
samples dry from the top to the bottom, a significant amount of water could remain below the
tensiometer caps after cavitation – due to material porosity and macropore water loss – which
would go unmeasured by the tensiometers, although it would be correctly quantified into
VWCreal based on balance measurements. These two principles may indicate that despite the
increased measurement range, the HYPROP© system may not be appropriate for measuring
matric potential in very porous green roof substrates.
3.3.3 Green Roof Substrates and Hydraulic Conductivity
There were no statistical (α=0.05) differences in hydraulic conductivity between any treatments,
which suggests that increasing the organic content of a green roof substrate does not affect multi-
dimensional water flow through the media (Fig. 3.10). These results are counterintuitive, given
that organic matter can hold up to nine times its weight in water (Hillel, 2004) and therefore
increasing a substrate’s organic content should increase water holding capacity, thereby
decreasing hydraulic conductivity.

78
Fig. 3.11. Hydraulic conductivity for three experimental green roof substrates with increasing
(10%, 20%, and 40%) volumetric proportions of organic matter as determined by the HYPROP©
method. Means (n=9) are presented for each treatment.
3.3.4 Model Parameters
Green roof substrates rarely saturate, as these data have demonstrated, and the particle size
distribution (Appendix B) demonstrates a wide range of pore space. Model parameters for the
three experimental substrate blends using the van Genuchten bimodal/ Mualem model (Durner,
1994; Mualem, 1974) are presented in Table 3.2.
79
Table 3.2. Presentation of van Genuchten bimodal (Durner, 1994) parameters for water retention and hydraulic conductivity of three
experimental green roof substrate blends with increasing volumetric proportions of organic matter (10%, 20%, or 40%).

80
3.4 Conclusions
This experiment clearly defines a need for better-defined protocols for the
analysis of porous green roof substrate physical properties, especially with regards to WHC and
FC. The current use of lab-determined WHC and FC values most likely overestimate potential
green roof storm water retention due to saturation-based methodologies. I have therefore
delineated FCsat from FCunsat as a means to separate saturation-based field capacity and substrate
VWC after gravitational drainage exclusive of saturation, which is likely more representative of
actual green roof retention potential.
The HYPROP© system could provide a slightly better quantification of matric potential
of green roof substrates, beyond the traditional range offered by tension table analysis of porous
soilless substrates; however, the HYPROP© method still could not characterize matric potential
(and therefore, VWC) for green roof substrates beyond tensions which are assumed to designate
plant unavailable water (>-50kPa to -500 kPa). Retention and hydraulic conductivity data were
fit using the van Genuchten bimodal (Durner, 1994) model, which considers porous media with a
range of particle sizes in unsaturated conditions.
This lab analysis of extensive green roof substrates shows few differences in hydraulic
properties with increasing (10%, 20%, and 40%) volumetric proportions of organic matter, a
surprising result given that organic matter provides water holding capacity, especially in soilless
systems. Data presented in Chapters 4 and 5 indicate that lab-based analyses of green roof
system components may not accurately predict or represent component behavior in the field.
While the HYPROP© offers an improved methodology for determining green roof
substrate matric potential, challenges presented by system design and substrate characteristics
prevent the characteristic of the entire moisture curve. Additional work to continue to expand the

81
measurement range of matric potential in green roof substrates would only further inform
scientists, designers, and regulatory entities with regards to green roof storm water retention
performance. Unfortunately, the quantification of component performance doesn’t really speak
to or predict entire system performance, nor do lab-based analyses adequately predict field-based
measurements. Since regulatory agencies determine system specification requirements based on
predicted or estimated stormwater retention, a more valuable use of research resources would be
to develop more accurate predictions of stormwater retention performance based on system
design.
82
Chapter 4: Growth and rates of evapotranspiration of container-grown Sedum
kamptschaticum grown in four different green roof substrates in a growth chamber.
4.1 Introduction
As researchers continue to investigate green roof components and system performance
(VanWoert et al., 2005; Rowe et al., 2006; Molineaux et al., 2009; Berndtsson et al., 2006;
Mentens et al., 2006; Teemusk and Mander, 2007), the total green roof area in North America
continues to increase (Erlichman and Peck, 2013). As the layer which supports the biological
functioning of any green roof system, green roof substrates (GRS) hold water for plant growth,
allow air movement for root gas exchange, offer stability and structure for root anchoring, and
provide nutrients for plant uptake. While GRS do retain a proportion of storm water through
substrate water holding capacity (buffering immediate storm water runoff), plants provide the
additional ecosystem service of storm water removal through transpirational water cycling. In
this way, water held in the GRS is taken up through the plant roots and cycled directly back into
the atmosphere as water vapor, decreasing the water content of the GRS to allow for further
capture of the next rain event. While water does leave the substrate through evaporative losses,
Starry (2013) demonstrated that with the exception of large (>62.5 mm) rain events, planted
experimental green roof platforms in the Mid-Atlantic region were 30% more efficient at moving
storm water than unplanted experimental green roof platforms. Starry (2013) illustrated that this
efficiency was directly tied to storm intensity, i.e. the amount of rainfall falling during a specific
time period. This contradicted VanWoert et al.’s (2005) conclusion that brown or unplanted
experimental roof platforms were just as effective at evaporating storm water as planted
experimental platforms. This illustrates that the effects of GRS composition on plant growth and
83
evapotranspiration should be investigated to better inform storm water retention predictions and
green roof system design.
4.1.1 Green Roof Substrates
In general, any soilless substrate should be consistent in composition, free of
pathogens and weed seed, and provide adequate water, air, and nutrients for plant survival and
growth (Handreck and Black, 2007). In addition to these properties, GRS must also have an
appropriate bulk density to resist wind uplift without surpassing roof structural live load limits
for the roof; they are also engineered to rapidly drain to avoid ponding on any area of the roof. In
the early nineteenth century, green roofs in Berlin did not use engineered media; rather,
construction rubble was spread over tar paper roofs and the living systems developed over time
(Kohler and Poll, 2010). Modern green roof substrate composition is largely based on
recommendations in the Forschungsgesellschaft Landschaftsentwicklung Landschaftsbau (FLL),
the German landscape industry’s guidelines for the design, planting, and maintenance of green
roof systems. The FLL makes recommendations for particle size distribution and organic content
as well as specific physical properties such as water holding capacity, bulk density, and total
porosity (FLL, 2008).
Beyond the basic FLL recommendations, GRS composition varies internationally and
regionally, usually due to material availability. North American GRS are largely composed of
lightweight aggregates – usually slate, shale, or clay that have been kiln-fired to create expanded
mineral particles (Beattie and Berghage, 2004). Particles of varying diameter are mixed together
to achieve appropriate particle size distribution and physical properties such as water holding
capacity, total porosity, and bulk density (Handreck and Black, 2007). Interestingly, while the
North American green roof industry largely uses manufactured aggregate for GRS, research from

84
other countries indicates efforts to utilize lower-carbon recycled or natural materials for the
inorganic component of GRS. For example, New Zealand green roof substrates are largely
composed of naturally-occurring zeolite and volcanic rock (Fassman and Simcock, 2008). A
study based in Northern Italy used a blend of locally available naturally-occurring mineral
materials as the extensive green roof substrate (Nardini et al., 2012). Molineaux et al. (2009)
reported that in the U.K., broken brick is the most commonly-used mineral portion of extensive
green roof substrates. In Sweden, extensive green roof substrates were traditionally natural soil
amended with naturally-occurring lava or scoria, and Emilsson (2008) reported the results of a
study utilizing broken roof tiles as a component of extensive green roof substrates as an
alternative to mined minerals.
The organic content of GRS varies depending on the design intent of the system;
however, most ready-to-plant blends roughly follow FLL guidelines of ≤65g/L (FLL, 2008). The
recommendation is based on the verification method of ashing or loss on ignition; however,
horticultural substrates are generally mixed volumetrically. The guideline is a weight per volume
metric – a value that could vary widely depending on the bulk density of the blend. Appendix C
data indicates that given the difference in densities of the mineral and organic portions of GRS, a
substrate could have up to 40% organic matter (volumetrically) and still fall within the FLL
guidelines. Since organic matter provides cation exchange and water holding capacity, varying
the organic content of a GRS could have significant impacts on plant growth and
evapotranspiration. The effects of increasing the volumetric proportion of organic matter in GRS
on plant growth and evapotranspiration therefore need to be further investigated to gain a better
understanding of how substrate composition may affect green roof plants and stormwater
mitigation potential.

85
4.1.2 Green Roof Plants
Green roofs present a unique environment for plants – a thin substrate layer requires a
fibrous, non-aggressive root system so as to avoid compromising the integrity of the waterproof
membrane of the roof; the reduced rooting zone also limits the volume of water that can be
stored after rain events. Green roof plants must tolerate extreme diurnal temperature ranges, diect
sun exposure, and high wind exposure can increase stomatal water loss; all these factors combine
to provide a drought-prone system even in climatic areas with relatively consistent rainfall.
Although green roofs are most often found in urban areas, the environmental challenges they
present to plants are in many ways comparable to deserts or rocky outcroppings, and the plants
that are most often used in extensive green roof systems are succulent species which have
evolved physiological responses to extreme heat and drought conditions.
One such mechanism is a variation on the traditional C3 photosynthetic pathway termed
the Crassulacean Acid Metabolism (CAM). CAM allows for a water use efficiency, or the weight
of plant material per volume of water used, six-fold greater than C3 plants (Nobel, 1996) because
carbon uptake occurs nocturnally. CAM plants can keep their stomata closed during the day to
prevent water loss – Carbon (CO2) is sequestered at night when stomata are open, and is
converted to malic acid until sunrise. Even though stomata are closed during the data (primarily
for water conservation), photosynthesis can continue during the day (albeit at a reduced rate) by
converting the malic acid back into CO2 for use in photosynthesis (Taiz and Zeiger, 2010).
Various degrees of CAM expression exist – ‘CAM cycling’ refers to the internal re-fixation of
carbon stored as malic acid while ‘CAM’ indicates nocturnal carbon fixation via the enzyme
PEPcase with the potential for periods of stomatal opening at the beginning and end of the day.
‘CAM idling’ refers to stomatal closure for the entire 24-hour day, in which no new carbon is

86
harvested but malic acid is still created nocturnally via the recapture of respiratory CO2 (Borland
et al, 2011).
Starry (2013) identified CAM metabolism in two popular green roof species, Sedum
album and Sedum kamtschaticum, which supported Butler et al.’s (2011) designation of Sedum
album and Sedum rupestre as facultative CAM species. Regardless of the photosynthetic
pathway, the effects of GRS on plant growth and evapotranspiration of green roof plants has not
been explored. In this study, the effects of substrate organic content on green roof plant growth
and evapotranspiration were evaluated by growing Sedum kamptschaticum in four different
substrates in a growth chamber for sixteen weeks.
The hypotheses that were formulated were:
1. HO: Plant root and shoot biomass will not be affected by substrate composition.
HA: Plant root and shoot biomass will be affected by substrate composition, with 40%
organic matter substrate producing greater root and shoot biomass than 10% and 20%
substrates because of the additional cation exchange and water holding capacity provided
by the organic matter.
2. HO: Green roof substrate organic content will not affect evapotranspirational water loss
from pots planted with Sedum kamptschaticum.
HA: Green roof substrate organic content will affect evapotranspirational water loss from
pots planted with Sedum kamptschaticum, since shoot growth is expected to increase with
increasing proportions of organic matter, which should lead to greater leaf area and
canopy volume and thus greater evapotranspiration.
4.2 Materials and Methods
In June 2012 a 60:40 crushed recycled brick:scoria mineral component was blended with
mushroom compost (Frey Brothers, Lancaster, Pennsylvania) in a drum mixer to create three
different substrates on a volumetric (m3/m3) basis: 90 mineral:10 organic, 80 mineral: 20
organic, or 60 mineral:40 organic. The total volume of each blend was adequate for platform-
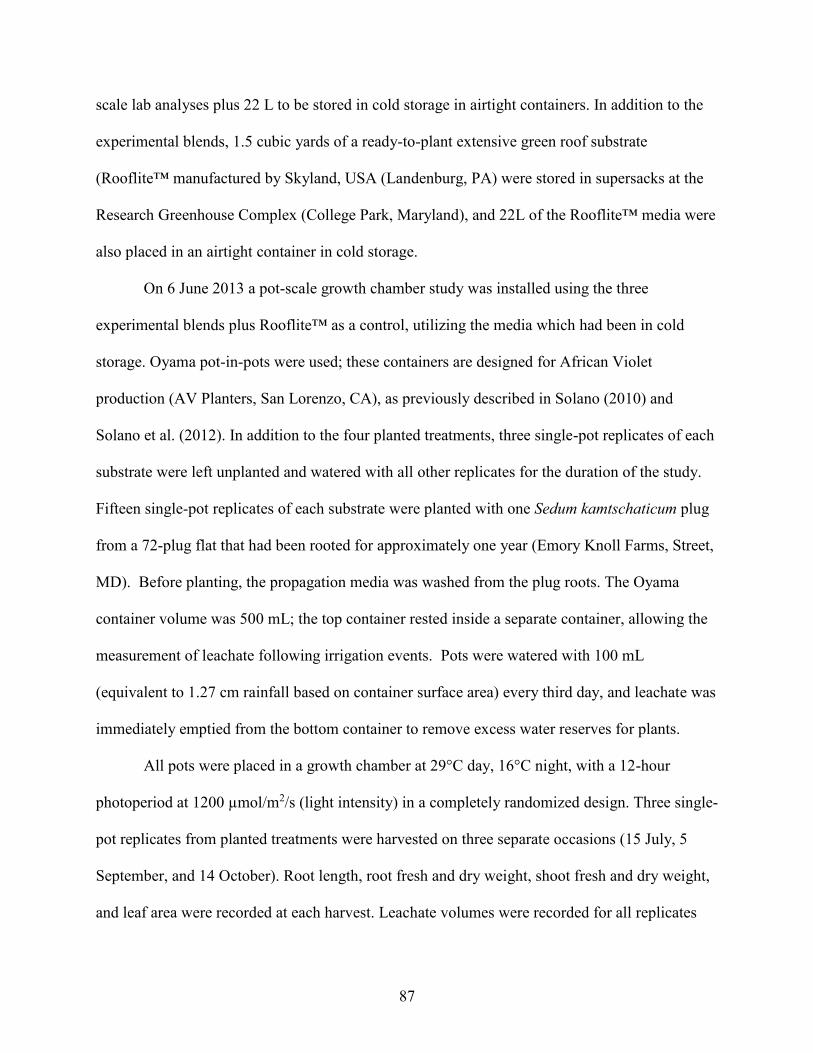
87
scale lab analyses plus 22 L to be stored in cold storage in airtight containers. In addition to the
experimental blends, 1.5 cubic yards of a ready-to-plant extensive green roof substrate
(Rooflite™ manufactured by Skyland, USA (Landenburg, PA) were stored in supersacks at the
Research Greenhouse Complex (College Park, Maryland), and 22L of the Rooflite™ media were
also placed in an airtight container in cold storage.
On 6 June 2013 a pot-scale growth chamber study was installed using the three
experimental blends plus Rooflite™ as a control, utilizing the media which had been in cold
storage. Oyama pot-in-pots were used; these containers are designed for African Violet
production (AV Planters, San Lorenzo, CA), as previously described in Solano (2010) and
Solano et al. (2012). In addition to the four planted treatments, three single-pot replicates of each
substrate were left unplanted and watered with all other replicates for the duration of the study.
Fifteen single-pot replicates of each substrate were planted with one Sedum kamtschaticum plug
from a 72-plug flat that had been rooted for approximately one year (Emory Knoll Farms, Street,
MD). Before planting, the propagation media was washed from the plug roots. The Oyama
container volume was 500 mL; the top container rested inside a separate container, allowing the
measurement of leachate following irrigation events. Pots were watered with 100 mL
(equivalent to 1.27 cm rainfall based on container surface area) every third day, and leachate was
immediately emptied from the bottom container to remove excess water reserves for plants.
All pots were placed in a growth chamber at 29°C day, 16°C night, with a 12-hour
photoperiod at 1200 µmol/m2/s (light intensity) in a completely randomized design. Three single-
pot replicates from planted treatments were harvested on three separate occasions (15 July, 5
September, and 14 October). Root length, root fresh and dry weight, shoot fresh and dry weight,
and leaf area were recorded at each harvest. Leachate volumes were recorded for all replicates

88
after the irrigation event most closely preceding a harvest. After the final harvest, six single pot
replicates from each planted treatment plus three single pot unplanted replicates remained in the
growth chamber and pot weights were recorded twice daily. Resultant weight loss was attributed
to evapotranspiration (planted replicates) and evaporation (unplanted replicates). After 10 days,
all replicates were re-watered with 20 mL water every 12 minutes until each replicate had
received 100 mL of water to mimic a 1.27 cm rain event occurring over one hour. Leachate
volumes were recorded for each replicate as before, and weights were recorded twice daily for
the next 7 days. Replicates were not re-watered for five additional days – totaling 12 days
without water – however, they were watered as before, mimicking a one-hour, half-inch rain
event and leachate volumes from each replicate were recorded. Water loss was again recorded
for the next 10 days. After the third dry-down period all plants were destructively harvested as
previously described.
Data were analyzed using the MIXED procedure in SAS 9.3 and the LSMEANS
statement; Scheffe’s adjustment was used for multiple means comparisons for all data with
α=0.05.
4.3 Results and Discussion
4.3.1 Destructive Harvests
Sedum kamptschaticum leaf area was greater for plants grown in the industry standard
(Rooflite ™) blend for the first harvest but was not different from the 40% OM treatment for the
second and third harvests (Fig. 4.1). Plants grown in 20% OM substrate had less leaf area than
those grown in 40% OM and greater leaf area than those grown in 10% OM, which was expected
given the benefits of increased water availability with increasing proportions of organic matter.

89
Fig. 4.1. Leaf area of Sedum kamptschaticum in three green roof substrates with increasing volumetric
proportions (10%, 20%, and 40%) of organic matter plus an industry standard control (Rooflite™)
substrate. Means (n=3) are shown for each treatment per harvest date. Letters indicate significance at
α=0.05 using Scheffe’s adjustment for multiple means comparison.
Although the Rooflite™ has similar organic content gravimetrically (Appendix C), the
volumetric proportion of OM is unknown. Nonetheless, the increased leaf area for plants grown
in the industry standard blend for the first harvest may be due to increased water availability as a
function of particle size distribution (Appendix B, Table B.2.). Although Rooflite™ has fewer
small-diameter particles compared to the experimental blends, (<0.355 mm), it has a greater
proportion of medium-diameter particles (0.355-2.36 mm, which increases the water holding
capacity of the substrate. The increased growth during the first six weeks of the study may
demonstrate that water availability plays a greater role than increased nutrient availability.

90
The trend was similar for aboveground biomass fresh weight as the Rooflite™ industry
standard substrate outperformed the three experimental blends, but only for the first harvest. By
the second harvest the 40% OM blend was no different than the Rooflite™ with 20% OM and
10% OM producing less fresh biomass each, respectively (Fig. 4.2).
Fig. 4.2 Aboveground biomass fresh weight of Sedum kamptschaticum plants grown in three green roof
substrates with increasing volumetric proportions (10%, 20%, and 40%) of organic matter compared to an
industry standard control (Rooflite™) substrate. Means (n=3) are shown for each treatment per harvest
date. Letters indicate significance at α=0.05 using Scheffe’s adjustment for multiple means comparison.
Aboveground biomass dry weight indicated that although leaf area and fresh weight may
be more sensitive to water availability than nutrient availability during early establishment (in
this case approximately 6 weeks) (Fig. 4.3), dry mass accumulation is more sensitive to nutrient
availability, given the differences in particle size distribution between the Rooflite™ and

91
experimental blends (Appendix B, Table B.2.). Dry mass for plants grown in the industry
standard was similar to that of plants grown in the 40% OM blend for harvest one, but the 40%
OM blend outperformed all other treatments for subsequent harvests.
Fig. 4.3. Aboveground biomass dry weight of Sedum kamptschaticum plants grown in three green roof
substrates with increasing volumetric proportions (10%, 20%, and 40%) of organic matter plus an
industry standard control (Rooflite™) substrate. Means (n=3) are shown for each treatment per harvest
date. Letters indicate significance at α=0.05 using Scheffe’s adjustment for multiple means comparison.
Differences in below-ground biomass fresh weight were only detected at the second
harvest, when the 20% OM blend produced less biomass than the other three treatments (Fig.
4.4). There were no differences in belowground biomass dry weight for any of the harvests (Fig.
4.5).

92
Fig. 4.4. Below-ground biomass fresh weight of Sedum kamptschaticum
plants grown in three green roof substrates with increasing volumetric
proportions (10%, 20%, and 40%) of organic matter plus an industry
standard control (Rooflite™) substrate. Means (n=3) are shown for each
treatment per harvest date. Letters indicate significance at α=0.05 using
Scheffe’s adjustment for multiple means comparison.
Fig. 4.5. Below-ground biomass dry weight of Sedum kamptschaticum
plants grown in three green roof substrates with increasing volumetric
proportions (10%, 20%, and 40%) of organic matter plus an industry
standard control (Rooflite™) substrate. Means (n=3) are shown for each
treatment per harvest date. Letters indicate significance at α=0.05 using
Scheffe’s adjustment for multiple means comparison..

93
Root succulence was calculated by dividing the total root length (mm) by the
belowground biomass fresh weight (g) to account for variability in root structure. There were no
differences in root succulence for harvest one; however, plants grown in the 10% OM blend
demonstrated less root succulence than all other treatments for remaining harvests (Figure 4.6).
Total in-pot nutrient availability per treatment is presented in Appendix E. Given the limited pot
volume, N availability ranged from 0.19 to 0.76 g per pot, indicating that differences in
establishment may be more sensitive to water availability than nutrient availability.
Figure 4.6. Root succulence of Sedum kamptschaticum plants grown in three green roof substrates with
increasing volumetric proportions (10%, 20%, and 40%) of organic matter plus an industry standard
control (Rooflite™) substrate. Root succulence determined by dividing total root length (mm) by root
fresh weight (g). Means (n=3) are shown for each treatment per harvest date. Letters indicate significance
at α=0.05 using Scheffe’s adjustment for multiple means comparison.

94
4.3.2 Plant Dry Downs
Planted replicates lost more water than unplanted replicates over the course of the three
cumulative dry-down periods (Fig. 4.7), supporting Starry’s (2013) findings that planted green
roofs do mitigate more stormwater than unplanted green roofs.
Fig. 4.7. Total cumulative water lost by Sedum kamptschaticum planted in three different green roof
substrates with increasing volumetric proportions (10%, 20%, and 40%) of organic matter plus an
industry standard control (Rooflite™) and unplanted pots with the same substrate. This represents the
sum of averaged water loss after three separate 100-mL irrigation events, for a total of three dry-down
periods. Means (n=6 and n = 3 for each planted and unplanted treatment, respectively) are shown for each
treatment. P values indicate significance (α=0.05).
After accounting for whole plant dry biomass (Fig. 4.8), plants growing in 20% and 10%
OM lost more water over the course of the three dry-down periods than those plants growing in
40% OM and the industry standard blend (Figs. 4.9 and 4.10). Note that it is not assumed that
substrates with greater proportions of organic matter produce less efficient plants; rather, they

95
produce plants with significantly greater biomass (Figs. 4.3, 4.5, and 4.8) which reduces the
water loss of these larger plants when it is expressed on a per gram biomass basis. Hence, when
the data are normalized in this way between treatments, it looks like the smaller plants use more
water, which is not true since we are not showing total water loss per plant.
Figure 4.8. Dry mass of Sedum kamptschaticum grown in three different green roof substrates with
increasing volumetric proportions (10%, 20%, and 40%) of organic matter plus an industry standard
substrate (Rooflite™). Means (n = 3) are shown for each treatment for each harvest date.

96
Fig. 4.9. Cumulative water loss per gram dry weight of plant biomass by container-grown Sedum
kamptschaticum grown in three different green roof substrates with increasing volumetric proportions
(10%, 20%, and 40%) of organic matter plus an industry standard substrate (Rooflite™) for the first of
three dry downs. Means (n = 6) are shown for each treatment at each measurement interval.
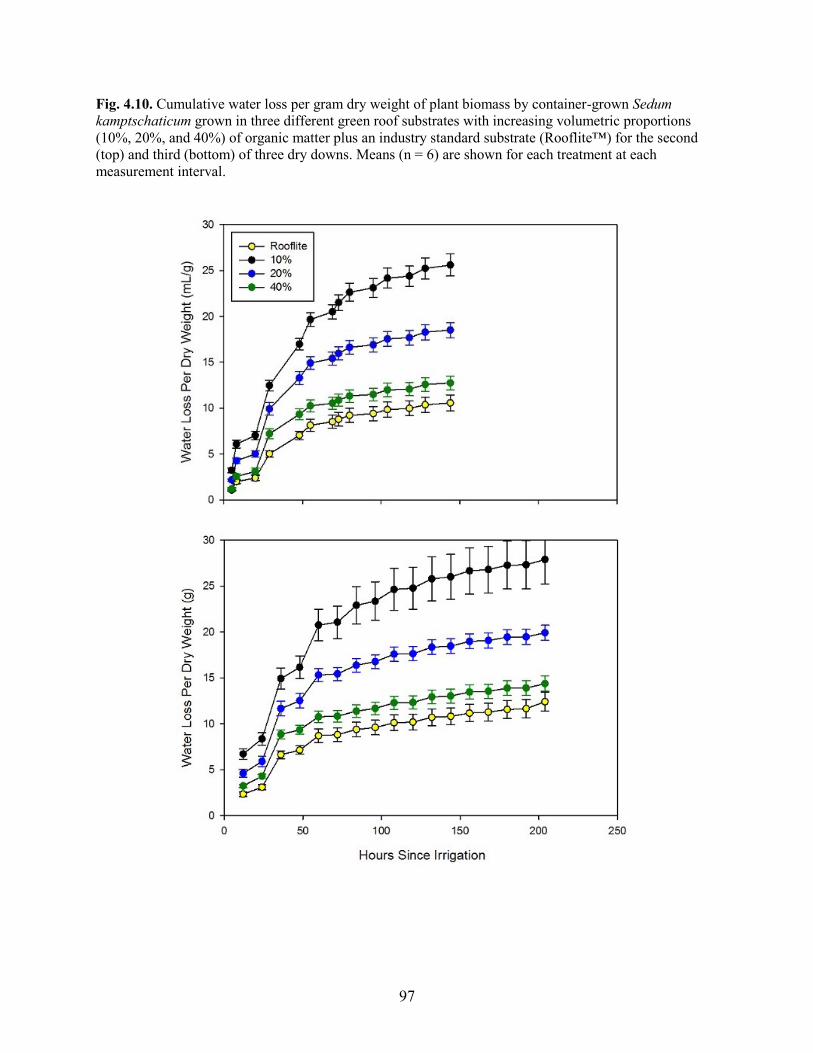
97
Fig. 4.10. Cumulative water loss per gram dry weight of plant biomass by container-grown Sedum
kamptschaticum grown in three different green roof substrates with increasing volumetric proportions
(10%, 20%, and 40%) of organic matter plus an industry standard substrate (Rooflite™) for the second
(top) and third (bottom) of three dry downs. Means (n = 6) are shown for each treatment at each
measurement interval.

98
Interestingly, all replicates lost water more quickly at the beginning of the first dry-down
as opposed to the second and third dry-down periods (Fig. 4.10). There are two possible
explanations for this. Firstly, the 100 mL irrigation event which began the first dry down was
applied all at once to each replicate pot while the second and third irrigation events were spread
out to mimic a one-hour, 1.27 cm rain event. Secondly, the decreased rate of water loss for the
second and third dry downs may indicate that plants had cycled into CAM. Until the beginning
of the first dry down, plants were watered every third day with 100 mL of water and were
watered in an identical fashion to begin the first dry down. They had therefore not been stressed
and likely had not cycled into CAM before the beginning of the first dry down; however, by the
beginning of the second dry down they had been 10 days without water and may have had their
stomata closed during all or part of the day by the beginning of the second dry down. By the
beginning of the third dry down, the plants had been over 20 days without water except for the
100 mL applied for the second dry down.
Because water loss is collectively attributed to evapotranspiration and transpiration,
average per-treatment water loss at each time interval for unplanted treatments was subtracted
from average per-treatment water loss for planted treatments (Figs. 4.11, 4.12, and 4.13) for
each dry-down period. With the exception of the standard Rooflite™ media during the first dry
down, evapotranspirational water loss from planted treatments surpassed evaporative water loss
from unplanted treatments within the first 48 hours of the dry down.

99
Fig. 4.11. Cumulative water loss of unplanted pots with green roof
substrates with increasing volumetric proportions (10%, 20%, and 40%)
of organic matter subtracted from cumulative water loss of pots planted
with Sedum kamptschaticum growing in the same experimental substrate
blends for the first of three dry down periods. Means (n=3 for unplanted
and n = 6 for planted treatments) are displayed.
Fig. 4.12. Cumulative water loss of unplanted pots with green roof
substrates with increasing volumetric proportions (10%, 20%, and 40%) of
organic matter subtracted from cumulative water loss of pots planted with
Sedum kamptschaticum growing in the same experimental substrate blends
for the second of three dry down periods. Means (n=3 for unplanted and n =
6 for planted treatments) are displayed.
100
Fig. 4.13. Cumulative water loss of unplanted pots with green roof substrates with increasing volumetric
proportions (10%, 20%, and 40%) of organic matter subtracted from cumulative water loss of pots
planted with Sedum kamptschaticum growing in the same experimental substrate blends for the third of
three dry down periods. Means (n=3 for unplanted and n = 6 for planted treatments) are displayed.
For the first dry down, the unplanted Rooflite™ treatment lost more water than the
planted Rooflite™ treatment, which may indicate that plants in the Rooflite™ media had
transitioned into CAM metabolism, with stomates closed during the day. If this was the case,
then daytime water loss would be due to evaporation only, and planted pots would be expected to
lose less water than unplanted pots due to the buffering effect of the plant canopy over the
exposed media. These results indicate that when plants are actively evapotranspiring water, they
are more effective at cycling stormwater back into the atmosphere than evaporation, confirming
Starry’s (2013) conclusion that Sedum plants are more effective at recharging green roof storage
in C3 metabolism compared to CAM metabolism.
101
The substrate volumetric water content (VWC) was calculated for each replicate by
accounting for the final plant fresh weight, substrate dry weight, and pot weight for each
replicate over the course of the dry down (Figs. 4.14, 4.16, 4.18). Substrate VWC ranged from
22-25% to 3.5-5% over the course of the first dry down (Fig. 4.14). The second dry down VWC
ranged from 18-22% to 4-5% (Fig. 4.16) while the third dry down VWC ranged from 20-23% to
2.5-4% (Fig. 4.18). The starting VWC was assumed to be container capacity (CC) for each
substrate treatment, because each replicate produced leachate following each initial irrigation
event. The final VWC at the end of each dry down indicates the plants were able pull nearly all
of the water out of the substrate.
Cumulative water loss for each dry down was normalized by total plant leaf area (Figs.
4.15, 4.17, and 4.19). Similarly to the per gram dry weight water loss, normalized results indicate
smaller plants may be more efficient; however, this is likely a result of the large difference in
plant size between treatments. Interestingly, the rate of water loss leveled after about 60 hours
for all three dry downs, which may indicate plants had transitioned to CAM to conserve water.
Comparing the timing with the in-pot VWC graphs shows this transition (points of inflection) to
occur around 8% VWC. Nevertheless, despite the extremely low water substrate VWC, the
plants continued to transpire beyond this, albeit more slowly, further suggesting CAM activity –
with stomata closed during the day, daytime water loss would be limited to evaporation and
nocturnal water loss would be minimal during stomatal opening. In-pot VWC fell below 5% for
all three dry downs, implying that S. kamptschaticum roots may have been accessing water
previously assumed to be unavailable for plant uptake.
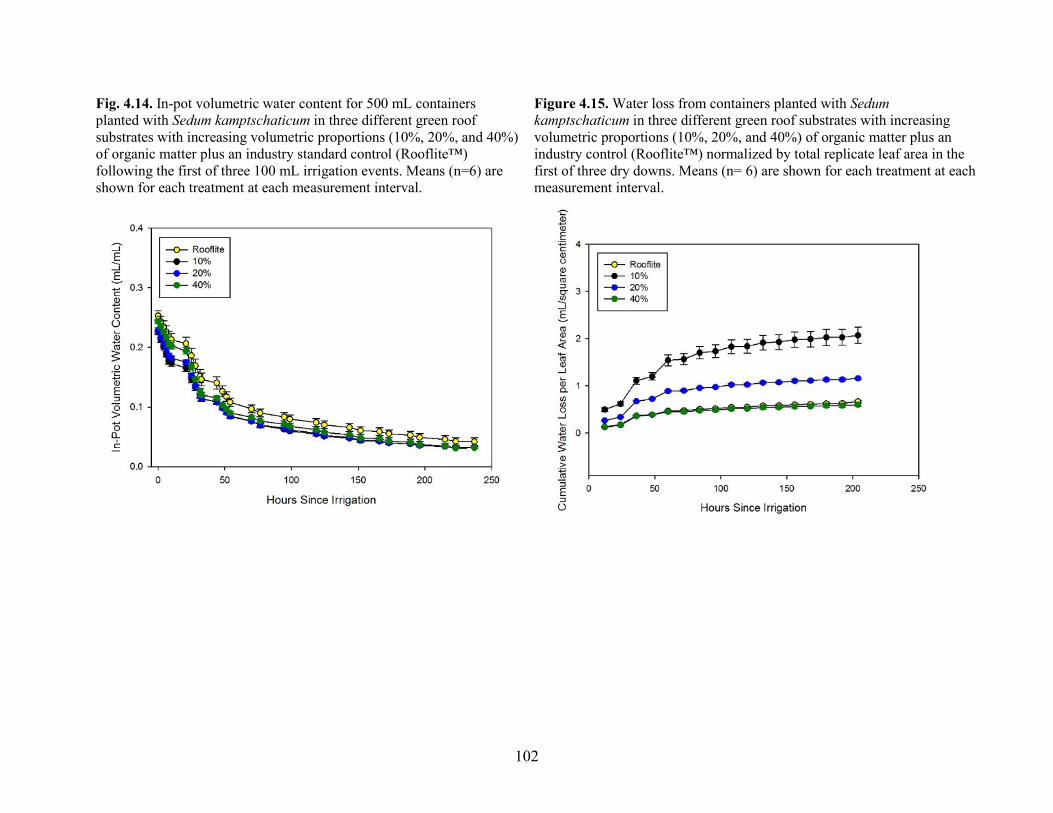
102
Fig. 4.14. In-pot volumetric water content for 500 mL containers
planted with Sedum kamptschaticum in three different green roof
substrates with increasing volumetric proportions (10%, 20%, and 40%)
of organic matter plus an industry standard control (Rooflite™)
following the first of three 100 mL irrigation events. Means (n=6) are
shown for each treatment at each measurement interval.
Figure 4.15. Water loss from containers planted with Sedum
kamptschaticum in three different green roof substrates with increasing
volumetric proportions (10%, 20%, and 40%) of organic matter plus an
industry control (Rooflite™) normalized by total replicate leaf area in the
first of three dry downs. Means (n= 6) are shown for each treatment at each
measurement interval.
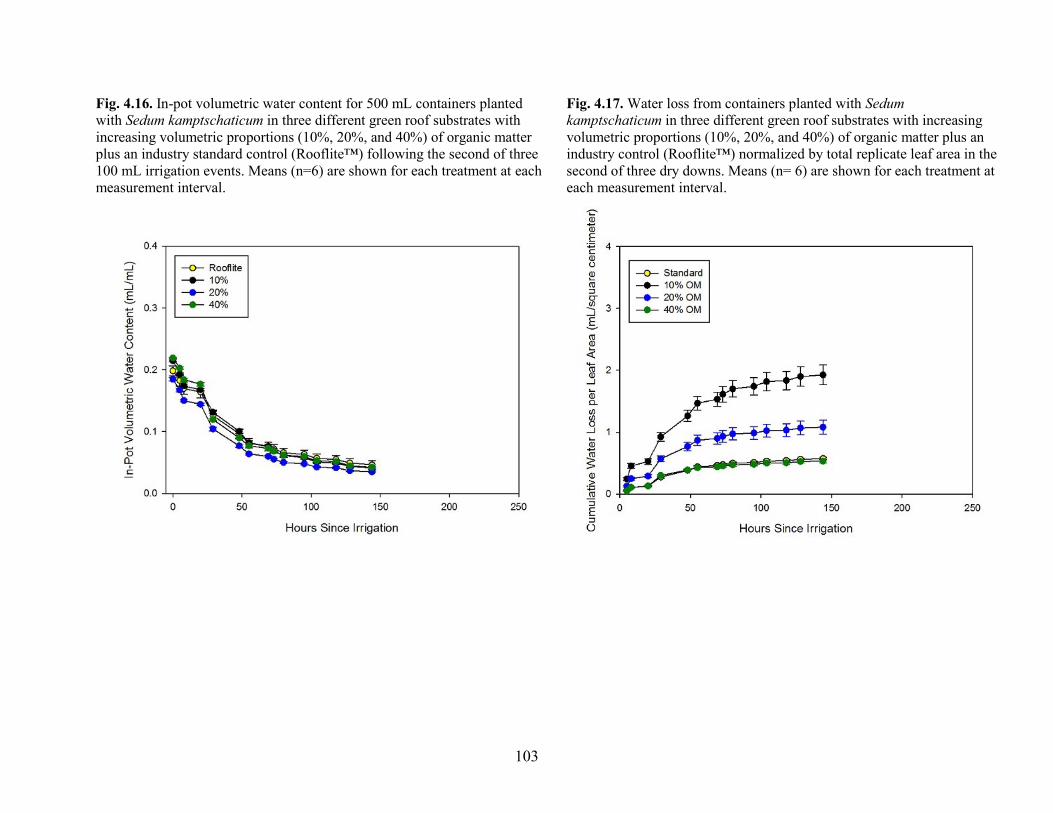
103
Fig. 4.16. In-pot volumetric water content for 500 mL containers planted
with Sedum kamptschaticum in three different green roof substrates with
increasing volumetric proportions (10%, 20%, and 40%) of organic matter
plus an industry standard control (Rooflite™) following the second of three
100 mL irrigation events. Means (n=6) are shown for each treatment at each
measurement interval.
Fig. 4.17. Water loss from containers planted with Sedum
kamptschaticum in three different green roof substrates with increasing
volumetric proportions (10%, 20%, and 40%) of organic matter plus an
industry control (Rooflite™) normalized by total replicate leaf area in the
second of three dry downs. Means (n= 6) are shown for each treatment at
each measurement interval.

104
Fig. 4.18. In-pot volumetric water content for 500 mL containers
planted with Sedum kamptschaticum in three different green roof
substrates with increasing volumetric proportions (10%, 20%, and 40%)
of organic matter plus an industry standard control (Rooflite™)
following the second of three 100 mL irrigation events. Means (n=6)
are shown for each treatment at each measurement interval.
Fig. 4.19. Water loss from containers planted with Sedum
kamptschaticum in three different green roof substrates with increasing
volumetric proportions (10%, 20%, and 40%) of organic matter plus an
industry control (Rooflite™) normalized by total replicate leaf area in
the second of three dry downs. Means (n= 6) are shown for each
treatment at each measurement interval.

105
4.4 Conclusions
As expected, increasing the volumetric proportions of organic matter in GRS results in
plants with greater biomass and leaf area, likely due to increased water availability with
increasing organic matter. Substrate composition did not affect the total volume of water
removed from the containers over time; rather, the presence of larger plants resulted in greater
transpirational water use (Fig. 4.7). Normalizing water loss by plant biomass dry weight and leaf
area indicated a greater efficiency for smaller plants but it is assumed this is a misleading result
based on the effect of smaller denominators for smaller plants. S. kamptschaticum plants grown
in 10% organic matter had less biomass and leaf area than plants grown in 20% or 40% organic
matter – dividing the cumulative water lost by a smaller denominator (dry biomass or leaf area,
respectively) would have resulted in a larger normalized value than dividing by a larger
denominator, i.e. for plants grown in 40% organic matter.
Perhaps the most interesting results of this experiment are the in-pot VWC reached
during the course of the three dry downs, especially when compared to cumulative water loss,
which typically asymptoted at approximately 8% VWC for all three dry-down periods (and
substrates). Permanent wilting point is assumed to be -15 kPa matric potential (Keihl et al.,
1992), which for horticultural substrates is around 40% VWC (Rodriguez 2009). These results
indicate that Sedum kamptschaticum can access water previously assumed to be unavailable to
plants. Clarifying the true VWC range at which green roof plants can successfully move water
will allow for better estimation of stormwater mitigation potential of green roof systems and
should be investigated more thoroughly.
Planted treatments lost more water than unplanted treatments cumulatively, and ET-T
[evapotranspirational – evaporational] water loss during each dry down further demonstrates that

106
plants are more effective at moving water into the atmosphere than evaporation. Applying these
data to the roof- or even watershed-scale further confirms Starry’s (2013) conclusions that
planted rooftops are more effective stormwater mitigation tools than brown or unplanted
rooftops. Furthermore, this study only spanned six months’ time – the extrapolated stormwater
retention potential over 30 years (assumed average lifespan of a green roof) of planted versus
unplanted roofs is significant.
These results indicate growth differences from increasing the volumetric proportions of
organic matter in an extensive green roof substrate may be due to differences in water
availability than nutrient availability. The limited pot volumes (500 mL) resulted in a range of
0.19-0.76 g total N per pot with increasing proportions of mushroom content, indicating Sedum
kamptschaticum plugs may have been more sensitive to the increased water holding capacity of
organic matter than to the increased nutrient content. While this study served to quantify
differences in Sedum kamptschaticum growth in experimental green roof substrates with
increasing volumetric proportions of organic matter during establishment, the platform-scale
field study presented in Chapter 5 provided data beyond the initial establishment period.

107
Chapter 5: A platform-scale study of the effects of green roof substrate organic
content on the rate of substrate dry down following rain events, storm water
retention, and growth of Sedum kamptschaticum.
5.1 Introduction
Although green roofs are becoming increasingly popular as storm water management
tools, our understanding of the effects of green roof system design on storm water mitigation is
still relatively poor, despite a growing body of literature. VanWoert et al. (2005) reported on the
effects of roof surface, slope, and media depth on storm water retention, concluding from the
platform-scale study that for all combined rain events, a 2% slope with 4 cm of substrate retained
more storm water compared to 6.5% slope and 2 cm or 6 cm substrate. In a second, the authors
concluded vegetated roof tops retain more storm water than gravel ballast or unplanted green
roof media (VanWoert et al., 2005). The effects of substrate depth (12 cm and 20 cm,
respectively) and vegetation type (herbaceous or woody shrubs) on temperature and storm water
mitigation were reported by Nardini et al. (2011), where the authors found significant effects of
substrate depth but no differences attributable to vegetation type. All vegetated modules retained
more storm water than non-planted controls. Starry (2013) investigated the role of specific
Sedum species on green roof storm water mitigation, reporting Sedum kamptschaticum and S.
sexangulare to have the highest rates of evapotranspiration and storm water mitigation compared
to S. album.
Looking beyond substrate depth and plant selection, the effects of substrate composition,
specifically organic content, on storm water mitigation potential is not well understood. Voyde et
al. (2010) investigated the effects of substrate composition and depth on storm water

108
performance of green roofs in New Zealand and concluded that neither variable had a significant
effect. Although the study did compare different compositions – the blends utilized zeolite,
pumice, or expanded clay, respectively - each blend was a volumetric proportion of 80% mineral
component and 20% composted bark fines. Molineaux et al. (2009) reported the effects of
organic content and mineral composition on plant growth. The organic content portion of the
study compared 15% (v:v) against 25% (v:v) and was independent of the study comparing
mineral composition and particle size distribution. As expected, increasing the volumetric
proportion of organic matter in a green roof substrate yielded larger plants; however, this was a
trial study which took place in a greenhouse under well watered conditions. The effects of
organic content on storm water mitigation were not investigated nor were the effects of organic
content on rates of evapotranspiration reported.
Gaining a greater understanding of the effects of substrate organic content on storm water
mitigation potential would better inform regulatory agencies, whose guidelines currently focus
largely on substrate depth and water holding capacity (WHC) [Maryland (Maryland Department
of Environment ESD Manual, 2011); Washington, DC (District Department of Environment
SWM Guide, 2013); Auckland, New Zealand (Fassman-Beck and Simcock, 2013)]. Some
organic matter (specifically, humic and fulvic acids) can hold up to nine times its dry weight in
water (Hillel, 2004); increasing the volumetric proportions of organic matter in a green roof
substrate may therefore have a significant effect on storm water retention potential. Most
regulatory agencies base their substrate composition guidelines on the German Landscape
Society’s Manual for Green Roof Design, Installation, and Maintenance (FLL, 2008), which
suggests ≤6.5g/L organic matter for an extensive green roof substrate. Given the differences in
particle density between organic matter and the mineral component of a green roof substrate,

109
volumetric organic content could range from 10-40% (APPENDIX C) and still fall within those
guidelines. The study described herein served to answer the following research questions:
1. HO: Green roof substrate organic content will not affect Sedum kamptschaticum growth
and establishment in a platform-scale field study, as determined by canopy coverage, root
fresh and dry biomass, and shoot fresh and dry biomass.
HA: Green roof substrate organic content will affect Sedum kamptschaticum growth and
establishment in a platform-scale field study, as determined by canopy coverage, root
fresh and dry biomass, and shoot fresh and dry biomass, because organic matter provides
water holding capacity and cation exchange capacity and these will increase with
increasing volumetric proportions of substrate organic content.
2. HO: Green roof substrate organic content will not affect the substrate volumetric water
content and rate of dry down following rain events in a platform-scale field study.
HA: Green roof substrate organic content will affect the substrate volumetric water
content and rate of dry down following rain events in a platform-scale field study,
because a pot-scale growth chamber experiment indicates substrate VWC during dry
downs is the same for green roof substrates with 10%, 20%, and 40% organic matter.
3. HO: Increasing the volumetric proportion of green roof substrate organic matter does not
affect the percent volume of rainfall retained, when considering either total volume per
rain event or intensity (volume per time).
HA: Increasing the volumetric proportion of green roof substrate organic matter will
decrease the percent volume of rainfall retained, when considering either total volume per
rain event or intensity (volume per time), because it is expected that root density in 10%
organic matter substrates will be higher than 20% or 40% organic matter substrates
because the plant roots will be searching for water and plant roots are the means by which
plants uptake water and cycle it back into the atmosphere.
5.2 Materials and Methods
5.2.1 Platform Construction
Sixteen experimental green roof platforms [interior dimensions 113.5 cm X 113.5 cm]
were constructed in May and June 2012 at the Research Greenhouse Complex at the University
of Maryland in College Park, Maryland. The profile of each platform from bottom to top was as
follows: 12 mm plywood decking, EPDM waterproofing membrane, drainage layer, filter fabric,

110
experimental substrate blends, and plants (Fig. 5.1). The waterproofing membrane, plastic cup-
type drainage layer, and filter fabric were obtained from Conservation Technology (Baltimore,
MD). Platforms were constructed and maintained according to FLL standards (FLL, 2008).
Platforms were with a 2% north-facing slope.
Fig. 5.1. Photograph of construction of the experimental green roof platforms at the
Research Greenhouse Complex at the University of Maryland, College Park
in May 2012.
Three different substrates were blended for the platform study. The inorganic portion was
a 60:40 crushed recycled brick: scoria blend, which was blended with either 10%, 20%, or 40%
(m3/m3) mushroom compost (Frey Brothers, Lancaster, PA). Particle size distributions of the
mineral components and experimental blends are located in Appendix B, Table B.2. Four
replicate platforms were installed with a 10 cm depth of each substrate blend (n=4). An
additional four platforms were filled with 10 cm of the 10% organic matter blend and left

111
unplanted to serve as a control (n=4). The four treatments were arranged in a randomized
complete block design taking into account a potential climate gradient between the greenhouse
range (to the NE) and an adjacent asphalt parking lot (to the SW).
The planted treatments were each planted on 4 July 2012 with 25 Sedum kamptschaticum
plugs (Emory Knoll Farms, Street, MD) propagated in 72 plug trays. The roots of all plugs were
washed completely of all propagation media prior to planting to avoid introducing additional
non-plant organic matter into the substrate profile (Fig. 5.2).
Fig. 5.2. Photograph illustrating the removal of all propagation media from plug roots
prior to planting.
All sixteen platforms were hand-watered twice weekly to the point of drainage for two
weeks following installation, after which time the study was solely dependent upon precipitation.

112
Per German guidelines (FLL, 2008), 15-10-15 Osmocote ® control release fertilizer was applied
each spring at the recommended rate (5g N/m2).
5.2.2 Environmental, Volumetric Water Content, and Runoff Data
Each platform was instrumented with four Echo-5TM moisture/temperature
sensors (Decagon Devices, Inc. Pullman, WA) in October 2012 to measure substrate volumetric
water content (VWC) and temperature data (Fig.5.3). Sensors were oriented horizontally,
inserted into the substrate pointing towards the top of the slope to account for preferential water
movement down the platform. Sensors were connected to Decagon nR-5 radio dataloggers, and
set to average per-minute readings every five minutes.
Fig. 5.3. Diagram illustrating sensor placement for the sixteen experimental platforms.
Data were then transmitted to a base station and computer in the University of Maryland
Greenhouse Range, and downloaded into DataTrac software (Decagon Devices, Inc., Pullman,
WA). Sensors were calibrated to each of the three experimental blends for all VWC analyses.
Direction of drainage

113
In July 2013 each platform was instrumented with a double tipping bucket rain gauge
(TB-4, Hydrological Services, New South Wales, Australia) (Fig. 5.4) to quantify platform
runoff.
Fig. 5.4. Photograph illustrating a TB-4 rain gauge installed on one of the sixteen
experimental platforms.
Runoff data were collected to a 1-minute resolution using a Campbell CR10X data logger
(Campbell Scientific Inc. Logan, Utah) using a logger program that included a calibration to
account for water loss during high intensity runoff events (Starry, 2013).
A weather station was installed adjacent to the platform study (Fig. 5.5). Rainfall (ECRN-
100 tipping rain gauge), air temperature and humidity (ECT sensor), wind speed and direction
(Davis cup anemometer), solar radiation (PYR, total radiation pyranometer), photosynthetic flux
density (PPF, QSO-S PAR sensor), and leaf wetness (LWS-L) were all continuously collected
using Decagon Devices (Pullman, Washington) instruments (Fig. 5.6). Environmental data were

114
continuously collected using a Decagon Devices EM50R radio logger at 1-min resolution.
(Figure 5.6).
I chose to designate a period of six hours without precipitation a separate rain event
(Shamseldin, 2010; Voyde et al., 2010). Five rain events were selected from May 2013 and
October 2013 and substrate volumetric water content (VWC) was plotted for the subsequent dry-
down periods for each treatment (n=16).
Fig. 5.5. Photograph showing the orientation of the weather station in relation to the
experimental green roof platforms at the University of Maryland Research
Greenhouse Complex.

115
Fig. 5.6. Photograph of weather station detail.
5.2.3 Non-destructive Harvests
Platforms were sampled during October 2012, March 2013, July 2013, October 2013, and
March 2014 for leaf area (Li-3100 Leaf Area Meter, Lincoln, Nebraska), shoot fresh and dry
weight, root length, and root fresh and dry weight. Prior to sampling, photos were taken for
canopy coverage analysis. Images were taken approximately 1.5 m above each platform using a
Nikon D5100 and an iPad-based shutter control app (Figure 5.7). Root length was quantified by
hand-picking all visible roots out of each sample and measuring by hand (Figure 5.8). To
determine canopy coverage, the number of pixels of plant canopy were divided by the total

116
number of pixels of interior platform area using Adobe Photoshop CS6 (San Jose, California)
following the procedure outlined by Kim et al. (2012) (Fig. 5.9). At each sampling date, three
samples were randomly selected for each platform using a random number generator. Two
random numbers indicated the location of each sample in a grid-based sampling pattern (Fig.
5.10).
Fig. 5.7. Photograph illustrating overhead picture-taking for canopy coverage
analysis. October 2013.

117
Fig. 5.8. Photograph illustrating part of the method of measuring root length.

118
Fig. 5.9. An example of plant canopy coverage analysis using digital photography.
The number of green pixels on the right would be divided by the total pixels on
the left.

119
Fig. 5.10. Photograph of grid-based random sampling.
After a square was randomly selected, all plant biomass within the square and all of the substrate
down to the filter fabric was sampled and processed for leaf area, shoot fresh and dry weight,
root fresh and dry weight, root length, and substrate depth. After roots were hand-picked from
cores all substrate material was collected, oven-dried at 110 C and ashed at 530 C for four hours
using a muffle furnace to quantify the total mass of organic content (results in Appendix C).
5.2.4 Statistical Analyses
Harvest and storm water retention data were analyzed using repeated measures
analysis in the MIXED procedure (SAS 9.3 SAS Institute, Inc., Cary, NC) There was no
significant (α=0.05) effects by harvest date (repeated measure effect), so data were
120
independently analyzed for each harvest date. Multiple means comparisons were performed
using Scheffe’s test where significant treatment differences were identified.
5.3 Results and Discussion
5.3.1 Non-destructive Harvests
Aboveground biomass was quantified for three of the five harvest dates – October 2012,
July 2013, and October 2013, since Sedum kamptschaticum are deciduous and were dormant for
both March harvests. Aboveground fresh and dry weights are reported in Figs. 5.11 and 5.12.
The random nature of the sampling introduces a large amount of variability into the data, and
may actually cause misleading results. The fresh and dry weight results for the July 2013
harvests are as expected, with plants grown in 40% organic matter producing more aboveground
biomass than those grown in 10% or 20% organic matter, respectively. However, the October
2013 dry weights (Fig. 5.12) indicate greater biomass for plants grown in 10% organic matter.
Thus the random nature of the sampling may introduce a large amount of variability into these
data. Plant canopy coverage data using pixel analysis of digital photos offers a more accurate
description of aboveground plant growth (Fig. 5.13), with increasing percentages of canopy
cover as substrate organic content increases.

121
Fig. 5.11. Aboveground biomass fresh weight for Sedum
kamptschaticum grown in a platform-scale green roof field study.
Means (n = 4) are shown for each treatment, letters designate
significance at α = 0.05, no letters indicate p>0.05.
Fig. 5.12. Aboveground biomass dry weight for Sedum
kamptschaticum grown in a platform-scale green roof field study.
Means (n = 4) are shown for each treatment, letters designate
significance at α = 0.05.

122
Fig. 5.13. Platform canopy coverage for Sedum kamptschaticum
grown in a platform-scale green roof field study. Means (n = 4) are
shown for each treatment, letters designate significance at α = 0.05.
Fig. 5.14. Leaf area for Sedum kamptschaticum grown in a
platform-scale green roof field study. Means (n = 4) are
shown for each treatment.

123
Plant canopy coverage data provides an excellent representation of two-dimensional
shoot growth. Leaf area (Fig. 5.14) better describes three-dimensional shoot growth because all
aboveground biomass within the sample area was quantified, particularly as leaves were often
stacked vertically in the canopy. Thus total canopy leaf area was extrapolated by multiplying
platform canopy coverage and leaf area data, presented in Fig. 5.15. These extrapolated data
indicate a significant effect of substrate organic content on aboveground biomass.
Fig. 5.15. Total canopy leaf area of Sedum kamptschaticum grown in a platform-scale green roof
field study. Results were extrapolated from the product of platform canopy cover and sample leaf
area. Means (n = 4) are shown for each treatment.
Shoot succulence was determined by dividing aboveground fresh weight by above-
ground dry weight (Fig. 5.16). Interestingly, differences were only detected for the October 2013

124
harvest date, when plants grown in 20% and 40% organic matter had a higher degree of
succulence.
Fig. 5.16. Shoot succulence for Sedum kamptschaticum grown in a platform-scale green roof
field study. Results were extrapolated from by dividing aboveground biomass fresh weight by
aboveground biomass dry weight. Means (n = 4) are shown for each treatment, letters designate
significance at α = 0.05, no letters indicate p>0.05.
Belowground biomass data were gathered for all five harvest dates. Again, random
sampling may have introduced large amounts of variability into the data set; however, comparing
the July 2013 fresh weight (Fig. 5.17) to July 2013 dry weight (Fig.5.18) indicates a large
amount of water storage in the root system for all treatments. Root succulence was determined
by dividing belowground biomass fresh weight by belowground biomass dry weight, presented
in Figure 5.19.
Fig. 5.17. Belowground biomass fresh weight for Sedum kamptschaticum grown in a platform-

125
scale green roof field study. Means (n = 4) are shown for each treatment, letters designate
significance at α = 0.05, no letters indicate p>0.05.

126
Fig. 5.18. Belowground biomass fresh weight for Sedum kamptschaticum grown in a platform-
scale green roof field study. Means (n = 4) are shown for each treatment, letters designate
significance at α = 0.05, no letters indicate p>0.05.

127
Fig.5.19. Root succulence of Sedum kamptschaticum grown in a platform-scale green roof field
study. Means (n = 4) are shown for each treatment, letters designate significance at α = 0.05, no
letters indicate p>0.05.
Total root length per sample demonstrated increased root growth with increasing proportions of
substrate organic matter (Figure 5.20), but root density (fresh weight divided by sample volume)
indicated no difference between plants grown in 10% and 20% organic matter, except for July
2013 (Figure 5.21). Root density was also highest for July 2013, attributed to the increased fresh
weight.
Only the July 2013 harvest showed a significant effect of substrate organic content on
root succulence. Interestingly, root succulence – or the amount of water stored in the roots – was
far greater in July 2013 than for the other harvest dates. Even though 2013 was a fairly rainy year

128
– both in the total rainfall and number of events – it is not assumed that root succulence would be
affected by substrate VWC or precipitation. Additionally, substrate VWC reached its peak in Fall
2013 (Figure 5.22), indicating that Sedum kamptschaticum may store more water in the root
system during the summer months.
Fig. 5.20. Root length of Sedum kamptschaticum grown in a platform-scale green roof field
study. Means (n = 4) are shown for each treatment, letters designate significance at α = 0.05,
no letters indicate p>0.05.

129
Fig. 5.21. Root density of Sedum kamptschaticum grown in a platform-scale green roof field
study, determined by dividing belowground biomass fresh weight by total sample volume. Means
(n = 4) are shown for each treatment, letters designate significance at α = 0.05, no letters indicate
p>0.05.
5.3.2 Volumetric Water Content
The daily substrate VWC (n=16) was plotted for 2013 based on sensor readings at 5:00
AM as a means to normalize the data on a daily basis while avoiding potential climatic
variability. These data are presented with daily rainfall totals in Figs. 5.22 and 5.23. Substrate
volumetric water content for each treatment was plotted for five dry-down periods immediately
following rain events (Figs. 5.24, 5.25, 5.26, 5.27, and 5.28). The longest dry period of 2013 was
15 days, and many rain events were small (less than 0.5 mm), so in some cases multiple dry
periods were combined with intermittent rain for graphing purposes.
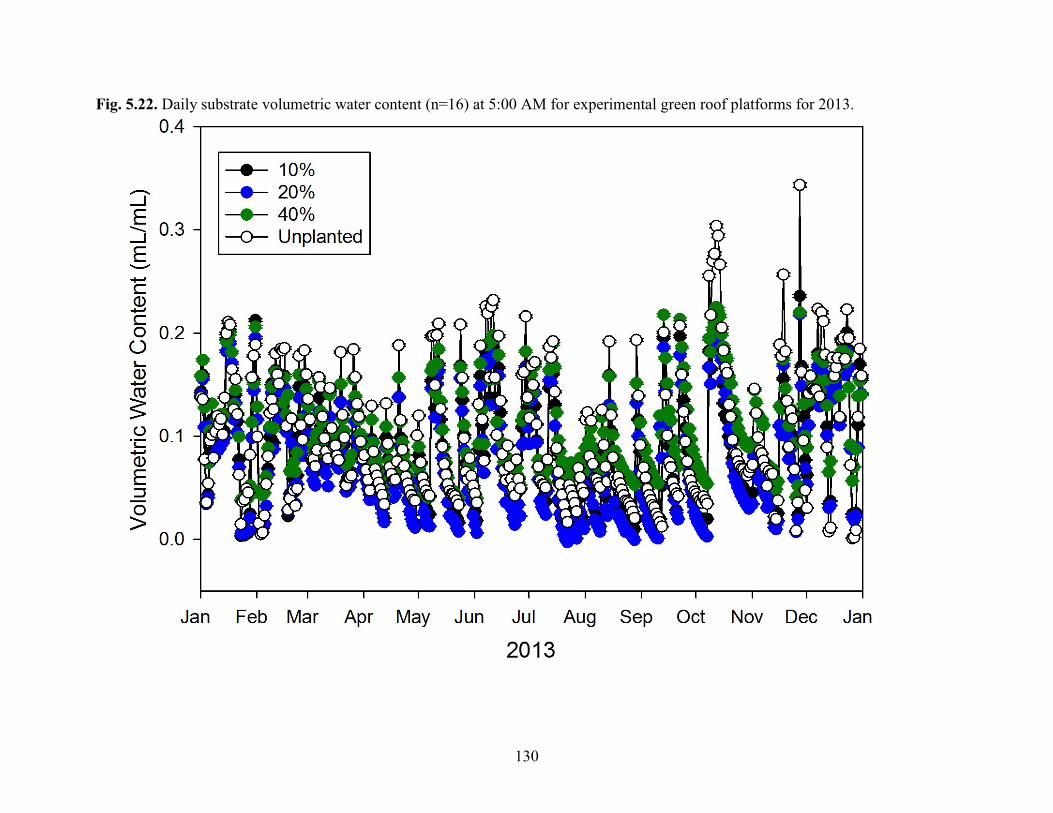
130
Fig. 5.22. Daily substrate volumetric water content (n=16) at 5:00 AM for experimental green roof platforms for 2013.

131
Fig. 5.23. Daily precipitation totals for 2013.

132
Fig. 5.24. Substrate volumetric water content of platform-scale experimental green roofs with
increasing proportions of organic content following a 10.8 mm rain event which occurred over
4.5 hours on May 11. Means (n = 16) are shown for each treatment.

133
Fig. 5.25. Substrate volumetric water content of platform-scale
experimental green roofs with increasing proportions of organic
content following an 11.2 mm rain event which occurred on
August 1 occurring over 9 hours, and a 3.6 mm rain event on
August 3 occurring for 1.5 hours. Means (n = 16) are shown for
each treatment.
Fig.5.26. Substrate volumetric water content of platform-scale
experimental green roofs with increasing proportions of organic
content following an 18.4 mm rain event which occurred on August
13 which occurred over 24 hours, and a 2.2 mm rain event on
August 16 which occurred over 7.25 hours. Means (n = 16) are
shown for each treatment.
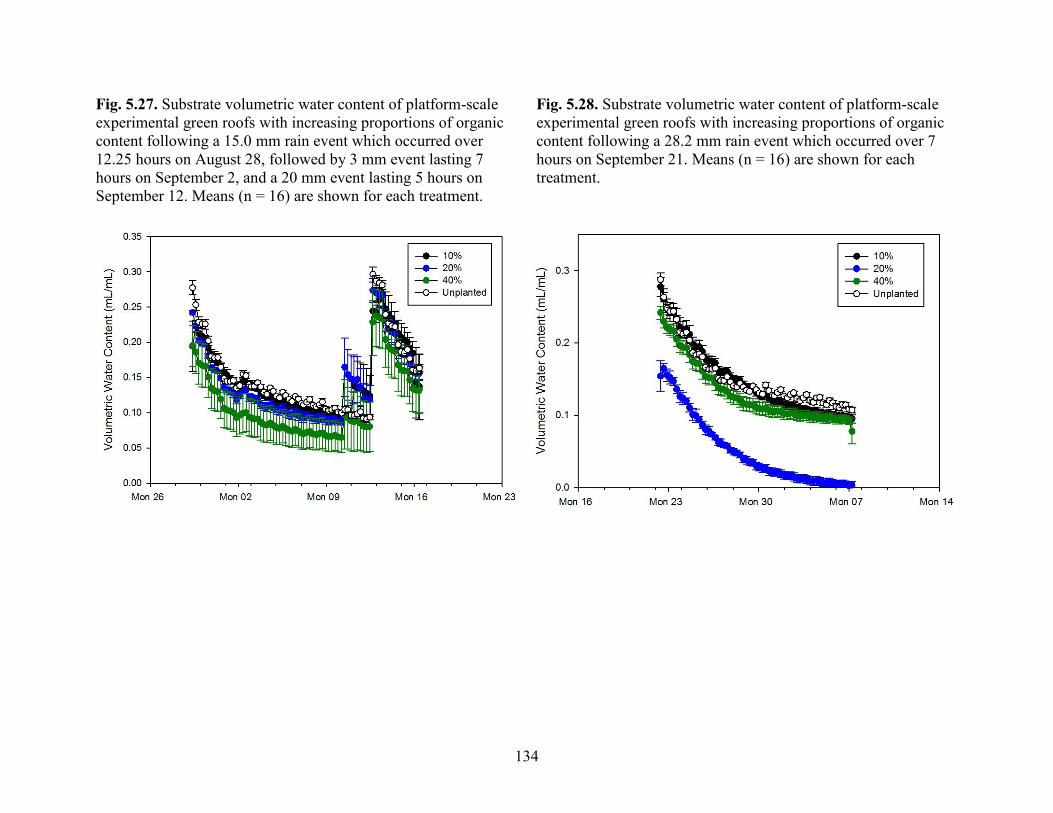
134
Fig. 5.27. Substrate volumetric water content of platform-scale
experimental green roofs with increasing proportions of organic
content following a 15.0 mm rain event which occurred over
12.25 hours on August 28, followed by 3 mm event lasting 7
hours on September 2, and a 20 mm event lasting 5 hours on
September 12. Means (n = 16) are shown for each treatment.
Fig. 5.28. Substrate volumetric water content of platform-scale
experimental green roofs with increasing proportions of organic
content following a 28.2 mm rain event which occurred over 7
hours on September 21. Means (n = 16) are shown for each
treatment.
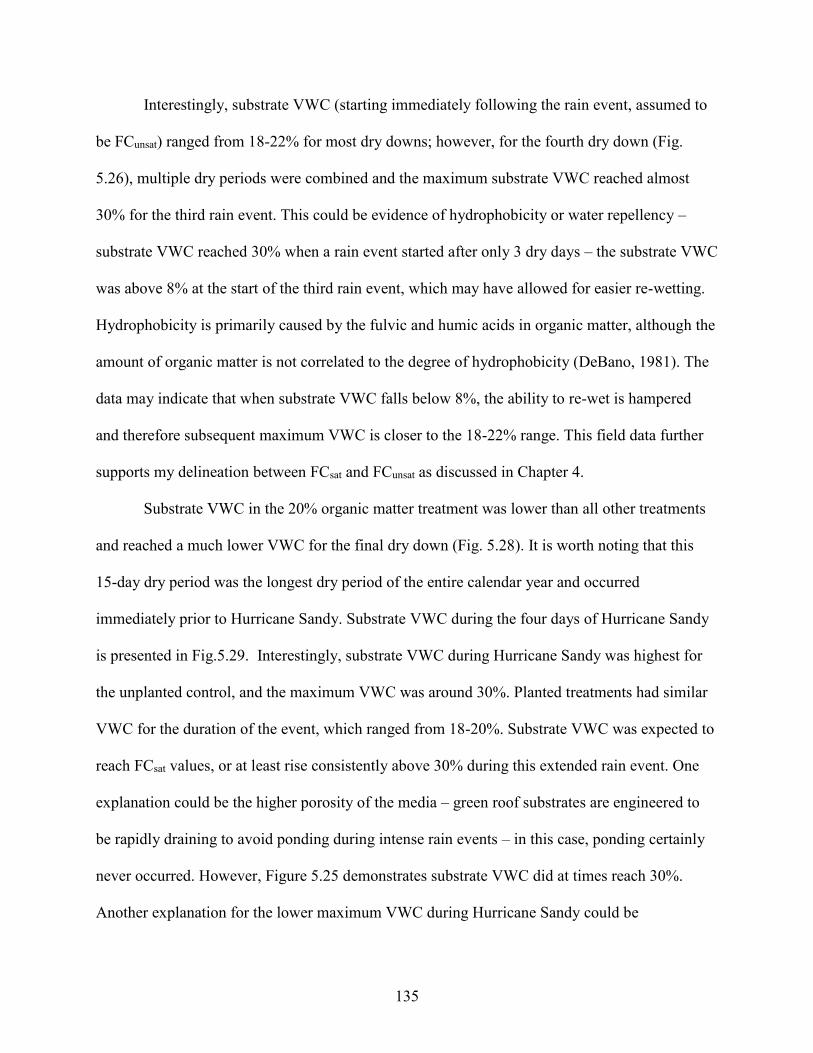
135
Interestingly, substrate VWC (starting immediately following the rain event, assumed to
be FCunsat) ranged from 18-22% for most dry downs; however, for the fourth dry down (Fig.
5.26), multiple dry periods were combined and the maximum substrate VWC reached almost
30% for the third rain event. This could be evidence of hydrophobicity or water repellency –
substrate VWC reached 30% when a rain event started after only 3 dry days – the substrate VWC
was above 8% at the start of the third rain event, which may have allowed for easier re-wetting.
Hydrophobicity is primarily caused by the fulvic and humic acids in organic matter, although the
amount of organic matter is not correlated to the degree of hydrophobicity (DeBano, 1981). The
data may indicate that when substrate VWC falls below 8%, the ability to re-wet is hampered
and therefore subsequent maximum VWC is closer to the 18-22% range. This field data further
supports my delineation between FCsat and FCunsat as discussed in Chapter 4.
Substrate VWC in the 20% organic matter treatment was lower than all other treatments
and reached a much lower VWC for the final dry down (Fig. 5.28). It is worth noting that this
15-day dry period was the longest dry period of the entire calendar year and occurred
immediately prior to Hurricane Sandy. Substrate VWC during the four days of Hurricane Sandy
is presented in Fig.5.29. Interestingly, substrate VWC during Hurricane Sandy was highest for
the unplanted control, and the maximum VWC was around 30%. Planted treatments had similar
VWC for the duration of the event, which ranged from 18-20%. Substrate VWC was expected to
reach FCsat values, or at least rise consistently above 30% during this extended rain event. One
explanation could be the higher porosity of the media – green roof substrates are engineered to
be rapidly draining to avoid ponding during intense rain events – in this case, ponding certainly
never occurred. However, Figure 5.25 demonstrates substrate VWC did at times reach 30%.
Another explanation for the lower maximum VWC during Hurricane Sandy could be

136
hydrophobicity due to the 15-day dry period immediately preceding the precipitation event.
Another interesting result is that planted treatments had consistently lower substrate VWC during
Hurricane Sandy than the non-planted control. While the relationship between root density and
substrate total VWC is not well understood, it is worth noting that VWC was more stable for
planted versus non-planted treatments.
Fig. 5.29. Substrate volumetric water content of platform-scale experimental green roofs with
increasing proportions of organic content during Hurricane Sandy, a 108.4 mm rain event which
occurred over 4 days from October 9 to October 13. Means (n = 16) are shown for each
treatment.
5.3.3 Stormwater Retention
Platform runoff was quantified for 21 rain events from July 2013 to November 2013, as
summarized in Table 5.1. There were many small (<12.5 mm) events, contributing to 100%
retention for many events. For several medium events (12.5-62.5 mm), the event duration was so
long that retention was near 100%.

137
Table 5.1. Table of rain events for which runoff from experimental green roof platforms planted with increasing proportions of organic matter
(10%, 20%, and 40%) was captured. Means (n=4) of retention percent are given. Rain events are delineated by size (small <12.5mm, medium
12.5-62.5mm, large >62.5mm).

138
Retention was plotted by storm size (depth) and intensity (depth per minute), and is
presented in Fig. 5.30 and Fig. 5.31. There was no significant relationship between organic
content storm water retention by storm size or intensity.
Fig. 5.30. Retention by storm size for experimental green roof platforms planted with substrates
with increasing volumetric (10%, 20%, and 40%) proportions of organic matter. Events ranged
from July 12 to October 9, 2013.
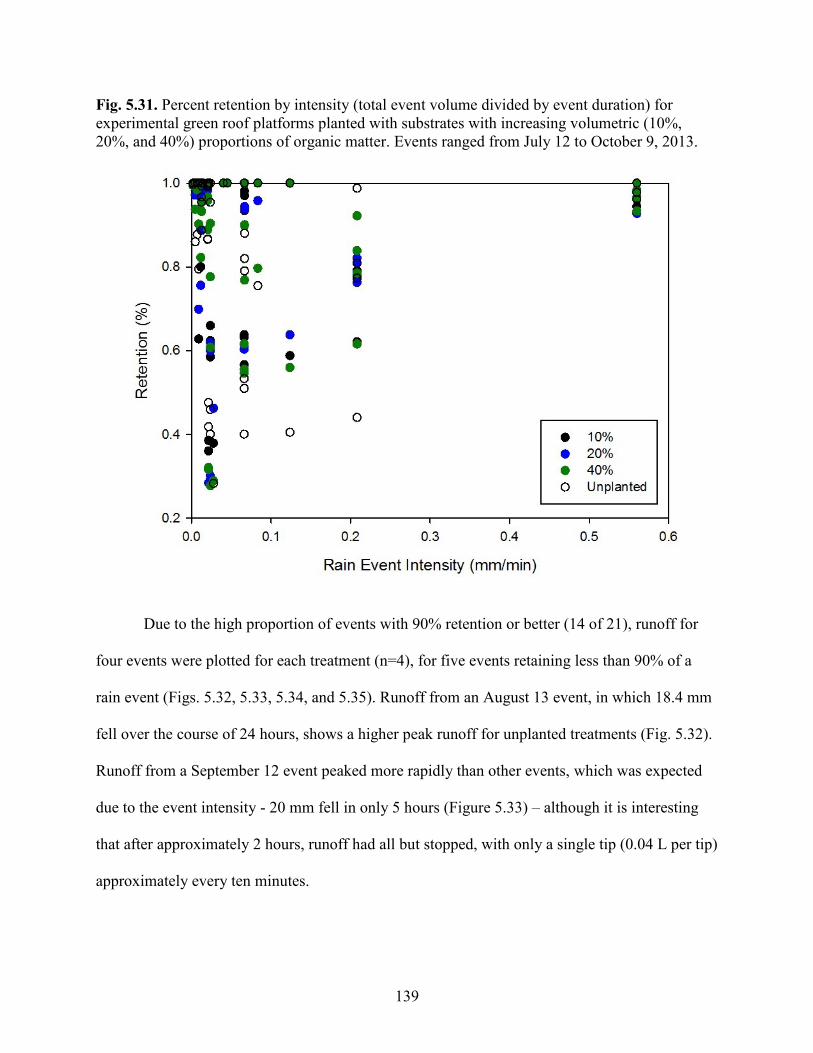
139
Fig. 5.31. Percent retention by intensity (total event volume divided by event duration) for
experimental green roof platforms planted with substrates with increasing volumetric (10%,
20%, and 40%) proportions of organic matter. Events ranged from July 12 to October 9, 2013.
Due to the high proportion of events with 90% retention or better (14 of 21), runoff for
four events were plotted for each treatment (n=4), for five events retaining less than 90% of a
rain event (Figs. 5.32, 5.33, 5.34, and 5.35). Runoff from an August 13 event, in which 18.4 mm
fell over the course of 24 hours, shows a higher peak runoff for unplanted treatments (Fig. 5.32).
Runoff from a September 12 event peaked more rapidly than other events, which was expected
due to the event intensity - 20 mm fell in only 5 hours (Figure 5.33) – although it is interesting
that after approximately 2 hours, runoff had all but stopped, with only a single tip (0.04 L per tip)
approximately every ten minutes.

140
Figure 5.32. Runoff from experimental green roof platforms planted with substrates with increasing volumetric (10%, 20%, and
40%) organic matter during a rain event occurring on August 13, 2013, in which 18.4 mm fell over 24 hours. Means (n = 4) are
shown for each treatment.

141
Figure 5.33. Runoff from experimental green roof platforms planted with substrates with increasing volumetric (10%, 20%, and
40%) organic matter during a rain event occurring on September 12, 2013, in which 20 mm fell over 5 hours. Means (n = 4) are
shown for each treatment.

142
A September 21 event – 28.2 mm in only 7 hours – shows runoff occurring more rapidly for
unplanted platforms, as well as a higher peak volume for unplanted platforms compared to
planted treatments, although no treatment differences for planted platforms was detected (Fig.
5.34). Runoff from this event was more characteristic to Starry’s (2013) results, which indicated
planted platforms retain more stormwater than unplanted platforms. Finally, runoff during
Hurricane Sandy, the largest event of 2013, is presented in Fig.5.35. Rain totals for the four day
event reached 108.4 mm. As expected, planted and unplanted platforms performed similarly, as
did all planted treatments. Again, these results confirm Starry’s conclusions that green roof
stormwater retention performance is largely dictated by storm characteristics – namely volume
and intensity. Hurricane Sandy was an outlier event in terms of total precipitation volume.
Nonetheless, the experimental green roof platforms did retain some storm water from the event –
performance ranged from 30-40% depending on treatment (Table 5.1), although no significant
differences for any treatment during any event were detected. With the exception of the
standard Rooflite™ media during the first dry down, evapotranspirational water loss from
planted treatments surpassed evaporative water loss from unplanted treatments within the first 48
hours of the dry down.

143
Figure 5.34. Runoff from experimental green roof platforms planted with substrates with increasing volumetric (10%, 20%, and
40%) organic matter during rain event occurring on September 21, 2013, in which 28.2 mm fell over 7 hours. Means (n = 4) are
shown for each treatment.

144
Figure 5.35. Runoff from experimental green roof platforms planted with substrates with increasing volumetric (10%, 20%, and
40%) organic matter during Hurricane Sandy, which lasted from October 9 to October 13, 2013, in which 108.4 mm fell. n = 4 for
each treatment.

145
One limitation of field work is smaller sample size (in this case, n=4), so while this may
have played a role, the results may also highlight an industry-wide issue: what defines a
“successful” green roof? For many, a successful green roof is one which has green vegetation
growing on it – the idea that “if it’s green, it’s good”. But platforms planted with 10% organic
matter performed equally as well as platforms planted with 40% organic matter, even with less
plant coverage, giving credence to the idea regional performance-based (i.e. retention, not visible
plant growth performance) metrics for green roofs should be developed. Please note that this is
not a recommendation for adding 10% organic matter for green roof substrates – the growth
chamber and destructive harvest data in Chapter 4 suggest more vigorous roots and shoots for
plants grown in 20% organic matter. But with no retention differences between 20% and 40%
despite differences in canopy cover, the motivation to choose 40% over 20% is at this point
largely client-focused – reaching 100% coverage in a shorter amount of time to fulfill the
expectation that “if it’s green, it’s good”, although performance may be the same.
5.4 Conclusions
Random non-destructive sampling introduced large amounts of variability into the data,
so it was difficult to draw informed inferences from the effects of substrate organic content on
plant growth from the fresh and dry weight of S. kamptschaticum. The platform canopy coverage
data, obtained through pixel analysis of digital photographs, was cleaner and allowed for
extrapolation of data which confirms the expected result – increased substrate organic content
leads to increased plant growth, which supports Chapter 4 destructive harvest findings. Dry mass
data from one harvest date indicated greater shoot dry biomass for 10% organic matter, although
pixel analysis showed otherwise. This is a direct result of the randomized sampling, because in
no case was shoot biomass for 10% organic matter greater than that of plants grown in 20% or

146
40% organic matter. Random sampling will likely be a more effective methodology once all
replicates reach at least 80% coverage, at which time differences in plant biomass will likely be
identified through harvests as well as pixel analysis.
The effects of organic content on substrate VWC is still somewhat unclear. Because
substrate VWC is largely affected by storm characteristics and antecedent moisture conditions,
there is no clear conclusion; however, I assert that when substrate VWC falls below 8%,
substrates will not hold as much water in subsequent rain events – the field capacity will be that
of FCunsat compared to lab-estimated FCsat values, as discussed in Chapter 4.
Furthermore, the effects of organic content on storm water retention are difficult to
discern due to the numerous rain events in 2013. Runoff data indicates platform discharge
occurred more quickly for unplanted platforms compared to planted platforms for at least two
events (Figs. 5.32 and 5.34), but there were no statistically significant differences in retention
values for any treatment. Retention was above 90% for all but 5 of 21 measured storms,
attributed to storm characteristics – most measured events were either small in volume, long in
duration, or a combination of both. Also of importance is that runoff was not measured until one
year post-installation – perhaps differences in retention would have been present during the first
season’s growth. Conversely, differences in retention performance due to substrate organic
content may not be detectable until after several seasons. It is likely that data 3-5 years post-
installation would provide a clearer picture of the effects of substrate organic content on
stormwater retention.
In conclusion, the effects of organic content on storm water retention is a complex issue
that should continue to be studied, and likely will not be understood without multiple seasons of
data in order to account for climatic variability from year to year.

147
Chapter 6: Conclusions
As green roofs gain popularity as stormwater management tools, regulatory agencies are
defining metrics and setting parameters for green roof performance around the world. Since
these systems are dynamic, it is integral to better define the effects of components, specifically
substrate, on plant growth, hydraulic properties, and stormwater retention.
The freeze-thaw analysis in Chapter 2 demonstrated firstly a need for greater
accountability within the green roof industry, because none of the three commercial extensive
green roof substrates met FLL particle size distribution guidelines as received direct from the
manufacturer. Furthermore, all three blends showed significant (p<0.05) particle degradation
when subjected to 30 freeze-thaw cycles, which speaks to the need for performance-based
metrics. The freeze-thaw analysis also demonstrates that green roof system design, regulations,
and performance metrics are likely to be most effective when developed on a regional basis. Not
all regions experience the extreme temperature fluctuations and freeze-thaw cycles of the Mid-
Atlantic; however, substrate analysis of established (3-7 years post-installation) green roofs in
the region indicate that green roof substrates are not maintaining their physical properties, which
may partially explain the number of green roof failures in the region.
Lab analysis of the matric potential and hydraulic conductivity of extensive green roof
substrates in Chapter 3 failed to detect in significant differences based on substrate organic
content, although the precision of the technique was excellent; however, the HYPROP© method
may not be appropriate for extensive green roof substrates or other highly porous media. The
system was developed for use with soils; the high porosity of the extensive green roof substrates
led to tensiometer water column caviation at around -30 kPa. Similar values may have been
attained using the tension table method; nonetheless, cavitation occurred outside of the range of

148
plant unavailable water (-50 to beyond -500 kPa), which are the tensions at which organic matter
is most likely to affect matric potential and hydraulic conductivity.
The results from Chapter 2 and Chapter 3 call into question the relevancy of component-
based guidelines, such as those from the FLL and even ASTM. If stormwater retention is the
driving force behind green roof design and installation, do particle size distribution and matric
potential matter? These parameters may affect and likely do affect stormwater retention;
however, current guidelines are based on lab analyses of components, a disjointed approach that
apparently does not account for actual performance from the empirical data shown in Chapters 4
and 5, with regards to plant water extraction and the effects of rainfall intensity on efficiency.
We need to delve beyond the basic assumptions that maximum water holding capacity will be
achieved during each rain event. I assert that a more appropriate and accurate way of
standardizing green roof design and estimating green roof performance is to shift the focus from
lab-based component analysis to system-based stormwater performance analysis. Without actual
performance data we cannot know how much stormwater a system will actually retain, and since
current technologies allow for data collection there is no excuse not to expand the body of actual
roof performance-based literature.
Growth chamber (Chapter 4) and platform-scale (Chapter 5) plant growth analyses using
substrate moisture sensors may offer better predictions of plant water use in extensive green roof
substrates with increasing (10%, 20%, and 40%) volumetric proportions of organic matter.
Sedum kamptschatcicum grown in 40% organic matter were larger in both studies. The increased
biomass with increasing volumetric proportions of organic matter for the platform-scale study in
Chapter 5 may be due to increased nutrient content – as apparent in Appendix E, which indicates
that, depending on treatment, these experimental platforms contained a range of 55-222 g N per

149
platform. While every platform was fertilized each spring according to FLL guidelines, increased
plant coverage in 40% organic matter may be attributed to nutrient availability, which is different
from the pot-scale study in Chapter 4, when differences were more likely due to differences in
water availability because od the limited rooting volume. For the pot-scale study, nutrient
availability ranged from 0.19 to 0.76 g N per pot. These results demonstrate that water may be
the more important resource during establishment (i.e. the first six months), but longer-term plant
growth is more perhaps equally sensitive to nutrient availability.
Interestingly, substrate VWC reached below 5% during three consecutive dry down
periods in the growth chamber study. Similar VWC was reported during post-rain event dry
down periods for the platform analyses in Chapter 5. These data indicate plant roots are
accessing substrate water previously assumed to be unavailable – Chapter 3 results demonstrate
that defining plant unavailable water for green roof substrates is challenging due to limitations of
current analytical laboratory tehcniques. Regardless of these issues, Chapters 4 and 5 illustrate
clearly that plant roots are extracting water from substrates beyond substrate moisture contents
that have been previously demonstrated.
While plant roots did evapotranspire a large proportion of the water held by the substrate,
there were no treatment differences in stormwater retention. This could be an artifact of storm
characteristics – most of the measured events were either small in size, short in duration, or a
combination thereof. Another likely explanation is that the effects of substrate organic content on
stormwater retention may not detectable until the systems are more mature – i.e., beyond three
years post-installation. Retention data was based on the second growing season for the
experimental platforms, so while plant growth differences were identifiable, these may not yet
have a measurable impact on retention. The growth differences between treatments will only be
150
compounded with each growing season – larger plants in 40% organic matter will build a thicker
thatch layer, which will add even more organic matter back into the system through microbial
degradation – I expect analysis of year 5 data will better elucidate the effects of substrate organic
content on stormwater retention.
In addition to identifying the need for more rigorous performance-based guidelines and
regulations regarding stormwater retention green roofs, my work demonstrates the ability of
Sedum kamptschaticum to access substrate water previously assumed to be unavailable. While
the volume of plant available water was not defined, these findings helps move forward the
literature and should help inform policies with regards to green roof stormwater retention
estimates. This work also clearly defines the need for delineation between lab-based maximum
water holding capacity (i.e., FCsat) and the more realistic field-based maximum water holding
capacity (i.e., FCunsat). Together these results offer more understanding to expected green roof
retention and lay the foundation for more actual roof performance monitoring.

151
Appendix A.
A carbon cost analysis of local (Frederick, Maryland) crushed brick was completed to
provide a basis of comparison for expanded mineral substrates. The brick are obtained direct
from a brick manufacturer in Frederick, Maryland and are considered “seconds” – either due to
imperfections in color or integrity of the structure (cracks, chips, etc.). These seconds are culled
from the production line prior to shipment and historically are stored in bulk by the manufacturer
indefinitely (Michael Furbish, Furbish, pers. comm.). The carbon cost analysis for crushed brick
as a green roof substrate starts at the point the brick is obtained as seconds from the manufacturer
for the purpose of crushing and blending into media. A portable crusher is used on-site at the
brick factory, and the crushed material is then transported to the blending facility.
For the sake of simplicity, the carbon comparison does not account for transportation
costs because expanded minerals also must be transported from the manufacturer to the blending
facility. Therefore, the only carbon cost associated with the crushed brick is the actual crushing.
The crusher used was a diesel-powered Eagle 1200 CC crusher, and yields about 225 tons/hour
for particle sizes less than 1” (2.25 cm). For these particle sizes, one ton is roughly one cubic
yard (based on bulk density of 1177 g/L). The crusher consumed 9.7 gal diesel fuel per hour.
Burning one gallon of diesel fuel yields 22.38 lbs CO2, coming to 201.42 lbs CO2 per hour from
the consumption of diesel fuel. Assuming a continuous 225 tons produced per hour, the total
carbon cost comes to 1.12 lbs CO2 per ton, equal to 0.5 kg CO2 per ton (cubic yard). This is far
below Elliot’s (2007) and the Expanded Shale, Slate, and Clay Institute’s (2011) reported 110 kg
CO2 per cubic yard expanded mineral.
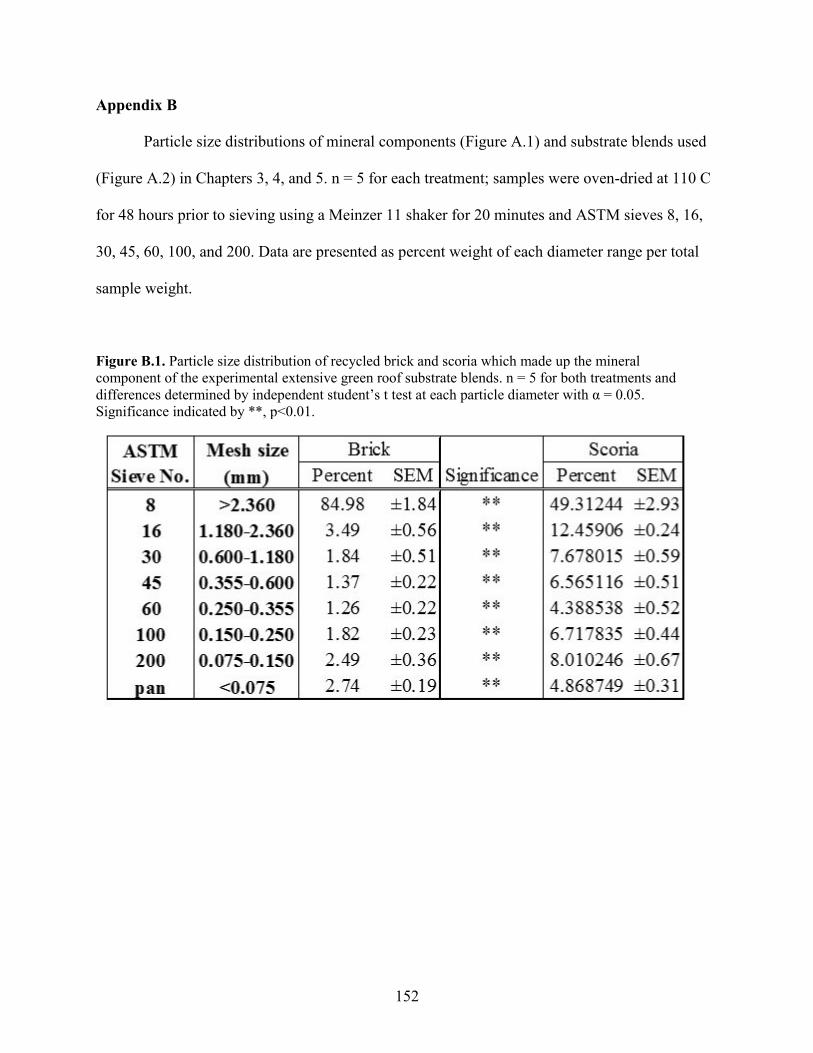
152
Appendix B
Particle size distributions of mineral components (Figure A.1) and substrate blends used
(Figure A.2) in Chapters 3, 4, and 5. n = 5 for each treatment; samples were oven-dried at 110 C
for 48 hours prior to sieving using a Meinzer 11 shaker for 20 minutes and ASTM sieves 8, 16,
30, 45, 60, 100, and 200. Data are presented as percent weight of each diameter range per total
sample weight.
Figure B.1. Particle size distribution of recycled brick and scoria which made up the mineral
component of the experimental extensive green roof substrate blends. n = 5 for both treatments and
differences determined by independent student’s t test at each particle diameter with α = 0.05.
Significance indicated by **, p<0.01.

153
Figure B.2. Particle size distribution of three experimental extensive green roof blends composed of 60:40 recycled brick:scoria and increasing
volumetric proportions of organic matter plus Rooflite ™, an industry standard ready-to-plant blend. n = 5 for all treatments and differences were
determined using Scheffe’s adjustment for multiple means comparisons at α = 0.05.

154
Appendix C.
Fig. C.1 Substrate organic content based on loss on ignition analysis. All roots were removed by
hand from samples of planted treatments. The unplanted treatment was mixed with 10% organic
matter initially. Loss on ignition was achieved by burning samples in a muffle furnace at 530 C
for four hours, following the methodology outlined by Heiri et al. (2001).

155
Appendix D
Volumetric water content (mL3/mL3) of three experimental green roof substrates with
increasing (10%, 20%, and 40%) volumetric proportions of organic matter was measured
continuously by the HYPROP© method (Schindler et al., 2010) with Decagon Devices ECHO-
5TM moisture sensors inserted into the cores (Fig. C.1). Substrate VWC values are actual
weight-based values measured by loss of weight during evaporation. Substrate matric potential
(VWC plotted against pF) is presented in subset A while substrate VWC is plotted against
millivolts (moisture sensor output) in subset B. Maximum VWX captured by the sensors is a
little less than the maximum HYPROP© VWC because the HYPROP© begins taking
measurements immediately after the instrument is assembled; evaporative water loss had begun
before and during sensor insertion. Core depth and sensor length are both 5 cm, so great care was
taken not to disturb or damage the tensiometers or pressure transducers (Fig. C.2), so there was a
time delay between the start of HYPROP© measurements and the start of sensor measurements.
Moisture sensors captured substrate VWC beyond the measurement range for the HYPROP©,
which stops at the point of tensiometer water column cavitation.

156
Fig. D.1. Particle size distribution of recycled brick and scoria which made up the mineral component of the experimental extensive green roof
substrate blends. n = 5 for both treatments and differences determined by independent student’s t test at each particle diameter with α = 0.05.
Significance indicated by **, p<0.01.
A B
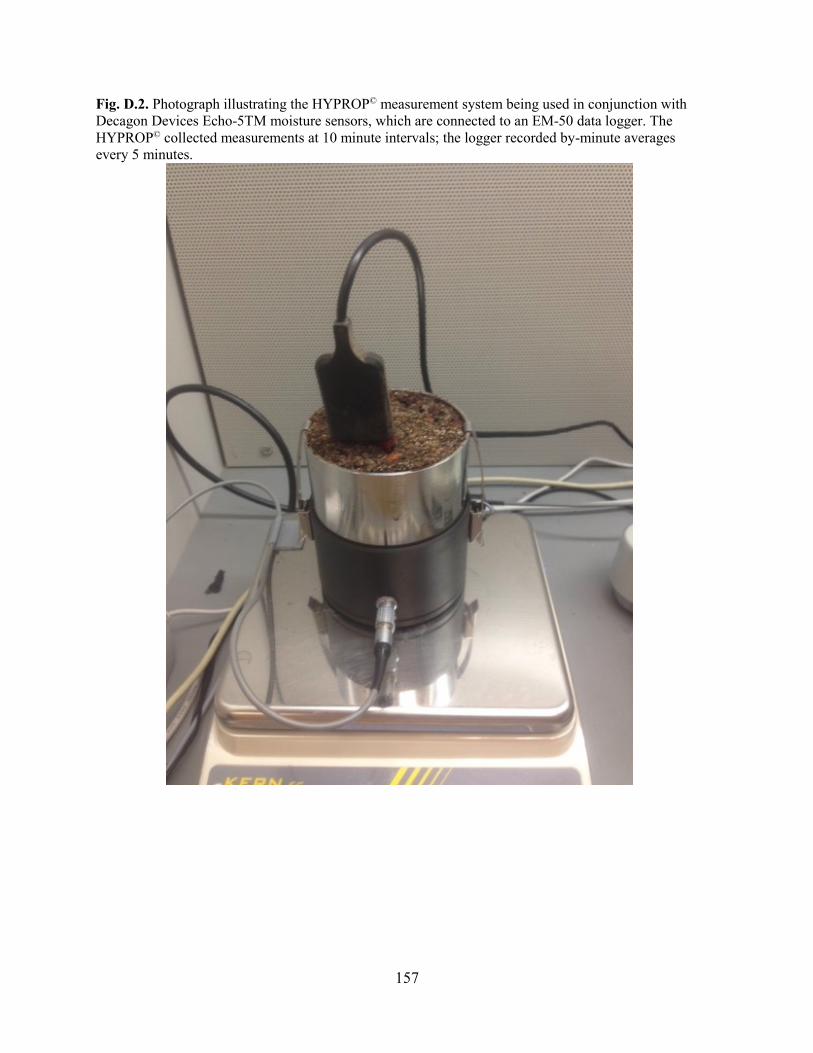
157
Fig. D.2. Photograph illustrating the HYPROP© measurement system being used in conjunction with
Decagon Devices Echo-5TM moisture sensors, which are connected to an EM-50 data logger. The
HYPROP© collected measurements at 10 minute intervals; the logger recorded by-minute averages
every 5 minutes.

158
Appendix E.
Mushroom compost is a common horticultural substrate amendment and its nutritional
content has been widely reported. Fidanza et al. (2010) reported the N-P-K values of mushroom
compost from 30 mushroom compost facilities across Southern Pennsylvania. The authors
reported total N to be 6.4 lbs/yd3, total phosphorus (as P2O5) as 1.67 lbs/yd3, and total potassium
(as K2O) to be 5.89 lbs/yd3. Table X.1 presents extrapolated values for the growth chamber study
in Chapter 4 (g per pot per treatment) and for the platform-scale field study in Chapter 5 (g per
platform per treatment).
Fig E.1. Extrapolated nutrient availability (N,P,K) per gram for the pot-scale growth chamber
study presented in Chapter 4 and the platform-scale field study presented in Chapter 5.

159
Glossary
FCsat: Field capacity as determined after saturating samples for a minimum of 24 hours and after
gravitational drainage.
FCunsat: Field capacity as determined without any extended saturation, after gravitational
drainage.
pF: The base 10 logarithm of soil or substrate water potential in cm.

160
Bibliography
Anderson, D.C. 1970. Effects of Urban Development on Floods in Northern VA. U.S.G.S. Water
Supply Paper 2001-C.
Arguedas-Rodriguez, F.R.A. 2009. Calibrating capacitance sensors to estimate water content,
matric potential, and electrical conductivity in soilless substrates. Thesis, University of
Maryland, College Park, Maryland. 137 pp.
Arnold, C.L. and C.J. Gibbons. 1996. Impervious Surface Coverage, the Emergence of a Key
Environmental Indicator. J. Am. Planning Assn. 62: 247-258.
Beattie, D.J. and R. Berghage. 2004. Green roof media characteristics: the basics. Proc. 2nd
North Amer. Green Roof Conf.: Greening Rooftops for Sustainable Communities, Portland, OR.
2-4 June 2004. Cardinal Group, Toronto.
Berndtsson, J.C. 2010. Green roof performance towards management of runoff water quantity
and quality: a review. Eco.Eng.36:351-361.
Berndtsson, J.C., L. Bengtsson, K. Jinno. 2009. Runoff water quality from intensive and
extensive vegetated roofs. Eco. Eng. 35:369-380.
Berndtsson, J.C., T. Emilsson, and L. Bengtsson. 2006. The influence of extensive vegetated
roofs on runoff water quality. Sci. of the Tot. Env. 355:48-63.
Bengtsson, L., L.Grahn, J.Olsson. 2005. Hydrological function of a thin extensive green roof in
southern Sweden. Nordic Hydrol. 36(3):259-268.
Bliss, D.J., R.D. Neufield, and R.J. Ries. 2009. Stormwater runoff mitigation using a green roof.
Env. Eng. Sci. 26(2): 407-418.
Bibbiani, Carlo, Assistant Professor-Researcher, University of Pisa, Italy.

161
Borland, A.M., V.A.B. Zambrano, J. Ceusters, and K. Shorrock. 2011. The photosynthetic
plasticity of crassulacean acid metabolism: an evolutionary innovation for sustainable
productivity in a changing world. New Phytologist 191:619-633.
Canada Climate Data. 2013. Canadian climate normal 1971-2000.
www.climate.weather.gc.ca/climate_normals/results_e.html?stnID=5097&autofwd=1 Last
accessed 17 September 2013.
Canada Public Works Department. 2002. Introductory Manual for Greening Roofs for Public
Works and Government Services. Version 1.1.
Carpenter, D. D. and P. Kaluvakolanu. 2011. Effect of roof surface type on storm-water runoff
from full-scale roofs in a temperate climate. J. Irrig. Drain. Eng. 137:161-169.
Carter, T. and A. Keeler. 2008. Life cycle cost-benefit analysis of extensive vegetated roof
systems. Journal of Environmental Management 87:350-363.
Casey Trees and LimnoTech. 2007. The Green Build-out Model: Quantifying the Stormwater
Management Benefits of Trees and Green Roofs in Washington, DC.
Chesapeake Bay Foundation. www.cfb.org. 9 February 2011.
City of Los Angeles Environmental Affairs Department. 2006. Report: Green roofs – cooling
Los Angeles.
Coffman, R.R. 2007. Vegetated roof systems: design, productivity, habitat, and sustainability in
green roof and ecoroof technology. Dissertation, The Ohio State University, Columbus, Ohio.
227 pages.

162
Costanza, R. and H. E. Daly. 1987. Toward and Ecological Economics. Baton Rouge: Coastal
Ecology Institute, Center for Wetland Resources, and the Department of Economics, Louisiana
State University.
Currie, B.A., and B. Bass. 2005. Estimate of air pollution mitigation with green plants and green
roofs using the UFORE model. In: Proceedings of Third Annual Greening Rooftops for
Sustainable Communities conference. Washington, D.C. May 4-6 2005.
Davis, A.P. and R.H. McCuen. 2005. Stormwater Management for Smart Growth. Springer
Publishing, New York. 367 pp.
DC Water and Sewer Authority. http://www.dcwasa.com/customercare/iab.cfm. 9 February
2011.
De Bano, L.F., S.M. Savage, and D.A. Hamilton. 1976. The Transfer of Heat and Hydrophobic
Substances During Burning. Soil Sci. Am. J. 40:779-782.
De Bano, L.F. 1981. Water Repellent Soils: A State of the Art. Pacific Southwest Forest and
Range Experiment Station, California.
De Boodt, M. and O. Verdonck. 1972. The physical properties of the substrates in horticulture.
Acta Hort. 26:37-44.
Delong, C. P. 2014. Evaluation of plant species for survival, growth, and contribution to green
roof function. Thesis. University of Maryland, College Park. 85 pages.
Deutsch, B., H. Whitlow, M.Sullivan, Savineau. 2005. Re-greening Washington, DC: A green
roof vision based on quantifying stormwater and air quality benefits.
http://www.greenroofs.org/resources/greenroofvisionfordc.pdf.

163
District Department of the Environment, Watershed Protection Division, District of Columbia.
June 2013. Stormwater Management Guidebook.
Drzal, M.S., W.C. Fonteno, and D.K. Cassel. 1999. Pore fraction analysis: a new tool in substrate
analysis. Acta Hort. 481:43-54.
Durhman, A.K. and D.B. Rowe. 2007. Effect of substrate depth on initial growth, coverage, and
survival of 25 succulent green roof taxa. HortScience 42(3)588-595.
Durner, W. 1994. Hydraulic conductivity estimation for soils with heterogeneous pore structure.
Water Resources Res. 30(2):211-223.
Elliott, Stephen. 2007. Embodied energy comparisons – light weight aggregates and pumice.
http://www.greenroofs.com/pdfs/skytrenches=1107_stephanelliott.pdf.
Emilsson, T. 2008. Vegetation development on extensive vegetated green roofs: influence of
substrate composition, establishment method, and species mix. Ecological Engineering
33(2008):265-277.
Erlichman, P. and S. Peck. 2013. Annual green roof industry survey for 2012. Available online at
http://greenroofs.org/index.php/resources/2012-green-roof-industry-survey . Accessed 12 August
2013.
Expanded Shale, Clay, and Slate Institute. 2012. Embodied energy to manufacture expanded
shale, clay, and slate (ESCSI) lightweight aggregate. Information sheet 9153.
Fassman, E.A. and R. Simcock. 2008. Development and implementation of locally-sourced
extensive green roof substrate in New Zealand. World Green Roof Congress, London.

164
Fassman-Beck, E.A. and Simcock, R. (2013). Extensive Living Roofs: Review and Design
Recommendations. Auckland UniServices Technical Report to Auckland Council. Auckland
Council TR2012/010. Available at
http://www.aucklandcouncil.govt.nz/en/planspoliciesprojects/reports/technicalpublications/Pages
/home.aspx.
Fassman-Beck, E., E. Voyde, R. Simcock, and Y.S. Hong. 2013. 4 Living roofs in 3 locations:
does configuration affect runoff mitigation? Journal of Hydrology 490:11-20.
Ferguson, B.K. 1994. Stormwater Infiltration. Boca Raton, FL. CRC Press. 288 pp.
Ferguson, B.K. 1996. Preventing the Problems of Urban Runoff. Renewable Resources Journal
13(4):14-18
Ferguson, B. Introduction to Stormwater: Concept, Purpose, Design. 1998. Wiley and Sons, Inc.,
New York. 255 pp.
Fidanza, M.A., D.L. Sanford, D.M. Beyer, and D.J. Aurentz. 2010. Analysis of fresh mushroom
compost. HortSci. 20(2): 449-453.
Fonteno, W.C. and C.T. Harden. 2003. Procedures for determining the physical properties of
horticultural substrates using the NCSU porometer. Available online at
http://www.ncsu.edu/project/hortsublab/pdf/porometer_manual.pdf
Forschungsgesellschaft Landschaftsentwicklung Landschaftsbau [FLL] Guideline for the
Planning, Execution, and Upkeep of Green-Roof Sites. 2008.
Forschungsgesellschaft Landschaftsentwicklung Landschaftsbau [FLL] Guideline for the
Planning, Execution, and Upkeep of Green-Roof Sites. 2002.
165
Getter, K., D.B. Rowe, and J.A. Andresen. 2007. Quantifying the effect of slope on extensive
green roof stormwater retention. Eco. Eng. 31:225-231.
Getter K.L., D.B. Rowe, G. P. Robertson, B.M. Cregg, and J. A. Andresen. 2009. Carbon
sequestration potential of green roofs. Enviro. Sci. Technol. 43:7564-7570.
Gliessman, S.R. 1998. Agroecology: ecological processes in sustainable agriculture. Ann Arbor
Press, Chelsea, Michigan. 357 pp.
Graham, P., M.Kim. 2005. Evaluating the stormwater management benefits of green roofs
through water balance modeling. Green Roofs for Healthy Cities Conference Proceedings. May
2005. Washington, DC.
Gregoire, B. and J. Clausen. 2011. Effect of a modular extensive green roof on stormwater runoff
and water quality. Eco. Eng. 37:963-969.
Groenevelt, P.H. and P.E. Gruntha. 1998. Utilization of crumb rubber as a soil amendment for
sports turf. Soil & Tillage Research 47 (1998) 169-172.
Handreck, K. and N. Black. 2002. Growing media for ornamental plants and turf. Second
Edition. University of New South Wales Press, Sydney, Australia. 483 pp.
Handreck, K. and N. Black. 2007. Growing media for ornamental plants and turf. Third Edition.
University of New South Wales Press, Sydney, Australia. 542 pp.
Harmon, K.S. 2000. Characteristics of rotary kiln expanded slate lightweight aggregate, Proc.
2nd International symposium on structural lightweight aggregate concrete, Kristiansand,
Norway. 18-22 June. Pp. 574-583.
Hathaway, A.M., W.F. Hunt, and G.D. Dennings. 2008. A field study of green roof hydrologic
and water quality performance. ASABE 51(1): 37-44.

166
Hill, M.S. 1997. Understanding Environmental Pollution. Cambridge, UK. Cambridge
University Press. 316 pp.
Hillel, D. 2004. Introduction to Environmental Soil Physics. San Diego, CA. Elsevier Academic
Press. 494 pages.
Horton, T. 2003. Turning the Tide: Saving the Chesapeake Bay. The Chesapeake Bay
Foundation. Island Press, Washington, DC. 387 pp.
Johnson, J. and J. Newton. 1996. Building Green, a Guide for using Plants on Roofs and
Pavement. The London Ecology Unit, London.
Kiehl, P.A., J.H. Liehl, D.W. Buerger. 1992. Growth response of Chrysanthemum to various
container medium moisture tension levels. J. Amer. Soc. Hort. Sci. 117(2): 224-229.
Kim, K., S.W. Kang, C.H. Pak, and M. Kim. 2012. Changes in leaf variegation and coloration of
English Ivy and Polka Dot Plant under various indoor light intensities. HortTech. 22:49-55.
Kohler, M. and P. Poll. 2010. Long-term performance of selected old Berlin greenroofs in
comparison to younger extensive greenroofs in Berlin. Ecol. Eng. 36:722-729.
Kohler, M., M.Schmidt, F.W. Grimme, M. Larr, V.L. de Assuncao Paiva, S. Tavares. 2002.
Green roofs in temperate climates and in the hot-humid tropics – far beyond the aesthetics.
Environ.Manage.Health 13(4)382-391.
Kolb, W.. 2004. Good reasons for roof planting – green roofs and rainwater. Proc. IC on Urban
Horticulture. Acta Hort 543:295-300
Kosareo, L. and R. Ries. 2007. Comparative environmental life cycle assessment of green roofs.
Build. Environ. 42:2606-2613.
167
Leopold, L.B. 1968. Hydrology for Urban Planning – a Guidebook on the Hydrologic Effects of
Urban Land Use. USGS Circular 554. Washington, DC. U.S. Geological Survey.
Lubowski, R.N., M. Vesterby, S. Bucholtz, A. Baez, and M.J. Roberts. 2006. Major Uses of
Land in the United States, 2002. United States Department of Agriculture Economic Research
Service Summary Report. May 2006. www.usda.gov/publications/eib14.
Lundholm, J.T., J.S. MacIvor, M.A. Ranalli. 2009. Benefits of green roofs on Canada’s east cost.
In: Proc. 7th North American Green roof Conference: Greening Rooftops for Sustainable
Communities. Atlanta, GA. The Cardinal Group, Toronto.
MacIvor, J.S., and J. Lundholm. 2011. Performance evaluation of native plants suited to
extensive green roof conditions in a maritime climate. Ecological Engineering 37(2011):407-
417.
Maryland Department of the Environment Environmental Site Design (ESD) Process and
Computations. 2010. Prepared by MDE. Available online at
http://www.mde.state.md.us/programs/Water/StormwaterManagementProgram/MarylandStormw
aterDesignManual/Pages/programs/waterprograms/sedimentandstormwater/stormwater_design/i
ndex.aspx
Mentens, J., D. Raes, M. Hermy. 2006. Green roofs as a tool for solving the rainwater runoff
problem in the urbanized 21st century. Landscape Urban Plan. 77:217-226.
Miller, Charlie, P.E. Owner, Roofmeadow, Philadelphia, PA.
Molineux, C.J., C.H. Fentiman, A.C. Gange. 2009. Characterising alternative recycled waste
materials for use as green roof growing media in the U.K. Ecological Engineering
35(2009):1507-1513.
Monterusso, M.A., D.B.Rowe, and C.L. Rugh. 2005. Establishment and persistence of Sedum
spp. and native taxa for green roof applications. HortScience 40(2):391-396.

168
Monterusso, M.A., D.B. Rowe, C.L. Rugh, and D.K. Russell. 2004. Runoff water quantity and
quality from green roof systems. Acta Hort 639:369-376.
Mualem, Y. 1976. A New Modelfor Predicting the Hydraulic Conductivity of Unsaturated
Porous Media, Water Resources Research 12(3):513-522.
Nardini, A., S. Andri, and M. Crasso. 2012. Influence of substrate depth and vegetation type on
temperature and water runoff mitigation by extensive green roofs: shrubs vs. herbaceous plants.
Urban Ecosyst. 15(3): 697-708.
National Institute of Standards and Technology. 2012. Time of Wetness and Freezing
Predictions. http://ciks.cbt.nist.gov/bentz/nistir6551/node10.htm. Last accessed 31 July 2012.
Newman, S., K. Panter, and M. Roll. 1997. Growth and nutrition of geraniums grown in media
developed from waste tire components. HortScience 32:674-676.
Nobel, P.S. 1996. High productivity of certain agronomic CAM species. In: Winter K. and
J.A.C. Smith. Crassulacean acid metabolism: biochemistry, ecophysiology, and evolution.
Berlin, Germany. Springer-Verlag, 255-265.
Oberlander, C.H., E. Whitelaw, E. Matsuzaki. 2002. Introductory manual for greening roofs for
public works and government services Canada. Version 1.1 published 13 December 2002.
Palla, A., L.G. Lanza, and P. La Barbera. 2008. A green roof experimental site in the
Mediterranean climate. Proc. 11th Annual Conf. on Urban Drainage, Edinburgh, Scottland, UK.
Peck, Steven. 2013. Annual Green Roof Industry Survey. Green Roofs for Healthy Cities Report
April, 2013. http://www.greenroofs.org/resources/GreenRoofIndustrySurveyReport2013.pdf
Peters, A. and W. Durner. 2008. Simplified evaporation method for determining soil hydraulic
properties. Journal of Hydrology 356:147-162.

169
Portland Bureau of Environmental Services (PBES). 2006. Combined Sewer Overflow Program
Progress Report. http://www.portlandonline.com/shared/cfm/image.cfm?id=113677.
Prodgers, R.A. 2009. Revegetating topsoil, scoria, and spoil in Montana. Proc. 2009 National
Meeting of American Society of Mining and Reclamation. Billings, MT. May 30 – June 5, 2009.
Quyum, Abdul. 2000. Water Migration Through Hydrophobic Soils. Dissertation. University of
Calgary. 157 pages.
Raviv, M., R. Wallach, A. Silber, and A. Bar-Tal. 2002. Substrates and their Analysis. Chapter 2,
Hydroponic production of vegetables and ornamentals. Embryo Publications, Athens, Greece.
Pp. 25-101.
Rivera, Leo. Decagon Devices, INC. Pullman, WA.
Rowe, D.B., M.A. Monterruso, and C.L. Rugh. 2006. Assessment of heat-expanded slate and
fertility requirements in green roof substrates. HortTechnology 16(3): 471-477.
Schindler, U., W. Durner, G. von Unold, L. Müller, and R. Wieland. 2010. The evaporation
method: extending the range of soil hydraulic properties using the air-entry method of the
ceramic cup. J. Plant Nutr. Soil Sci. 173:563-572.
Schindler, U., W. Durner, G. von Unold, and L. Müller. 2010b. Evaporation method for
measuring unsaturated hydraulic properties of soils: extending the measurement range. Soil Sci.
Soc. Am. J. 74:1071-1083.
Schroll, E., J. Lambrinos, T. Righetti, and D. Sandrock. 2011. The role of vegetation in
regulating stormwater runoff from green roofs in a winter rainfall climate. Eco. Eng. 37:595-600.

170
Seattle stormwater code. 2009. Director’s rules, client assistance memos, green stormwater
infrastructure and flow control calculators. Last accessed March 3 2011.
http://www.seattle.gov/dpd/codes/stormwatercode/overview/default.asp
Seattle Green Stormwater Infrastructure Manual. 2010. Volume 3, Section 4.4.8.
Shamseldin, A.Y., 2010. Analytical Probabilistic Models for Low Impact Development (LID)
Stormwater Management Planning, Progress Report. Auckland, Waitakere City Council.
Snodgrass, E. and L. Snodgrass. 2006. Green roof plants. A resource and planting guide. Timber
Press, Inc. Portland, Oregon. 203 pp.
Solano, S.L. 2010. Investigating crumb rubber amendments for extensive green roof substrates.
Thesis, University of Maryland, College Park, Maryland. 150 pp.
Solano, L., A.R. Ristvey, J.D. Lea-Cox, and S.M. Cohan. 2012. Sequestering zinc from recycled
crumb rubber in extensive green roof media. Eco. Eng. 47:284-290.
Starry, O. 2013. The comparative effects of three sedum species on green roof water retention.
Dissertation, University of Maryland, College Park, Maryland. 157 pp.
Sydney City Council. 2010. Green Roof Resource Manual. Sydney, Australia.
http://www.cityofsydney.nsw.gov.au/__data/assets/pdf_file/0006/109383/Green-roof-resource-
manual-full-version.pdf
Taiz, L. and E. Zeiger. 2010. Plant Physiology Fifth Ed. Sinauer Associates, Inc. Sunderland,
Massachusetts.
Tan, P. and A. Sia. 2005. A pilot green roof research project in Singapore. Ini: Proc. of 3rd North
American Green Roof Conference: Greening Rooftops for Sustainable Communities,
Washington, DC. 4-6 May 2005. The Cardinal Group, Toronto.

171
Teemusk, A. and U. Mander. 2007. Rainwater runoff quantity and quality performance from a
green roof: the effects of short-term events. Eco. Eng. 30:271-277.
United States Environmental Protection Agency National Pollutant Discharge Elimination
System. http://cfpub.epa.gov/npdes/hom.cfm?program_id=5 9 February 2011.
United States Environmental Protection Agency. Greenhouse gas equivalency calculator.
http://www.epa.gov/cleanenergy/energy-resources/calculator.html Accessed 1 February, 2012
United States Environmental Protection Agency. 2010. Green Infrastructure Case Studies:
Municipal Policies for Managing Stormwater with Green Infrastructure. Bulletin No. EPA-841-
F-10-004.
United States Geological Survey. Volcanic Glossary: Scoria.
http://volcanoes.usgs.gov/images/pglossary/scoria.php 8 July 2011.
van Genuchten, M.T. 1980. A closed-form equation for predicting the hydraulic conductivity of
unsaturated soils. Soil Sci. Soc. Am. J. 44(5):892-898.
Van Renterghem, T. and D. Botteldooren. 2009. Reducing the acoustical façade load from road
traffic with green roofs. Building and Environment 44:1081-1087.
Van Renterghem, T. and D. Botteldooren. 2011. In-situ measurements of sound propagating over
extensive green roofs. Building and Envionment 46:729-738.
VanWoert, N.D., D.B. Rowe, J.A. Andresen, C.L. Rugh, and L. Xiao. 2005a. Watering regime
and green roof substrate design affect Sedum plant growth. HortScience 40(3):659-664.

172
VanWoert, N.D., D.B. Rowe, J.A. Andresen, C.L. Rugh, R.T. Fernandez, and L. Xiao. 2005b.
Green roof stormwater retention: effects of roof surface, slope, and media depth. J. Environ.
Qual. 34:1036-1044.
Villarreal, E.L. and L. Bengtsson. 2005. Response of a Sedum green-roof to individual rain
events. Eco. Eng. 25:1-7
Voyde, E., E. Fasman, and R. Simcock. 2010. Hydrology of an extensive living roof under sub-
tropical climate conditions in Auckland, New Zealand. J. Hydrol. 394:384-395.
Wallis, M.G., D.R. Scotter, and D.J. Horne. 1991. An Evaluation of the Intrinsic Sorptivity
Water Repellency Index on a Range of New Zealand Soils. Austr. J. Soil Res. 29: 353-362
Wang, L., J. Lyons, P. Rasmussen, P. Simons, T. Wiley, and P. Stewart. 2003. Watershed, reach,
and riparian influences on stream fish assemblages in the Northern Lakes and Forest Ecoregion.
Canadian Journal of fisheries and Aquatic Science 60:491-505.
Wong, N.H., P.Y. Tan, Y. Chen. 2007. Study of thermal performance of extensive rooftop
greenery systems in the tropical climate. Build. Environ. 42:25-54.
Wuerthner, George. “The Truth About Land Use in the United States”. 2002. Watersheds
Messenger, Vol. 9, No. 2.