Embed Size (px)
Citation preview
This project was supported by Grant No. 2006-IJ-CX-K035 awarded by the National Institute of Justice, Office of Justice Programs, US Department of
Justice. Points of view in this document are those of the authors and do not necessarily represent the official position or policies of the US Department of
Justice.
1
Evaluating IEEE 802.16 Broadband Wireless as a Communications Infrastructure for
Public Safety Activities
PIs: Jim Martin, Mike Westall
Clemson University
jim.martin,[email protected]
Abstract Public safety agencies traditionally use mobile radio systems for communications although cell
phones for voice and data are also prevalent. Most would agree that these communications
systems are not sufficient to meet the needs of law enforcement. Consequently there is
significant interest in broadband wireless technology. In this project, we have evaluated WiMAX
communications technology for use by public safety. Primarily because of equipment and
spectrum availability, the study focused on WiMAX operating at 4.9 GHz which is licensed
spectrum reserved for use by public safety agencies. Partnering with the Clemson University
Police Department we obtained the necessary license from the FCC, deployed a WiMAX
network on campus, and analyzed its performance using scenarios suggested by the Clemson PD.
The central goal of the research was to establish how well WiMAX can serve the needs of public
safety. Our main result suggests that realistic deployments (i.e., cost effective deployments) can
provide „hot spot‟ coverage over city-wide deployments. Feedback from the Clemson PD
indicates that such coverage is useful and can support a wide variety of law enforcement
applications.
Summary The project began 10/1/2006 and was completed 9/30/2008. The goal of the first year of the project
was to deploy and validate the WiMAX network on campus. The goal of the second year was to
analyze how the performance of the network, focusing on how Clemson Police Department
applications would work. To be specific, the following research objectives were defined for year 2
(9/30/2007-9/30/2008):
Extend the Clemson testbed to include 802.16e mobile WiMAX.
Evaluate the performance of a core set of voice, video, and data applications in mobile
scenarios
Focus on the particular problem of transporting large amounts of video data (e.g., video
surveillance and in-car video)
Extend our involvement with the WiMAX Forum lobbying for standards helpful to public
safety.
This project was supported by Grant No. 2006-IJ-CX-K035 awarded by the National Institute of Justice, Office of Justice Programs, US Department of
Justice. Points of view in this document are those of the authors and do not necessarily represent the official position or policies of the US Department of
Justice.
2
Our vendors (M/A-COM and Airspan) advised us that 802.16e equipment would not be available until
2009. We therefore paused work on the project and requested a third year grant extension with no
additional cost. This request was not approved and so unfortunately only a portion of the year 2
activities were completed. Only $209,000 or the $300,000 award was actually spent (roughly 30% of
the year 2 funds were actually consumed).
During year 1 of this project we accomplished the following:
• Established a collaboration with local police and fire departments and Clemson
University's IT and network infrastructure organization.
• Deployed WiMAX equipment from M/A-COM.
• Demonstrated voice and video to local agencies.
• Developed initial deployment guidelines
• Established a presence in the WiMAX forum
During year 2 we accomplished the following (roughly 1/3 of the original year 2 objectives were
accomplished):
• We have completed two papers that document the results of a performance assessment of
our WiMAX network. The results highlight information that the Clemson University
Police Department had specifically asked, specifically, what kind of coverage does
the network provide; and what types of applications are supported by the network.
• Have participated with the Application Working Group of the WiMAX Forum. We have
presented our recommendations of the WiMAX requirements to support public safety.
This contributed to a pair of WiMAX Forum White Paper submissions entitled
“WiMAX Public Safety Best Practice” and a WiMAX Forum White Paper
submission entitled “WiMAX Public Safety Best Practice”.
• We have completed v1.0 of our coverage tool and we are taking steps to make it available
to the public safety community.
• We have completed an initial assessment of a second 4.9 GHz WiMAX deployment
operated by the West Virginia High Technology Consortium Foundation. The results
are useful for law enforcement as they provide a second „snapshot‟ of how WiMAX
performs in a real deployment.
Project output and deliverables include the following:
All aspects of the project are documented at our project web site:
http://people.clemson.edu/~jmarty/projects/PublicSafety/PublicSafety.html
Three papers have been submitted based on our work (2 are pending, 1 has been accepted
for publication)
o Zhou, Y., Chowdhury, M., Martin, J., Wang, K.C., Westall, J., and Kang, X.Y.,
“Field Performance Study of a Regional WiMAX Network for Intelligent
Transportation System Applications,” Journal of Transportation Research Board,
Transportation Research Board, 2009 (in press).
o Martin, J., Westall, J., Pressly, W., “WiMAX Performance at 4.9 GHz”, under
review.
This project was supported by Grant No. 2006-IJ-CX-K035 awarded by the National Institute of Justice, Office of Justice Programs, US Department of
Justice. Points of view in this document are those of the authors and do not necessarily represent the official position or policies of the US Department of
Justice.
3
o Martin, J., Westall,, W., “Performance Characteristics of an Operational WiMAX
Network”, under review.
Measurement data is available at our „visualization‟ website:
https://mgridhost.clemson.edu/WiMAX (user name: DOJ, password: DOJ).
Summary of Results:
Based on the analysis that we performed on our campus WiMAX network, we report the
following results. Within a coverage area, we observed application level throughput ranging
from 5.1 Mbps to 0.64 Mbps. The throughput rate varied as a function of modulation type and
coding rate. Modulation and coding rate are functions of signal strength, and signal strength is a
function of distance from the transmitter and the nature of any material in the line of sight to the
transmitter. In addition to supporting best-effort data traffic (e.g., email, file exchange to/from
officers in the field), the network will support multimedia applications such as video and VoIP.
The WiMAX link remained operational while the subscriber station remained in near line-of-
sight of the base station and within a distance of 0.5 miles.
We developed a coverage tool and used it to monitor coverage over a specific path around
campus for a period of 6 months. We found that an operational link required near line-of-sight
between the subscriber station and the base station. The coverage was sensitive to the level of
foliage present at the time of data collection. During the Winter months, it was possible to
maintain network connectivity over a path around campus. However, during the Spring and
Summer, the subscriber station suffered frequent link disconnects when traveling the same path.
These results are good news for law enforcement. It is possible to deploy a WiMAX network to
support emerging broadband applications that will help law enforcement. Our Clemson PD
collaborators suggest that video streamed to or from police cars or to mobile devices would have
significant impact on their ability to serve the public. However, 100% coverage might be
expensive as the required number of base stations could be significant. A much more practical
solution is to deploy equipment providing „corridors‟ of support within a region. A corridor
might be a 3 mile stretch of a highway. “Corridors” along with hot-spot coverage within a city
would facilitate a large set of applications. Although we did not specifically compare WiMAX
to WiFi at 4.9 GHz, we do conjecture that the choice of protocol (WiMAX or WiFi) is not the
major limiting factor. The major performance obstacle is the poor propagation properties of 4.9
GHz RF in deployments that involve obstructions.
Technical Report
Similar to WiFi, Worldwide Interoperability for Microwave Access (referred to as WiMAX)
This project was supported by Grant No. 2006-IJ-CX-K035 awarded by the National Institute of Justice, Office of Justice Programs, US Department of
Justice. Points of view in this document are those of the authors and do not necessarily represent the official position or policies of the US Department of
Justice.
4
represents a MAC and physical layer wireless communications technology. The set of standards
that define WiMAX are developed and maintained by the IEEE 802.16 Working Group. The
current standard is referred to as 802.16e [802.16e]. Unlike WiFi, WiMAX was designed to
provide broadband wireless access at a municipal, state-wide, or multi-state level.
WiMAX is designed to operate in radio frequencies ranging from hundreds of megahertz to 66
GHz. The WiMAX Forum identifies working profiles that define operating modes and
configuration settings allowing equipment set to the same profile to interoperate [WimaxForum].
WiMAX operating modes and configuration options specified by a profile include:
Point-to-multipoint (PMP) or mesh operating modes. PMP implies subscriber stations
(SSs) must communicate through a central point, the base station. Mesh mode implies
subscriber stations can communicate directly with other SSs. To the best of our
knowledge, there are no WiMAX implementations that support mesh mode.
Operational parameters such as center frequency range, channel bandwidth, channel
frequency step size, fast Fourier transform (FFT) size and duplexing mode (time division
duplex and frequency division duplex).
Fixed, nomadic, portable or mobile operation [ForumApps]. Early WiMAX products
supported the 802.16d standard which allows fixed, nomadic or portable operation.
Fixed operation implies single location with no movement. Nomadic operation implies
multiple locations (points of network attachment) with no movement. Portable operation
implies nomadic access assuming pedestrian walking speed movement. As a subscriber
station moves out of range from one base station and into range of another, a „hard
handoff‟ occurs. A hard handoff requires the subscriber to go through a new channel
acquisition process (acquire carrier, sync, range, and register) when the current channel
disconnects. No MAC level handoff messages are exchanged. The latest 802.16e standard
extends the previous 802.16d standard for fixed operation as well as the updates required
for mobile operation. Mobile operation supports vehicular movement. 802.16e defines
messages that allow base stations to handle handoffs. The WiMAX Forum has defined
two levels of mobility: simple and full. Simple mobility supports movement up to 60
kmph and requires hard handoffs that cause brief interruptions of service of up to 1
second. Full mobility supports mobile devices moving at up to 120 kmph requiring soft
handoffs that limit interruptions to less than 50 ms. While all operating modes are
specified in a unified standard, we refer to fixed, nomadic, and portable operating modes
using the original IEEE standard of 802.16d and mobile operating mode using the IEEE
standard name of 802.16e (mobile) [802.16A,802.16B].
We have deployed an 802.16d WiMAX testbed at Clemson University using M/A-COM‟s Vida
WiMAX equipment1. The equipment operates in point-to-multipoint mode at 4.9 GHz which is
spectrum reserved for public safety2. The Clemson University Police Department and the City of
Clemson Police Department each hold a license to operate radio equipment at the 4.9 GHz band.
1 Information on the M/A-COM equipment is located at http://www.macom-wireless.com/products/broadband/default.asp 2 Refer to http://www.apco911.org/frequency/4-9GHz/documents/Motorola_4.9_GHz_White_Paper_06-13-2005.pdf for an
overview of FCC rules surrounding the use of 4.9 GHz.
This project was supported by Grant No. 2006-IJ-CX-K035 awarded by the National Institute of Justice, Office of Justice Programs, US Department of
Justice. Points of view in this document are those of the authors and do not necessarily represent the official position or policies of the US Department of
Justice.
5
Although a WiMAX Forum profile for 4.9 GHz has not yet been defined, a set of WiMAX
equipment vendors have agreed on a set of operating parameters allowing interoperability. We
refer to this set of operating modes and parameters as the 4.9 GHz profile. Appendix 1
highlights the details of the profile. In summary, the M/A-COM equipment uses 5 MHz
channels, time division duplex (TDD) mode, and 10 millisecond frames. The physical layer is
based on 256 FFT orthogonal frequency division multiplexing (OFDM). Nomadic operation is
achieved via „hard handoffs‟. Our network consists of a single base station and consequently
client hand-offs between base stations are not considered in the analysis.
This report presents results from a performance analysis we have conducted of our WiMAX
network. To the best of our knowledge the work reported in this paper is the first academic study
of WiMAX in an operational network in which controlled experiments could be conducted. We
divide the analysis into three sections. The first section documents the deployment at Clemson
University. In order to interpret the observed results, it is necessary to have a basic
understanding of how WiMAX works. Therefore, the second section of the paper describes
802.16 operation primarily by highlighting expected performance of the network. The third
section summarizes observed results from our study. We end the paper with a summary of our
conclusions and with a list of future work.
1 The Clemson WiMAX Network The WiMAX network at Clemson University consists of 1 base station and 6 subscriber stations.
The base station and 4 subscriber stations are from M-A/COM. Two high power clients that
transmit with a maximum power of 27 dBm and 2 low power units that transmit at 20 dBm. The
other two subscribers stations are EasyST radios from Airspan which transmit at 20 dBm.
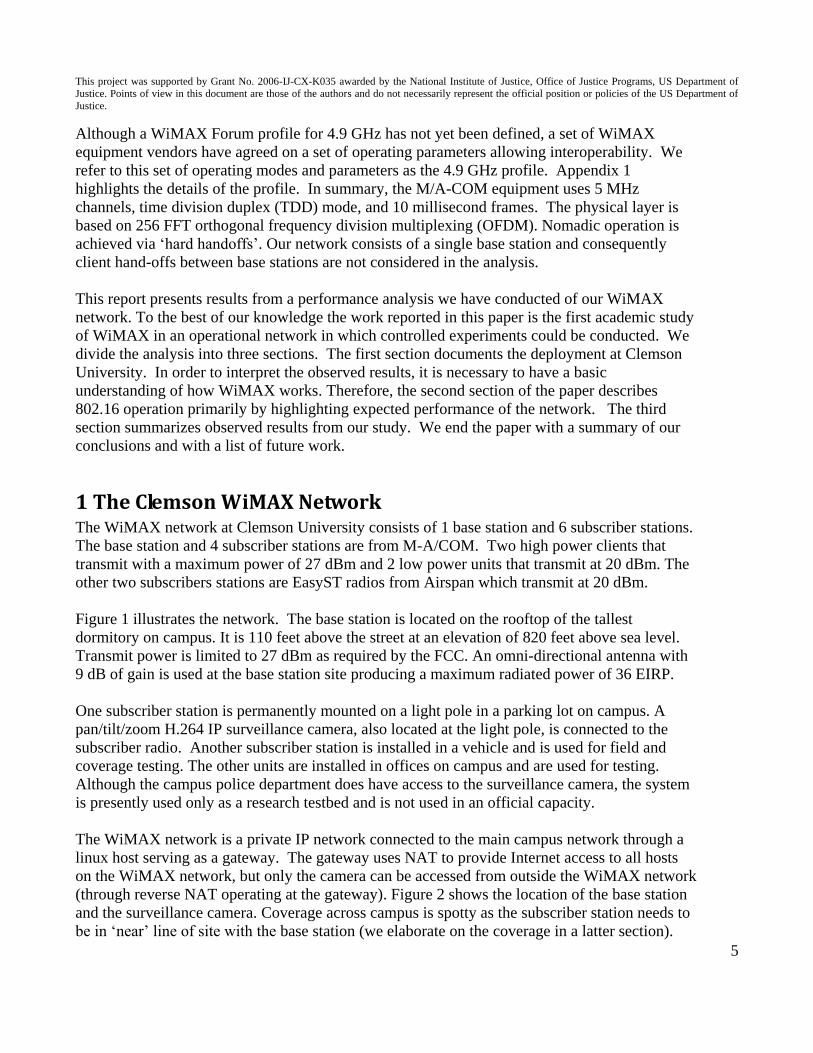
Figure 1 illustrates the network. The base station is located on the rooftop of the tallest
dormitory on campus. It is 110 feet above the street at an elevation of 820 feet above sea level.
Transmit power is limited to 27 dBm as required by the FCC. An omni-directional antenna with
9 dB of gain is used at the base station site producing a maximum radiated power of 36 EIRP.
One subscriber station is permanently mounted on a light pole in a parking lot on campus. A
pan/tilt/zoom H.264 IP surveillance camera, also located at the light pole, is connected to the
subscriber radio. Another subscriber station is installed in a vehicle and is used for field and
coverage testing. The other units are installed in offices on campus and are used for testing.
Although the campus police department does have access to the surveillance camera, the system
is presently used only as a research testbed and is not used in an official capacity.
The WiMAX network is a private IP network connected to the main campus network through a
linux host serving as a gateway. The gateway uses NAT to provide Internet access to all hosts
on the WiMAX network, but only the camera can be accessed from outside the WiMAX network
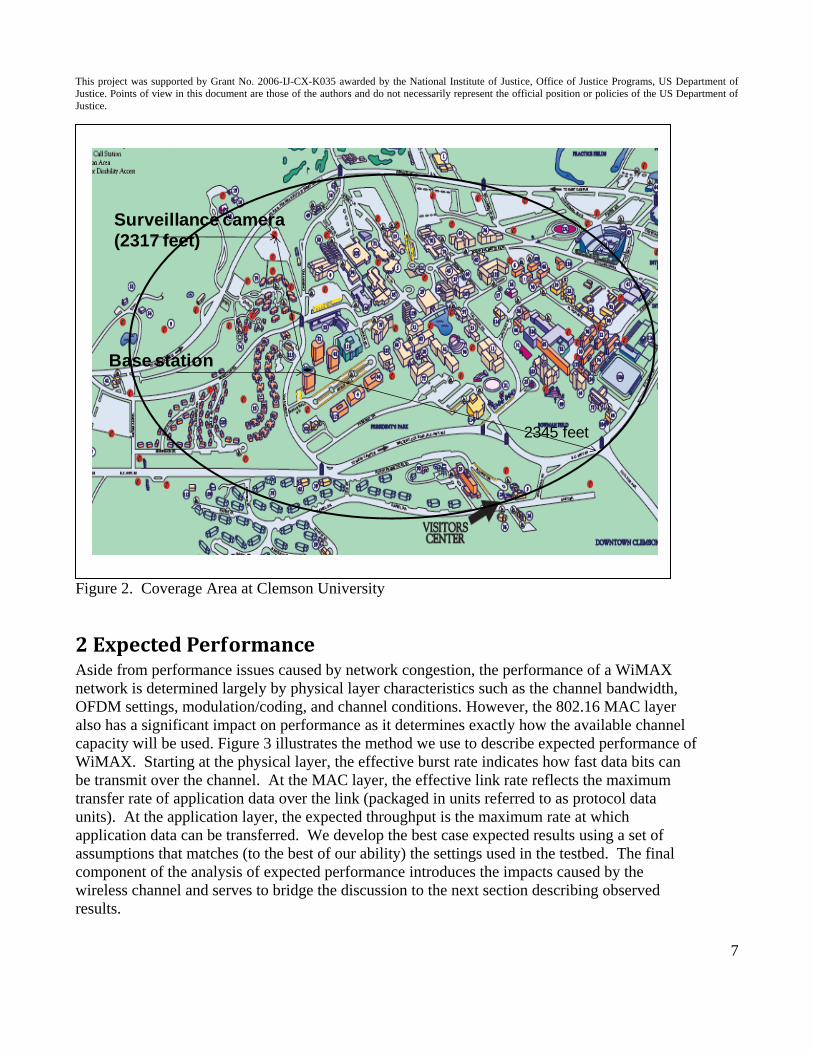
(through reverse NAT operating at the gateway). Figure 2 shows the location of the base station
and the surveillance camera. Coverage across campus is spotty as the subscriber station needs to
be in „near‟ line of site with the base station (we elaborate on the coverage in a latter section).
This project was supported by Grant No. 2006-IJ-CX-K035 awarded by the National Institute of Justice, Office of Justice Programs, US Department of
Justice. Points of view in this document are those of the authors and do not necessarily represent the official position or policies of the US Department of
Justice.
6
Coverage can extend beyond one mile from the base station if there is an unobstructed view
between the base station and subscriber station.
Figure 1 Network Diagram
Wireless cloud
MaxRad MFB49009omni (9 db gain)
M/A COM basestationMAVM-VMXBD
192.168.90.252
ManagementConsole,TFTP server for
BS config info,DHCP, NTP servers
Subscriber Station192.168.90.251
192.168.90.31
100/1000
Switch
100/1000
Switch
Indigo Vision 9000E H.264PTZ IP Camera
Subscriber Station192.168.90.250
ClemsonNetwork130.127/16
Subscriber Station192.168.90.252
192.168.90.41
100/1000
Switch
Subscriber Station192.168.90.253
192.168.90.51
100/1000
Switch
100/1000
Switch
LinuxRouter192.168.90.254
MaxRadPanel Antenna (18 db)
This project was supported by Grant No. 2006-IJ-CX-K035 awarded by the National Institute of Justice, Office of Justice Programs, US Department of
Justice. Points of view in this document are those of the authors and do not necessarily represent the official position or policies of the US Department of
Justice.
7
Figure 2. Coverage Area at Clemson University
2 Expected Performance Aside from performance issues caused by network congestion, the performance of a WiMAX
network is determined largely by physical layer characteristics such as the channel bandwidth,
OFDM settings, modulation/coding, and channel conditions. However, the 802.16 MAC layer
also has a significant impact on performance as it determines exactly how the available channel
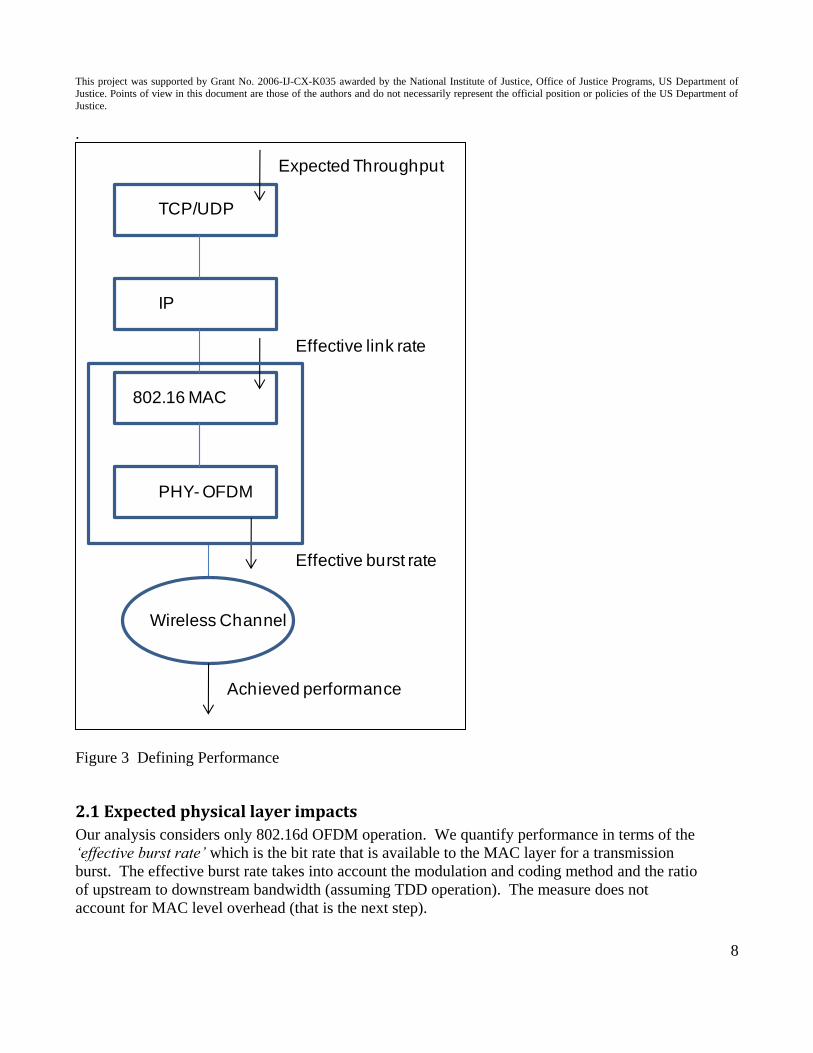
capacity will be used. Figure 3 illustrates the method we use to describe expected performance of
WiMAX. Starting at the physical layer, the effective burst rate indicates how fast data bits can
be transmit over the channel. At the MAC layer, the effective link rate reflects the maximum
transfer rate of application data over the link (packaged in units referred to as protocol data
units). At the application layer, the expected throughput is the maximum rate at which
application data can be transferred. We develop the best case expected results using a set of
assumptions that matches (to the best of our ability) the settings used in the testbed. The final
component of the analysis of expected performance introduces the impacts caused by the
wireless channel and serves to bridge the discussion to the next section describing observed
results.
Campus Deployment
8
Surveillance camera
(2317 feet)
Base station
2345 feet
This project was supported by Grant No. 2006-IJ-CX-K035 awarded by the National Institute of Justice, Office of Justice Programs, US Department of
Justice. Points of view in this document are those of the authors and do not necessarily represent the official position or policies of the US Department of
Justice.
8
.
Figure 3 Defining Performance
2.1 Expected physical layer impacts
Our analysis considers only 802.16d OFDM operation. We quantify performance in terms of the
‘effective burst rate’ which is the bit rate that is available to the MAC layer for a transmission
burst. The effective burst rate takes into account the modulation and coding method and the ratio
of upstream to downstream bandwidth (assuming TDD operation). The measure does not
account for MAC level overhead (that is the next step).
TCP/UDPTCP/UDP
TCP/UDPIP
TCP/UDP802.16 MAC
TCP/UDPPHY- OFDM
Wireless Channel
Expected Throughput
Effective link rate
Effective burst rate
Achieved performance
This project was supported by Grant No. 2006-IJ-CX-K035 awarded by the National Institute of Justice, Office of Justice Programs, US Department of
Justice. Points of view in this document are those of the authors and do not necessarily represent the official position or policies of the US Department of
Justice.
9
The OFDM physical layer divides bandwidth into subchannels as follows3
256 Total subchannels
8 "Pilot" channels used to establish/maintain physical layer synchronization
192 Data channels
55 Channels used as guard bands
1 A null carrier is transmitted on the center frequency channel
Each subchannel has a bandwidth of 5 Mhz / 256 channels = 19.531 Khz.
Our analysis assumes an oversampling factor of 144/125 leading to a carrier spacing of 22.5
KHz. The symbol (baud) time is the inverse 44.44 usec/symbol. The symbol (baud) time in the
WiMAX standard is the FFT symbol duration used in demultiplexing BPSK, QPSK, or QAM
encoded OFDM signals. To counter intersymbol interference, WiMAX defines possible guard
intervals of 1/4, 1/8, 1/16 and 1/32 of the FFT symbol duration. The standard specifies a guard
interval of 1/8 for OFDM channels when the bandwidth is a multiple of 1.25 MHz.
For the remaining analysis we assume a guard interval of 1/8. The symbol time is:
44.44 + (44.44/8) = 50.0 usec. Therefore the aggregate symbol rate is 20,000 symbols per
second. Assuming that 50% of channel capacity is allocated to both upstream and downstream
flows, the 64 QAM 2/3 modulation mode yields an effective downstream burst rate of:
(6 * 2/3) * 1.92 Msymbols/second = 7.68 Mbps
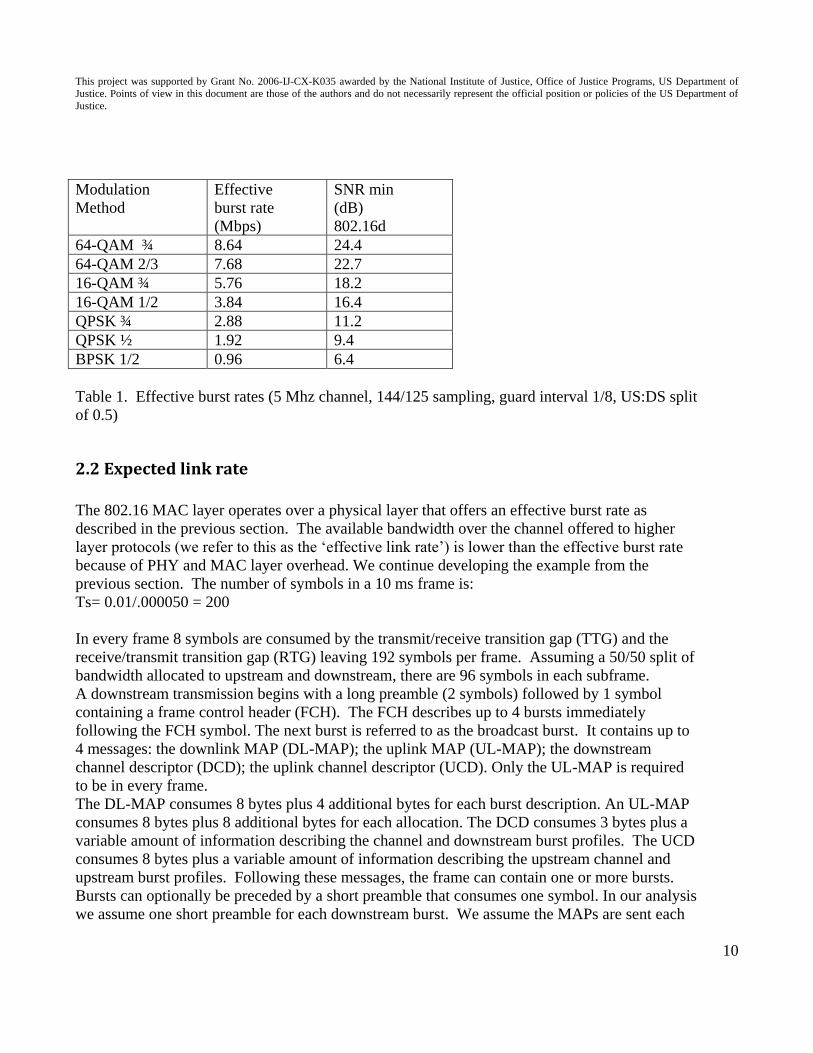
Table 1 indicates the maximum possible effective burst rate for each modulation method
specified by the WiMAX standard. The results apply to both downstream and upstream. A base
station is required to adapt the modulation method and the transmit power levels used over both
downstream and upstream channels. Subscriber stations periodically provide carrier-to-
interference plus noise ratio (CINR) and received signal strength indication (RSSI) statistics to
the base station through the report report (REP-REQ) and report response (REP_RSP) messages.
While the specific adaptation algorithm is not specified in the standard, minimum radio receiver
sensitivity requirements are specified. The table shows the minimum signal-to-noise (SNR)
level that is required for a given modulation and code level as specified by the standard.
3 The M/A-COM base station does not support subchannelization. When a protocol data unit (PDU) is transmit, all
subchannels are dedicated to the single burst.
This project was supported by Grant No. 2006-IJ-CX-K035 awarded by the National Institute of Justice, Office of Justice Programs, US Department of
Justice. Points of view in this document are those of the authors and do not necessarily represent the official position or policies of the US Department of
Justice.
10
Modulation
Method
Effective
burst rate
(Mbps)
SNR min
(dB)
802.16d
64-QAM ¾ 8.64 24.4
64-QAM 2/3 7.68 22.7
16-QAM ¾ 5.76 18.2
16-QAM 1/2 3.84 16.4
QPSK ¾ 2.88 11.2
QPSK ½ 1.92 9.4
BPSK 1/2 0.96 6.4
Table 1. Effective burst rates (5 Mhz channel, 144/125 sampling, guard interval 1/8, US:DS split
of 0.5)
2.2 Expected link rate
The 802.16 MAC layer operates over a physical layer that offers an effective burst rate as
described in the previous section. The available bandwidth over the channel offered to higher
layer protocols (we refer to this as the „effective link rate‟) is lower than the effective burst rate
because of PHY and MAC layer overhead. We continue developing the example from the
previous section. The number of symbols in a 10 ms frame is:
Ts= 0.01/.000050 = 200
In every frame 8 symbols are consumed by the transmit/receive transition gap (TTG) and the
receive/transmit transition gap (RTG) leaving 192 symbols per frame. Assuming a 50/50 split of
bandwidth allocated to upstream and downstream, there are 96 symbols in each subframe.
A downstream transmission begins with a long preamble (2 symbols) followed by 1 symbol
containing a frame control header (FCH). The FCH describes up to 4 bursts immediately
following the FCH symbol. The next burst is referred to as the broadcast burst. It contains up to
4 messages: the downlink MAP (DL-MAP); the uplink MAP (UL-MAP); the downstream
channel descriptor (DCD); the uplink channel descriptor (UCD). Only the UL-MAP is required
to be in every frame.
The DL-MAP consumes 8 bytes plus 4 additional bytes for each burst description. An UL-MAP
consumes 8 bytes plus 8 additional bytes for each allocation. The DCD consumes 3 bytes plus a
variable amount of information describing the channel and downstream burst profiles. The UCD
consumes 8 bytes plus a variable amount of information describing the upstream channel and
upstream burst profiles. Following these messages, the frame can contain one or more bursts.
Bursts can optionally be preceded by a short preamble that consumes one symbol. In our analysis
we assume one short preamble for each downstream burst. We assume the MAPs are sent each
This project was supported by Grant No. 2006-IJ-CX-K035 awarded by the National Institute of Justice, Office of Justice Programs, US Department of
Justice. Points of view in this document are those of the authors and do not necessarily represent the official position or policies of the US Department of
Justice.
11
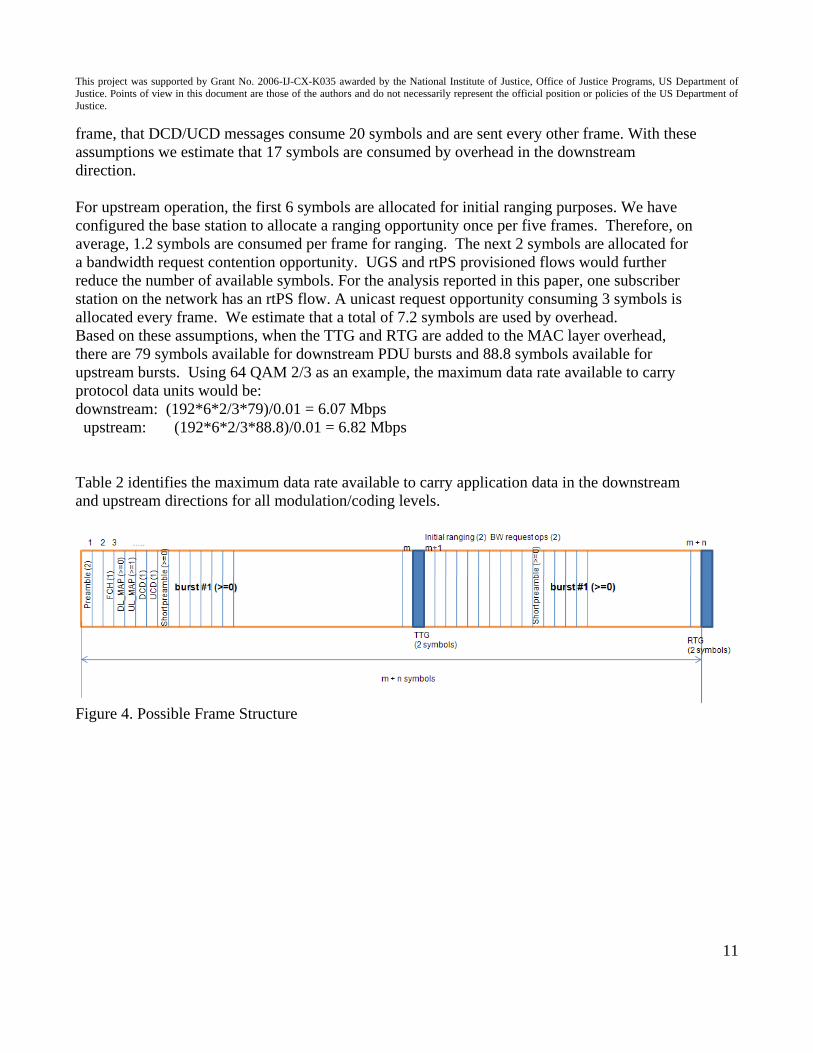
frame, that DCD/UCD messages consume 20 symbols and are sent every other frame. With these
assumptions we estimate that 17 symbols are consumed by overhead in the downstream
direction.
For upstream operation, the first 6 symbols are allocated for initial ranging purposes. We have
configured the base station to allocate a ranging opportunity once per five frames. Therefore, on
average, 1.2 symbols are consumed per frame for ranging. The next 2 symbols are allocated for
a bandwidth request contention opportunity. UGS and rtPS provisioned flows would further
reduce the number of available symbols. For the analysis reported in this paper, one subscriber
station on the network has an rtPS flow. A unicast request opportunity consuming 3 symbols is
allocated every frame. We estimate that a total of 7.2 symbols are used by overhead.
Based on these assumptions, when the TTG and RTG are added to the MAC layer overhead,
there are 79 symbols available for downstream PDU bursts and 88.8 symbols available for
upstream bursts. Using 64 QAM 2/3 as an example, the maximum data rate available to carry
protocol data units would be:
downstream: (192*6*2/3*79)/0.01 = 6.07 Mbps
upstream: (192*6*2/3*88.8)/0.01 = 6.82 Mbps
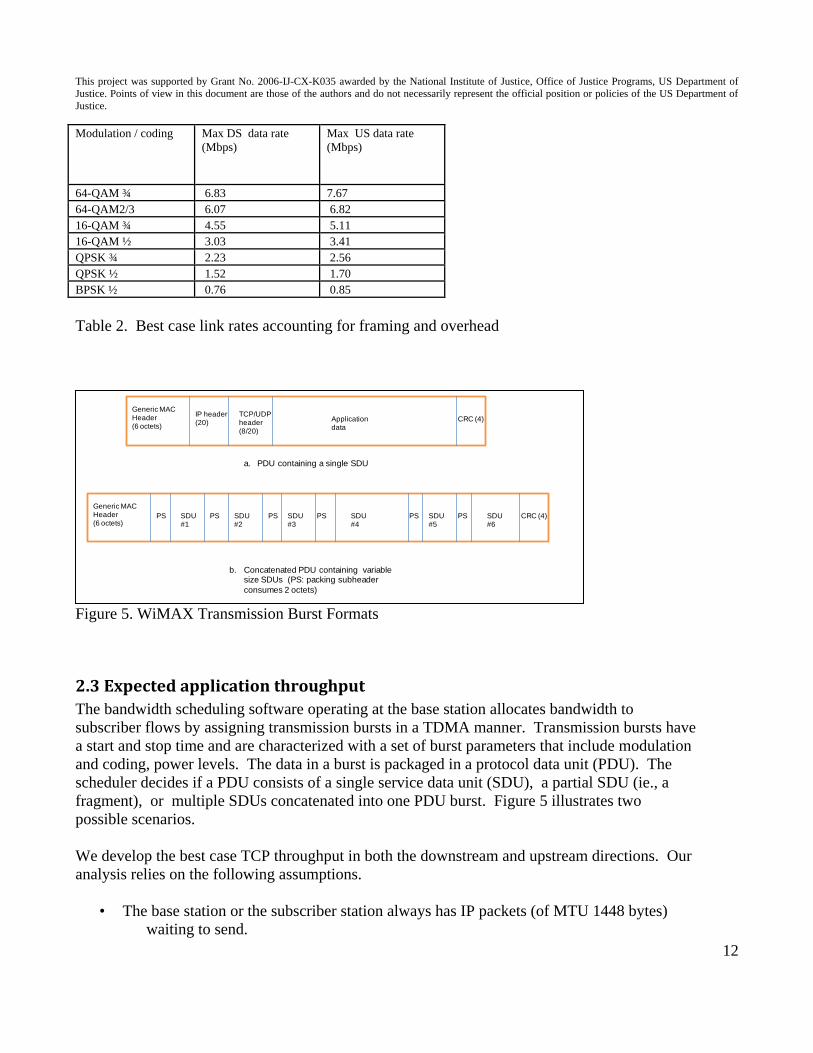
Table 2 identifies the maximum data rate available to carry application data in the downstream
and upstream directions for all modulation/coding levels.
Figure 4. Possible Frame Structure
This project was supported by Grant No. 2006-IJ-CX-K035 awarded by the National Institute of Justice, Office of Justice Programs, US Department of
Justice. Points of view in this document are those of the authors and do not necessarily represent the official position or policies of the US Department of
Justice.
12
Modulation / coding Max DS data rate
(Mbps) Max US data rate
(Mbps)
64-QAM ¾ 6.83 7.67 64-QAM2/3 6.07 6.82 16-QAM ¾ 4.55 5.11 16-QAM ½ 3.03 3.41 QPSK ¾ 2.23 2.56 QPSK ½ 1.52 1.70 BPSK ½ 0.76 0.85
Table 2. Best case link rates accounting for framing and overhead
Figure 5. WiMAX Transmission Burst Formats
2.3 Expected application throughput
The bandwidth scheduling software operating at the base station allocates bandwidth to
subscriber flows by assigning transmission bursts in a TDMA manner. Transmission bursts have
a start and stop time and are characterized with a set of burst parameters that include modulation
and coding, power levels. The data in a burst is packaged in a protocol data unit (PDU). The
scheduler decides if a PDU consists of a single service data unit (SDU), a partial SDU (ie., a
fragment), or multiple SDUs concatenated into one PDU burst. Figure 5 illustrates two
possible scenarios.
We develop the best case TCP throughput in both the downstream and upstream directions. Our
analysis relies on the following assumptions.
• The base station or the subscriber station always has IP packets (of MTU 1448 bytes)
waiting to send.
Generic MAC Header(6 octets)
a. PDU containing a single SDU
CRC (4) IP header(20)
TCP/UDP header(8/20)
Application data
Generic MAC Header(6 octets)
b. Concatenated PDU containing variable size SDUs (PS: packing subheader
consumes 2 octets)
CRC (4) PS SDU#1
PS SDU#2
SDU#3
SDU#4
SDU#5
SDU#6
PS PS PS PS
This project was supported by Grant No. 2006-IJ-CX-K035 awarded by the National Institute of Justice, Office of Justice Programs, US Department of
Justice. Points of view in this document are those of the authors and do not necessarily represent the official position or policies of the US Department of
Justice.
13
• IP packets are concatenated and sent as a single burst (as depicted in Figure 5b).
• The overhead associated with a burst is illustrated in Figure 5b.
• An IP packet that will not fit in the space available in a subframe is fragmented so that no
symbols are wasted.
• A single TCP flow is active in the network.
• An ideal channel (i.e., no bit errors or fading effects).
Continuing to use 64 QAM 2/3 as the example, we derive the best case downstream and upstream
throughput. The maximum amount of data that can be sent in a single frame:
Downstream: 192 * 6 * 2/3 * 79 * 1/8 = 7,584 bytes
Upstream: 192 * 6 * 2/3 * 88.8 * 1/8 = 8,524.8 bytes
If we assume all available symbols are allocated to a single PDU burst, and if we factor in an overhead
of 1448/1500, we get a maximum application throughput of:
Downstream: (7,584 * 8 / 0.01 ) * 0.965 = 5.86 Mbps
Upstream: (8,524.8 * 8 / 0.01) * 0.965 = 6.58 Mbps
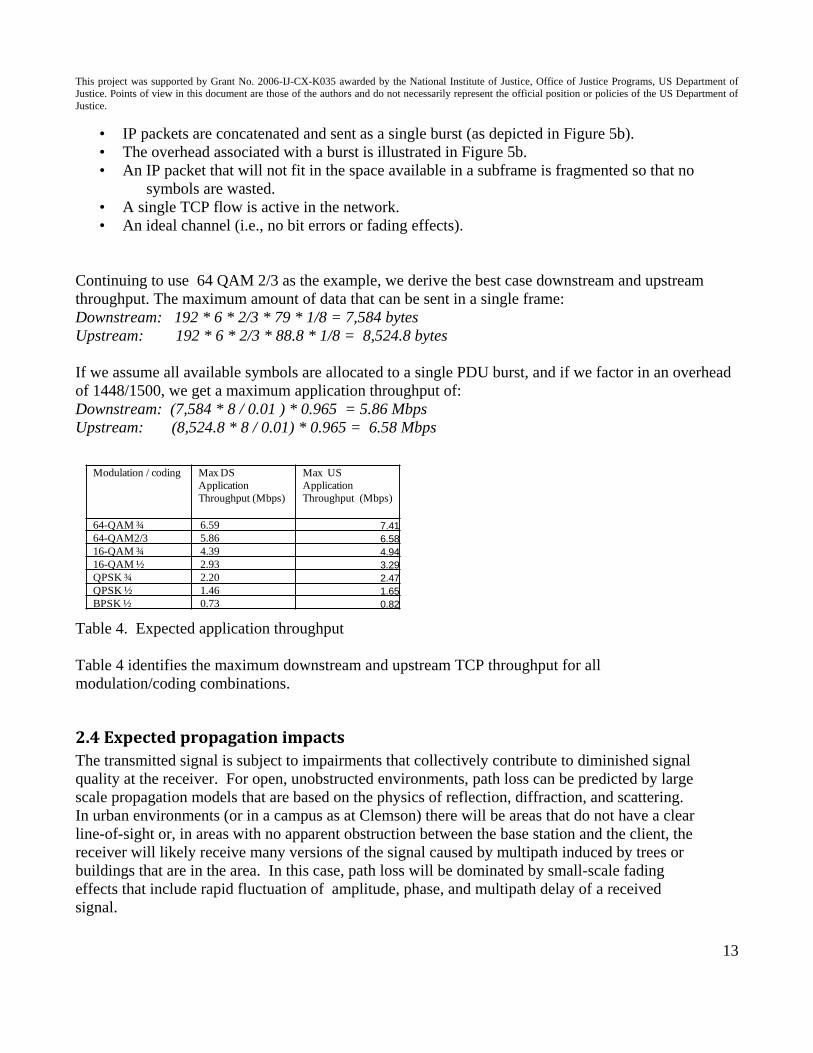
Modulation / coding Max DS
Application
Throughput (Mbps)
Max US
Application
Throughput (Mbps)
64-QAM ¾ 6.59 7.41
64-QAM2/3 5.86 6.58
16-QAM ¾ 4.39 4.94
16-QAM ½ 2.93 3.29
QPSK ¾ 2.20 2.47
QPSK ½ 1.46 1.65
BPSK ½ 0.73 0.82
Table 4. Expected application throughput
Table 4 identifies the maximum downstream and upstream TCP throughput for all
modulation/coding combinations.
2.4 Expected propagation impacts
The transmitted signal is subject to impairments that collectively contribute to diminished signal
quality at the receiver. For open, unobstructed environments, path loss can be predicted by large
scale propagation models that are based on the physics of reflection, diffraction, and scattering.
In urban environments (or in a campus as at Clemson) there will be areas that do not have a clear
line-of-sight or, in areas with no apparent obstruction between the base station and the client, the
receiver will likely receive many versions of the signal caused by multipath induced by trees or
buildings that are in the area. In this case, path loss will be dominated by small-scale fading
effects that include rapid fluctuation of amplitude, phase, and multipath delay of a received
signal.
This project was supported by Grant No. 2006-IJ-CX-K035 awarded by the National Institute of Justice, Office of Justice Programs, US Department of
Justice. Points of view in this document are those of the authors and do not necessarily represent the official position or policies of the US Department of
Justice.
14
A commonly used propagation model that includes the effects of random „clutter‟ is log-normal
shadowing [RAPP02]. The model gives the path loss that might be expected over a large
number of measurement locations which have the same separation between the client and the
base station. The model is a function of distance (d) based on two parameters: a path loss
exponent, n, and a random component, a value x , which is a zero-mean Gaussian distributed
random variable (in dB) with standard deviation (also in dB). The parameter 0d is the close-in
reference distance.
0
0
( ) ( ) 10 logd
PL dB PL d n xd
The path loss exponent and the standard deviation factor are usually derived from measured data.
Previous studies show that in urban areas the measured path loss exhibits a path loss exponent in
the 2-4 range and a standard deviation in the 8 – 12 range. In the next section we provide a
snapshot of the coverage observed on campus by comparing measured path loss results to path
loss predicted by a log-normal shadowing model using parameters that fit measured data.
3 Observed Results We have conducted a measurement study of the WiMAX network deployed at Clemson
University. The network provides coverage in areas that have near line-of-sight and that are
within roughly 0.5 miles of the base station. Only locations that have clear line-of-sight have
coverage beyond 0.5 mile. The farthest distance we observed an operational link was 1.2 miles.
We present two types of measured results. First, we summarize the results of TCP throughput
experiments that show the best case throughput over a range of modulation and coding settings.
Second, we present the results of coverage tests that provide an assessment of the impact that
channel impairments have on the network.
For all results reported in this paper we used the higher power M-A/COM subscriber station in a
vehicle with an external 6 gain dB antenna attached to the roof. We used a Linux host located in
a car as the client-side platform for all measurement experiments reported in this paper. The
server was located on the Linux gateway machine on the wired network
3.1 TCP throughput results
We used the iperf performance tool to obtain application throughput measurements. We positioned the
measurement laptop at a location that resulted in the desired combination of upstream and downstream
modulation settings. We used iperf to transfer as much TCP data as possible for 10 seconds first in the
upstream direction and then in the downstream direction. We configured iperf to display the observed
TCP throughput every second. We ensured that the modulation did not change during the course of the
transfer. The socket buffer size was optimized to ensure that the pipe was always full but that buffer
This project was supported by Grant No. 2006-IJ-CX-K035 awarded by the National Institute of Justice, Office of Justice Programs, US Department of
Justice. Points of view in this document are those of the authors and do not necessarily represent the official position or policies of the US Department of
Justice.
15
overflow at any queue over the path did not occur.
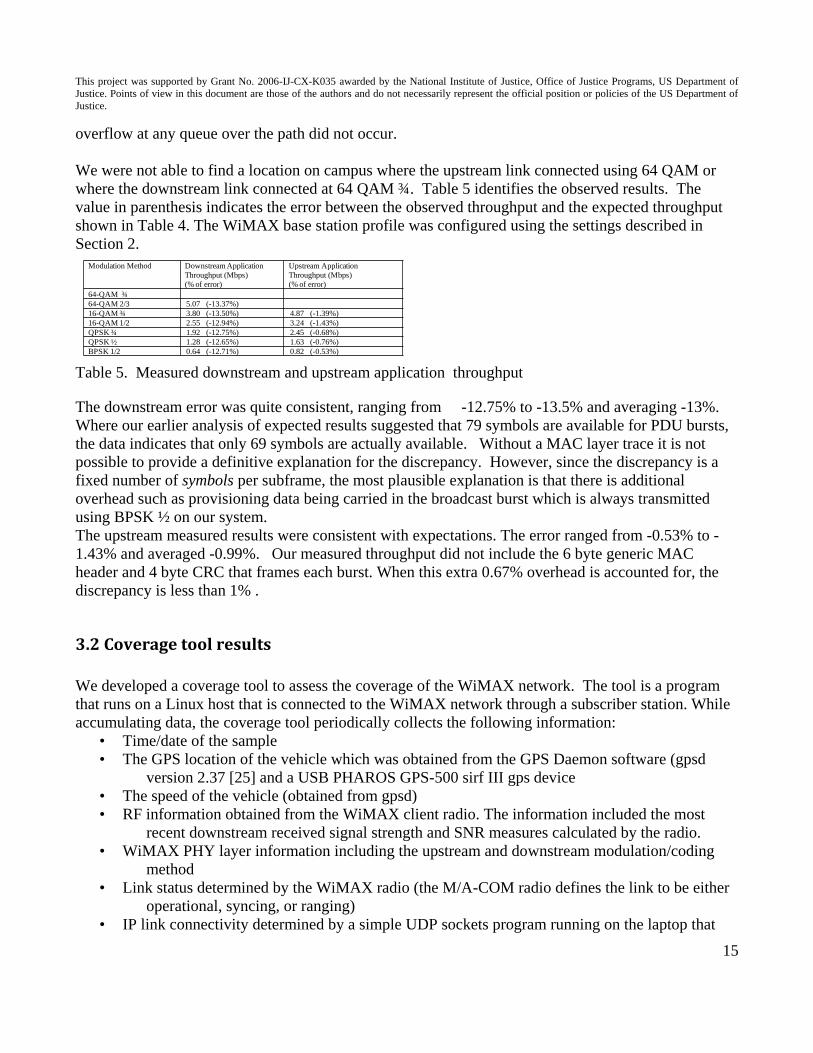
We were not able to find a location on campus where the upstream link connected using 64 QAM or
where the downstream link connected at 64 QAM ¾. Table 5 identifies the observed results. The
value in parenthesis indicates the error between the observed throughput and the expected throughput
shown in Table 4. The WiMAX base station profile was configured using the settings described in
Section 2.
Modulation Method Downstream Application
Throughput (Mbps)
(% of error)
Upstream Application
Throughput (Mbps)
(% of error)
64-QAM ¾
64-QAM 2/3 5.07 (-13.37%)
16-QAM ¾ 3.80 (-13.50%) 4.87 (-1.39%)
16-QAM 1/2 2.55 (-12.94%) 3.24 (-1.43%)
QPSK ¾ 1.92 (-12.75%) 2.45 (-0.68%)
QPSK ½ 1.28 (-12.65%) 1.63 (-0.76%)
BPSK 1/2 0.64 (-12.71%) 0.82 (-0.53%)
Table 5. Measured downstream and upstream application throughput
The downstream error was quite consistent, ranging from -12.75% to -13.5% and averaging -13%.
Where our earlier analysis of expected results suggested that 79 symbols are available for PDU bursts,
the data indicates that only 69 symbols are actually available. Without a MAC layer trace it is not
possible to provide a definitive explanation for the discrepancy. However, since the discrepancy is a
fixed number of symbols per subframe, the most plausible explanation is that there is additional
overhead such as provisioning data being carried in the broadcast burst which is always transmitted
using BPSK ½ on our system.
The upstream measured results were consistent with expectations. The error ranged from -0.53% to -
1.43% and averaged -0.99%. Our measured throughput did not include the 6 byte generic MAC
header and 4 byte CRC that frames each burst. When this extra 0.67% overhead is accounted for, the
discrepancy is less than 1% .
3.2 Coverage tool results
We developed a coverage tool to assess the coverage of the WiMAX network. The tool is a program
that runs on a Linux host that is connected to the WiMAX network through a subscriber station. While
accumulating data, the coverage tool periodically collects the following information:
• Time/date of the sample
• The GPS location of the vehicle which was obtained from the GPS Daemon software (gpsd
version 2.37 [25] and a USB PHAROS GPS-500 sirf III gps device
• The speed of the vehicle (obtained from gpsd)
• RF information obtained from the WiMAX client radio. The information included the most
recent downstream received signal strength and SNR measures calculated by the radio.
• WiMAX PHY layer information including the upstream and downstream modulation/coding
method
• Link status determined by the WiMAX radio (the M/A-COM radio defines the link to be either
operational, syncing, or ranging)
• IP link connectivity determined by a simple UDP sockets program running on the laptop that
This project was supported by Grant No. 2006-IJ-CX-K035 awarded by the National Institute of Justice, Office of Justice Programs, US Department of
Justice. Points of view in this document are those of the authors and do not necessarily represent the official position or policies of the US Department of
Justice.
16
sends a 64 byte UDP datagram to an echo server located on the linux gateway. The result is
a round trip time sample obtained when the UDP datagram echo arrives or a value of 0
indicating the packet was dropped
From January 2008 through June 2008 we collected 12 sets of data. A data set is a set of
samples obtained from a 30 minute drive around campus. We had a standard driving path within
the coverage area that facilitated comparing different data sets obtained at different times of year.
We developed a web site that provides both data archival and analysis capabilities. The web site
allows a user to select (and to upload) a data set which is then visualized using a Google Map
service. The visualization has two modes: one that shows the RF properties observed with each
data sample; a second that shows link connectivity. A green symbol implies network
connectivity, a black symbol implies there is no connectivity. The criteria that determines
network connectivity is if the SNR is greater than a value of 5.This is roughly the point where
the link loses synchronization and where any IP packets that do get transmitted are not received.
We derived this rule-of-thumb by observing that IP packets were always dropped when the SNR
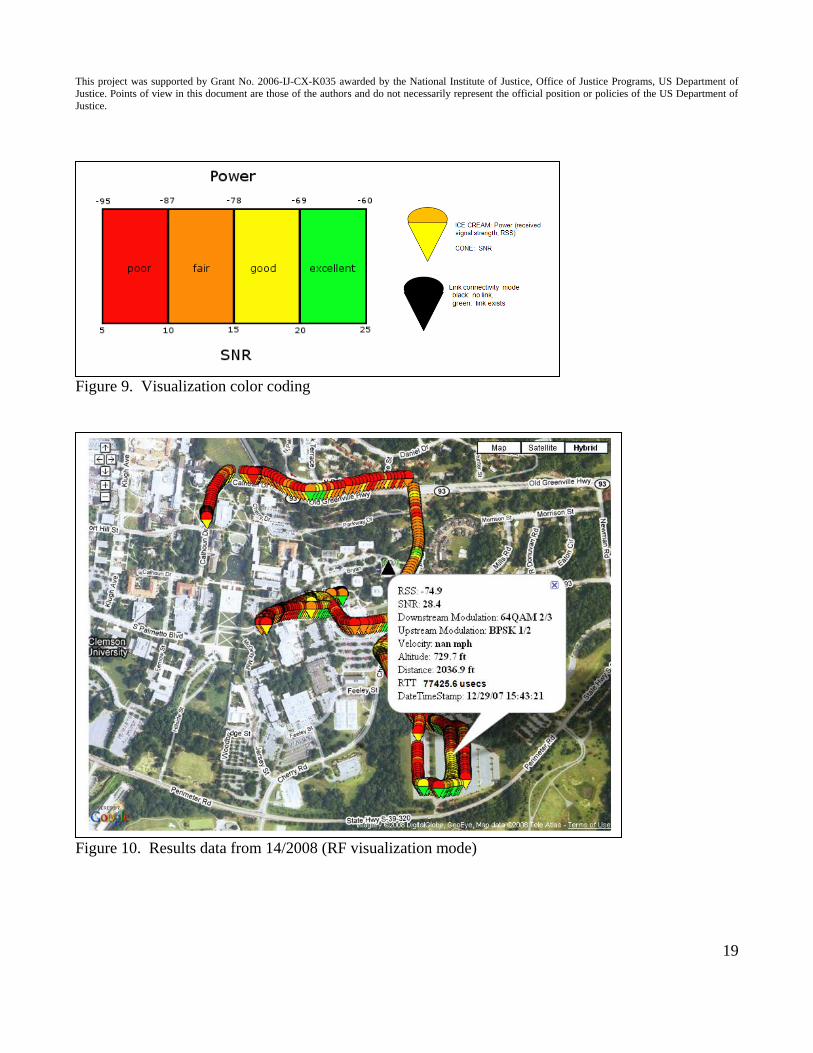
was below 5. Figure 8 visualizes the same data set but in RF mode. Each data point is
represented by a color-coded ice cream cone. The top part of the symbol (i.e., the „ice cream‟)
represents the most recent downstream RSSI statistic observed by the radio and the bottom cone
represents the most recent downstream SNR. This information is retrieved from the chip set used
in the radio. We conjecture that these measures represent a statistic based most recent conditions
observed by the radio overall all subchannels but we have not been able to confirm this. The
color coding is specified in Figure 9.
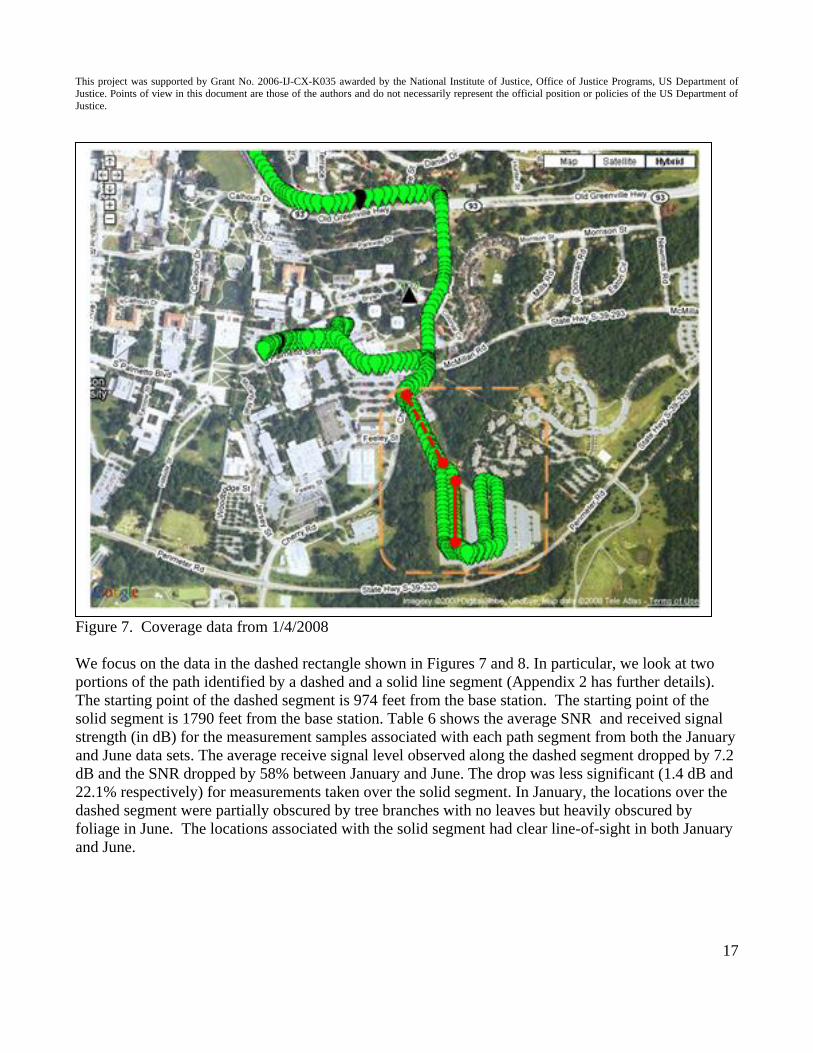
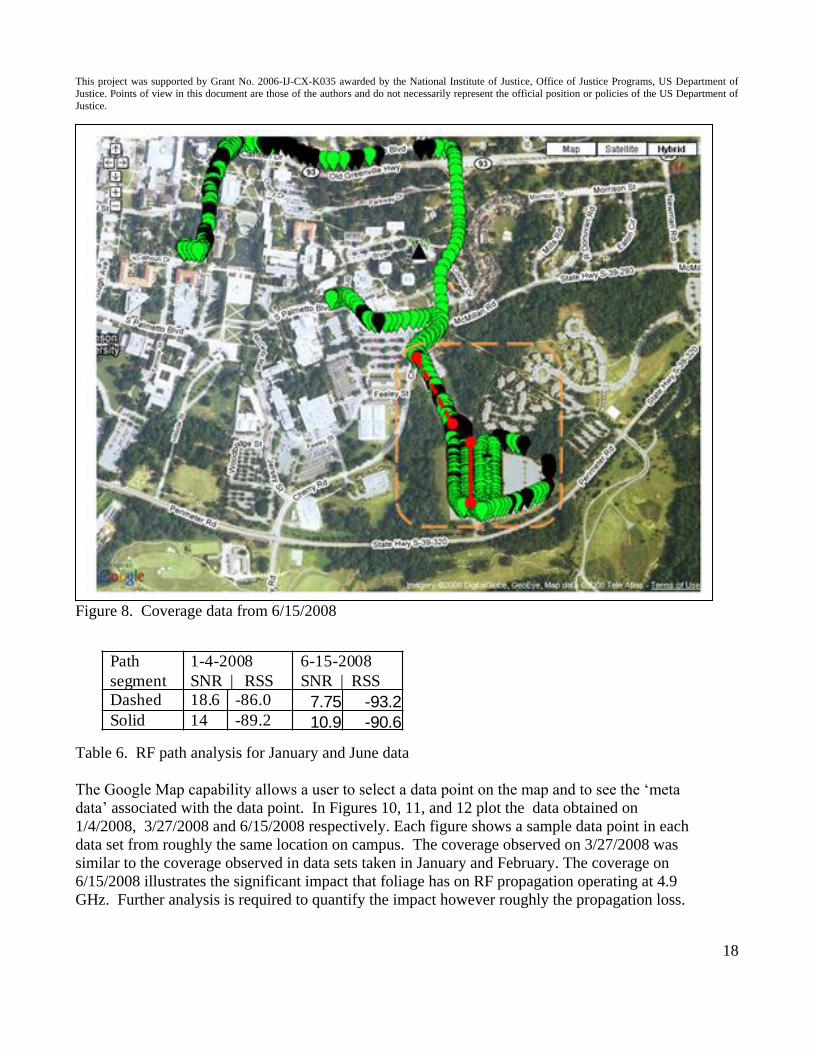
Figures 7 and 8 show data collected on 1/4/2007 and 6/15/2008 respectively. The black triangle
located in the center of the map represents the location of the base station. All data points are from
locations that fall within a circle of coverage extending 0.5 miles in radius around the base station.
Figure 7 shows that the subscriber station did not have network connectivity roughly 4 times. Further
study of the data shows that the subscriber station never lost synchronization rather the SNR dropped
below the threshold of 5. Figure 8 shows a significantly larger number of network disconnect events.
The gaps in the data occurred when the subscriber station did lose synchronization and had to reacquire
the channel. While in this state, the subscriber station would not respond to the coverage tool‟s request
for status information.
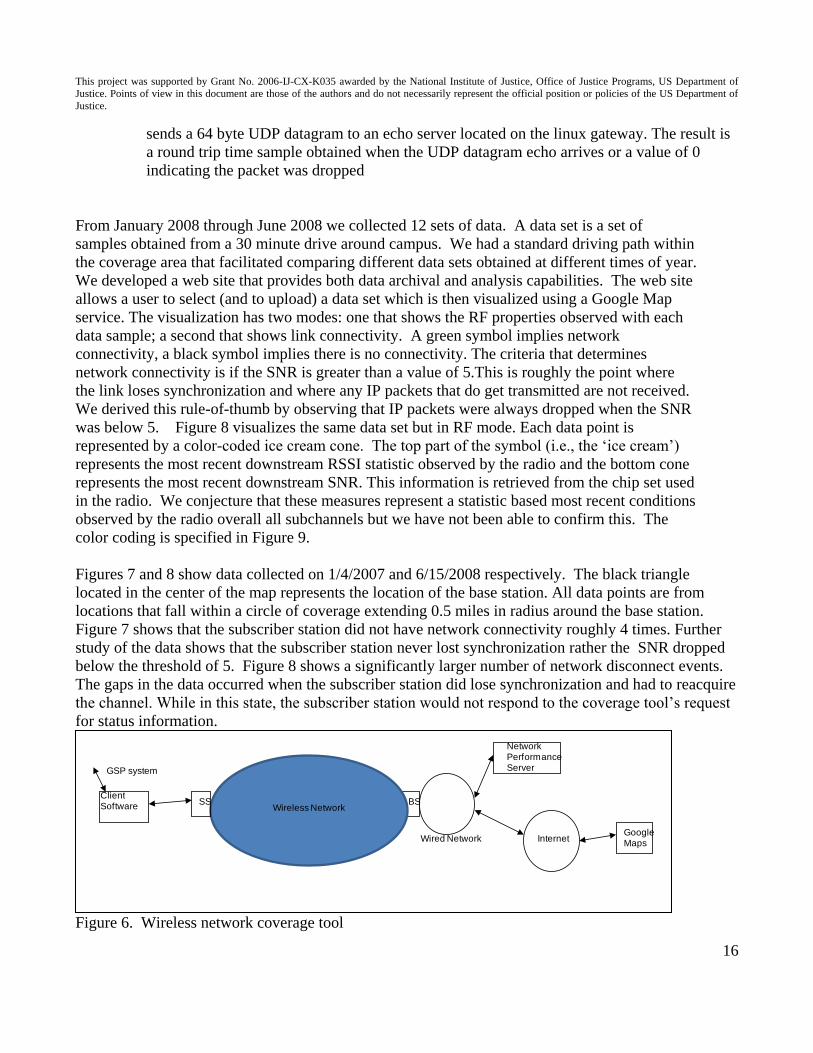
Figure 6. Wireless network coverage tool
Network PerformanceServer
GoogleMaps
BSWireless Network
Wired Network Internet
SSClient Software
GSP system
This project was supported by Grant No. 2006-IJ-CX-K035 awarded by the National Institute of Justice, Office of Justice Programs, US Department of
Justice. Points of view in this document are those of the authors and do not necessarily represent the official position or policies of the US Department of
Justice.
17
Figure 7. Coverage data from 1/4/2008
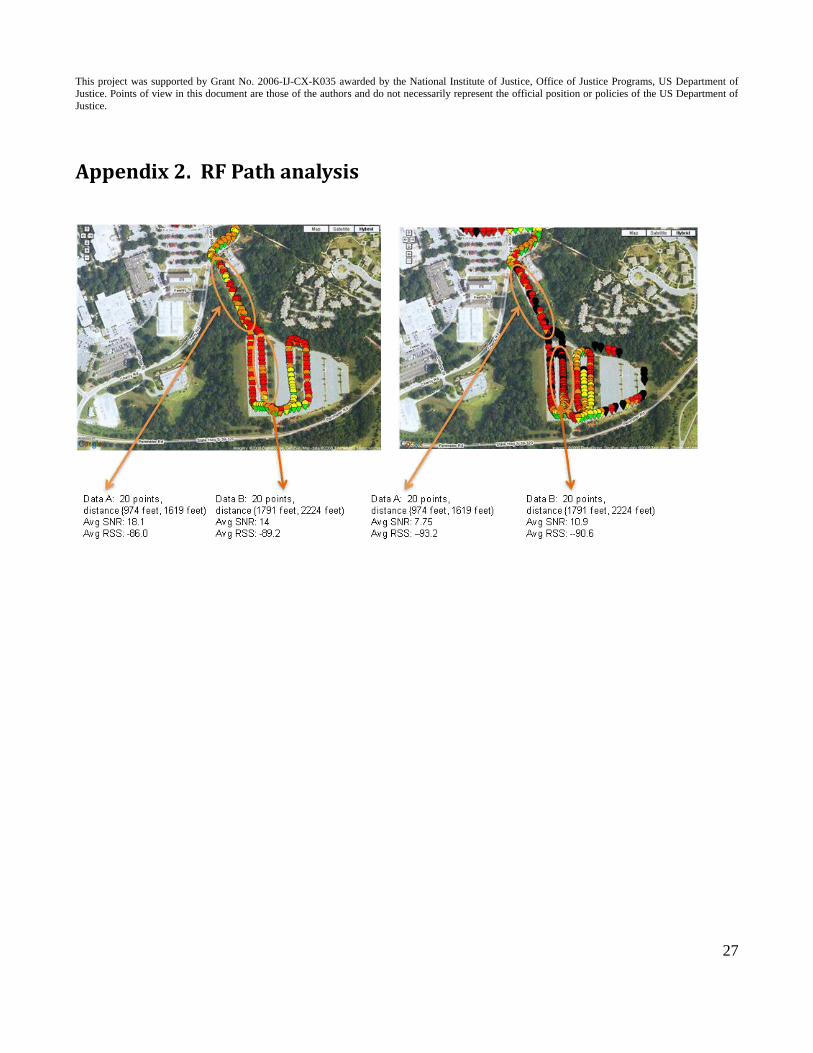
We focus on the data in the dashed rectangle shown in Figures 7 and 8. In particular, we look at two
portions of the path identified by a dashed and a solid line segment (Appendix 2 has further details).
The starting point of the dashed segment is 974 feet from the base station. The starting point of the
solid segment is 1790 feet from the base station. Table 6 shows the average SNR and received signal
strength (in dB) for the measurement samples associated with each path segment from both the January
and June data sets. The average receive signal level observed along the dashed segment dropped by 7.2
dB and the SNR dropped by 58% between January and June. The drop was less significant (1.4 dB and
22.1% respectively) for measurements taken over the solid segment. In January, the locations over the
dashed segment were partially obscured by tree branches with no leaves but heavily obscured by
foliage in June. The locations associated with the solid segment had clear line-of-sight in both January
and June.
This project was supported by Grant No. 2006-IJ-CX-K035 awarded by the National Institute of Justice, Office of Justice Programs, US Department of
Justice. Points of view in this document are those of the authors and do not necessarily represent the official position or policies of the US Department of
Justice.
18
Figure 8. Coverage data from 6/15/2008
Path
segment
1-4-2008
SNR | RSS
6-15-2008
SNR | RSS
Dashed 18.6 -86.0 7.75 -93.2Solid 14 -89.2 10.9 -90.6
Table 6. RF path analysis for January and June data
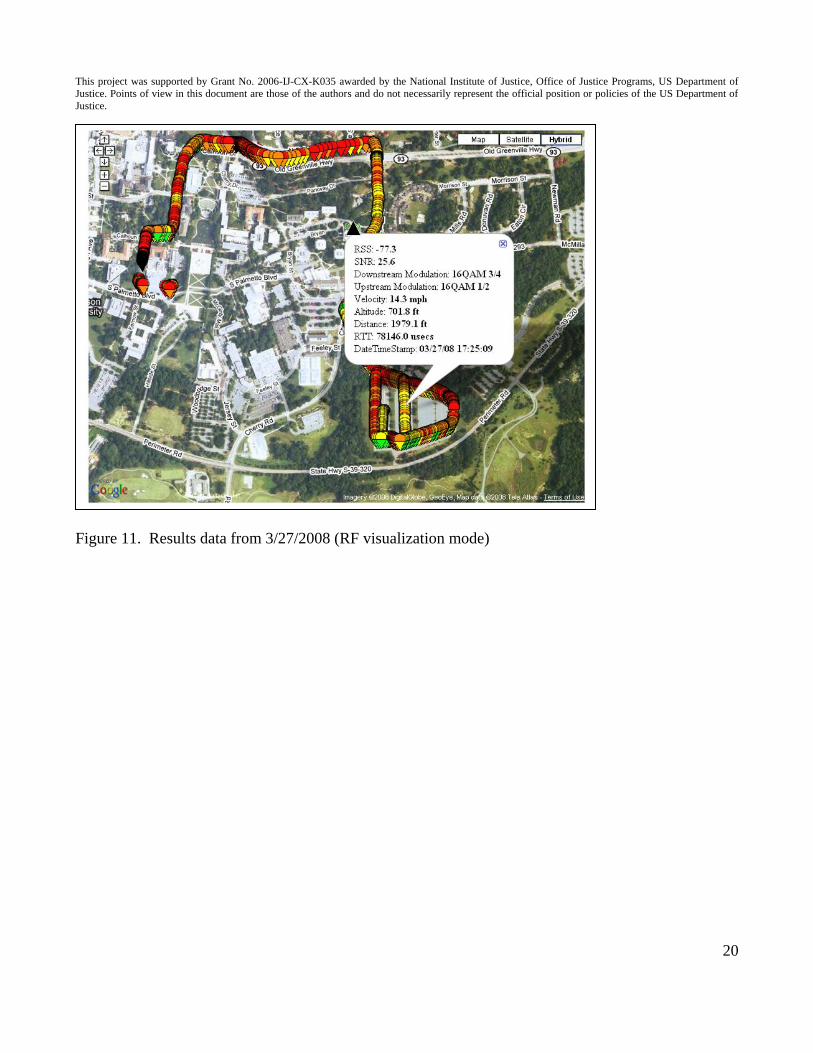
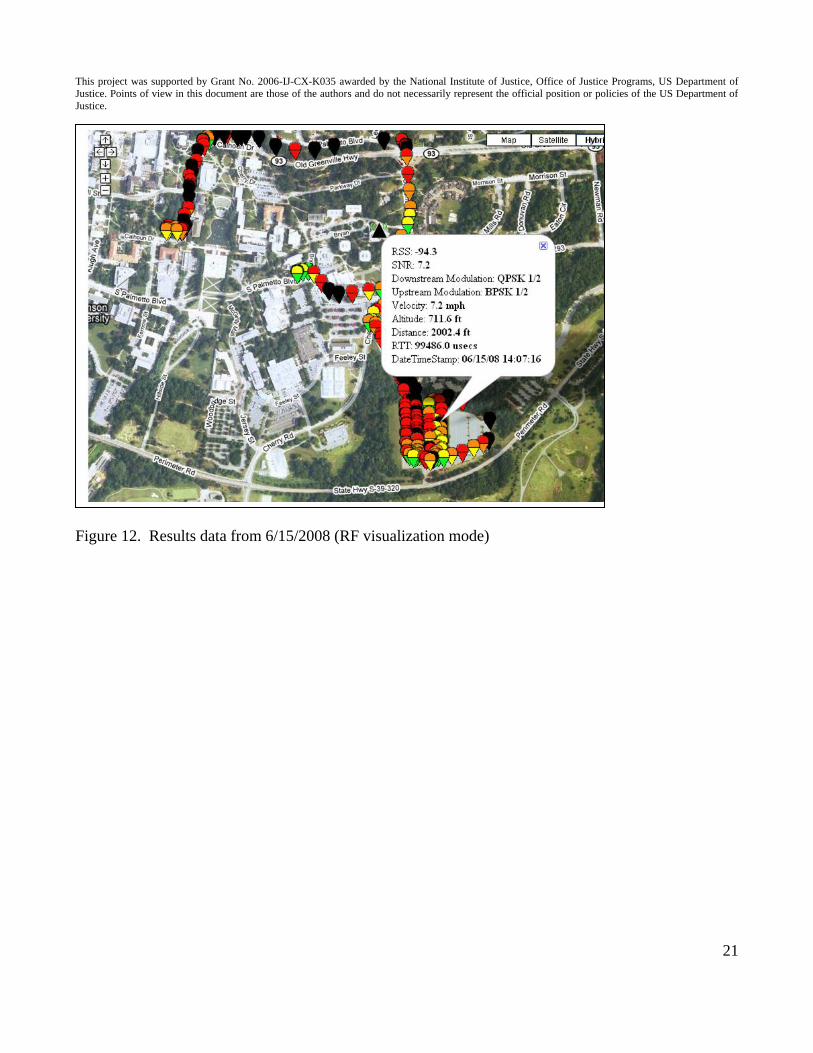
The Google Map capability allows a user to select a data point on the map and to see the „meta
data‟ associated with the data point. In Figures 10, 11, and 12 plot the data obtained on
1/4/2008, 3/27/2008 and 6/15/2008 respectively. Each figure shows a sample data point in each
data set from roughly the same location on campus. The coverage observed on 3/27/2008 was
similar to the coverage observed in data sets taken in January and February. The coverage on
6/15/2008 illustrates the significant impact that foliage has on RF propagation operating at 4.9
GHz. Further analysis is required to quantify the impact however roughly the propagation loss.
This project was supported by Grant No. 2006-IJ-CX-K035 awarded by the National Institute of Justice, Office of Justice Programs, US Department of
Justice. Points of view in this document are those of the authors and do not necessarily represent the official position or policies of the US Department of
Justice.
19
Figure 9. Visualization color coding
Figure 10. Results data from 14/2008 (RF visualization mode)
This project was supported by Grant No. 2006-IJ-CX-K035 awarded by the National Institute of Justice, Office of Justice Programs, US Department of
Justice. Points of view in this document are those of the authors and do not necessarily represent the official position or policies of the US Department of
Justice.
20
Figure 11. Results data from 3/27/2008 (RF visualization mode)
This project was supported by Grant No. 2006-IJ-CX-K035 awarded by the National Institute of Justice, Office of Justice Programs, US Department of
Justice. Points of view in this document are those of the authors and do not necessarily represent the official position or policies of the US Department of
Justice.
21
Figure 12. Results data from 6/15/2008 (RF visualization mode)
This project was supported by Grant No. 2006-IJ-CX-K035 awarded by the National Institute of Justice, Office of Justice Programs, US Department of
Justice. Points of view in this document are those of the authors and do not necessarily represent the official position or policies of the US Department of
Justice.
22
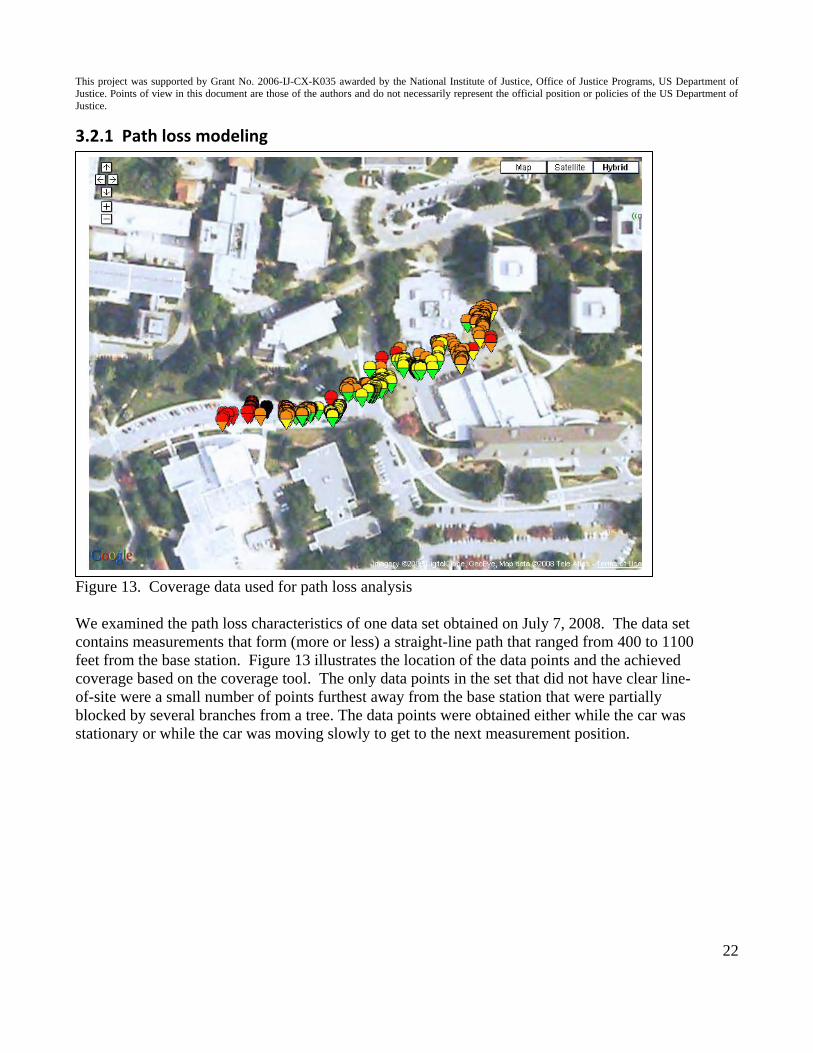
3.2.1 Path loss modeling
Figure 13. Coverage data used for path loss analysis
We examined the path loss characteristics of one data set obtained on July 7, 2008. The data set
contains measurements that form (more or less) a straight-line path that ranged from 400 to 1100
feet from the base station. Figure 13 illustrates the location of the data points and the achieved
coverage based on the coverage tool. The only data points in the set that did not have clear line-
of-site were a small number of points furthest away from the base station that were partially
blocked by several branches from a tree. The data points were obtained either while the car was
stationary or while the car was moving slowly to get to the next measurement position.
This project was supported by Grant No. 2006-IJ-CX-K035 awarded by the National Institute of Justice, Office of Justice Programs, US Department of
Justice. Points of view in this document are those of the authors and do not necessarily represent the official position or policies of the US Department of
Justice.
23
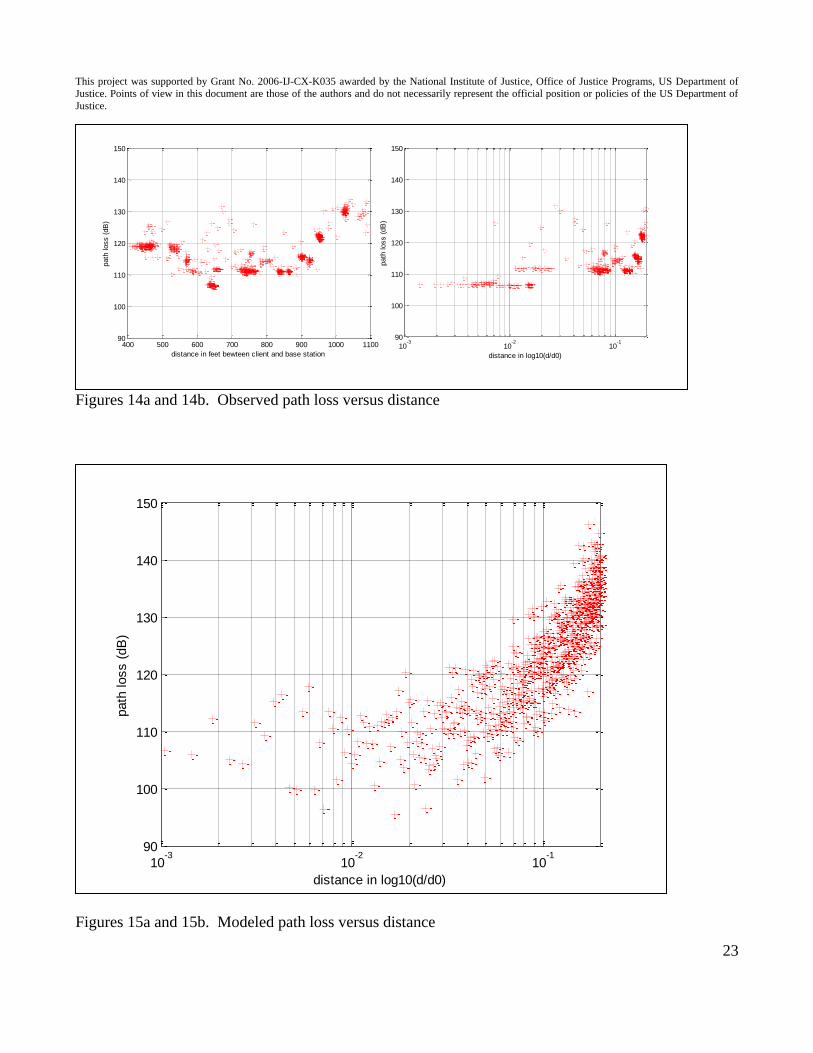
Figures 14a and 14b. Observed path loss versus distance
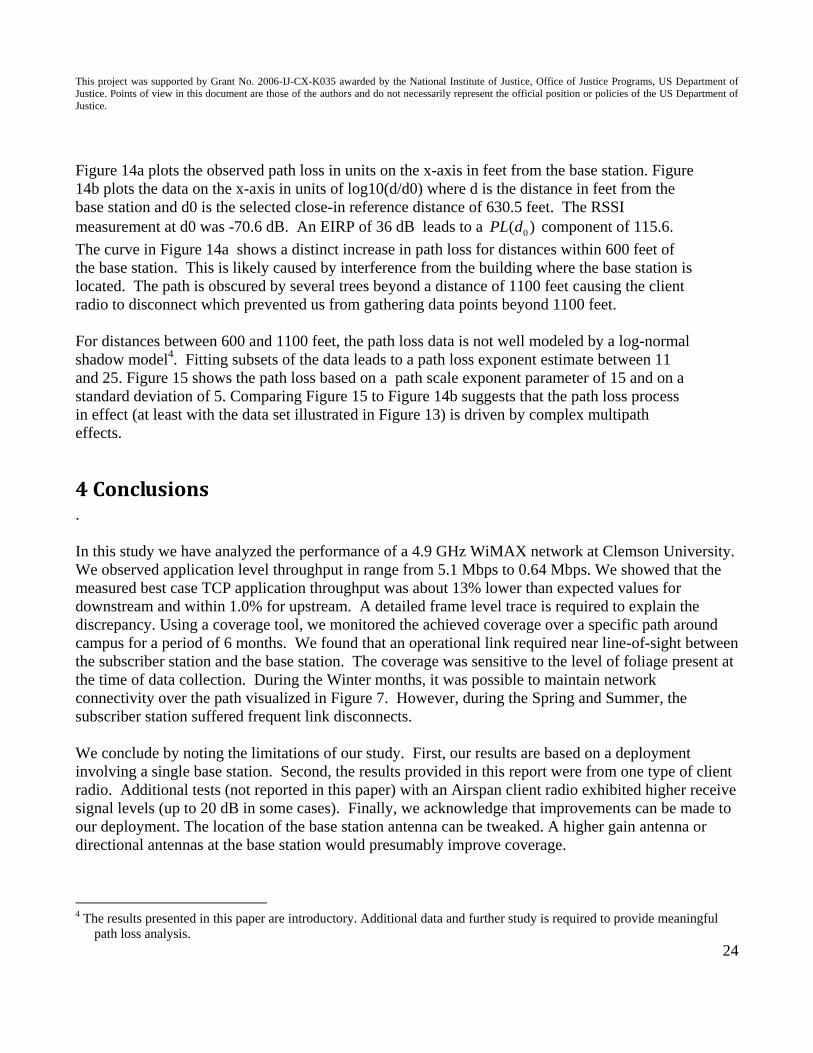
Figures 15a and 15b. Modeled path loss versus distance
400 500 600 700 800 900 1000 110090
100
110
120
130
140
150
distance in feet bewteen client and base station
path
loss (
dB
)
10-3
10-2
10-1
90
100
110
120
130
140
150
distance in log10(d/d0)
path
loss (
dB
)
10-3
10-2
10-1
90
100
110
120
130
140
150
distance in log10(d/d0)
path
loss (
dB
)
This project was supported by Grant No. 2006-IJ-CX-K035 awarded by the National Institute of Justice, Office of Justice Programs, US Department of
Justice. Points of view in this document are those of the authors and do not necessarily represent the official position or policies of the US Department of
Justice.
24
Figure 14a plots the observed path loss in units on the x-axis in feet from the base station. Figure
14b plots the data on the x-axis in units of log10(d/d0) where d is the distance in feet from the
base station and d0 is the selected close-in reference distance of 630.5 feet. The RSSI
measurement at d0 was -70.6 dB. An EIRP of 36 dB leads to a 0( )PL d component of 115.6.
The curve in Figure 14a shows a distinct increase in path loss for distances within 600 feet of
the base station. This is likely caused by interference from the building where the base station is
located. The path is obscured by several trees beyond a distance of 1100 feet causing the client
radio to disconnect which prevented us from gathering data points beyond 1100 feet.
For distances between 600 and 1100 feet, the path loss data is not well modeled by a log-normal
shadow model4. Fitting subsets of the data leads to a path loss exponent estimate between 11
and 25. Figure 15 shows the path loss based on a path scale exponent parameter of 15 and on a
standard deviation of 5. Comparing Figure 15 to Figure 14b suggests that the path loss process
in effect (at least with the data set illustrated in Figure 13) is driven by complex multipath
effects.
4 Conclusions .
In this study we have analyzed the performance of a 4.9 GHz WiMAX network at Clemson University.
We observed application level throughput in range from 5.1 Mbps to 0.64 Mbps. We showed that the
measured best case TCP application throughput was about 13% lower than expected values for
downstream and within 1.0% for upstream. A detailed frame level trace is required to explain the
discrepancy. Using a coverage tool, we monitored the achieved coverage over a specific path around
campus for a period of 6 months. We found that an operational link required near line-of-sight between
the subscriber station and the base station. The coverage was sensitive to the level of foliage present at
the time of data collection. During the Winter months, it was possible to maintain network
connectivity over the path visualized in Figure 7. However, during the Spring and Summer, the
subscriber station suffered frequent link disconnects.
We conclude by noting the limitations of our study. First, our results are based on a deployment
involving a single base station. Second, the results provided in this report were from one type of client
radio. Additional tests (not reported in this paper) with an Airspan client radio exhibited higher receive
signal levels (up to 20 dB in some cases). Finally, we acknowledge that improvements can be made to
our deployment. The location of the base station antenna can be tweaked. A higher gain antenna or
directional antennas at the base station would presumably improve coverage.
4 The results presented in this paper are introductory. Additional data and further study is required to provide meaningful
path loss analysis.
This project was supported by Grant No. 2006-IJ-CX-K035 awarded by the National Institute of Justice, Office of Justice Programs, US Department of
Justice. Points of view in this document are those of the authors and do not necessarily represent the official position or policies of the US Department of
Justice.
25
References [802.16A] IEEE 802.16-2004, IEEE Standard for Local and Metropolitan Area Networks Part
16: Air Interface for Fixed Broadband Wireless Access Systems, 7/2004.
[802.16B] 802.16E-2005 &802.16/COR1 IEEE Standard for Local and metropolitan area
networks Part 16: Air Interface for Fixed and Mobile Broadband Wireless Access Systems
Amendment for Physical and Medium Access Control Layers for Combined Fixed and Mobile
Operation in Licensed Bands, 2/2006.
[ForumApps] “Fixed, nomadic, portable and mobile applications for 802.16-2004 and 802.16e
WiMAX Networks”, WiMAX Forum report, 11/2005.
[GPSD] The GPS Daemon, available at http://gpsd.berlios.de/#downloads
[iperf[ The Internet Performance Tool, available at http://dast.nlanr.net/Projects/Iperf/
[WiMAXForum] The WiMAX Forum, http://www.wimaxforum.org
[Motorola05] 4.9 GHz Public Safety Broadband Spectrum, Overview of Technical Rules and
Licensing Instructions, available at: http://www.apco911.org/frequency/4-
9GHz/documents/Motorola_4.9_GHz_White_Paper_06-13-2005.pdf
[Rapp02] Wireless Communications, T. Rappaport, Prentice Hall, 2002.
This project was supported by Grant No. 2006-IJ-CX-K035 awarded by the National Institute of Justice, Office of Justice Programs, US Department of
Justice. Points of view in this document are those of the authors and do not necessarily represent the official position or policies of the US Department of
Justice.
26
Appendix 1. 4.9 GHz Profile supported by M/A-COM’s Vida Equipment5
Operating Frequency: 4.9 GHz
Duplex: TDD
Channel Bandwidth 5MHz
Modulation: OFDM 256 FFT
Frame duration: 10 milliseconds
Max BS Transmitter Power: 27dBm max
Base Station Rx sensitivity
-96dBm BPSK ½
-91dBm QPSK ¾
-85dBm 16QAM 3/4
Max Client Power
Low power unit: .1 watts, +20dBm at QPSK/16QAM
High power unit: .5 watts, + 27dBm at QPSK/16QAM
Client Station Rx sensitivity
-96dBm BPSK ½
-91dBm QPSK ¾
-85dBm 16QAM 3/4
M/A-COM VidaWiMAX gear is 5 Mhz. OFDM multiplexing is used and the subchannels are
allocated as follows6
256 Total subchannels
8 "Pilot" channels used to establish/maintain physical layer synchronization
192 Data channels
56 Channels used as some manner of guard bands.
Each subchannel has a bandwidth of 5 Mhz / 256 channels = 19.531 Khz.
5 The M/A-COM base station specification is located at http://www.macom-
wireless.com/products/broadband/datasheets/7403.pdf 6 The M/A-COM base station does not support subchannelization. When a protocol data unit (PDU) is
transmit, all subchannels are dedicated to the single burst.
This project was supported by Grant No. 2006-IJ-CX-K035 awarded by the National Institute of Justice, Office of Justice Programs, US Department of
Justice. Points of view in this document are those of the authors and do not necessarily represent the official position or policies of the US Department of
Justice.
27
Appendix 2. RF Path analysis


![IEEE 802.16: WiMAX Overview, WiMAX · PDF filevs. 3G. The common Misconceptions about WiMAX & 3G CDMA are [5]: 1) Cost . c. ... IEEE 802.16: WiMAX Overview, WiMAX Architecture . Mojtaba](https://img.pdfslide.us/doc/110x75/5a752f217f8b9ad22a8c6f07/ieee-80216-wimax-overview-wimax-architecture-vs-3g-the-common-misconceptions.jpg)