Embed Size (px)
Citation preview
CURE-TSR: Challenging Unreal and RealEnvironments for Traffic Sign Recognition
Dogancan Temel, Gukyeong Kwon ∗, Mohit Prabhushankar∗, and Ghassan AlRegibGeorgia Institute of Technology
Center for Signal and Information Processing{cantemel, gukyeong.kwon, mohit.p, alregib}@gatech.edu
Abstract
In this paper, we investigate the robustness of traffic sign recognition algorithmsunder challenging conditions. Existing datasets are limited in terms of their size andchallenging condition coverage, which motivated us to generate the ChallengingUnreal and Real Environments for Traffic Sign Recognition (CURE-TSR) dataset.It includes more than two million traffic sign images that are based on real-worldand simulator data. We benchmark the performance of existing solutions in real-world scenarios and analyze the performance variation with respect to challengingconditions. We show that challenging conditions can decrease the performance ofbaseline methods significantly, especially if these challenging conditions result inloss or misplacement of spatial information. We also investigate the effect of dataaugmentation and show that utilization of simulator data along with real-world dataenhance the average recognition performance in real-world scenarios. The datasetis publicly available at https://ghassanalregib.com/cure-tsr/.
1 Introduction
Autonomous vehicles are transforming existing transportation systems. As we step up the ladder ofautonomy, more critical functions are performed by algorithms, which demands more robustness.In case of following traffic rules, robust sign recognition systems are essential unless we have priorinformation about traffic sign types and locations. It is a common practice to test the robustnessof these systems with traffic datasets [1, 2, 3, 4, 5, 6, 7, 8, 9, 10]. However, majority of thesedatasets are limited in terms of challenging environmental conditions. There is usually no metadatacorresponding to challenging conditions or levels in these datasets, which are also limited in terms ofdataset size. Moreover, the relationship between challenging conditions and algorithmic performanceis not analyzed in these studies. Lu et al. [11] investigated the traffic sign detection performancewith respect to challenging adversarial examples and showed that adversarial perturbations areeffective only in specific situations. Das et al. [12] showed the vulnerabilities of existing systemsand suggested JPEG compression to eliminate adversarial effects. Even though both of these studiesanalyze algorithmic performance variation with respect to specific challenging situations, adversarialexamples are inherently different from realistic challenging scenarios.
In this paper, we investigate the traffic sign recognition performance of commonly used methods underrealistic challenging conditions. To eliminate the shortcomings of existing datasets, we introduce theChallenging Unreal and Real Environments for Traffic Sign Recognition (CURE-TSR) dataset. Thecontributions of this paper are 4 folds.
• We introduce the most comprehensive publicly-available traffic sign recognition datasetwith controlled challenging conditions.
∗Equal contribution.
31st Conference on Neural Information Processing Systems (NIPS 2017), Long Beach, CA, USA.
arX
iv:1
712.
0246
3v1
[cs
.CV
] 7
Dec
201
7
• We provide a detailed analysis of the benchmarked algorithms in terms of their recognitionperformance under challenging conditions. Based on this analysis, we identify the vulnera-bilities of algorithms with respect to challenging conditions, which should give insights intothe use of such models under certain conditions.
• We provide images that originate from captured sequences as well as synthesized sequences,which would lead to a better understanding of similarities/differences between real-worldand simulator data in terms of algorithmic performance. This understanding can be utilizedto generate more realistic datasets and minimize the need for real-world data collection thatrequires significant resources.
• We use diverse data augmentation methods and show that utilization of limited simulatordata along with real-world data can enhance the recognition performance. This observationshows that simulated environments can enhance the performance of data-driven methods inreal-world scenarios even when there is a difference between target and source domains.
2 Dataset
Timofte et al. [3] introduced the Belgium traffic sign classification (BelgiumTSC) dataset whoseimages were acquired with a van that had 8 roof-mounted cameras. Acquisition vehicle cruised instreets of Belgium and images were captured every meter. A subset of these images were selectedand traffic signs were cropped to obtain the BelgiumTSC dataset. Stallkamp et al. [6, 7] introducedthe German traffic sign recognition benchmark (GTSRB) dataset, which was acquired during daytimein Germany. Each traffic sign instance in the dataset is adjusted to have 30 images. BelgiumTSC andGTSRB datasets are limited in terms of challenging environmental conditions and they do not includemetadata related to the type of challenging conditions or their levels. Because of limited control in dataacquisition setup, it is not possible to perform controlled experiments with these datasets. The totalnumber of annotated signs including BelgiumTSC and GTSRB datasets is around 60, 000, which maynot be sufficient to test the robustness of recognition algorithms comprehensively. To compensatethe shortcomings in the literature, we introduce the CURE-TSR dataset. Main characteristics ofBelgiumTSC, GTSRB, and CURE-TSR datasets are summarized in Table 1.
Table 1: Main characteristics of BelgiumTSC, GTSRB, and CURE-TSR datasets.
Dataset Number ofimages
Number ofannotated
images
Number ofsign types
Signsize
Origin ofthe videos
Acquisitiondevice
BelgiumTSC[13]
7,095 -7,125
Allimages 62 11x10 to
562x438
Capturedin
Belgium
Colorcameras
GTSRB[14]
133,000 -144,769 51,840 43 15x15 to
250x250
Capturedin
Germany
Prosilica GC1380CH
color camera
CURE-TSR[15] 2,206,106 All
images 14 3x7 to206x277
Captured inBelgium andGenerated in
Unreal Engine 4
Colorcameras
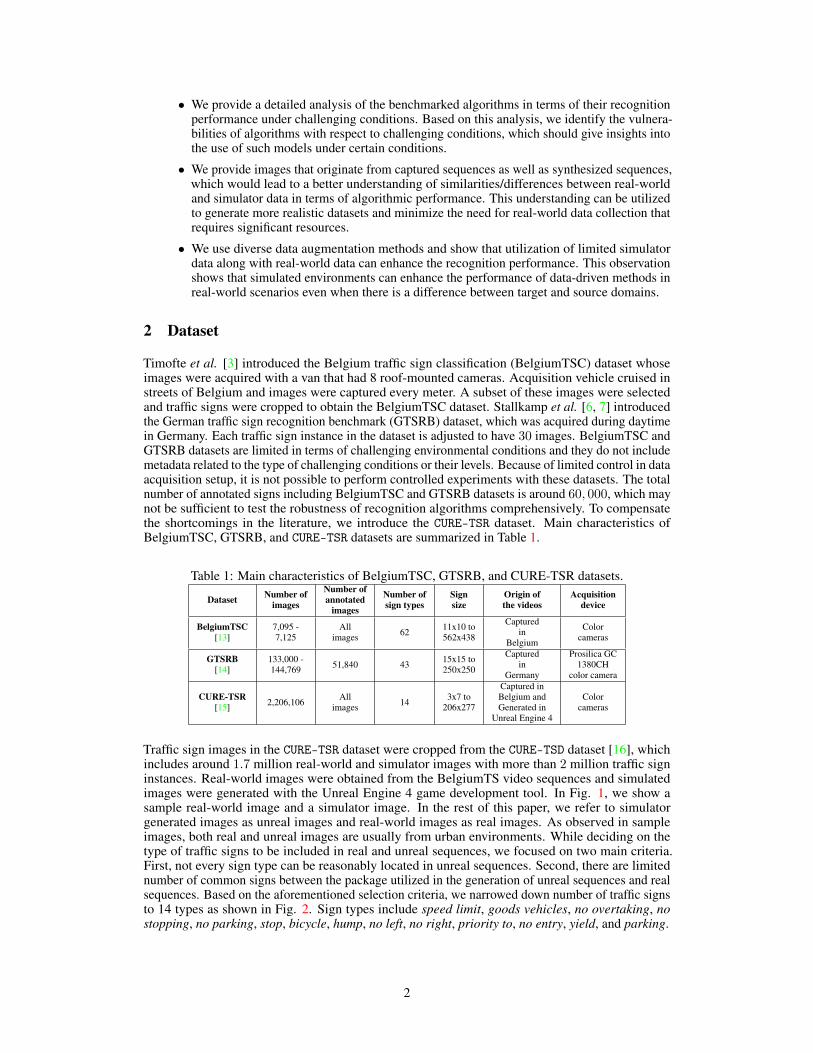
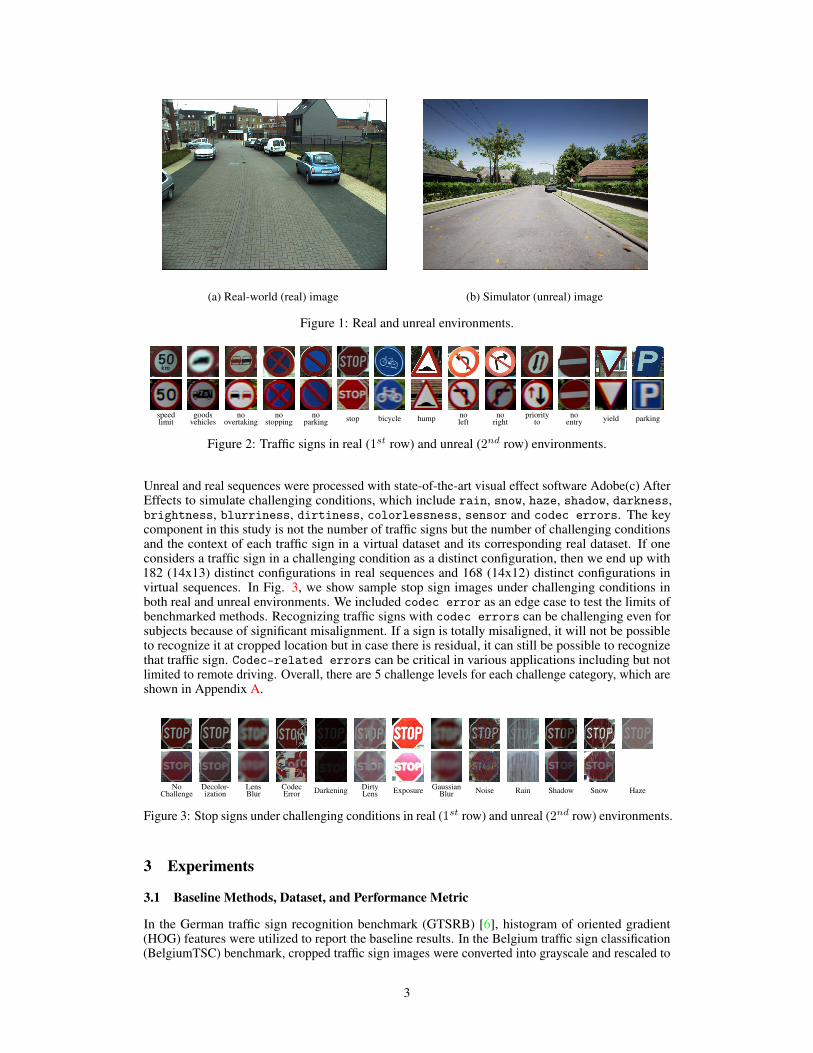
Traffic sign images in the CURE-TSR dataset were cropped from the CURE-TSD dataset [16], whichincludes around 1.7 million real-world and simulator images with more than 2 million traffic signinstances. Real-world images were obtained from the BelgiumTS video sequences and simulatedimages were generated with the Unreal Engine 4 game development tool. In Fig. 1, we show asample real-world image and a simulator image. In the rest of this paper, we refer to simulatorgenerated images as unreal images and real-world images as real images. As observed in sampleimages, both real and unreal images are usually from urban environments. While deciding on thetype of traffic signs to be included in real and unreal sequences, we focused on two main criteria.First, not every sign type can be reasonably located in unreal sequences. Second, there are limitednumber of common signs between the package utilized in the generation of unreal sequences and realsequences. Based on the aforementioned selection criteria, we narrowed down number of traffic signsto 14 types as shown in Fig. 2. Sign types include speed limit, goods vehicles, no overtaking, nostopping, no parking, stop, bicycle, hump, no left, no right, priority to, no entry, yield, and parking.
2
(a) Real-world (real) image (b) Simulator (unreal) image
Figure 1: Real and unreal environments.
speed goods no no no stop bicycle hump no no priority no yield parkinglimit vehicles overtaking stopping parking left right to entry
Figure 2: Traffic signs in real (1st row) and unreal (2nd row) environments.
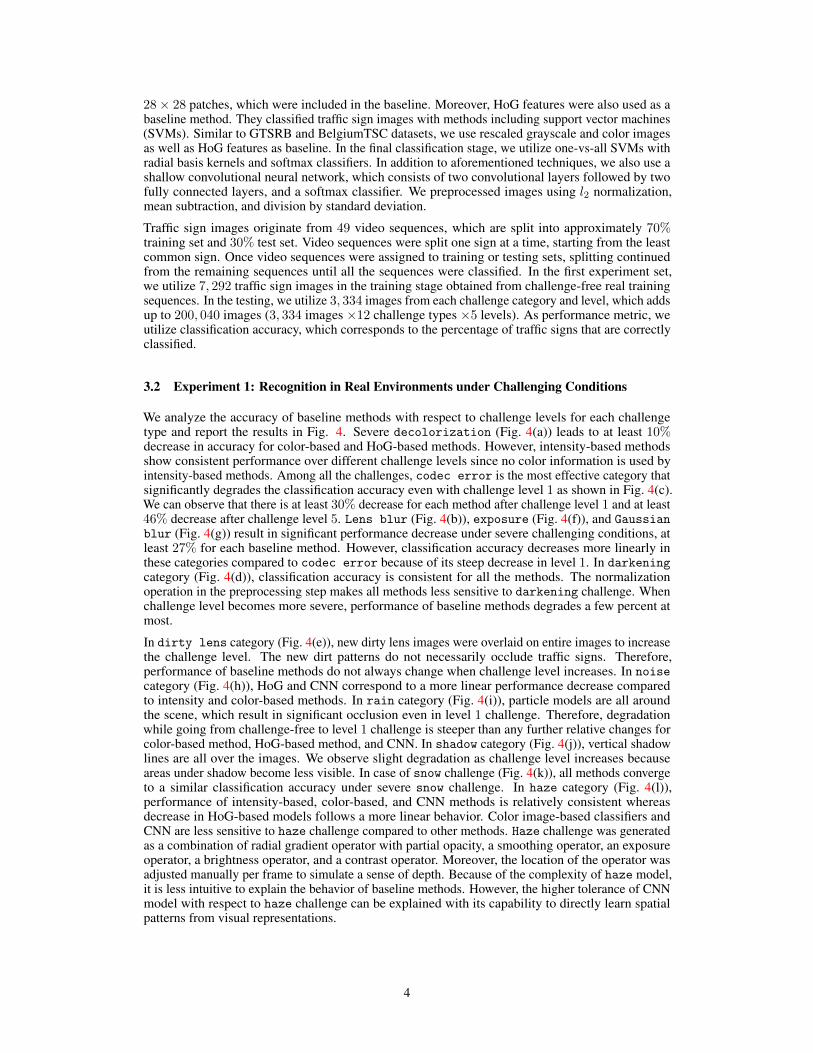
Unreal and real sequences were processed with state-of-the-art visual effect software Adobe(c) AfterEffects to simulate challenging conditions, which include rain, snow, haze, shadow, darkness,brightness, blurriness, dirtiness, colorlessness, sensor and codec errors. The keycomponent in this study is not the number of traffic signs but the number of challenging conditionsand the context of each traffic sign in a virtual dataset and its corresponding real dataset. If oneconsiders a traffic sign in a challenging condition as a distinct configuration, then we end up with182 (14x13) distinct configurations in real sequences and 168 (14x12) distinct configurations invirtual sequences. In Fig. 3, we show sample stop sign images under challenging conditions inboth real and unreal environments. We included codec error as an edge case to test the limits ofbenchmarked methods. Recognizing traffic signs with codec errors can be challenging even forsubjects because of significant misalignment. If a sign is totally misaligned, it will not be possibleto recognize it at cropped location but in case there is residual, it can still be possible to recognizethat traffic sign. Codec-related errors can be critical in various applications including but notlimited to remote driving. Overall, there are 5 challenge levels for each challenge category, which areshown in Appendix A.
No Decolor- Lens Codec Darkening Dirty Exposure Gaussian Noise Rain Shadow Snow HazeChallenge ization Blur Error Lens Blur
Figure 3: Stop signs under challenging conditions in real (1st row) and unreal (2nd row) environments.
3 Experiments
3.1 Baseline Methods, Dataset, and Performance Metric
In the German traffic sign recognition benchmark (GTSRB) [6], histogram of oriented gradient(HOG) features were utilized to report the baseline results. In the Belgium traffic sign classification(BelgiumTSC) benchmark, cropped traffic sign images were converted into grayscale and rescaled to
3
28× 28 patches, which were included in the baseline. Moreover, HoG features were also used as abaseline method. They classified traffic sign images with methods including support vector machines(SVMs). Similar to GTSRB and BelgiumTSC datasets, we use rescaled grayscale and color imagesas well as HoG features as baseline. In the final classification stage, we utilize one-vs-all SVMs withradial basis kernels and softmax classifiers. In addition to aforementioned techniques, we also use ashallow convolutional neural network, which consists of two convolutional layers followed by twofully connected layers, and a softmax classifier. We preprocessed images using l2 normalization,mean subtraction, and division by standard deviation.
Traffic sign images originate from 49 video sequences, which are split into approximately 70%training set and 30% test set. Video sequences were split one sign at a time, starting from the leastcommon sign. Once video sequences were assigned to training or testing sets, splitting continuedfrom the remaining sequences until all the sequences were classified. In the first experiment set,we utilize 7, 292 traffic sign images in the training stage obtained from challenge-free real trainingsequences. In the testing, we utilize 3, 334 images from each challenge category and level, which addsup to 200, 040 images (3, 334 images ×12 challenge types ×5 levels). As performance metric, weutilize classification accuracy, which corresponds to the percentage of traffic signs that are correctlyclassified.
3.2 Experiment 1: Recognition in Real Environments under Challenging Conditions
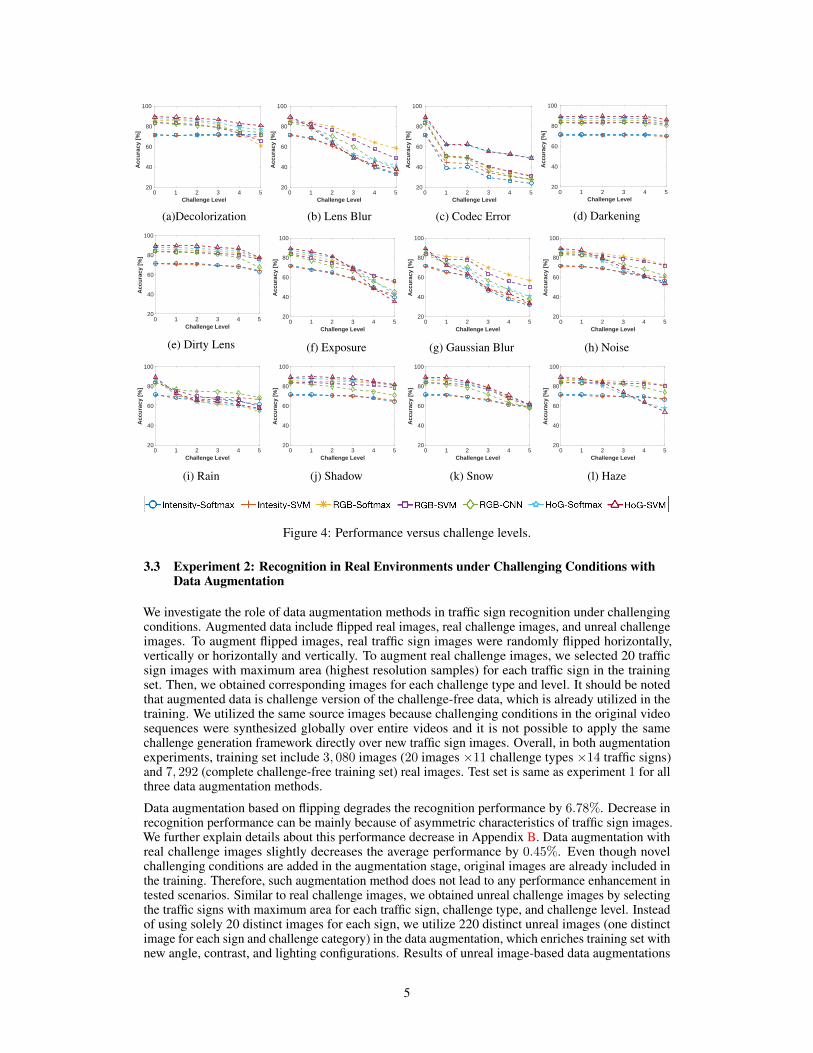
We analyze the accuracy of baseline methods with respect to challenge levels for each challengetype and report the results in Fig. 4. Severe decolorization (Fig. 4(a)) leads to at least 10%decrease in accuracy for color-based and HoG-based methods. However, intensity-based methodsshow consistent performance over different challenge levels since no color information is used byintensity-based methods. Among all the challenges, codec error is the most effective category thatsignificantly degrades the classification accuracy even with challenge level 1 as shown in Fig. 4(c).We can observe that there is at least 30% decrease for each method after challenge level 1 and at least46% decrease after challenge level 5. Lens blur (Fig. 4(b)), exposure (Fig. 4(f)), and Gaussianblur (Fig. 4(g)) result in significant performance decrease under severe challenging conditions, atleast 27% for each baseline method. However, classification accuracy decreases more linearly inthese categories compared to codec error because of its steep decrease in level 1. In darkeningcategory (Fig. 4(d)), classification accuracy is consistent for all the methods. The normalizationoperation in the preprocessing step makes all methods less sensitive to darkening challenge. Whenchallenge level becomes more severe, performance of baseline methods degrades a few percent atmost.
In dirty lens category (Fig. 4(e)), new dirty lens images were overlaid on entire images to increasethe challenge level. The new dirt patterns do not necessarily occlude traffic signs. Therefore,performance of baseline methods do not always change when challenge level increases. In noisecategory (Fig. 4(h)), HoG and CNN correspond to a more linear performance decrease comparedto intensity and color-based methods. In rain category (Fig. 4(i)), particle models are all aroundthe scene, which result in significant occlusion even in level 1 challenge. Therefore, degradationwhile going from challenge-free to level 1 challenge is steeper than any further relative changes forcolor-based method, HoG-based method, and CNN. In shadow category (Fig. 4(j)), vertical shadowlines are all over the images. We observe slight degradation as challenge level increases becauseareas under shadow become less visible. In case of snow challenge (Fig. 4(k)), all methods convergeto a similar classification accuracy under severe snow challenge. In haze category (Fig. 4(l)),performance of intensity-based, color-based, and CNN methods is relatively consistent whereasdecrease in HoG-based models follows a more linear behavior. Color image-based classifiers andCNN are less sensitive to haze challenge compared to other methods. Haze challenge was generatedas a combination of radial gradient operator with partial opacity, a smoothing operator, an exposureoperator, a brightness operator, and a contrast operator. Moreover, the location of the operator wasadjusted manually per frame to simulate a sense of depth. Because of the complexity of haze model,it is less intuitive to explain the behavior of baseline methods. However, the higher tolerance of CNNmodel with respect to haze challenge can be explained with its capability to directly learn spatialpatterns from visual representations.
4
0 1 2 3 4 5Challenge Level
20
40
60
80
100
Acc
ura
cy [
%]
(a)Decolorization
0 1 2 3 4 5Challenge Level
20
40
60
80
100
Acc
ura
cy [
%]
(b) Lens Blur
0 1 2 3 4 5Challenge Level
20
40
60
80
100
Acc
ura
cy [
%]
(c) Codec Error
0 1 2 3 4 5Challenge Level
20
40
60
80
100
Acc
ura
cy [
%]
(d) Darkening
0 1 2 3 4 5Challenge Level
20
40
60
80
100
Acc
ura
cy [
%]
(e) Dirty Lens
0 1 2 3 4 5Challenge Level
20
40
60
80
100
Acc
ura
cy [
%]
(f) Exposure
0 1 2 3 4 5Challenge Level
20
40
60
80
100
Acc
ura
cy [
%]
(g) Gaussian Blur
0 1 2 3 4 5Challenge Level
20
40
60
80
100
Acc
ura
cy [
%]
(h) Noise
0 1 2 3 4 5Challenge Level
20
40
60
80
100
Acc
ura
cy [
%]
(i) Rain
0 1 2 3 4 5Challenge Level
20
40
60
80
100
Acc
ura
cy [
%]
(j) Shadow
0 1 2 3 4 5Challenge Level
20
40
60
80
100
Acc
ura
cy [
%]
(k) Snow
0 1 2 3 4 5Challenge Level
20
40
60
80
100
Acc
ura
cy [
%]
(l) Haze
Figure 4: Performance versus challenge levels.
3.3 Experiment 2: Recognition in Real Environments under Challenging Conditions withData Augmentation
We investigate the role of data augmentation methods in traffic sign recognition under challengingconditions. Augmented data include flipped real images, real challenge images, and unreal challengeimages. To augment flipped images, real traffic sign images were randomly flipped horizontally,vertically or horizontally and vertically. To augment real challenge images, we selected 20 trafficsign images with maximum area (highest resolution samples) for each traffic sign in the trainingset. Then, we obtained corresponding images for each challenge type and level. It should be notedthat augmented data is challenge version of the challenge-free data, which is already utilized in thetraining. We utilized the same source images because challenging conditions in the original videosequences were synthesized globally over entire videos and it is not possible to apply the samechallenge generation framework directly over new traffic sign images. Overall, in both augmentationexperiments, training set include 3, 080 images (20 images ×11 challenge types ×14 traffic signs)and 7, 292 (complete challenge-free training set) real images. Test set is same as experiment 1 for allthree data augmentation methods.
Data augmentation based on flipping degrades the recognition performance by 6.78%. Decrease inrecognition performance can be mainly because of asymmetric characteristics of traffic sign images.We further explain details about this performance decrease in Appendix B. Data augmentation withreal challenge images slightly decreases the average performance by 0.45%. Even though novelchallenging conditions are added in the augmentation stage, original images are already included inthe training. Therefore, such augmentation method does not lead to any performance enhancement intested scenarios. Similar to real challenge images, we obtained unreal challenge images by selectingthe traffic signs with maximum area for each traffic sign, challenge type, and challenge level. Insteadof using solely 20 distinct images for each sign, we utilize 220 distinct unreal images (one distinctimage for each sign and challenge category) in the data augmentation, which enriches training set withnew angle, contrast, and lighting configurations. Results of unreal image-based data augmentations
5
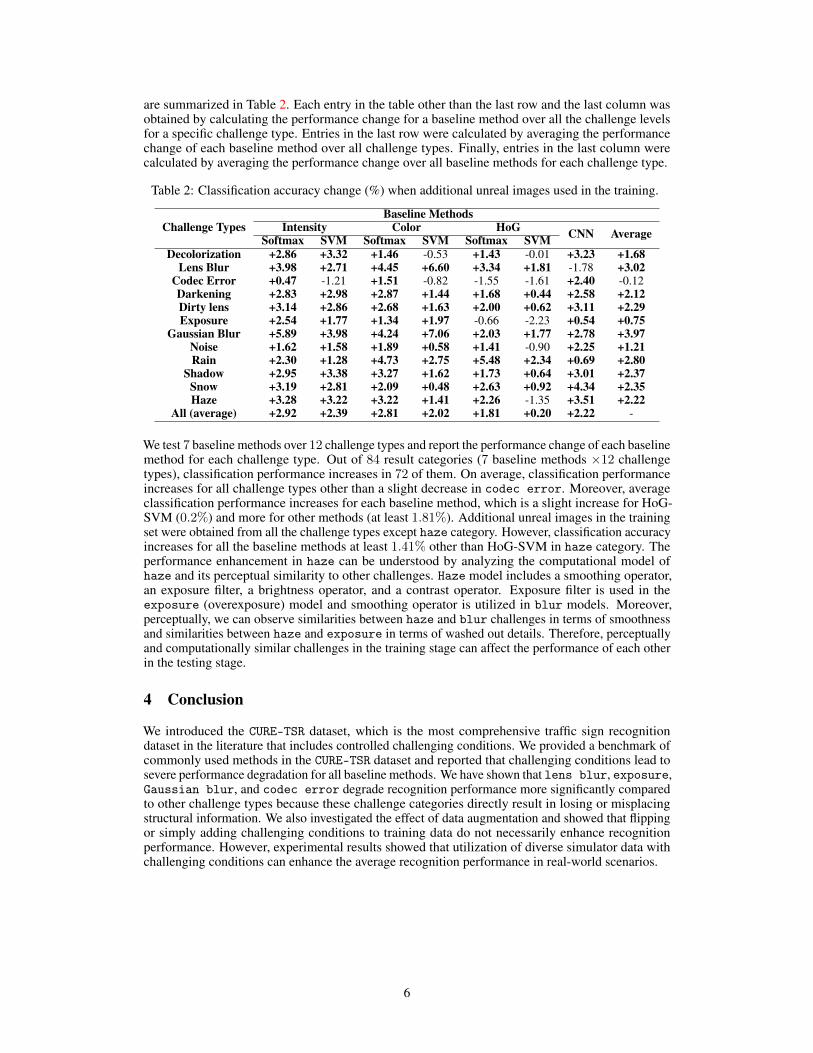
are summarized in Table 2. Each entry in the table other than the last row and the last column wasobtained by calculating the performance change for a baseline method over all the challenge levelsfor a specific challenge type. Entries in the last row were calculated by averaging the performancechange of each baseline method over all challenge types. Finally, entries in the last column werecalculated by averaging the performance change over all baseline methods for each challenge type.
Table 2: Classification accuracy change (%) when additional unreal images used in the training.
Challenge TypesBaseline Methods
Intensity Color HoG CNN AverageSoftmax SVM Softmax SVM Softmax SVMDecolorization +2.86 +3.32 +1.46 -0.53 +1.43 -0.01 +3.23 +1.68
Lens Blur +3.98 +2.71 +4.45 +6.60 +3.34 +1.81 -1.78 +3.02Codec Error +0.47 -1.21 +1.51 -0.82 -1.55 -1.61 +2.40 -0.12Darkening +2.83 +2.98 +2.87 +1.44 +1.68 +0.44 +2.58 +2.12Dirty lens +3.14 +2.86 +2.68 +1.63 +2.00 +0.62 +3.11 +2.29Exposure +2.54 +1.77 +1.34 +1.97 -0.66 -2.23 +0.54 +0.75
Gaussian Blur +5.89 +3.98 +4.24 +7.06 +2.03 +1.77 +2.78 +3.97Noise +1.62 +1.58 +1.89 +0.58 +1.41 -0.90 +2.25 +1.21Rain +2.30 +1.28 +4.73 +2.75 +5.48 +2.34 +0.69 +2.80
Shadow +2.95 +3.38 +3.27 +1.62 +1.73 +0.64 +3.01 +2.37Snow +3.19 +2.81 +2.09 +0.48 +2.63 +0.92 +4.34 +2.35Haze +3.28 +3.22 +3.22 +1.41 +2.26 -1.35 +3.51 +2.22
All (average) +2.92 +2.39 +2.81 +2.02 +1.81 +0.20 +2.22 -
We test 7 baseline methods over 12 challenge types and report the performance change of each baselinemethod for each challenge type. Out of 84 result categories (7 baseline methods ×12 challengetypes), classification performance increases in 72 of them. On average, classification performanceincreases for all challenge types other than a slight decrease in codec error. Moreover, averageclassification performance increases for each baseline method, which is a slight increase for HoG-SVM (0.2%) and more for other methods (at least 1.81%). Additional unreal images in the trainingset were obtained from all the challenge types except haze category. However, classification accuracyincreases for all the baseline methods at least 1.41% other than HoG-SVM in haze category. Theperformance enhancement in haze can be understood by analyzing the computational model ofhaze and its perceptual similarity to other challenges. Haze model includes a smoothing operator,an exposure filter, a brightness operator, and a contrast operator. Exposure filter is used in theexposure (overexposure) model and smoothing operator is utilized in blur models. Moreover,perceptually, we can observe similarities between haze and blur challenges in terms of smoothnessand similarities between haze and exposure in terms of washed out details. Therefore, perceptuallyand computationally similar challenges in the training stage can affect the performance of each otherin the testing stage.
4 Conclusion
We introduced the CURE-TSR dataset, which is the most comprehensive traffic sign recognitiondataset in the literature that includes controlled challenging conditions. We provided a benchmark ofcommonly used methods in the CURE-TSR dataset and reported that challenging conditions lead tosevere performance degradation for all baseline methods. We have shown that lens blur, exposure,Gaussian blur, and codec error degrade recognition performance more significantly comparedto other challenge types because these challenge categories directly result in losing or misplacingstructural information. We also investigated the effect of data augmentation and showed that flippingor simply adding challenging conditions to training data do not necessarily enhance recognitionperformance. However, experimental results showed that utilization of diverse simulator data withchallenging conditions can enhance the average recognition performance in real-world scenarios.
6
References[1] C. Grigorescu and N. Petkov. Distance sets for shape filters and shape recognition. IEEE Trans.
Image Proces., 12(10):1274–1286, Oct 2003.
[2] R. Timofte, K. Zimmermann, and L. V. Gool. Multi-view traffic sign detection, recognition,and 3D localisation. In WACV, pages 1–8, Dec 2009.
[3] R. Timofte, K. Zimmermann, and L. Van Gool. Multi-view traffic sign detection, recognition,and 3D localisation. Mach. Vis. App., 25(3):633–647, 2014.
[4] R. Belaroussi, P. Foucher, J. P. Tarel, B. Soheilian, P. Charbonnier, and N. Paparoditis. Roadsign detection in images: A case study. In Proc. ICPR, pages 484–488, Aug 2010.
[5] F. Larsson and M. ‘ Felsberg. Using fourier descriptors and spatial models for traffic signrecognition. In Proc. SCIA, SCIA’11, pages 238–249, Berlin, Heidelberg, 2011. Springer-Verlag.
[6] J. Stallkamp, M. Schlipsing, J. Salmen, and C. Igel. The German Traffic Sign RecognitionBenchmark: A multi-class classification competition. In Proc. IJCNN, pages 1453–1460, July2011.
[7] J. Stallkamp, M. Schlipsing, J. Salmen, and C. Igel. Man versus computer: Benchmarkingmachine learning algorithms for traffic sign recognition . Neural Networks, 32:323 – 332, 2012.Selected Papers from IJCNN 2011.
[8] S. Houben, J. Stallkamp, J. Salmen, M. Schlipsing, and C. Igel. Detection of traffic signs inreal-world images: The German Traffic Sign Detection Benchmark. In Proc. IJCNN, pages 1–8,Aug 2013.
[9] A. Mogelmose, M. M. Trivedi, and T. B. Moeslund. Vision-based traffic sign detection andanalysis for intelligent driver assistance systems: Perspectives and survey. IEEE Trans. Intell.Transp. Syst., 13(4):1484–1497, Dec 2012.
[10] Z. Zhu, D. Liang, S. Zhang, X. Huang, B. Li, and S. Hu. Traffic-sign detection and classificationin the wild. In Proc. IEEE CVPR, pages 2110–2118, June 2016.
[11] J. Lu, H. Sibai, E. Fabry, and D. Forsyth. No need to worry about adversarial examples in objectdetection in autonomous vehicles. In arXiv:1707.03501, 2017.
[12] N. Das, M. Shanbhogue, S.-T. Chen, F. Hohman, L. Chen, M. E. Kounavis, and D. H. Chau.Keeping the bad guys out: Protecting and vaccinating deep learning with jpeg compression. InarXiv:1705.02900, 2017.
[13] R. Timofte, K. Zimmermann, and L. V. Gool. Belgium traffic sign dataset. http://btsd.ethz.ch/shareddata/, 2009.
[14] J. Stallkamp, M. Schlipsing, J. Salmen, and C. Igel. German traffic sign recognition anddetection benchmarks. http://benchmark.ini.rub.de/, 2013.
[15] CURE-TSR: Challenging unreal and real environments for traffic sign recognition. https://ghassanalregib.com/cure-tsr/, 2017.
[16] CURE-TSD: Challenging unreal and real environments for traffic sign detection. https://ghassanalregib.com/cure-tsd/, 2017.
7
A Appendix: Visualization of Challenge Levels and Types
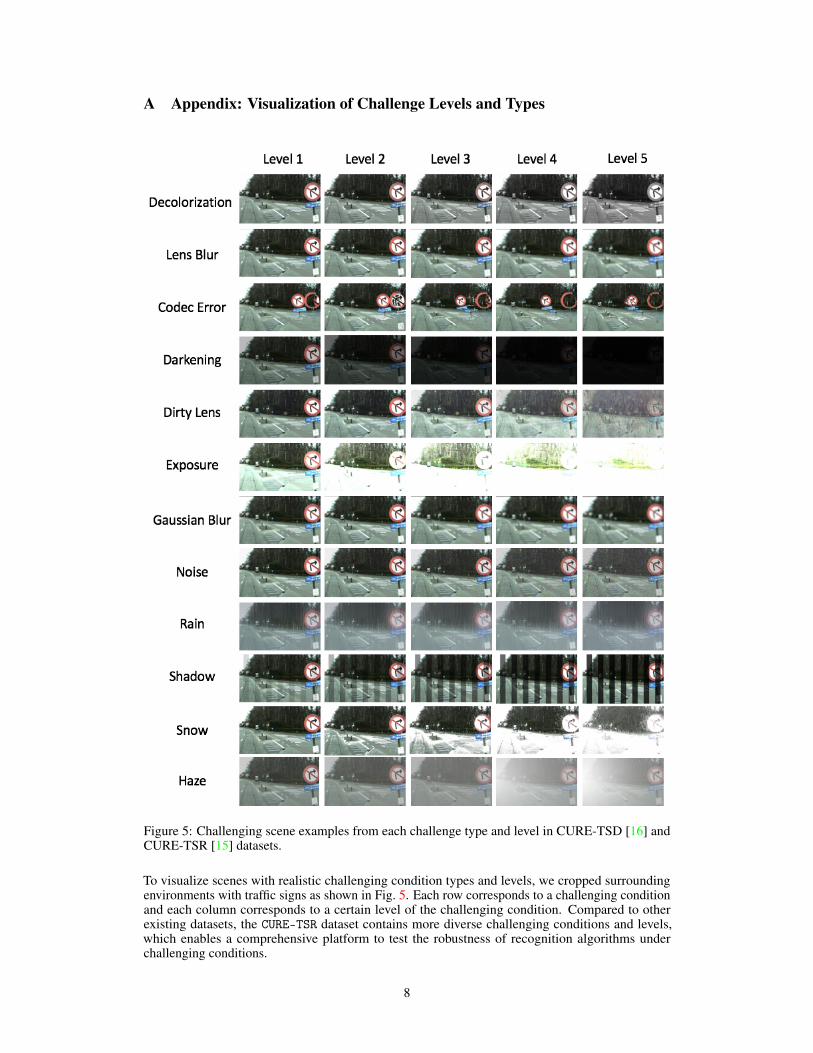
Figure 5: Challenging scene examples from each challenge type and level in CURE-TSD [16] andCURE-TSR [15] datasets.
To visualize scenes with realistic challenging condition types and levels, we cropped surroundingenvironments with traffic signs as shown in Fig. 5. Each row corresponds to a challenging conditionand each column corresponds to a certain level of the challenging condition. Compared to otherexisting datasets, the CURE-TSR dataset contains more diverse challenging conditions and levels,which enables a comprehensive platform to test the robustness of recognition algorithms underchallenging conditions.
8
B Appendix: Data Augmentation
We retrained the benchmark algorithms, listed in Sec. 3.1, by augmenting the initial training imageswith their flipped versions. Vertically, horizontally or vertically and horizontally flipped challenge-freereal images were used for data augmentation. Translation was not utilized in the data augmentationbecause recognition dataset is based on cropped images that do not include background information.Flipping-based data augmentation degrades the average recognition accuracy by more than 6.5%mainly because of the asymmetric characteristics of traffic sign images. For instance, consider the nostopping and no parking signs from Fig. 2. The former sign is symmetric along its horizontal axiswhile the latter sign is asymmetric. Augmenting the training data with horizontally flipped versionsof the asymmetric no parking can lead to learning a visual representation similar to no stopping sign,which is different from the intended class and can degrade the overall degradation accuracy.
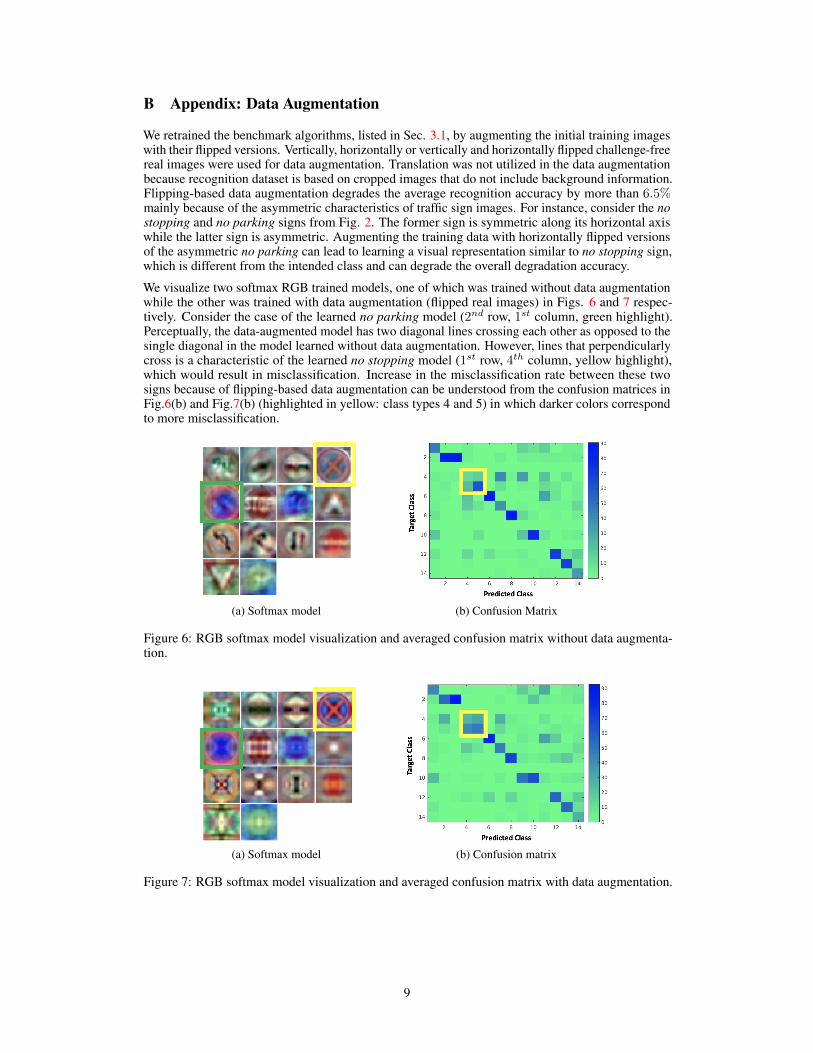
We visualize two softmax RGB trained models, one of which was trained without data augmentationwhile the other was trained with data augmentation (flipped real images) in Figs. 6 and 7 respec-tively. Consider the case of the learned no parking model (2nd row, 1st column, green highlight).Perceptually, the data-augmented model has two diagonal lines crossing each other as opposed to thesingle diagonal in the model learned without data augmentation. However, lines that perpendicularlycross is a characteristic of the learned no stopping model (1st row, 4th column, yellow highlight),which would result in misclassification. Increase in the misclassification rate between these twosigns because of flipping-based data augmentation can be understood from the confusion matrices inFig.6(b) and Fig.7(b) (highlighted in yellow: class types 4 and 5) in which darker colors correspondto more misclassification.
(a) Softmax model (b) Confusion Matrix
Figure 6: RGB softmax model visualization and averaged confusion matrix without data augmenta-tion.
(a) Softmax model (b) Confusion matrix
Figure 7: RGB softmax model visualization and averaged confusion matrix with data augmentation.
9
![arXiv:2008.00178v1 [cs.CV] 1 Aug 2020 · Mohit Prabhushankar, Gukyeong Kwon, Dogancan Temel, and Ghassan AlRegib OLIVES at the Center for Signal and Information Processing, School](https://img.pdfslide.us/doc/110x75/6021b437f60115677619ea68/arxiv200800178v1-cscv-1-aug-2020-mohit-prabhushankar-gukyeong-kwon-dogancan.jpg)


![Ghassan Hamarneh arXiv:0907.0204v1 [cs.CV] 1 Jul 2009hamarneh/ecopy/arxiv_0907_0204.pdf · Ghassan Hamarneh Simon Fraser University 8888 University Dr., Burnaby, BC hamarneh@cs.sfu.ca](https://img.pdfslide.us/doc/110x75/5f3c498594bded505f794a4c/ghassan-hamarneh-arxiv09070204v1-cscv-1-jul-2009-hamarnehecopyarxiv09070204pdf.jpg)