Embed Size (px)
Citation preview

Abstract
This paper uses matched employer-employee data from the 1998 Workplace Employee
Relations Survey (WERS98) to estimate influences on managerial and employee perceptions
of the employee relations climate.
Both the strength and direction of union effects differ according to the nature of the
union and employer responses to it. Employee and employer perceptions of climate differ
according to the strength of the union, bargaining arrangements adopted, and managerial
attitudes to union membership. Employees’ perceptions of climate are also strongly
associated with employees’ perceptions of union effectiveness.
JEL Classifications: J51, J53
Key Words: Trades unions; industrial relations climate; employee relations; matched employer-employee data.
This paper is produced under the ‘Future of Trade Unions in Modern Britain’ Programme supported by the Leverhulme Trust. The Centre for Economic Performance acknowledges with thanks, the generosity of the Trust. For more information concerning this Programme please e-mail future of [email protected]

Union Effects On Managerial and Employee
Perceptions of Employee Relations in Britain
Alex Bryson
April 2001

Published by Centre for Economic Performance London School of Economics and Political Science Houghton Street London WC2A 2AE Alex Bryson, submitted March 2001 ISBN 0 7530 1466 1 Individual copy price: £5

Union Effects On Managerial and Employee
Perceptions of Employee Relations in Britain
Alex Bryson
1. Introduction 1
2. Theoretical Links Between Aspects of Unionisation and the Climate of Employee Relations 4
2.1 Background 4 2.2 Hypotheses 7
3. The Data 11 3.1 Climate measures 12 3.2 Workplace- level measures of trade unionism 12 3.3 Control variables for analyses of managerial perceptions of the
employee relations climate 17 3.4 Control variables for analyses of employee perceptions of the employee relations climate 20
4. Analysis 21 4.1 The samples 21 4.2 Modelling procedures 22
5. Results 23
5.1 Employer perceptions of climate 23 5.2 Employee perceptions of climate 25
6. Conclusions 28 Appendix Tables 30 References 56
The Centre for Economic Performance is financed by the Economic and Social Research Council.
Acknowledgments
I acknowledge the Department of Trade and Industry, the Economic and Social Research
Council, the Advisory, Conciliation and Arbitration Service and the Policy Studies Institute
as the originators of the 1998 Workplace Employee Relations Survey data, and The Data
Archive at the University of Essex as the distributor of the data. I also thank the Department
of Trade and Industry for funding the project which led to this paper. None of these
organisations bears any responsibility for my analysis and interpretations of the data.
Alex Bryson is a member of the Centre for Economic Performance and of the Policy Studies
Institute. Comments on this paper are very welcome and can be sent to the author at the
Policy Studies Institute, 100 Park Village East, London NW1 or via e-mail to

1. Introduction
This paper addresses the question: what impact do trade unions have on the employee
relations climate in Britain? The motivation for the paper is to shed light on differences in
the perceptions of employers and employees in the same workplaces, and to consider the
policy implications.
Until recently, most analyses of attitudes towards the employee relations climate in
Britain were based on data about workplaces gathered primarily from managerial
respondents, such as the long-running series of Workplace Industrial Relations Surveys
(WIRS) (Fernie, Metcalf and Woodland, 1994; Fernie and Metcalf, 1995; Wood and de
Menezes, 1998; Moreton, 1999). This began to change in the late 1990s, with analyses of
employee data from the British Social Attitudes Surveys (BSAS) (Bryson and McKay, 1997;
Bryson, 1999) and the Workplace Employee Relations Survey 1998 (WERS98) (Cully et al.,
1999; Scholarios et al., 1999). The WERS98 data offer a unique in-sight into the employee
relations climate in Britain because they contain similar measures of perceptions of climate
for employees and employers working in the same workplaces. The distribution of responses
from management and employees is presented in Table 1. It is apparent that employees have
poorer perceptions of workplace employee relations than their managerial counterparts.1
Nevertheless, over half viewed the employee relations climate at their workplace as ‘very
good’ or ‘good’.
Table 1: Ratings of Management-Employee Relations in 1998
Employees Management
Very good 15 42 Good 40 48 Neither good nor poor 27 8 Poor 12 2 Very poor 6 1 Weighted base 27,659 2185 Unweighted base 27,691 2188
Note: In a self-completion questionnaire, employees were asked: ‘In general, how would you describe relations between managers and employees here?’ The employee base is all employees excluding 524 unweighted cases with missing data. In a face-to-face interview, the senior manager with responsibility for personnel was asked: ‘Finally, looking at this scale, how would you rate the relationship between management and employees generally at this workplace?’
1 If, as seems possible, employee relations were poorer in those workplaces where management refused permission to distribute the employee questionnaires, then the ‘real’ gap may be wider. However, our weighting scheme compensates for sample non-response. We believe that survey procedures conveying the confidentiality of information provided by employees were sufficiently rigorous to discount the possibility that employees’ responses were affected by the possibility of management reprisals.

2
Table 2 presents this information in a different way, restricting the comparison to
those instances in which data are available for both employees and the employer. It shows
that, while employee perceptions of climate were poorer than managers’ perceptions in nearly
half of all cases, both parties agreed in one-third of cases and managers’ ratings were poorer
in 14 per cent of cases.2
Table 2: Agreement on the Climate of Employee Relations
% Manager’s rating worse by one point 12 Manager’s rating worse by more than one point 2 Both parties agree 33 Employee’s rating worse by one point 31 Employee’s rating worse by more than one point 23 Weighted base 27,625 Unweighted base 27,673
Note: Includes all employees where there are non-missing data for the employee and employer perceptions of climate.
There are a number of reasons why employee perceptions of management-employee
relations differ from those of their employer. First, our main managerial respondents have
formal responsibility for employee relations at the workplace and, with that authority, should
have the opportunity to influence conditions at work in a way that the average worker can
not. Employees in general may be less constrained in their criticism of workplace relations
than managers who are more directly responsible for them. Secondly, employees’
perceptions may differ from their employer’s because their perspectives are influenced by
different factors. As well as making judgements with different information sets3, employees’
perceptions are likely to be influenced by factors such as their general feelings about what
their workplace is like to work in (Cully et al., 1999: 280-281), their feelings about the
effectiveness of their union, and how they view their own management. It is not surprising,
therefore, that employee perceptions of climate do not match the perceptions of their
employers. Our purpose in this paper is to assess the contribution of unions and attitudes
towards unions in explaining these differences.
2 These data differ from those presented by Cully et al. (1999: 283) because they relate to all employees with non-missing data in the survey, whereas Cully et al. confine their analyses to non-managerial employees in workplaces with 25 or more employees. 3 For instance, workers may be more aware of the ‘real’ feeling on the shopfloor than management, whereas management may be privy to all formal grievances and disputes in a way that most employees will not.
3
Our findings provide a context in which to appraise the impact of a new piece of
legislation. The Fairness at Work White Paper (Department of Trade and Industry, 1998),
launched by the Secretary of State for Trade and Industry in May 1998, argued that effective
unions are conducive to good employee relations. Moreover it claimed that harmonious
employee relations based on partnership between workers and their employer improve both
the working lives of individuals and the performance of organisations. However, the
government also went on to argue that these benefits may be jeopardised if, against the
wishes of their employees, employers refuse to recognise a union for pay bargaining and
worker representation. Accordingly, the White Paper proposed a procedure under which an
employer might be compelled to recognise trade unions where a majority of employees so
wish. The statutory recognition procedure was contained in the Employment Relations Act
1999, and has been in effect since 6 June 2000.4 As our data were obtained at a time when
employers were still at liberty to decide for themselves whether or not to recognise unions, it
is not possible to infer directly from our results whether the new statutory provisions will
improve workplace governance.5 Even if we were to find that the presence of recognised
trade unions was associated with good employee relations, we would have to acknowledge
that forcing an employer to recognise a union against their wishes could well sour employee
relations rather than improve them. Indeed, some critics of the new legislation have pointed
to the failure of previous statutory arrangements for union recognition introduced in the early
1970s, suggesting that it demonstrated that compelling employers to deal with trades unions
will be damaging to the conduct of employee relations (Confederation of British Industry,
1998). However, our analysis can shed light on two issues that are fundamental to any
consideration of the links between unions and workplace governance, irrespective of the
statutory environment. The first is whether the presence of recognised unions has a
beneficial effect on governance and, if so, under what circumstances. As we detail further
below, evidence has emerged recently that the influence of unions is diminishing even where,
at least nominally, they continue to be granted recognition rights. There are theoretical
grounds for suspecting that this development will adversely affect workplace relations. The
second issue we can illuminate is whether the impact of unions depends on how management
4 Under the legislation, employers with more than 20 employees are required to recognise unions for bargaining on pay, hours and holidays if a majority of relevant workers demonstrate support for it. To achieve recognition, a union must show in a secret ballot that it has the support of 40 per cent of those working in the bargaining unit, as well as a majority of those voting. Alternatively, the union can demonstrate that more than half of the workers in the unit are union members.

4
reacts to them. We contend that good employee relations can only be fashioned with the
support of management and workers: it is not simply a gift to be bestowed by one side or the
other, no matter how willing they may be.
The rest of the paper is set out as follows. Section 2 discusses trends in unionisation
and employer and employee orientations to unions that may have a bearing on union
influence over workplace governance. It goes on to outline theoretical links between unions
and the employee relations climate and the five hypotheses tested in the paper. In Section 3
we introduce the WERS98 data used in our analyses. Section 4 discusses our analytical
approach. Results are presented in Section 5 and Section 6 concludes.
2. Theoretical Links Between Aspects of Unionisation and the Climate of
Employee Relations
2.1 Background
The last two decades have been a period of continuous decline for trade unions in Britain.
The unionised sector shrank due to falls in membership and a rapid drop in the number of
employers recognising unions for collective bargaining (Millward et al., 2000; Machin,
2000). But the issue at the heart of this paper is: what influence do unions have where they
retain a foothold in the workplace? We focus on four aspects of unionisation which may
influence both the size and direction of union effects on the climate of employee relations.
These are union strength, bargaining arrangements, managerial support for unions, and the
effectiveness of unions as perceived by employees.
Union strength: Unions’ influence in the workplace derives, in large part, from their
bargaining power, stemming from their ability to disrupt the supply of labour in pursuance of
their members’ interests. But it also comes from the union’s role as the representative ‘voice’
of employees in the resolution of workplace grievances and disputes. Both sources of
influence depend on the credibility of the union in claiming to represent the workforce. This
has diminished since the early 1980s. Even where unions continue to be recognised by the
employer for bargaining purposes, there has been a decline in the proportion of employees
5 For an attempt to do so using historical and international comparative analysis see Wood and Godard (1999).
5
whose terms and conditions are set by collective bargaining and the proportion who are union
members (Millward et al., 2000). This may explain the absence of a general union wage
mark-up (Forth and Millward, 2000) and, by 1998, the disappearance of negative union
effects on workplace financial performance usually attributed to the monopoly power of
unions (Addison and Belfield, 2000; Bryson and Wilkinson, 2001).
However, the decline in these ‘average’ union effects for some workplace outcomes is
by no means the whole story. First, some average union effects remain powerful. For
instance, unionised workplaces had slower growth rates than non-unionised workplaces in the
1990s, ceteris paribus, suggesting that union effects are not benign (Bryson, 2001a).
Secondly, many workplaces still have ‘strong’ unions with high membership, high bargaining
coverage and on-site lay representation (Millward et al., 2000: 179-183). One might expect
the ‘returns’ to well-organised, or strong, unions to be relatively greater now that average
union strength has declined. Forth and Millward (2000) confirm this in their analyses of the
union wage premium. They found that, by 1998, there was no general union premium, but
there was a sizeable mark-up in workplaces with high bargaining coverage. Thirdly, as
discussed in greater detail below, even weak unions may still have appreciable effects on
employee perceptions of climate.
Bargaining arrangements: Bargaining arrangements refer to the ways in which
unions and employers are organised for bargaining purposes. An individual union may
negotiate separately for different groups of workers but, in the main, the number of
recognised unions at a workplace sets a limit on the number of separate bargaining groups.
Separate unions may negotiate together. Where all recognised unions negotiate together this
is known as ‘single-table bargaining’.
During the 1990s, there was a major switch away from separate bargaining to joint
bargaining in workplaces where collective bargaining was the dominant form of pay
determination (Millward et al., 2000: 203). In 1990, only 40 per cent of these workplaces
had single bargaining units. This had risen to 77 per cent in 1998. The principle cause of the
trend to single-table bargaining was not the reduction in multi-unionism which occurred over
the period, but a simplification of bargaining arrangements where more than one union
existed (Millward et al., 2000: 204). The change was the result of behavioural change in
workplaces which continued in operation over the period, coupled with the near universal
adoption of single-table bargaining among unionised workplaces that had come into being
since 1990 and those growing above the 25-employee threshold used for sampling in the

6
WIRS series. If these trends continue, single-table bargaining will become still more
prevalent.
Bargaining structures are not simply determined by unions. Indeed, when Millward et
al. (2000) investigated the reasons why continuing workplaces had shifted to single-table
bargaining, they concluded that ‘many, if not most, of the moves towards simpler negotiating
arrangements were at the instigation of management’ (Millward et al., 2000: 205). This
implies that employers feel they had something to gain from simpler bargaining
arrangements: these gains might include a better employee relations climate.
Management attitudes to unions: What has caused the general decline in the ‘take-
up’ of unions among employees and employers, lies beyond the scope of this paper.6
However, as discussed below, employer support for unions and employee perceptions of the
job done by unions may be important in explaining the effects of unions on perceptions of
workplace governance. Trends in these two factors provide useful background to the
discussion of their effects on climate below.
Where employers are at liberty to choose whether they recognise trade unions, unions
are heavily reliant on the support, or at least acquiescence, of management, to conduct their
business in representing members. This was the case for the period up to 1998 for which we
have data.7 However, employees are less likely to think that their employer endorses union
membership than they were in the mid-1980s (Bryson, 2001b; Gallie et al, 1998: 107)).
Survey evidence from managers in workplaces recognising unions shows that, while
management endorsement of union membership rose in the 1980s, partly offsetting the
decline in the closed shop, endorsement of membership declined markedly in the 1990s,
along with a decline in the closed shop (Millward et al., 2000: 145-149). Union
derecognition was relatively rare over the period (Millward et al., 2000: 103-104). Instead,
where employers continue to recognise unions, they appear to be capitalising on changes in
the labour market and the legal framework which have strengthened their bargaining power
vis-à-vis employees to refashion their relationship with organised labour. In 1998, a clear
majority of managers in workplaces recognising unions expressed a preference for consulting
directly with employees rather than with unions (Bryson, 2001c). This is consistent with case
studies uncovering instances in which recognised unions are by-passed in managerial
6 For discussion of this issue see Millward et al., 2000; Metcalf, 2000; Machin, 2000.

7
decision-making (Marchington and Parker, 1990; Darlington, 1994), and evidence from
WERS98 on ‘the extent to which worker representatives were excluded altogether from the
province of many workplace issues’ (Cully et al., 1999: 105).
Union effectiveness: These considerations may lead us to suspect that managers are
less constrained than they were in the 1980s in pursuing corporate goals, sometimes at the
expense of employees. Consequently, other things being equal, employee representations to
management may be less influential in the governance of the workplace. However, evidence
from BSAS indicates that employees are no more likely to view unions as ineffective in the
late 1990s than they were in the early 1980s (Bryson, 2001c).
2.2 Hypotheses
Relations between unions and employers are often portrayed as a ‘zero-sum game’, where
union members benefit at the expense of employers, and vice versa. However, there is theory
and evidence to indicate that both workers and employers can benefit from unions under
certain conditions. Unions may have offsetting influences on climate arising from their dual
function in bargaining on behalf of members for improved pay and conditions, on the one
hand, and in representing the ‘voice’ of workers to management on the other. Consequently,
their actual impact on climate is a matter for empirical investigation. Below we outline five
hypotheses tested in the paper which suggest ways in which unionisation may affect
employer and employee perceptions of climate.
First hypothesis: Managers perceive the workplace employee relations climate to be better
where they deal with a unified worker voice able to represent the majority of workers.
However, where unions are particularly strong, managers will perceive climate to be poorer.
Managers are likely to view the climate poorly where strong unions use their
bargaining power to take a greater share of profits at the expense of the firm8, particularly
where this results in conflict or discord. On the other hand, unions can operate as effective
7 Although statutory rights to recognition under the Employee Relations Act 1999 diminish reliance on employers for formal recognition, in practice it is likely that unions will remain reliant on employer support if they are to make effective representations on behalf of their members. 8 Pay bargaining may have similar effects in the public sector where wage demands must be satisfied, along with competing claims for resources, from fixed budgets set by officials and politicians.

8
agents for management in enforcing desired effort in return for agreed rewards, and in
delivering worker compliance with management-initiated change. However, they can only
do this where they are perceived by management and employees as the legitimate
representative of the employees’ voice. From this principle-agent perspective, it makes little
sense for employers to maintain ineffectual unions, since unions require influence if they are
to reduce employers’ agency costs in maintaining and enforcing desired levels of worker
effort.9 Unions can also contribute to better management perceptions of climate where they
are effective in communicating and seeking to resolve employee grievances (Freeman and
Medoff, 1984). Weak unions may have a particularly negative influence on managerial
perceptions of climate, arising from the frustration in having to deal with a union which is not
capable of operating as an effective voice or agent.
Analysis of the 1990 Workplace Industrial Relations Survey showed that managerial
perceptions of climate were ‘worse where the strong and weak versions of unionisation exist
than it is in non-union workplaces or those with middling union strength’ (Fernie and
Metcalf, 1995: 401). The authors suggest that ‘the benefits from having a union representing
the bulk of the labour force in a workplace ... flow from greater voice and representativeness
and less fragmentation of workplace employee relations’ (Fernie and Metcalf, op. cit.). This
may have remained so in the late 1990s, even though declines in union density and
bargaining coverage meant fewer workers were represented by union voice where it was
present. We test whether this was the case in 1998 with our union strength and bargaining
arrangement measures, described later.
Second hypothesis: Employees’ perceptions of climate will be best where unions have
sufficient strength to represent their voice to management.
Genuine co-operation between management and employees seems unlikely if
employees have no access to independent sources of power to represent them and protect
their interests. Marshall (1992) argues that co-operative relations cannot be maintained
where there is a substantial power imbalance between management and unions because the
stronger party will opt for unilateral control over co-operation. Where unions are weak, and
employers are tempted to exercise unilateral control, employees may be less trusting in
9 Also, distributive bargaining relies on ‘interdependency’ between employer and union, at least in the long run (Walton and McKersie, 1965).
9
management and perceptions of climate may be poor.
Whereas particularly strong unions may be associated with poorer managerial
perceptions of climate, strong unions are unlikely to have this effect on employees’
perceptions. Indeed, if strong unions are best able to deliver better terms and conditions for
employees, this may result in better employee perceptions of the working environment than
might otherwise be the case.
Analyses of BSAS indicate that employees’ perceptions of climate are indeed poorest
where unions are weak, and they are at least as good as perceptions in non-unionised
workplaces where employees think union power in the workplace is ‘about right’ (Bryson,
2001c).
Third hypothesis: Employee perceptions of climate are no worse, and may even be better,
where voice is fragmented, than they are where there is a unified worker voice.
Although employers may benefit from a single, unified worker voice, this may not be
the case for employees. It may well be that employees’ interests can be adequately
represented through a single union, or multiple unions operating in concert. But if workers
are heterogeneous, multiple unions operating separately may better represent their needs. In
practice, single unionism may be particularly unsuited to meeting the majority of employees’
needs because it is associated with lower union density and bargaining coverage than
multiple unionism (Bryson and Wilkinson, 2001). This may help to explain why, by 1998,
the union wage premium in Britain was confined to workers in multiple union workplaces
(Forth and Millward, 2000).
It is also possible that non-union voice mechanisms such as direct two-way
communication between management and employees, can complement union voice and, as
such, enhance employee perceptions of climate. It may do so if it operates as a more efficient
method of communication between employees and the employer, as some human resource
management academics suggest (Storey, 1992), and where it involves employees not covered
by union voice. Employees’ perceptions of management improve where there is intensive
use of direct communication methods between management and employees (Bryson, 2000).
This is particularly so in a union setting, suggesting some complimentarity between union
and non-union voice (op. cit.).
10
Fourth hypothesis: Managerial and employee perceptions of workplace governance are
better where managers support union membership, and are poorest where managers
discourage membership.
The acts or omissions of one party may be able to sour employee relations, but no
matter how constructive a union wishes to be, or how strong it may be organisationally, a co-
operative environment is likely to require that management engages constructively with the
union, and vice versa. Only then can the ‘space’ for collaboration (or what is sometimes
termed ‘concertation’ (Hyman, 1997: 323) be created. In this sense, ‘the extent to which a
union is a liability or an asset [for the employer] depends crucially on how management
responds to it’ (Freeman and Medoff, 1984: 5).10 Thus, a co-operative environment is likely
to require that management engage constructively with the union, unless it can devise non-
union employee involvement strategies that substitute for unions. Conversely, where
management opposes membership, a low trust relationship may ensue, resulting in a
deterioration in perceptions of climate. Recent evidence from analyses of BSAS shows that,
ceteris paribus, employees’ perceptions of climate are indeed best where management
supports membership, and are poorest were management is opposed to membership (Bryson,
2001c). I am aware of no evidence on the association between managerial attitudes to unions
and managerial perceptions of climate.
Fifth hypothesis: Employees’ perceptions of climate are positively associated with
perceptions of union effectiveness.
The perception that a union is effectively protecting and advancing its members’
interests can result in positive perceptions of management (Deery et al, 1995). This may
occur where union instrumentality11 engenders greater employee allegiance to both the union
and the employing organisation (‘dual commitment’), thus resulting in more co-operative and
harmonious management-employee relations. It may also occur where perceptions of union
effectiveness are associated with perceptions of a fairer, more challenging and satisfying
10 Similar arguments apply to other workplace outcomes such as financial performance. Thus, the behaviour of one party may be responsible for poor financial performance but, as Denny and Muellbauer (1988: 6) argue: ‘it is not the independent effect of trade unions but the interaction of unions and management that can cause improved economic performance’.
11
work environment. This, in turn, can positively influence perceptions of management (Deery
et al., 1999: 546).
Gallie et al. (1998: 72-86) find that employees perceive supervision to be tighter, and
technical and bureaucratic methods of management control to be more evident where unions
are perceived as having greater influence. The authors suggest that ‘a reasonable inference,
then, is that intensive control systems were preferred by organisations where managerial
power was contested’ (Gallie et al., 1998: 85). It may be that, where unions contest ‘the
terrain’ with management, employee perceptions of the working environment actually
deteriorate, in which case trust in management may also deteriorate. This line of reasoning
cautions against a simple assumption that effective unionism will translate into better
perceptions of climate. In fact, analyses of BSAS indicate that employees’ perceptions of
climate are particularly poor where unions are perceived to be ineffective (Bryson, 2001c).
Where unions are viewed as effective, perceptions of climate among employees in unionised
workplaces did not differ from the perceptions of employees in non-unionised workplaces,
ceteris paribus.
3. The Data
The Workplace Employee Relations Survey 1998 (WERS98) is a nationally representative
survey of workplaces with 10 or more employees covering all sectors of the economy except
agriculture.12
Our analyses use two elements of the survey. The first is the management interview,
conducted face-to-face with the most senior workplace manager responsible for employee
relations. This was supplemented by a pre-interview self-completion questionnaire providing
workforce data that might have involved interrogating records. Interviews were conducted in
2191 workplaces with a response rate of 80 per cent. The second element we use is the
survey of employees within workplaces where a management interview was obtained. Self-
completion questionnaires were distributed to a simple random sample of 25 employees (or
11 In this context, union instrumentality means ‘the degree to which the union achieves the valued goals of employees’ (Deery et al., 1995: 9). 12 For a comprehensive technical account of the survey see Airey et al. (1999) and for the initial analysis of the survey see Cully et al. (1999). The survey data sets are available from The Data Archive, University of Essex.

12
all employees in workplaces with 10-24) in the 1880 cases where management permitted it.13
Of the 44,283 questionnaires distributed, 28,237 (64 per cent) usable ones were returned.14
3.1 Climate measures
Our climate measures are those presented in Table 1. Others have used composite indexes of
managerial relations derived from a number of items contained in the employee questionnaire
when exploring employees’ perceptions of climate (Guest et al., 1999; Scholarios et al.,
1999). Although there are advantages to moving away from reliance on a single-item
response, I have chosen to focus on the single item to allow for comparability across the
analyses of managerial and employee perceptions.
3.2 Workplace-level measures of trade unionism
Below we describe the dimensions of unionisation used in our analyses, namely union
strength, bargaining arrangements, managerial attitudes to unions and employee perceptions
of union effectiveness. We also identify some of the ways in which these measures might
relate to employee and employer perceptions of climate.
Distributions for these variables and control variables are presented in Appendix
Tables 1 and 2 for management and employees respectively.
Union strength: Union recognition by the employer for pay bargaining is the basis for
union influence in the workplace. Although rights to represent members in grievance
procedures and other matters, and rights to negotiate over non-pay issues are important in
building a membership base and allow unions some influence over workplace matters, these
rights rarely exist without the right to negotiate over pay (Millward, 1994: 30-33). Since
payment is generally regarded as ‘the most conspicuous focus of collective concern for
labour’ (Brown et al., 1995: 123), unions that are not recognised for pay bargaining purposes
can only address issues of peripheral interest to workers collectively.
13 The probability of worker selection is the product of the probability of the workplace being selected and the probability of an employee being selected from within that workplace. Cully et al. (1999: 306) note the advantages of this approach. 14 The weighting scheme used in this paper compensates for sample non-response bias which was detected in the employee survey (Airey et al., 1999: 91-92).
13
When distinguishing unions according to their strength, analysts have traditionally
compared union recognition with and without a closed shop, whereby at least some
employees are required by the employer to be union members. However, the closed shop has
been in decline since the beginning of the 1980s, and is now legally unenforceable. By 1998,
only 2 per cent of workplaces recognising unions were maintaining a closed shop so it is not
possible to rely on it as the single most important indicator of union strength.
Analysts have frequently combined the closed shop and management endorsement of
union membership as a single measure of union strength, since the recommendation of union
membership by management may not differ substantially in practice from closed shop
arrangements (Wright, 1996). This is particularly so now that the closed shop is no longer
legally enforceable in Britain. However, management endorsement is an ambiguous measure
of union strength because, although it may assist in the recruitment of members, thus
strengthening a union, it may be a sign that a union is not wholly independent of
management, and may even be reliant on management support for its position. Therefore
union strength and management support for unions are conceptually different. A union may
be strong without management support. Where it is strong in the face of management
opposition, the employee relations climate may be conflictual. Where it is strong and has
management support, climate may be better. Therefore we prefer to treat the existence of a
de facto closed shop and strong endorsement of union membership as measures of managerial
attitudes towards unions, rather than measures of union strength.
The influence the union wields in the workplace is also likely to depend on the
proportion of employees it can count among its members. Mean union density15 declined
markedly in workplaces with recognised unions over the 1980s and 1990s, but there was a
sharp increase in the rate of decline in the 1990s (Millward et al., 2000: 140-145), implying a
considerable loss of influence in the workplace. By 1998, it stood at 58 per cent in
workplaces with 10 or more employees. Higher union density may influence employer and
employee perceptions of a union’s legitimacy in representing workers’ interests, predisposing
them to take greater account of what the union is saying. Where unions represent most of the
workforce, they can represent workers’ interests with a strong ‘voice’. Where they represent
a minority of workers, they may lack influence over sections of the workforce.
15 Mean workplace-level union density is the sum of the percentage of employees in membership for each workplace, divided by the number of workplaces. This measure is the one we use in our analyses. It differs

14
Consequently, their ability to work constructively with employers may be hampered by their
inability to deliver worker support for change. Equally, their ability to disrupt production is
diminished. These considerations may explain why employers are less likely to listen to the
union if only a minority of employees back it than if the union represents a majority voice –
even if the employer has chosen to recognise the union (Cully et al., 1999: 105-6).
Despite being an indicator of union strength, workplace union density has not featured
in many analyses of the employee relations climate, primarily because of difficulties in
interpreting its effects. The proportion of a workforce that is unionised may be directly
influenced by the climate of the workplace since employees’ propensity to join a union may
be affected by the existing employee relations climate. For instance, where climate is poor
and workers wish for a more effective voice, they may be more inclined to join a union. In
this case, higher union density may be correlated with poor climate, but it is the poor climate
which has resulted in higher density, rather than vice versa. The second difficulty in using
workplace-level union density is the difficulty in interpreting what union density is capturing.
It is highly correlated with a number of other union measures, such as managerial support for
unions, and managers’ desire to consult with unions rather than directly with employees
(Cully et al., 1999: 90). Despite these caveats we consider the effects of union density.
The percentage of workers whose pay is jointly determined by employers and unions
through collective bargaining is another fairly direct measure of union influence in the
workplace. By this measure, unions have lost a good deal of influence over joint regulation
since the mid-1980s, despite being formally recognised for pay bargaining. There has been a
marked decline in collective bargaining coverage in unionised workplaces since 1984
(Millward et al., 2000: 159-167). Furthermore, for the first time, a sizeable proportion of
workplaces with recognised unions reported having no workers covered by collective
bargaining. The rate of decline, and the emergence of many unionised establishments with
no effective bargaining, have been so dramatic that commentators suggest they ‘may mark a
qualitatively different phase in the development of unionism’ (Millward et al., 2000: 167).
Another indicator of union organisational strength is the presence of a trade union
representative. Union representatives may also be viewed as ‘voice mechanisms’, operating
as a channel for communication between local membership and management, and assisting in
the resolution of disputes and grievances (Cully et al., 1999: 201-203). WERS98 provides
from aggregate union density, the mean of which is derived by summing the members across a set of workplaces and then dividing by the total number of employees in those workplaces.
15
evidence that worker representatives are increasingly conforming to this role, attaching
greater importance to ‘dealing with problems raised by the treatment of employees by
management, and to resolving disputes’ (Cully et al., 1999: 201), rather than the more
‘traditional’ activities of maintaining wages and benefits. If they are effective in this role, the
presence of representatives on-site may contribute to more positive perceptions of
management-employee relations.16
Bargaining arrangements: Traditionally, bargaining arrangements are equated with
bargaining power: complementary workers will choose separate bargaining, while
substitutable workers will choose joint bargaining (Horn and Wolinsky, 1988)..17 If workers
are close substitutes they will do better by joining forces in either a single union or joint
bargaining arrangement, helping them to avoid divide-and-rule tactics by the employer. If
groups of workers are highly complementary, each group is powerful under separate
bargaining as the employer needs all groups to maintain production. Furthermore, separate
bargaining arrangements may permit consideration of different issues facing different groups
of workers. If this delivers desirable outcomes for workers, the process may result in
increased worker motivation, improved productivity and thus performance. Nevertheless,
separate bargaining always carries with it the risk that employers will be able to ‘divide-and-
rule’, leading to a deterioration in employees’ perceptions of the employee relations climate.
However, bargaining arrangements may have effects on employer and employee
perceptions of climate that can not be reduced simply to their impact on relative bargaining
power. Employers may benefit when negotiating with a unified worker voice, which may
take the form of a single union, or separate unions bargaining together. This is attractive to
employers when it limits the sort of inter-union rivalry in the bargaining process which
results in ‘leapfrogging’ claims, and where it reduces the costs to employers of engaging in
bargaining with multiple unions. But multi-unionism may be associated with poorer
managerial perceptions of climate, whether there is joint bargaining or not. This may occur
where unions are engaged in demarcation disputes, jurisdictional disputes regarding rights to
16 If unions were losing their organisational strength in the 1990s, one might have expected a continuation in the decline of on-site representation that had begun in the latter half of the 1980s. In fact, evidence from the WERS98 cross-section and panel indicates that on-site representation stabilised in the 1990s, with around seven-in-ten workplaces with 25 or more employees and a recognised union also having an on-site representative (Millward et al., 2000: 153-154). Among workplaces with 10 or more employees with recognised unions, 59 per cent had an on-site representative in 1998. 17 Naylor (1995) demonstrates why separate bargaining is associated with unions capturing more of the available rents at a workplace.
16
represent, membership poaching disputes, or other forms of ‘competitive militancy’, although
it is rare in practice (Dobson, 1997). On the other hand, multi-unionism may increase
productivity among heterogeneous workers if it is a superior means of diagnosing and
articulating workers’ grievances, resulting in a better climate (Metcalf, et al., 1993: 9).
Our analyses consider the number of unions recognised for pay bargaining at the
workplace and, where there is multi-unionism, whether they bargain jointly or separately.
Managerial attitudes to unions: the data contain four measures of management
support for unions, three obtained from the management respondent, and one asked in the
employee questionnaire.
The following question is asked of both management and employees:
‘How would you describe management’s general attitude towards trade union
membership among employees at this establishment? Is management…
… in favour of trade union membership
… not in favour of it
… or neutral about it?’
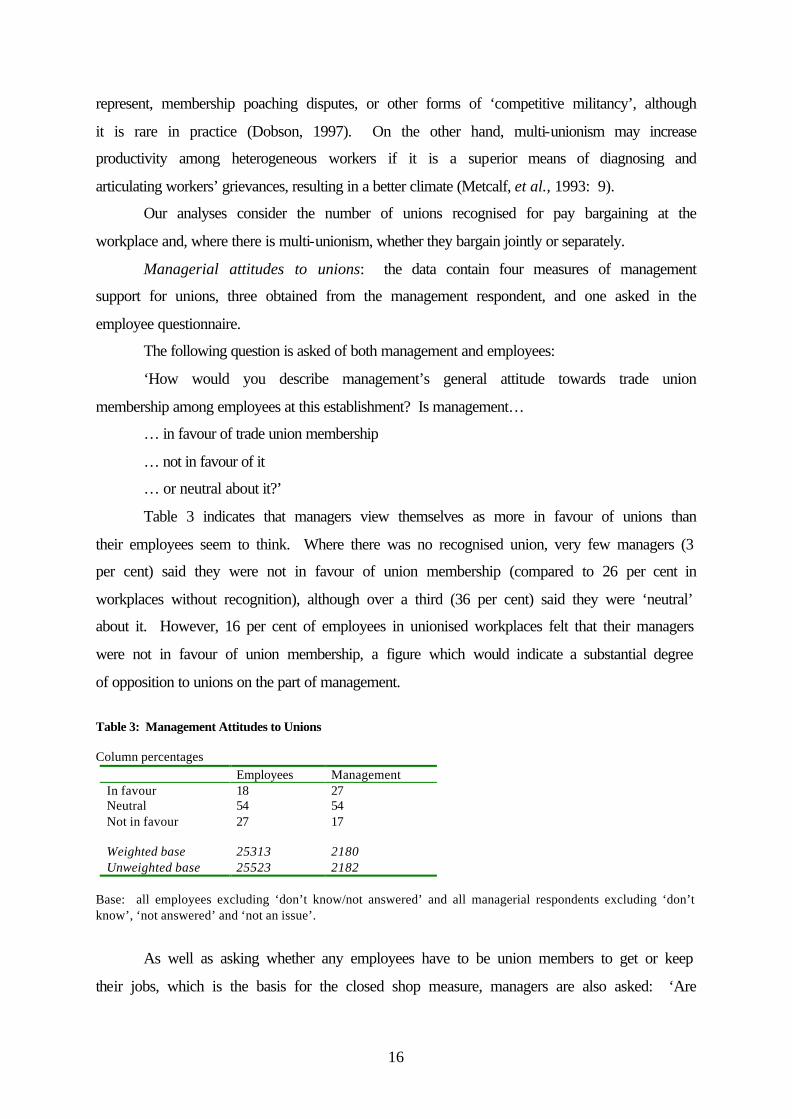
Table 3 indicates that managers view themselves as more in favour of unions than
their employees seem to think. Where there was no recognised union, very few managers (3
per cent) said they were not in favour of union membership (compared to 26 per cent in
workplaces without recognition), although over a third (36 per cent) said they were ‘neutral’
about it. However, 16 per cent of employees in unionised workplaces felt that their managers
were not in favour of union membership, a figure which would indicate a substantial degree
of opposition to unions on the part of management.
Table 3: Management Attitudes to Unions Column percentages
Employees Management In favour 18 27 Neutral 54 54 Not in favour 27 17 Weighted base 25313 2180 Unweighted base 25523 2182
Base: all employees excluding ‘don’t know/not answered’ and all managerial respondents excluding ‘don’t know’, ‘not answered’ and ‘not an issue’.
As well as asking whether any employees have to be union members to get or keep
their jobs, which is the basis for the closed shop measure, managers are also asked: ‘Are

17
there any employees here who management strongly recommends should be union
members?’ This is our third measure of management attitudes to unions.
Finally, WIRS has traditionally contained little information on how employers wish to
work with unions at their workplace. This gap is filled in WERS98 with a question about
how strongly the respondent agrees with the statement: ‘We would rather consult directly
with employees than unions’. Almost three-quarters of managerial respondents agreed with
the statement. Perhaps more revealing still is the fact that 18 per cent of managerial
respondents in unionised workplaces agreed strongly with the statement, and a further 37 per
cent agreed.
Employee perceptions of union effectiveness: WERS98 contains data on two sorts of
union influence, as perceived by employees. The first is perceptions of union effectiveness in
working for employees and serving their interests. Where employees are aware of a
workplace union, they are asked how strongly they agree that unions at the workplace ‘take
notice of members’ problems and complaints’. Among those giving a valid answer, the
percentage of members agreeing was similar across workplaces with and without recognised
unions (72 per cent where they were recognised and 69 per cent where there was no
recognition). Non-members were less likely to agree, whether they worked in workplaces
with recognised unions or not (55 and 56 per cent respectively).
The second sort of measure is employee perceptions of the difference unions make at
the workplace, and the influence they have over management. Our preferred measure is
based on how strongly they agree or disagree with the statement that unions or staff
associations at the workplace ‘are taken seriously by management’. Roughly half of
employees in workplaces with 10 or more employees agree with the view that unions are
taken seriously by management. Although the figure is a little higher where the individual is
a member of a recognised union, the differences are not large.18
3.3 Control variables for analyses of managerial perceptions of the employee relations
climate
Appendix Table 1 defines these variables and shows their incidence in the sample, but I
introduce them briefly below.
18 However, the differences are much larger when one takes account of the fact that so many non-members are unaware that a recognised union operates at their establishment.
18
Respondent characteristics: I experimented with a number of variables capturing the
nature of the managerial respondent. The final models incorporate three. First, since
previous research indicated that women tend to have better perceptions of climate than men
(Bryson and McKay, 1997) we identify whether the respondent was a woman. Secondly, we
include whether the respondent was a personnel or employee relations specialist since
research with WIRS90 found specialists had poorer perceptions of climate than other
managerial respondents (Fernie, Metcalf and Woodland, 1994). Previous research indicates
that employees’ perceptions of climate deteriorate with time in their job; we incorporate job
tenure on the assumption that this effect will also apply to managers.
Workforce composition: Managerial perceptions of climate are better in smaller
workplaces (Fernie, Metcalf and Woodland, 1994), so I include a categorical variable
capturing the number of employees at the workplace. Three additional variables capture the
composition of the workforce: the percentage of women, part-timers and non-white ethnic
minorities.
Workplace ownership, sector and location: In the same way that smaller workplaces
are often associated with better managerial perceptions of climate, so too are smaller
organisations: the distinction between workplaces which are single independent
establishments and those belonging to multiple-establishment organisations helps capture
this. I also make use of information that identifies workplaces owned by individuals or
families also involved in the day-to-day running of the workplace. Public and private sector
organisations differ markedly in the way they manage employee relations (Millward et al.,
2000: 61-80). For example, their bargaining arrangements are very different. So we control
for this with a dummy variable. I use the one-digit standard industrial classification to
capture other industry-specific differences. A twelve-category regional variable captures
workplace location. Although debate about the ‘new’ industrial relations has died down
somewhat, it is still equated with younger workplaces, those set up on greenfield sites, and
foreign-owned workplaces (Millward, 1994). I control for these factors.
Workplace activity: Workplace climate may be affected by the pressures associated
with exposure to a competitive market environment. The workplace activity variable
distinguishes workplaces producing goods and services for consumers, those supplying to
other companies, those supplying to other parts of the organisation they belong to, those that
do not produce goods or provide services for the open market, and those that are purely
administrative offices.
19
Management practices: If unions are more likely to gain a foothold where
management is poor (or good) the estimates of union effects on climate may be biased since
they may simply indicate that a workplace is poorly or well-managed (Huselid and Becker,
1996). I include a wide range of management practices to account for this possibility, as
recorded in Appendix Table 1. It is worth mentioning some of them briefly. First, there are
the human resource management practices. HRMSCORE is loosely based on the managerial
concepts outlined by Pfeffer (1995) which he argues produce a sustainable competitive
advantage through the effective management of people. The measure is a count of practices
identified by Pfeffer, supplemented by other aspects of human resource management
identifiable in the literature.19 (I have experimented with the count variable in some models;
in others I included the full set of practices.) Secondly, I include a range of voice and
communication variables supplementing the union-non-union voice variable referred to
below. Some entail two-way communication, others one-way downward communication
from management to employees. The third set of management practice variables relates to
formal procedures: individual grievance procedures, procedures for dealing with collective
disputes, and formal written policies on equal opportunities or managing diversity. Finally, I
identify whether the workplace or organisation to which it belongs has been accredited as an
Investor in People.20
Non-union voice: The nature of worker voice is captured by a variable which
distinguishes workplaces with no voice, union-only voice, direct non-union voice only, or
‘dual channel’ voice involving a combination of union and non-union voice.21
19 These dimensions are as follows: selectivity in recruiting (SELECTIV); employment security (JOBSECUR); incentive pay (PROFITPY, PERFPAY, CASHBO); employee ownership (ESOP); information sharing (NINFO); participation and empowerment (EMPOWER); self-managed teams (AUTOTEAM); training and skill development (PCOFFJOB, ONGOING); cross-utilisation and cross-training (TROTHJ2); symbolic egalitarianism (SAMETERM); promotion from within (INTERPRO). In addition the score includes an indicator that the workplace has a formal strategic plan (STRATEGY), strategic planning being a key component on HRM according to some commentators (Storey, 1992), and widespread appraisal systems (APPRAISE). The variable is approximately normally distributed. 20 The Investors in People (IiP) award is given to workplaces or organisations by independent assessors from Training and Enterprise Councils in England and Wales (Local Enterprise Companies in Scotland) which have a planned approach to setting and communicating business objectives and developing people to meet those objectives. 21 The ‘voice’ measure (VOICE3) identifies a union voice as being present where there is a recognised union or the union appoints an employee representative to a joint consultative committee which meets regularly. Non-union voice comprises direct voice (incorporating team briefings, regular meetings between senior management and the workforce, and problem-solving groups) and non-union representative voice in the form of a joint consultative committee without union nominees which meets regularly.

20
3.4 Control variables for analyses of employee perceptions of the employee relations
climate
The combination of employee data on demographics, qualifications, job characteristics, and
attitudes to their job, management and unions, coupled with workplace data obtained from
the manager responsible for personnel or human resource issues at the site, allows us to
control for a very wide range of individual-level and workplace-level information to estimate
precisely influences on managerial responsiveness to employees. Appendix Table 2 defines
these variables and shows their incidence in the sample. Here we discuss the rationale for the
inclusion of variables that do not appear in our analyses of employer perceptions.
Demographic characteristics of respondents: our analyses incorporate gender, age
and ethnicity, all of which have been associated with employee perceptions of management in
previous studies (Bryson and McKay, 1997; Gallie, White, Cheng and Tomlinson, 1998).
More highly educated workers often have higher expectations of involvement, and may
therefore be particularly critical of management where participation is denied. So I include
individuals’ highest educational qualification, and whether they possess a vocational
qualification.
Job-related characteristics: I control for five aspects of individuals’ jobs: occupation
(based on the 1990 Standard Occupational Classification); years spent working at the
workplace; hours usually worked each week; whether the contract is a permanent one; and
gross weekly wage. Together these variables help capture an individual’s attachment to their
workplace, the investment they have made in working there, and their status in the
organisation.
The twelve-category ordered variable capturing gross wages controls for a well-
known union effect which may confound other union effects, namely the union mark-up on
wages. Union-induced wage increases may make workers more positive about their working
environment than they otherwise would be, so confounding estimates of a union-induced
effect arising through bargaining arrangements.
Union membership status: it is a standard finding in the British and American
literatures that unionised workers express greater dissatisfaction with management than non-
unionised workers (Freeman and Medoff, 1984; Gallie, White, Cheng and Tomlinson, 1998;
Bryson, 1999; Bryson 2000). Freeman and Medoff offer an explanation for this in the greater
politicisation of unionised workers. They suggest that unionised workers are more prone to
21
express their voice ‘loudly’ to ensure that it is heard, resulting in ‘voice-induced
complaining’ (1984: 142) which they distinguish from ‘true’ dissatisfaction. They also
suggest that ‘some of the critical attitude of union workers is due to their greater awareness of
problems and willingness to speak out’ (1984: 142). As Gallie, White, Cheng and
Tomlinson (1998: 113-114) point out: ‘unionism as an oppositional form of representation
may highlight organisational inefficiencies and colour perceptions of management
competence’. In addition, as Freeman and Medoff note (1984: 141), other things being
equal, the stock of dissatisfied workers will be greater in unionised workplaces because
dissatisfied workers are less likely to quit in unionised workplaces than they are in non-
unionised workplaces (Bryson and McKay, 1997). I therefore control for individual union
membership status to help distinguish between ‘membership’ and ‘workplace’ union effects.
Workforce composition: Two workforce composition variables are introduced
alongside those used in the analysis of managerial perceptions. I include the percentage of
managers who are women to identify whether there is anything distinctive about the style of
women managers which employees respond to.22 Secondly, I include a count variable
identifying the total number of occupations at the workplace to differentiate simpler and more
complex work processes. The variable seeks to control for the possibility that effects
associated with fragmented bargaining are simply picking up the effects of a more
fragmented workforce.
4. Analysis
4.1 The samples
The analysis of managerial perceptions of climate is based on all the respondents to the
managerial questionnaire in WERS98 with non-missing data. The respondent is the person
with day-to-day responsibility for personnel and employment relations matters at the
workplace. With weighting to account for complex survey design, survey results can be
generalised with confidence to the population of workplaces in Britain employing 10 or more
employees.
22
The analysis of employees’ perceptions of climate is based on all respondents to the
employee questionnaire with non-missing data. Others have confined their analyses of
employees’ perceptions of climate to non-managerial employees, perhaps because managers
are overwhelmingly positive in their assessment of climate and lie on one side of the
management-employee line, while non-managerial employees lie on the other (Cully et al.,
1999: 276-283). I adopt an alternative approach, analysing the perceptions of all employees
with non-missing data. After all, most managers experience ‘being managed’ or supervised.
Those managers actually responsible for employee relations at sampled workplaces were
eligible for the main management questionnaire, and were not included in the eligible sample
of employees at the workplace. Our models include occupational controls to account for
more positive perceptions of climate further up the occupational hierarchy.With weighting to
account for complex survey design, the employee survey results can be generalised with
confidence to the population of employees in Britain employed at workplaces with 10 or
more employees.
4.2 Modelling procedures
The climate variables are categorical indicators defined in terms of ordered responses. I use
ordered probit estimators to model the relationship between these dependent variables and
sets of independent variables. In ordered probit, an underlying unobservable score is
estimated as a linear function of the independent variables and a set of unknown ‘threshold’
parameters, or cut points. The probability of observing outcome i corresponds to the
probability that the estimated linear function plus random error is within the range of the cut
points estimated for the outcome. It is assumed that the error term is normally distributed
(Greene, 1997). Significant positive coefficients indicate variables associated with better
climate.
Analyses take account of the complex survey design allowing results to be generalised
to the workplace and employee populations from which the samples were drawn. First, all
models are run on data weighted by the inverse of the employer’s sampling probability in the
case of the analysis of management data, and the employee’s sampling probability in the case
of the employee data. As well as allowing the results to be generalised to the population from
22 Whether managerial style is gendered has been the subject of much speculation and analysis recently (Wajcman, 1996, 2000).

23
which the sample is drawn, the use of probability weights also guards against estimation bias
which can arise through differential sample selection probabilities.23 Secondly, we employ
the Huber-White robust variance estimator that produces consistent standard errors in the
presence of heteroscedasticity.24 Thirdly, we obtain accurate standard errors by taking
account of sample stratification and the non-independence of employee observations due to
clustering in the primary sampling units, namely workplaces.
This procedure uses pseudo-likelihood methods, the point estimates being those from
a weighted ‘likelihood’ which is not the distribution function for the sample. Thus, standard
likelihood-ratio tests are not valid (Skinner, 1989; STATA Manual, Release 6, Volume 4,
1999).
5. Results
5.1 Employer perceptions of climate
Appendix Tables 3 and 4 contain estimates of union effects on employer perceptions of the
employee relations climate. The dependent variable is the one presented in the last column of
Table 1, but due to the small number of respondents saying climate was ‘poor’ or ‘very poor’
I have collapsed these two categories so that the outcome variable runs from 1 ‘poor/very
poor’ to 4 ‘very good’. Positive coefficients indicate factors associated with better climate.
Effects of categorical variables such as the type of bargaining arrangement are
evaluated against a ‘reference’ category. These categories are identified in the tables, and
significance tests in the tables are based on comparisons of coefficients with the reference
category. However, there may be statistically significant effects across categories. I test for
these and report on all significant effects.25
Appendix Table 3 presents seven models, each containing the full set of control
variables, plus alternative measures of union strength. Managers in unionised workplaces
23 Differential sampling fractions can result in standard estimator biases (Skinner, 1997). The weights account for all variation in sampling probabilities, thus eliminating differential sampling probability as a possible source of estimation bias. 24 The F statistic reported for each model is a Wald test based on the robustly estimated variance matrix. 25 I do so by rebasing the equations, that is, altering reference categories, and, in other cases, by computing whether effects are significant using STATA’s SVYLC command (STATA Manual Release 6, Volume 4, pp.36-50).

24
had poorer perceptions of climate than managers in non-unionised workplaces, ceteris
paribus, but the effect is only significant at a 90 per cent confidence level (Model (1)).
However, the presence of an on-site union representative offsets this underlying negative
effect (Model (2)). Only in the absence of an on-site representative were perceptions poorer
in unionised workplaces than in non-unionised workplaces (-0.34, t=1.94). It may be that a
union with an on-site representative can operate more effectively as an agent for the
employer, or as a voice for workers, improving employer perceptions of climate as a result.
The union density and bargaining coverage measures give somewhat conflicting
indications as to the effect of union strength. The union density measure provides no support
for our proposition that managers may perceive climate as poorer where unions are strong or
weak. On the contrary, their perceptions of climate were poorest where union density was
mid-range, that is, between 25 and 74 per cent (Model (3)). However, high bargaining
coverage was associated with poorer managerial perceptions of climate, although 100 per
cent coverage was not (Model (4)). Other analyses of WERS98 show that the union wage
premium was confined to workplaces with high bargaining coverage, and was absent where
there was 100 per cent coverage (Forth and Millward, 2000). Taken together, these findings
are consistent with the proposition that managers perceive the climate to be poorest where
unions engage in effective wage bargaining.
There is no support for the proposition that managers perceive climate as poorer
where worker voice is fragmented. Multi-unionism was not associated with poorer climate
(Model (5)), and managerial perceptions of climate did not benefit from a unified worker
voice in the form of a single union or single-table bargaining (Model (6)). Finally, although
dual channel arrangements, whereby union voice existed alongside non-union voice, were
associated with poorer perceptions of climate relative to workplaces with no worker voice,
the effect was barely statistically significant (Model (7)).
In general, union strength and the degree to which worker voice is unified appear to
be less important in explaining employer perceptions of climate than workforce composition,
workplace characteristics such as size26 and industry, and management practices. However,
there is some evidence that managers viewed climate more poorly where unions were
26 In contrast to much of the literature, managers of smaller workplaces had poorer perceptions of climate. However, managers in owner-managed workplaces, which are often small, had better perceptions of climate than managers in other workplaces, ceteris paribus.
25
recognised for pay bargaining, particularly where bargaining coverage was high and where
on-site representation was absent.
Appendix Table 4 presents models containing three alternative measures of
management attitudes towards unions. The models contain the same set of controls as those
in Appendix Table 3. Model (1) shows that the negative perceptions of climate in the
presence of recognised unions is confined to instances in which the union receives no
practical support from management in encouraging union membership in the form of
membership endorsement or enforcing a closed shop. This supports the contention that
employee relations will be poor where there is a union present that is not actively supported
by management. The proposition receives further support in Model (2): controlling for
union recognition, where management was ‘in favour’ of union membership, managerial
perceptions of climate were more favourable than where they were ‘not in favour’. However,
the effect is only significant at a 90 per cent confidence level. Although there is an indication
that perceptions of climate were better where managers ‘strongly disagreed’ that they would
rather consult directly with employees than with unions, the effect was not statistically
significant (Model (3)).
In summary, unionisation has an underlying negative impact on employer perceptions
of climate. However, this effect is absent where employers support union membership, and
where employers benefit from the presence of a union representative on-site who may operate
either as an effective communication channel with management in delivering workers’
‘voice’, or as an agent for the employer, or both.
5.2 Employee perceptions of climate
Appendix Tables 5 and 6 contain estimates of union effects on employee perceptions of the
employee relations climate. The dependent variable is the one presented in the first column
of Table 1. The outcome variable runs from 1 ‘very poor’ to 5 ‘very good’. Again, positive
coefficients indicate factors associated with better climate.
As in the case of managerial perceptions, union recognition was associated with
poorer perceptions of climate, ceteris paribus, though the effect is only significant at a 90 per
cent confidence level (Appendix Table 5, Model (1)).27 However, in stark contrast to the
27 It is conceivable that individual union membership status and workplace tenure are both endogenous with respect to employee perceptions of climate since those who are least satisfied with the climate may be inclined

26
findings for managers, employee perceptions were significantly poorer in the presence of an
on-site worker representative (Model (2)). It may be that ‘voice-induced complaining’ and
awareness of managerial shortcomings, discussed in Section Three, are both heightened in the
presence of on-site representatives through their roles as purveyors of information and
galvanisers of support for union causes.
Contrary to expectations, employee perceptions of climate were not poorest where
unions were weak. Rather, they were poorest where unions were strong. Thus, employee
perceptions of climate deteriorated as union density rose (Model (2)). Where union density
was low, employee perceptions of climate were no different from those held by employees in
workplaces with no union members. Climate was particularly poor where union density
exceeded 75 per cent. Similarly, employee perceptions of climate were poorest where
bargaining coverage was high (Model (3)). As in the case of employers’ perceptions,
perceptions of climate were no different in workplaces with 100 per cent coverage than they
were in workplaces with no bargaining coverage, ceteris paribus.
Earlier I suggested that employer perceptions of climate might be negatively affected
by fragmented worker voice, whereas employees may benefit from fragmentation because
fragmentation, whether in the form of multiple unions or union and non-union voice, may be
better able to meet the needs of heterogeneous workers. In fact, this was not so. It was
employees who perceived climate to be poorer where worker voice was fragmented.
Employee perceptions of climate were poorest where there were multiple unions (Model (5)),
where each union bargained separately (Model (6)), and where there was dual channel
communication (Model (7)). Interestingly, Model (6) shows that single-table bargaining can
ameliorate the negative effects of multiple unionism. This suggests that poorer employee
perceptions of climate in the presence of multiple unionism was associated with the
bargaining process, rather than other factors associated with multiple unionism such as
demarcation disputes. The negative effects of employers trying to reach agreement with
to respond by joining a union to ‘voice’ their concerns, or leaving (Freeman and Medoff, 1984). I therefore ran all the models presented here excluding individual union membership status and workplace tenure. Since union members are predominantly concentrated in workplaces with unions recognised for pay bargaining, and since unions are known to increase average workplace tenure by reducing the propensity to quit, one would expect the negative effects of membership and longer tenure to transfer to our unionisation measures once they are excluded from the models. This is precisely what happens, so that the union effects are much stronger in the absence of these two variables. For example, in Model (1), the union recognition dummy has a coefficient of –0.15 and a t-statistic of 3.88 once membership status and workplace tenure are removed. My rationale for their retention in the models is to estimate union effects net of these membership and tenure effects.
27
unions with competing interests outweighed any beneficial effects arising from multiple
unions’ ability to represent sections of a workforce more effectively.
In principle, non-union voice may complement union voice, either by helping union
non-members to articulate their voice, or by addressing issues for all workers that the union
does not address. In practice, dual channel voice was associated with poorer perceptions of
climate, suggesting that union and non-union voice may be substitutes for one another, rather
than complements.
Appendix Table 6 assesses the impact of managerial support for unions and employee
perceptions of union effectiveness on employees’ perceptions of climate. As in the case of
employers, employees’ negative perceptions of climate in the presence of recognised unions
were confined to instances in which the union received no practical support from
management in encouraging union membership in the form of membership endorsement or
enforcing a closed shop (Model (1)). It appears from Model (2) that management attitudes to
union membership were instrumental in determining how employees viewed the employee
relations climate. As anticipated, using employee perceptions of management attitudes to
union membership, it appears that employee perceptions were best where management
supported membership, and poorest where they were not in favour of membership.28
However, a different picture emerges when we match in what employers said their attitudes
were to union membership (Model (3)). Employee perceptions of climate did not differ
significantly according to what employers said their attitudes to union membership were,
except in the small number of cases where managers had said that union membership was
‘not an issue’.29 Taken together, these findings suggest that it is employees’ perception of
management attitudes to unions, rather than the actual, professed views of management,
which are important in explaining employees’ perceptions of climate. However, there is
evidence that employees respond particularly positively to employers who would rather
consult with employees directly rather than with unions (Model (4)).
Employee perceptions of union effectiveness were important in explaining employee
perceptions of climate. As anticipated, perceptions of climate were better where employees
thought the union was taken seriously by management, and they were particularly poor where
28 This finding was confirmed in separate models for union members and non-members. 29 In separate models for union members and non-members, I found employers’ professed attitudes towards union membership had no significant effect on members’ perceptions of climate. However, non-members were sensitive to the way in which management engaged with unions, favouring the scenario in which management were not in favour of membership, or viewed it as ‘not an issue’.
28
employees thought that management did not taken the union seriously (Model (5)). Running
separate models for union members and non-members, these effects were just as strong for
non-members as they were for members. This suggests that the finding is not simply
measuring the extent to which the union can deliver for its members. It may also be an
indicator of the extent to which employers engage seriously with the concerns and interests of
all employees. A similar conclusion can be drawn from Model (6) which shows that unions
perceived as effectively dealing with members’ concerns can contribute to a better employee
relations climate. Again, this finding held for members and non-members.
6. Conclusions
Using matched employer-employee data from the WERS98, we have shown that employees
tend to have a poorer perception of the employee relations climate at their workplace than
their employers. These differences can be explained, at least in part, by union effects since
what delivers better climate from an employer perspective does not always do so from an
employee perspective, and vice versa.
I hypothesised that employer perceptions of climate would be poor in the presence of
strong or weak unionism, but that they might be better where unions were strong enough to
operate effectively, without having excessive bargaining power. There was some support for
this hypothesis, since the poorer perceptions of climate associated with unionisation were
confined to workplaces without on-site worker representation, where worker voice is
necessarily weak. Equally, employer perceptions of climate were particularly poor where a
high percentage of workers were covered by collective bargaining. I interpret this effect as a
bargaining effect associated with circumstances in which unions are able to achieve a wage
premium.
I also hypothesised that employee perceptions of climate would be poor in the
presence of weak unions, and better where unions were sufficiently strong to represent
workers’; interests. In fact, employee perceptions of climate were poorest where there were
strong unions present, as indicated by the presence of an on-site representative, high union
density or high bargaining coverage. I suggested that these effects might be explained, in
part, by the politicising effect of strong unionism, and also by the antagonism that can arise
where unions use their bargaining strength to push wage claims.
29
Contrary to expectations, fragmented bargaining arrangements were not associated
with poorer employer perceptions of climate. Instead, they were associated with poorer
employee perceptions of climate. This suggests that employer moves to simplify bargaining
arrangements in the 1990s, discussed in Section Two, may have been in response to
employee concerns about fragmentation, rather than a direct response to employers’ own
perceptions of employee relations.
There is support from both employers and employees for the contention that employee
relations will be poor where there is a union present that is not actively supported by
management. But from an employee perspective, it is employees’ perception of management
attitudes to unions, rather than the actual, professed views of management, which are
important in explaining employees’ perceptions of climate.
Finally, the analysis confirms that the direction of union effects on employee
perceptions of climate depends on how they perceive union effectiveness in dealing with
employers and with employees concerns. Where they are perceived as effective, they
contribute to better perceptions of climate, whilst ineffective unions are associated with
poorer climate. This was true for union members and non-members alike.
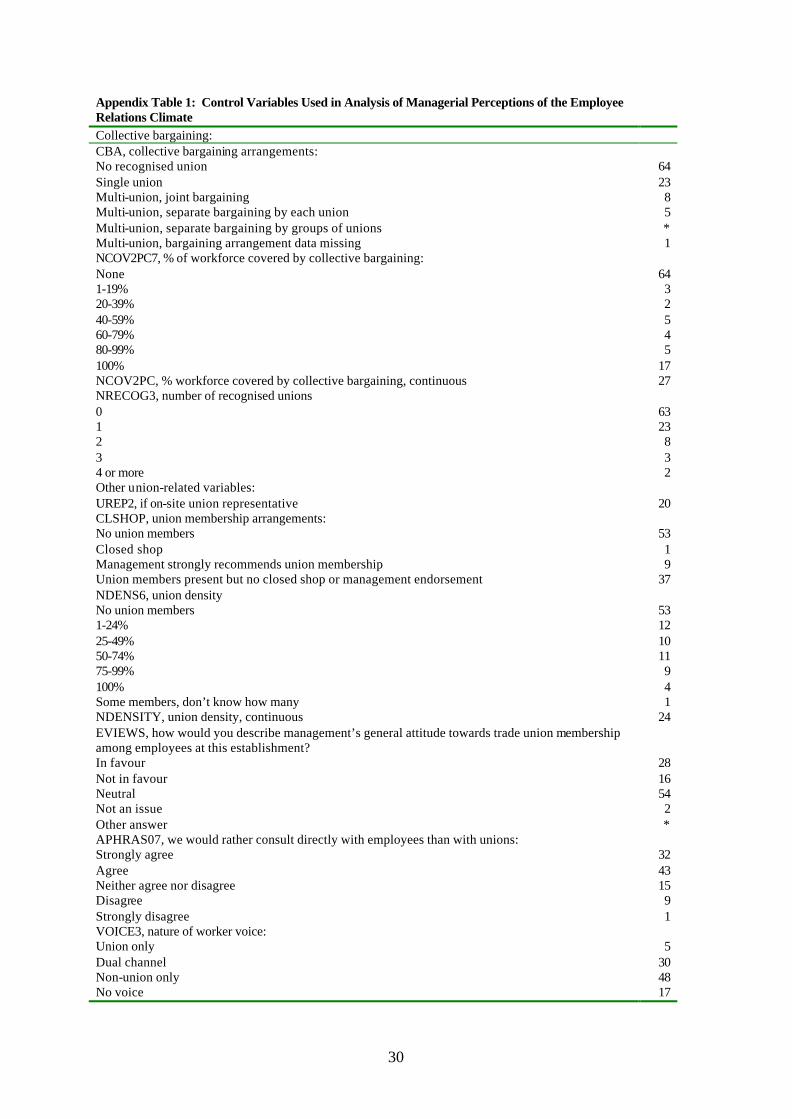
30
Appendix Table 1: Control Variables Used in Analysis of Managerial Perceptions of the Employee Relations Climate Collective bargaining: CBA, collective bargaining arrangements: No recognised union Single union Multi-union, joint bargaining Multi-union, separate bargaining by each union Multi-union, separate bargaining by groups of unions Multi-union, bargaining arrangement data missing
64 23 8 5 * 1
NCOV2PC7, % of workforce covered by collective bargaining: None 1-19% 20-39% 40-59% 60-79% 80-99% 100%
64 3 2 5 4 5
17 NCOV2PC, % workforce covered by collective bargaining, continuous 27 NRECOG3, number of recognised unions 0 1 2 3 4 or more
63 23 8 3 2
Other union-related variables: UREP2, if on-site union representative 20 CLSHOP, union membership arrangements: No union members Closed shop Management strongly recommends union membership Union members present but no closed shop or management endorsement
53 1 9
37 NDENS6, union density No union members 1-24% 25-49% 50-74% 75-99% 100% Some members, don’t know how many
53 12 10 11 9 4 1
NDENSITY, union density, continuous 24 EVIEWS, how would you describe management’s general attitude towards trade union membership among employees at this establishment? In favour Not in favour Neutral Not an issue Other answer
28 16 54 2 *
APHRAS07, we would rather consult directly with employees than with unions: Strongly agree Agree Neither agree nor disagree Disagree Strongly disagree
32 43 15 9 1
VOICE3, nature of worker voice: Union only Dual channel Non-union only No voice
5
30 48 17
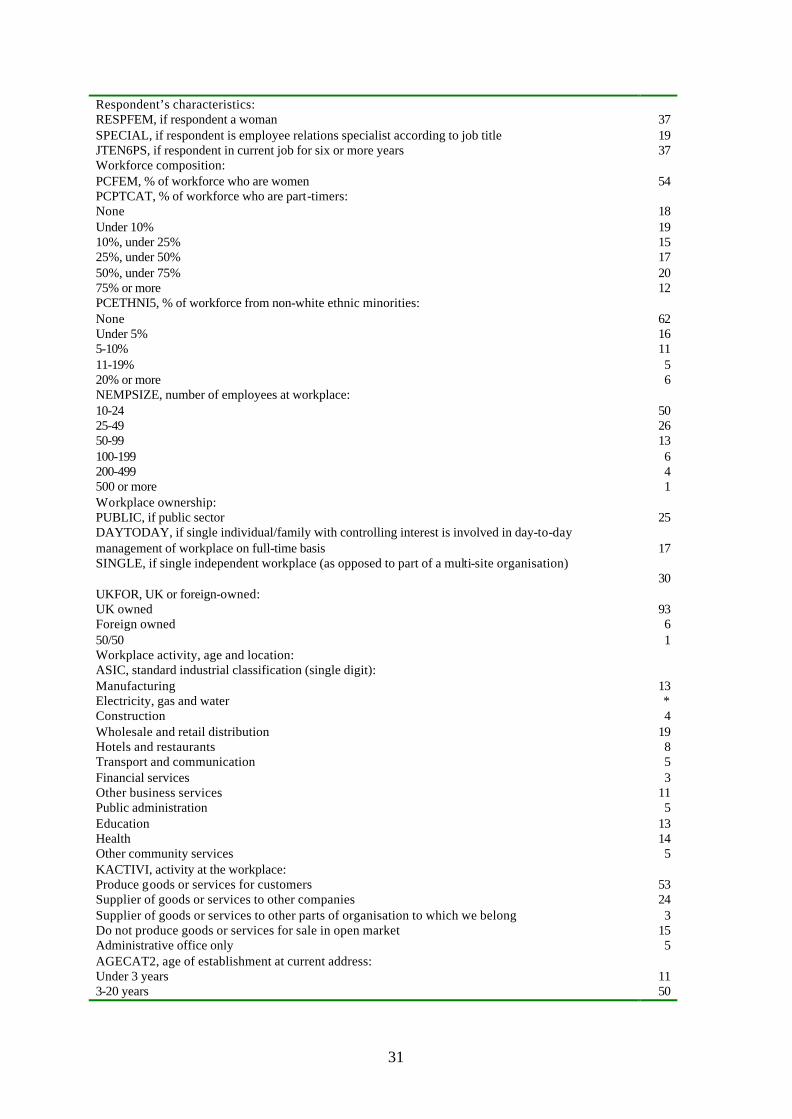
31
Respondent’s characteristics: RESPFEM, if respondent a woman 37 SPECIAL, if respondent is employee relations specialist according to job title 19 JTEN6PS, if respondent in current job for six or more years 37 Workforce composition: PCFEM, % of workforce who are women 54 PCPTCAT, % of workforce who are part-timers: None Under 10% 10%, under 25% 25%, under 50% 50%, under 75% 75% or more
18 19 15 17 20 12
PCETHNI5, % of workforce from non-white ethnic minorities: None Under 5% 5-10% 11-19% 20% or more
62 16 11 5 6
NEMPSIZE, number of employees at workplace: 10-24 25-49 50-99 100-199 200-499 500 or more
50 26 13 6 4 1
Workplace ownership: PUBLIC, if public sector 25 DAYTODAY, if single individual/family with controlling interest is involved in day-to-day management of workplace on full-time basis
17
SINGLE, if single independent workplace (as opposed to part of a multi-site organisation) 30
UKFOR, UK or foreign-owned: UK owned Foreign owned 50/50
93 6 1
Workplace activity, age and location: ASIC, standard industrial classification (single digit): Manufacturing Electricity, gas and water Construction Wholesale and retail distribution Hotels and restaurants Transport and communication Financial services Other business services Public administration Education Health Other community services
13 * 4
19 8 5 3
11 5
13 14 5
KACTIVI, activity at the workplace: Produce goods or services for customers Supplier of goods or services to other companies Supplier of goods or services to other parts of organisation to which we belong Do not produce goods or services for sale in open market Administrative office only
53 24 3
15 5
AGECAT2, age of establishment at current address: Under 3 years 3-20 years
11 50
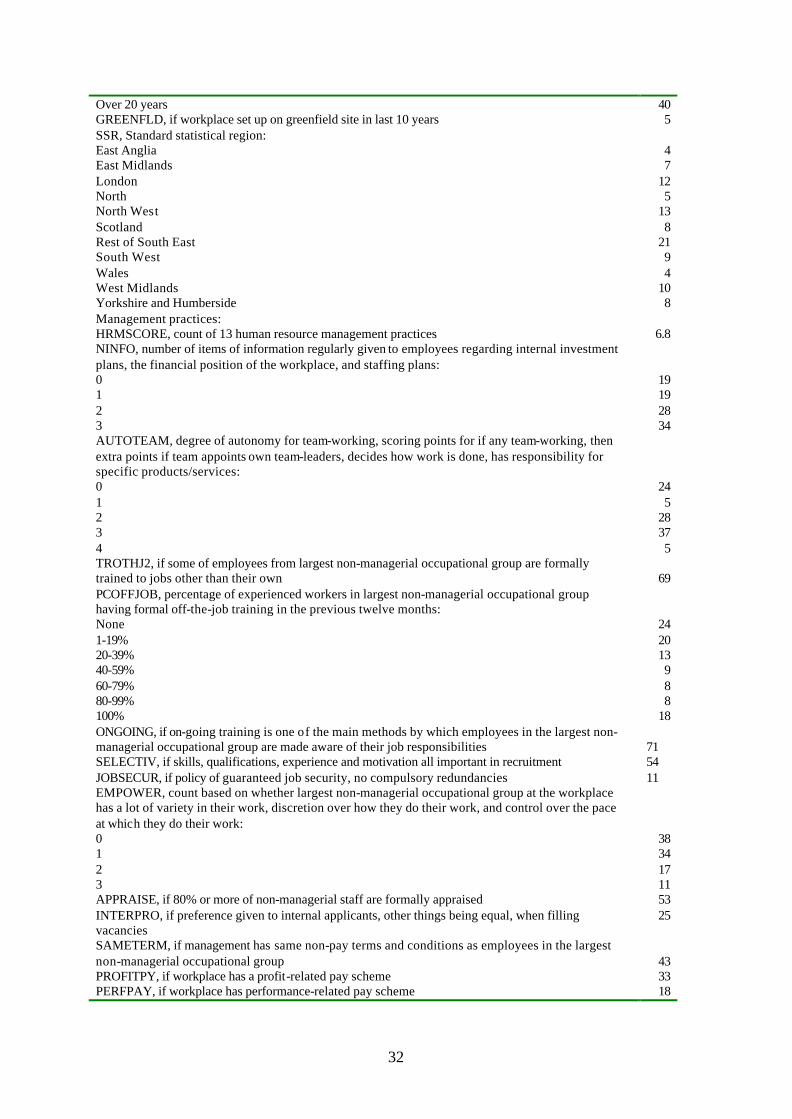
32
Over 20 years 40 GREENFLD, if workplace set up on greenfield site in last 10 years 5 SSR, Standard statistical region: East Anglia East Midlands London North North West Scotland Rest of South East South West Wales West Midlands Yorkshire and Humberside
4 7
12 5
13 8
21 9 4
10 8
Management practices: HRMSCORE, count of 13 human resource management practices 6.8 NINFO, number of items of information regularly given to employees regarding internal investment plans, the financial position of the workplace, and staffing plans: 0 1 2 3
19 19 28 34
AUTOTEAM, degree of autonomy for team-working, scoring points for if any team-working, then extra points if team appoints own team-leaders, decides how work is done, has responsibility for specific products/services: 0 1 2 3 4
24 5
28 37 5
TROTHJ2, if some of employees from largest non-managerial occupational group are formally trained to jobs other than their own
69
PCOFFJOB, percentage of experienced workers in largest non-managerial occupational group having formal off-the-job training in the previous twelve months: None 1-19% 20-39% 40-59% 60-79% 80-99% 100%
24 20 13 9 8 8
18 ONGOING, if on-going training is one of the main methods by which employees in the largest non-managerial occupational group are made aware of their job responsibilities
71
SELECTIV, if skills, qualifications, experience and motivation all important in recruitment 54 JOBSECUR, if policy of guaranteed job security, no compulsory redundancies 11 EMPOWER, count based on whether largest non-managerial occupational group at the workplace has a lot of variety in their work, discretion over how they do their work, and control over the pace at which they do their work: 0 1 2 3
38 34 17 11
APPRAISE, if 80% or more of non-managerial staff are formally appraised 53 INTERPRO, if preference given to internal applicants, other things being equal, when filling vacancies
25
SAMETERM, if management has same non-pay terms and conditions as employees in the largest non-managerial occupational group
43
PROFITPY, if workplace has a profit-related pay scheme 33 PERFPAY, if workplace has performance-related pay scheme 18
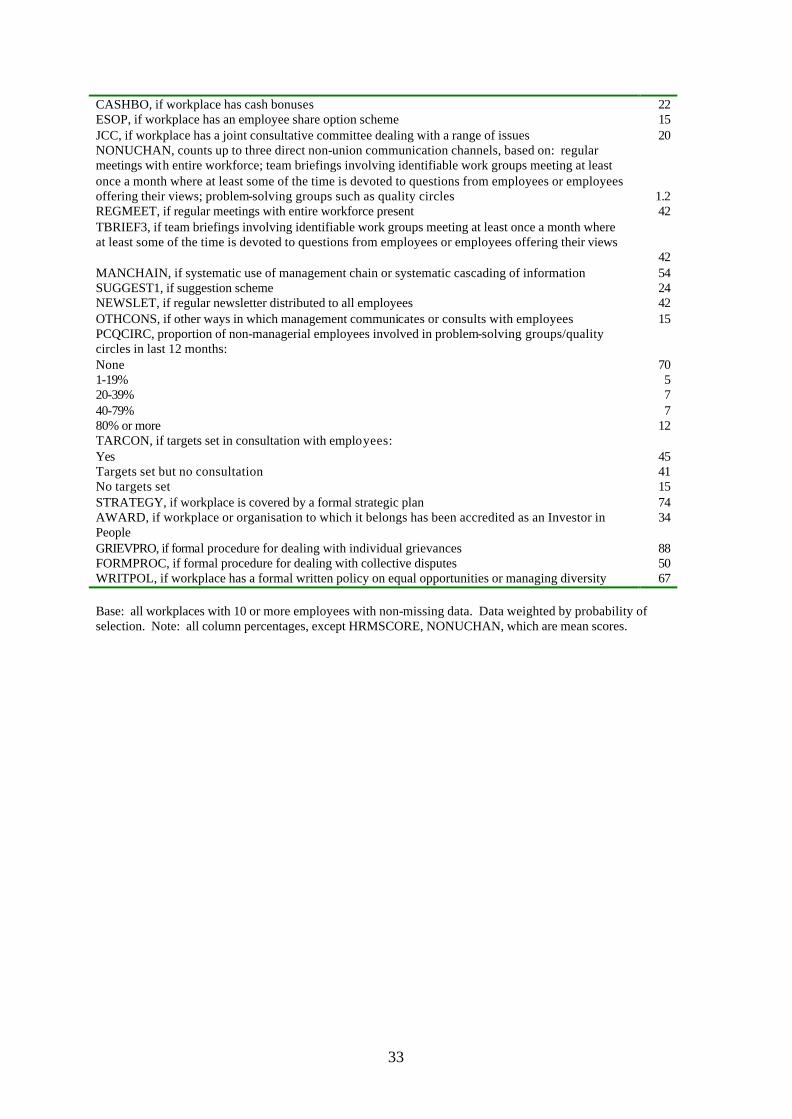
33
CASHBO, if workplace has cash bonuses 22 ESOP, if workplace has an employee share option scheme 15 JCC, if workplace has a joint consultative committee dealing with a range of issues 20 NONUCHAN, counts up to three direct non-union communication channels, based on: regular meetings with entire workforce; team briefings involving identifiable work groups meeting at least once a month where at least some of the time is devoted to questions from employees or employees offering their views; problem-solving groups such as quality circles
1.2 REGMEET, if regular meetings with entire workforce present 42 TBRIEF3, if team briefings involving identifiable work groups meeting at least once a month where at least some of the time is devoted to questions from employees or employees offering their views
42 MANCHAIN, if systematic use of management chain or systematic cascading of information 54 SUGGEST1, if suggestion scheme 24 NEWSLET, if regular newsletter distributed to all employees 42 OTHCONS, if other ways in which management communicates or consults with employees 15 PCQCIRC, proportion of non-managerial employees involved in problem-solving groups/quality circles in last 12 months: None 1-19% 20-39% 40-79% 80% or more
70 5 7 7
12 TARCON, if targets set in consultation with employees: Yes Targets set but no consultation No targets set
45 41 15
STRATEGY, if workplace is covered by a formal strategic plan 74 AWARD, if workplace or organisation to which it belongs has been accredited as an Investor in People
34
GRIEVPRO, if formal procedure for dealing with individual grievances 88 FORMPROC, if formal procedure for dealing with collective disputes 50 WRITPOL, if workplace has a formal written policy on equal opportunities or managing diversity 67 Base: all workplaces with 10 or more employees with non-missing data. Data weighted by probability of selection. Note: all column percentages, except HRMSCORE, NONUCHAN, which are mean scores.
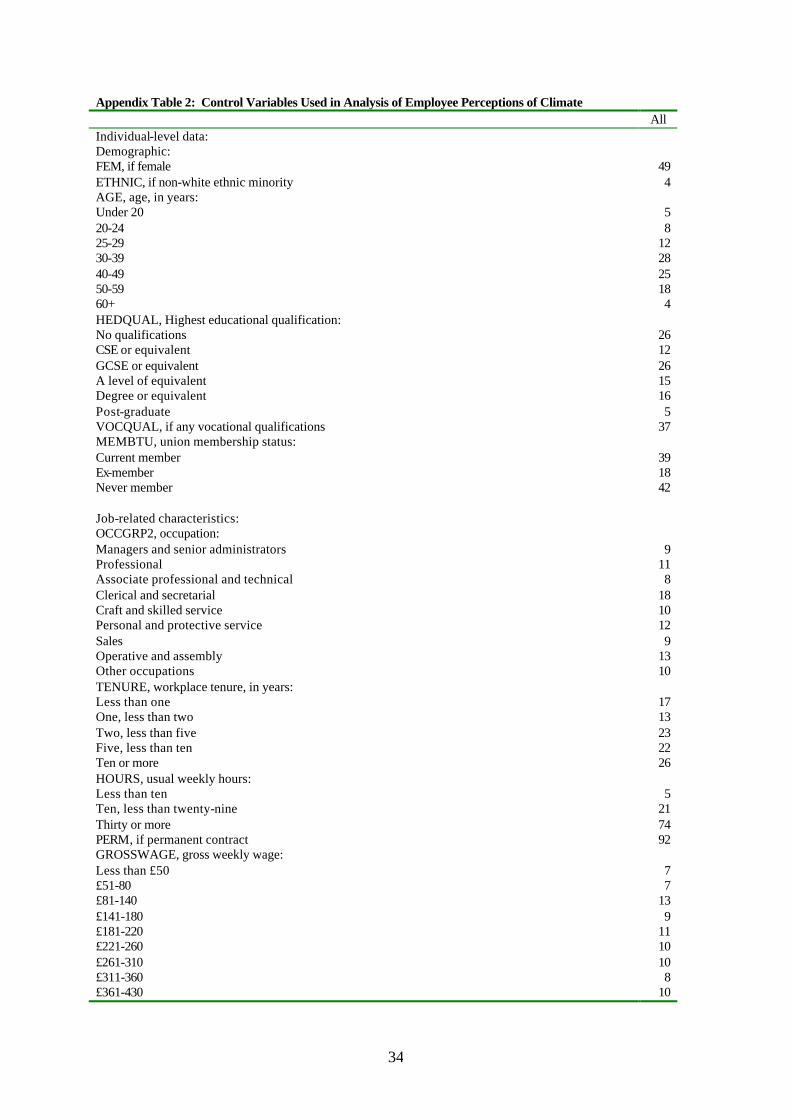
34
Appendix Table 2: Control Variables Used in Analysis of Employee Perceptions of Climate All Individual-level data: Demographic: FEM, if female 49 ETHNIC, if non-white ethnic minority 4 AGE, age, in years: Under 20 20-24 25-29 30-39 40-49 50-59 60+
5 8
12 28 25 18 4
HEDQUAL, Highest educational qualification: No qualifications CSE or equivalent GCSE or equivalent A level of equivalent Degree or equivalent Post-graduate
26 12 26 15 16 5
VOCQUAL, if any vocational qualifications 37 MEMBTU, union membership status: Current member Ex-member Never member
39 18 42
Job-related characteristics: OCCGRP2, occupation: Managers and senior administrators Professional Associate professional and technical Clerical and secretarial Craft and skilled service Personal and protective service Sales Operative and assembly Other occupations
9
11 8
18 10 12 9
13 10
TENURE, workplace tenure, in years: Less than one One, less than two Two, less than five Five, less than ten Ten or more
17 13 23 22 26
HOURS, usual weekly hours: Less than ten Ten, less than twenty-nine Thirty or more
5
21 74
PERM, if permanent contract 92 GROSSWAGE, gross weekly wage: Less than £50 £51-80 £81-140 £141-180 £181-220 £221-260 £261-310 £311-360 £361-430
7 7
13 9
11 10 10 8
10
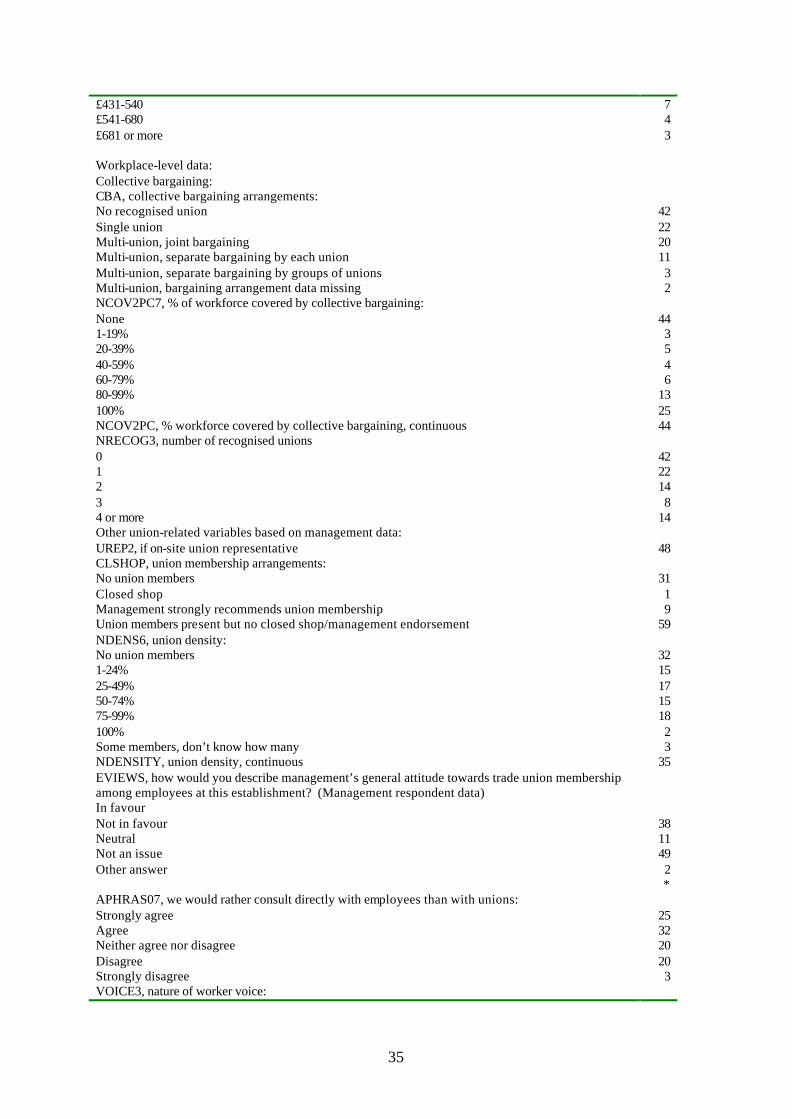
35
£431-540 £541-680 £681 or more
7 4 3
Workplace-level data: Collective bargaining: CBA, collective bargaining arrangements: No recognised union Single union Multi-union, joint bargaining Multi-union, separate bargaining by each union Multi-union, separate bargaining by groups of unions Multi-union, bargaining arrangement data missing
42 22 20 11 3 2
NCOV2PC7, % of workforce covered by collective bargaining: None 1-19% 20-39% 40-59% 60-79% 80-99% 100%
44 3 5 4 6
13 25
NCOV2PC, % workforce covered by collective bargaining, continuous 44 NRECOG3, number of recognised unions 0 1 2 3 4 or more
42 22 14 8
14 Other union-related variables based on management data: UREP2, if on-site union representative 48 CLSHOP, union membership arrangements: No union members Closed shop Management strongly recommends union membership Union members present but no closed shop/management endorsement
31 1 9
59 NDENS6, union density: No union members 1-24% 25-49% 50-74% 75-99% 100% Some members, don’t know how many
32 15 17 15 18 2 3
NDENSITY, union density, continuous 35 EVIEWS, how would you describe management’s general attitude towards trade union membership among employees at this establishment? (Management respondent data) In favour Not in favour Neutral Not an issue Other answer
38 11 49 2 *
APHRAS07, we would rather consult directly with employees than with unions: Strongly agree Agree Neither agree nor disagree Disagree Strongly disagree
25 32 20 20 3
VOICE3, nature of worker voice:
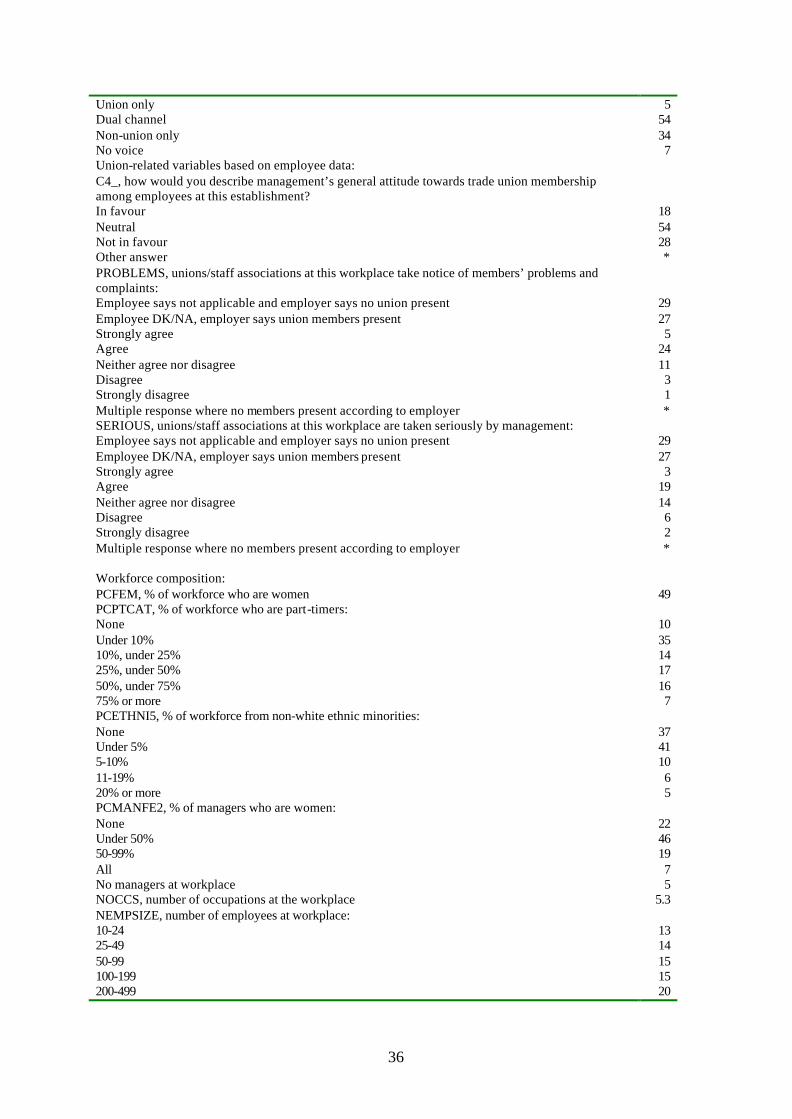
36
Union only Dual channel Non-union only No voice
5 54 34 7
Union-related variables based on employee data: C4_, how would you describe management’s general attitude towards trade union membership among employees at this establishment? In favour Neutral Not in favour Other answer
18 54 28 *
PROBLEMS, unions/staff associations at this workplace take notice of members’ problems and complaints: Employee says not applicable and employer says no union present Employee DK/NA, employer says union members present Strongly agree Agree Neither agree nor disagree Disagree Strongly disagree Multiple response where no members present according to employer
29 27 5
24 11 3 1 *
SERIOUS, unions/staff associations at this workplace are taken seriously by management: Employee says not applicable and employer says no union present Employee DK/NA, employer says union members present Strongly agree Agree Neither agree nor disagree Disagree Strongly disagree Multiple response where no members present according to employer
29 27 3
19 14 6 2 *
Workforce composition: PCFEM, % of workforce who are women 49 PCPTCAT, % of workforce who are part-timers: None Under 10% 10%, under 25% 25%, under 50% 50%, under 75% 75% or more
10 35 14 17 16 7
PCETHNI5, % of workforce from non-white ethnic minorities: None Under 5% 5-10% 11-19% 20% or more
37 41 10 6 5
PCMANFE2, % of managers who are women: None Under 50% 50-99% All No managers at workplace
22 46 19 7 5
NOCCS, number of occupations at the workplace 5.3 NEMPSIZE, number of employees at workplace: 10-24 25-49 50-99 100-199 200-499
13 14 15 15 20

37
500 or more 24 Workplace ownership: PUBLIC, if public sector 31 SINGLE, if single independent workplace (as opposed to part of a multi-site organisation) 22 UKFOR, UK or foreign-owned: UK owned Foreign owned 50/50
86 13 1
Workplace activity, age and location: ASIC, standard industrial classification (single digit): Manufacturing Electricity, gas and water Construction Wholesale and retail distribution Hotels and restaurants Transport and communication Financial services Other business services Public administration Education Health Other community services
23 1 3
15 4 6 4 8 9
10 13 3
KACTIVI, activity at the workplace: Produce goods or services for customers Supplier of goods or services to other companies Supplier of goods/services to other parts of organisation Do not produce goods or services for sale in open market Administrative office only
53 22 7
14 4
AGECAT2, age of establishment at current address: Under 3 years 3-20 years Over 20 years
8
41 51
SSR, Standard statistical region: East Anglia East Midlands London North North West Scotland Rest of South East South West Wales West Midlands Yorkshire and Humberside
5 9
10 7
10 10 19 8 4
10 8
Management practices: SPECIAL, if main managerial respondent is an employee relations specialist 49 HRMSCORE, count of 13 human resource management practices 7.5 NINFO, number of items of information regularly given to employees regarding internal investment plans, the financial position of the workplace, and staffing plans: 0 1 2 3
13 17 28 42
AUTOTEAM, degree of autonomy for team-working, scoring points for if any team-working, then extra points if team appoints own team-leaders, decides how work is done, has responsibility for specific products/services: 0 1 2
13 7
36
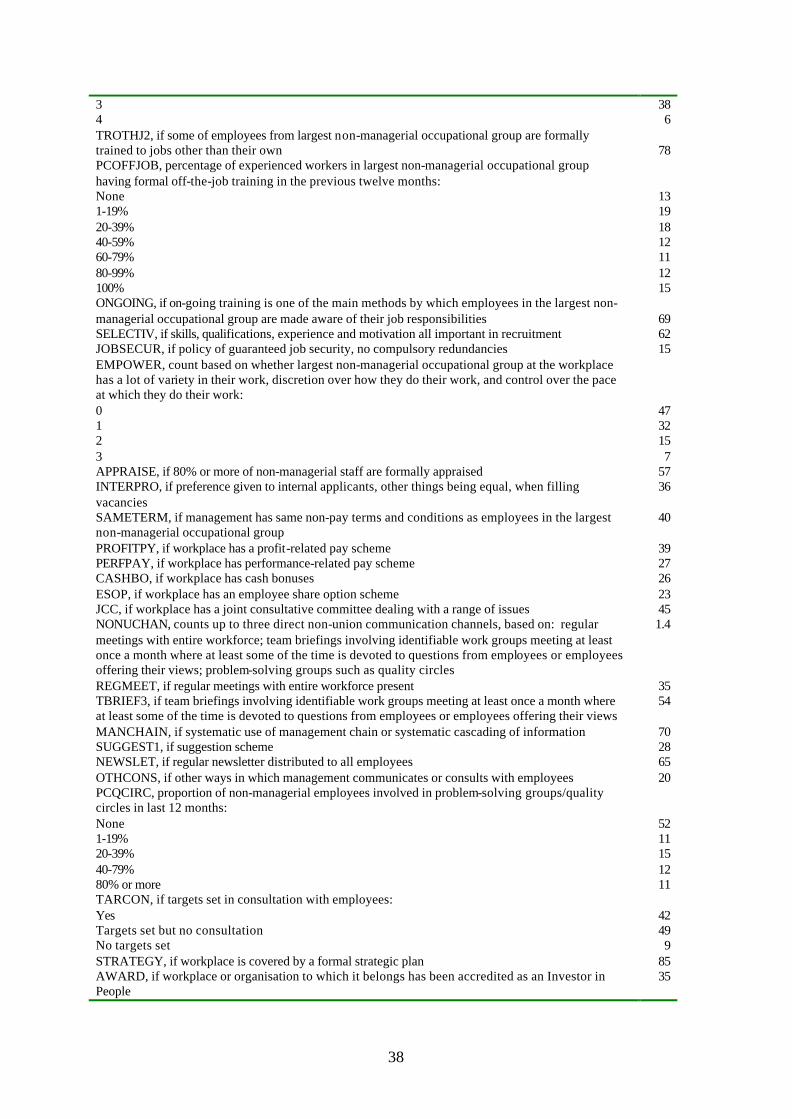
38
3 4
38 6
TROTHJ2, if some of employees from largest non-managerial occupational group are formally trained to jobs other than their own
78
PCOFFJOB, percentage of experienced workers in largest non-managerial occupational group having formal off-the-job training in the previous twelve months: None 1-19% 20-39% 40-59% 60-79% 80-99% 100%
13 19 18 12 11 12 15
ONGOING, if on-going training is one of the main methods by which employees in the largest non-managerial occupational group are made aware of their job responsibilities
69
SELECTIV, if skills, qualifications, experience and motivation all important in recruitment 62 JOBSECUR, if policy of guaranteed job security, no compulsory redundancies 15 EMPOWER, count based on whether largest non-managerial occupational group at the workplace has a lot of variety in their work, discretion over how they do their work, and control over the pace at which they do their work: 0 1 2 3
47 32 15 7
APPRAISE, if 80% or more of non-managerial staff are formally appraised 57 INTERPRO, if preference given to internal applicants, other things being equal, when filling vacancies
36
SAMETERM, if management has same non-pay terms and conditions as employees in the largest non-managerial occupational group
40
PROFITPY, if workplace has a profit-related pay scheme 39 PERFPAY, if workplace has performance-related pay scheme 27 CASHBO, if workplace has cash bonuses 26 ESOP, if workplace has an employee share option scheme 23 JCC, if workplace has a joint consultative committee dealing with a range of issues 45 NONUCHAN, counts up to three direct non-union communication channels, based on: regular meetings with entire workforce; team briefings involving identifiable work groups meeting at least once a month where at least some of the time is devoted to questions from employees or employees offering their views; problem-solving groups such as quality circles
1.4
REGMEET, if regular meetings with entire workforce present 35 TBRIEF3, if team briefings involving identifiable work groups meeting at least once a month where at least some of the time is devoted to questions from employees or employees offering their views
54
MANCHAIN, if systematic use of management chain or systematic cascading of information 70 SUGGEST1, if suggestion scheme 28 NEWSLET, if regular newsletter distributed to all employees 65 OTHCONS, if other ways in which management communicates or consults with employees 20 PCQCIRC, proportion of non-managerial employees involved in problem-solving groups/quality circles in last 12 months: None 1-19% 20-39% 40-79% 80% or more
52 11 15 12 11
TARCON, if targets set in consultation with employees: Yes Targets set but no consultation No targets set
42 49 9
STRATEGY, if workplace is covered by a formal strategic plan 85 AWARD, if workplace or organisation to which it belongs has been accredited as an Investor in People
35

39
GRIEVPRO, if formal procedure for dealing with individual grievances 96 FORMPROC, if formal procedure for dealing with collective disputes 66 WRITPOL, if workplace has a formal written policy on equal opportunities or managing diversity 81 Base: all employees with non-missing data in workplaces with 10 or more employees. Note all are column percentages, except HRMSCORE, NONUCHAN and NOCCS, all of which are the mean scores of count variables.
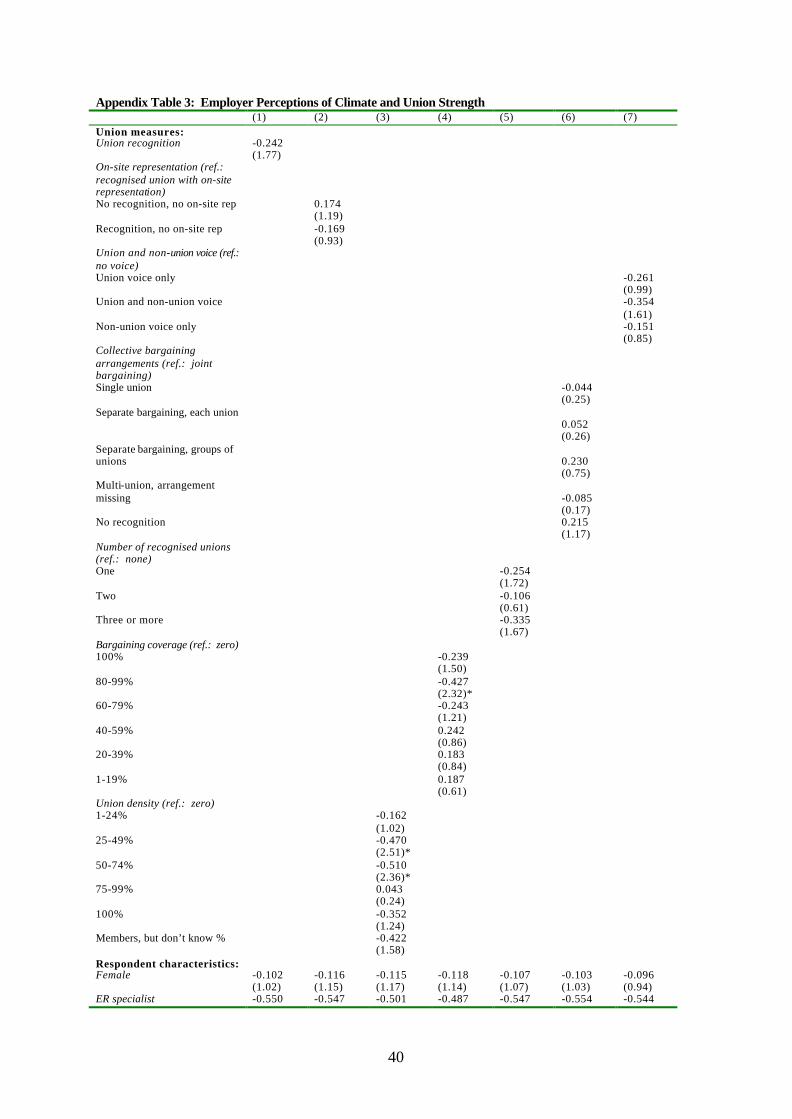
40
Appendix Table 3: Employer Perceptions of Climate and Union Strength (1) (2) (3) (4) (5) (6) (7) Union measures: Union recognition -0.242 (1.77) On-site representation (ref.: recognised union with on-site representation)
No recognition, no on-site rep 0.174 (1.19) Recognition, no on-site rep -0.169 (0.93) Union and non-union voice (ref.: no voice)
Union voice only -0.261 (0.99) Union and non-union voice -0.354 (1.61) Non-union voice only -0.151 (0.85) Collective bargaining arrangements (ref.: joint bargaining)
Single union -0.044 (0.25) Separate bargaining, each union
0.052
(0.26) Separate bargaining, groups of unions
0.230
(0.75) Multi-union, arrangement missing
-0.085
(0.17) No recognition 0.215 (1.17) Number of recognised unions (ref.: none)
One -0.254 (1.72) Two -0.106 (0.61) Three or more -0.335 (1.67) Bargaining coverage (ref.: zero) 100% -0.239 (1.50) 80-99% -0.427 (2.32)* 60-79% -0.243 (1.21) 40-59% 0.242 (0.86) 20-39% 0.183 (0.84) 1-19% 0.187 (0.61) Union density (ref.: zero) 1-24% -0.162 (1.02) 25-49% -0.470 (2.51)* 50-74% -0.510 (2.36)* 75-99% 0.043 (0.24) 100% -0.352 (1.24) Members, but don’t know % -0.422 (1.58) Respondent characteristics: Female -0.102 -0.116 -0.115 -0.118 -0.107 -0.103 -0.096 (1.02) (1.15) (1.17) (1.14) (1.07) (1.03) (0.94) ER specialist -0.550 -0.547 -0.501 -0.487 -0.547 -0.554 -0.544
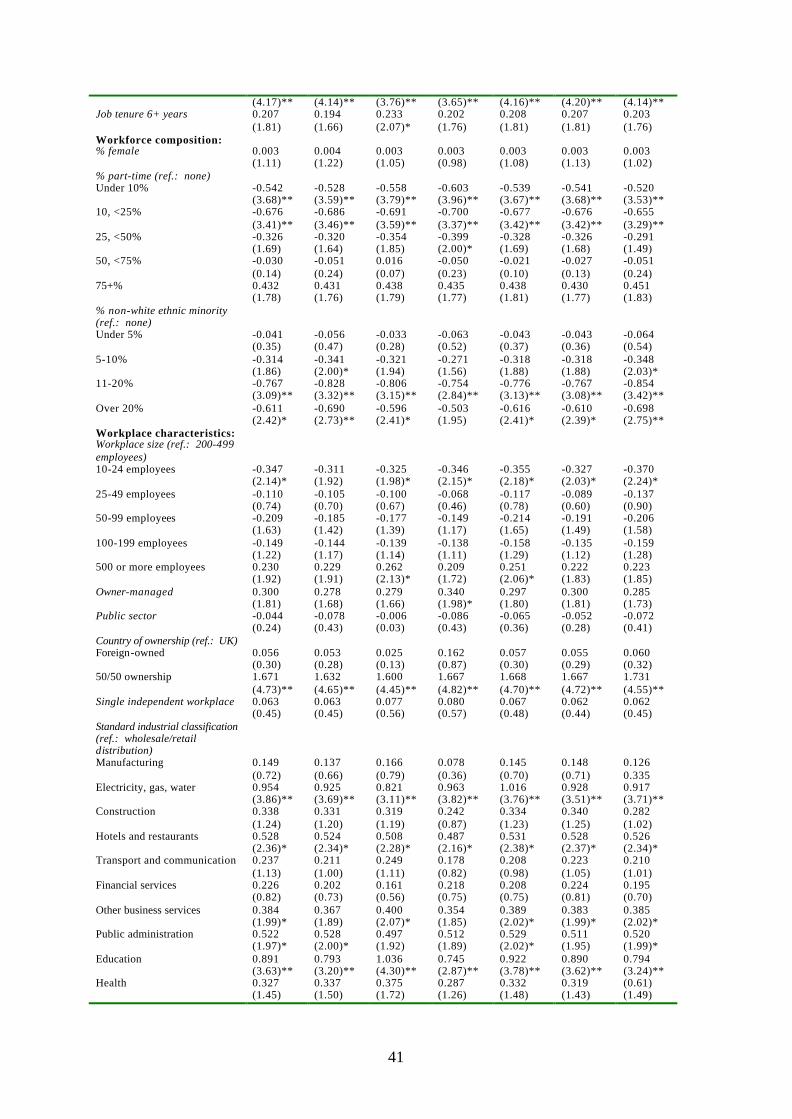
41
(4.17)** (4.14)** (3.76)** (3.65)** (4.16)** (4.20)** (4.14)** Job tenure 6+ years 0.207 0.194 0.233 0.202 0.208 0.207 0.203 (1.81) (1.66) (2.07)* (1.76) (1.81) (1.81) (1.76) Workforce composition: % female 0.003 0.004 0.003 0.003 0.003 0.003 0.003 (1.11) (1.22) (1.05) (0.98) (1.08) (1.13) (1.02) % part-time (ref.: none) Under 10% -0.542 -0.528 -0.558 -0.603 -0.539 -0.541 -0.520 (3.68)** (3.59)** (3.79)** (3.96)** (3.67)** (3.68)** (3.53)** 10, <25% -0.676 -0.686 -0.691 -0.700 -0.677 -0.676 -0.655 (3.41)** (3.46)** (3.59)** (3.37)** (3.42)** (3.42)** (3.29)** 25, <50% -0.326 -0.320 -0.354 -0.399 -0.328 -0.326 -0.291 (1.69) (1.64) (1.85) (2.00)* (1.69) (1.68) (1.49) 50, <75% -0.030 -0.051 0.016 -0.050 -0.021 -0.027 -0.051 (0.14) (0.24) (0.07) (0.23) (0.10) (0.13) (0.24) 75+% 0.432 0.431 0.438 0.435 0.438 0.430 0.451 (1.78) (1.76) (1.79) (1.77) (1.81) (1.77) (1.83) % non-white ethnic minority (ref.: none)
Under 5% -0.041 -0.056 -0.033 -0.063 -0.043 -0.043 -0.064 (0.35) (0.47) (0.28) (0.52) (0.37) (0.36) (0.54) 5-10% -0.314 -0.341 -0.321 -0.271 -0.318 -0.318 -0.348 (1.86) (2.00)* (1.94) (1.56) (1.88) (1.88) (2.03)* 11-20% -0.767 -0.828 -0.806 -0.754 -0.776 -0.767 -0.854 (3.09)** (3.32)** (3.15)** (2.84)** (3.13)** (3.08)** (3.42)** Over 20% -0.611 -0.690 -0.596 -0.503 -0.616 -0.610 -0.698 (2.42)* (2.73)** (2.41)* (1.95) (2.41)* (2.39)* (2.75)** Workplace characteristics: Workplace size (ref.: 200-499 employees)
10-24 employees -0.347 -0.311 -0.325 -0.346 -0.355 -0.327 -0.370 (2.14)* (1.92) (1.98)* (2.15)* (2.18)* (2.03)* (2.24)* 25-49 employees -0.110 -0.105 -0.100 -0.068 -0.117 -0.089 -0.137 (0.74) (0.70) (0.67) (0.46) (0.78) (0.60) (0.90) 50-99 employees -0.209 -0.185 -0.177 -0.149 -0.214 -0.191 -0.206 (1.63) (1.42) (1.39) (1.17) (1.65) (1.49) (1.58) 100-199 employees -0.149 -0.144 -0.139 -0.138 -0.158 -0.135 -0.159 (1.22) (1.17) (1.14) (1.11) (1.29) (1.12) (1.28) 500 or more employees 0.230 0.229 0.262 0.209 0.251 0.222 0.223 (1.92) (1.91) (2.13)* (1.72) (2.06)* (1.83) (1.85) Owner-managed 0.300 0.278 0.279 0.340 0.297 0.300 0.285 (1.81) (1.68) (1.66) (1.98)* (1.80) (1.81) (1.73) Public sector -0.044 -0.078 -0.006 -0.086 -0.065 -0.052 -0.072 (0.24) (0.43) (0.03) (0.43) (0.36) (0.28) (0.41) Country of ownership (ref.: UK) Foreign-owned 0.056 0.053 0.025 0.162 0.057 0.055 0.060 (0.30) (0.28) (0.13) (0.87) (0.30) (0.29) (0.32) 50/50 ownership 1.671 1.632 1.600 1.667 1.668 1.667 1.731 (4.73)** (4.65)** (4.45)** (4.82)** (4.70)** (4.72)** (4.55)** Single independent workplace 0.063 0.063 0.077 0.080 0.067 0.062 0.062 (0.45) (0.45) (0.56) (0.57) (0.48) (0.44) (0.45) Standard industrial classification (ref.: wholesale/retail distribution)
Manufacturing 0.149 0.137 0.166 0.078 0.145 0.148 0.126 (0.72) (0.66) (0.79) (0.36) (0.70) (0.71) 0.335 Electricity, gas, water 0.954 0.925 0.821 0.963 1.016 0.928 0.917 (3.86)** (3.69)** (3.11)** (3.82)** (3.76)** (3.51)** (3.71)** Construction 0.338 0.331 0.319 0.242 0.334 0.340 0.282 (1.24) (1.20) (1.19) (0.87) (1.23) (1.25) (1.02) Hotels and restaurants 0.528 0.524 0.508 0.487 0.531 0.528 0.526 (2.36)* (2.34)* (2.28)* (2.16)* (2.38)* (2.37)* (2.34)* Transport and communication 0.237 0.211 0.249 0.178 0.208 0.223 0.210 (1.13) (1.00) (1.11) (0.82) (0.98) (1.05) (1.01) Financial services 0.226 0.202 0.161 0.218 0.208 0.224 0.195 (0.82) (0.73) (0.56) (0.75) (0.75) (0.81) (0.70) Other business services 0.384 0.367 0.400 0.354 0.389 0.383 0.385 (1.99)* (1.89) (2.07)* (1.85) (2.02)* (1.99)* (2.02)* Public administration 0.522 0.528 0.497 0.512 0.529 0.511 0.520 (1.97)* (2.00)* (1.92) (1.89) (2.02)* (1.95) (1.99)* Education 0.891 0.793 1.036 0.745 0.922 0.890 0.794 (3.63)** (3.20)** (4.30)** (2.87)** (3.78)** (3.62)** (3.24)** Health 0.327 0.337 0.375 0.287 0.332 0.319 (0.61) (1.45) (1.50) (1.72) (1.26) (1.48) (1.43) (1.49)
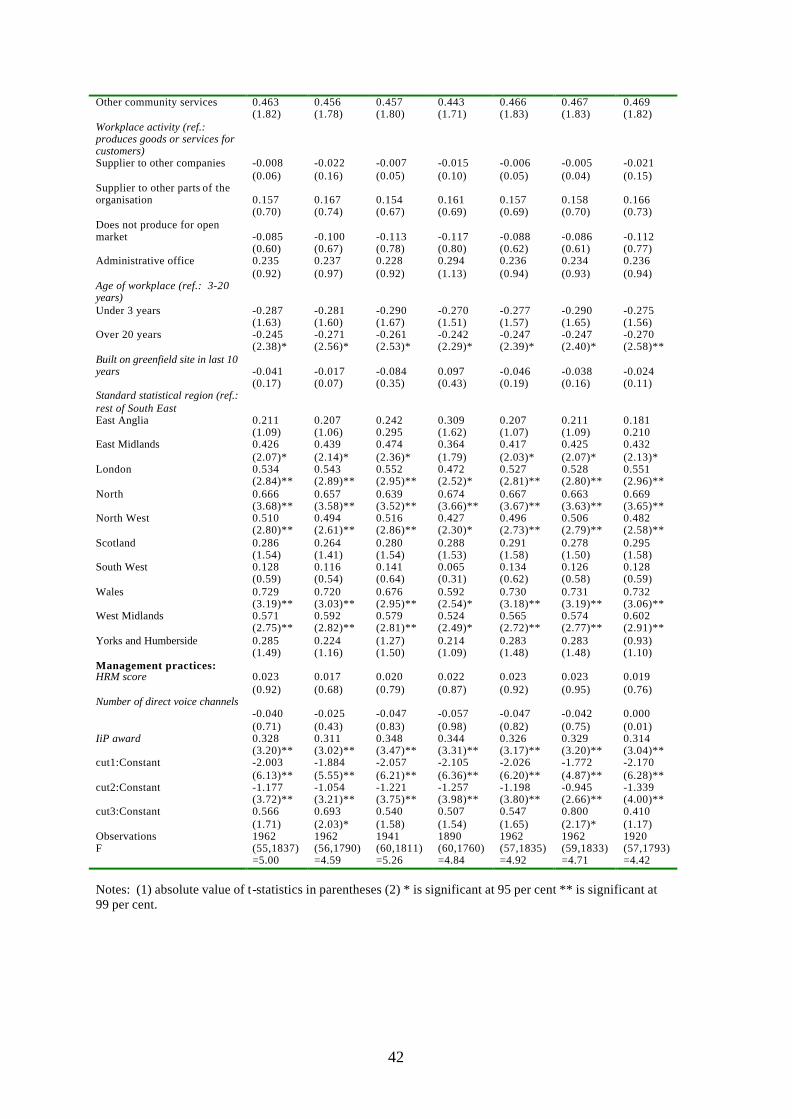
42
Other community services 0.463 0.456 0.457 0.443 0.466 0.467 0.469 (1.82) (1.78) (1.80) (1.71) (1.83) (1.83) (1.82) Workplace activity (ref.: produces goods or services for customers)
Supplier to other companies -0.008 -0.022 -0.007 -0.015 -0.006 -0.005 -0.021 (0.06) (0.16) (0.05) (0.10) (0.05) (0.04) (0.15) Supplier to other parts of the organisation
0.157
0.167
0.154
0.161
0.157
0.158
0.166
(0.70) (0.74) (0.67) (0.69) (0.69) (0.70) (0.73) Does not produce for open market
-0.085
-0.100
-0.113
-0.117
-0.088
-0.086
-0.112
(0.60) (0.67) (0.78) (0.80) (0.62) (0.61) (0.77) Administrative office 0.235 0.237 0.228 0.294 0.236 0.234 0.236 (0.92) (0.97) (0.92) (1.13) (0.94) (0.93) (0.94) Age of workplace (ref.: 3-20 years)
Under 3 years -0.287 -0.281 -0.290 -0.270 -0.277 -0.290 -0.275 (1.63) (1.60) (1.67) (1.51) (1.57) (1.65) (1.56) Over 20 years -0.245 -0.271 -0.261 -0.242 -0.247 -0.247 -0.270 (2.38)* (2.56)* (2.53)* (2.29)* (2.39)* (2.40)* (2.58)** Built on greenfield site in last 10 years
-0.041
-0.017
-0.084
0.097
-0.046
-0.038
-0.024
(0.17) (0.07) (0.35) (0.43) (0.19) (0.16) (0.11) Standard statistical region (ref.: rest of South East
East Anglia 0.211 0.207 0.242 0.309 0.207 0.211 0.181 (1.09) (1.06) 0.295 (1.62) (1.07) (1.09) 0.210 East Midlands 0.426 0.439 0.474 0.364 0.417 0.425 0.432 (2.07)* (2.14)* (2.36)* (1.79) (2.03)* (2.07)* (2.13)* London 0.534 0.543 0.552 0.472 0.527 0.528 0.551 (2.84)** (2.89)** (2.95)** (2.52)* (2.81)** (2.80)** (2.96)** North 0.666 0.657 0.639 0.674 0.667 0.663 0.669 (3.68)** (3.58)** (3.52)** (3.66)** (3.67)** (3.63)** (3.65)** North West 0.510 0.494 0.516 0.427 0.496 0.506 0.482 (2.80)** (2.61)** (2.86)** (2.30)* (2.73)** (2.79)** (2.58)** Scotland 0.286 0.264 0.280 0.288 0.291 0.278 0.295 (1.54) (1.41) (1.54) (1.53) (1.58) (1.50) (1.58) South West 0.128 0.116 0.141 0.065 0.134 0.126 0.128 (0.59) (0.54) (0.64) (0.31) (0.62) (0.58) (0.59) Wales 0.729 0.720 0.676 0.592 0.730 0.731 0.732 (3.19)** (3.03)** (2.95)** (2.54)* (3.18)** (3.19)** (3.06)** West Midlands 0.571 0.592 0.579 0.524 0.565 0.574 0.602 (2.75)** (2.82)** (2.81)** (2.49)* (2.72)** (2.77)** (2.91)** Yorks and Humberside 0.285 0.224 (1.27) 0.214 0.283 0.283 (0.93) (1.49) (1.16) (1.50) (1.09) (1.48) (1.48) (1.10) Management practices: HRM score 0.023 0.017 0.020 0.022 0.023 0.023 0.019 (0.92) (0.68) (0.79) (0.87) (0.92) (0.95) (0.76) Number of direct voice channels
-0.040 -0.025
-0.047
-0.057
-0.047
-0.042
0.000
(0.71) (0.43) (0.83) (0.98) (0.82) (0.75) (0.01) IiP award 0.328 0.311 0.348 0.344 0.326 0.329 0.314 (3.20)** (3.02)** (3.47)** (3.31)** (3.17)** (3.20)** (3.04)** cut1:Constant -2.003 -1.884 -2.057 -2.105 -2.026 -1.772 -2.170 (6.13)** (5.55)** (6.21)** (6.36)** (6.20)** (4.87)** (6.28)** cut2:Constant -1.177 -1.054 -1.221 -1.257 -1.198 -0.945 -1.339 (3.72)** (3.21)** (3.75)** (3.98)** (3.80)** (2.66)** (4.00)** cut3:Constant 0.566 0.693 0.540 0.507 0.547 0.800 0.410 (1.71) (2.03)* (1.58) (1.54) (1.65) (2.17)* (1.17) Observations 1962 1962 1941 1890 1962 1962 1920 F (55,1837)
=5.00 (56,1790)=4.59
(60,1811)=5.26
(60,1760)=4.84
(57,1835)=4.92
(59,1833)=4.71
(57,1793)=4.42
Notes: (1) absolute value of t-statistics in parentheses (2) * is significant at 95 per cent ** is significant at 99 per cent.
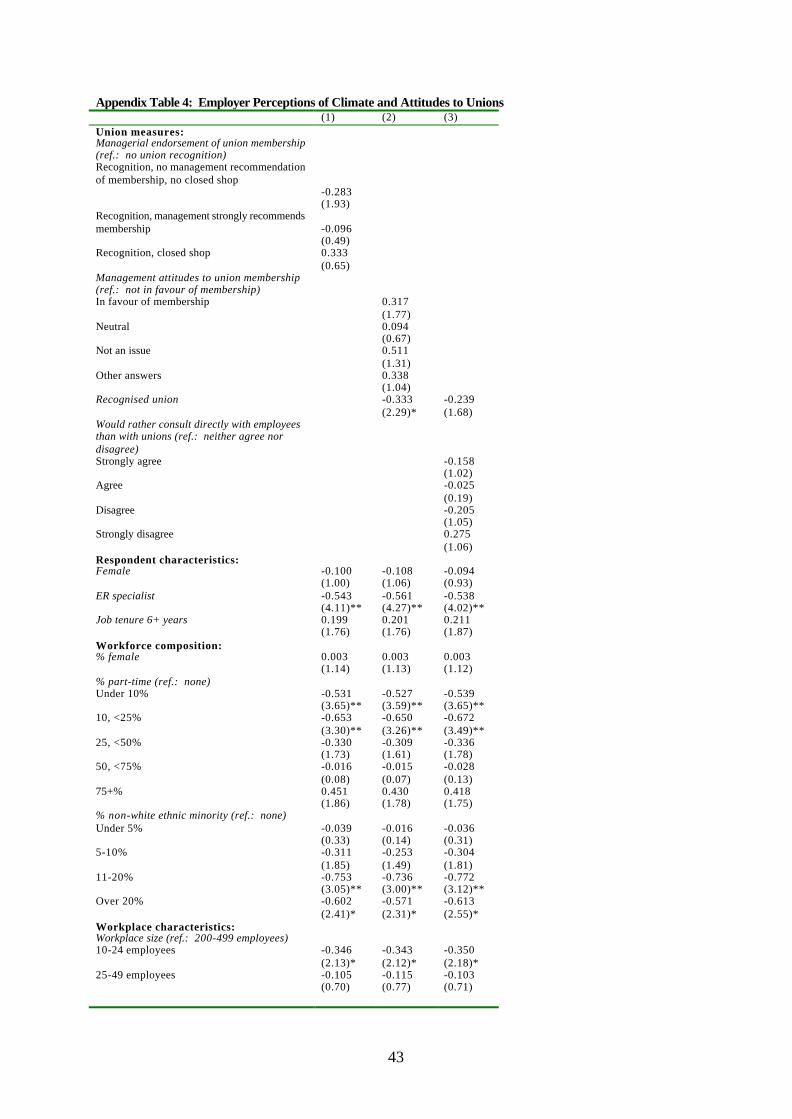
43
Appendix Table 4: Employer Perceptions of Climate and Attitudes to Unions (1) (2) (3) Union measures: Managerial endorsement of union membership (ref.: no union recognition)
Recognition, no management recommendation of membership, no closed shop
-0.283
(1.93) Recognition, management strongly recommends membership
-0.096
(0.49) Recognition, closed shop 0.333 (0.65) Management attitudes to union membership (ref.: not in favour of membership)
In favour of membership 0.317 (1.77) Neutral 0.094 (0.67) Not an issue 0.511 (1.31) Other answers 0.338 (1.04) Recognised union -0.333 -0.239 (2.29)* (1.68) Would rather consult directly with employees than with unions (ref.: neither agree nor disagree)
Strongly agree -0.158 (1.02) Agree -0.025 (0.19) Disagree -0.205 (1.05) Strongly disagree 0.275 (1.06) Respondent characteristics: Female -0.100 -0.108 -0.094 (1.00) (1.06) (0.93) ER specialist -0.543 -0.561 -0.538 (4.11)** (4.27)** (4.02)** Job tenure 6+ years 0.199 0.201 0.211 (1.76) (1.76) (1.87) Workforce composition: % female 0.003 0.003 0.003 (1.14) (1.13) (1.12) % part-time (ref.: none) Under 10% -0.531 -0.527 -0.539 (3.65)** (3.59)** (3.65)** 10, <25% -0.653 -0.650 -0.672 (3.30)** (3.26)** (3.49)** 25, <50% -0.330 -0.309 -0.336 (1.73) (1.61) (1.78) 50, <75% -0.016 -0.015 -0.028 (0.08) (0.07) (0.13) 75+% 0.451 0.430 0.418 (1.86) (1.78) (1.75) % non-white ethnic minority (ref.: none) Under 5% -0.039 -0.016 -0.036 (0.33) (0.14) (0.31) 5-10% -0.311 -0.253 -0.304 (1.85) (1.49) (1.81) 11-20% -0.753 -0.736 -0.772 (3.05)** (3.00)** (3.12)** Over 20% -0.602 -0.571 -0.613 (2.41)* (2.31)* (2.55)* Workplace characteristics: Workplace size (ref.: 200-499 employees) 10-24 employees -0.346 -0.343 -0.350 (2.13)* (2.12)* (2.18)* 25-49 employees -0.105 -0.115 -0.103 (0.70) (0.77) (0.71)
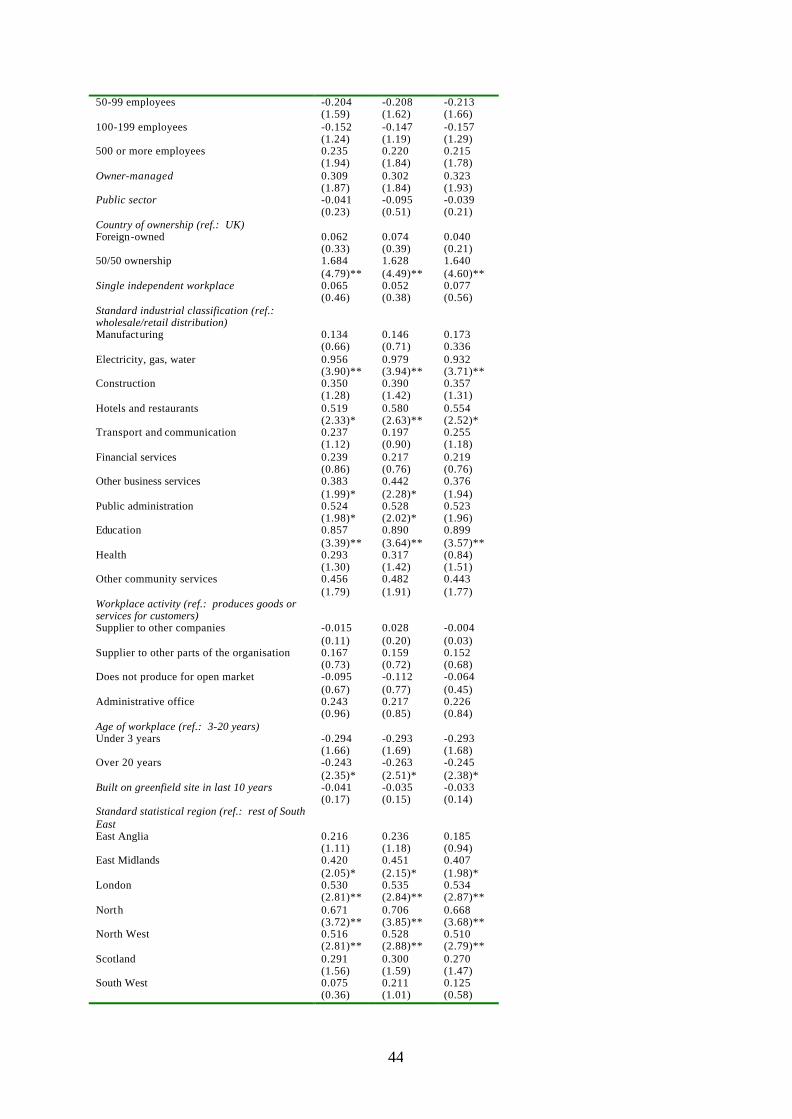
44
50-99 employees -0.204 -0.208 -0.213 (1.59) (1.62) (1.66) 100-199 employees -0.152 -0.147 -0.157 (1.24) (1.19) (1.29) 500 or more employees 0.235 0.220 0.215 (1.94) (1.84) (1.78) Owner-managed 0.309 0.302 0.323 (1.87) (1.84) (1.93) Public sector -0.041 -0.095 -0.039 (0.23) (0.51) (0.21) Country of ownership (ref.: UK) Foreign-owned 0.062 0.074 0.040 (0.33) (0.39) (0.21) 50/50 ownership 1.684 1.628 1.640 (4.79)** (4.49)** (4.60)** Single independent workplace 0.065 0.052 0.077 (0.46) (0.38) (0.56) Standard industrial classification (ref.: wholesale/retail distribution)
Manufacturing 0.134 0.146 0.173 (0.66) (0.71) 0.336 Electricity, gas, water 0.956 0.979 0.932 (3.90)** (3.94)** (3.71)** Construction 0.350 0.390 0.357 (1.28) (1.42) (1.31) Hotels and restaurants 0.519 0.580 0.554 (2.33)* (2.63)** (2.52)* Transport and communication 0.237 0.197 0.255 (1.12) (0.90) (1.18) Financial services 0.239 0.217 0.219 (0.86) (0.76) (0.76) Other business services 0.383 0.442 0.376 (1.99)* (2.28)* (1.94) Public administration 0.524 0.528 0.523 (1.98)* (2.02)* (1.96) Education 0.857 0.890 0.899 (3.39)** (3.64)** (3.57)** Health 0.293 0.317 (0.84) (1.30) (1.42) (1.51) Other community services 0.456 0.482 0.443 (1.79) (1.91) (1.77) Workplace activity (ref.: produces goods or services for customers)
Supplier to other companies -0.015 0.028 -0.004 (0.11) (0.20) (0.03) Supplier to other parts of the organisation 0.167 0.159 0.152 (0.73) (0.72) (0.68) Does not produce for open market -0.095 -0.112 -0.064 (0.67) (0.77) (0.45) Administrative office 0.243 0.217 0.226 (0.96) (0.85) (0.84) Age of workplace (ref.: 3-20 years) Under 3 years -0.294 -0.293 -0.293 (1.66) (1.69) (1.68) Over 20 years -0.243 -0.263 -0.245 (2.35)* (2.51)* (2.38)* Built on greenfield site in last 10 years -0.041 -0.035 -0.033 (0.17) (0.15) (0.14) Standard statistical region (ref.: rest of South East
East Anglia 0.216 0.236 0.185 (1.11) (1.18) (0.94) East Midlands 0.420 0.451 0.407 (2.05)* (2.15)* (1.98)* London 0.530 0.535 0.534 (2.81)** (2.84)** (2.87)** North 0.671 0.706 0.668 (3.72)** (3.85)** (3.68)** North West 0.516 0.528 0.510 (2.81)** (2.88)** (2.79)** Scotland 0.291 0.300 0.270 (1.56) (1.59) (1.47) South West 0.075 0.211 0.125 (0.36) (1.01) (0.58)
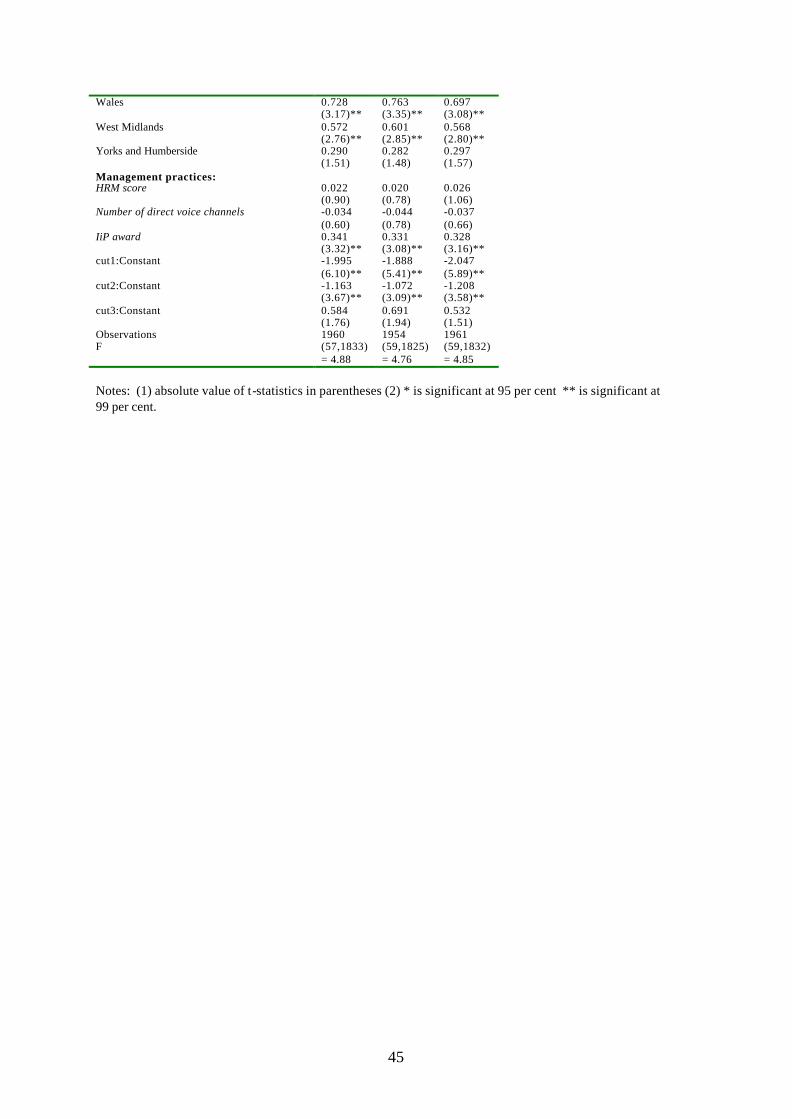
45
Wales 0.728 0.763 0.697 (3.17)** (3.35)** (3.08)** West Midlands 0.572 0.601 0.568 (2.76)** (2.85)** (2.80)** Yorks and Humberside 0.290 0.282 0.297 (1.51) (1.48) (1.57) Management practices: HRM score 0.022 0.020 0.026 (0.90) (0.78) (1.06) Number of direct voice channels -0.034 -0.044 -0.037 (0.60) (0.78) (0.66) IiP award 0.341 0.331 0.328 (3.32)** (3.08)** (3.16)** cut1:Constant -1.995 -1.888 -2.047 (6.10)** (5.41)** (5.89)** cut2:Constant -1.163 -1.072 -1.208 (3.67)** (3.09)** (3.58)** cut3:Constant 0.584 0.691 0.532 (1.76) (1.94) (1.51) Observations 1960 1954 1961 F (57,1833)
= 4.88 (59,1825)= 4.76
(59,1832)= 4.85
Notes: (1) absolute value of t-statistics in parentheses (2) * is significant at 95 per cent ** is significant at 99 per cent.
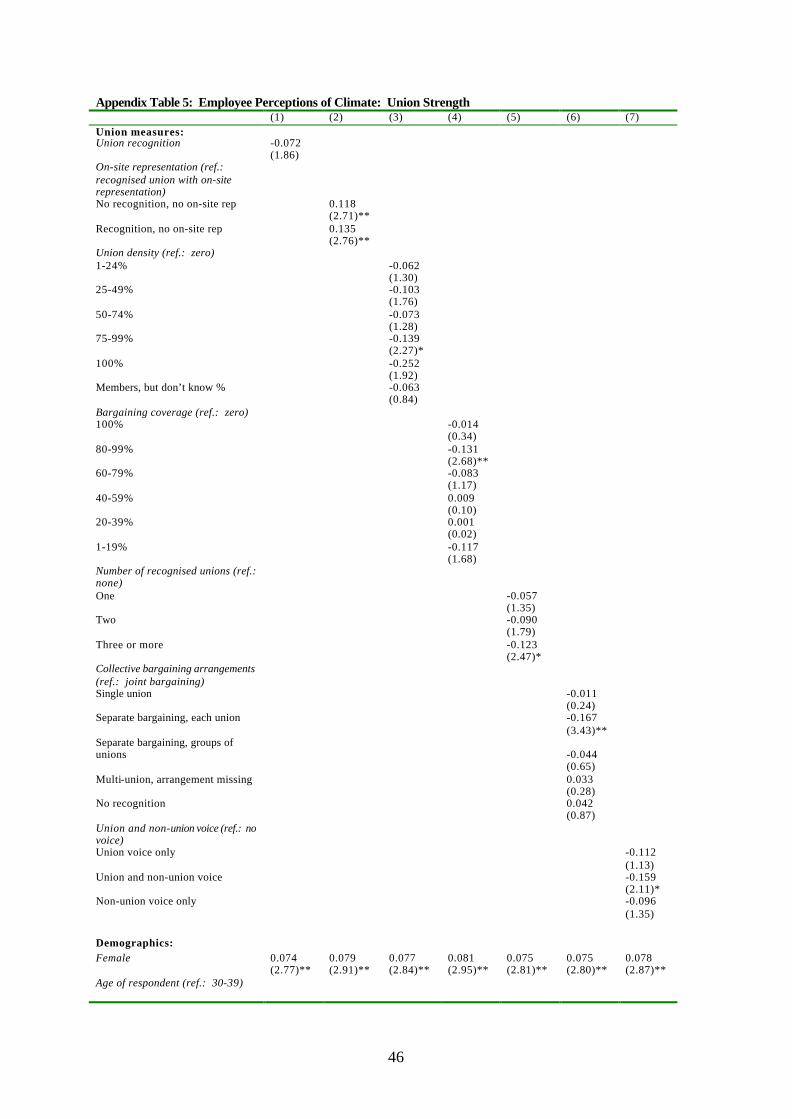
46
Appendix Table 5: Employee Perceptions of Climate: Union Strength (1) (2) (3) (4) (5) (6) (7) Union measures: Union recognition -0.072 (1.86) On-site representation (ref.: recognised union with on-site representation)
No recognition, no on-site rep 0.118 (2.71)** Recognition, no on-site rep 0.135 (2.76)** Union density (ref.: zero) 1-24% -0.062 (1.30) 25-49% -0.103 (1.76) 50-74% -0.073 (1.28) 75-99% -0.139 (2.27)* 100% -0.252 (1.92) Members, but don’t know % -0.063 (0.84) Bargaining coverage (ref.: zero) 100% -0.014 (0.34) 80-99% -0.131 (2.68)** 60-79% -0.083 (1.17) 40-59% 0.009 (0.10) 20-39% 0.001 (0.02) 1-19% -0.117 (1.68) Number of recognised unions (ref.: none)
One -0.057 (1.35) Two -0.090 (1.79) Three or more -0.123 (2.47)* Collective bargaining arrangements (ref.: joint bargaining)
Single union -0.011 (0.24) Separate bargaining, each union -0.167 (3.43)** Separate bargaining, groups of unions
-0.044
(0.65) Multi-union, arrangement missing 0.033 (0.28) No recognition 0.042 (0.87) Union and non-union voice (ref.: no voice)
Union voice only -0.112 (1.13) Union and non-union voice -0.159 (2.11)* Non-union voice only -0.096 (1.35)
Demographics:
Female 0.074 0.079 0.077 0.081 0.075 0.075 0.078 (2.77)** (2.91)** (2.84)** (2.95)** (2.81)** (2.80)** (2.87)** Age of respondent (ref.: 30-39)
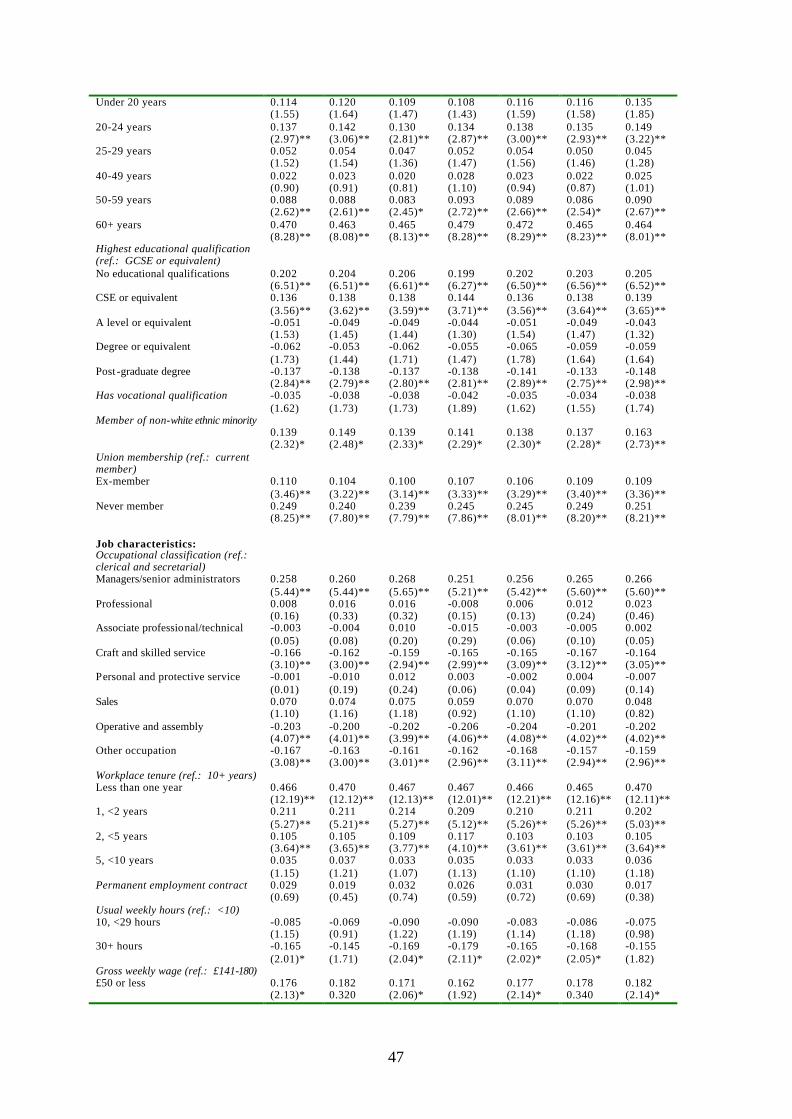
47
Under 20 years 0.114 0.120 0.109 0.108 0.116 0.116 0.135 (1.55) (1.64) (1.47) (1.43) (1.59) (1.58) (1.85) 20-24 years 0.137 0.142 0.130 0.134 0.138 0.135 0.149 (2.97)** (3.06)** (2.81)** (2.87)** (3.00)** (2.93)** (3.22)** 25-29 years 0.052 0.054 0.047 0.052 0.054 0.050 0.045 (1.52) (1.54) (1.36) (1.47) (1.56) (1.46) (1.28) 40-49 years 0.022 0.023 0.020 0.028 0.023 0.022 0.025 (0.90) (0.91) (0.81) (1.10) (0.94) (0.87) (1.01) 50-59 years 0.088 0.088 0.083 0.093 0.089 0.086 0.090 (2.62)** (2.61)** (2.45)* (2.72)** (2.66)** (2.54)* (2.67)** 60+ years 0.470 0.463 0.465 0.479 0.472 0.465 0.464 (8.28)** (8.08)** (8.13)** (8.28)** (8.29)** (8.23)** (8.01)** Highest educational qualification (ref.: GCSE or equivalent)
No educational qualifications 0.202 0.204 0.206 0.199 0.202 0.203 0.205 (6.51)** (6.51)** (6.61)** (6.27)** (6.50)** (6.56)** (6.52)** CSE or equivalent 0.136 0.138 0.138 0.144 0.136 0.138 0.139 (3.56)** (3.62)** (3.59)** (3.71)** (3.56)** (3.64)** (3.65)** A level or equivalent -0.051 -0.049 -0.049 -0.044 -0.051 -0.049 -0.043 (1.53) (1.45) (1.44) (1.30) (1.54) (1.47) (1.32) Degree or equivalent -0.062 -0.053 -0.062 -0.055 -0.065 -0.059 -0.059 (1.73) (1.44) (1.71) (1.47) (1.78) (1.64) (1.64) Post -graduate degree -0.137 -0.138 -0.137 -0.138 -0.141 -0.133 -0.148 (2.84)** (2.79)** (2.80)** (2.81)** (2.89)** (2.75)** (2.98)** Has vocational qualification -0.035 -0.038 -0.038 -0.042 -0.035 -0.034 -0.038 (1.62) (1.73) (1.73) (1.89) (1.62) (1.55) (1.74) Member of non-white ethnic minority
0.139 0.149
0.139
0.141
0.138
0.137
0.163
(2.32)* (2.48)* (2.33)* (2.29)* (2.30)* (2.28)* (2.73)** Union membership (ref.: current member)
Ex-member 0.110 0.104 0.100 0.107 0.106 0.109 0.109 (3.46)** (3.22)** (3.14)** (3.33)** (3.29)** (3.40)** (3.36)** Never member 0.249 0.240 0.239 0.245 0.245 0.249 0.251 (8.25)** (7.80)** (7.79)** (7.86)** (8.01)** (8.20)** (8.21)** Job characteristics: Occupational classification (ref.: clerical and secretarial)
Managers/senior administrators 0.258 0.260 0.268 0.251 0.256 0.265 0.266 (5.44)** (5.44)** (5.65)** (5.21)** (5.42)** (5.60)** (5.60)** Professional 0.008 0.016 0.016 -0.008 0.006 0.012 0.023 (0.16) (0.33) (0.32) (0.15) (0.13) (0.24) (0.46) Associate professional/technical -0.003 -0.004 0.010 -0.015 -0.003 -0.005 0.002 (0.05) (0.08) (0.20) (0.29) (0.06) (0.10) (0.05) Craft and skilled service -0.166 -0.162 -0.159 -0.165 -0.165 -0.167 -0.164 (3.10)** (3.00)** (2.94)** (2.99)** (3.09)** (3.12)** (3.05)** Personal and protective service -0.001 -0.010 0.012 0.003 -0.002 0.004 -0.007 (0.01) (0.19) (0.24) (0.06) (0.04) (0.09) (0.14) Sales 0.070 0.074 0.075 0.059 0.070 0.070 0.048 (1.10) (1.16) (1.18) (0.92) (1.10) (1.10) (0.82) Operative and assembly -0.203 -0.200 -0.202 -0.206 -0.204 -0.201 -0.202 (4.07)** (4.01)** (3.99)** (4.06)** (4.08)** (4.02)** (4.02)** Other occupation -0.167 -0.163 -0.161 -0.162 -0.168 -0.157 -0.159 (3.08)** (3.00)** (3.01)** (2.96)** (3.11)** (2.94)** (2.96)** Workplace tenure (ref.: 10+ years) Less than one year 0.466 0.470 0.467 0.467 0.466 0.465 0.470 (12.19)** (12.12)** (12.13)** (12.01)** (12.21)** (12.16)** (12.11)** 1, <2 years 0.211 0.211 0.214 0.209 0.210 0.211 0.202 (5.27)** (5.21)** (5.27)** (5.12)** (5.26)** (5.26)** (5.03)** 2, <5 years 0.105 0.105 0.109 0.117 0.103 0.103 0.105 (3.64)** (3.65)** (3.77)** (4.10)** (3.61)** (3.61)** (3.64)** 5, <10 years 0.035 0.037 0.033 0.035 0.033 0.033 0.036 (1.15) (1.21) (1.07) (1.13) (1.10) (1.10) (1.18) Permanent employment contract 0.029 0.019 0.032 0.026 0.031 0.030 0.017 (0.69) (0.45) (0.74) (0.59) (0.72) (0.69) (0.38) Usual weekly hours (ref.: <10) 10, <29 hours -0.085 -0.069 -0.090 -0.090 -0.083 -0.086 -0.075 (1.15) (0.91) (1.22) (1.19) (1.14) (1.18) (0.98) 30+ hours -0.165 -0.145 -0.169 -0.179 -0.165 -0.168 -0.155 (2.01)* (1.71) (2.04)* (2.11)* (2.02)* (2.05)* (1.82) Gross weekly wage (ref.: £141-180) £50 or less 0.176 0.182 0.171 0.162 0.177 0.178 0.182 (2.13)* 0.320 (2.06)* (1.92) (2.14)* 0.340 (2.14)*
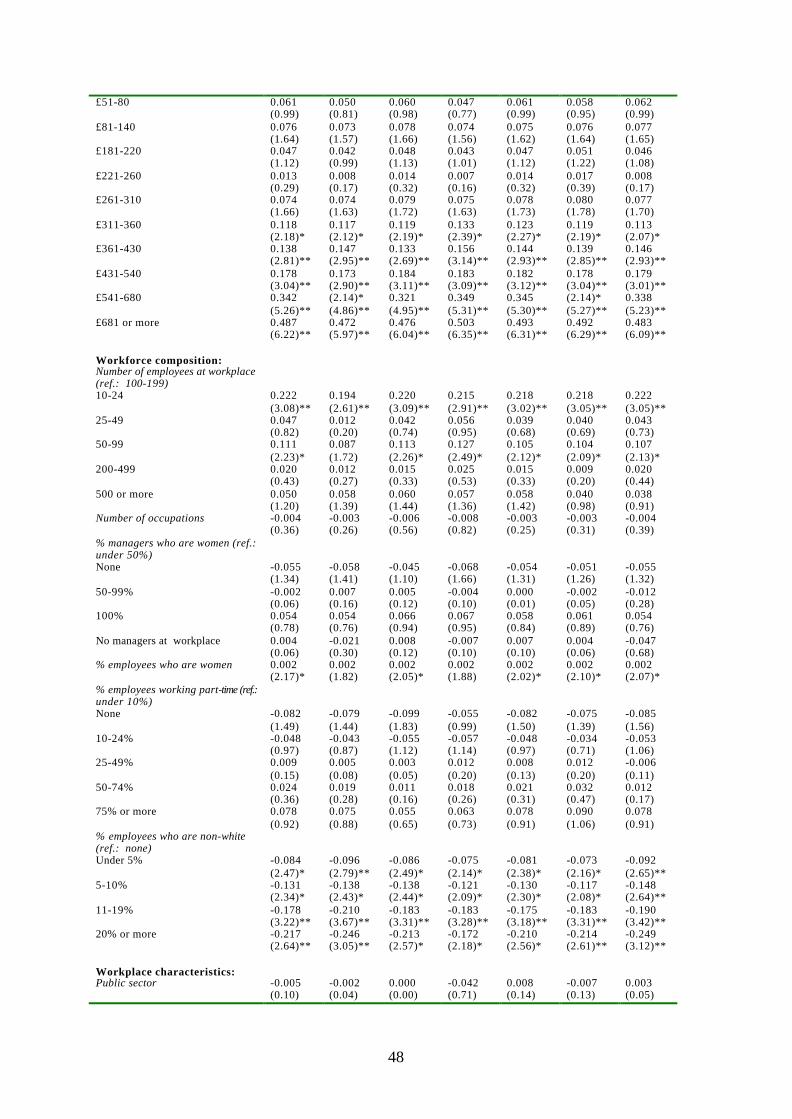
48
£51-80 0.061 0.050 0.060 0.047 0.061 0.058 0.062 (0.99) (0.81) (0.98) (0.77) (0.99) (0.95) (0.99) £81-140 0.076 0.073 0.078 0.074 0.075 0.076 0.077 (1.64) (1.57) (1.66) (1.56) (1.62) (1.64) (1.65) £181-220 0.047 0.042 0.048 0.043 0.047 0.051 0.046 (1.12) (0.99) (1.13) (1.01) (1.12) (1.22) (1.08) £221-260 0.013 0.008 0.014 0.007 0.014 0.017 0.008 (0.29) (0.17) (0.32) (0.16) (0.32) (0.39) (0.17) £261-310 0.074 0.074 0.079 0.075 0.078 0.080 0.077 (1.66) (1.63) (1.72) (1.63) (1.73) (1.78) (1.70) £311-360 0.118 0.117 0.119 0.133 0.123 0.119 0.113 (2.18)* (2.12)* (2.19)* (2.39)* (2.27)* (2.19)* (2.07)* £361-430 0.138 0.147 0.133 0.156 0.144 0.139 0.146 (2.81)** (2.95)** (2.69)** (3.14)** (2.93)** (2.85)** (2.93)** £431-540 0.178 0.173 0.184 0.183 0.182 0.178 0.179 (3.04)** (2.90)** (3.11)** (3.09)** (3.12)** (3.04)** (3.01)** £541-680 0.342 (2.14)* 0.321 0.349 0.345 (2.14)* 0.338 (5.26)** (4.86)** (4.95)** (5.31)** (5.30)** (5.27)** (5.23)** £681 or more 0.487 0.472 0.476 0.503 0.493 0.492 0.483 (6.22)** (5.97)** (6.04)** (6.35)** (6.31)** (6.29)** (6.09)** Workforce composition: Number of employees at workplace (ref.: 100-199)
10-24 0.222 0.194 0.220 0.215 0.218 0.218 0.222 (3.08)** (2.61)** (3.09)** (2.91)** (3.02)** (3.05)** (3.05)** 25-49 0.047 0.012 0.042 0.056 0.039 0.040 0.043 (0.82) (0.20) (0.74) (0.95) (0.68) (0.69) (0.73) 50-99 0.111 0.087 0.113 0.127 0.105 0.104 0.107 (2.23)* (1.72) (2.26)* (2.49)* (2.12)* (2.09)* (2.13)* 200-499 0.020 0.012 0.015 0.025 0.015 0.009 0.020 (0.43) (0.27) (0.33) (0.53) (0.33) (0.20) (0.44) 500 or more 0.050 0.058 0.060 0.057 0.058 0.040 0.038 (1.20) (1.39) (1.44) (1.36) (1.42) (0.98) (0.91) Number of occupations -0.004 -0.003 -0.006 -0.008 -0.003 -0.003 -0.004 (0.36) (0.26) (0.56) (0.82) (0.25) (0.31) (0.39) % managers who are women (ref.: under 50%)
None -0.055 -0.058 -0.045 -0.068 -0.054 -0.051 -0.055 (1.34) (1.41) (1.10) (1.66) (1.31) (1.26) (1.32) 50-99% -0.002 0.007 0.005 -0.004 0.000 -0.002 -0.012 (0.06) (0.16) (0.12) (0.10) (0.01) (0.05) (0.28) 100% 0.054 0.054 0.066 0.067 0.058 0.061 0.054 (0.78) (0.76) (0.94) (0.95) (0.84) (0.89) (0.76) No managers at workplace 0.004 -0.021 0.008 -0.007 0.007 0.004 -0.047 (0.06) (0.30) (0.12) (0.10) (0.10) (0.06) (0.68) % employees who are women 0.002 0.002 0.002 0.002 0.002 0.002 0.002 (2.17)* (1.82) (2.05)* (1.88) (2.02)* (2.10)* (2.07)* % employees working part-time (ref.: under 10%)
None -0.082 -0.079 -0.099 -0.055 -0.082 -0.075 -0.085 (1.49) (1.44) (1.83) (0.99) (1.50) (1.39) (1.56) 10-24% -0.048 -0.043 -0.055 -0.057 -0.048 -0.034 -0.053 (0.97) (0.87) (1.12) (1.14) (0.97) (0.71) (1.06) 25-49% 0.009 0.005 0.003 0.012 0.008 0.012 -0.006 (0.15) (0.08) (0.05) (0.20) (0.13) (0.20) (0.11) 50-74% 0.024 0.019 0.011 0.018 0.021 0.032 0.012 (0.36) (0.28) (0.16) (0.26) (0.31) (0.47) (0.17) 75% or more 0.078 0.075 0.055 0.063 0.078 0.090 0.078 (0.92) (0.88) (0.65) (0.73) (0.91) (1.06) (0.91) % employees who are non-white (ref.: none)
Under 5% -0.084 -0.096 -0.086 -0.075 -0.081 -0.073 -0.092 (2.47)* (2.79)** (2.49)* (2.14)* (2.38)* (2.16)* (2.65)** 5-10% -0.131 -0.138 -0.138 -0.121 -0.130 -0.117 -0.148 (2.34)* (2.43)* (2.44)* (2.09)* (2.30)* (2.08)* (2.64)** 11-19% -0.178 -0.210 -0.183 -0.183 -0.175 -0.183 -0.190 (3.22)** (3.67)** (3.31)** (3.28)** (3.18)** (3.31)** (3.42)** 20% or more -0.217 -0.246 -0.213 -0.172 -0.210 -0.214 -0.249 (2.64)** (3.05)** (2.57)* (2.18)* (2.56)* (2.61)** (3.12)** Workplace characteristics: Public sector -0.005 -0.002 0.000 -0.042 0.008 -0.007 0.003 (0.10) (0.04) (0.00) (0.71) (0.14) (0.13) (0.05)

49
Country of ownership (ref.: 100% UK)
Foreign-owned 0.042 0.041 0.047 0.064 0.047 0.046 0.031 (0.86) (0.84) (0.96) (1.32) (0.96) (0.96) (0.64) 50/50 0.207 0.208 0.206 0.226 0.215 0.207 0.217 (1.91) (1.91) (1.88) (2.24)* (1.97)* (1.94) (1.90) Single independent workplace 0.012 0.010 0.006 0.019 0.015 0.019 0.011 (0.30) (0.25) (0.14) (0.46) (0.36) (0.45) (0.26) Standard industrial classification (ref.: manufacturing)
Electricity, gas and water 0.074 0.094 0.081 0.070 0.097 0.047 0.070 (1.07) (1.34) (1.13) (0.98) (1.38) (0.67) (1.00) Construction 0.171 0.157 0.147 0.170 0.171 0.154 0.161 (2.20)* (2.00)* (1.85) (2.06)* (2.20)* (1.99)* (2.08)* Wholesale and retail distribution -0.131 -0.131 -0.142 -0.122 -0.131 -0.145 -0.121 (1.78) (1.78) (1.88) (1.68) (1.77) (1.98)* (1.66) Hotels and restaurants 0.133 0.134 0.111 0.107 0.137 0.117 0.138 (1.50) (1.51) (1.21) (1.24) (1.53) (1.32) (1.55) Transport and communication -0.069 -0.065 -0.063 -0.080 -0.066 -0.054 -0.067 (1.06) (1.00) (0.97) (1.21) (1.02) (0.86) (1.03) Financial services 0.058 0.053 0.051 0.034 0.054 0.044 0.067 (0.79) (0.72) (0.69) (0.45) (0.73) (0.60) (0.90) Other business services 0.098 0.104 0.082 0.091 0.099 0.085 0.091 (1.48) (1.58) (1.19) (1.38) (1.48) (1.27) (1.39) Public administration 0.102 0.114 0.085 0.083 0.107 0.126 0.102 (1.34) (1.49) (1.12) (1.04) (1.40) (1.65) (1.32) Education 0.190 0.182 0.198 0.204 0.193 0.180 0.184 (2.30)* (2.16)* (2.41)* (2.40)* (2.34)* (2.19)* (2.21)* Health 0.024 0.038 0.018 0.019 0.035 0.010 0.041 (0.29) (0.45) (0.22) (0.23) (0.42) (0.11) (0.49) Other community services 0.114 0.107 0.117 0.117 0.115 0.093 0.115 (1.12) (1.03) (1.12) (1.13) (1.12) (0.91) (1.13) Workplace activity (ref.: produces goods/services for customers)
Supplier to other companies -0.046 -0.052 -0.057 -0.053 -0.049 -0.052 -0.052 (1.07) (1.21) (1.35) (1.20) (1.15) (1.22) (1.22) Supplier to other parts of the organisation
-0.006
-0.016
0.005
-0.017
0.000
0.005
-0.005
(0.11) (0.29) (0.09) (0.30) (0.01) (0.09) (0.09) Does not produce for the open market
0.043
0.031
0.052
0.031
0.044
0.036
0.035
(1.04) (0.71) (1.23) (0.73) (1.06) (0.86) (0.83) Administrative office only 0.068 0.064 0.058 0.057 0.068 0.068 0.060 (0.96) (0.91) (0.82) (0.79) (0.96) (0.96) (0.85) Age of workplace at current address (ref.: more than 20 yrs)
Under 3 years -0.111 -0.117 -0.118 -0.110 -0.114 -0.115 -0.121 (1.60) (1.69) (1.74) (1.58) (1.64) (1.72) (1.72) Between 3 and 20 years 0.038 0.029 0.040 0.041 0.034 0.034 0.031 (1.15) (0.87) (1.20) (1.24) (1.02) (1.04) (0.93) Respondent to managerial interview is an ER specialist
-0.102
-0.102
-0.104
-0.104
-0.099
-0.104
-0.102
(2.91)** (2.89)** (2.93)** (2.92)** (2.82)** (2.92)** (2.88)** HRM score 0.009 0.008 0.008 0.009 0.009 0.010 0.009 (1.03) (0.96) (0.90) (0.99) (1.06) (1.16) (1.04) Number of direct voice channels 0.022 0.019 0.020 0.016 0.022 0.020 0.038 (1.32) (1.18) (1.19) (0.95) (1.35) (1.22) (2.02)* IiP award 0.094 0.092 0.110 0.099 0.093 0.094 0.089 (3.32)** (3.24)** (3.79)** (3.50)** (3.30)** (3.35)** (3.11)** Region (ref.: rest of South East) East Anglia 0.025 0.008 0.037 0.015 0.023 0.047 0.019 (0.38) (0.12) 0.040 0.025 0.023 (0.68) 0.002 East Midlands 0.122 0.120 0.134 0.088 0.122 0.145 0.130 (2.11)* (2.04)* (2.30)* (1.48) (2.09)* (2.50)* (2.20)* London 0.112 0.113 0.120 0.093 0.113 0.130 0.126 (1.82) (1.82) (1.94) (1.54) (1.84) (2.15)* (2.05)* North 0.059 0.051 0.099 0.050 0.068 0.066 0.061 (0.91) (0.80) (1.44) (0.77) (1.05) (1.01) (0.93) North West 0.100 0.093 0.119 0.085 0.105 0.106 0.105 (1.84) (1.67) (2.18)* (1.48) (1.95) (1.95) (1.92) Scotland -0.022 -0.025 -0.004 -0.041 -0.016 -0.016 -0.019 (0.36) (0.41) (0.07) (0.67) (0.26) (0.27) (0.31) South West 0.172 0.176 0.182 0.151 0.176 0.169 0.178 (2.75)** (2.79)** (2.93)** (2.42)* (2.81)** (2.71)** (2.84)**

50
Wales 0.172 0.147 0.191 0.149 0.177 0.173 0.145 (2.49)* (2.10)* (2.71)** (2.07)* (2.55)* (2.52)* (2.03)* West Midlands 0.110 0.107 0.117 0.114 0.112 0.110 0.122 (1.90) (1.82) (1.98)* (1.93) (1.94) (1.90) (2.07)* Yorkshire and Humberside 0.020 0.008 (0.57) (0.23) (0.35) 0.027 (0.29) (0.33) (0.13) (0.66) (0.41) (0.38) (0.45) (0.03) cut1:Constant -1.119 -1.055 -1.162 -1.180 -1.118 -1.075 -1.200 (6.60)** (6.21)** (6.62)** (6.83)** (6.60)** (6.36)** (6.76)** cut2:Constant -0.410 -0.344 -0.458 -0.468 -0.408 -0.363 -0.489 (2.43)* (2.03)* (2.62)** (2.73)** (2.42)* (2.15)* (2.76)** cut3:Constant 0.443 0.509 0.397 0.384 0.444 0.490 0.363 (2.63)** (3.02)** (2.28)* (2.24)* (2.64)** (2.91)** (2.06)* cut4:Constant 1.717 1.784 1.667 1.658 1.718 1.764 1.641 (10.24)** (10.60)** (9.61)** (9.72)** (10.26)** (10.47)** (9.35)** Observations 22451 21911 22147 21688 22451 22451 21954 F 98,1414
=16.37 99,1374 = 15.76
103,1392 = 15.81
103,1355 = 16.17
100,1412 = 16.18
102,1410 = 16.02
100,1375 = 15.76
Notes: (1) absolute value of t-statistics in parentheses (2) * is significant at 95 per cent ** is significant at 99 per cent.

51
Appendix Table 6: Employees’ Perceptions of Climate: Managerial Support for Unions and Union Effectiveness (1) (2) (3) (4) (5) (6) Union measures: Managerial endorsement of union membership (ref.: no union recognition)
Recognition, no management recommendation of membership, no closed shop
-0.071
(1.79) Recognition, management strongly recommends membership
0.071
(1.13) Recognition, closed shop -0.053 (0.29) Union recognition -0.289 -0.060 -0.043 -0.072 -0.068 (7.02)** (1.43) (1.05) (1.84) (1.69) Employee perceptions of management attitudes to union membership (ref.: neutral)
In favour 0.417 (13.14)** Not in favour -0.610 (22.14)** Other answer 0.027 (0.18) Union takes notice of members’ problems and complaints (ref.: neither agree nor disagree)
Not applicable, no members 0.038 (0.62) Members, but respondent not aware of them
0.057 (1.28) Strongly agree 0.204 (3.07)** Agree 0.129 (3.46)** Disagree -0.466 (7.90)** Strongly disagree -0.934 (7.02)** Other answer -0.154 (0.91) Union taken seriously by management (ref.: neither agree nor disagree)
Not applicable, no members 0.080 (1.37) Members, but respondent not aware of them
0.100
(2.56)* Strongly agree 0.643 (7.81)** Agree 0.348 (9.55)** Disagree -0.514 (13.00)** Strongly disagree -1.285 (15.77)** Other answer -0.133 (0.81) Employer would rather consult directly with employees than with unions (ref.: neither agree nor disagree)
Strongly agree 0.107 (2.20)* Agree -0.017 (0.40) Disagree -0.013 (0.31) Strongly disagree -0.015 (0.22) Management attitudes to union membership (ref.: neutral)
In favour of membership 0.023 (0.64)

52
Not in favour 0.080 (1.50) Not an issue 0.377 (3.15)** Other answers 0.155 (1.46) Demographics: Female 0.072 0.071 0.073 0.074 0.052 0.076 (2.68)** (2.48)* (2.72)** (2.76)** (1.90) (2.86)** Age of respondent (ref.: 30-39) Under 20 years 0.114 0.042 0.111 0.110 0.075 0.100 (1.55) (0.57) (1.51) (1.51) (1.01) (1.36) 20-24 years 0.141 0.071 0.132 0.135 0.109 0.133 (3.05)** (1.46) (2.86)** (2.93)** (2.36)* (2.89)** 25-29 years 0.051 0.008 0.049 0.053 0.018 0.041 (1.48) (0.21) (1.43) (1.55) (0.49) (1.18) 40-49 years 0.021 -0.004 0.023 0.023 0.022 0.010 (0.83) (0.16) (0.91) (0.91) (0.90) (0.40) 50-59 years 0.084 0.058 0.084 0.090 0.071 0.078 (2.50)* (1.79) (2.51)* (2.69)** (2.19)* (2.32)* 60+ years 0.468 0.365 0.465 0.469 0.442 0.446 (8.23)** (5.69)** (8.14)** (8.26)** (7.98)** (7.72)** Highest educational qualification (ref.: GCSE or equivalent)
No educational qualifications 0.203 0.199 0.201 0.203 0.196 0.202 (6.52)** (5.83)** (6.48)** (6.54)** (6.25)** (6.41)** CSE or equivalent 0.135 0.142 0.133 0.139 0.141 0.143 (3.51)** (3.46)** (3.48)** (3.64)** (3.58)** (3.75)** A level or equivalent -0.052 -0.059 -0.051 -0.051 -0.037 -0.043 (1.54) (1.62) (1.52) (1.54) (1.10) (1.30) Degree or equivalent -0.069 -0.067 -0.063 -0.059 -0.061 -0.058 (1.94) (1.76) (1.75) (1.63) (1.68) (1.56) Post -graduate degree -0.150 -0.114 -0.144 -0.129 -0.136 -0.136 (3.21)** (2.25)* (3.01)** (2.67)** (2.83)** (2.80)** Has vocational qualification -0.035 -0.018 -0.034 -0.035 -0.025 -0.035 (1.63) (0.78) (1.57) (1.60) (1.12) (1.61) Member of non-white ethnic minority 0.138 0.176 0.135 0.139 0.144 0.138 (2.30)* (3.03)** (2.25)* (2.33)* (2.33)* (2.27)* Union membership (ref.: current member) Ex-member 0.117 0.188 0.112 0.109 0.134 0.150 (3.68)** (5.70)** (3.47)** (3.42)** (4.12)** (4.60)** Never member 0.258 0.323 0.247 0.247 0.263 0.273 (8.54)** (10.15)** (8.23)** (8.07)** (9.01)** (9.12)** Job characteristics: Occupational classification (ref.: clerical and secretarial)
Managers/senior administrators 0.256 0.235 0.258 0.258 0.251 0.267 (5.43)** (4.68)** (5.46)** (5.45)** (5.24)** (5.51)** Professional 0.015 0.015 0.001 0.005 0.053 0.023 (0.32) (0.30) (0.01) (0.10) (1.12) (0.47) Associate professional/technical -0.001 0.005 0.000 -0.006 0.004 0.000 (0.02) (0.11) (0.00) (0.12) (0.07) (0.01) Craft and skilled service -0.166 -0.153 -0.164 -0.169 -0.154 -0.158 (3.10)** (2.64)** (3.04)** (3.17)** (2.68)** (2.94)** Personal and protective service 0.003 0.049 0.000 -0.005 0.028 0.009 (0.07) (0.93) (0.01) (0.11) (0.57) (0.18) Sales 0.072 0.045 0.084 0.071 0.080 0.088 (1.13) (0.75) (1.32) (1.11) (1.23) (1.39) Operative and assembly -0.202 -0.210 -0.197 -0.205 -0.166 -0.191 (4.04)** (4.05)** (3.94)** (4.13)** (3.22)** (3.83)** Other occupation -0.161 -0.128 -0.161 -0.172 -0.141 -0.138 (2.98)** (2.27)* (2.97)** (3.17)** (2.66)** (2.55)* Workplace tenure (ref.: 10+ years) Less than one year 0.460 0.365 0.463 0.466 0.429 0.450 (12.04)** (9.08)** (12.14)** (12.24)** (11.21)** (11.68)** 1, <2 years 0.209 0.150 0.209 0.209 0.180 0.197 (5.22)** (3.59)** (5.21)** (5.24)** (4.33)** (4.81)** 2, <5 years 0.104 0.065 0.103 0.104 0.083 0.098 (3.64)** (2.19)* (3.56)** (3.64)** (2.89)** (3.37)** 5, <10 years 0.034 0.014 0.033 0.034 0.033 0.035 (1.12) (0.46) (1.11) (1.15) (1.10) (1.14) Permanent employment contract 0.025 0.017 0.027 0.030 0.040 0.038 (0.57) (0.35) (0.62) (0.70) (0.92) (0.88)

53
Usual weekly hours (ref.: <10) 10, <29 hours -0.094 -0.093 -0.082 -0.083 -0.092 -0.089 (1.29) (1.13) (1.11) (1.15) (1.21) (1.21) 30+ hours -0.180 -0.174 -0.162 -0.167 -0.157 -0.167 (2.23)* (1.88) (1.98)* (2.05)* (1.85) (2.05)* Gross weekly wage (ref.: £141-180) £50 or less 0.165 0.190 0.179 0.175 0.188 0.171 (2.00)* 0.278 0.351 (2.13)* 0.291 0.325 £51-80 0.056 0.056 0.061 0.061 0.059 0.043 (0.91) (0.83) (1.00) (1.00) (0.95) (0.70) £81-140 0.074 0.083 0.078 0.078 0.071 0.074 (1.60) (1.64) (1.68) (1.68) (1.54) (1.59) £181-220 0.047 0.056 0.048 0.048 0.038 0.041 (1.12) (1.28) (1.14) (1.15) (0.91) (0.96) £221-260 0.012 0.018 0.009 0.016 0.020 0.015 (0.27) (0.38) (0.20) (0.37) (0.45) (0.34) £261-310 0.072 0.062 0.075 0.077 0.060 0.066 (1.61) (1.33) (1.65) (1.72) (1.33) (1.46) £311-360 0.117 0.072 0.119 0.120 0.091 0.106 (2.17)* (1.30) (2.20)* (2.20)* (1.67) (1.95) £361-430 0.143 0.081 0.139 0.144 0.096 0.117 (2.93)** (1.63) (2.83)** (2.95)** (1.93) (2.39)* £431-540 0.177 0.152 0.188 0.179 0.144 0.168 (3.07)** (2.58)* (3.23)** (3.07)** (2.47)* (2.89)** £541-680 0.350 (2.19)* (2.15)* 0.336 (2.26)* (2.09)* (5.50)** (4.28)** (5.48)** (5.22)** (4.55)** (5.06)** £681 or more 0.506 0.478 0.486 0.482 0.439 0.473 (6.74)** (5.81)** (6.23)** (6.21)** (5.71)** (6.03)** Workforce composition: Number of employees at workplace (ref.: 100-199)
10-24 0.221 0.195 0.224 0.219 0.193 0.222 (3.07)** (2.69)** (3.09)** (3.04)** (2.69)** (3.11)** 25-49 0.041 0.051 0.030 0.040 0.030 0.048 (0.72) (0.87) (0.52) (0.69) (0.52) (0.83) 50-99 0.103 0.123 0.103 0.110 0.104 0.113 (2.09)* (2.50)* (2.12)* (2.25)* (2.10)* (2.24)* 200-499 0.013 0.019 0.013 0.016 0.000 0.017 (0.28) (0.41) (0.30) (0.34) (0.01) (0.37) 500 or more 0.044 0.038 0.046 0.052 0.050 0.046 (1.07) (0.90) (1.12) (1.26) (1.20) (1.10) Number of occupations -0.006 -0.003 -0.003 -0.003 -0.008 -0.004 (0.60) (0.24) (0.29) (0.34) (0.77) (0.44) % managers who are women (ref.: under 50%)
None -0.058 -0.050 -0.057 -0.050 -0.039 -0.053 (1.45) (1.24) (1.40) (1.22) (0.98) (1.30) 50-99% -0.007 -0.016 -0.006 0.001 -0.001 -0.005 (0.17) (0.39) (0.15) (0.01) (0.01) (0.12) 100% 0.055 -0.002 0.050 0.039 0.049 0.044 (0.81) (0.03) (0.72) (0.56) (0.70) (0.63) No managers at workplace -0.021 0.010 0.029 0.011 -0.010 -0.002 (0.30) (0.14) (0.43) (0.16) (0.16) (0.03) % employees who are women 0.002 0.003 0.002 0.002 0.002 0.002 (2.05)* (2.81)** (2.34)* (2.13)* (2.56)* (2.41)* % employees working part-time (ref.: under 10%)
None -0.087 -0.089 -0.089 -0.078 -0.087 -0.088 (1.62) (1.64) (1.61) (1.42) (1.64) (1.61) 10-24% -0.049 -0.089 -0.032 -0.044 -0.053 -0.049 (0.96) (1.80) (0.64) (0.90) (1.07) (0.98) 25-49% 0.008 -0.028 0.023 0.017 -0.013 0.004 (0.13) (0.47) (0.38) (0.29) (0.22) (0.07) 50-74% 0.022 -0.048 0.039 0.016 0.012 0.021 (0.33) (0.69) (0.58) (0.23) (0.17) (0.31) 75% or more 0.075 -0.043 0.096 0.090 0.055 0.071 (0.88) (0.46) (1.12) (1.07) (0.65) (0.83) % employees who are non-white (ref.: none) Under 5% -0.085 -0.080 -0.075 -0.090 -0.089 -0.091 (2.51)* (2.28)* (2.20)* (2.63)** (2.56)* (2.66)** 5-10% -0.120 -0.132 -0.119 -0.137 -0.141 -0.144 (2.16)* (2.29)* (2.14)* (2.47)* (2.50)* (2.57)*
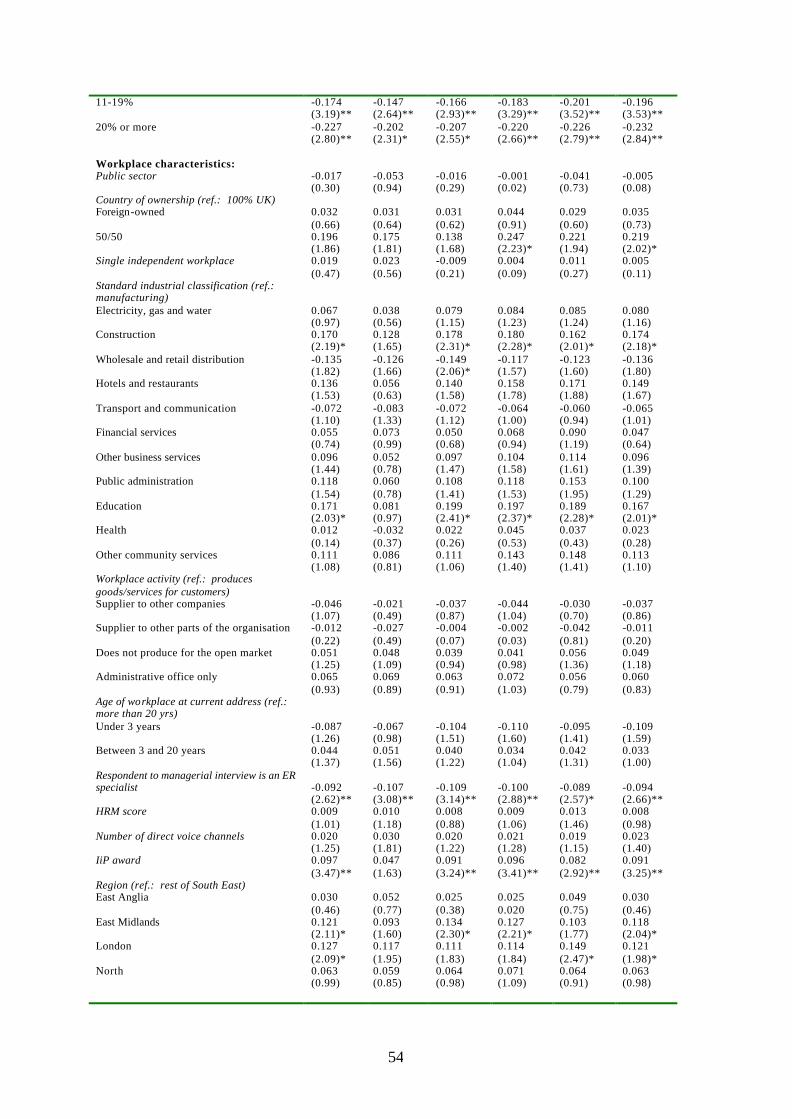
54
11-19% -0.174 -0.147 -0.166 -0.183 -0.201 -0.196 (3.19)** (2.64)** (2.93)** (3.29)** (3.52)** (3.53)** 20% or more -0.227 -0.202 -0.207 -0.220 -0.226 -0.232 (2.80)** (2.31)* (2.55)* (2.66)** (2.79)** (2.84)** Workplace characteristics: Public sector -0.017 -0.053 -0.016 -0.001 -0.041 -0.005 (0.30) (0.94) (0.29) (0.02) (0.73) (0.08) Country of ownership (ref.: 100% UK) Foreign-owned 0.032 0.031 0.031 0.044 0.029 0.035 (0.66) (0.64) (0.62) (0.91) (0.60) (0.73) 50/50 0.196 0.175 0.138 0.247 0.221 0.219 (1.86) (1.81) (1.68) (2.23)* (1.94) (2.02)* Single independent workplace 0.019 0.023 -0.009 0.004 0.011 0.005 (0.47) (0.56) (0.21) (0.09) (0.27) (0.11) Standard industrial classification (ref.: manufacturing)
Electricity, gas and water 0.067 0.038 0.079 0.084 0.085 0.080 (0.97) (0.56) (1.15) (1.23) (1.24) (1.16) Construction 0.170 0.128 0.178 0.180 0.162 0.174 (2.19)* (1.65) (2.31)* (2.28)* (2.01)* (2.18)* Wholesale and retail distribution -0.135 -0.126 -0.149 -0.117 -0.123 -0.136 (1.82) (1.66) (2.06)* (1.57) (1.60) (1.80) Hotels and restaurants 0.136 0.056 0.140 0.158 0.171 0.149 (1.53) (0.63) (1.58) (1.78) (1.88) (1.67) Transport and communication -0.072 -0.083 -0.072 -0.064 -0.060 -0.065 (1.10) (1.33) (1.12) (1.00) (0.94) (1.01) Financial services 0.055 0.073 0.050 0.068 0.090 0.047 (0.74) (0.99) (0.68) (0.94) (1.19) (0.64) Other business services 0.096 0.052 0.097 0.104 0.114 0.096 (1.44) (0.78) (1.47) (1.58) (1.61) (1.39) Public administration 0.118 0.060 0.108 0.118 0.153 0.100 (1.54) (0.78) (1.41) (1.53) (1.95) (1.29) Education 0.171 0.081 0.199 0.197 0.189 0.167 (2.03)* (0.97) (2.41)* (2.37)* (2.28)* (2.01)* Health 0.012 -0.032 0.022 0.045 0.037 0.023 (0.14) (0.37) (0.26) (0.53) (0.43) (0.28) Other community services 0.111 0.086 0.111 0.143 0.148 0.113 (1.08) (0.81) (1.06) (1.40) (1.41) (1.10) Workplace activity (ref.: produces goods/services for customers)
Supplier to other companies -0.046 -0.021 -0.037 -0.044 -0.030 -0.037 (1.07) (0.49) (0.87) (1.04) (0.70) (0.86) Supplier to other parts of the organisation -0.012 -0.027 -0.004 -0.002 -0.042 -0.011 (0.22) (0.49) (0.07) (0.03) (0.81) (0.20) Does not produce for the open market 0.051 0.048 0.039 0.041 0.056 0.049 (1.25) (1.09) (0.94) (0.98) (1.36) (1.18) Administrative office only 0.065 0.069 0.063 0.072 0.056 0.060 (0.93) (0.89) (0.91) (1.03) (0.79) (0.83) Age of workplace at current address (ref.: more than 20 yrs)
Under 3 years -0.087 -0.067 -0.104 -0.110 -0.095 -0.109 (1.26) (0.98) (1.51) (1.60) (1.41) (1.59) Between 3 and 20 years 0.044 0.051 0.040 0.034 0.042 0.033 (1.37) (1.56) (1.22) (1.04) (1.31) (1.00) Respondent to managerial interview is an ER specialist
-0.092
-0.107
-0.109
-0.100
-0.089
-0.094
(2.62)** (3.08)** (3.14)** (2.88)** (2.57)* (2.66)** HRM score 0.009 0.010 0.008 0.009 0.013 0.008 (1.01) (1.18) (0.88) (1.06) (1.46) (0.98) Number of direct voice channels 0.020 0.030 0.020 0.021 0.019 0.023 (1.25) (1.81) (1.22) (1.28) (1.15) (1.40) IiP award 0.097 0.047 0.091 0.096 0.082 0.091 (3.47)** (1.63) (3.24)** (3.41)** (2.92)** (3.25)** Region (ref.: rest of South East) East Anglia 0.030 0.052 0.025 0.025 0.049 0.030 (0.46) (0.77) (0.38) 0.020 (0.75) (0.46) East Midlands 0.121 0.093 0.134 0.127 0.103 0.118 (2.11)* (1.60) (2.30)* (2.21)* (1.77) (2.04)* London 0.127 0.117 0.111 0.114 0.149 0.121 (2.09)* (1.95) (1.83) (1.84) (2.47)* (1.98)* North 0.063 0.059 0.064 0.071 0.064 0.063 (0.99) (0.85) (0.98) (1.09) (0.91) (0.98)
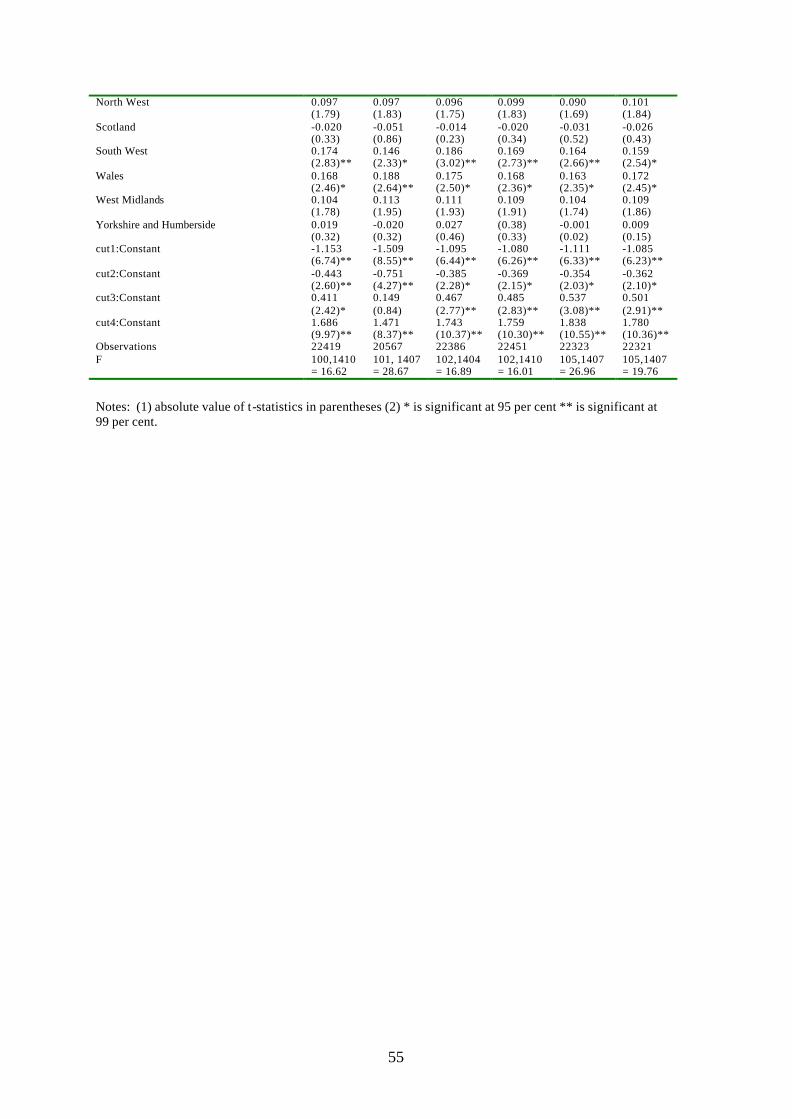
55
North West 0.097 0.097 0.096 0.099 0.090 0.101 (1.79) (1.83) (1.75) (1.83) (1.69) (1.84) Scotland -0.020 -0.051 -0.014 -0.020 -0.031 -0.026 (0.33) (0.86) (0.23) (0.34) (0.52) (0.43) South West 0.174 0.146 0.186 0.169 0.164 0.159 (2.83)** (2.33)* (3.02)** (2.73)** (2.66)** (2.54)* Wales 0.168 0.188 0.175 0.168 0.163 0.172 (2.46)* (2.64)** (2.50)* (2.36)* (2.35)* (2.45)* West Midlands 0.104 0.113 0.111 0.109 0.104 0.109 (1.78) (1.95) (1.93) (1.91) (1.74) (1.86) Yorkshire and Humberside 0.019 -0.020 0.027 (0.38) -0.001 0.009 (0.32) (0.32) (0.46) (0.33) (0.02) (0.15) cut1:Constant -1.153 -1.509 -1.095 -1.080 -1.111 -1.085 (6.74)** (8.55)** (6.44)** (6.26)** (6.33)** (6.23)** cut2:Constant -0.443 -0.751 -0.385 -0.369 -0.354 -0.362 (2.60)** (4.27)** (2.28)* (2.15)* (2.03)* (2.10)* cut3:Constant 0.411 0.149 0.467 0.485 0.537 0.501 (2.42)* (0.84) (2.77)** (2.83)** (3.08)** (2.91)** cut4:Constant 1.686 1.471 1.743 1.759 1.838 1.780 (9.97)** (8.37)** (10.37)** (10.30)** (10.55)** (10.36)** Observations 22419 20567 22386 22451 22323 22321 F 100,1410
= 16.62 101, 1407 = 28.67
102,1404 = 16.89
102,1410 = 16.01
105,1407 = 26.96
105,1407 = 19.76
Notes: (1) absolute value of t-statistics in parentheses (2) * is significant at 95 per cent ** is significant at 99 per cent.
56
References Addison, J.T. and Belfield, C. (2000), ‘The Impact of Financial Participation and Employee
Involvement on Financial Performance: A Re-estimation Using the 1998 WERS’, Scottish Journal of Political Economy, Vol. 47, No. 5, pp.571-583.
Airey, C., Hales, J., Hamilton, R., Korovessis, C., McKernan, A. and Perdon, S. (1999), The
Workplace Employee Relations Survey (WERS) 1997-8: Technical Report. Brown, W., Marginson, P. and Walsh, J. (1995), ‘Management: Pay Determination and
Collective Bargaining’ in P. Edwards (ed.), Industrial Relations: Theory and Practice in Britain, Blackwell: Oxford.
Bryson, A. (1999), ‘Are Unions Good for Industrial Relations?’ in R. Jowell, J. Curtice, A.
Park, and K. Thomson (eds.), British Social Attitudes: the 16th Report – Who Shares New Labour Values?, Aldershot, Ashgate.
Bryson, A. (2000), ‘Have British Workers Lost Their Voice, Or Have They Gained A New
One? An Analysis of Matched Employer-Employee Data’, Discussion Paper No. 2, Policy Studies Institute, London,.
Bryson, A. (2001a), ‘Employee Voice, Workplace Closure and Employment Growth: A
Panel Analysis’, Discussion Paper No. 6, Policy Studies Institute, London. Bryson, A. (2001b), ‘Would I Lie to You? Union Effects on Employee Trust in
Management’, NIESR Review, forthcoming. Bryson, A. (2001c), The Impact of Unions on Workplace Governance, 1983-1998, Policy
Studies Institute, London, forthcoming. Bryson, A. and McKay, S. (1997), ‘What About the Workers?’ in R. Jowell, J. Curtice, A.
Park, L. Brook, K. Thomson and C. Bryson, British Social Attitudes: the 14th Report, Aldershot, Dartmouth.
Bryson, A. and Wilkinson, D. (2001), Collective Bargaining and Workplace Performance:
an Investigation Using the Workplace Employee Relations Survey 1998, Department of Trade and Industry Research Paper.
Confederation of British Industry (1998), Human Resources Report No. 16, CB1: London. Cully, M., Woodland, S., O’Reilley, A. and Dix, G. (1999), Britain at Work: As depicted by
the 1998 Workplace Employee Relations Survey, Routledge: London. Darlington, R. (1994), ‘Shop Stewards' Organisation in Ford Halewood: from Beynon To
Today’, Industrial Relations Journal, 25(2), pp.136-49. Deery, S.J., Erwin, P.J. and Iverson, R.D. (1995), ‘Union Management, Co-Operation, Dual
Allegiance and Organisational Performance’, Working Paper No. 89, Department of Management and Industrial Relations, University of Melbourne.
57
Deery, S., Erwin, P.J. and Iverson, R. (1999), ‘Industrial Relations Climate, Attendance Behaviour and the Role of Trade Unions’, British Journal of Industrial Relations, 37(4), pp.533-558.
Deery, S. and Walsh, J. (1999), ‘The Decline of Collectivism? A Comparative Study of
White-Collar Employees in Britain and Australia’, British Journal of Industrial Relations, 37(2), pp.245-269.
Denny, K. and Muellbauer, J. (1988), ‘Economic and Industrial Relations Explanations of
Productivity Change: Some Evidence for the British Manufacturing Sector, 1980-1984’, mimeo, Nuffield College, Oxford.
Department of Trade and Industry (1998), Fairness at Work, Cmd 3968. Dobson, J.R. (1997), ‘The Effects of Multi-unionism: a Survey of Large Manufacturing
Establishments’, British Journal of Industrial Relations, 35(4), pp.547-566. Fernie, S., Metcalf, D. and Woodland, S. (1994), ‘Does HRM Boost Employee-Management
Relations?’, Working Paper No. 548, Centre for Economic Performance, London School of Economics.
Fernie, S. and Metcalf, D. (1995), ‘Participation, Contingent Pay, Representation and
Workplace Performance: Evidence from Great Britain’, British Journal of Industrial Relations, 33(3), pp.379-415.
Forth, J. and Millward, N. (2000), ‘The Determinants of Pay Levels and Fringe Benefit
Provision in Britain’, Discussion Paper No. 171, National Institute of Economic and Social Research.
Freeman, R. and Medoff, J. (1984), What Do Unions Do?, Basic Books: New York. Gallie, D., White, M., Cheng, Y. and Tomlinson, M. (1998), Restructuring the Employment
Relationship, OUP: Oxford. Greene, W.H. (1997), Econometric Analysis, 3rd edition, Macmillan: New York. Guest, D., Michie, J., Conway, N. and Sheehan, M. (1999), ‘Partnership and Performance:
An Analysis Using the 1998 Workplace Employee Relations Survey’, paper for BJIR/WERS98 Conference, Cumberland Lodge.
Horn, H. and Wolinsky, A. (1988), ‘Worker Substitutability and Patterns of Unionisation’,
The Economic Journal, 98, pp.484-487. Huselid, M.A. and Becker, B.E. (1996), ‘Methological Issues in Cross-Sectional and Panel
Estimates of the Human Resource-Firm Performance Link’, Industrial Relations, Vol. 35, No. 3, pp.400-422.
Hyman, R. (1997), ‘The Future of Employee Representation’, British Journal of Industrial
Relations, 35(3), pp.309-336.

58
Machin, S. (2000), ‘Union Decline in Britain’, British Journal of Industrial Relations, 38(4), pp.631-645.
Marchington, M. and Parker, P. (1990), Changing Patterns of Employee Relations, Harvester
Wheatsheaf: Hemel Hempstead. Marshall, R. (1992), ‘The Future Role of Government in Industrial Relations’, Industrial
Relations Journal, 31(1), pp.31-49. Metcalf, D. (2000), ‘British Unions: Dissolution or Resurgence Revisited’, Discussion Paper
No. , Centre for Economic Performance, London School of Economics. Metcalf, D., Wadsworth, J. and Ingram, P. (1993), ‘Multi-Unionism, Size of Bargaining
Group and Strikes’, Industrial Relations Journal, 24(1), pp.3-13. Millward, N. (1994), The New Industrial Relations?, Policy Studies Institute: London. Millward, N., Bryson, A. and Forth, J. (2000), All Change at Work? British Employment
Relations, 1980-98, As Portrayed by the Workplace Industrial Relations Survey Series, Routledge: London.
Moreton, D. (1999), ‘A Model of Labour Productivity and Union Density in British Private
Sector Unionised Establishments’, Oxford Economic Papers, 51, pp.322-344. Naylor, R. (1995), ‘On the Economic Effects of Multiple Unionism, Scandinavian Journal of
Economics, 97(1), pp.161-167. Pfeffer, J. (1995), ‘Producing Sustainable Competitive Advantage through Effective
Management of People’, Academy Journal of Management Executive, 9(1), pp.55-69. Scholarios, D., Ramsay, H. and Harley, B. (1999), ‘High Noon on the High Road: Testing
Inside the Black Box of ‘High Performance’ Work Systems’, paper for BJIR/WERS98 Conference, Cumberland Lodge.
Skinner, C.J. (1989), Introduction to Part A in C.J. Skinner; D. Holt, and T.M.F. Smith,
(eds.), Analysis of Complex Surveys, John Wiley and Sons: New York. Skinner, C. (1997), ‘The Use of Sample Survey Weights in the Regression Analysis of the
Workplace Industrial Relations Survey Data’, mimeo, University of Southampton. STATA (1999), Manual Release 6 Volume 4, STATA Press, College Station, Texas. Storey, J. (1992), Developments in the Management of Human Resources, Blackwells:
Oxford. Wajcman, J. (1996), ‘Desperately Seeking Differences: Is Management Style Gendered?’,
British Journal of Industrial Relations, 34(3), pp.333-49. Walton, R. and McKersie, R. (1965), A Behavioural Theory of Labor Negotiations,
McGraw-Hill: New York.
59
Wood, S. and de Menezes, L. (1998), ‘High Commitment Management in the UK: Evidence from the Workplace Industrial Relations Survey, and Employers’ Manpower and Skills Practices Survey’, Human Relations, 51(4), pp.485-515.
Wood, S. and Godard, J. (1999), ‘The Statutory Union Recognition Procedure in the
Employment Relations Bill: A Comparative Analysis’, British Journal of Industrial Relations, 37, pp.203-245.
Wright, M. (1996), ‘The Collapse of Compulsory Unionism? Collective Organization in
Highly Unionized British Companies, 1979-1991’, British Journal of Industrial Relations, 34(4), pp.497-513.
Recent Discussion Papers from the ‘Future of Trade Unions in Modern Britain’ Programme
Centre for Economic Performance
493 D. Metcalf British Unions: Dissolution or Resurgence
Revisited
April 2001
492 R. Gomez S. M. Lipset N. Meltz
Frustrated Demand for Unionisation: the Case of the United States and Canada Revisited
477 P. Willman The Viability of Trade Union Organisation: A Bargaining Unit Analysis
November 2000
468 A. S. Litwin Trade Unions and Industrial Injury in Great Britain
August 2000
455 S. Machin Union Decline in Britain April 2000
454 D. Marsden Teachers Before the ‘Threshold’ April 2000
453 H. Gospel G. Lockwood P. Willman
The Right to Know: Disclosure of Information for Collective Bargaining and Joint Consultation
April 2000
452 D. Metcalf K. Hansen A. Charlwood
Unions and the Sword of Justice: Unions and Pay Systems, Pay Inequality, Pay Discrimination and Low Pay
April 2000
To order a discussion paper, please contact the Publications Unit Tel 020 7955 7673 Fax 020 7955 7595 Email [email protected]
Web site http://cep.lse.ac.uk
CENTRE FOR ECONOMIC PERFORMANCE Recent Discussion Papers
493 D. Metcalf British Unions: Dissolution or Resurgence Revisited
492 R. Gomez S. M. Lipset N. Meltz
Frustrated Demand for Unionisation: the Case of the United States and Canada Revisited
491 S. Burgess J. Lane D. Stevens
Jobs, Workers and Changes in Earnings Dispersion
490 S. Burgess S. Profit
Externalities in the Matching of Workers and Firms in Britain
489 S. Nickell G. Quintini
Nominal Wage Rigidity and the Rate of Inflation
488 S. Nickell J. Van Reenen
Technological Innovation and Performance in the United Kingdom
487 M. M. Tudela Explaining Currency Crises: A Duration Model Approach
486 D. Sturm Product Standards, Trade Disputes and Protectionism
485 G. Duranton V. Monastiriotis
Mind the Gaps: The Evolution of Regional Inequalities in the UK 1982-1997
484 H. G. Overman Y. Ioannides
Zipfs Law for Cities: An Empirical Examination
483 H. G. Overman Y. Ioannides
Cross Sectional Evolution of the US City Size Distribution
482 Y. Ioannides H. G. Overman
Spatial Evolution of the US Urban System
481 H. G. Overman Neighbourhood Effects in Small Neighbourhoods
480 S. Gomulka Pension Problems and Reforms in the Czech Republic, Hungary, Poland and Romania
To order a discussion paper, please contact the Publications Unit Tel 020 7955 7673 Fax 020 7955 7595 Email [email protected]
Web site http://cep.lse.ac.uk