Embed Size (px)
Citation preview
THE ROLE OF SEMANTIC LOCALITYIN HIERARCHICAL DISTRIBUTED DYNAMIC INDEXING
AND INFORMATION RETRIEVAL
BY
FABIEN DAVID BOUSKILA
�Ecole Nationale Sup�erieure des T�el�ecommunications de Paris� ����
THESIS
Submitted in partial ful�llment of the requirementsfor the degree of Master of Science in Electrical Engineering
in the Graduate College of theUniversity of Illinois at Urbana�Champaign� ����
Urbana� Illinois
ABSTRACT
The global growth in popularity of the World Wide Web has been enabled in part
by the availability of browser�based search tools� which in turn have led to an increased
demand for indexing techniques and technologies� This explosive growth is evidenced by
the rapid expansion in the number and size of digital collections of documents� Simulta�
neously� fully automatic content�based techniques of indexing have been under develop�
ment at a variety of institutions� The time is thus ripe for the development of scalable
knowledge management systems capable of handling extremely large textual collections
distributed across multiple repositories�
Hierarchical Distributed Dynamic Indexing �HDDI dynamically creates a hierarchical
index from distributed document collections� At each node of the hierarchy� a knowl�
edge base is created and subtopic regions of semantic locality are identi�ed� This thesis
presents an overview of HDDI with a focus on the algorithm that identi�es regions of
semantic locality within knowledge bases at each level of the hierarchy�
iii

To my parents� my brother Gautier� my sister �Elise� Bertrand and Nathalie�
iv
ACKNOWLEDGMENTS
I would like to thank Professor William Morton Pottenger for his proactive manag�
ing of the HDDI project� and for his open�door policy towards students� I gratefully
acknowledge the assistance and contributions of the sta in the Automated Learning
Group directed by Dr� Michael Welge at the National Center for Supercomputing Ap�
plications �NCSA as well as the funding and technical oversight provided by Dr� Tilt
Thompkins in the Emerging Technologies Group at NCSA� I also want to thank my the�
sis co�advisor Professor Wen�Mei Hwu and my academic advisor Professor William H�
Sanders for their support�
v
TABLE OF CONTENTS
CHAPTER PAGE
� INTRODUCTION � � � � � � � � � � � � � � � � � � � � � � � � � � � � � � � � �
� OVERVIEW OF INFORMATION RETRIEVAL AND HDDI � � � � ���� Overview of Information Retrieval � � � � � � � � � � � � � � � � � � � � � � �
����� An information retrieval system � � � � � � � � � � � � � � � � � � � ����� The three dimensions of information retrieval � � � � � � � � � � � �
��� Overview of HDDI � � � � � � � � � � � � � � � � � � � � � � � � � � � � � � ������� Concept extraction � � � � � � � � � � � � � � � � � � � � � � � � � � ������� Matrices build � � � � � � � � � � � � � � � � � � � � � � � � � � � � � ������� Hierarchy build � � � � � � � � � � � � � � � � � � � � � � � � � � � � ������� Knowledge base creation � � � � � � � � � � � � � � � � � � � � � � � ������� Semantic locality detection � � � � � � � � � � � � � � � � � � � � � � ������ Hierarchy mapping � � � � � � � � � � � � � � � � � � � � � � � � � � ��
��� HDDI Applications in Information Retrieval � � � � � � � � � � � � � � � � ������� Query search and retrieval � � � � � � � � � � � � � � � � � � � � � � ������� Detection of emerging conceptual contents � � � � � � � � � � � � � ������� Targeted marketing analysis � � � � � � � � � � � � � � � � � � � � � �
� SEMANTIC LOCALITY INDENTIFICATION � � � � � � � � � � � � � ����� Previous Work � � � � � � � � � � � � � � � � � � � � � � � � � � � � � � � � ��
����� The use of clustering in information retrieval � � � � � � � � � � � � ������� Existing algorithms in graph partitioning � � � � � � � � � � � � � � ������� Test collections � � � � � � � � � � � � � � � � � � � � � � � � � � � � ��
��� The Semantic Locality Finder� sLoc � � � � � � � � � � � � � � � � � � � � � ������� Contextual transitivity in sLoc � � � � � � � � � � � � � � � � � � � ������� Design � � � � � � � � � � � � � � � � � � � � � � � � � � � � � � � � � ������� Implementation � � � � � � � � � � � � � � � � � � � � � � � � � � � � ������� Clustering measures � � � � � � � � � � � � � � � � � � � � � � � � � ��
��� Experiments with Macro� and Micrometrics � � � � � � � � � � � � � � � � ������� General observations � � � � � � � � � � � � � � � � � � � � � � � � � ������� The use of micrometrics � � � � � � � � � � � � � � � � � � � � � � � ������� The use of macrometrics � � � � � � � � � � � � � � � � � � � � � � � ������� Results for the optimization function F � � � � � � � � � � � � � � � ��
��� Summary and Conclusion � � � � � � � � � � � � � � � � � � � � � � � � � � �
vi
� VALIDATION AND GOLD STANDARDS � � � � � � � � � � � � � � � � ����� The SMART Project and Gold Standards � � � � � � � � � � � � � � � � � ����� Building an HDDI from SMART Collections � � � � � � � � � � � � � � � � �
����� Study of the gold standard SMART queries � � � � � � � � � � � � ������ Study of the leaf�level HDDI nodes � � � � � � � � � � � � � � � � � ������ Study of interior HDDI nodes � � � � � � � � � � � � � � � � � � � � ������ Study of a sample hierarchy � � � � � � � � � � � � � � � � � � � � � �
��� Query Search and Retrieval Strategies � � � � � � � � � � � � � � � � � � � ������� Mixed transversal and vertical search strategy � � � � � � � � � � � ������� Conclusion � � � � � � � � � � � � � � � � � � � � � � � � � � � � � � � ��
� CONCLUSIONS AND FUTURE WORK � � � � � � � � � � � � � � � � � � ��� Regions of Semantic Locality and sLoc � � � � � � � � � � � � � � � � � � � � ��� Hierarchical Classi�cation of Knowledge and HDDI � � � � � � � � � � � � ����� Other Applications � � � � � � � � � � � � � � � � � � � � � � � � � � � � � � ��
REFERENCES � � � � � � � � � � � � � � � � � � � � � � � � � � � � � � � � � � ��
vii
LIST OF TABLES
Table PAGE
��� Similarity matrix � � � � � � � � � � � � � � � � � � � � � � � � � � � � � � � � � ����� Binary matrix� threshold �� � � � � � � � � � � � � � � � � � � � � � � � � � � � ����� Binary matrix� threshold �� � � � � � � � � � � � � � � � � � � � � � � � � � � � ����� Binary matrix� threshold �� � � � � � � � � � � � � � � � � � � � � � � � � � � � ����� Running times for dierent input sets and � � ��� � � � � � � � � � � � � � � � ���� Regression statistics � � � � � � � � � � � � � � � � � � � � � � � � � � � � � � � ��
��� Terms of item frequency � in the knowledge neighborhoods at a leaf node � � ���� Average percentage of a query matching at least one level of the HDDI � � � ��
viii
LIST OF FIGURES
Figure PAGE
��� A typical IR system � � � � � � � � � � � � � � � � � � � � � � � � � � � � � � � ��� Hierarchy build � � � � � � � � � � � � � � � � � � � � � � � � � � � � � � � � � � ����� Knowledge base � � � � � � � � � � � � � � � � � � � � � � � � � � � � � � � � � � ����� Regions of semantic locality in a knowledge base � � � � � � � � � � � � � � � � ����� Query mapping process � � � � � � � � � � � � � � � � � � � � � � � � � � � � � � ���� Sample mapping from user space to Web pages space � � � � � � � � � � � � � ��
��� Typical class types� �a string� �b star� �c clique� �d clump � � � � � � � � � ����� Resulting clusters for each value of the threshold � � � � � � � � � � � � � � � ����� Strongly connected regions of a graph � � � � � � � � � � � � � � � � � � � � � � ����� The sLoc process � � � � � � � � � � � � � � � � � � � � � � � � � � � � � � � � � ����� Distribution of weights at a leaf�level node � � � � � � � � � � � � � � � � � � � � �� Distribution of weights in an interior node � � � � � � � � � � � � � � � � � � � � ��� Running time versus Max�N�E for sLoc � � � � � � � � � � � � � � � � � � � � ����� Pseudo�code for Tarjan�s algorithm � � � � � � � � � � � � � � � � � � � � � � � ����� Homogeneous vs� tightly connected clusters � � � � � � � � � � � � � � � � � � ������ Distribution of arc weights at a leaf�level node �for Patterns ��� � � � � � � ������ Clusters at the end of phase �� vs� � � � � � � � � � � � � � � � � � � � � � � ������ Number of clusters vs� � � � � � � � � � � � � � � � � � � � � � � � � � � � � � � ������ Intracluster densities for Patterns ��� � � � � � � � � � � � � � � � � � � � � � � ������ Intercluster densities for Patterns ��� � � � � � � � � � � � � � � � � � � � � � � ������ Reduced intracluster density for an interior HDDI node �from Patterns ��� ����� Intercluster density for an interior HDDI node �from Patterns ��� � � � � � ������ Weight distribution for an interior HDDI node �from Patterns ��� � � � � � � ���� Optimization function F vs� � � � � � � � � � � � � � � � � � � � � � � � � � � � ������ �� � ��� P� vs� � � � � � � � � � � � � � � � � � � � � � � � � � � � � � � � � � ������ Coverage c vs� � � � � � � � � � � � � � � � � � � � � � � � � � � � � � � � � � � ������ Optimization function F for an interior HDDI node �from Patterns ��� � � � ��
��� Item frequency distribution of ADI queries � � � � � � � � � � � � � � � � � � � ���� Item frequency distribution of ADI document set � � � � � � � � � � � � � � � ���� Item frequency distribution of CISI queries � � � � � � � � � � � � � � � � � � � ���� Item frequency distribution of CISI document set � � � � � � � � � � � � � � � ���� Item frequency distribution of MED queries � � � � � � � � � � � � � � � � � � ��� Item frequency distribution of MED document set � � � � � � � � � � � � � � � ���� Interior node item frequency distribution for CISI � � � � � � � � � � � � � � � �
ix
��� Interior node item frequency distribution for MED � � � � � � � � � � � � � � ���� Interior node item frequency distribution for ADI � � � � � � � � � � � � � � � ������ Item frequency distribution of ADI document set � � � � � � � � � � � � � � � ������ Mixed transversal and vertical search strategy � � � � � � � � � � � � � � � � � ������ Algorithm for the mixed transversal�vertical search strategy � � � � � � � � � ��
x
CHAPTER �
INTRODUCTION
The explosive growth of digital repositories of information has been enabled by re�
cent developments in communication and information technologies� The global Inter�
net�World Wide Web exempli�es the rapid deployment of such technologies� Despite
signi�cant accomplishments in internetworking� however� scalable indexing techniques
for distributed information lag behind the rapid growth of digital collections�
In the ��st century� a signi�cant amount of information useful in the practice of sci�
ence will be available via such computer communications networks� The appearance of
focussed digital libraries on the World Wide Web demonstrates the willingness of scien�
tists and engineers to distribute detailed information beyond that traditionally available
in the published literature �e�g�� ���� It is critical that new information infrastructure
be developed that enables eective search in the huge volume of distributed information
emerging in digital form�
Traditional methods of indexing combine multiple subject areas into a single� mono�
lithic index� There are already enough documents on the Web that such indexing tech�
nology is often failing to perform eective search� The di�culty lies in the fact that
since so many documents and subjects are being combined together� retrieving all the
documents that match a particular word phrase often returns too many documents for
eective search� This problem has been known for some time ����
In order to properly address this problem� a paradigm shift is needed in the approach
to indexing� First and foremost� it is clear that digital collections are now and will
continue to be distributed� Our �rst premise is thus that indexesmust also be distributed�
�
Secondly� it must be realized that the information contained in these distributed
digital repositories is hierarchical in nature�� Traditionally� knowledge hierarchies have
been created with human expertise�� Such an approach does not scale to the tremendous
amount of emerging digital information for two reasons� as knowledge increases� new
topics are emerging at a greater rate� and both this and the sheer volume of information
preclude manual approaches to indexing� Our second premise is thus that distributed
indexes must properly re�ect the hierarchical nature of knowledge�
Thirdly� due to the vast increase in communications bandwidth and computing and
online storage capabilities mentioned above� digital collections are frequently updated�
This process re�ects a key characteristic of ��st century collections� namely� they are
dynamic in nature� Our third premise is thus that any new information infrastructure
must include dynamic indexing capabilities�
In the �nal analysis� these three technologies must be integrated into a cohesive whole�
The goal of our research is thus to architect a knowledge management prototype based
on HDDI� Hierarchical Distributed Dynamic Indexing�
This thesis will give a brief overview of the steps involved in HDDI� and then focus on
my work in developing technology for identifying regions of semantic locality in knowledge
bases� I will also use the results of our experiments to justify the need for a hierarchical
classi�cation of knowledge�
Chapter � provides the reader with an overview of HDDI� It describes the dierent
steps and concepts leading to a scalable dynamic index of repositories�
Chapter � describes sLoc� the algorithm we developed at NCSA to identify regions
of semantic locality in knowledge bases� After a review of the previous work� I explain
the theory behind sLoc� Because sLoc is intended to be used for a whole set of dierent
applications� we designed a set of measures that the user may select from to get the
�This point was made recently by the National Center for Supercomputing Applications �NCSA�director Larry Smarr and echoed by NSF CISE assistant director Ruzena Bajcsy at recent seminars atthe University of Illinois�
�One popular form is the thesaurus �e�g�� the National Library of Medicine�s MeSH thesaurus��
�

clustering needed for his particular application� I then report on our experiments with
these dierent measures and give more information on their use�
In Chapter �� I describe the experiments we conducted in order to validate our ap�
proach with sLoc� For the particular case of a query search application� we compared
sLoc to gold standard collections from the SMART project�� ADI� CISI and MED� This
led us to some better insight into the use of the hierarchy in HDDI�
Chapter � states our conclusions and open issues for future work�
�Cornell University�
�
CHAPTER �
OVERVIEW OF INFORMATION
RETRIEVAL AND HDDI
This chapter will discuss the goals� concepts and strategies used in building a Hier�
archical Distributed Dynamic Index� I will �rst give a brief overview of the information
retrieval �eld�� and explain what speci�c applications of IR HDDI addresses� I will then
describe the HDDI process step by step� Finally� we will take a look at how HDDI can
be applied to knowledge management in various applications�
��� Overview of Information Retrieval
First of all� information retrieval �IR is a broad term with multiple meanings� In
the scope of this thesis� we shall be concerned only with automatic information retrieval
systems� We are actually considering automatic as opposed to manual systems� we also
want to make a clear distinction between information and data� In �Information Storage
and Retrieval� ��� Korfhage describes the dierence between information and data as
follows��
Data are received� stored� and retrieved by an information endosystem� The
data are impersonal� they are equally available to any users of the system�
Information� in contrast� is a set of data that have been matched to a partic�
ular information need� That is� the concept of information has both personal
�This section is adapted from van Rijsbergen�s ���� book � for the most part� I added referencesto IR work in the eighties and nineties� and put this introduction into HDDI�s perspective�
�The endosystem �� consists of those factors that the designer can specify and control such as theequipment� algorithms and procedures used�
�
and time�dependent components that are not present in the concept of data�
For example� even if a system can provide to the user a list of ingredients
in a certain breakfast cereal or the names of the signers of the Declaration
of Independence� these data are not information if they are already known
to the user or have no relevance to the user�s need� In eect these data be�
come noise in the system� disrupting the user�s awareness and concentration�
In addition� they potentially dilute the system response to any information
need�
Even if information retrieval is not only about document retrieval� it has been accepted
as a description for the work published by Cleverdon � �� Salton ��� ��� Sparck Jones ���
and others� Instead of documents� one can consider other pieces of information to be
retrieved� similar terms and sentences� for example� For the sake of simplicity we will
describe IR as retrieving documents or items� but one has to keep in mind that a document
is not the only chunk of information that can be returned�
Another perspective is to consider information retrieval �IR in relation to data re�
trieval �DR� The main aspect that dierentiates IR from DR is that DR normally looks
for an exact match � it returns a boolean answer to the request saying if the there is an
item that exactly matches the request� IR will rather �nd all the items that partially
match the query and then rank them with respect to a given set of criteria� only to return
the best matches�
Data retrieval is generally described as deterministic� whereas information retrieval
is essentially probabilistic� While DR uses simple yes�no relationships between elements
�a is related to b� or is not� IR allows a degree of uncertainty in these relationships� and
assigns a measure on it�
As van Rijsbergen puts it ���� data retrieval typically uses a monoethic classi�cation�
in order to belong to a class� an object must have a set of attributes both necessary and
su�cient to belong to a class� In IR such a classi�cation would not be very useful� a
polyethic classi�cation is rather used� one where an object will only share some attributes
with the other class members�
�
Processor
Feedback
Items
Queries
OutputInput
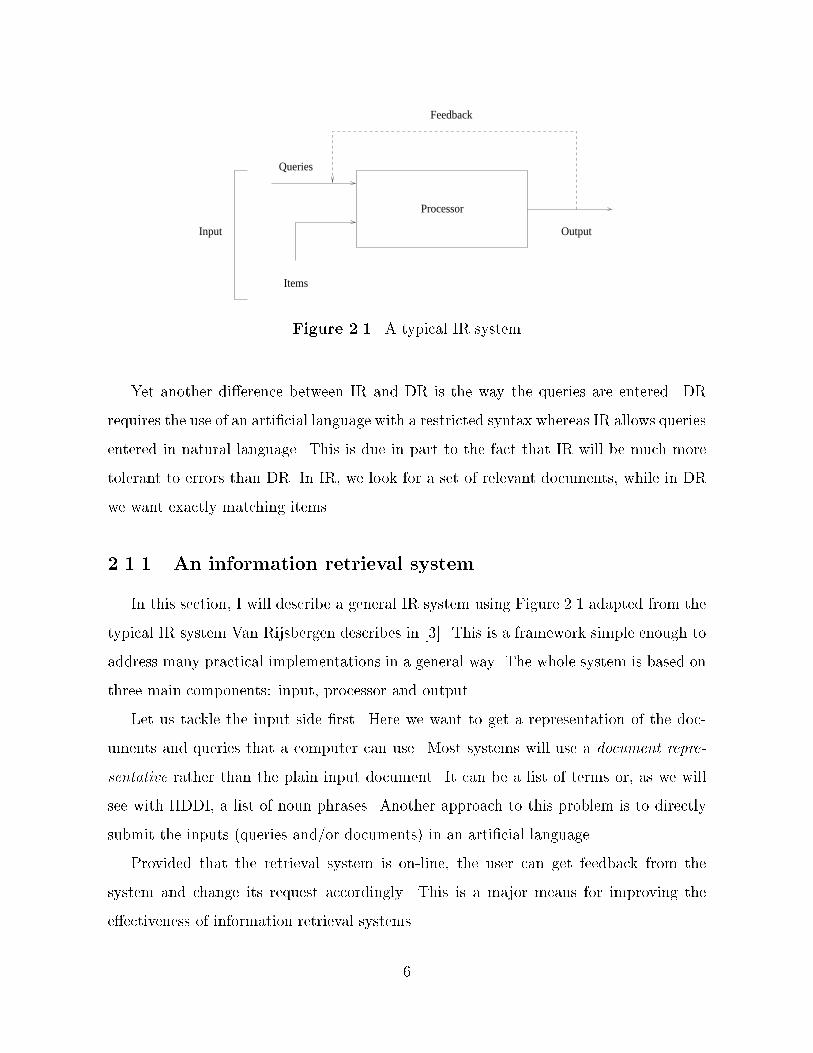
Figure ��� A typical IR system
Yet another dierence between IR and DR is the way the queries are entered� DR
requires the use of an arti�cial language with a restricted syntax whereas IR allows queries
entered in natural language� This is due in part to the fact that IR will be much more
tolerant to errors than DR� In IR� we look for a set of relevant documents� while in DR
we want exactly matching items�
����� An information retrieval system
In this section� I will describe a general IR system using Figure ��� adapted from the
typical IR system Van Rijsbergen describes in ���� This is a framework simple enough to
address many practical implementations in a general way� The whole system is based on
three main components� input� processor and output�
Let us tackle the input side �rst� Here we want to get a representation of the doc�
uments and queries that a computer can use� Most systems will use a document repre�
sentative rather than the plain input document� It can be a list of terms or� as we will
see with HDDI� a list of noun phrases� Another approach to this problem is to directly
submit the inputs �queries and�or documents in an arti�cial language�
Provided that the retrieval system is on�line� the user can get feedback from the
system and change its request accordingly� This is a major means for improving the
eectiveness of information retrieval systems�
The processor is the second part of the retrieval system� This is the module actu�
ally concerned with structuring the information in order to actually retrieve the relevant
items� This process usually involves some sort of classi�cation and a strategy for per�
forming the actual search over the resulting structure�
Eventually the processor does or does not �nd relevant documents and outputs the
results� These typically consist of a set of items �documents or other chunks of informa�
tion� At this point the processing part of IR is done� but the results need to be analyzed
in order to know how well the system performs�
����� The three dimensions of information retrieval
Following van Rijsbergen ���� we identify three main areas of research in IR� content
analysis� information structures� and evaluation� The �rst is concerned with describing
the contents of documents in a suitable form for computer processing� The second� infor�
mation structures� focuses on exploiting relationships between the pieces of information
in the input� in order to improve e�ciency and eectiveness of retrieval strategies� The
third� evaluation� addresses the issues of measuring the eectiveness of retrieval�
������� Content analysis
Van Rijsbergen reports that since Luhn �see ���� in the late ����s� frequency counts of
words in a document text have often been used to determine which words were signi�cant
enough to represent the document in the computer� These words have thus been called
keywords� In addition� the frequency of occurrence of these words in the body of the
text were also used to indicate how signi�cant they are one compared to the other� This
provided a simple weighting scheme for the keywords� and documents were represented
using a weighted keyword description of the document�
At this point I want to make clear what is meant by keyword with respect to term�
Traditionally the two have been used interchangeably� but in the scope of this thesis� we
�
will use term only to refer to a single word keyword �e�g�� �car�� However� notice that a
keyword can also be a set of words such as a noun phrase �e�g�� �brand new blue car��
Van Rijsbergen reports that the use of statistical information about distributions of
words in documents was exploited by Maron and Kuhns ����� and Stiles ���� who obtained
statistical associations between keywords� In order to achieve better retrieval results
these associations were used to build a thesaurus� The �� � Washington Symposium on
Statistical Association Methods for Mechanized Documentation ���� is a good reference
for this early work� Karen Sparck Jones used measures of association between keywords
based on their frequency of co�occurrence� that is� the frequency with which two keywords
occur together within the same document� She has shown that such related words can
be used to increase the proportion of the relevant documents which are retrieved ����
������� Information structure
The information structure deals with the way the information is organized for the
purpose of information retrieval� This is a crucial part of the process� if not executed
properly� the information structure can lead to very poor e�ciency� A popular orga�
nization is the inverted �le where for each keyword� the documents in which it occurs
are listed� Many experiments have attempted to demonstrate the superiority of another
organization� in clustered��les� potentially better for on�line retrieval� The organization
of these clustered �les is produced by an automatic classi�cation method�
Over the last �� years� these automatic classi�cation techniques have been the subject
of an extensive research practice� Van Rijsbergen reports that Good ���� and Fairhorne
���� �rst suggested that the use of automatic classi�cation in document retrieval� Doyle
�� � and Rocchio ���� carried out the �rst serious experiments in document clustering back
in �� �� Over the ����s Salton�s SMART system ��� provided the necessary tools for the
research community to carry out experiments in this �eld� Over the ����s document
clustering has still been used extensively� and new methods have also been investigated
from the late ����s until now� such as Latent Semantic Indexing �LSI by Susan Dumais
����� LSI is based on an SVD �singular vector decomposition of the term to document
�
matrix� it then reduces the dimension of the space to �nd the latent relationships between
terms� It is dierent from document clustering because clusters are not actually formed�
during the retrieval phase the query vector is mapped into the smaller dimension space
and a distance metric is used to return the closest documents�
������� Evaluation
The �rst comparative test of information retrieval dates back to the �rst Cran�eld
test� between ���� and �� � ����� Later on� in the ����s� the SMART retrieval system
���� ����� and Sparck Jones ��� experiments are characterized by the use of test collec�
tions of documents� requests and relevance judgments that will be needed� and by the
view of information retrieval as a batch process� Interaction with the user is not really
compatible with this approach ����� In ����� Karen Sparck Jones edited Information
Retrieval Experiment� a good summary of what had been done at the time� In late �����
TREC �Text REtrieval Conference started ����� TREC provides researchers with a set of
collections and queries� Results are submitted to the organizers for relevance evaluation�
Today eectiveness of retrieval is mostly measured in terms of precision �the propor�
tion of retrieved documents which are relevant and recall �the proportion of relevant
documents retrieved or by measures based on them�
������� E�ectiveness and e�ciency
The main purpose of the research in information retrieval is to improve e�ective�
ness and e�ciency of retrieval� E�ciency is usually measured in terms of the computer
resources used such as memory used� storage necessary� and CPU time� E�ciency mea�
surement is generally machine�dependent� In the previous section I mentioned that ef�
fectiveness is usually measured in terms of precision and recall� Because these measures
are central to any study in information retrieval� let me state the de�nitions for precision
and recall here�
�
Precision �Number of relevant documents retrieved
total number of documents retrived����
Recall �Number of relevant documents retrieved
total number of relevant documents����
The reason for emphasizing these two measures is that I make frequent reference to
retrieval eectiveness but its actual use is delayed until Chapter �� It will su�ce until
we reach that chapter to think of retrieval eectiveness in terms of precision and recall�
��� Overview of HDDI
Hierarchical Distributed Dynamic Indexing �HDDI is a technology for organizing
very large distributed and dynamic data sets into a cohesive hierarchical framework for
optimal probabilistic search�
Our primary objective in the Hierarchical Distributed Dynamic Indexing project is to
create a software system whereby large� distributed collections are automatically indexed
for use in concept�based knowledge searches� The di�culty in creating indexing systems
that eectively perform concept�based search is a well�known problem �����
The following steps compose the HDDI system�
� Concept extraction
� Matrices build
� Hierarchy build
� Knowledge base creation
� Regions of semantic locality detection
� Hierarchy map formation
��
����� Concept extraction
During the concept extraction process� parts of speech within documents are tagged
and all concepts �e�g�� nouns and noun phrases in textual collections occurring within
the document collection are identi�ed� Heuristics are applied to prune the result set�
Documents are currently stored in Extensible Markup Language �XML format� The
resulting set of concepts is then used in the matrices build process�
����� Matrices build
Concepts extracted during the previous process are used to compute concept fre�
quency and co�occurrence matrices� Concepts which occur within the same document
are de�ned as co�occurring� The frequencies of co�occurrences of concept pairs among all
documents in the set are also computed�
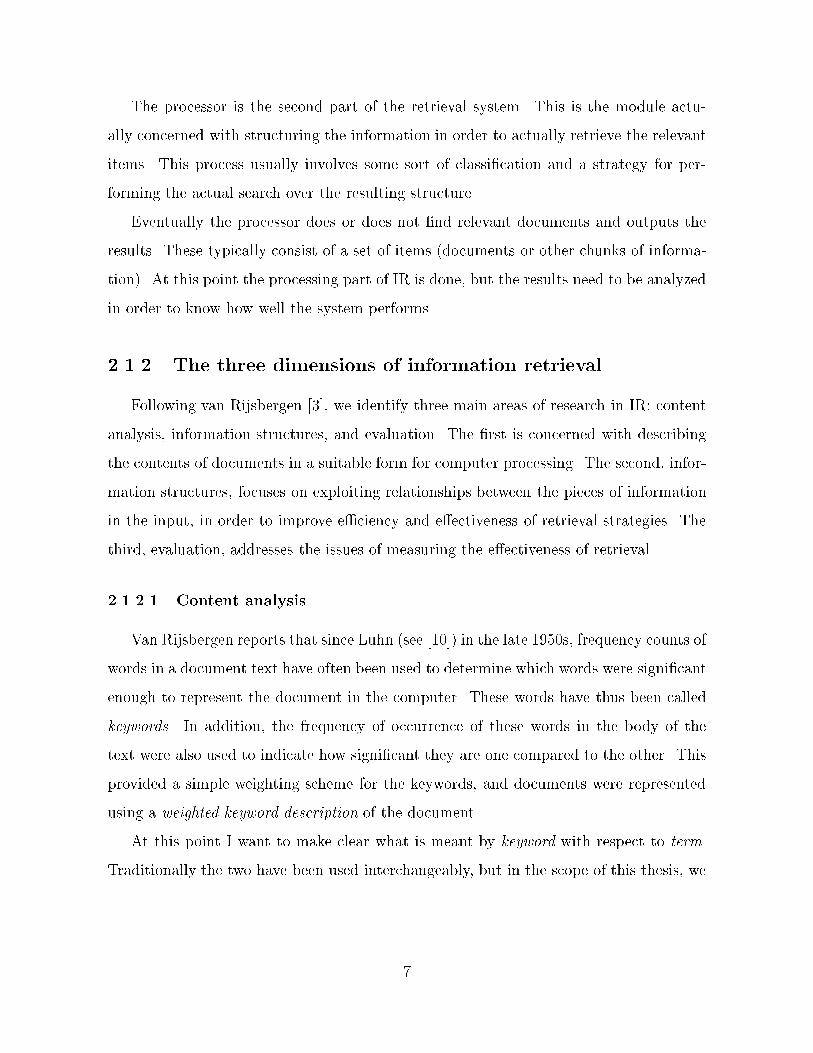
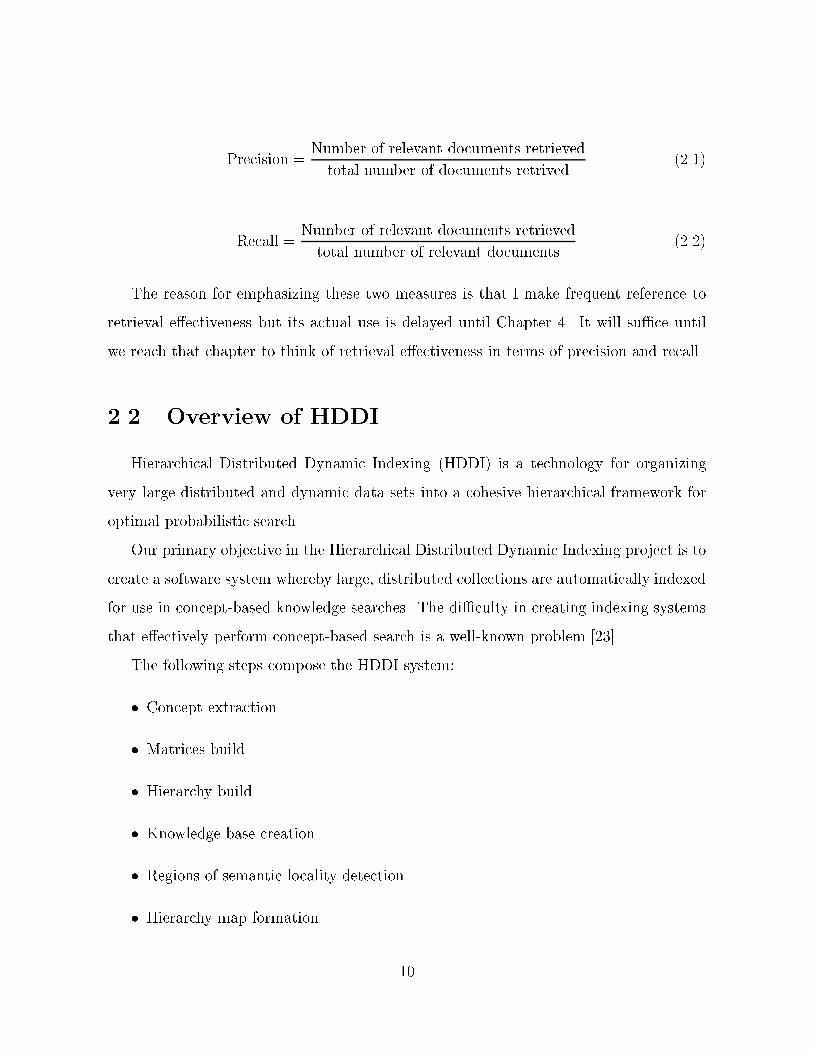
����� Hierarchy build
The hierarchy build is a metalevel organizational process that combines the matrices
built in the previous step� These co�occurrence matrices provide the basis for organizing
concepts into an ontology of knowledge based on the content of the collections� Systematic
�ltering� pruning� and meshing lower level �child matrices form the hierarchical structure�
producing higher level �parent combined matrices as show in Figure ���� The process
is iterative in that matrices are pruned and merged at successively higher levels� The
resulting hierarchical index consists of high�resolution leaf�level index nodes that become
increasingly less precise �i�e�� lower resolution as the hierarchy is built�
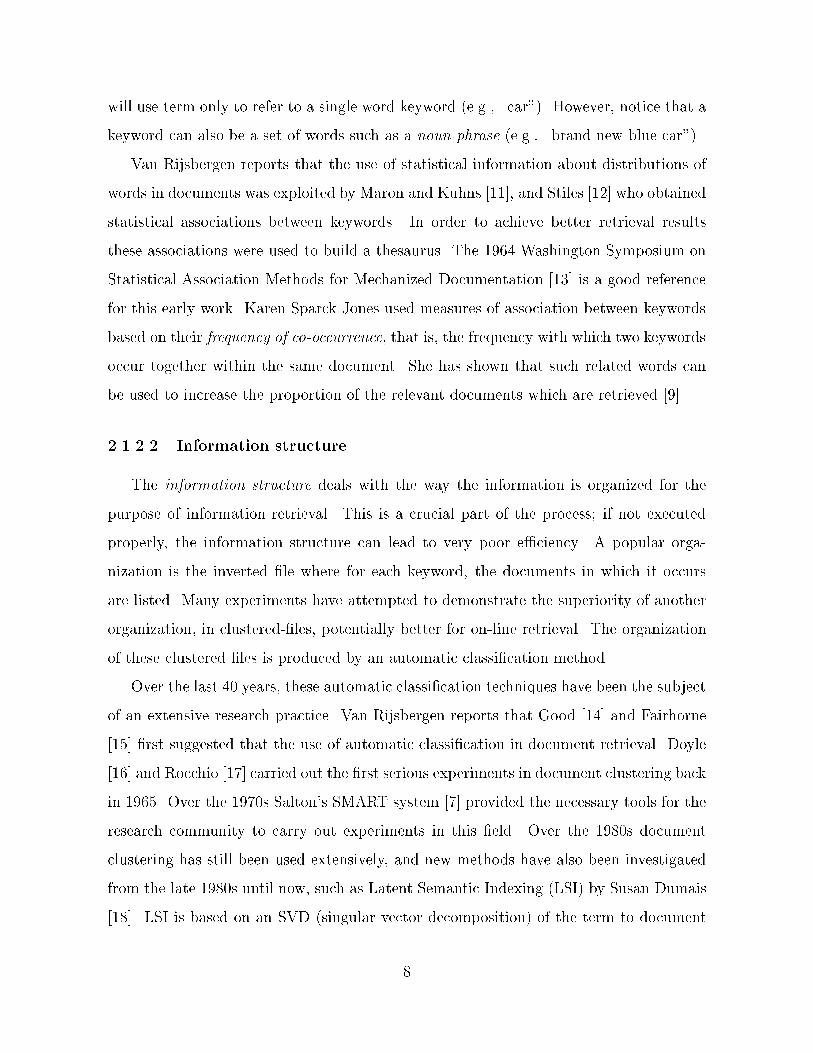
����� Knowledge base creation
Knowledge base formation is the second metalevel organizational process� For each
concept in each matrix in the hierarchy� co�occurring concepts are ranked� resulting in
a one�to�many mapping where each concept is associated with a list of related concepts
��
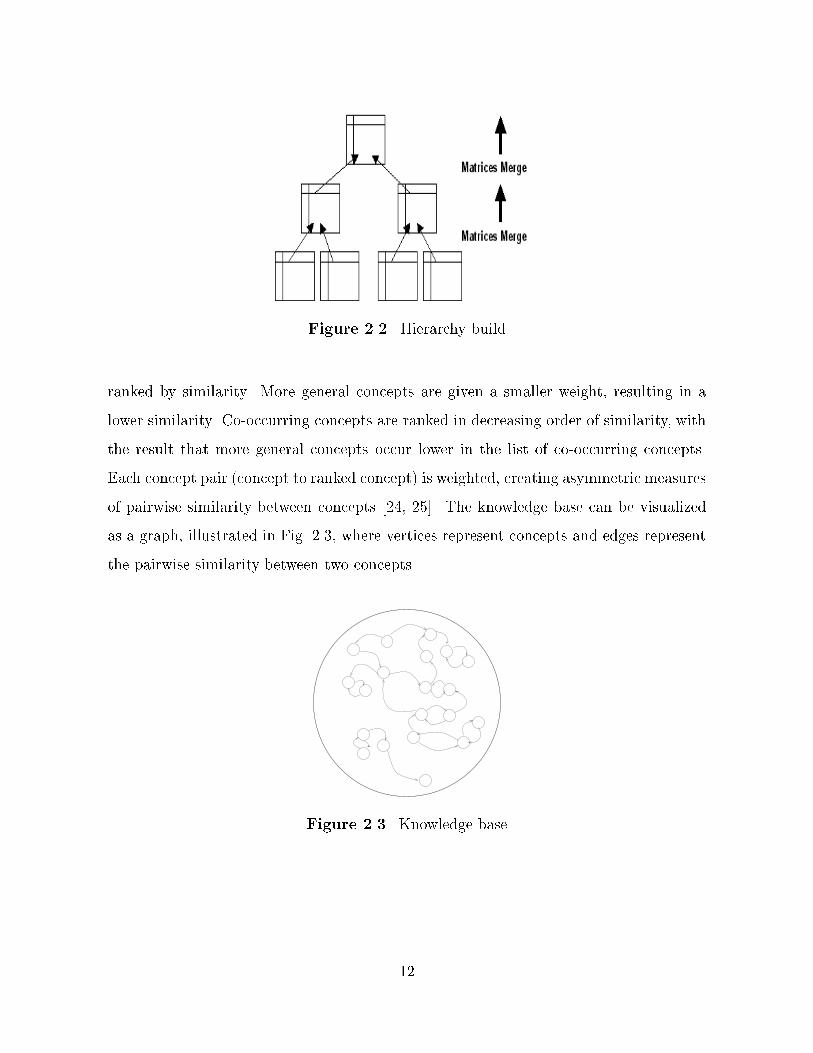
Figure ��� Hierarchy build
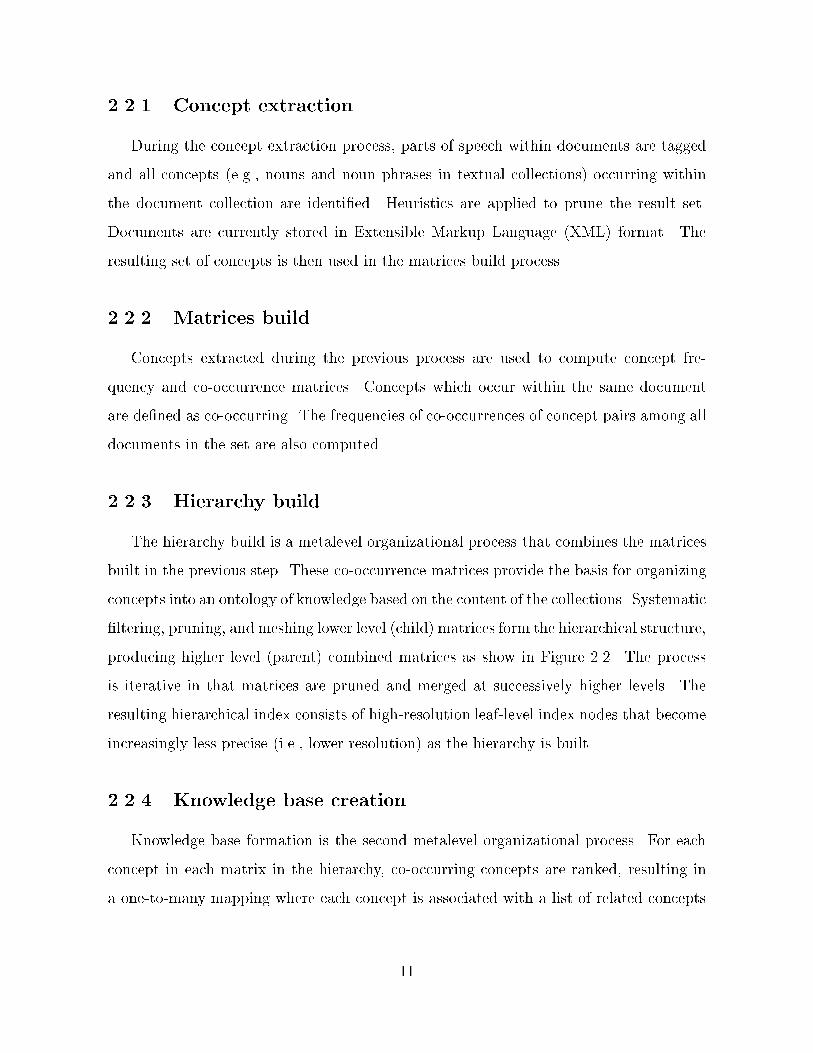
ranked by similarity� More general concepts are given a smaller weight� resulting in a
lower similarity� Co�occurring concepts are ranked in decreasing order of similarity� with
the result that more general concepts occur lower in the list of co�occurring concepts�
Each concept pair �concept to ranked concept is weighted� creating asymmetric measures
of pairwise similarity between concepts ���� ���� The knowledge base can be visualized
as a graph� illustrated in Fig� ���� where vertices represent concepts and edges represent
the pairwise similarity between two concepts�
Figure ��� Knowledge base
��
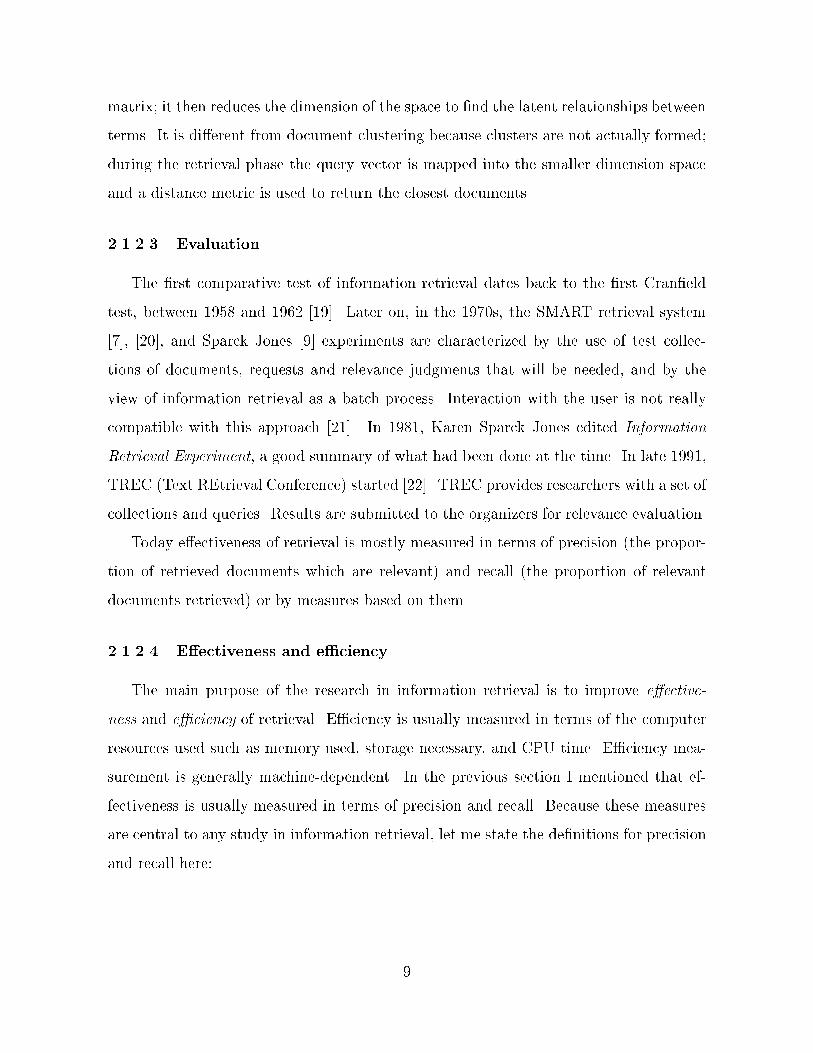
����� Semantic locality detection
The resulting weight assignments from knowledge base creation are context�sensitive�
and are used to determine regions of semantic locality �i�e�� conceptual density within
each node of the hierarchy� During this phase focussed clusters of concepts within each
knowledge base are detected� The result is a hierarchy of knowledge bases composed of
regions of high�density clusters of concepts � subtopic regions� if you will� In simple terms�
these regions consist of clusters of concepts commonly used together that collectively
create a knowledge neighborhood� Regions of semantic locality are illustrated in Figure ����
each region is bounded by a dotted line�
Chapter � describes sLoc� the algorithm we designed and implemented to �nd regions
of semantic locality� The resulting set of regions is called a knowledge neighborhood�
Figure ��� Regions of semantic locality in a knowledge base
����� Hierarchy mapping
The �nal process is to create a mapping of the information space by developing link�
ages between the clusters identi�ed during semantic locality detection� These mappings
provide the necessary links� or paths� between information areas at the higher level of
the hierarchy and the lower levels of the hierarchy� Map linkages are based on computed
density and probability of query match at each node level� This process de�nes relation�
��
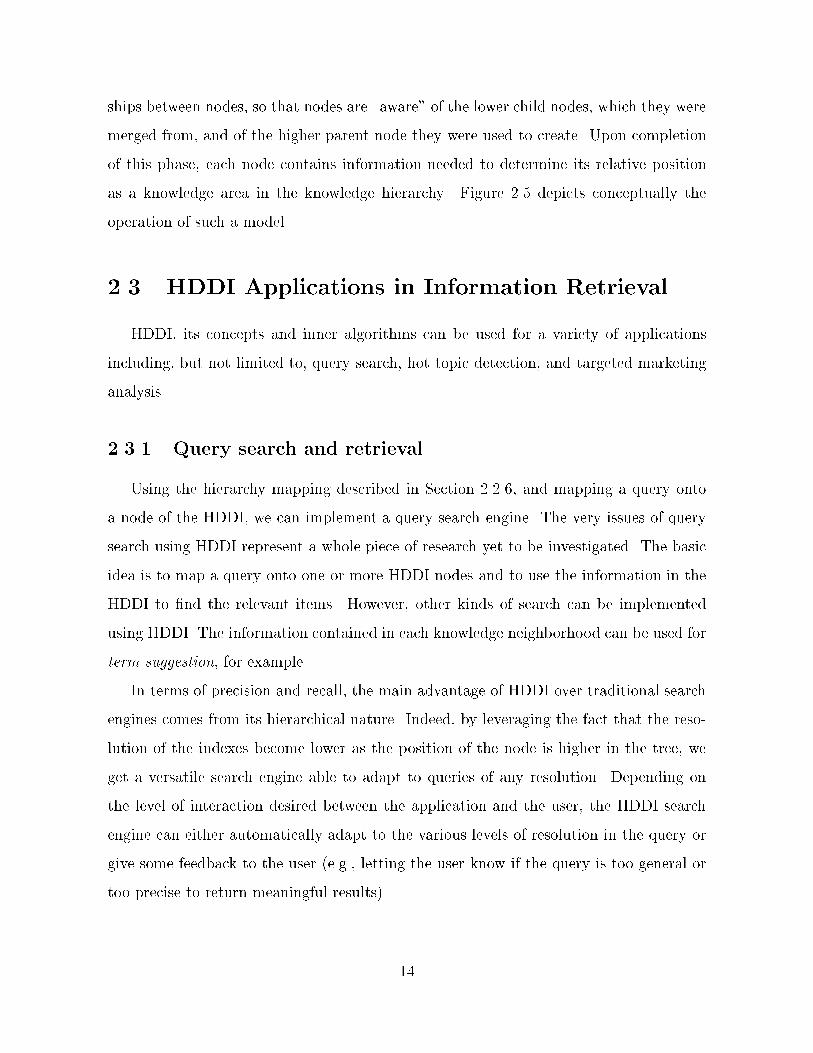
ships between nodes� so that nodes are �aware� of the lower child nodes� which they were
merged from� and of the higher parent node they were used to create� Upon completion
of this phase� each node contains information needed to determine its relative position
as a knowledge area in the knowledge hierarchy� Figure ��� depicts conceptually the
operation of such a model�
��� HDDI Applications in Information Retrieval
HDDI� its concepts and inner algorithms can be used for a variety of applications
including� but not limited to� query search� hot topic detection� and targeted marketing
analysis�
����� Query search and retrieval
Using the hierarchy mapping described in Section ���� � and mapping a query onto
a node of the HDDI� we can implement a query search engine� The very issues of query
search using HDDI represent a whole piece of research yet to be investigated� The basic
idea is to map a query onto one or more HDDI nodes and to use the information in the
HDDI to �nd the relevant items� However� other kinds of search can be implemented
using HDDI� The information contained in each knowledge neighborhood can be used for
term suggestion� for example�
In terms of precision and recall� the main advantage of HDDI over traditional search
engines comes from its hierarchical nature� Indeed� by leveraging the fact that the reso�
lution of the indexes become lower as the position of the node is higher in the tree� we
get a versatile search engine able to adapt to queries of any resolution� Depending on
the level of interaction desired between the application and the user� the HDDI search
engine can either automatically adapt to the various levels of resolution in the query or
give some feedback to the user �e�g�� letting the user know if the query is too general or
too precise to return meaningful results�
��
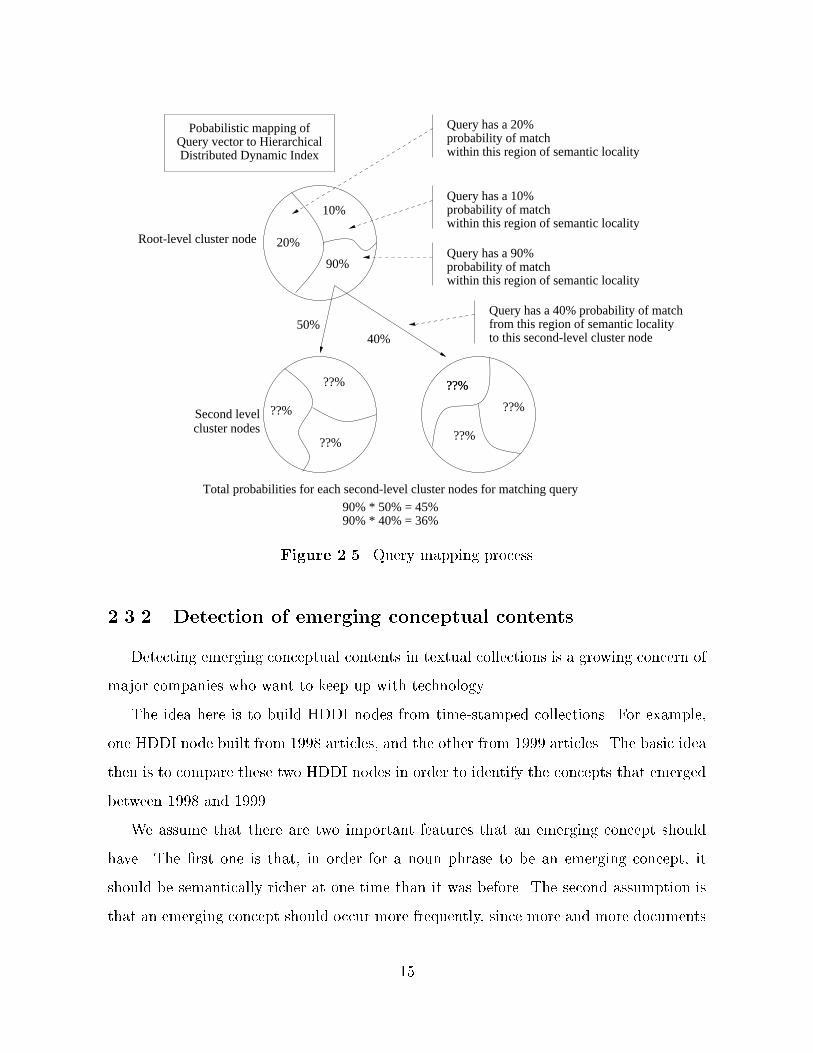
Query has a 20%probability of matchwithin this region of semantic locality
Pobabilistic mapping ofQuery vector to HierarchicalDistributed Dynamic Index
Root-level cluster node 20%
10%
90%
??%
probability of matchwithin this region of semantic locality
Query has a 10%
Query has a 90%probability of matchwithin this region of semantic locality
50%40%
Query has a 40% probability of matchfrom this region of semantic localityto this second-level cluster node
Total probabilities for each second-level cluster nodes for matching query90% * 50% = 45%90% * 40% = 36%
Second levelcluster nodes
??%
??%
??%??%
??%
??%
Figure ��� Query mapping process
����� Detection of emerging conceptual contents
Detecting emerging conceptual contents in textual collections is a growing concern of
major companies who want to keep up with technology�
The idea here is to build HDDI nodes from time�stamped collections� For example�
one HDDI node built from ���� articles� and the other from ���� articles� The basic idea
then is to compare these two HDDI nodes in order to identify the concepts that emerged
between ���� and �����
We assume that there are two important features that an emerging concept should
have� The �rst one is that� in order for a noun phrase to be an emerging concept� it
should be semantically richer at one time than it was before� The second assumption is
that an emerging concept should occur more frequently� since more and more documents
��
will reference it� The semantic richness of a noun phrase can be approximated by the
number of other noun phrases that are in the same region of semantic locality�
We further assume that� to be an emerging concept� the number of occurrences of a
particular noun phrase should exhibit an accelerating occurrence in a large corpus� Also�
the number of occurrences cannot be too high� otherwise� it might be a redundant noun
phrase�
Combining all these assumptions� we conclude that if we have a statistically signi�cant
sample of documents� by using these two indexes �size of cluster� occurrences we will be
able to identify emerging concepts�
����� Targeted marketing analysis
A targeted marketing analysis study is being carried out at NCSA� using the HDDI
technology to predict which web pages or content will be of interest to a particular user�
This can be used in many applications� for human�computer interaction to display a
personalized set of links that �t the user�s pro�le� for advertisement� for optimization of
the back�end resources �servers and network loads can be balanced when we know the
groups of pages that are systematically visited together�
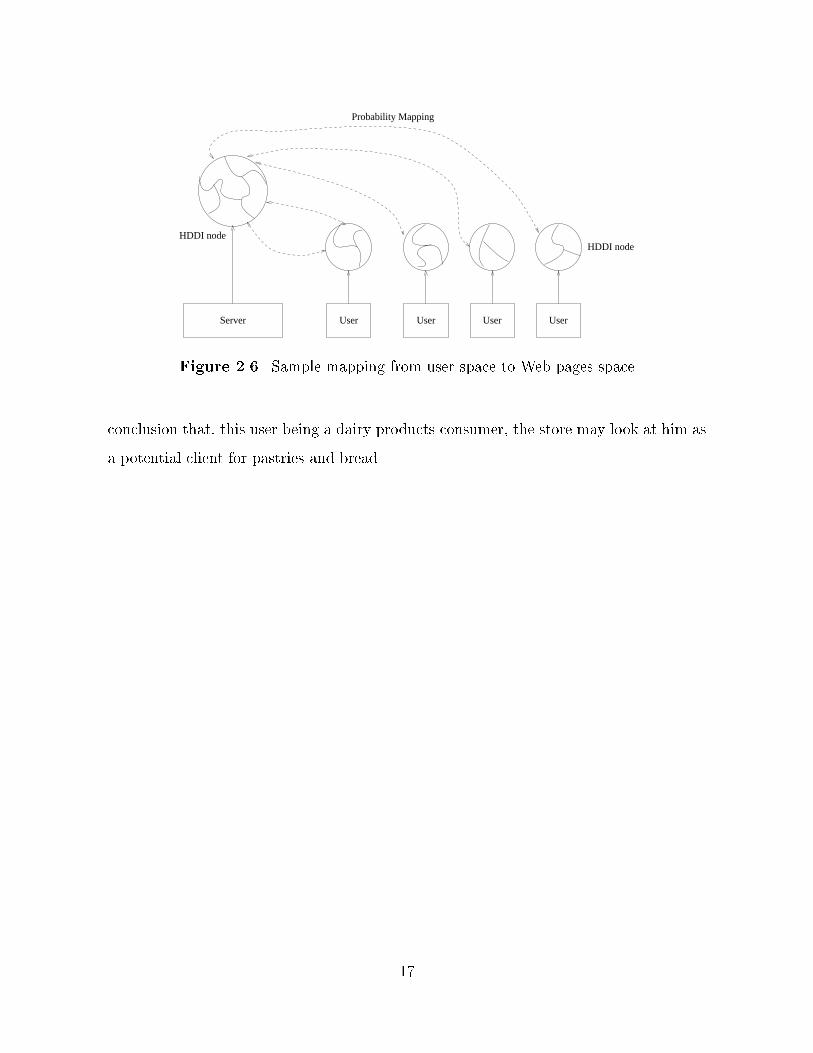
The implementation uses server logs over a certain period termed the critical period�
These logs are used as input collections for HDDI� as shown Figure �� � an HDDI node
is built and a knowledge neighborhood is determined for the server� At the same time�
one HDDI node is built for each user� using the information known about the particular
user� Each of these user HDDI nodes has a knowledge neighborhood that can be mapped
to the knowledge neighborhood of the server�
One particular application of this is market basket analysis� An HDDI node can be
built to represent all the products a given user has purchased� The knowledge neighbor�
hood may then identify dairy products as a region of semantic locality� On the server
side� dairy products may be included with bread and pastries in one single region of
the knowledge neighborhood� Mapping the two regions one to the other can lead to the
�
User User User UserServer
HDDI nodeHDDI node
Probability Mapping
Figure ��� Sample mapping from user space to Web pages space
conclusion that� this user being a dairy products consumer� the store may look at him as
a potential client for pastries and bread�
��
CHAPTER �
SEMANTIC LOCALITY
INDENTIFICATION
In order to build and search an HDDI� we want to identify the regions of semantic
locality in the knowledge base at each node�
This chapter describes sLoc� the algorithm we designed and implemented to �nd
regions of semantic locality� In other words� the purpose of sLoc is to derive the knowledge
neighborhood �set of regions of semantic locality from a knowledge base�
Remember that a knowledge base is created at each level of the hierarchy� A knowl�
edge base is a graph representing the concepts �noun phrases in the HDDI node linked
with arcs of which the weights represent the similarities between concepts� The result�
ing weight assignments from knowledge base creation are context�sensitive� and are used
to determine regions of semantic locality �i�e�� conceptual density within each node of
the hierarchy� During this phase focussed clusters of concepts within each knowledge
base are detected� The result is a hierarchy of knowledge bases composed of regions of
high�density clusters of concepts � subtopic regions� if you will� In simple terms� these
regions consist of clusters of concepts commonly used together that collectively create a
knowledge neighborhood�
The motivation for the use of semantic locality comes from the commonly used premise
that grouping similar concepts leads to increased eectiveness and e�ciency in particular
in query search and retrieval �see Sparck Jones ���� Also� in the perspective of the HDDI
hierarchy� semantic locality enables tracking of similar topics across the hierarchy�
��
I will �rst give a brief overview of how people have been addressing information
clustering traditionally� then I will explain the algorithm and de�ne a set of measures to
assess its performance� Finally� I will illustrate its use with sample cases�
��� Previous Work
In this section I will review the traditional clustering methods used in information
retrieval� their purpose� advantages and drawbacks� I will then present other algorithms
used in graph partitioning and see why these were not applicable for the particular case
sLoc addresses� We might want to note here that classi�cation and clustering do not
usually refer to the same thing� Classi�cation tends to consider classes that are either
given or computed at the beginning� and tries to classify new objects into these existing
classes� Clustering is generally thought of as a dynamic process that creates and modi�es
the classes with respect to the objects it wants to classify� Clustering and classi�cation
will however be used synonymously in this thesis�
����� The use of clustering in information retrieval
In information retrieval the two most used classi�cation schemes are� term classi��
cation and document classi�cation� Notice that Sparck Jones�s keyword classi�cation����
or HDDI�s concept classi�cation refer to the same idea� clustering terms rather than
documents� Following Salton�s description in ����
Term classication is designed to group terms into �synonym classes in the hope of
producing greater matching capacities between queries and document terms�
Document classication groups documents together to improve recall� but also to
increase the response time of the retrieval system�
The two classi�cations are not independent because the terms assigned to the docu�
ments must necessarily form the basis for the classes produced by a document grouping
procedure�
��
Term classi�cation groups related low�frequency terms into common thesaurus classes
�clusters� or regions of semantic locality� The terms included in a common class can
then be substituted for each other in retrieval� and the recall output produced may be
improved that way�
Document classi�cations make it possible to restrict the searches to the most inter�
esting document classes only� thereby providing high�precision output ����
������� The cluster hypothesis
Any sort of clustering in information retrieval �document� or keyword clustering
is based on the assumption that closely associated documents �respectively keywords�
or concepts in the HDDI terminology� tend to be relevant to the same request� Van
Rijsbergen ��� refers to this assumption as the cluster hypothesis�
������� Criteria of a good clustering
The �rst property we expect from a clustering method is that it provides a set of
clusters that actually �t the constraints and requirements of our application semantics�
However� the method needs additional properties in order to scale to any kind of input
set� Jardine and Sibson �� � stated the major requirements of a good clustering method�
�� The classi�cation should be de�ned such that a given result is obtained for any
given body of data�
�� The classi�cation should be independent of scale because a multiplication by a
constant of the property values identifying the objects should not aect the classi�
�cation�
�� Small errors in the description of the objects must not lead to big changes in the
clustering�
�� The method must be independent of the initial ordering of the objects�
��
�� Objects exhibiting strong similarities should not be split by being assigned to sep�
arate classes�
We argue that although true in the �� �s� these requirements may have to be reviewed
in the context of the ����s where the amount of data increases on a daily basis� The fact
that the amount of data increases every day invalidates the need for the classi�cation
to be independent of scale� we rather want the classi�cation to adapt to the scale� that
is to create new classes or delete some to work best with the actual size of the current
collection�
At the same time� another essential criterion in the assessment of a clustering method
is the e�ciency achieved by the algorithm� As stated in Section �������� e�ciency is
usually measured in terms of the computer resources used such as memory and storage
requirements and CPU time�
Over the past �� years� various methods have been used to achieve good e�ciency and
eectiveness� In ����� Van Rijsbergen identi�ed two major approaches ��� to information
clustering� they are still good starting points for research in IR today�
�� The clustering is based on a measure of similarity between the objects to be clus�
tered�
�� The cluster method proceeds directly from the object descriptions�
������� First approach Methods based on similarities
Dierent considerations come into play when designing and assessing a clustering
system for information retrieval� For example� one may want to strive for e�ciency of
the clustering process by de�ning the best split as the one produced at least cost in terms
of memory size used� running time or number of operations used�
One may also wish to optimize some classi�cation criterion� such as the cohesiveness
between clusters� or the strength of the association between items included in a single
class� or the corresponding weakness between items in dierent classes ���� ���� Quoting
��
���� let us consider class A of items� and let B represent the items not in A� A class may
then be de�ned as the set A which minimizes the cohesion function
C �S�AB
SAA � SAB����
where Sij denotes the similarity between items i and j�
SAB can be de�ned as the average of all the pairwise similarities for the NA terms in
A and the NB terms in B� that is
SAB ��
NANB
Xi�A
Xj�B
Sij ����
Other parameters can also characterize a classi�cation process� Besides cost and
cohesion� the resulting clusters can be forced to have a given structure� One common
approach is to use the similarity measures between objects to cluster the graph� Let us
consider a set of objects we want to cluster� We �rst compute numerical values of each
pair of objects indicating their similarity� Notice that this similarity measure is usually
symmetric �similarity from a to b is the same as similarity from b to a� However HDDI
is based on asymmetric similarities �����
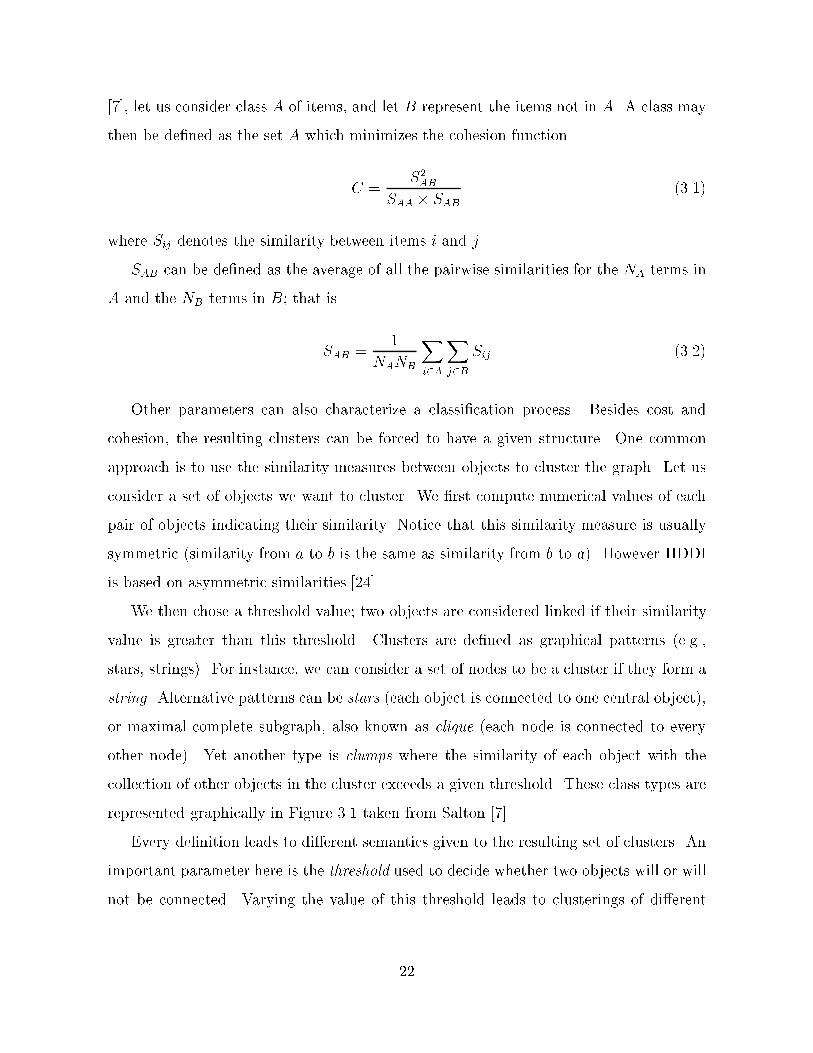
We then chose a threshold value� two objects are considered linked if their similarity
value is greater than this threshold� Clusters are de�ned as graphical patterns �e�g��
stars� strings� For instance� we can consider a set of nodes to be a cluster if they form a
string� Alternative patterns can be stars �each object is connected to one central object�
or maximal complete subgraph� also known as clique �each node is connected to every
other node� Yet another type is clumps where the similarity of each object with the
collection of other objects in the cluster exceeds a given threshold� These class types are
represented graphically in Figure ��� taken from Salton ����
Every de�nition leads to dierent semantics given to the resulting set of clusters� An
important parameter here is the threshold used to decide whether two objects will or will
not be connected� Varying the value of this threshold leads to clusterings of dierent
��
A B C D
A
A
AB
B
BC
C
C
D
D
DE
FG
E
E
F
(a)
(b)
(c) (d)
Figure ��� Typical class types� �a string� �b star� �c clique� �d clump
resolutions� i�e�� clusterings where the size of a cluster including a given object will vary
with the threshold value� A hierarchy can thus be created� The most important of these
hierarchic methods is single�link ����
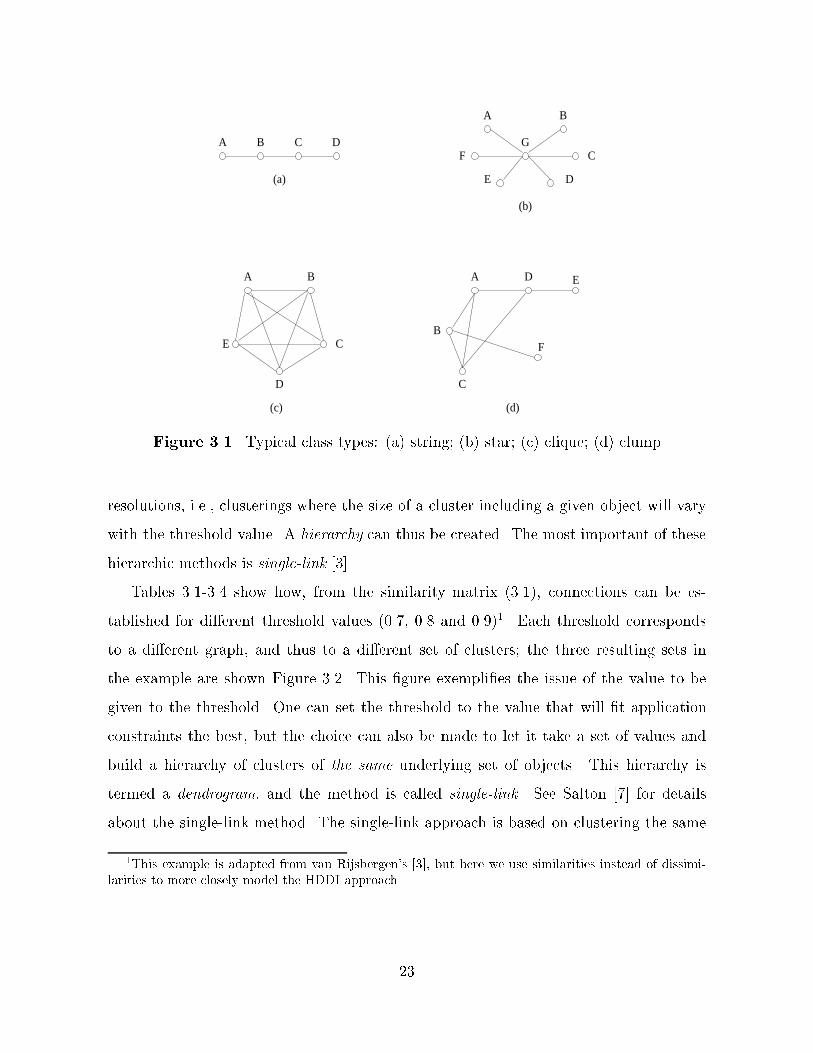
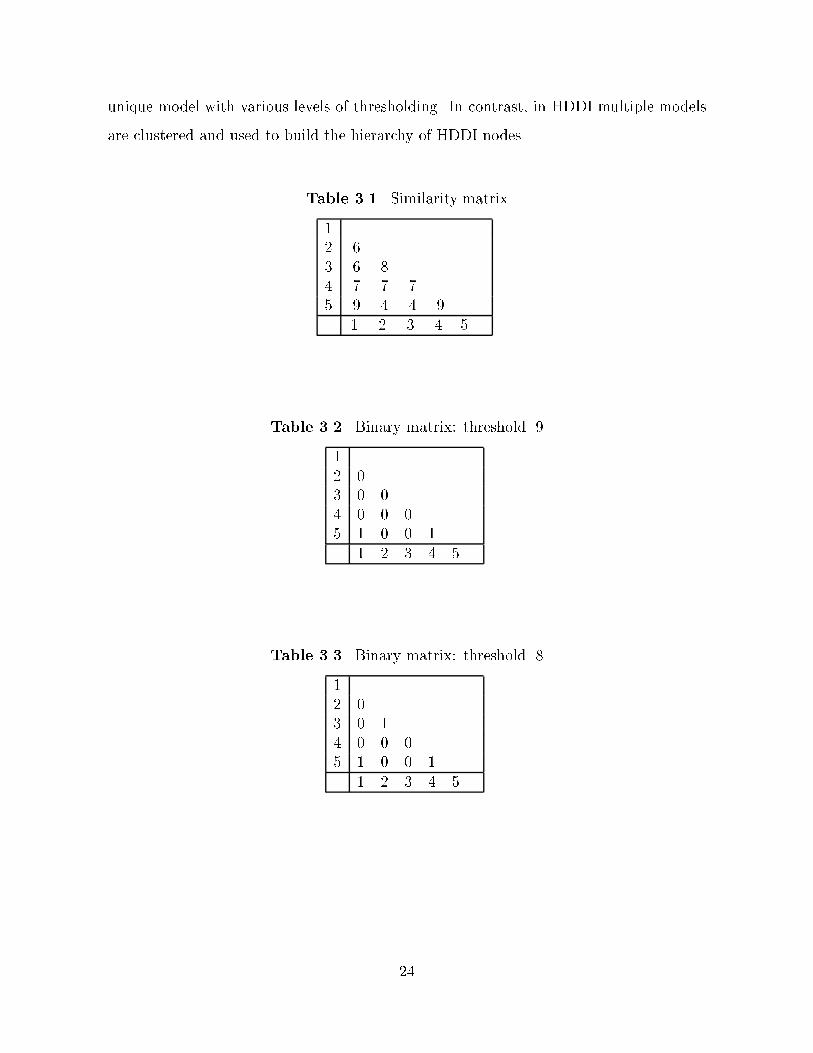
Tables ������� show how� from the similarity matrix ����� connections can be es�
tablished for dierent threshold values ����� ��� and ����� Each threshold corresponds
to a dierent graph� and thus to a dierent set of clusters� the three resulting sets in
the example are shown Figure ���� This �gure exempli�es the issue of the value to be
given to the threshold� One can set the threshold to the value that will �t application
constraints the best� but the choice can also be made to let it take a set of values and
build a hierarchy of clusters of the same underlying set of objects� This hierarchy is
termed a dendrogram� and the method is called single�link� See Salton ��� for details
about the single�link method� The single�link approach is based on clustering the same
�This example is adapted from van Rijsbergen�s �� but here we use similarities instead of dissimi�larities to more closely model the HDDI approach�
��
unique model with various levels of thresholding� In contrast� in HDDI multiple models
are clustered and used to build the hierarchy of HDDI nodes�
Table ��� Similarity matrix
�� � � � ��� �� �� ��� �� �� �� ��
� � � � �
Table ��� Binary matrix� threshold ��
�� �� � �� � � �� � � � �
� � � � �
Table ��� Binary matrix� threshold ��
�� �� � �� � � �� � � � �
� � � � �
��
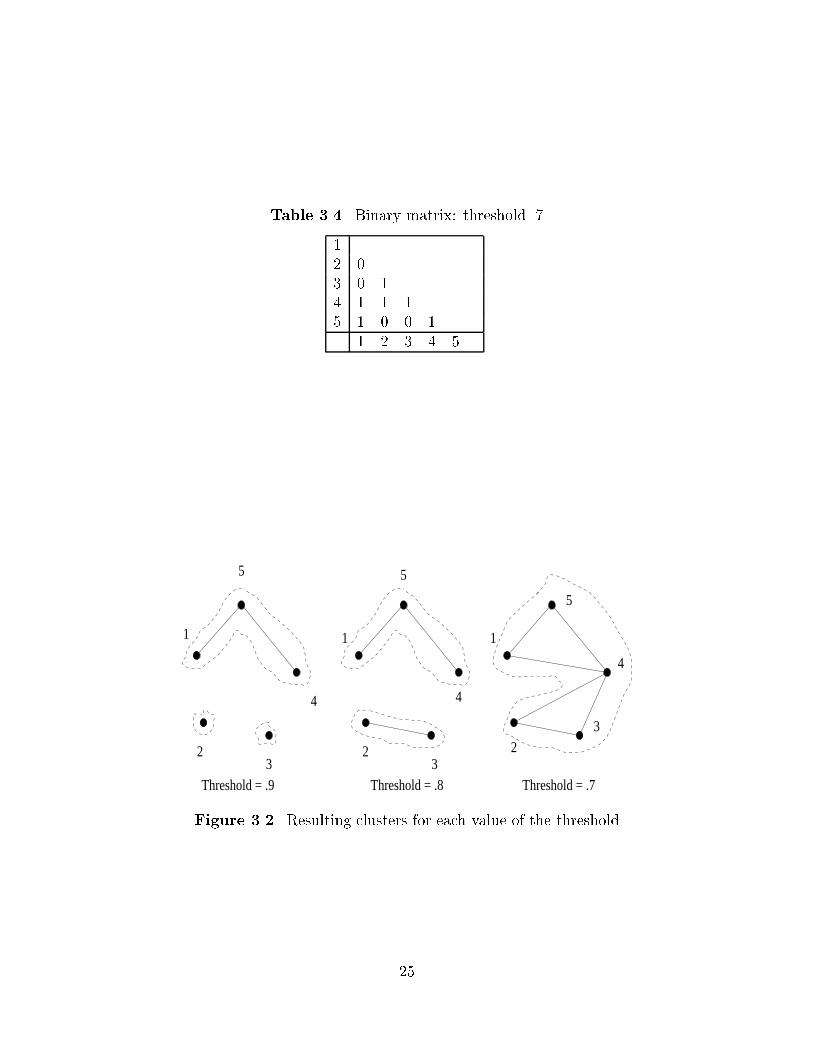
Table ��� Binary matrix� threshold ��
�� �� � �� � � �� � � � �
� � � � �
Threshold = .9 Threshold = .8 Threshold = .7
1 1 1
2 2 23 3
3
4 4
4
5 5
5
Figure ��� Resulting clusters for each value of the threshold
��
������� Second approach Using object descriptions directly
Using the combination of class types� cohesion functions and dendrograms can then
lead to good theoretical clustering� However� due to limited computing power� e�ciency
has been a major goal in the de�nition of the algorithmically de�ned cluster methods
used in IR� in particular in document clustering� For this reason� many methods have
preferred to proceed directly from object description to �nal classi�cation without the
expensive intermediate calculation of a similarity measure� The basic idea here is to
perform a cheap density test to identify potential cluster centers and then cluster around
these selected items ����� Another characteristic of these methods is that they do not
seek an underlying structure in the data but attempt to impose a suitable structure on
it��
In this section� following van Rijsbergen� I will give an overview of these methods�
I will not describe in detail the heuristic algorithms here since they mainly apply to
document clustering� but I want to outline the major ideas because they can still be
applied to concepts clustering�
The most important concept is that of cluster representative� It is simply an object
that summarizes and represents the contents of a cluster� The ideal cluster representative
should be near every object in the cluster in some average sense� hence� the alternative
name centroid for cluster representative� The similarity of the objects to the representa�
tive is measured by a matching function� The algorithms also use a number of empirically
determined parameters� such as ���
�� the number of clusters desired�
�� a minimum and maximum size for each cluster�
�� a threshold value on the matching function� below which an object will not be
included in a cluster�
�� the control of overlap between clusters�
�We will see in Section � how sLoc� through macrometrics can take a similar standpoint�
�
�� an arbitrarily chosen objective function which is optimized�
Following are the main three stages from ���
�� Select a number of objects as cluster centers� The remaining objects are then as�
signed to the centers or to a special cluster for outliers� From the initial assignment
the cluster representatives are computed and all objects are assigned to the clusters
once again� The �nal clusters might overlap�
�� Iteratively change the clusters to allow the various input parameters to be adjusted
so that the resulting classi�cation meets the prior speci�cation of the parameters
more closely�
�� Unassigned objects are forcibly assigned� and overlap between clusters is reduced�
A good example of this kind of algorithm is Rocchio�s ���� clustering algorithm�
����� Existing algorithms in graph partitioning
In our eort to �nd an algorithm for clustering knowledge bases� we also wanted
to consider alternative approaches to classical IR clustering algorithms� In one sense�
clustering a knowledge base can be cast as a graph partitioning problem� we therefore
looked at the dierent problems that current graph partitioning techniques can help to
solve� and evaluated the use of these techniques in HDDI�
Graph partitioning is an NP�hard problem� with numerous applications� It appears
in various forms in parallel computing� sparse matrix reordering� circuit placement and
other important disciplines� Several advanced software solutions are available from the
internet� The most well�known are Chaco ���� and Metis �����
Traditional graph partitioning algorithms compute a k�way partitioning of a graph
such that the number of edges that are cut by the partitioning is minimized and each
partition has an equal number of vertices� The task of minimizing the edge�cut can be
�NP stands for nondeterministic polynomial time�
��
considered as the objective and the requirement that the partitions be of the same size
can be considered as the constraint�
Much of the current research in graph partitioning �nds its application in parallel
computing and load balancing� Therefore� the focus is mostly on getting a �xed number
of clusters �that may correspond to the number of processors for example and an equal
number of vertices� in a nonoriented graph�
Another area of research where clustering is extensively used is image processing�
The image processing research community has developed several linear or near linear
algorithms for texture segmentation� While these algorithms have some disadvantages
relative to clustering� they may allow signi�cant improvements in visualizing some very
large spatial data sets� such as detailed atmospheric data or SAR images �����
Natural language processing� information systems modeling� program speci�cation�
information retrieval� machine learning and case�based reasoning sometimes use yet an�
other kind of clustering method based on conceptual structures� Conceptual structures
are a kind of knowledge representation developed by John Sowa in ����� They are a
graphical notation for typed �rst�order logic� Using these conceptual structures Mineau
and Godin designed a conceptual clustering algorithm for knowledge bases �����
In graph drawing disciplines the issue of visualizing large and complex graphs has also
been addressed through clustering strategies� In ���� Sablowski and Frick demonstrate
a new approach to clustering large graphs� They identify successive structural elements
�patterns� in the graph� About the simplest pattern occurring in a graph are leaves� i�e��
nodes with in�degree � and out�degree �� Other patterns they use include paths �nodes
with in�degree � out�degree � �� triangles and similar simple structures�
Hinrich Sch�utze uses clustering for context�group dscrimination and disambiguation
in computational linguistics ����� In this study� similarity in word space is based on
second order co�occurrence� Quoting Sch�utze�
Words� contexts and clusters are represented in a high�dimensional real�valued
vector space� Context vectors capture the information present in second�
order co�occurrence� Instead of forming a context representation from the
��
words that the ambiguous word directly occurs with in a particular context
��rst�order co�occurrence� we form the context representation from the words
that these words in turn co�occur with in the training corpus� Second�order
co�occurrence information is less sparse and more robust than �rst�order in�
formation�
This tells us that� depending on the context� allowing some transitivity in the similarity
relation can improve the results of clustering based on similarity measures�
In data mining applications� Han� Karypis and Kumar ���� propose a clustering
method based on hypergraphs that is expected to handle large input data sets better
than the traditional k�means ���� or Autoclass �� �� The idea of the hypergraph model is
to map the relationship of the original data in high dimensional space into a hypergraph�
The hypergraph model is therefore based on the concept of a hyperedge� Quoting Kumar
et al� �����
A hyperedge represents a relationship �a�nity among subsets of data and the
weight of the hyperedge re�ects the strength of this a�nity� A hypergraph
partitioning algorithm is used to �nd a partitioning of the vertices such that
the corresponding data items in each partition are highly related and the
weight of the hyperedges cut by the partitioning is minimized�
This study used a number of partitions that was set a priori� and a dierent measure of
similarity� which do not �t our requirements for sLoc� However ���� does introduce �tness
and connectivity measures� which are akin to metrics used in sLoc �see Section ������� for
a detailed comparison of these approaches�
In the �nal analysis we determined that none of the available algorithms were suitable
for our application� Thus� the decision was made to base development on an existing
linear graph partitioning algorithm that could be readily adapted to our needs �����
��
����� Test collections
In the following chapters we will use various test collections to illustrate or validate
our approach� Let me introduce them brie�y here�
� Patterns ��� is a collection of ��� postings to a discussion list about computer
software systems�
� MED� CISI and ADI are three collections of respectively ����� ��� and �� ab�
stracts� MED is a sample from MEDLINE� the National Library of Medicine�s
database of references to articles published in biomedical journals� The CISI and
ADI collections both contain information science documents�
� The Grainger collection contains � ��� abstracts from the Grainger Engineering
Library at University of Illinois�
��� The Semantic Locality Finder� sLoc
In this section we discuss the details of the algorithm� system design and implemen�
tation of the Semantic Locality Finder �sLoc�
The function of sLoc is to identify regions of semantic locality� For now� we can
qualitatively characterize a region of semantic locality as follows�
� Concepts inside a region of semantic locality are similar to each other�
� Concepts belonging to dierent regions of semantic locality are dissimilar�
Similarity between concepts is de�ned quantitatively in ���� ���� It is a mapping from
one concept to another that quantitatively determines how similar they are semantically�
We term the resultant mapping a knowledge base�� A knowledge base is represented as
an asymmetric directed graph in which nodes are concepts and arc weights are similarity
measures� Determining regions of semantic locality in such a graph involves clustering
�Note that follow�on work by Chen �of � �� terms this a concept space�
��
or splitting the input knowledge base into a set of subtopic regions � smaller knowledge
bases� if you will� These subtopic regions are regions of semantic locality or conceptual
density� The number of concepts in each region of semantic locality may vary and the
total number of regions is determined dynamically by sLoc� sLoc processes a knowledge
base and outputs a knowledge neighborhood that consists of multiple regions of semantic
locality�
����� Contextual transitivity in sLoc
The similarity relation is by de�nition not transitive� The theoretical basis for sLoc is
the concept of what I call contextual transitivity in the similarity relation� In essence� this
means that depending on the context �structure and distribution of the similarities in the
knowledge base� a threshold is decided upon and transitivity is constrained accordingly�
Contextual transitivity extends Sch�utze�s conceptualization of second order co�occurrence
���� by using n�order co�occurrence� where n varies with the underlying semantic structure
of the model�
In order to group concepts together in a region of semantic locality� sLoc uses con�
textual transitivity� Here is a simple example� Let us consider the three concepts Java�
applet and e�commerce� If the concepts occur in the same document� they are called
co�occurring concepts� Let us assume that Java and applet co�occur and that Java and
e�commerce also co�occur� This means that there is at least one document that contains
both Java and applet� and that there is at least one document that contains both Java
and e�commerce� but applet and e�commerce do not co�occur necessarily� However it
may be natural to gather the three concepts in one unique class and extrapolate that
e�commerce and applet are actually related� That is what contextual transitivity means�
Note that similarity is not a Boolean variable� it can take a whole range of values�
Two concepts can thus be more or less similar� In sLoc considerations on the knowledge
base structure lead to a heuristic minimum similarity value for two concepts to be in the
same cluster� and therefore to constrain transitivity� It is called contextual because this
��
4
6
1
5
2
3
R1
R2R3
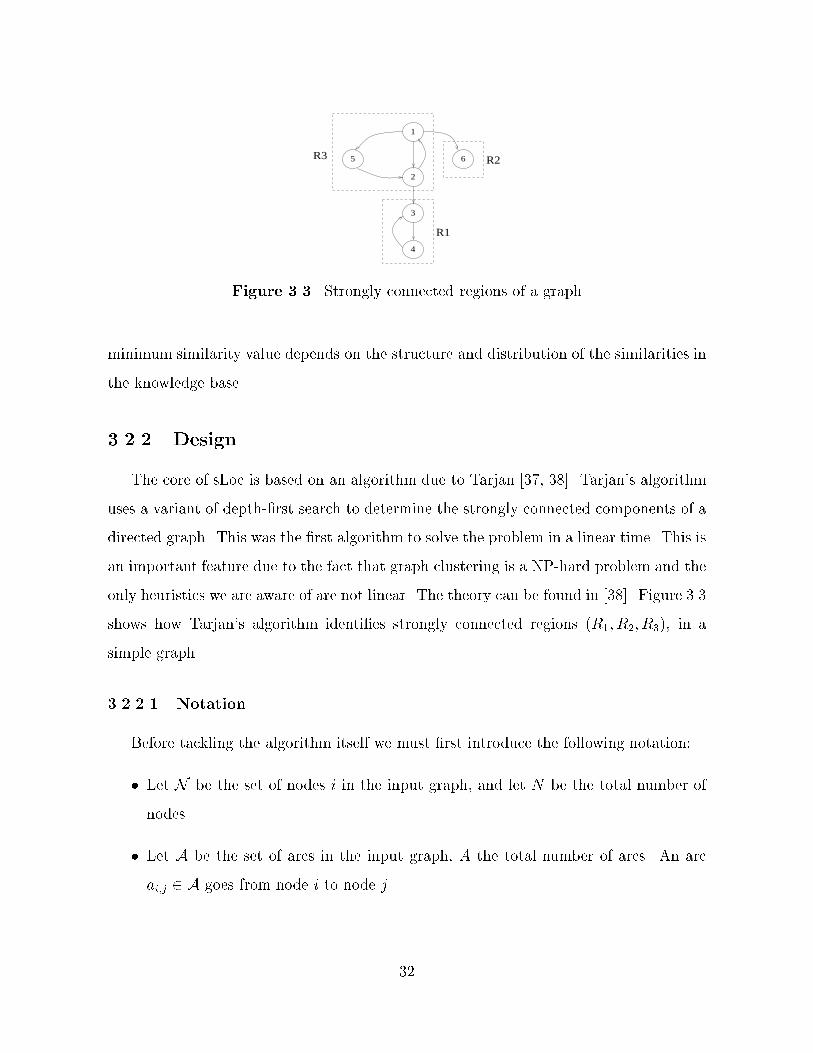
Figure ��� Strongly connected regions of a graph
minimum similarity value depends on the structure and distribution of the similarities in
the knowledge base�
����� Design
The core of sLoc is based on an algorithm due to Tarjan ���� ���� Tarjan�s algorithm
uses a variant of depth��rst search to determine the strongly connected components of a
directed graph� This was the �rst algorithm to solve the problem in a linear time� This is
an important feature due to the fact that graph clustering is a NP�hard problem and the
only heuristics we are aware of are not linear� The theory can be found in ����� Figure ���
shows how Tarjan�s algorithm identi�es strongly connected regions �R�� R�� R�� in a
simple graph�
������� Notation
Before tackling the algorithm itself we must �rst introduce the following notation�
� Let N be the set of nodes i in the input graph� and let N be the total number of
nodes�
� Let A be the set of arcs in the input graph� A the total number of arcs� An arc
ai�j � A goes from node i to node j�
��
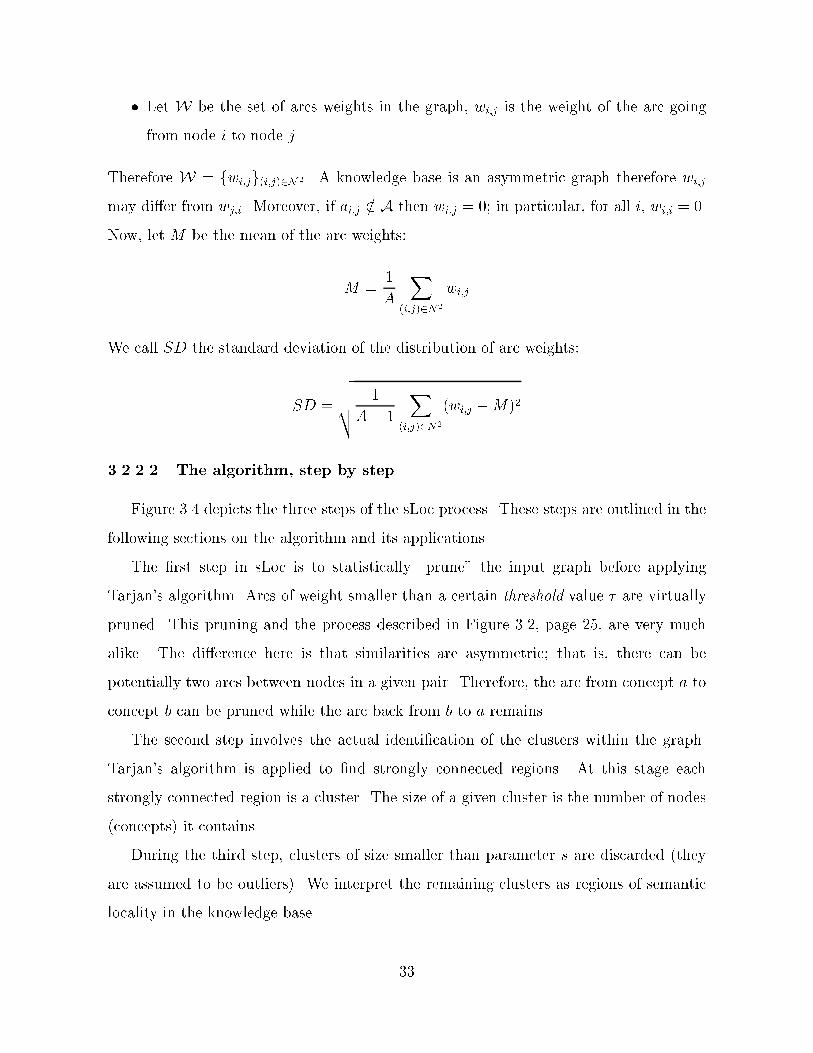
� Let W be the set of arcs weights in the graph� wi�j is the weight of the arc going
from node i to node j�
Therefore W � fwi�jg�i�j��N �� A knowledge base is an asymmetric graph therefore wi�j
may dier from wj�i� Moreover� if ai�j �� A then wi�j � �� in particular� for all i� wi�i � ��
Now� let M be the mean of the arc weights�
M ��
A
X�i�j��N�
wi�j
We call SD the standard deviation of the distribution of arc weights�
SD �
vuut �
A� �
X�i�j��N�
�wi�j �M�
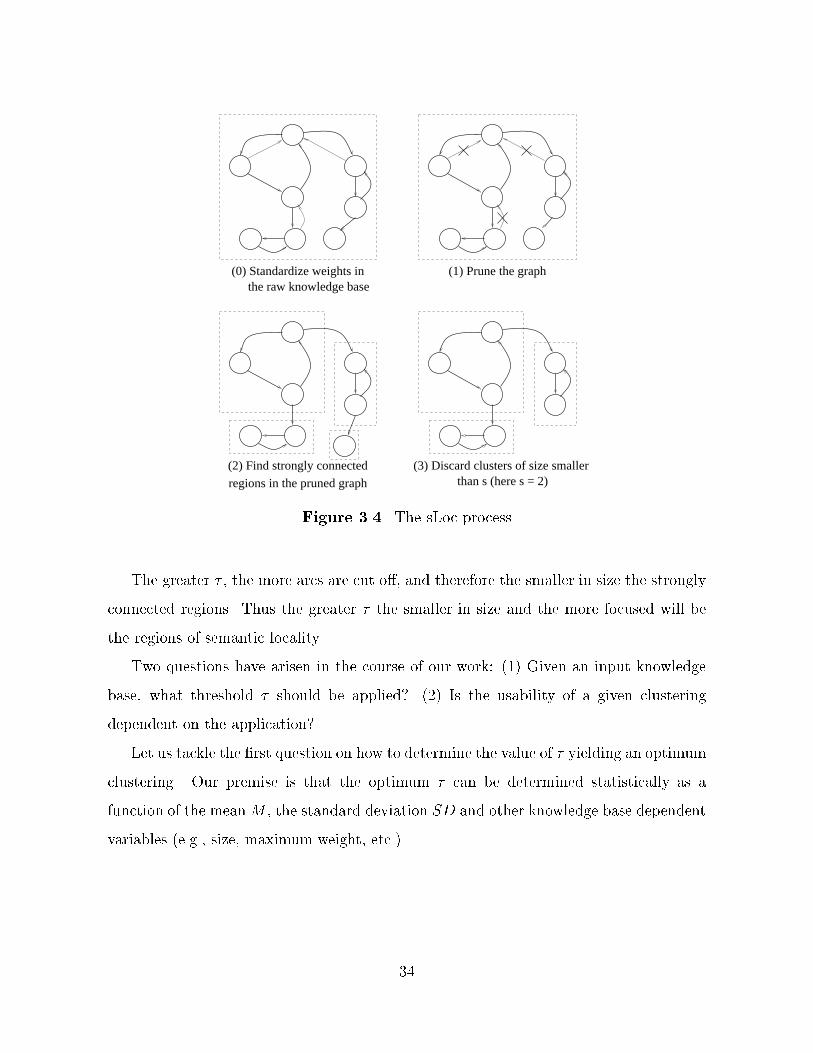
������� The algorithm� step by step
Figure ��� depicts the three steps of the sLoc process� These steps are outlined in the
following sections on the algorithm and its applications�
The �rst step in sLoc is to statistically �prune� the input graph before applying
Tarjan�s algorithm� Arcs of weight smaller than a certain threshold value � are virtually
pruned� This pruning and the process described in Figure ���� page ��� are very much
alike� The dierence here is that similarities are asymmetric� that is� there can be
potentially two arcs between nodes in a given pair� Therefore� the arc from concept a to
concept b can be pruned while the arc back from b to a remains�
The second step involves the actual identi�cation of the clusters within the graph�
Tarjan�s algorithm is applied to �nd strongly connected regions� At this stage each
strongly connected region is a cluster� The size of a given cluster is the number of nodes
�concepts it contains�
During the third step� clusters of size smaller than parameter s are discarded �they
are assumed to be outliers� We interpret the remaining clusters as regions of semantic
locality in the knowledge base�
��
(1) Prune the graph
regions in the pruned graph
(2) Find strongly connected (3) Discard clusters of size smaller than s (here s = 2)
(0) Standardize weights inthe raw knowledge base
Figure ��� The sLoc process
The greater � � the more arcs are cut o� and therefore the smaller in size the strongly
connected regions� Thus the greater � the smaller in size and the more focused will be
the regions of semantic locality�
Two questions have arisen in the course of our work� �� Given an input knowledge
base� what threshold � should be applied �� Is the usability of a given clustering
dependent on the application
Let us tackle the �rst question on how to determine the value of � yielding an optimum
clustering� Our premise is that the optimum � can be determined statistically as a
function of the meanM � the standard deviation SD and other knowledge base dependent
variables �e�g�� size� maximum weight� etc��
��
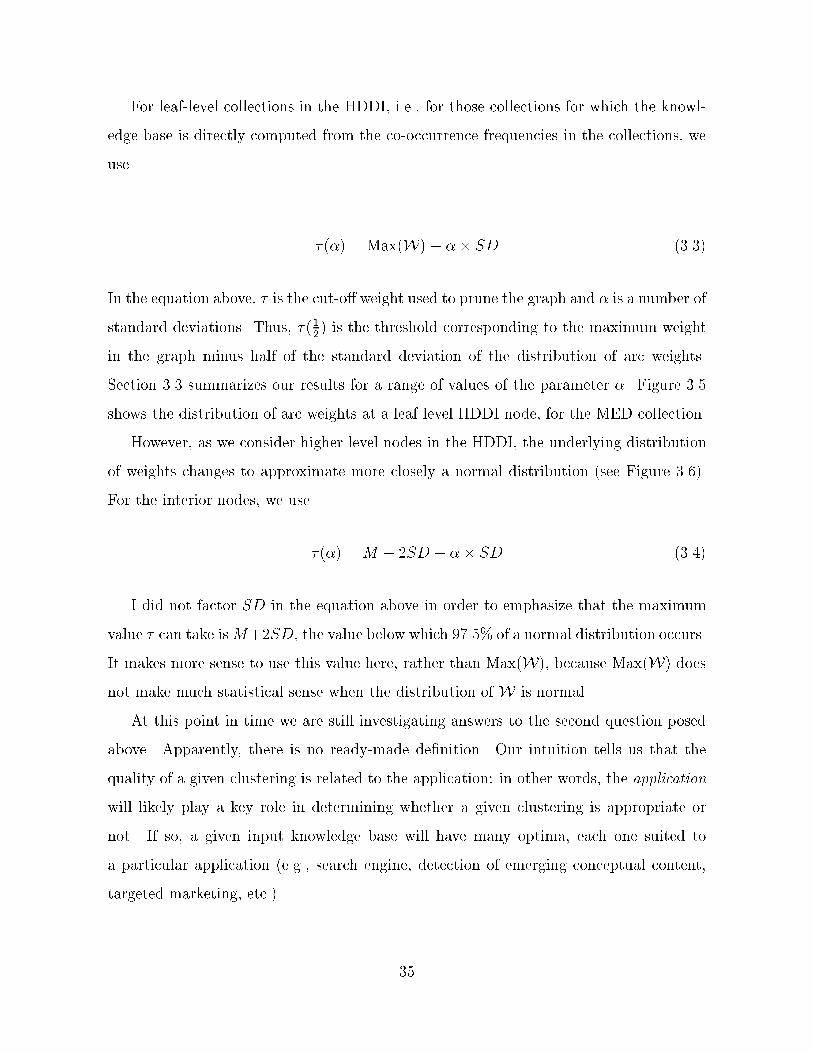
For leaf�level collections in the HDDI� i�e�� for those collections for which the knowl�
edge base is directly computed from the co�occurrence frequencies in the collections� we
use
��� � Max�W� �� SD ����
In the equation above� � is the cut�o weight used to prune the graph and � is a number of
standard deviations� Thus� ���� is the threshold corresponding to the maximum weight
in the graph minus half of the standard deviation of the distribution of arc weights�
Section ��� summarizes our results for a range of values of the parameter �� Figure ���
shows the distribution of arc weights at a leaf�level HDDI node� for the MED collection�
However� as we consider higher level nodes in the HDDI� the underlying distribution
of weights changes to approximate more closely a normal distribution �see Figure �� �
For the interior nodes� we use
��� � M � �SD � �� SD ����
I did not factor SD in the equation above in order to emphasize that the maximum
value � can take isM��SD� the value below which ����! of a normal distribution occurs�
It makes more sense to use this value here� rather than Max�W� because Max�W does
not make much statistical sense when the distribution of W is normal�
At this point in time we are still investigating answers to the second question posed
above� Apparently� there is no ready�made de�nition� Our intuition tells us that the
quality of a given clustering is related to the application� in other words� the application
will likely play a key role in determining whether a given clustering is appropriate or
not� If so� a given input knowledge base will have many optima� each one suited to
a particular application �e�g�� search engine� detection of emerging conceptual content�
targeted marketing� etc��
��
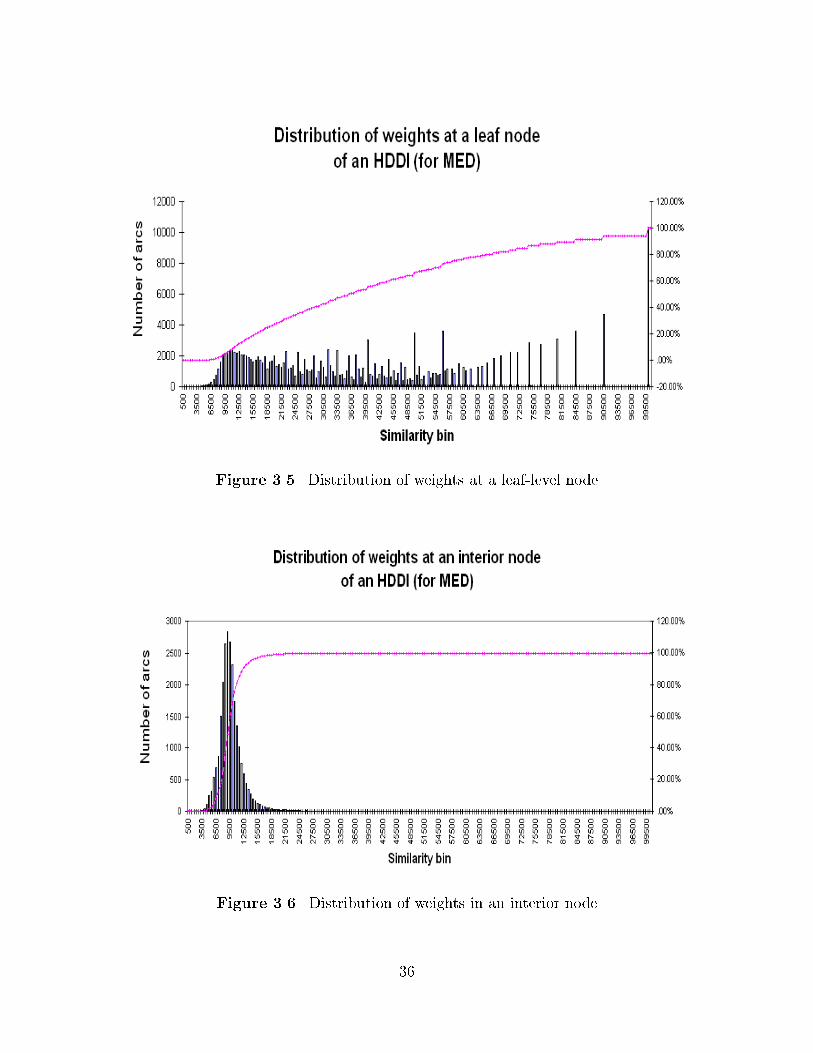
Figure ��� Distribution of weights at a leaf�level node
Figure ��� Distribution of weights in an interior node
�
����� Implementation
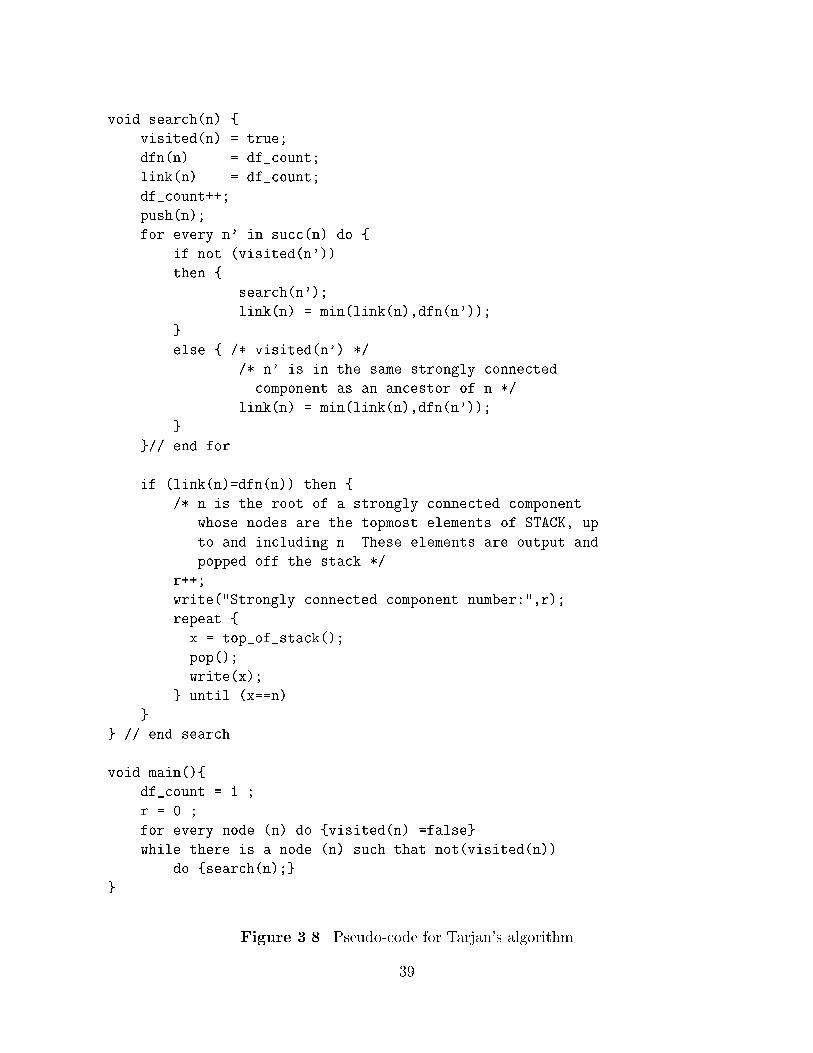
The core of the implementation of sLoc is Tarjan�s algorithm� The following sections
will give its complexity and pseudo�code�
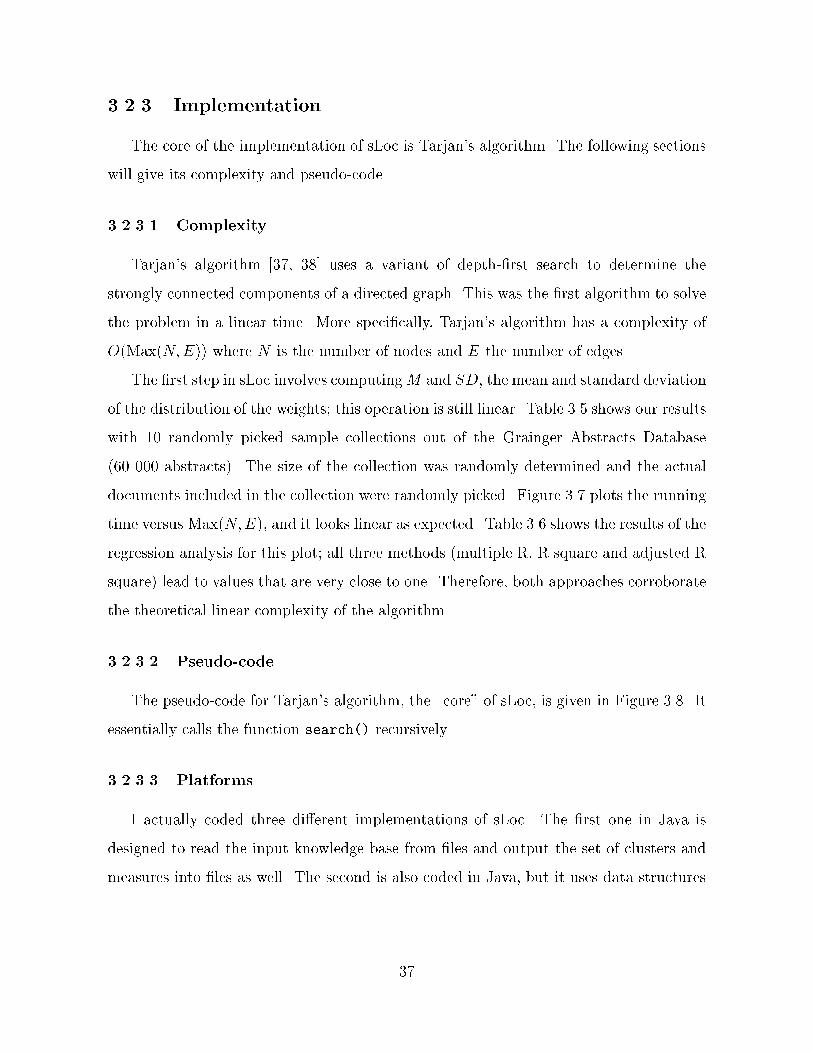
������� Complexity
Tarjan�s algorithm ���� ��� uses a variant of depth��rst search to determine the
strongly connected components of a directed graph� This was the �rst algorithm to solve
the problem in a linear time� More speci�cally� Tarjan�s algorithm has a complexity of
O�Max�N�E where N is the number of nodes and E the number of edges�
The �rst step in sLoc involves computingM and SD� the mean and standard deviation
of the distribution of the weights� this operation is still linear� Table ��� shows our results
with �� randomly picked sample collections out of the Grainger Abstracts Database
� � ��� abstracts� The size of the collection was randomly determined and the actual
documents included in the collection were randomly picked� Figure ��� plots the running
time versus Max�N�E� and it looks linear as expected� Table �� shows the results of the
regression analysis for this plot� all three methods �multiple R� R square and adjusted R
square lead to values that are very close to one� Therefore� both approaches corroborate
the theoretical linear complexity of the algorithm�
������� Pseudo�code
The pseudo�code for Tarjan�s algorithm� the �core� of sLoc� is given in Figure ���� It
essentially calls the function search�� recursively�
������� Platforms
I actually coded three dierent implementations of sLoc� The �rst one in Java is
designed to read the input knowledge base from �les and output the set of clusters and
measures into �les as well� The second is also coded in Java� but it uses data structures
��
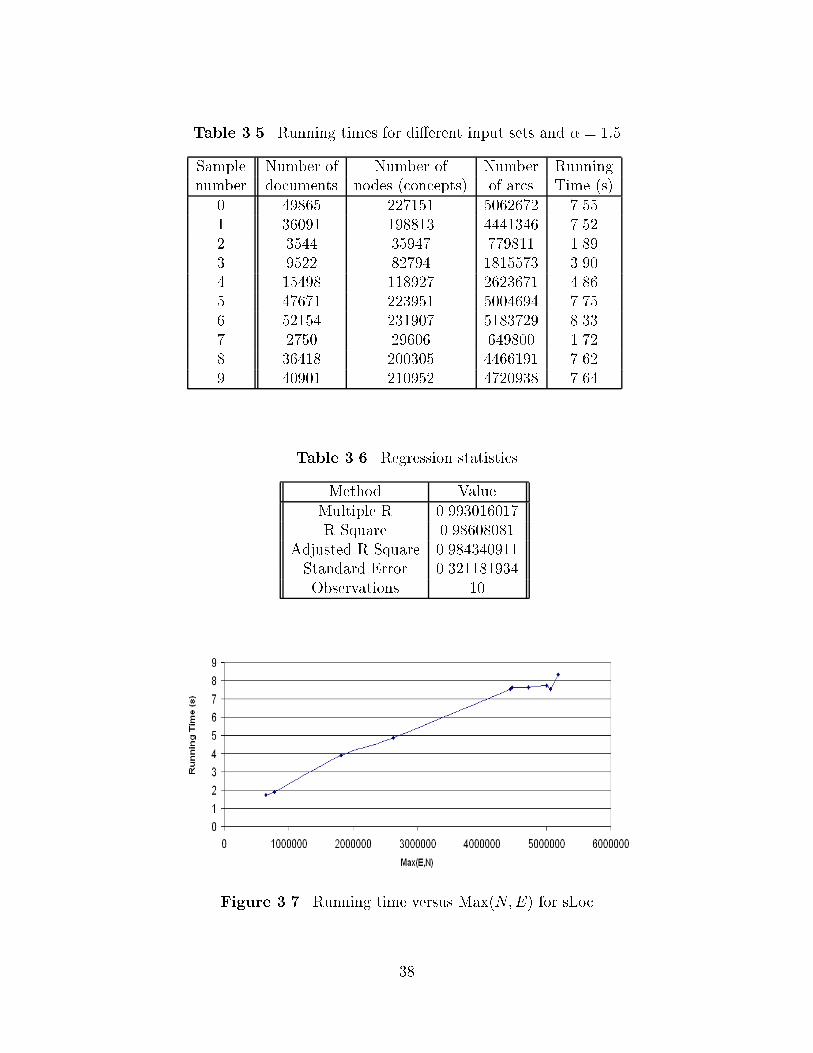
Table ��� Running times for dierent input sets and � � ���
Sample Number of Number of Number Runningnumber documents nodes �concepts of arcs Time �s
� ��� � ������ �� � �� ����� � ��� ������ ������ ����� ���� ����� ������ ����� ���� ����� ������� ����� ����� ������ � �� �� ��� � �� �� ������ ���� �� ���� ����� ������ ������� ����� ���� �� � ����� ����� � ��� ������ �� ��� �� �� ����� ������ ������� �� �
Table ��� Regression statistics
Method ValueMultiple R ������� ���R Square ���� �����
Adjusted R Square �����������Standard Error �����������Observations ��
Figure �� Running time versus Max�N�E for sLoc
��
void search�n� �
visited�n� � true�
dfn�n� � df�count�
link�n� � df�count�
df�count���
push�n��
for every n� in succ�n� do �
if not �visited�n���
then �
search�n���
link�n� � min�link�n��dfn�n����
else � � visited�n�� �
� n� is in the same strongly connected
component as an ancestor of n �
link�n� � min�link�n��dfn�n����
end for
if �link�n��dfn�n�� then �
� n is the root of a strongly connected component
whose nodes are the topmost elements of STACK� up
to and including n� These elements are output and
popped off the stack �
r���
write� Strongly connected component number� �r��
repeat �
x � top�of�stack���
pop���
write�x��
until �x��n�
end search
void main���
df�count � � �
r � � �
for every node �n� do �visited�n� �false
while there is a node �n� such that not�visited�n��
do �search�n��
Figure ��� Pseudo�code for Tarjan�s algorithm
��
allowing it to be integrated in the Java implementation of HDDI� Both Java versions
were coded using JDK ��� because of the library it provides to work with collections�
Java is a very powerful tool for rapid prototyping� although large memory require�
ments are not supported by the Java virtual machine because it can handle only ���bit
addressing on the machines employed in our experiments� In order to have a version of
sLoc that we can use for experiments with large collection sizes� I also wrote a C�� on
the SGI Origin����� using the Polaris library �����
����� Clustering measures
In order to �nd the optimum where the threshold � leads to satisfactory regions of
semantic locality� we introduce some measures on the resulting knowledge neighborhood�
We distinguish between what we call �micrometrics� assessing the interior structure
of the clustered graph and �macrometrics� assessing the knowledge neighborhood quality
based on measures that are independent of its internal structure�
Macrometrics will not take into account the underlying graph structure� We can draw
a parallel between these measures and the input parameters used in the second approach
to clustering described in Section ������ The main macrometrics are the number of
clusters� the size of the clusters� and the coverage� they will be described later in this
chapter�
Micrometrics give some feedback about the internal structure of the clustered graph�
they measure the similarity of concepts in a cluster� and the dissimilarity of concepts in
dierent clusters� However� these measures are very expensive computationally�
Moreover� the quality of these micrometrics is very dependent on the graph structure�
In order to avoid a getting a huge set of measures� one for each cluster for example� we
want to use a �reduced� measure for each micrometric� The reduced measure represents
the distribution of a given metric across the whole knowledge neighborhood� However�
the less homogeneous the underlying graph� the less these measures make sense� because
one average cannot represent the complexity of a heterogeneous distribution�
��
In de�ning the micrometrics� we take an approach similar to that of Sparck Jones
��� and compute measures similar to those of Section �������� The intercluster and
intracluster densities for a given knowledge base are computed over all clusters remaining
after the completion of phase � �see Figure ����
Let us call C�� C� � � � Cn the n clusters of nodes found by sLoc� Notice that� math�
ematically� �C�� C� � � � Cn is not a partition of N � we must add all the clusters of size
smaller than s to get a real partition of N � �C�� C� � � � Cn only covers part of the input
knowledge base� the clusters of size smaller than s� rather than being forced into a larger
cluster are simply discarded� Traditional clustering methods such as Rocchio�s ���� try
to force the outliers into existing clusters� In HDDI we want to leverage our knowledge
of outliers and allow sLoc to play a role in �trimming� the knowledge base� Therefore�
all the concepts in clusters of size smaller than s will be ignored for any further use at
the leaf level of the hierarchy�
������� Coverage
At the end of the process depicted in Figure ��� clusters of size smaller than s are
discarded� For large values of � �respectively� small values of � the number of nodes
discarded can be fairly high� In other words� the ratio of the number of nodes in clusters
of size greater than s to the total number of nodes present in the knowledge base originally
is fairly low for large values of � � We call the this later ratio the coverage c in the HDDI
terminology� The coverage c is the percentage of the knowledge base actually represented
in the regions of semantic locality sLoc outputs�
c �
Pk����nNCk
N����
For example� a coverage of �� means that ��! of the nodes in the input knowledge base
will actually appear in a cluster of the knowledge neighborhood� The larger c the larger
the number of concepts that will be retrievable through the knowledge neighborhood�
��
������� Number of clusters
The number of clusters n at the end of phase � �see Figure ���� page �� is a good
experimental indicator of distribution of clusters� We will see in Section ��� how the
quality of the clustering relates to the number of clusters� Notice that n not only depends
on the threshold � � but it is also determined by the minimum cluster size s that we impose�
As for the other measures� the way s is set must re�ect the application needs� For some
applications� or some input sets s � � might be too small�
������� Cluster size
The distribution of cluster sizes is characteristic of the clustering too� Section ���
gives an interpretation of how this distribution changes with the threshold � �
������� Intracluster densities
The intracluster density ��Ck of a given cluster Ck can be easily computed from the
mean MCkand standard deviation SDCk
of the weights of arcs inside cluster Ck�
��Ck �MCk
� � SDCk
���
Let us call NCkthe number of nodes in cluster Ck� An alternative formula for intra�
cluster density is
��Ck ��
NCk� �NCk
� �
X�i�j��Ck
wi�j ����
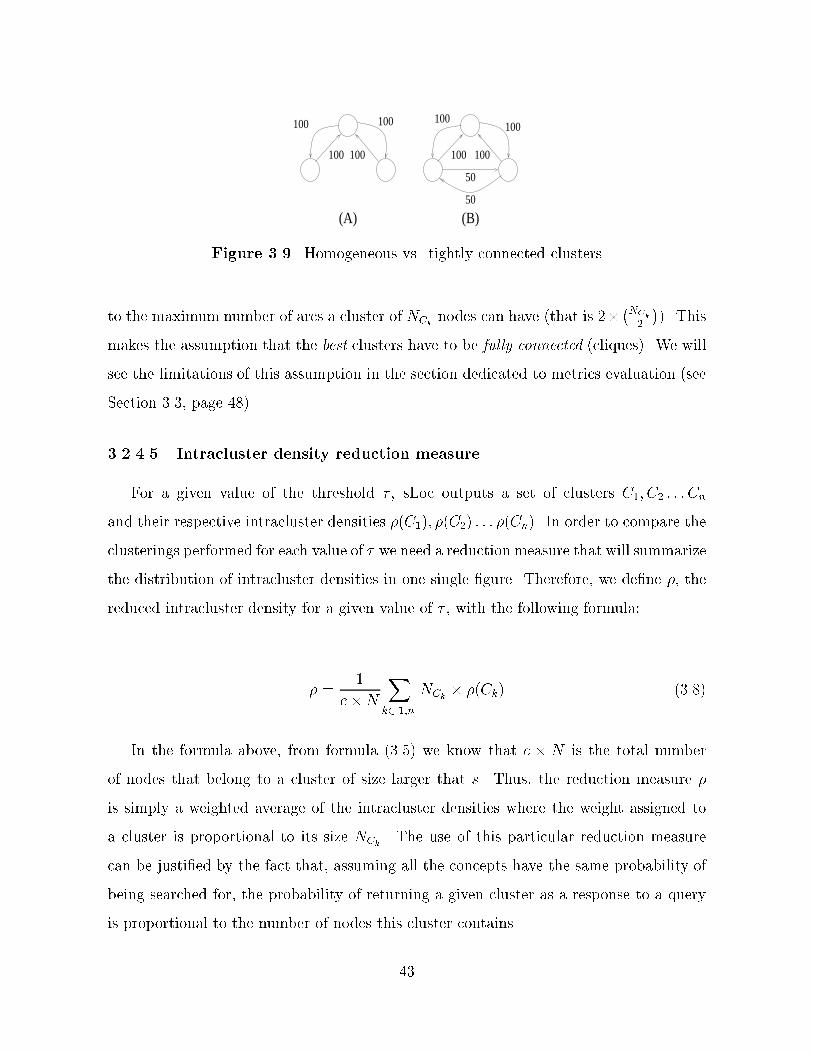
Formula ��� will assign a greater intracluster density to clusters of homogeneously
high weight� Formula ���� was designed to take care of situations described in Figure ����
In the case presented� using formula ��� we would get ��A � ��B� to put it simply�
formula ��� favors homogeneity over connectivity� Therefore we introduced formula
���� for cases when connectivity �ts more closely to the application needs� It is very
important to notice that in Equation ���� the denominator NCk� �NCk
�� corresponds
��
(A) (B)
100 100 100100
50
50
100 100100100
Figure ��� Homogeneous vs� tightly connected clusters
to the maximum number of arcs a cluster of NCknodes can have �that is ��
�NCk�
�� This
makes the assumption that the best clusters have to be fully connected �cliques� We will
see the limitations of this assumption in the section dedicated to metrics evaluation �see
Section ���� page ���
������� Intracluster density reduction measure
For a given value of the threshold � � sLoc outputs a set of clusters C�� C� � � � Cn
and their respective intracluster densities ��C�� ��C� � � � ��Cn� In order to compare the
clusterings performed for each value of � we need a reduction measure that will summarize
the distribution of intracluster densities in one single �gure� Therefore� we de�ne �� the
reduced intracluster density for a given value of � � with the following formula�
� ��
c�N
Xk����n
NCk� ��Ck ����
In the formula above� from formula ���� we know that c � N is the total number
of nodes that belong to a cluster of size larger that s� Thus� the reduction measure �
is simply a weighted average of the intracluster densities where the weight assigned to
a cluster is proportional to its size NCk� The use of this particular reduction measure
can be justi�ed by the fact that� assuming all the concepts have the same probability of
being searched for� the probability of returning a given cluster as a response to a query
is proportional to the number of nodes this cluster contains�
��
������� Intercluster density
In order to compute the intercluster density P � let Ainter � A be the subset of A
such that
Ainter � fai�j � A j i � Cp� j � Cq� p �� qg
The set Ainter contains all the arcs going from one cluster to another� What we call Ainter
is the number of elements in Ainter� Then Minter and SDinter are
Minter ��
Ainter
Xai�j�Ainter
wi�j
SDinter �
s�
Ainter � �
Xai�j�Ainter
�wi�j �Minter�
A �rst de�nition for the intercluster density P is
P �Minter
�� � SDinter����
An alternative de�nition can be
P ��
n� �n� �
Xai�j�Ainter
wi�j �����
As with ��� and ����� ���� and ����� dier by the patterns they emphasize in
the clustering� Formula ���� will assign a greater intercluster density when the arcs in
Ainter are of similar weight� whereas ����� will emphasize the connectivity pattern of the
clustering�
Here� notice the denominator in Equation ����� n� �n� �� where n is the number of
clusters after the end of phase � in Figure ���� page ��� it can be viewed as an assumption
��
made on the clustered graph structure� This measure makes much more sense if the set
of clusters are fully connected� that is� if there the weights wi�j are distributed fairly
homogeneously between clusters pairs�
������ A possible denition of the optimum
The intracluster density measures the similarity of concepts within a cluster� As a
result� it is our premise that reduced intracluster density � should be maximum at the
optimum� At the same time� the intercluster density P measures how similar concepts
are across dierent clusters� Therefore� we want the intercluster density to be minimized
at this same optimum� At the same time� the closer the coverage c is to ���!� the larger
the number of concepts represented in the knowledge neighborhood� These three metrics
vary in completely dierent ranges� to make them comparable we have them all range
between zero and one by simply dividing them by the largest value they actually take
across the range of alpha� We then de�ne standardized reduced intracluster density ��
and intercluster density P��
���� ����
Max��T ���������
P��� �P ��
Max��T �P �������
A satisfactory clustering will have a �� close to �� a P� close to �� that is� �� � P�
close to one� while the coverage has to be as close to � as possible too� Therefore� we
arrive at the empirical formula for the optimization function F�
F � ��� � ��� P�� c �����
��
The optimum � makes F reach a maximum� The above formula aims at determining
the clustering that yields an optimum balance between coverage� intra� and intercluster
densities� Further experimental evidence is needed� however� on the impact on perfor�
mance in application environments to justify the use of such an optimum� Figure ���
depicts one such environment in which such experiments can be conducted�
This de�nition of a theoretical optimum does not intend to actually �t every real�world
application sLoc would be used for� It is rather intended to provide a theoretical baseline�
a reference to which other optima can be compared� For instance� the �optimum� clusters
may be too large to be properly managed by a dynamic query engine that matches a
query vector to one or more clusters� In addition� if concepts inside a given cluster are to
be used as suggestions for an interactive search re�nement� clusters of size greater than
�� will not be very user�friendly�
The logical next step is thus to test the dierent criteria for clustering e�ciency in real�
world applications� Figure ��� depicts the mapping of a query vector to a hierarchical
distributed dynamic index� As discussed in Section ���� � mappings between regions
of semantic locality provide the necessary links� or paths� between subtopic regions at
higher and lower levels of the hierarchy� Chapter � will broach several issues related to
performing an actual query search on an HDDI� using gold standard collections from the
SMART project�
������� Comparison with hypergraph�based partitioning
In ����� Han� Karypis and Kumar use HMETIS� a multilevel hypergraph partitioning
algorithm to cluster large data sets� Their approach has caught our attention because
their purpose is very similar to ours� that is� to achieve scalable clustering�
Like most traditional graph partitioning algorithms� HMETIS requires the user to
enter the number of clusters before starting� The bad clusters are then eliminated using
a �tness function and a threshold� Let e be a set of vertices representing a hyperedge
and C be a set of vertices representing a partition� The �tness function that measures
the goodness of the partition C is de�ned as follows�
�
fitness�C �
Pe�C weight�eP
je�Cj��weight�e�����
The �tness function measures the ratio of weights of edges that are within the partition
and weights of edges involving any vertex of this partition� The high �tness value suggests
that the partition has more weights for edges connecting vertices within the partition�
This measure actually incorporates both concepts of intra� and intercluster densities� or
at least the weight�part of them� The numerator of the �tness function in Equation �����
is the sum of the weights �similarities within a cluster� we �nd this same sum in sLoc�s
de�nition of the intracluster density function ��C� The denominator is concerned with
edge cuts� in this regard it is similar to sLoc�s intercluster density�
Kumar et al� also use another criterion to �lter out vertices that are not highly
connected to the rest of the partition� The connectivity function of vertex v in C is
de�ned as follows�
connectivity�C �jfeje � C� v � egj
jfeje � Cgj�����
The connectivity measures the percentage of edges that each vertex is associated
with� A high connectivity value suggests that the vertex has many edges connecting
good proportion of the vertices in the partition� Note that this measure assesses strictly
intracluster connectivity�
It is very interesting to notice how Kumar at al� merge inter� and intracluster densities
into one measure ��tness whereas sLoc keeps them separate� and also how these sLoc
metrics merge and balance weights and connectivity inside intra� and intercluster density�
whereas Kumar et al� make a clear distinction between the two� Note that Kumar does
not address the issue of intercluster connectivity�
��
Notice also that as intra� and intercluster densities� �tness and connectivity can be
called micro�metrics� They give relevant information about the clustered graph structure�
but they are very expensive to compute�
��� Experiments with Macro� and Micrometrics
A set of experiments on input knowledge bases of dierent sizes and content have been
conducted� The parameter � was used as the X�axis variable to plot several measures
on the output knowledge neighborhood� We have noticed some general trends in the
experiments we have carried out� In this section� rather than trying to be general� we will
focus on particular examples for the reader to get a feel about what happens qualitatively
and quantitatively in the knowledge neighborhood as we tune �� Because we believe they
are more relevant to search and retrieval requirements� we picked the de�nitions of intra�
and intercluster densities that favored connectivity over homogeneity� that is� we use in
this section de�nitions ����� page ��� for intracluster density� and ������ page ��� for
intercluster density� These formulae favor clusters with a high degree of connectivity
�lots of arcs between concepts� our intuition is that connectivity is essential to semantic
locality�
����� General observations
First� one of the major advantages of sLoc is that the algorithm execution time is
linear in the maximum number of nodes�arcs in the input knowledge base Max�N�A�
The algorithm is scalable in this regard�
The performance of sLoc is closely dependent on how the weights and arcs are assigned
when the input knowledge base is created� In kBase� the knowledge base creation algo�
rithm� the distribution of weights is not uniform� about half of the weights are equal to
�See Equation ���� page �� for a de�nition of ��
��
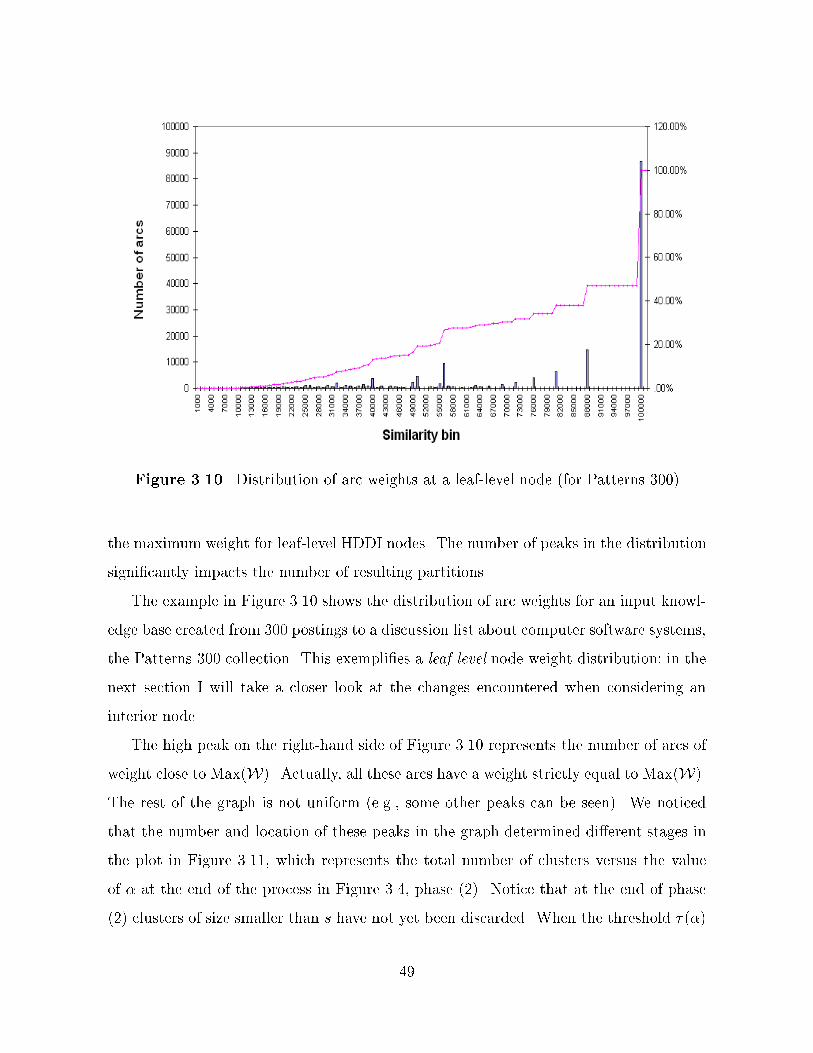
Figure ���� Distribution of arc weights at a leaf�level node �for Patterns ���
the maximum weight for leaf�level HDDI nodes� The number of peaks in the distribution
signi�cantly impacts the number of resulting partitions�
The example in Figure ���� shows the distribution of arc weights for an input knowl�
edge base created from ��� postings to a discussion list about computer software systems�
the Patterns ��� collection� This exempli�es a leaf�level node weight distribution� in the
next section I will take a closer look at the changes encountered when considering an
interior node�
The high peak on the right�hand side of Figure ���� represents the number of arcs of
weight close to Max�W� Actually� all these arcs have a weight strictly equal to Max�W�
The rest of the graph is not uniform �e�g�� some other peaks can be seen� We noticed
that the number and location of these peaks in the graph determined dierent stages in
the plot in Figure ����� which represents the total number of clusters versus the value
of � at the end of the process in Figure ���� phase ��� Notice that at the end of phase
�� clusters of size smaller than s have not yet been discarded� When the threshold ���
��
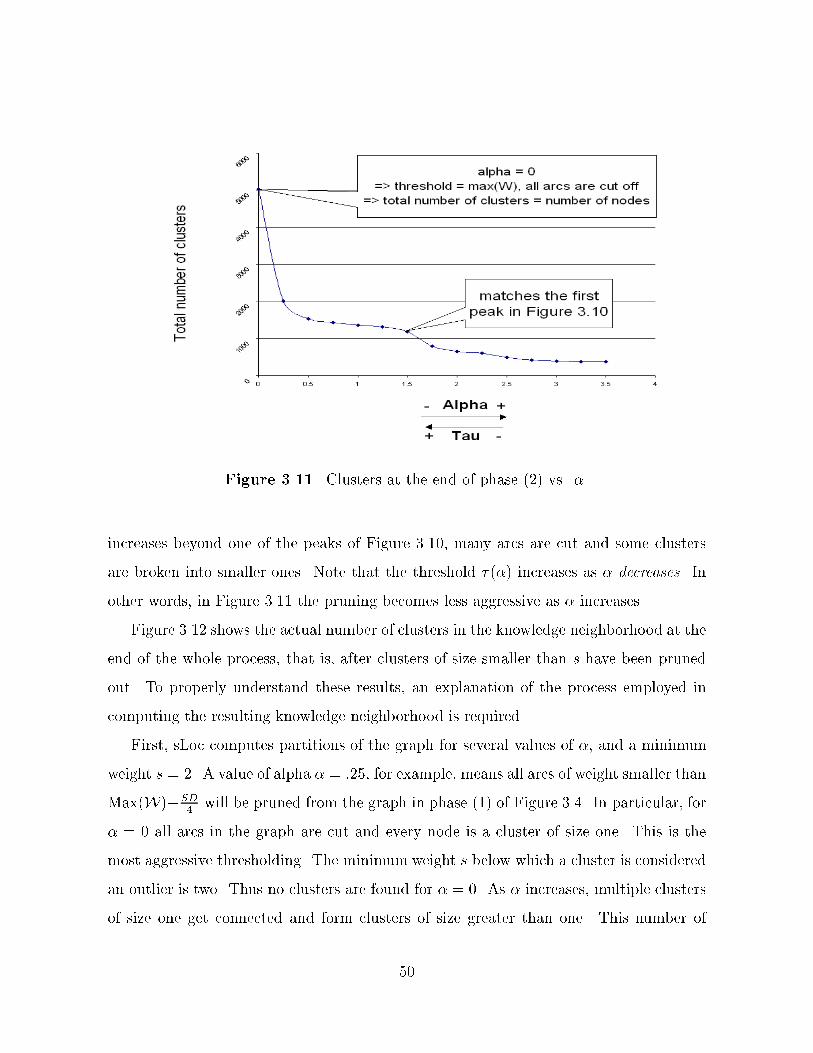
Figure ���� Clusters at the end of phase �� vs� �
increases beyond one of the peaks of Figure ����� many arcs are cut and some clusters
are broken into smaller ones� Note that the threshold ��� increases as � decreases� In
other words� in Figure ���� the pruning becomes less aggressive as � increases�
Figure ���� shows the actual number of clusters in the knowledge neighborhood at the
end of the whole process� that is� after clusters of size smaller than s have been pruned
out� To properly understand these results� an explanation of the process employed in
computing the resulting knowledge neighborhood is required�
First� sLoc computes partitions of the graph for several values of �� and a minimum
weight s � �� A value of alpha � � ���� for example� means all arcs of weight smaller than
Max�W�SD�
will be pruned from the graph in phase �� of Figure ���� In particular� for
� � � all arcs in the graph are cut and every node is a cluster of size one� This is the
most aggressive thresholding� The minimum weight s below which a cluster is considered
an outlier is two� Thus no clusters are found for � � �� As � increases� multiple clusters
of size one get connected and form clusters of size greater than one� This number of
��
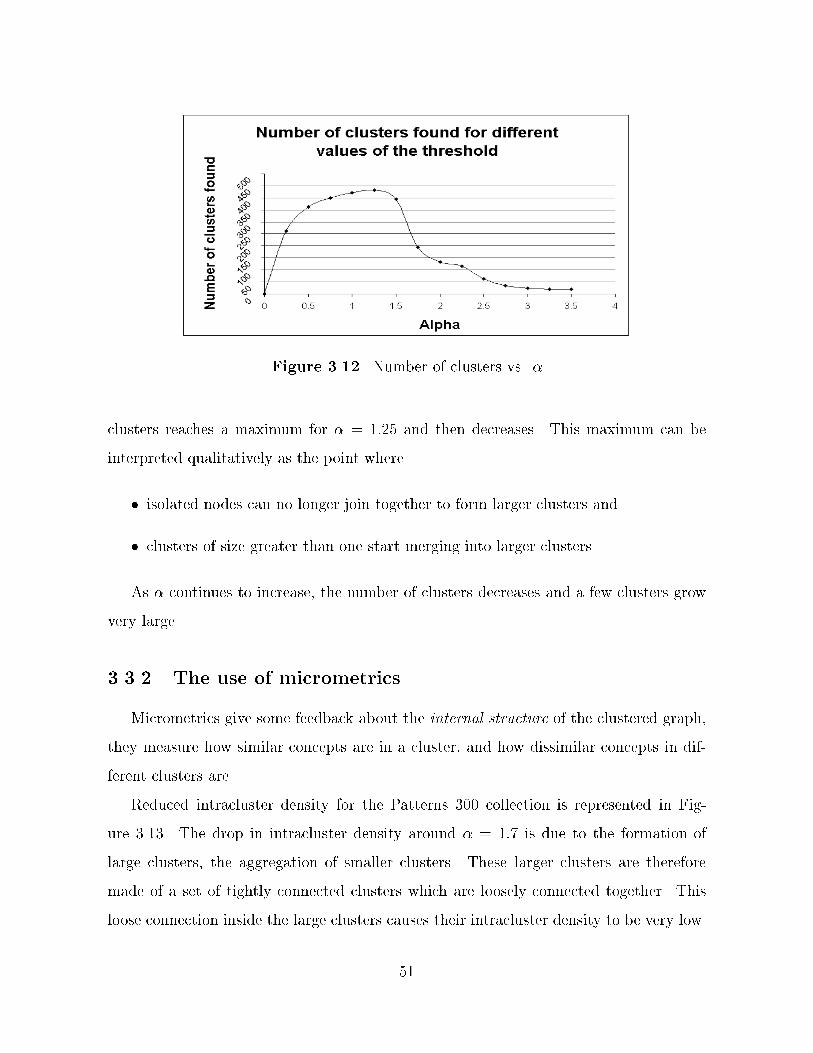
Figure ���� Number of clusters vs� �
clusters reaches a maximum for � � ���� and then decreases� This maximum can be
interpreted qualitatively as the point where
� isolated nodes can no longer join together to form larger clusters and
� clusters of size greater than one start merging into larger clusters�
As � continues to increase� the number of clusters decreases and a few clusters grow
very large�
����� The use of micrometrics
Micrometrics give some feedback about the internal structure of the clustered graph�
they measure how similar concepts are in a cluster� and how dissimilar concepts in dif�
ferent clusters are�
Reduced intracluster density for the Patterns ��� collection is represented in Fig�
ure ����� The drop in intracluster density around � � ��� is due to the formation of
large clusters� the aggregation of smaller clusters� These larger clusters are therefore
made of a set of tightly connected clusters which are loosely connected together� This
loose connection inside the large clusters causes their intracluster density to be very low�
��
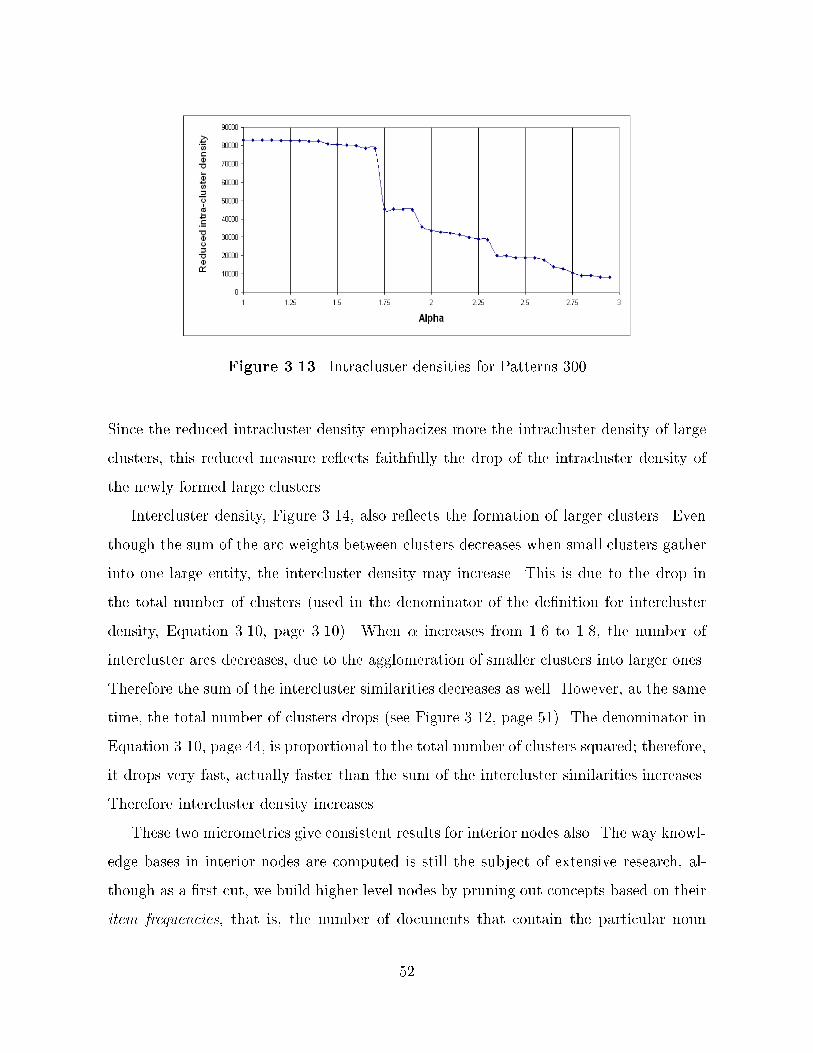
Figure ���� Intracluster densities for Patterns ���
Since the reduced intracluster density emphacizes more the intracluster density of large
clusters� this reduced measure re�ects faithfully the drop of the intracluster density of
the newly formed large clusters�
Intercluster density� Figure ����� also re�ects the formation of larger clusters� Even
though the sum of the arc weights between clusters decreases when small clusters gather
into one large entity� the intercluster density may increase� This is due to the drop in
the total number of clusters �used in the denominator of the de�nition for intercluster
density� Equation ����� page ����� When � increases from �� to ���� the number of
intercluster arcs decreases� due to the agglomeration of smaller clusters into larger ones�
Therefore the sum of the intercluster similarities decreases as well� However� at the same
time� the total number of clusters drops �see Figure ����� page ��� The denominator in
Equation ����� page ��� is proportional to the total number of clusters squared� therefore�
it drops very fast� actually faster than the sum of the intercluster similarities increases�
Therefore intercluster density increases�
These two micrometrics give consistent results for interior nodes also� The way knowl�
edge bases in interior nodes are computed is still the subject of extensive research� al�
though as a �rst cut� we build higher level nodes by pruning out concepts based on their
item frequencies� that is� the number of documents that contain the particular noun
��
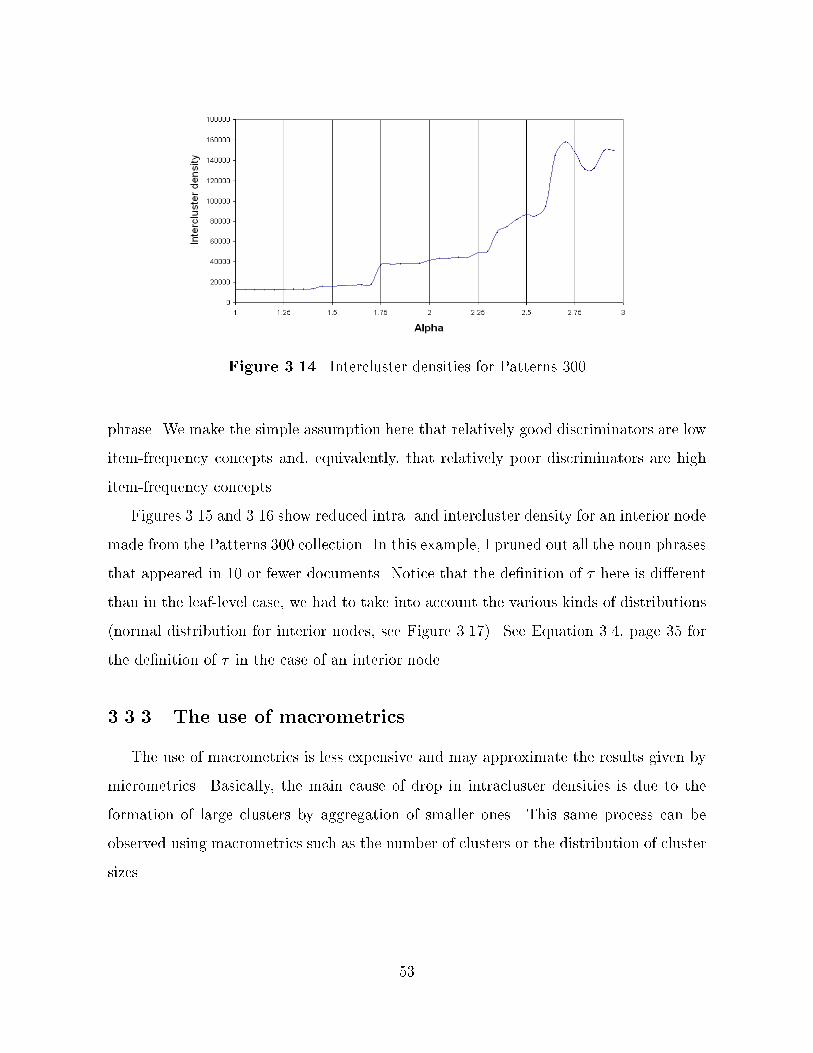
Figure ���� Intercluster densities for Patterns ���
phrase� We make the simple assumption here that relatively good discriminators are low
item�frequency concepts and� equivalently� that relatively poor discriminators are high
item�frequency concepts�
Figures ���� and ��� show reduced intra� and intercluster density for an interior node
made from the Patterns ��� collection� In this example� I pruned out all the noun phrases
that appeared in �� or fewer documents� Notice that the de�nition of � here is dierent
than in the leaf�level case� we had to take into account the various kinds of distributions
�normal distribution for interior nodes� see Figure ����� See Equation ���� page �� for
the de�nition of � in the case of an interior node�
����� The use of macrometrics
The use of macrometrics is less expensive and may approximate the results given by
micrometrics� Basically� the main cause of drop in intracluster densities is due to the
formation of large clusters by aggregation of smaller ones� This same process can be
observed using macrometrics such as the number of clusters or the distribution of cluster
sizes�
��
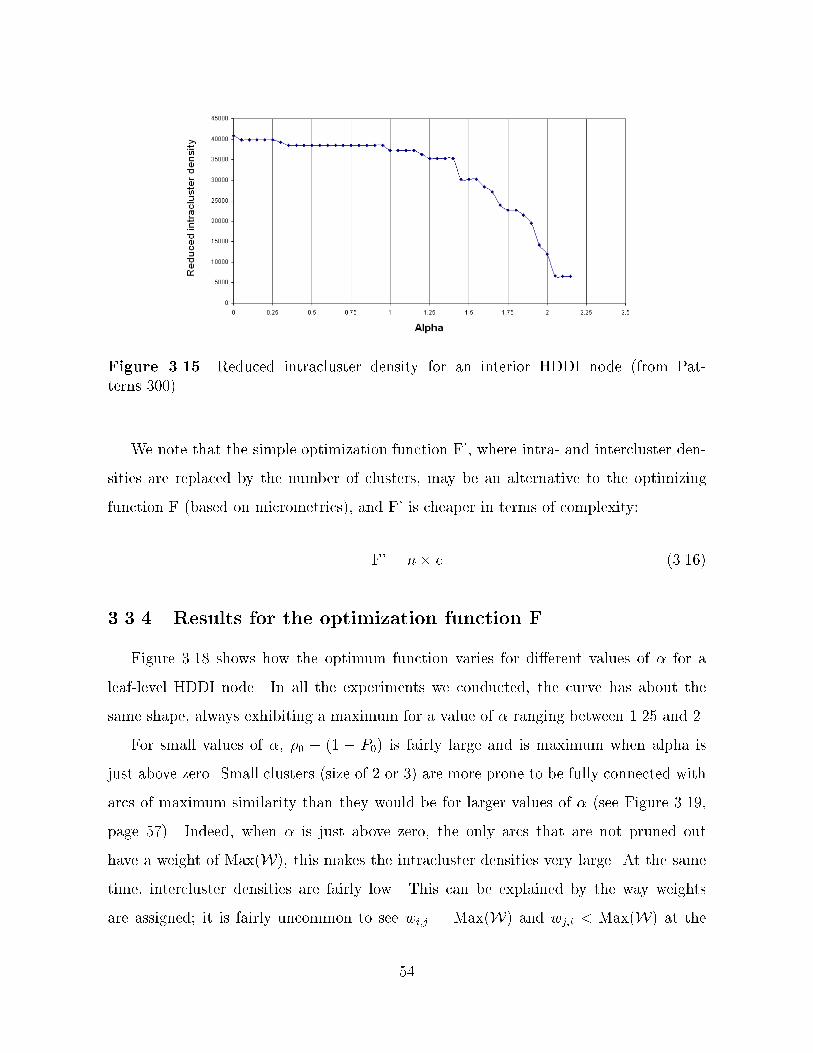
Figure ���� Reduced intracluster density for an interior HDDI node �from Pat�terns ���
We note that the simple optimization function F�� where intra� and intercluster den�
sities are replaced by the number of clusters� may be an alternative to the optimizing
function F �based on micrometrics� and F� is cheaper in terms of complexity�
F� � n� c ����
����� Results for the optimization function F
Figure ���� shows how the optimum function varies for dierent values of � for a
leaf�level HDDI node� In all the experiments we conducted� the curve has about the
same shape� always exhibiting a maximum for a value of � ranging between ���� and ��
For small values of �� �� � �� � P� is fairly large and is maximum when alpha is
just above zero� Small clusters �size of � or � are more prone to be fully connected with
arcs of maximum similarity than they would be for larger values of � �see Figure �����
page ��� Indeed� when � is just above zero� the only arcs that are not pruned out
have a weight of Max�W� this makes the intracluster densities very large� At the same
time� intercluster densities are fairly low� This can be explained by the way weights
are assigned� it is fairly uncommon to see wi�j � Max�W and wj�i � Max�W at the
��
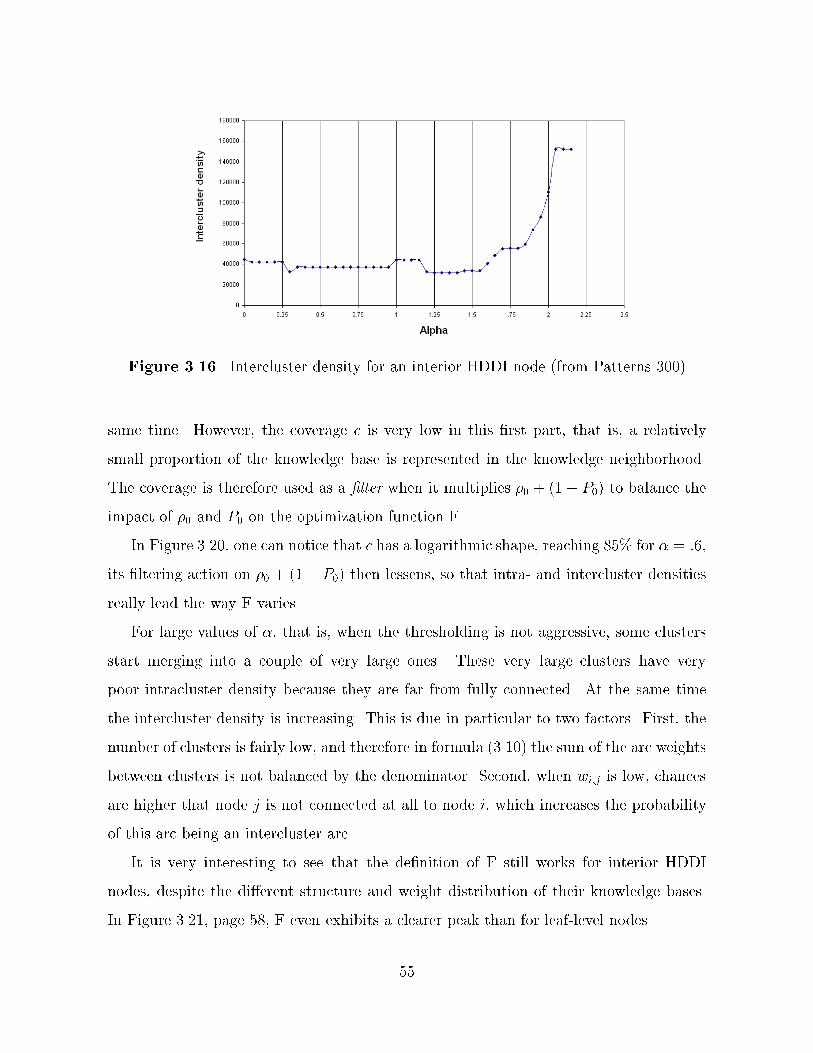
Figure ���� Intercluster density for an interior HDDI node �from Patterns ���
same time� However� the coverage c is very low in this �rst part� that is� a relatively
small proportion of the knowledge base is represented in the knowledge neighborhood�
The coverage is therefore used as a �lter when it multiplies �� � ��� P� to balance the
impact of �� and P� on the optimization function F�
In Figure ����� one can notice that c has a logarithmic shape� reaching ��! for � � � �
its �ltering action on �� � ��� P� then lessens� so that intra� and intercluster densities
really lead the way F varies�
For large values of �� that is� when the thresholding is not aggressive� some clusters
start merging into a couple of very large ones� These very large clusters have very
poor intracluster density because they are far from fully connected� At the same time
the intercluster density is increasing� This is due in particular to two factors� First� the
number of clusters is fairly low� and therefore in formula ����� the sum of the arc weights
between clusters is not balanced by the denominator� Second� when wi�j is low� chances
are higher that node j is not connected at all to node i� which increases the probability
of this arc being an intercluster arc�
It is very interesting to see that the de�nition of F still works for interior HDDI
nodes� despite the dierent structure and weight distribution of their knowledge bases�
In Figure ����� page ��� F even exhibits a clearer peak than for leaf�level nodes�
��
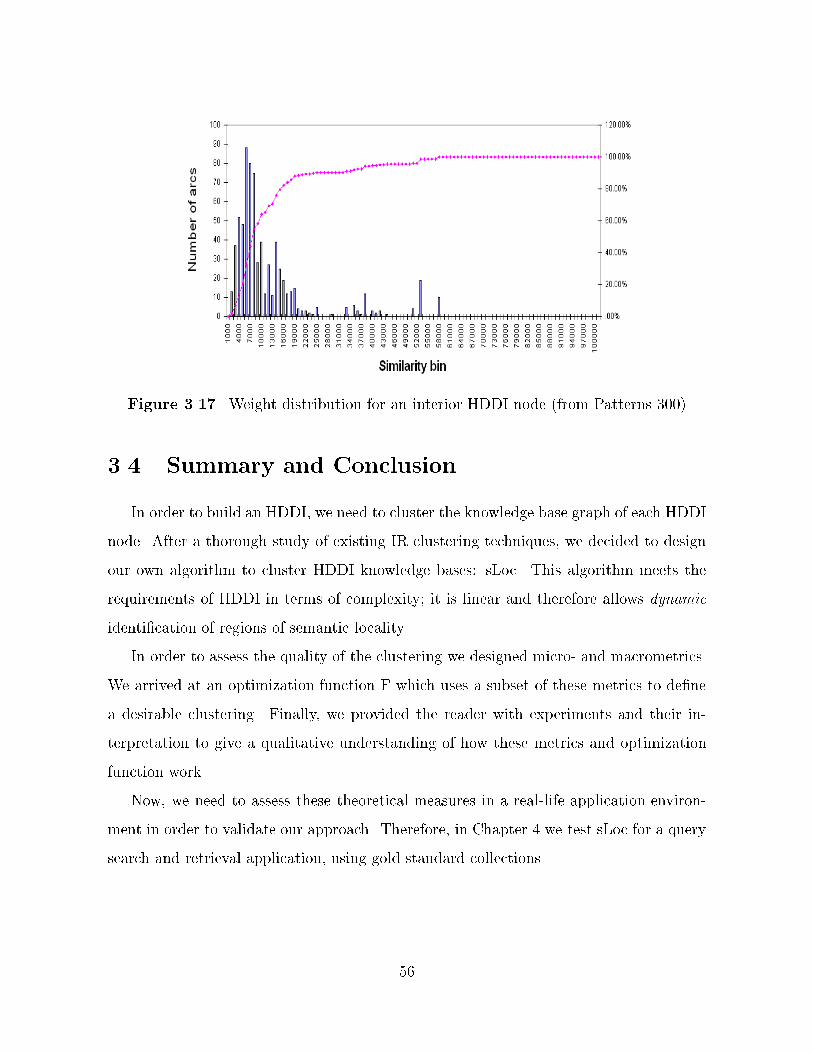
Figure ��� Weight distribution for an interior HDDI node �from Patterns ���
��� Summary and Conclusion
In order to build an HDDI� we need to cluster the knowledge base graph of each HDDI
node� After a thorough study of existing IR clustering techniques� we decided to design
our own algorithm to cluster HDDI knowledge bases� sLoc� This algorithm meets the
requirements of HDDI in terms of complexity� it is linear and therefore allows dynamic
identi�cation of regions of semantic locality�
In order to assess the quality of the clustering we designed micro� and macrometrics�
We arrived at an optimization function F which uses a subset of these metrics to de�ne
a desirable clustering� Finally� we provided the reader with experiments and their in�
terpretation to give a qualitative understanding of how these metrics and optimization
function work�
Now� we need to assess these theoretical measures in a real�life application environ�
ment in order to validate our approach� Therefore� in Chapter � we test sLoc for a query
search and retrieval application� using gold standard collections�
�
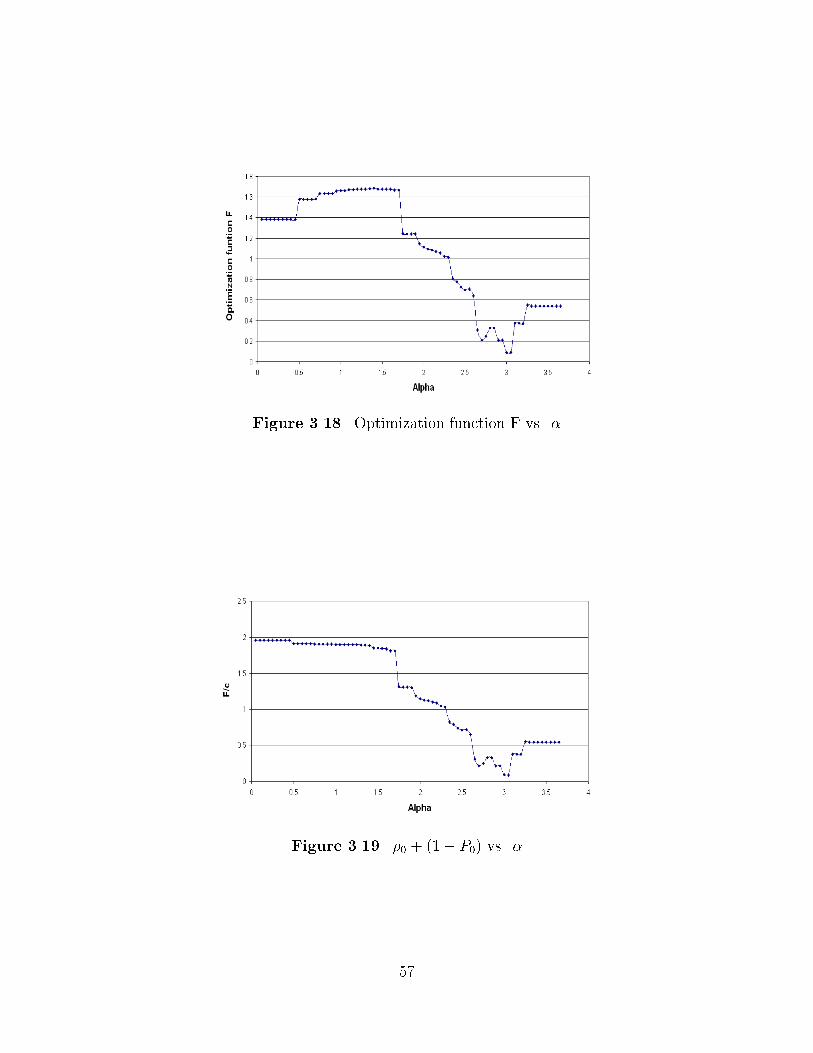
Figure ���� Optimization function F vs� �
Figure ���� �� � ��� P� vs� �
��
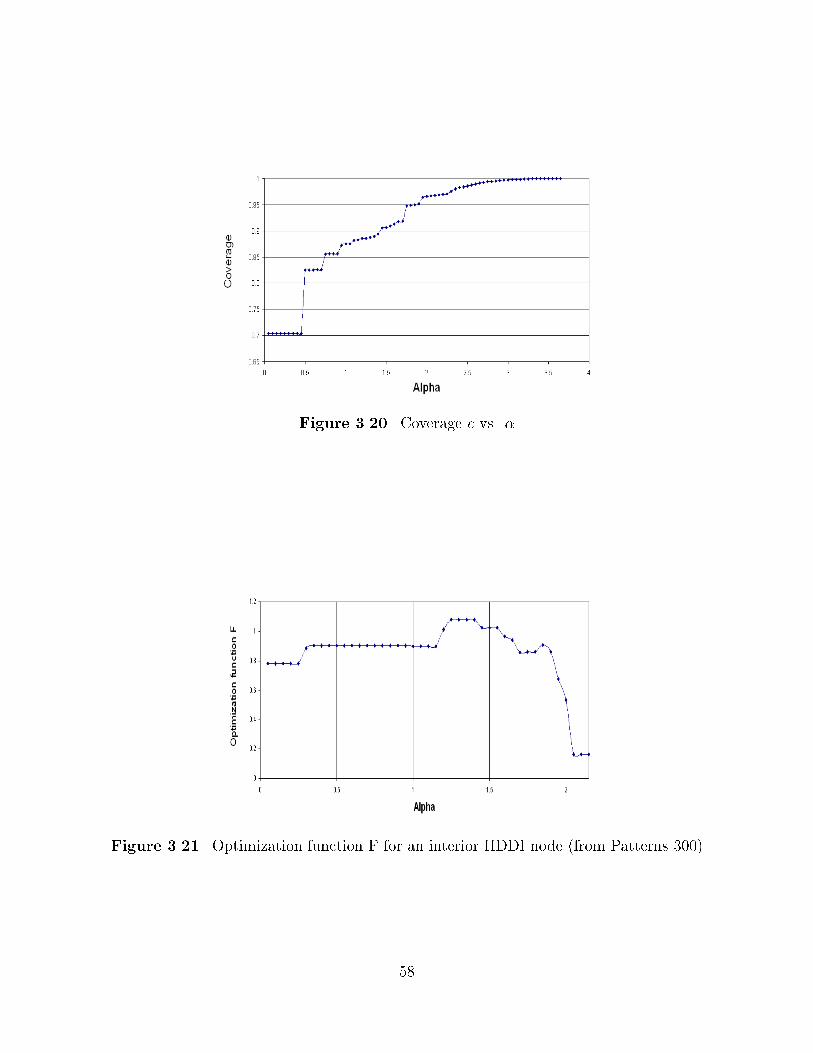
Figure ���� Coverage c vs� �
Figure ���� Optimization function F for an interior HDDI node �from Patterns ���
��
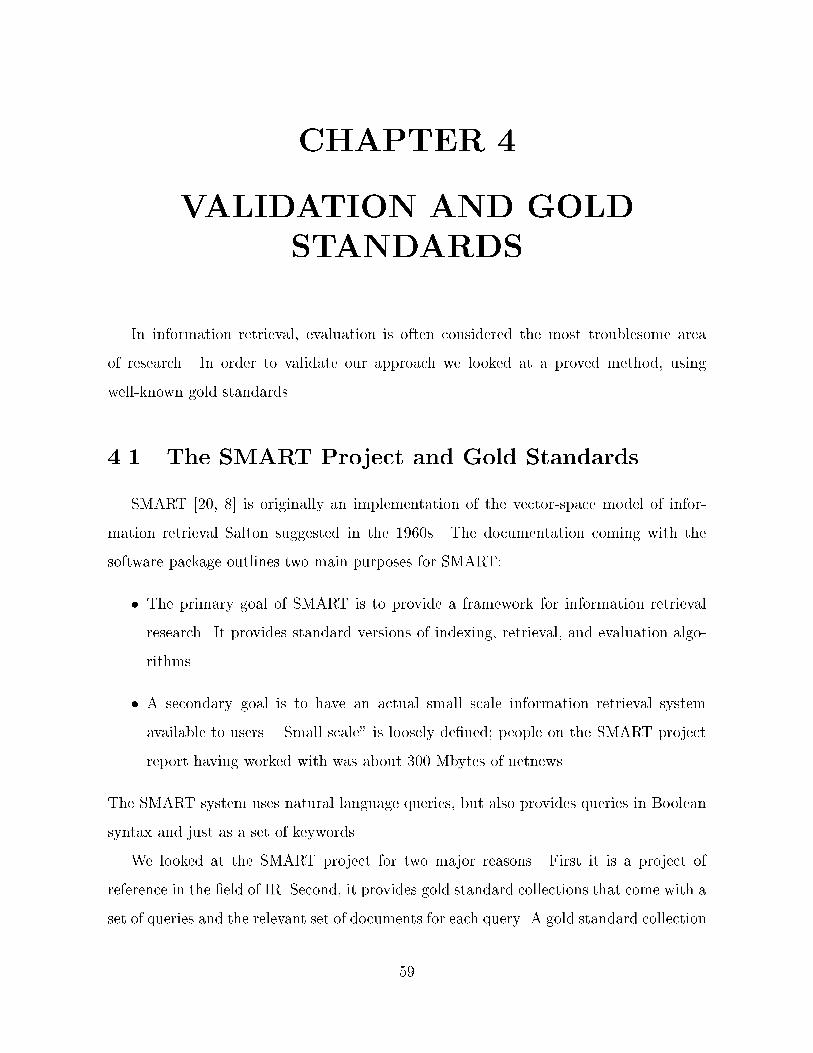
CHAPTER �
VALIDATION AND GOLD
STANDARDS
In information retrieval� evaluation is often considered the most troublesome area
of research� In order to validate our approach we looked at a proved method� using
well�known gold standards�
��� The SMART Project and Gold Standards
SMART ���� �� is originally an implementation of the vector�space model of infor�
mation retrieval Salton suggested in the �� �s� The documentation coming with the
software package outlines two main purposes for SMART�
� The primary goal of SMART is to provide a framework for information retrieval
research� It provides standard versions of indexing� retrieval� and evaluation algo�
rithms�
� A secondary goal is to have an actual small scale information retrieval system
available to users� �Small scale� is loosely de�ned� people on the SMART project
report having worked with was about ��� Mbytes of netnews�
The SMART system uses natural language queries� but also provides queries in Boolean
syntax and just as a set of keywords�
We looked at the SMART project for two major reasons� First it is a project of
reference in the �eld of IR� Second� it provides gold standard collections that come with a
set of queries and the relevant set of documents for each query� A gold standard collection
��
is composed of a set of documents� a set of queries and the relevant documents associated
with these queries� These collections are called gold standards because they include the
collections� queries and proper responses chosen by domain experts� In addition� many
such gold standard collections have been used by various research projects� thus making
comparison between various techniques possible�
��� Building an HDDI from SMART Collections
In our eort to validate sLoc using SMART collections� we learned a lot� not only
about HDDI� but also about the SMART gold standard queries and the assumptions
they make implicitly�
The validation process has served as a ground�breaking step too� because� as expected�
a query search and retrieval mechanism would not work without building at least a simple
HDDI� We thus had to investigate new issues such as hierarchy building and search
strategies�
Therefore this chapter is also intended to give the reader a feel about the issues in
building an HDDI using hands�on experiments with ADI� MED and CISI� three SMART
gold standard collections�
����� Study of the gold standard SMART queries
The three collections � ADI� CISI and MED � come with a set of queries and for each
query the set of relevant items� Because we want to achieve high precision and recall� we
investigated the structure of these queries�
At this point let us introduce the term �item frequency�� The item frequency of a
concept is the number of items �documents it occurs in� regardless of how many times
it actually occurs in each item� Let us characterize the queries for each collection in
terms of the distribution of their item frequencies� More speci�cally� let us� for each
collection� compare the item frequency distribution in the queries with the item frequency
distribution across the documents�
�
In order to keep it simple and general I used only three dierent bins� The �rst one
gathers all the terms of item frequency �� the next gathers the terms of item frequency
ranging between � and �� and the last between �� and the maximum item frequency� I
chose �� arbitrarily� it turns out to be a convenient median of the distribution in some
cases� but I could as well have chosen some other �gure here�
������� ADI Collection and queries
ADI is the smallest collection of the three� it is only made of �� documents� Figure ���
shows that ����! of the queries are terms that occur in � to �� documents� Of these� only
three query terms ��� �! occur in only one document of the collection� Now Figure ���
represents the item frequency distribution of all the terms in the collection �not only
those of the queries� Terms of item frequency � represent ����! of all the terms in the
documents�
Two important conclusions have to be stated here� First� the queries given in SMART
do not re�ect the item frequency distribution in the collection� queries are mostly made
of terms of item frequency greater than one� This makes the assumption that users search
using relatively poor discriminators �terms occurring in many documents� Second� given
the query item frequency distribution Figure ���� in order for HDDI to match these
queries and get good precision and recall� it must be able to match both the queries�
item frequency distribution at one or more levels� and it must match the document set
item frequency distribution at the leaf level�
������� CISI and MED Collection and queries
The same remarks apply here� too� CISI is a larger collection ���� documents� but
the same patterns as in ADI emerge in query item frequency distribution and document
set item frequency distribution� In Figures ��� and ���� note that while � ! of the terms
in the document set appear in one document only � �� of them� that is� only ���! of
the �� � terms � are represented in the queries�
�
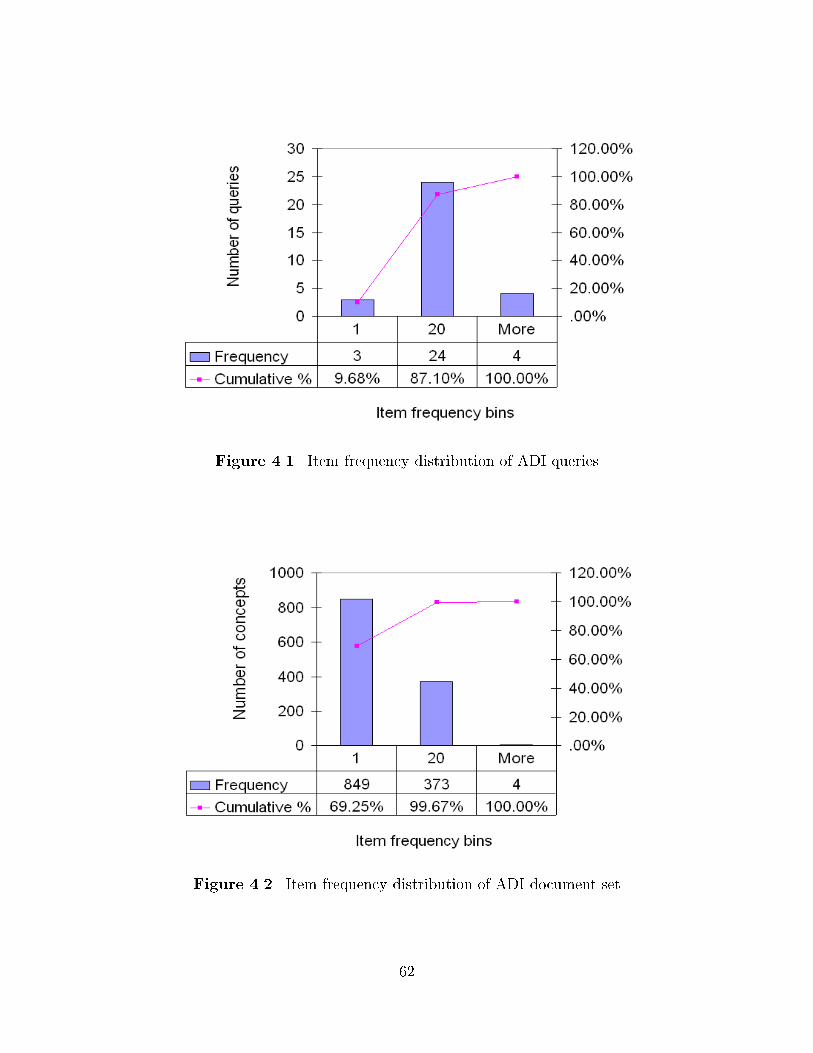
Figure ��� Item frequency distribution of ADI queries
Figure ��� Item frequency distribution of ADI document set
�
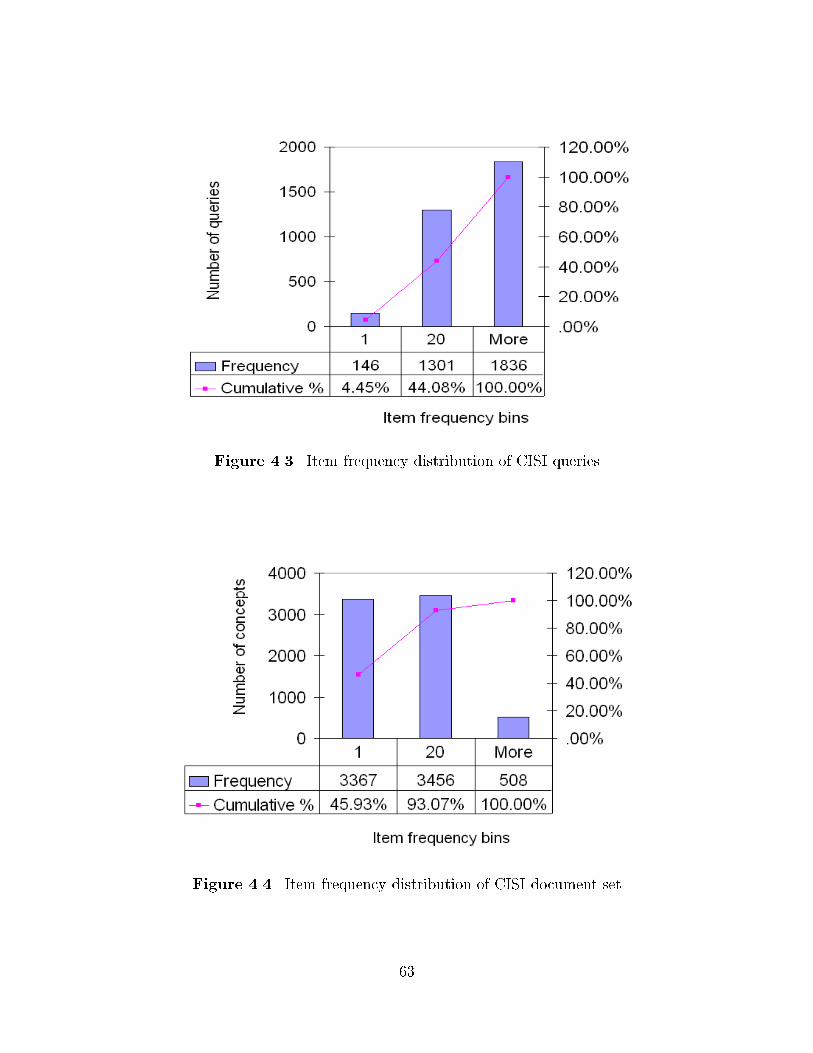
Figure ��� Item frequency distribution of CISI queries
Figure ��� Item frequency distribution of CISI document set
�
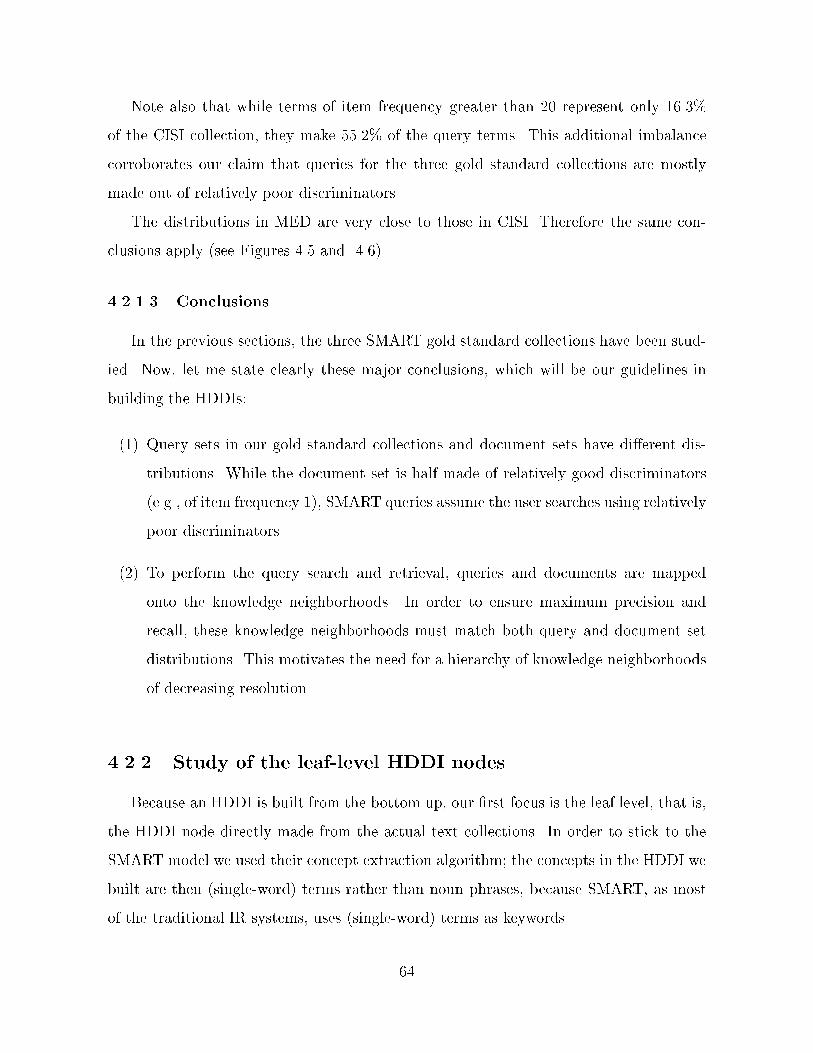
Note also that while terms of item frequency greater than �� represent only � ��!
of the CISI collection� they make ����! of the query terms� This additional imbalance
corroborates our claim that queries for the three gold standard collections are mostly
made out of relatively poor discriminators�
The distributions in MED are very close to those in CISI� Therefore the same con�
clusions apply �see Figures ��� and �� �
������� Conclusions
In the previous sections� the three SMART gold standard collections have been stud�
ied� Now� let me state clearly these major conclusions� which will be our guidelines in
building the HDDIs�
�� Query sets in our gold standard collections and document sets have dierent dis�
tributions� While the document set is half made of relatively good discriminators
�e�g�� of item frequency �� SMART queries assume the user searches using relatively
poor discriminators�
�� To perform the query search and retrieval� queries and documents are mapped
onto the knowledge neighborhoods� In order to ensure maximum precision and
recall� these knowledge neighborhoods must match both query and document set
distributions� This motivates the need for a hierarchy of knowledge neighborhoods
of decreasing resolution�
����� Study of the leaf�level HDDI nodes
Because an HDDI is built from the bottom up� our �rst focus is the leaf level� that is�
the HDDI node directly made from the actual text collections� In order to stick to the
SMART model we used their concept extraction algorithm� the concepts in the HDDI we
built are then �single�word terms rather than noun phrases� because SMART� as most
of the traditional IR systems� uses �single�word terms as keywords�
�
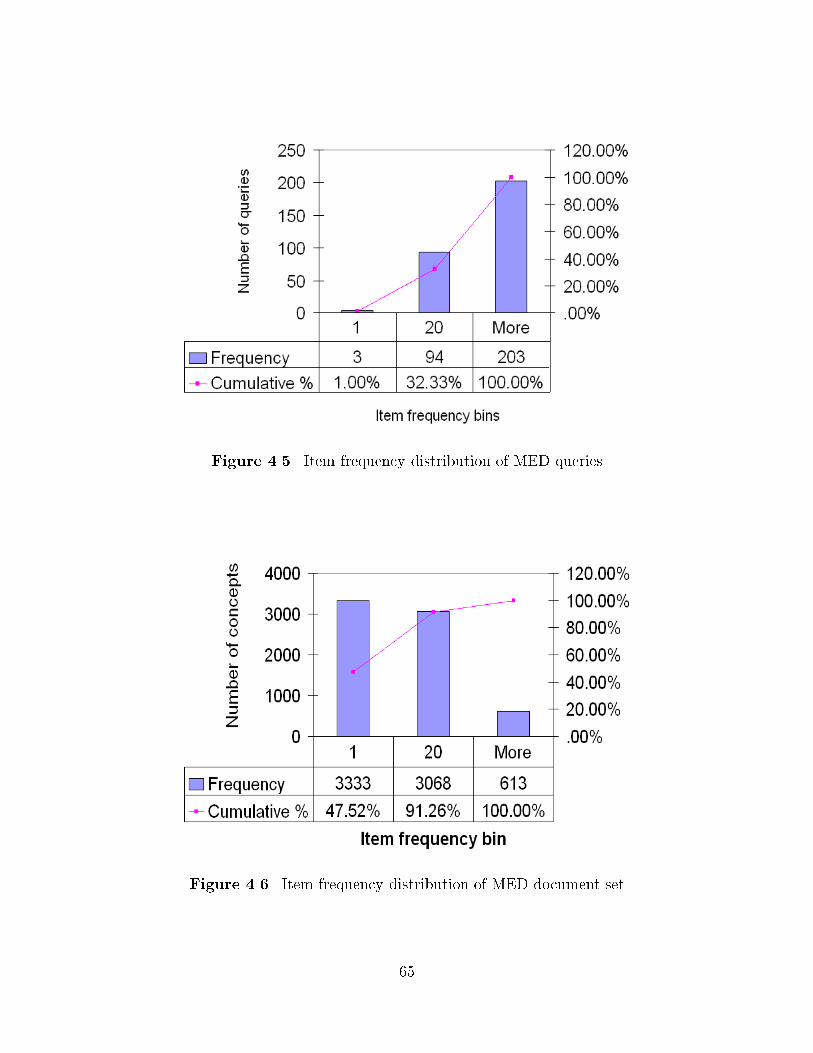
Figure ��� Item frequency distribution of MED queries
Figure ��� Item frequency distribution of MED document set
�
In order to understand what is going on when the clustering is performed� we need to
analyze the item frequency distribution in the SMART collections� Figures ���� ��� and
�� show the proportion of terms of item frequency �� compared to other item frequencies�
This basically means that in all three collections more than ��! of the terms occur in
only one document across the whole collection�
These terms of item frequency � will be identi�ed as good discriminators by kBase�
the algorithm that creates the knowledge base in an HDDI node � good because they
discriminate clearly between documents in the input set�
A poor discriminator is a term that can be found in a large percentage of the entire
collection� The algorithm kBase assigns high weights to arcs connecting pairs of a good
discriminators�
When sLoc identi�es the regions of semantic locality� it �lters out relatively poor
discriminators and forms clusters of good discriminators� Now� what happens when more
than ��! of the terms have an item frequency of � The meaning of such an unbalanced
distribution is that ��! of the terms are excellent discriminators� Consequently� sLoc
builds a knowledge neighborhood formed of terms of item frequency � for the most part�
�ltering out almost all the terms of greater item frequency� Table ��� shows the percentage
of terms of item frequency � in the knowledge neighborhoods built by sLoc for each of
the three SMART collections� The rest of the terms in the knowledge neighborhood have
an item frequency close to ��
The bottom line of the study at the HDDI leaf level is that the knowledge neighbor�
hoods contain only excellent discriminators� This of course is dependent on the algorithm
used to compute the similarities in the knowledge base� kBase� but it is our observation
that all the indexing algorithms use some sort of band�pass �lter eect to focus only
on a certain quality of discriminators� Therefore� changing kBase for another algorithm
would not change the need for a hierarchy� As we saw earlier� the queries proposed by
SMART use very few high quality discriminators� therefore� we see the need for a higher
level in the hierarchy� an interior node with a lower resolution� In other words� we need
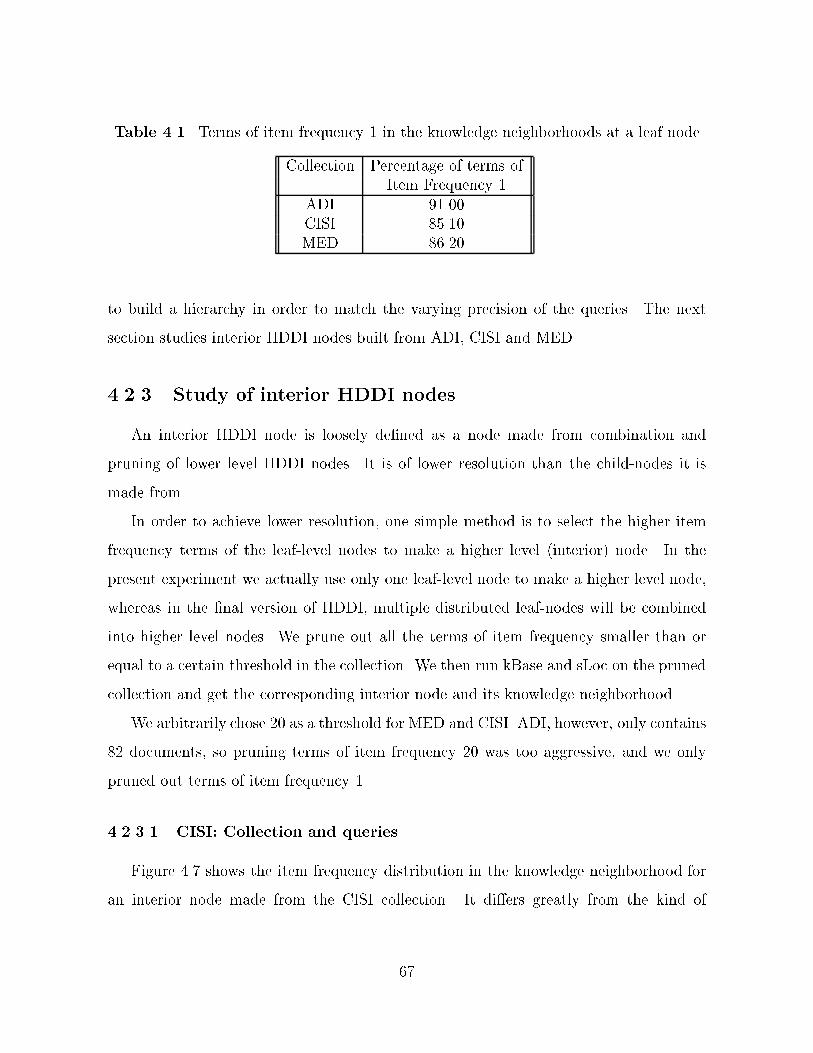
Table ��� Terms of item frequency � in the knowledge neighborhoods at a leaf node
Collection Percentage of terms ofItem Frequency �
ADI �����CISI �����MED � ���
to build a hierarchy in order to match the varying precision of the queries� The next
section studies interior HDDI nodes built from ADI� CISI and MED�
����� Study of interior HDDI nodes
An interior HDDI node is loosely de�ned as a node made from combination and
pruning of lower level HDDI nodes� It is of lower resolution than the child�nodes it is
made from�
In order to achieve lower resolution� one simple method is to select the higher item
frequency terms of the leaf�level nodes to make a higher level �interior node� In the
present experiment we actually use only one leaf�level node to make a higher level node�
whereas in the �nal version of HDDI� multiple distributed leaf�nodes will be combined
into higher level nodes� We prune out all the terms of item frequency smaller than or
equal to a certain threshold in the collection� We then run kBase and sLoc on the pruned
collection and get the corresponding interior node and its knowledge neighborhood�
We arbitrarily chose �� as a threshold for MED and CISI� ADI� however� only contains
�� documents� so pruning terms of item frequency �� was too aggressive� and we only
pruned out terms of item frequency ��
������� CISI Collection and queries
Figure ��� shows the item frequency distribution in the knowledge neighborhood for
an interior node made from the CISI collection� It diers greatly from the kind of
�
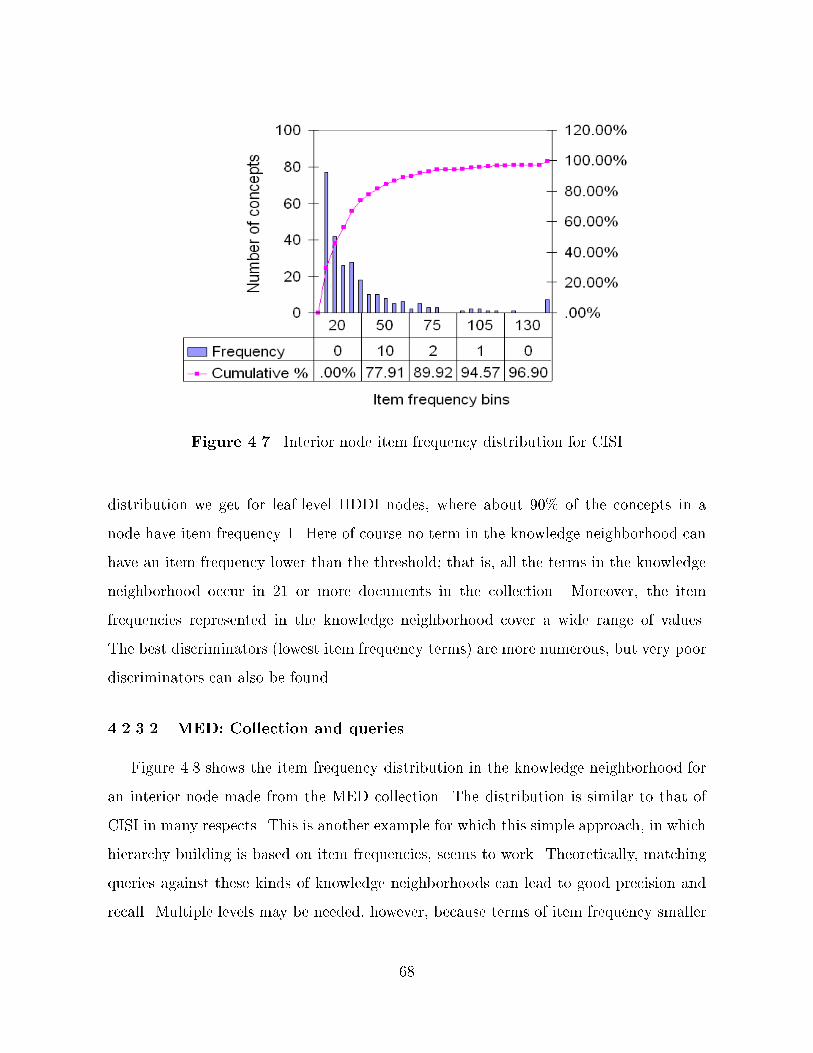
Figure �� Interior node item frequency distribution for CISI
distribution we get for leaf�level HDDI nodes� where about ��! of the concepts in a
node have item frequency �� Here of course no term in the knowledge neighborhood can
have an item frequency lower than the threshold� that is� all the terms in the knowledge
neighborhood occur in �� or more documents in the collection� Moreover� the item
frequencies represented in the knowledge neighborhood cover a wide range of values�
The best discriminators �lowest item frequency terms are more numerous� but very poor
discriminators can also be found�
������� MED Collection and queries
Figure ��� shows the item frequency distribution in the knowledge neighborhood for
an interior node made from the MED collection� The distribution is similar to that of
CISI in many respects� This is another example for which this simple approach� in which
hierarchy building is based on item frequencies� seems to work� Theoretically� matching
queries against these kinds of knowledge neighborhoods can lead to good precision and
recall� Multiple levels may be needed� however� because terms of item frequency smaller
�
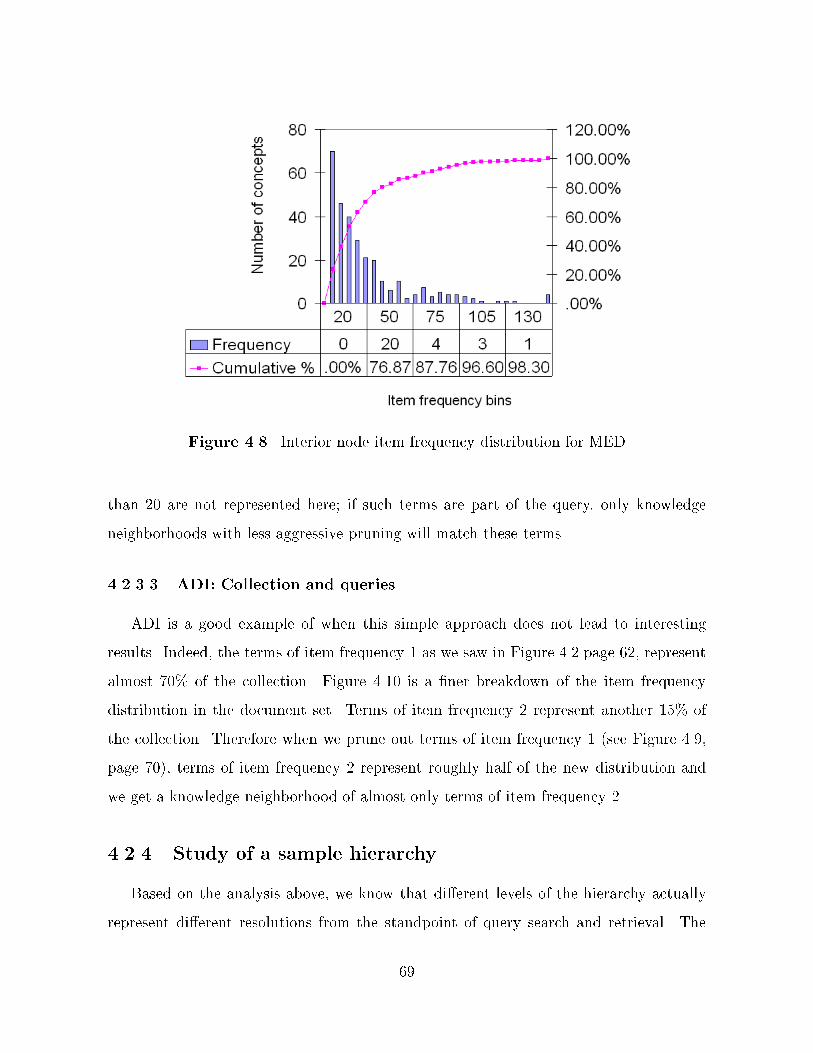
Figure ��� Interior node item frequency distribution for MED
than �� are not represented here� if such terms are part of the query� only knowledge
neighborhoods with less aggressive pruning will match these terms�
������� ADI Collection and queries
ADI is a good example of when this simple approach does not lead to interesting
results� Indeed� the terms of item frequency � as we saw in Figure ��� page �� represent
almost ��! of the collection� Figure ���� is a �ner breakdown of the item frequency
distribution in the document set� Terms of item frequency � represent another ��! of
the collection� Therefore when we prune out terms of item frequency � �see Figure ����
page ��� terms of item frequency � represent roughly half of the new distribution and
we get a knowledge neighborhood of almost only terms of item frequency ��
����� Study of a sample hierarchy
Based on the analysis above� we know that dierent levels of the hierarchy actually
represent dierent resolutions from the standpoint of query search and retrieval� The
�
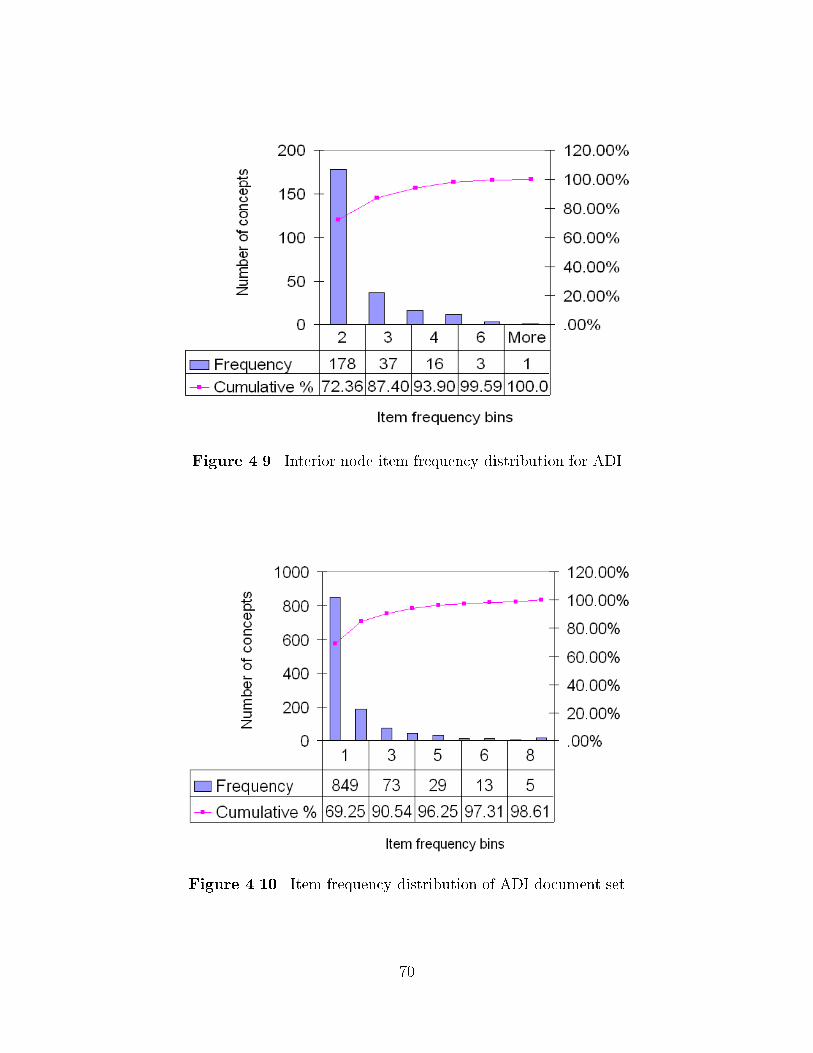
Figure ��� Interior node item frequency distribution for ADI
Figure ���� Item frequency distribution of ADI document set
��
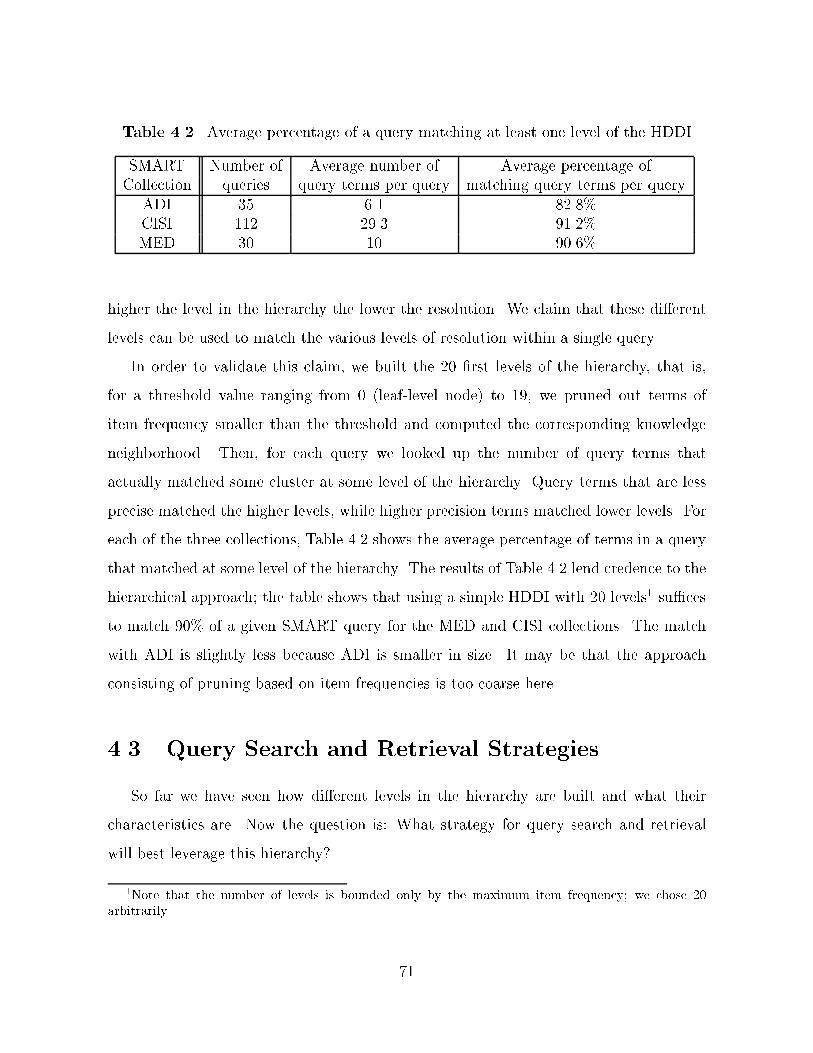
Table ��� Average percentage of a query matching at least one level of the HDDI
SMART Number of Average number of Average percentage ofCollection queries query terms per query matching query terms per query
ADI �� �� ����!CISI ��� ���� ����!MED �� �� ��� !
higher the level in the hierarchy the lower the resolution� We claim that these dierent
levels can be used to match the various levels of resolution within a single query�
In order to validate this claim� we built the �� �rst levels of the hierarchy� that is�
for a threshold value ranging from � �leaf�level node to ��� we pruned out terms of
item frequency smaller than the threshold and computed the corresponding knowledge
neighborhood� Then� for each query we looked up the number of query terms that
actually matched some cluster at some level of the hierarchy� Query terms that are less
precise matched the higher levels� while higher precision terms matched lower levels� For
each of the three collections� Table ��� shows the average percentage of terms in a query
that matched at some level of the hierarchy� The results of Table ��� lend credence to the
hierarchical approach� the table shows that using a simple HDDI with �� levels� su�ces
to match ��! of a given SMART query for the MED and CISI collections� The match
with ADI is slightly less because ADI is smaller in size� It may be that the approach
consisting of pruning based on item frequencies is too coarse here�
��� Query Search and Retrieval Strategies
So far we have seen how dierent levels in the hierarchy are built and what their
characteristics are� Now the question is� What strategy for query search and retrieval
will best leverage this hierarchy
�Note that the number of levels is bounded only by the maximum item frequency� we chose �arbitrarily�
��
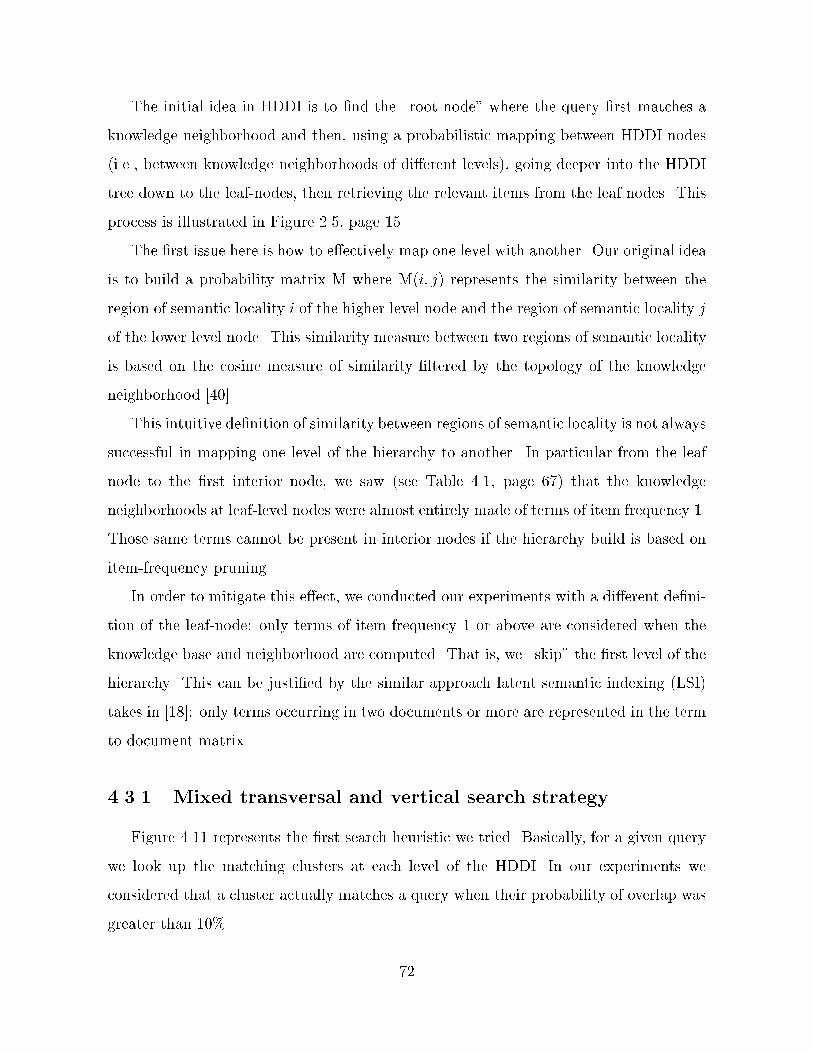
The initial idea in HDDI is to �nd the �root node� where the query �rst matches a
knowledge neighborhood and then� using a probabilistic mapping between HDDI nodes
�i�e�� between knowledge neighborhoods of dierent levels� going deeper into the HDDI
tree down to the leaf�nodes� then retrieving the relevant items from the leaf nodes� This
process is illustrated in Figure ���� page ���
The �rst issue here is how to eectively map one level with another� Our original idea
is to build a probability matrix M where M�i� j represents the similarity between the
region of semantic locality i of the higher level node and the region of semantic locality j
of the lower level node� This similarity measure between two regions of semantic locality
is based on the cosine measure of similarity �ltered by the topology of the knowledge
neighborhood �����
This intuitive de�nition of similarity between regions of semantic locality is not always
successful in mapping one level of the hierarchy to another� In particular from the leaf
node to the �rst interior node� we saw �see Table ���� page � that the knowledge
neighborhoods at leaf�level nodes were almost entirely made of terms of item frequency ��
Those same terms cannot be present in interior nodes if the hierarchy build is based on
item�frequency pruning�
In order to mitigate this eect� we conducted our experiments with a dierent de�ni�
tion of the leaf�node� only terms of item frequency � or above are considered when the
knowledge base and neighborhood are computed� That is� we �skip� the �rst level of the
hierarchy� This can be justi�ed by the similar approach latent semantic indexing �LSI
takes in ����� only terms occurring in two documents or more are represented in the term
to document matrix�
����� Mixed transversal and vertical search strategy
Figure ���� represents the �rst search heuristic we tried� Basically� for a given query
we look up the matching clusters at each level of the HDDI� In our experiments we
considered that a cluster actually matches a query when their probability of overlap was
greater than ��!�
��
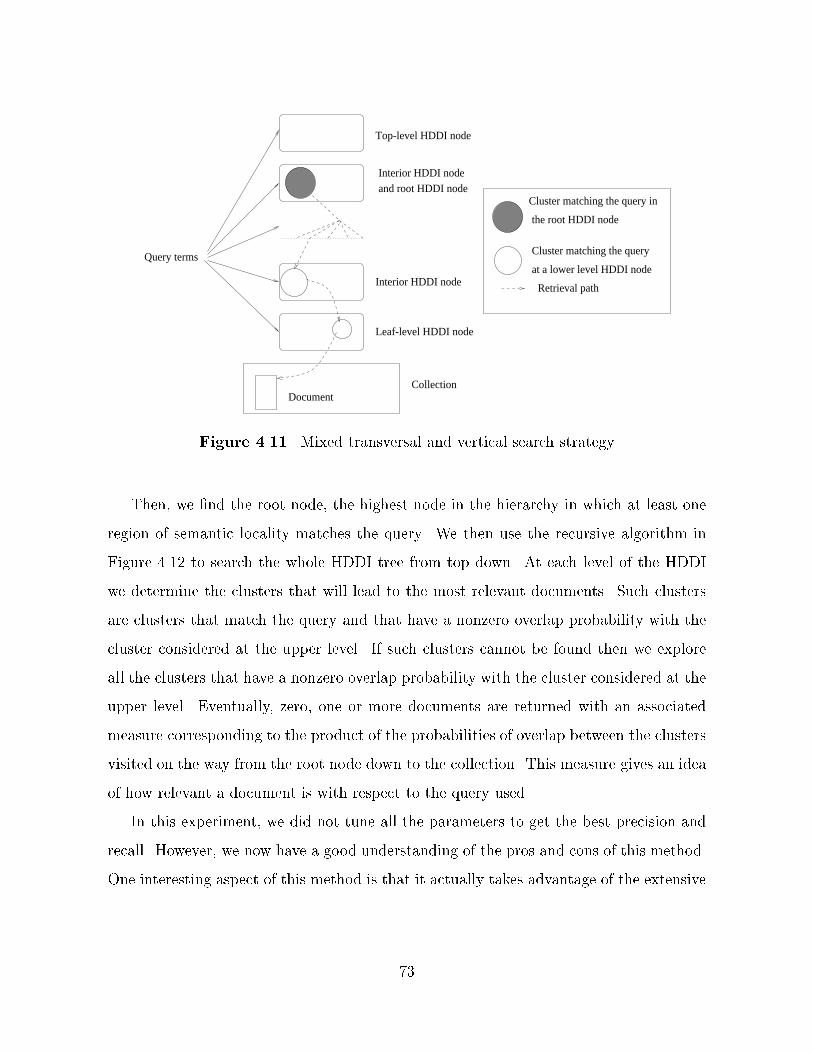
Top-level HDDI node
Collection
Leaf-level HDDI node
Interior HDDI node
Document
Interior HDDI nodeand root HDDI node
Retrieval path
Cluster matching the query in
the root HDDI node
Cluster matching the query
at a lower level HDDI nodeQuery terms
Figure ���� Mixed transversal and vertical search strategy
Then� we �nd the root node� the highest node in the hierarchy in which at least one
region of semantic locality matches the query� We then use the recursive algorithm in
Figure ���� to search the whole HDDI tree from top down� At each level of the HDDI
we determine the clusters that will lead to the most relevant documents� Such clusters
are clusters that match the query and that have a nonzero overlap probability with the
cluster considered at the upper level� If such clusters cannot be found then we explore
all the clusters that have a nonzero overlap probability with the cluster considered at the
upper level� Eventually� zero� one or more documents are returned with an associated
measure corresponding to the product of the probabilities of overlap between the clusters
visited on the way from the root node down to the collection� This measure gives an idea
of how relevant a document is with respect to the query used�
In this experiment� we did not tune all the parameters to get the best precision and
recall� However� we now have a good understanding of the pros and cons of this method�
One interesting aspect of this method is that it actually takes advantage of the extensive
��
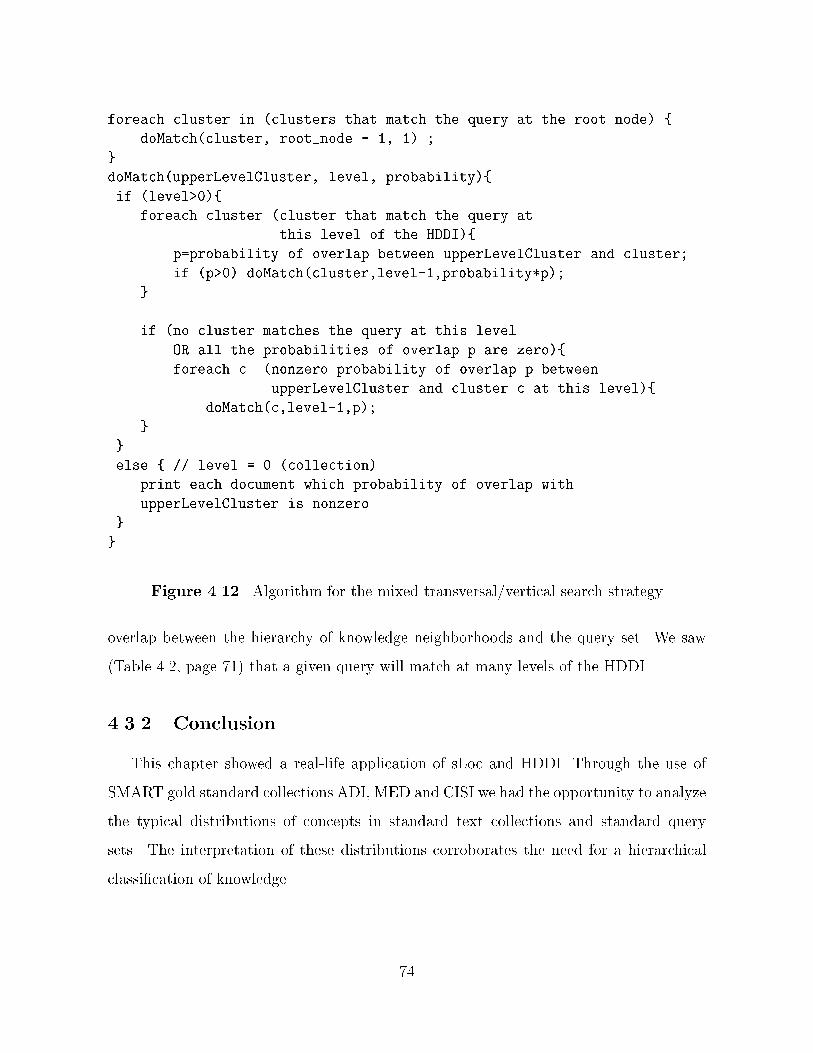
foreach cluster in �clusters that match the query at the root node� �
doMatch�cluster� root�node � �� �� �
doMatch�upperLevelCluster� level� probability��
if �level����
foreach cluster �cluster that match the query at
this level of the HDDI��
p�probability of overlap between upperLevelCluster and cluster�
if �p��� doMatch�cluster�level���probability�p��
if �no cluster matches the query at this level
OR all the probabilities of overlap p are zero��
foreach c �nonzero probability of overlap p between
upperLevelCluster and cluster c at this level��
doMatch�c�level���p��
else � level � � �collection�
print each document which probability of overlap with
upperLevelCluster is nonzero�
Figure ���� Algorithm for the mixed transversal�vertical search strategy
overlap between the hierarchy of knowledge neighborhoods and the query set� We saw
�Table ���� page �� that a given query will match at many levels of the HDDI�
����� Conclusion
This chapter showed a real�life application of sLoc and HDDI� Through the use of
SMART gold standard collections ADI� MED and CISI we had the opportunity to analyze
the typical distributions of concepts in standard text collections and standard query
sets� The interpretation of these distributions corroborates the need for a hierarchical
classi�cation of knowledge�
��

We built HDDIs for ADI� MED and CISI and veri�ed that on average more than ��!
of the query terms in a query mapped to one or more level of the HDDI� These results
�see Table ���� page �� lend credence to the hierarchical approach� Using a simple HDDI
with �� levels su�ces to match ��! of a given SMART query for the MED and CISI
gold standard collections and ��! for ADI�
Finally� we designed a simple search strategy to map SMART queries onto an HDDI�
This �rst�pass strategy helped us identify some of the key factors of a good retrieval
strategy using HDDI�
��
CHAPTER �
CONCLUSIONS AND FUTURE
WORK
The HDDI project started less than a year ago now� A lot has already been achieved�
but the project is still in its infancy� The main purpose of this thesis was to give an
overview of the tools� measures and issues related to sLoc and HDDI�
This thesis summarized my work on the HDDI project� My main focus has been
sLoc� the algorithm we use in HDDI to identify the regions of semantic locality� but
I also brought my contribution to the conception of the HDDI architecture� In this
chapter� I will identify our key discoveries with sLoc and HDDI and give guidelines for
future work�
��� Regions of Semantic Locality and sLoc
In order to build an HDDI� we need to cluster the knowledge base graph of each HDDI
node� After a thorough study of existing IR clustering techniques� we decided to design
our own algorithm to cluster HDDI knowledge bases based on contextual transitivity�
sLoc� This algorithm meets the requirements of HDDI in terms of complexity� it is linear
and therefore allows dynamic identi�cation of regions of semantic locality�
Note that other IR techniques may also use an approach akin to contextual transitiv�
ity� In particular� latent semantic indexing �LSI is based on a similar principle ����� In
LSI� the term�to�document matrix is modi�ed using a truncated singular value decom�
position �SVD� The truncated SVD creates a new space of lower dimension� The use of
�
this new space enables the discovery of hidden relationships between concepts� Quoting
Susan Dumais �����
The approach is to take advantage of implicit higher�order structure in the as�
sociation of terms with documents ��semantic structure� in order to improve
the detection of relevant documents on the basis of terms found in queries�
We have the intuition that what Dumais refers to as taking advantage of �implicit higher�
order structure in the association of terms with documents� is actually akin to using some
sort of contextual transitivity to discover �latent� relationships between terms� Further
mathematical research is needed to determine how LSI and contextual transitivity are
related�
In order to assess the quality of the clustering� we designed micro� and macrometrics�
We arrived at an optimization function F which uses a subset of these metrics to de�ne
a desirable clustering� We provided the reader with experiments and their interpretation
to give a qualitative understanding of how these metrics and optimization function work�
In Chapter �� we saw how� using sLoc� we could get a knowledge neighborhood at each
level of the HDDI� Using the �rst �� levels of the HDDI� the corresponding knowledge
neighborhoods identi�ed by sLoc successfully matched about ��! of the terms of standard
queries for MED� CISI and ADI�
Now� open issues are still to be addressed in sLoc� More speci�cally� some parameters
in sLoc have been set empirically� and research can be done to determine more accurately
how they can in�uence the results�
For example� s� the minimum number of concepts for a region of semantic locality to
be valid� has been set to two� That is� we made the assumption that the �nal application
of sLoc and HDDI values regions of semantic locality even if they contain only two
concepts� Depending on the context and on the particular application� s may have to
take a larger value�
Another issue is how to evaluate the performance of F� the optimization function
used in sLoc to determine how aggressive the thresholding must be� This performance
��
de�nitely depends on the type of application� In the case of query search and retrieval�
we got good results in terms of coverage �about ��! of the terms of standard queries for
MED� CISI and ADI� but using our mixed transversal and vertical search strategy� one
issue that arose was the presence of large regions of semantic locality� The bottom line
is that tuning of the optimization function F has to be done as part of the whole query
strategy� That is why we focused on de�ning metrics and explaining how to make use of
them� rather than spending time tuning F�
Yet another issue with sLoc is how it will scale to cases where multiple repositories are
combined into one single knowledge base� In other words� how will sLoc behave when we
will start to build the hierarchy out of multiple repositories Here as well the performance
of sLoc is completely left up to the designer of the hierarchy build algorithm� Using the
various metrics we introduced� F will be tuned� Experiments have to be carried out for
each application in order to determine what feature of sLoc is most important� it may
be coverage� sometimes intracluster density� and sometimes only intercluster density may
matter� We see sLoc as a highly �exible tool� fast and versatile� now only the application
designer will know how to get the best out of it�
��� Hierarchical Classi�cation of Knowledge and HDDI
Our basic premise in HDDI is that� to eectively process information in a dynamic
and scalable way� we need to organize it according to a hierarchical classi�cation�
The validation experiments carried out in Chapter � con�rmed the need for building a
hierarchy of HDDI nodes� The �rst reason is to not only overcome� but also leverage the
band�pass eect of most indexing algorithms that will narrow down the resolution of an
index to a given quality of discriminators� Second� building a hierarchical classi�cation
of knowledge is a signi�cant aid in conceptual search� well�known search engines such as
Yahoo� do use a hierarchical classi�cation to match the way people would intuitively go
about searching information� Third� queries� by nature� are not organized according to a
��
hierarchical structure� they have their own internal structure and we need to match this
structure in order to achieve maximum precision and recall�
We designed and implemented a �rst�pass search and retrieval strategy using HDDI�
We learned a lot from the results� On the one hand� the strategy works well for the cases
when regions of semantic locality at adjacent levels overlap well and relevant documents
are identi�ed� On the other hand� we noticed two main issues� First� the retrieval path
from the root node to the collection is sometimes discontinuous� That is� a region of
semantic locality at one level of the HDDI does not overlap with any region of semantic
locality at the HDDI node right below� Second� large clusters in some HDDI nodes can
lead to signi�cant loss in precision�
Alternatives can be found to improve the performance of our search and retrieval
system� We can take any of the following courses�
� Modify our strategy� that is� modify the way the retrieval paths through the HDDI
are determined�
� Tune the parameters in sLoc to get dierent knowledge neighborhoods� We have
been using the optimization function F �see Equation ������ page �� to determine
the threshold � used in sLoc� other values of � would lead to other types of clustering
and eventually to other relevance judgments�
� Change the way the hierarchy is built� using another pruning approach based on
properties other than item frequency�
� Use a dierent approach to computing similarities between regions of semantic
locality using� for example� co�occurrence matrices�
� Change the way kBase computes the arc weights to avoid homogeneous knowledge
neighborhoods with respect to item frequency�
With respect to implementation� HDDI will eventually distributed across dierent
systems� New issues will arise when addressing this implementation� such as naming�
��
synchronization and all the traditional issues of distributed computing� We are aware of
them� and although not tackled in this thesis� they are part of our constraints in designing
the system framework�
As explained in Section ������ in designing an IR system there are some research
issues that have to be considered on the way� Although the HDDI architecture answers
some of these� other features of HDDI are left to be adapted to a particular application�
Speci�cally� in its present version the HDDI model does not explicitly de�ne the way
queries would be entered� Another issue� as we saw� is the strategy used to map the
query onto the HDDI� Finally� besides precision and recall analysis� other indicators of
relevance might come into play�
��� Other Applications
In this thesis� I focused on the query search and retrieval application of HDDI� but
extensive research is being carried out at NCSA in detection of emerging conceptual con�
tents and targeted marketing analysis� Hopefully� the tools� measures and understanding
we obtained from the standpoint of query search and retrieval will bene�t other appli�
cations as well� Finally� as we improve our understanding of the potential of HDDI� we
can expect new application ideas to emerge from our research eorts�
��
REFERENCES
��� Los Alamos National Laboratory� �arXiv�org e�Print archive�� http���xxx�lanl�gov�
�����
��� National Research Council CSTB� Computing The Future� Washington DC� National
Academy Press� �����
��� C� J� van Rijsbergen� Information Retrieval� London� Butterworths� �����
��� R� B� Korfhage� Information Storage and Retrieval� New York� Wiley� �����
��� R� B� Korfhage and T� G� DeLutis� �A basis for time and cost evaluation in informa�
tion systems�� The Information Bazar� Proceedings of the Sixth Annual Colloquium
on Information Retrieval� pp� ������ � �� ��
� � C� W� Cleverdon� �On the inverse relationship of recall and precision�� Journal of
Documentation� vol� ��� pp� �������� �����
��� G� Salton� Dynamic Information and Library Processing� Englewood Clis� New
Jersey� Prentice Hall� �����
��� G� Salton and M� McGill� Introduction to Modern Information Retrieval� New York�
McGraw�Hill� �����
��� K� S� Jones� Automatic Keyword Classi�cation for Information Retrieval� London�
Butterworths� �����
���� H� P� Luhn� �A statistical approach to mechanised encoding and searching of library
information�� IBM Journal of Reasearch and Development� vol� �� pp� �������� �����
��
���� M� E� Maron and J� L� Kuhns� �On relevance� probabilistic indexing and information
retrieval�� Journal of the ACM� vol� �� pp� �� ����� �� ��
���� H� F� Stiles� �The association factor in information retrieval�� Journal of the ACM�
vol� �� pp� �������� �� ��
���� M� E� Stevens� V� E� Guiliano� and L� B� Heilprin� Statistical Association Methods
for Mechanized Documentation� Washington DC� National Bureau of Standards�
�� ��
���� I� J� Good� �Speculations concerning information retrieval�� Tech� Rep� PC���� IBM
Research Centre� New York� �����
���� R� A� Fairhorne� The Mathematics of Classi�cation� London� Butterworths� �� ��
�� � L� B� Doyle� �Is automatic classi�cation a reasonable application of statistical anal�
ysis of text � Journal of the ACM� vol� ��� pp� �������� �� ��
���� J� J� Rocchio� �Document retrieval systems � optimization and evaluation�� PhD
thesis� Harvard University� �� � Report ISR��� to National Science Foundation�
Harvard Computation Laboratory�
���� S� T� Dumais� M� W� Berry� and G� W� O�Brien� �Using linear algebra for intelligent
information retrieval�� SIAM Review� vol� ��� no� �� pp� �������� �����
���� C� W� Cleverdon� �Report on the testing and analysis of an investigation into the
comparative e�ciency of indexing systems�� tech� rep�� College of Aeronautics� Cran�
�eld� UK� �� ��
���� G� Salton� �Automatic text analysis�� Science� vol� � �� pp� �������� �����
���� S� E� Robertson� �Retrieval and relevance� On the evaluation of IR systems�� The
ISI Lazerow Lecture� November �����
���� D� K� Harman �ed�� �The �rst text retrieval conference �trec���� NIST Special
Publication ���� �����
��
���� C� Lynch and H� Garcia�Molina� �Interoperability� scaling� and the digital libraries
research�� in �� IITA Digital Libraries Workshop� May �����
���� H� Chen and K� J� Lynch� �Automatic construction of networks of concepts charac�
terizing document databases�� IEEE Transactions on Systems� Man and Cybernet�
ics� vol� ��� pp� �������� September �����
���� W� M� Pottenger� �Theory� techniques� and experiments in solving recurrences in
computer programs�� PhD thesis� Univ� of Illinois at Urbana�Champaign� Center
for Supercomputing Res� " Dev�� May �����
�� � N� Jardine and R� Sibson� �A model for taxonomy��Mathematical Biosciences� vol� ��
pp� � ������ May �� ��
���� B� Hendrickson and R� Leland� �The Chaco user�s guide� version ����� Tech� Rep�
SAND���� ��� Sandia� �����
���� G� Karypis and V� Kumar� �Multilevel k�way hypergraph partioning�� Tech� Rep�
����� � University of Minnesota CS"E� �����
���� B��H� Wang� �Texture segmentation of SAR images�� in Proceedings of Image Un�
derstanding Workshop� May �����
���� J� F� Sowa� Conceptual Structures� Information Processing in Mind and Machine�
Reading� MA� Addison�Wesley� �����
���� G� W� Mineau and R� Godin� �Automatic structuring of knowledge bases by con�
ceptual clustering�� IEEE Transactions on Knowledge and Data Engineering� vol� ��
pp� �������� October �����
���� R� Sablowski and A� Frick� �Automatic graph clustering �system demonstration�� in
Proceedings of the Symposium on Graph Drawing� GD ���� Berkeley� CA� September
��� �
��
���� H� Sch�utze� �Automatic word sense discrimination�� Computational Linguistics�
vol� ��� no� �� pp� ������� �����
���� E��H� Han� G� Karypis� and V� Kumar� �Clustering in a high�dimensional space
using hypergraph models�� Tech� Rep� ���� �� University of Minesota� �����
���� J� A� Hartigan and M� A� Wong� �Algorithm �� � a k�means clustering algorithm��
Applied Statistics� vol� ��� p� ���� �����
�� � P� Cheeseman� M� Self� J� Kelly� W� Taylor� D� Freeman� and J� Stutz� �Bayesian
classi�cation�� in Seventh National Conference on Arti�cial Intelligence� Saint Paul�
MN� pp� ��� ��� �����
���� R� E� Tarjan� �Depth �rst search and linear graph algorithms�� SIAM J� Computing�
vol� �� pp� �� � �� �����
���� A� V� Aho� J� E� Hopcroft� and J� Ullman� The Design and Analysis of Computer
Algorithms� Reading� MA� Addison�Wesley� �����
���� W� Blume� R� Doallo� R� Eigenmann� J� Grout� J� Hoe�inger� T� Lawrence� J� Lee�
D� Padua� Y� Paek� W� Pottenger� L� Rauchwerger� and P� Tu� �Parallel program�
ming with Polaris�� IEEE Computer� vol� ��� pp� ������ December ��� �
���� W� M� Pottenger and D� Zelenko� �Concept space comparison and validation�� Tech�
Rep� UIUCDCS�R��������� University of Illinois at Urbana�Champaign CS� Decem�
ber �����
��