Embed Size (px)
Citation preview
RA Economics and institutional change
Absorptive Capacity and Efficiency: A Comparative
Stochastic Frontier Approach Using Sectoral Data
Letizia Montinari Michael Rochlitz
ISSN 2279-6894 IMT LUCCA EIC WORKING
PAPER SERIES 04 June 2012
#04 2012

ISSN 2279-6894
IMT LUCCA EIC WORKING PAPER SERIES #04/2012 © IMT-Institutions, Markets, Technologies, Institute for Advanced Studies, Lucca
Piazza San Ponziano 6, 55100 Lucca
Research Area
Economics and institutional change
Absorptive Capacity and Efficiency: A Comparative Stochastic Frontier Approach Using Sectoral Data
Letizia Montinari IMT Institute for Advanced Studies Lucca
Michael Rochlitz IMT Institute for Advanced Studies Lucca
Absorptive Capacity and Efficiency: A ComparativeStochastic Frontier Approach Using Sectoral Data
Letizia Montinari∗& Michael Rochlitz†
Abstract
In this paper, we investigate differences in and determinants of technical efficiency acrossthree groups of OECD, Asian and Latin American countries. As technical efficiency deter-mines the capacity with which countries absorb technology produced abroad, these differ-ences are important to understand differences in growth and productivity across countries,especially for developing countries which depend to a large extend on foreign technology.Using a stochastic frontier framework and data for 22 manufacturing sectors for 1996-2005,we find notable differences in technical efficiency between the three country groups we ex-amine. We then investigate the effect of human capital and domestic R&D, proxied by thestock of patents, on technical efficiency. We find that while human capital has always astrongly positive effect on efficiency, an increase in the stock of patents has positive effectson efficiency in high-tech sectors, but negative effects in low-tech sectors.
1 IntroductionDespite the emergence of newly industrialized economies and an increasing fragmentation ofglobal production, most innovations are still carried out in a small number of R&D-intensivecountries (Eaton and Kortum 2001, Caselli and Wilson 2004). The large majority of developingand newly industrialized countries import technology from these countries (Mastromarco 2008).Gerschenkron (1962) and Abramovitz (1986) have argued that developing countries have ahigher growth potential than advanced countries, as they can realize larger productivity gainsin adopting advanced technologies. In a theoretical paper, Acemoglu et al. (2006) formalizedthe idea that developing countries should focus on adopting foreign technology before startingto innovate themselves. According to the case study literature, this is indeed what happened innewly industrialized countries such as South Korea, Taiwan or more recently China (Amsden1989, 2001, Wade 1990, Breznitz and Murphree 2011). In all these economies, the capacity tosuccessfully absorb foreign technology has played a crucial role in sustaining high growth rates.
Understanding differences in absorptive capacity is thus key to understand the large dif-ferences in productivity and income across countries (Prescott 1998). While the technologicaldistance from R&D-intensive countries determines the scale of potential benefits from importingtechnology, and trade liberalization opens up channels of technology transfer, the ability of acountry to absorb imported technology is crucial to realize the potential gains from catching-upand trade.
The aim of this paper is to examine levels of technical efficiency and determinants of ab-sorptive capacity for two groups of industrialized and emerging economies in Asia and LatinAmerica, and a group of European OECD countries that also includes the US. While this last
∗PhD Candidate in Economics, Markets and Institutions at IMT Institute for Advanced Studies Lucca (Italy),[email protected]
†PhD Candidate in Economics, Markets and Institutions at IMT Institute for Advanced Studies Lucca (Italy),[email protected]
1
group is composed of countries that have been leading industrialized nations for a long time,the Asian and Latin American countries in our sample, with the exception of Japan, are mostlydeveloping and newly industrialized economies. Comparing these three country groups permitsus to investigate if efficiency levels and determinants of absorptive capacity systematically differacross regions that are at different levels of economic development, and share different politicaland historical contexts.
We use stochastic frontier analysis (SFA) and sectoral data, which permits us to treat techni-cal efficiency and technical change as two distinct components of total factor productivity (TFP)in each industry. SFA allows us to simultaneously estimate levels and determinants of technicalefficiency, with technical efficiency being a close approximation of the concept of absorptivecapacity we have in mind.
Instead of using SFA, most previous studies in the absorptive capacity literature have em-ployed a two-stage modelling strategy (Senhadji 2000, Miller and Upadhyay 2000, Madden etal. 2001, Okabe 2002, Wang 2007, Madsen et al. 2010), which however suffers from a numberof flaws (that we discuss in section 2). The few studies using SFA have either focused on OECDcountries (Griffith et al. 2003, 2004, Kneller and Stevens 2006), or have used aggregate data(Mastromarco 2008, Henry et al. 2009), and do not have data for recent years.
Using sectoral instead of aggregate data permits us to get more precise results, and to distin-guish between effects on low-tech and high-tech sectors. As sectoral data has become availableonly recently for many developing countries, this paper is the first one, to our knowledge, thatcombines SFA with the use of sectoral data for both developed and developing countries.
We investigate the effect of two potential determinants of absorptive capacity, namely humancapital measured by years of schooling, and the effectiveness of domestic R&D, proxied by thestock of patents filed by a country. While most previous studies have either examined the effectsof human capital (Nelson and Phelps 1966, Cohen and Levinthal 1989, Benhabib and Spiegel1994, 2005) or R&D expenditure (Verspagen 1991, Fagerberg 1994, Aghion and Howitt 2005)on absorptive capacity, we follow more recent studies that look on both determinants (Knellerand Stevens 2006). However, instead of R&D expenditure we use stock of patents as a proxyfor R&D, which to our knowledge has not been done before in this context.
The contributions of this paper to the literature are thus twofold. To our knowledge, thispaper is the first using SFA and sectoral data to comparatively analyse efficiency levels anddeterminants of absorptive capacity across three groups of developed and developing countries.Secondly, instead of R&D expenditure, we introduce the use of stock of patents as a proxy forR&D to the absorptive capacity literature.
We find that levels of technical efficiency slightly increase over the time span covered in ourstudy, with the exception of Latin America, where efficiency in high-tech sectors experiences asharp drop after 1999. A temporary drop in high-tech efficiency, albeit less pronounced, is alsonoticeable for Asia and OECD countries after 1999. While in Europe low-tech sectors are onaverage more efficienct than high-tech sectors, the opposite is the case for Asia and the US, withLatin America showing mixed results. Looking on the determinants of technical efficiency, wefind that human capital has always a strongly positive effect on efficiency, especially in low-techsectors. An increase in the stock of patents has positive effects on efficiency in high-tech sectors,but negative effects in low-tech sectors, especially for Asia and Latin America.
In the following, section 2 will discuss our empirical strategy, and section 3 presents the data.Section 4 shows the results for our frontier estimation, the efficiency levels and for determinantsof technical efficiency, and section 5 concludes.
2 Empirical strategyWe use stochastic frontier analysis (SFA), as it provides an ideal framework to estimate technicalinefficiency. SFA is prefered to the more popular two-stage modelling approach used in most of
2
the previous literature, since it is statistically more accurate and matches more closely the ideaof absorptive capacity we want to capture. The two-stage approach consists in estimating TFPas residual of a parameterized production function, and then regressing it against a numberof factors which are considered to be linked to changes in productivity (Senhadji 2000, Millerand Upadhyay 2000, Madden et al. 2001, Okabe 2002, Wang 2007, Madsen et al. 2010).However, Koop et al. (1999, 2000) point out that while in the first stage of this approach theefficiency terms are assumed to be identically and independently distributed, in the second stagethey are a function of a number of variables which might directly enter the production functionspecification (or be correlated with explanatory variables), thereby contradicting the assumptionof identically distributed inefficiency terms (Battese and Coelli 1995, pp. 326). SFA overcomesthis problem by assuming that technical inefficiency effects of production are independently butnot identically distributed, and then by simultaneously estimating the stochastic frontier andthe inefficiency model.
Another important feature of SFA is that it allows us to distinguish between technicalprogress, technical efficiency, and a stochastic component of TFP. This distinction is omit-ted in the two-stage approach, where TFP is used as a measure of technical inefficiency. A thirdcriticism concerns the use of the country with the highest TFP as the numeraire in a measureof relative productivity, to account for the distance to the technical frontier (Griffth et al. 2004,Kneller 2005). This approach is based on two unrealistic assumptions. First, it assumes thatthe country with the highest TFP is at the frontier, which might not be true. Secondly, itassumes that a unique technology frontier exists for all countries. In the SFA approach, theconcept of absorptive capacity is instead related to that of production frontier, which representsthe maximum output that can be produced starting from any given input vector (i.e. the upperboundary of the production possibilities set).
Our emprical strategy is based on that of Battese and Coelli (1995). Following their formu-lation, the stochastic production frontier can be expressed as
Yijt = exp(xijtβ + Vijt − Uijt) (1)
where Yijt is output, xijt is a vector of inputs of production, β is a vector of parameters tobe estimated, Vijt are random errors which capture the stochastic nature of the frontier, andUijt are non-negative random variables which denote technical inefficiency of production andare obtained by a truncation at zero of the normal distribution with mean zitδ and varianceσ2(see Battese and Coelli 1995).
The technical inefficiency effect is specified by the following equation
Uijt = zitδ + Wijt (2)
where zit is a vector of explanatory variables associated with technical inefficiency of pro-duction, δ is a vector of unknown coefficients, and Wijt is a random variable defined by thetruncation of a normal distribution with zero mean and variance σ2. The requirement thatUijt ≥ 0 is ensured by truncating Wijt such that Wijt ≥ −zijtδ.
The parameters of equations (1) and (2) are estimated simultaneously by the method ofmaximum likelihood.1The likelihood function is expressed in terms of the variance parametersσ2
S ≡ σ2V + σ2 and γ ≡ σ2
σ2S
.2 The technical efficiency of production of sector j in country i attime t is
TEijt = exp(−Uijt) = exp(−zitδ − Wijt) (3)
1The parameters of the model defined by (1) and (2) are estimated simultaneously using Frontier 4.1 whichis a package for SFA developed by Battese and Coelli. Frontier 4.1 provides maximum-likelihood estimates ofthe parameters and predicts technical efficiencies.
2For the derivation of the likelihood function and its partial derivatives with respect to the parameters of themodel see Battese and Coelli (1993).
3
The prediction of the technical efficiency terms is based on their conditional distributionUijt | Eijt where Eijt = Vijt − Uijt, given the model assumptions (See Battese and Coelli 1993).
To estimate equation (2), we assume a semi-translog specification (i.e. translog in k and l,as proposed by Kneller and Stevens 2003), which provides a less restrictive functional form fora production function
yijt = β0j + β1kijt + β2lijt + β3k2ijt + β4l2
ijt + β5kijtlijt
+β6pit + β7rit + β8year2 + β9ci + β10sj − uijt + vijt (4)
where all lower case letters represent logarithms.yijt is value added, kijtis physical capital, lijtis labour supply, pit is domestic knowledge
measured by local R&D and rit represents foreign knowledge spillovers, which are assumed tobe a function of the stock of R&D in the five countries that contribute most to the global stockof R&D.
We make the simplifying assumption that technology is factor-neutral, implying that outputis separable in the production function and technology, so that we can separate technologicalchange pit from efficiency uijt in TFP. A quadratic time trend, year2, is also included to measuretechnical progress not captured by local and foreign R&D.3 Finally, a set of country fixed effectsci and a set of sector fixed effects sj are included to control for country and sector specificcharacteristics.
Following Griliches and Lichtenberg (1984), knowledge is assumed to be an input in theproduction function. As Kneller and Stevens (2006), we assume that knowledge evolves withthe local stock of R&D and with foreign knowledge spillovers, capturing technical change. Tomeasure foreign R&D spillovers to the domestic economy, we follow Coe and Helpman (1995)and Henry et al. (2009). They use a bilateral-imports-share weighted sum of R&D capital stocksof trade partners. Using the same logic, we weight the stock of R&D of the five countries thatcontribute most to the total stock of R&D by the share of imported machinery and equipmentfrom these countries. This is motivated by the evidence that most of the world’s R&D isproduced in a small number of R&D-intensive countries and imported through R&D-intensiveinputs (Eaton and Kortum 2001, Caselli and Wilson 2004).
Finally, we assume that knowledge transfer is partial, depending on the degree of economicintegration across countries. Barriers to knowledge transfer are captured by weighting the stockof R&D by the distance to the source.
Rit =∑n=5
(Pnt ∗ mint
Din)
where n is an index for the five top countries, Pntis the stock of R&D in country n, min isthe share of machinery and equipment imported by country i from country n, and Din is thedistance between country i to country n.
Technical inefficiency is defined by
vijt = δoj + δ1zit + δ2lowtech ∗ zit + δ3hit + δ4lowtech ∗ hit + δ5si + wijt (5)
where, as before, all lower case letters represent logarithms.zit is stock of patents, hitis human capital, lowtech is a dummy variable taking value 1 when
the sector is low-tech and 0 otherwise, si are sector fixed effects, and wijt has been defined afterequation (2).
The impact of knowledge on inefficiency is captured by the stock of patents. To our knowl-edge, the use of stock of patents is new in the empirical literature on absorptive capacity. Kneller
3A similar assumption is made by Henry et al. (2009).
4
and Stevens (2006) use spending on R&D in the industry to measure the effect of knowledgeon inefficiency. In our analysis, we prefer to use stock of patents as a measure of knowledgefor two reasons: first we believe that stock of patents is a more reliable indicator of effectiveknowledge production in a country, and second we find stock of patents to be more robust tomulticollinearity problems, given the high correlation between spending in R&D and years ofschooling that we found (ρ = 0.77).
We use average years of schooling in country i as proxy for human capital. The effect of bothstock of patents and years of schooling is allowed to vary between high-tech and low-tech sectors.Finally, a set of sector fixed effects are added to control for sector specific characteristics. Ifthe stock of knowledge and human capital positively affect absorptive capacity in the high-techsectors, we should expect δ1 and δ3 to have a negative sign. In the low-tech sectors, we shouldexpect the sum of the coefficients for both the stock of patents and years of schooling to benegative (e.i. δ1 + δ2 < 0 and δ3 + δ4 < 0).
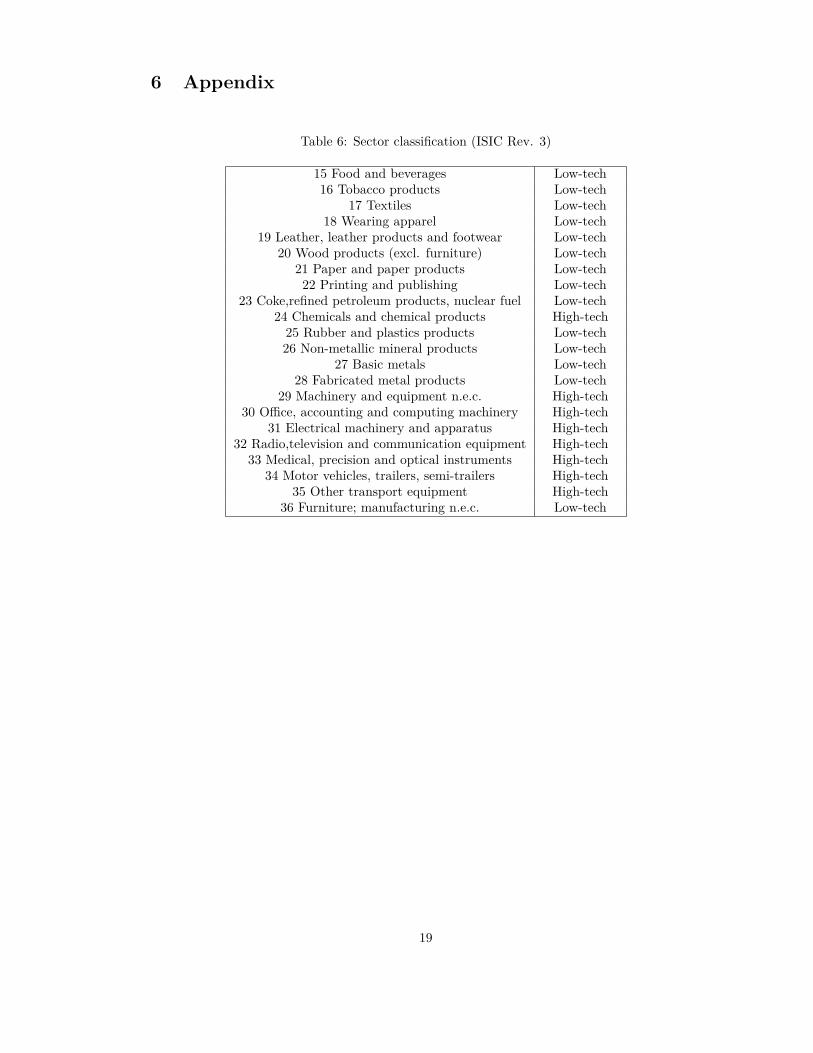
3 DataThe model is estimated for a sample of 10 European and North-American OECD countries(United Kingdom, United States, France, Germany, Italy, Belgium, Norway, Sweden, Nether-lands, Denmark), 7 Asian countries (China, India, Indonesia, Japan, Philippines, Singapore,South Korea), 5 Latin American countries (Bolivia, Chile, Colombia, Mexico, Uruguay) andfor twenty-two manufacturing industries over the period 1996-2005.4 We divide the 22 man-ufacturing sectors into high-tech and low-tech sectors, following the standard OECD sectorclassification.5
While the first group of 10 OECD countries is included as a benchmark, we have chosen theother two country groups from regions that are characterized by different historical and politicalpre-conditions, i.e. Asia and Latin America. Whereas the countries in the first group have beenamong the world’s leading industrialized nations for a long time, most countries in the two othergroups are developing and newly industrialized economies that are still at a much lower level ofeconomic development. Many of them share a recent history of successful economic catch-up,which makes them especially interesting for an analysis of absorptive capacity.
Our choice of countries was limited by the availability of sectoral data. Sectoral data is notyet available for many developing countries, and has only recently been made available for mostof the non-OECD countries in our sample. As of now, our sample is thus the largest possibleconsidering issues of data availability. Furthermore, we have exluded developing countries fromAfrica, as data availability was very limited and technology absorption has arguably played onlya marginal role in these countries until recently (Lall and Pietrobelli, 2002).
Data for valued added, gross fixed capital formation and number of employees are takenfrom the UNIDO ISDB database (3-4 digit level). Data are comparable across years, havingbeen deflated to 2000 prices and converted using measures of purchaising power parity (PPP)to US$. Both the GDP deflator and the PPP conversion factor are taken from World Bank.
The perpetual inventory method (PIM) is used to construct the capital stock.
Kijt+1 = Kijt + Iijt+1 − δKijt (6)
Kij0 = Iij0
gKi + δK
(7)
where Kij is capital stock of sector j in country i , Iij is capital formation/investment, δK
is the depreciation rate set at 4% (Liao et al. 2009), and gKi is the average growth in the first
five years of investment series.4Stock of R&D, years of schooling and number of patents are available only at the country level.5See Table 6 in the Appendix.
5
Human capital is measured by average years of schooling in the population in country i, andis taken from Barro and Lee (2010). The PIM is also used to compute stock of R&D using totalR&D expenditure in country i deflated to 2000 prices, and converted using measures of PPP toUS$.
Pit+1 = Pit + Rit+1 − δPit (8)
Pi0 = Ri0
gRi + δp
(9)
where Pi is the stock of R&D in country i, Ri is the expenditure in R&D, gRi is the average
annual growth rate of R&D and δRis the rate of depreciation of R&D stock that we set at 15%(Griliches 1984).
Data on patents are obtained from OECD. We use the triadic patent families which are a setof patents filed at the European Patent Office (EPO), the United States Patent and TrademarkOffice (USPTO), and the Japan Patent Office (JPO), for the same invention, by the sameapplicant. The PIM is used to compute the stock of patents:
Zit+1 = Zit + TPFit+1 − δZit (10)
Zi0 = TPFi0
gZi + δZ
(11)
where Zit is the stock of patents in country i, TPFi is the number of triadic patent families,gZ
i is the average annual growth rate of patents, and δZ is the depretiation rate set at 15% (Halland MacGarvie 2010).
Foreign R&D spillovers are computed using the stock of R&D of the United States, Japan,Germany, France and the United Kingdom, which are the countries which contributed mostto the stock of total R&D over the period 1996-2005. The share of imported machinery andequipment is calculated by using data on total imports and imported machinery and equipmentfrom UN Comtrade, deflated to 2000 prices and converted using measures of PPP to US$.
Distance between capital cities in kilometers is taken from Gleditsch (2003).For about 50% of our observations we have a balanced panel, while for more than 63% we
have 9 out of 10 years, and for almost 70% 8 out of 10 years. 6
Table 1 shows the basic descriptive statistics for all the variables of our analysis.
4 Results4.1 Frontier EstimatesWe report the results of our frontier estimation in Tables 2 and 3, with Table 2 showing frontierestimates, and Table 3 output elasticities. Estimated elasticities are within the range of whatis found elsewhere in the literature, although we find slightly higher values for the elasticity ofvalue added with respect to labour than studies using data for earlier periods (Kneller, Stevens2006, Liao et al. 2009). For the full sample, the elasticity of value added with respect tophysical capital is 0.201, and that with respect to labour 0.802. While we find evidence formildly increasing returns to scale for physical capital and labour concerning OECD countriesand Latin America (1.025 and 1.081), returns to scale are slightly decreasing for Asia (0.938).
The estimated effect of the stock of local R&D on output is strongly positive and significantat the 1% level for OECD countries (0.233), but only weakly positive and not significant for Asia
6Table 7 in the Appendix summarizes the number of available sectors by country and by year.
6
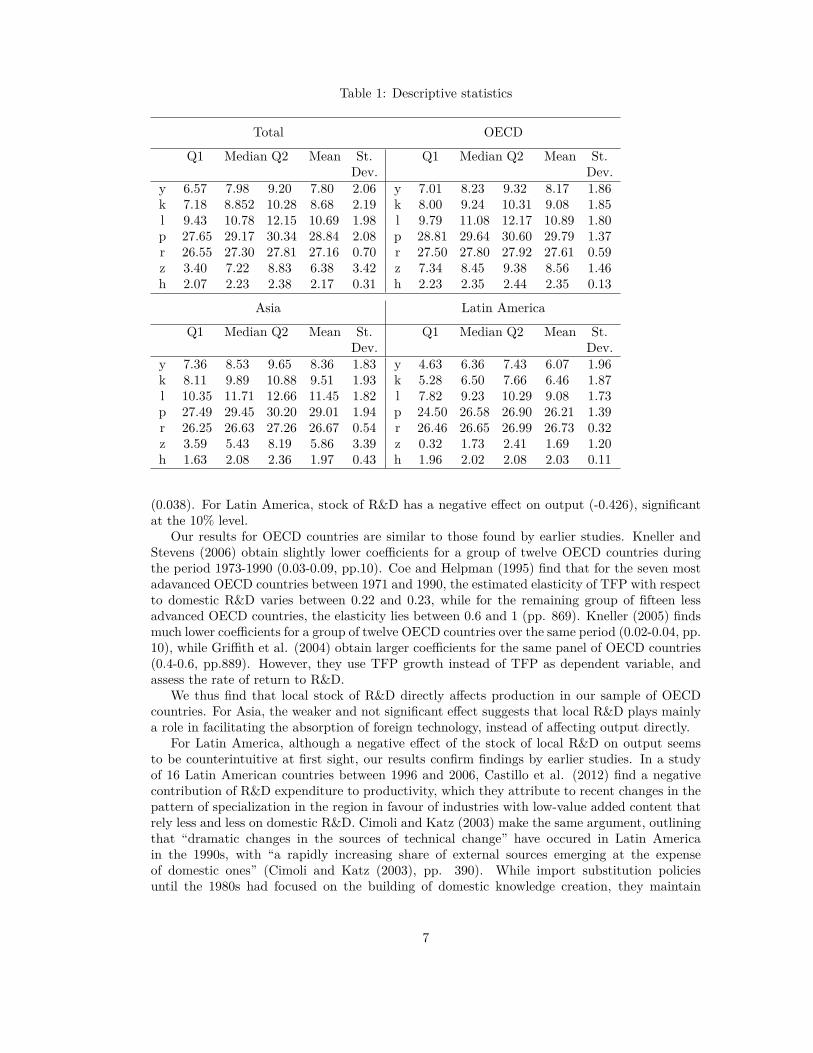
Table 1: Descriptive statistics
Total OECD
Q1 Median Q2 Mean St.Dev.
Q1 Median Q2 Mean St.Dev.
y 6.57 7.98 9.20 7.80 2.06 y 7.01 8.23 9.32 8.17 1.86k 7.18 8.852 10.28 8.68 2.19 k 8.00 9.24 10.31 9.08 1.85l 9.43 10.78 12.15 10.69 1.98 l 9.79 11.08 12.17 10.89 1.80p 27.65 29.17 30.34 28.84 2.08 p 28.81 29.64 30.60 29.79 1.37r 26.55 27.30 27.81 27.16 0.70 r 27.50 27.80 27.92 27.61 0.59z 3.40 7.22 8.83 6.38 3.42 z 7.34 8.45 9.38 8.56 1.46h 2.07 2.23 2.38 2.17 0.31 h 2.23 2.35 2.44 2.35 0.13
Asia Latin America
Q1 Median Q2 Mean St.Dev.
Q1 Median Q2 Mean St.Dev.
y 7.36 8.53 9.65 8.36 1.83 y 4.63 6.36 7.43 6.07 1.96k 8.11 9.89 10.88 9.51 1.93 k 5.28 6.50 7.66 6.46 1.87l 10.35 11.71 12.66 11.45 1.82 l 7.82 9.23 10.29 9.08 1.73p 27.49 29.45 30.20 29.01 1.94 p 24.50 26.58 26.90 26.21 1.39r 26.25 26.63 27.26 26.67 0.54 r 26.46 26.65 26.99 26.73 0.32z 3.59 5.43 8.19 5.86 3.39 z 0.32 1.73 2.41 1.69 1.20h 1.63 2.08 2.36 1.97 0.43 h 1.96 2.02 2.08 2.03 0.11
(0.038). For Latin America, stock of R&D has a negative effect on output (-0.426), significantat the 10% level.
Our results for OECD countries are similar to those found by earlier studies. Kneller andStevens (2006) obtain slightly lower coefficients for a group of twelve OECD countries duringthe period 1973-1990 (0.03-0.09, pp.10). Coe and Helpman (1995) find that for the seven mostadavanced OECD countries between 1971 and 1990, the estimated elasticity of TFP with respectto domestic R&D varies between 0.22 and 0.23, while for the remaining group of fifteen lessadvanced OECD countries, the elasticity lies between 0.6 and 1 (pp. 869). Kneller (2005) findsmuch lower coefficients for a group of twelve OECD countries over the same period (0.02-0.04, pp.10), while Griffith et al. (2004) obtain larger coefficients for the same panel of OECD countries(0.4-0.6, pp.889). However, they use TFP growth instead of TFP as dependent variable, andassess the rate of return to R&D.
We thus find that local stock of R&D directly affects production in our sample of OECDcountries. For Asia, the weaker and not significant effect suggests that local R&D plays mainlya role in facilitating the absorption of foreign technology, instead of affecting output directly.
For Latin America, although a negative effect of the stock of local R&D on output seemsto be counterintuitive at first sight, our results confirm findings by earlier studies. In a studyof 16 Latin American countries between 1996 and 2006, Castillo et al. (2012) find a negativecontribution of R&D expenditure to productivity, which they attribute to recent changes in thepattern of specialization in the region in favour of industries with low-value added content thatrely less and less on domestic R&D. Cimoli and Katz (2003) make the same argument, outliningthat “dramatic changes in the sources of technical change” have occured in Latin Americain the 1990s, with “a rapidly increasing share of external sources emerging at the expenseof domestic ones” (Cimoli and Katz (2003), pp. 390). While import substitution policiesuntil the 1980s had focused on the building of domestic knowledge creation, they maintain
7
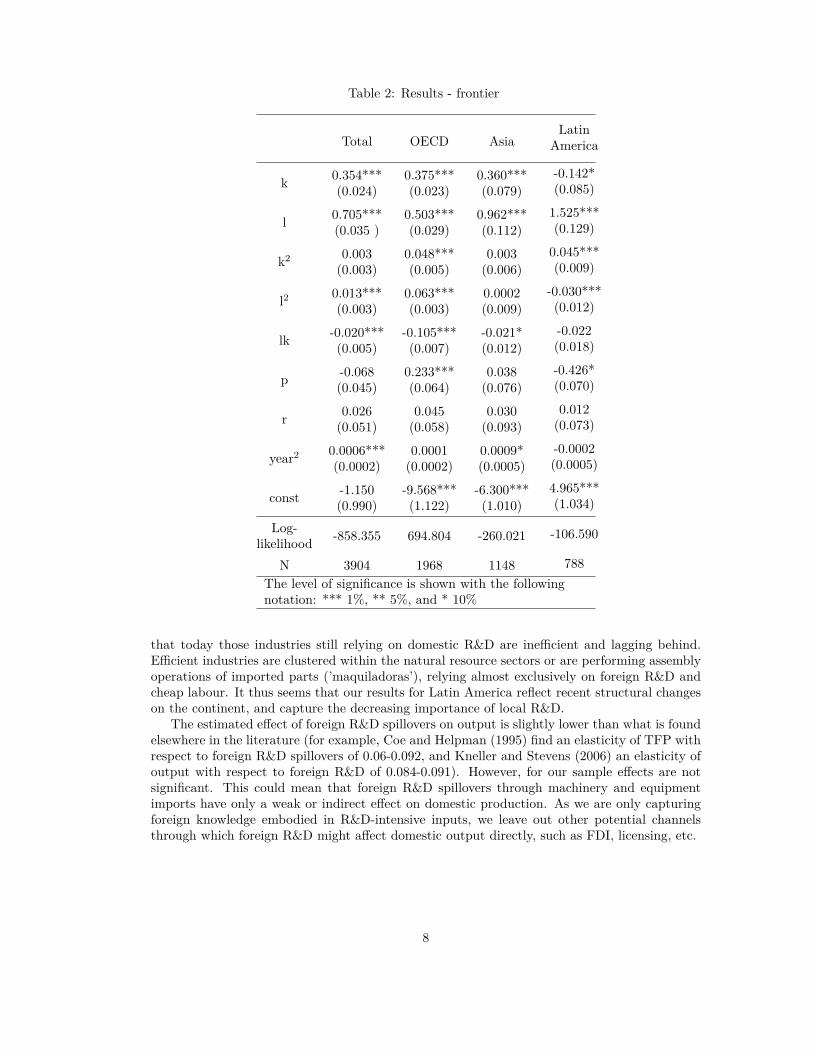
Table 2: Results - frontier
Total OECD AsiaLatin
America
k 0.354***(0.024)
0.375***(0.023)
0.360***(0.079)
-0.142*(0.085)
l 0.705***(0.035 )
0.503***(0.029)
0.962***(0.112)
1.525***(0.129)
k2 0.003(0.003)
0.048***(0.005)
0.003(0.006)
0.045***(0.009)
l2 0.013***(0.003)
0.063***(0.003)
0.0002(0.009)
-0.030***(0.012)
lk -0.020***(0.005)
-0.105***(0.007)
-0.021*(0.012)
-0.022(0.018)
p -0.068(0.045)
0.233***(0.064)
0.038(0.076)
-0.426*(0.070)
r 0.026(0.051)
0.045(0.058)
0.030(0.093)
0.012(0.073)
year2 0.0006***(0.0002)
0.0001(0.0002)
0.0009*(0.0005)
-0.0002(0.0005)
const -1.150(0.990)
-9.568***(1.122)
-6.300***(1.010)
4.965***(1.034)
Log-likelihood -858.355 694.804 -260.021 -106.590
N 3904 1968 1148 788The level of significance is shown with the followingnotation: *** 1%, ** 5%, and * 10%
that today those industries still relying on domestic R&D are inefficient and lagging behind.Efficient industries are clustered within the natural resource sectors or are performing assemblyoperations of imported parts (’maquiladoras’), relying almost exclusively on foreign R&D andcheap labour. It thus seems that our results for Latin America reflect recent structural changeson the continent, and capture the decreasing importance of local R&D.
The estimated effect of foreign R&D spillovers on output is slightly lower than what is foundelsewhere in the literature (for example, Coe and Helpman (1995) find an elasticity of TFP withrespect to foreign R&D spillovers of 0.06-0.092, and Kneller and Stevens (2006) an elasticity ofoutput with respect to foreign R&D of 0.084-0.091). However, for our sample effects are notsignificant. This could mean that foreign R&D spillovers through machinery and equipmentimports have only a weak or indirect effect on domestic production. As we are only capturingforeign knowledge embodied in R&D-intensive inputs, we leave out other potential channelsthrough which foreign R&D might affect domestic output directly, such as FDI, licensing, etc.
8
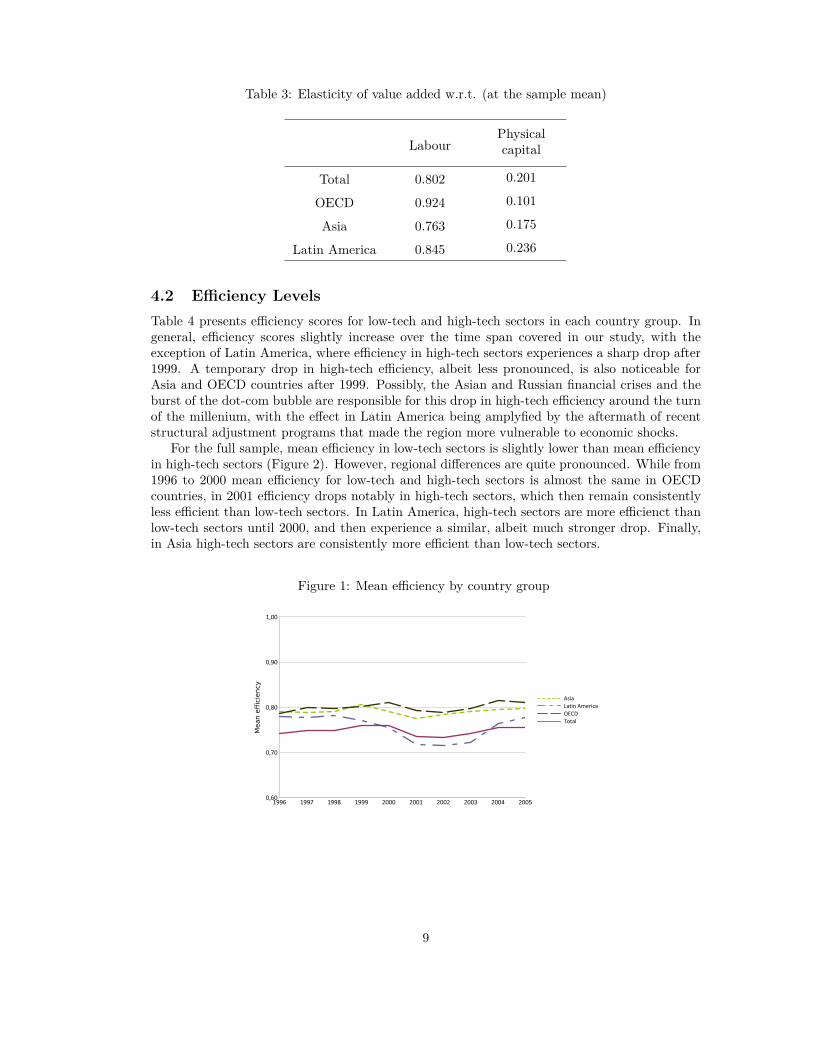
Table 3: Elasticity of value added w.r.t. (at the sample mean)
LabourPhysicalcapital
Total 0.802 0.201
OECD 0.924 0.101
Asia 0.763 0.175
Latin America 0.845 0.236
4.2 Efficiency LevelsTable 4 presents efficiency scores for low-tech and high-tech sectors in each country group. Ingeneral, efficiency scores slightly increase over the time span covered in our study, with theexception of Latin America, where efficiency in high-tech sectors experiences a sharp drop after1999. A temporary drop in high-tech efficiency, albeit less pronounced, is also noticeable forAsia and OECD countries after 1999. Possibly, the Asian and Russian financial crises and theburst of the dot-com bubble are responsible for this drop in high-tech efficiency around the turnof the millenium, with the effect in Latin America being amplyfied by the aftermath of recentstructural adjustment programs that made the region more vulnerable to economic shocks.
For the full sample, mean efficiency in low-tech sectors is slightly lower than mean efficiencyin high-tech sectors (Figure 2). However, regional differences are quite pronounced. While from1996 to 2000 mean efficiency for low-tech and high-tech sectors is almost the same in OECDcountries, in 2001 efficiency drops notably in high-tech sectors, which then remain consistentlyless efficient than low-tech sectors. In Latin America, high-tech sectors are more efficienct thanlow-tech sectors until 2000, and then experience a similar, albeit much stronger drop. Finally,in Asia high-tech sectors are consistently more efficient than low-tech sectors.
Figure 1: Mean efficiency by country group
1996 1997 1998 1999 2000 2001 2002 2003 2004 20050,60
0,70
0,80
0,90
1,00
Mean e
ffic
iency
Asia
Latin America
OECD
Total
9
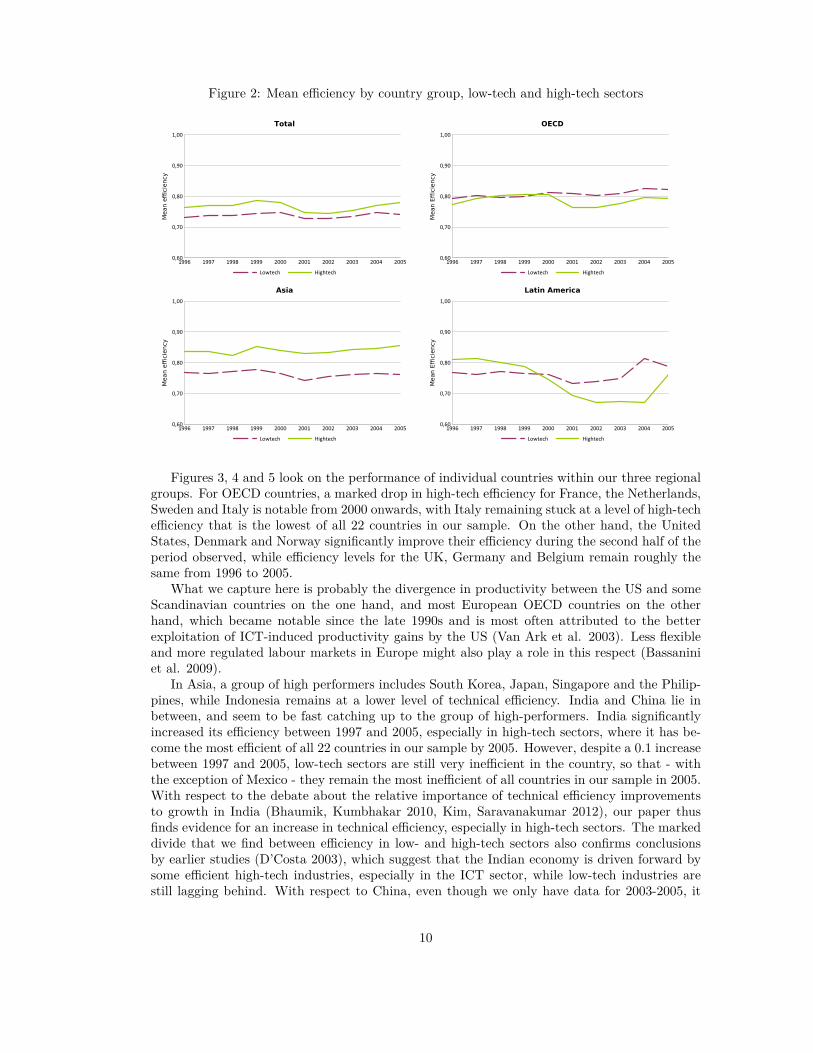
Figure 2: Mean efficiency by country group, low-tech and high-tech sectors
1996 1997 1998 1999 2000 2001 2002 2003 2004 20050,60
0,70
0,80
0,90
1,00
Mean e
ffic
iency
Lowtech Hightech
Total
1996 1997 1998 1999 2000 2001 2002 2003 2004 20050,60
0,70
0,80
0,90
1,00
Mean E
ffic
iency
Lowtech Hightech
OECD
1996 1997 1998 1999 2000 2001 2002 2003 2004 20050,60
0,70
0,80
0,90
1,00
Mean e
ffic
iency
Lowtech Hightech
Asia
1996 1997 1998 1999 2000 2001 2002 2003 2004 20050,60
0,70
0,80
0,90
1,00
Mean E
ffic
iency
Lowtech Hightech
Latin America
Figures 3, 4 and 5 look on the performance of individual countries within our three regionalgroups. For OECD countries, a marked drop in high-tech efficiency for France, the Netherlands,Sweden and Italy is notable from 2000 onwards, with Italy remaining stuck at a level of high-techefficiency that is the lowest of all 22 countries in our sample. On the other hand, the UnitedStates, Denmark and Norway significantly improve their efficiency during the second half of theperiod observed, while efficiency levels for the UK, Germany and Belgium remain roughly thesame from 1996 to 2005.
What we capture here is probably the divergence in productivity between the US and someScandinavian countries on the one hand, and most European OECD countries on the otherhand, which became notable since the late 1990s and is most often attributed to the betterexploitation of ICT-induced productivity gains by the US (Van Ark et al. 2003). Less flexibleand more regulated labour markets in Europe might also play a role in this respect (Bassaniniet al. 2009).
In Asia, a group of high performers includes South Korea, Japan, Singapore and the Philip-pines, while Indonesia remains at a lower level of technical efficiency. India and China lie inbetween, and seem to be fast catching up to the group of high-performers. India significantlyincreased its efficiency between 1997 and 2005, especially in high-tech sectors, where it has be-come the most efficient of all 22 countries in our sample by 2005. However, despite a 0.1 increasebetween 1997 and 2005, low-tech sectors are still very inefficient in the country, so that - withthe exception of Mexico - they remain the most inefficient of all countries in our sample in 2005.With respect to the debate about the relative importance of technical efficiency improvementsto growth in India (Bhaumik, Kumbhakar 2010, Kim, Saravanakumar 2012), our paper thusfinds evidence for an increase in technical efficiency, especially in high-tech sectors. The markeddivide that we find between efficiency in low- and high-tech sectors also confirms conclusionsby earlier studies (D’Costa 2003), which suggest that the Indian economy is driven forward bysome efficient high-tech industries, especially in the ICT sector, while low-tech industries arestill lagging behind. With respect to China, even though we only have data for 2003-2005, it
10
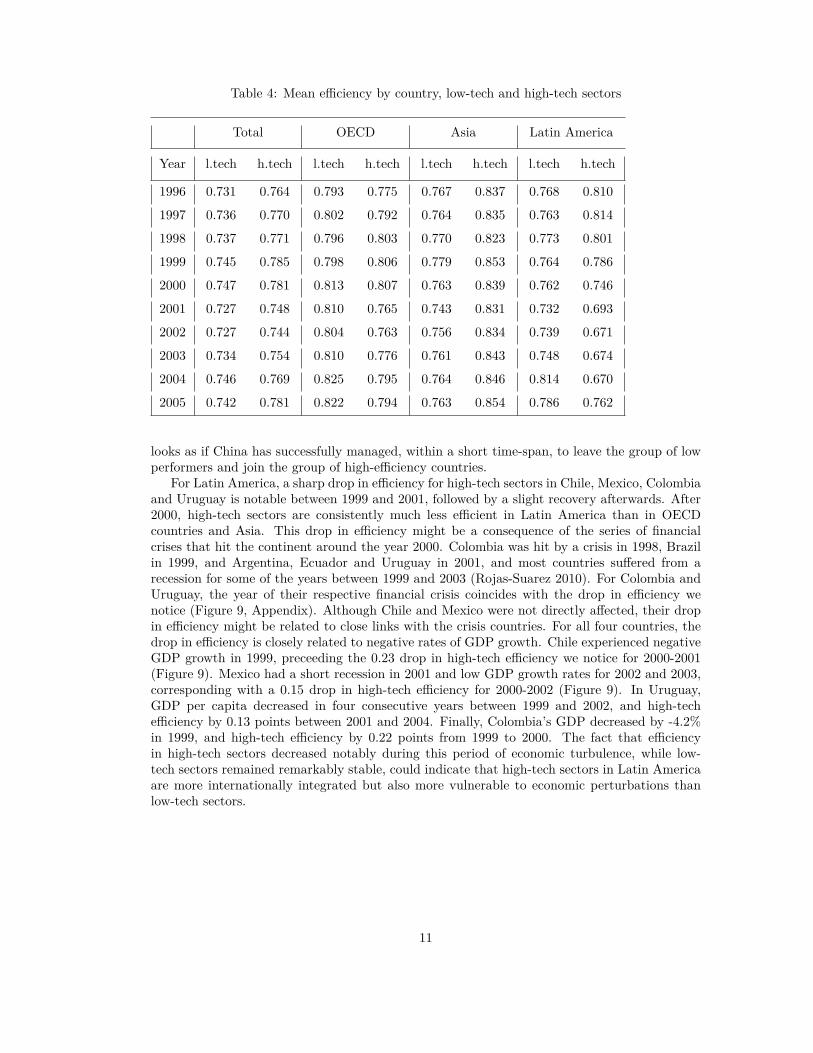
Table 4: Mean efficiency by country, low-tech and high-tech sectors
Total OECD Asia Latin America
Year l.tech h.tech l.tech h.tech l.tech h.tech l.tech h.tech
1996 0.731 0.764 0.793 0.775 0.767 0.837 0.768 0.810
1997 0.736 0.770 0.802 0.792 0.764 0.835 0.763 0.814
1998 0.737 0.771 0.796 0.803 0.770 0.823 0.773 0.801
1999 0.745 0.785 0.798 0.806 0.779 0.853 0.764 0.786
2000 0.747 0.781 0.813 0.807 0.763 0.839 0.762 0.746
2001 0.727 0.748 0.810 0.765 0.743 0.831 0.732 0.693
2002 0.727 0.744 0.804 0.763 0.756 0.834 0.739 0.671
2003 0.734 0.754 0.810 0.776 0.761 0.843 0.748 0.674
2004 0.746 0.769 0.825 0.795 0.764 0.846 0.814 0.670
2005 0.742 0.781 0.822 0.794 0.763 0.854 0.786 0.762
looks as if China has successfully managed, within a short time-span, to leave the group of lowperformers and join the group of high-efficiency countries.
For Latin America, a sharp drop in efficiency for high-tech sectors in Chile, Mexico, Colombiaand Uruguay is notable between 1999 and 2001, followed by a slight recovery afterwards. After2000, high-tech sectors are consistently much less efficient in Latin America than in OECDcountries and Asia. This drop in efficiency might be a consequence of the series of financialcrises that hit the continent around the year 2000. Colombia was hit by a crisis in 1998, Brazilin 1999, and Argentina, Ecuador and Uruguay in 2001, and most countries suffered from arecession for some of the years between 1999 and 2003 (Rojas-Suarez 2010). For Colombia andUruguay, the year of their respective financial crisis coincides with the drop in efficiency wenotice (Figure 9, Appendix). Although Chile and Mexico were not directly affected, their dropin efficiency might be related to close links with the crisis countries. For all four countries, thedrop in efficiency is closely related to negative rates of GDP growth. Chile experienced negativeGDP growth in 1999, preceeding the 0.23 drop in high-tech efficiency we notice for 2000-2001(Figure 9). Mexico had a short recession in 2001 and low GDP growth rates for 2002 and 2003,corresponding with a 0.15 drop in high-tech efficiency for 2000-2002 (Figure 9). In Uruguay,GDP per capita decreased in four consecutive years between 1999 and 2002, and high-techefficiency by 0.13 points between 2001 and 2004. Finally, Colombia’s GDP decreased by -4.2%in 1999, and high-tech efficiency by 0.22 points from 1999 to 2000. The fact that efficiencyin high-tech sectors decreased notably during this period of economic turbulence, while low-tech sectors remained remarkably stable, could indicate that high-tech sectors in Latin Americaare more internationally integrated but also more vulnerable to economic perturbations thanlow-tech sectors.
11

Figure 3: Mean efficiency - OECD
1996 1997 1998 1999 2000 2001 2002 2003 2004 2005
0,6
0,7
0,8
0,9
Mean e
ffic
iency Denmark
France
Italy
United Kingdom
United States
Norway
Germany
OECD
Figure 4: Mean efficiency - Asia
1996 1997 1998 1999 2000 2001 2002 2003 2004 2005
0,60000
0,70000
0,80000
0,90000
Mean E
ffic
iency China
Indonesia
India
Japan
Korea
Philippines
Singapore
Asia
Figure 5: Mean efficiency - Latin America
1996 1997 1998 1999 2000 2001 2002 2003 2004 2005
0,60
0,70
0,80
0,90
Mean E
ffic
iency
Bolivia
Chile
Colombia
Mexico
Uruguay
Latin America
12
4.3 Determinants of Technical EfficiencyStock of Patents
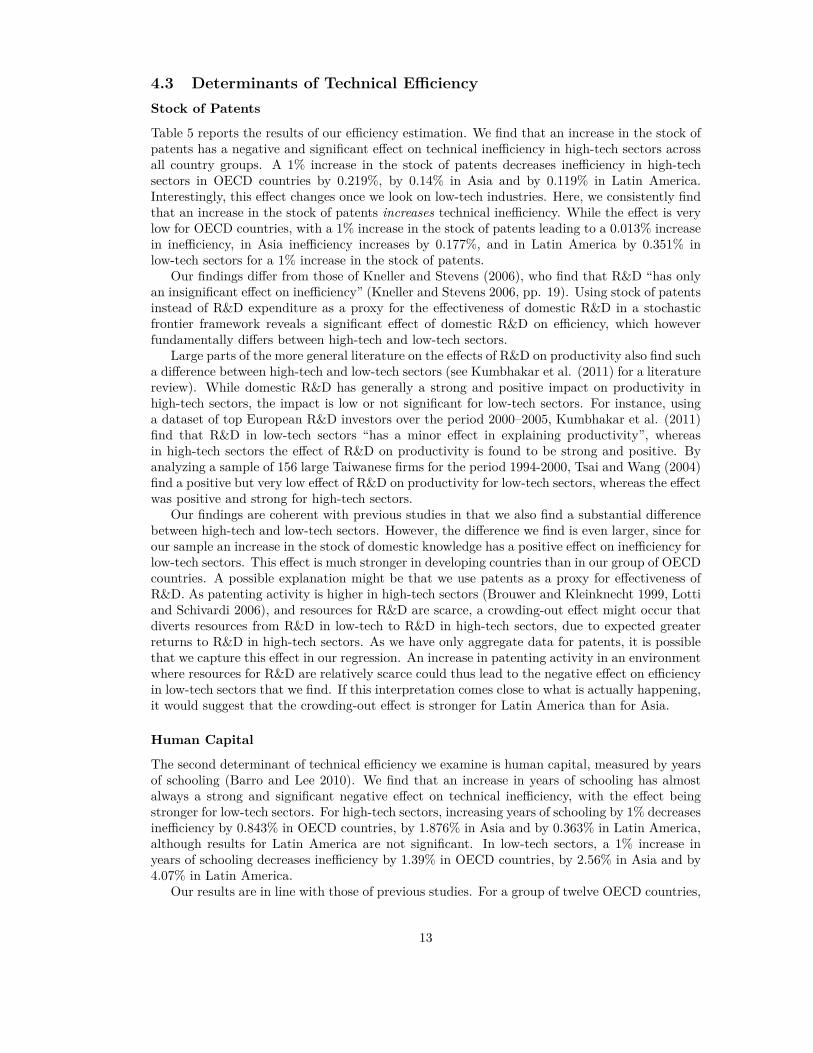
Table 5 reports the results of our efficiency estimation. We find that an increase in the stock ofpatents has a negative and significant effect on technical inefficiency in high-tech sectors acrossall country groups. A 1% increase in the stock of patents decreases inefficiency in high-techsectors in OECD countries by 0.219%, by 0.14% in Asia and by 0.119% in Latin America.Interestingly, this effect changes once we look on low-tech industries. Here, we consistently findthat an increase in the stock of patents increases technical inefficiency. While the effect is verylow for OECD countries, with a 1% increase in the stock of patents leading to a 0.013% increasein inefficiency, in Asia inefficiency increases by 0.177%, and in Latin America by 0.351% inlow-tech sectors for a 1% increase in the stock of patents.
Our findings differ from those of Kneller and Stevens (2006), who find that R&D “has onlyan insignificant effect on inefficiency” (Kneller and Stevens 2006, pp. 19). Using stock of patentsinstead of R&D expenditure as a proxy for the effectiveness of domestic R&D in a stochasticfrontier framework reveals a significant effect of domestic R&D on efficiency, which howeverfundamentally differs between high-tech and low-tech sectors.
Large parts of the more general literature on the effects of R&D on productivity also find sucha difference between high-tech and low-tech sectors (see Kumbhakar et al. (2011) for a literaturereview). While domestic R&D has generally a strong and positive impact on productivity inhigh-tech sectors, the impact is low or not significant for low-tech sectors. For instance, usinga dataset of top European R&D investors over the period 2000–2005, Kumbhakar et al. (2011)find that R&D in low-tech sectors “has a minor effect in explaining productivity”, whereasin high-tech sectors the effect of R&D on productivity is found to be strong and positive. Byanalyzing a sample of 156 large Taiwanese firms for the period 1994-2000, Tsai and Wang (2004)find a positive but very low effect of R&D on productivity for low-tech sectors, whereas the effectwas positive and strong for high-tech sectors.
Our findings are coherent with previous studies in that we also find a substantial differencebetween high-tech and low-tech sectors. However, the difference we find is even larger, since forour sample an increase in the stock of domestic knowledge has a positive effect on inefficiency forlow-tech sectors. This effect is much stronger in developing countries than in our group of OECDcountries. A possible explanation might be that we use patents as a proxy for effectiveness ofR&D. As patenting activity is higher in high-tech sectors (Brouwer and Kleinknecht 1999, Lottiand Schivardi 2006), and resources for R&D are scarce, a crowding-out effect might occur thatdiverts resources from R&D in low-tech to R&D in high-tech sectors, due to expected greaterreturns to R&D in high-tech sectors. As we have only aggregate data for patents, it is possiblethat we capture this effect in our regression. An increase in patenting activity in an environmentwhere resources for R&D are relatively scarce could thus lead to the negative effect on efficiencyin low-tech sectors that we find. If this interpretation comes close to what is actually happening,it would suggest that the crowding-out effect is stronger for Latin America than for Asia.
Human Capital
The second determinant of technical efficiency we examine is human capital, measured by yearsof schooling (Barro and Lee 2010). We find that an increase in years of schooling has almostalways a strong and significant negative effect on technical inefficiency, with the effect beingstronger for low-tech sectors. For high-tech sectors, increasing years of schooling by 1% decreasesinefficiency by 0.843% in OECD countries, by 1.876% in Asia and by 0.363% in Latin America,although results for Latin America are not significant. In low-tech sectors, a 1% increase inyears of schooling decreases inefficiency by 1.39% in OECD countries, by 2.56% in Asia and by4.07% in Latin America.
Our results are in line with those of previous studies. For a group of twelve OECD countries,
13

Table 5: Results - efficiency determinants
Total OECD AsiaLatin
America
z -0.187***(0.013)
-0.219***(0.021)
-0.140***(0.019)
-0.119*(0.071)
Low-tech*z
0.361***(0.020)
0.232***(0.021)
0.317***(0.020)
0.470***(0.074)
h 0.660***(0.136)
-0.843***(0.168)
-1.876***(0.198)
-0.363(0.437)
Low-tech*h
-2.992***(0.157)
-0.548***(0.174)
-0.685***(0.208)
-3.705***(0.3402)
const 0.838***(0.211)
1.722***(0.354)
1.654***(0.413)
4.066(0.935)
sigmasquared
0.658***(0.022)
0.291***(0.007)
0.558***(0.029)
0.377***(0.022)
gamma 0.943***(0.004)
0.974***(0.003)
0.912***(0.009)
0.911***(0.012)
N 3904 1968 1148 788The level of significance is shown with the followingnotation: *** 1%, ** 5%, and * 10%
Kneller and Stevens (2006) find that a 1% increase in human capital decreases inefficiencyby 1.86%. Their coefficient is slightly higher than ours. As they look on an earlier period(1973-1990), this could be a sign for marginal decreasing returns of human capital over time inOECD countries. To our knowledge, there are no previous studies that use a stochastic frontierframework and specifically look at the effect of human capital on inefficiency in Asia and LatinAmerica. However, looking at a group of 57 developing countries for the period 1960-2000,Mastromarco (2008) finds that increasing human capital by 1% decreases inefficiency by 2.33%.
We find that an increase in human capital reduces technical inefficiency more in low-techthan in high tech-sectors. This could mean that the type of human capital captured by theyears of schooling data provided by Barro and Lee (2010) is more relevant in low-tech than inhigh-tech sectors. While an additional year of schooling has a strong impact on efficiency in low-tech activities, efficiency improvements in high-tech sectors are mainly induced by increases in“highly qualified” human capital (e.g. education at a post-graduate and doctoral level, specialistqualifications, etc.), which are not captured by Barro and Lee’s data on years of schooling.
Comparing OECD countries and Asia to Latin America reveals further interesting results.Whereas in the former the effect of schooling on low-tech sectors is only slightly higher than theeffect on high-tech sectors, for Latin America the effect of schooling on efficiency in low-techsectors is exceptionally strong, whereas the effect on high-tech sectors is relatively small andinsignificant. This suggests that the quality of human capital in low-tech sectors is still very lowin Latin America.
14
5 ConclusionUsing a stochastic frontier framework and data for 22 manufacturing sectors, we found notabledifferences in technical efficiency between a group of 10 OECD countries, 7 Asian countriesand 5 Latin American countries. As the efficiency with which countries use frontier technologydetermines their capacity to absorb technology produced abroad, these differences are importantto understand differences in growth and productivity, especially for developing countries whichdepend to a large extend on foreign technology.
We examine the effect of two potential determinants of a country’s absorptive capacity:human capital measured by years of schooling, and the effectiveness of domestic R&D, proxiedby the stock of patents. We find that years of schooling always has a strongly positive effecton efficiency, especially in low-tech sectors and for developing countries. The stock of patentspositively affects efficiency in high-tech sectors, but has a consistently negative effect on efficiencyin low-tech sectors, especially for Asia and Latin America.
To our knowledge, this is the first study using a stochastic frontier approach and sectoraldata not only for OECD countries, but also for two groups of emerging economies. Using sectoraldata permits us to disaggregate the efficiency effect of schooling and stock of patents betweenlow-tech and high-tech sectors. However, as in many developing countries sectoral data has onlybeen made available recently, and is not yet available to a sufficient extend for human capital,stock of R&D and patents, there is a lot of scope for future work once better data becomesavailable.
References[1] Abramovitz M. (1986), Catching Up, Forging Ahead, and Falling Behind, The
Journal of Economic History, 46(2), 385-406
[2] Acemoglu D., Aghion P., Zilibotti F. (2006), Distance to Frontier, Selection, andEconomic Growth, Journal of the European Economic Association, 4(1), 37-74
[3] Aghion P., Howitt P. (2005), Growth With Quality-Improving Innovations: anIntegrated Framework, in Aghion P., Durlauf S. (eds.), Handbook of EconomicGrowth, 1(1), 68-97
[4] Amsden A. (1989), Asia’s Next Giant: South Korea and Late Industrialization,Oxford University Press, Oxford
[5] Amsden A. (2001), The Rise of the Rest: Challenges to the West from Late-Industrializing Economies, Oxford University Press, Oxford
[6] Barro R., Lee J. (2010), A New Data Set of Educational Attainment in the World,1950-2010, NBER Working Paper No. 15902
[7] Bassanini A., Nunziata L., Venn D. (2009), Job Protection Legislation and Pro-ductivity Growth in OECD Countries, Economic Policy, 24(58), 349-402
[8] Battese G., Coelli T. (1995), A Model for Technical Efficiency Effects in a StochasticFrontier Production Function For Panel Data, Empirical Economics, 20(2), 325-332
[9] Benhabib J., Spiegel M. (1994), The Role of Human Capital in Economic De-velopment: Evidence from Aggregate Cross-Country Data, Journal of MonetaryEconomics, 34(2), 143-173
[10] Benhabib J., Spiegel M. (2005), Human Capital and Technology Diffusion, inAghion P., Durlauf S. (eds.), Handbook of Economic Growth, 1(1), 935-966
15
[11] Bhaumik S., Kumbhakar S. (2010), Is the Post-Reform Growth of the Indian Man-ufacturing Sector Efficiency Driven? Empirical Evidence from Plant-Level Data,Journal of Asian Economics, 21(2), 219-232
[12] Breznitz D., Murphree M. (2011), Run of the Red Queen: Government, Innovation,Globalization, and Economic Growth in China, Yale University Press, New Haven
[13] Brouwera, E., Kleinknecht, A. (1999), Innovative Output, and a Firm’s Propensityto Patent: An Exploration of CIS Micro Data, Research Policy, Elsevier, 28(6),615–624
[14] Caselli F., Wilson D. (2004), Importing Technology, Journal of Monetary Eco-nomics, 51, 1-32
[15] Castillo L., Salem D., Guasch J. (2012), Innovative and Absorptive Capacity ofInternational Knowledge, Policy Research Working Paper No. 5931, The WorldBank, Washington
[16] Cimoli M., Katz J. (2003), Structural Reforms, Technological Gaps and EconomicDevelopment: a Latin American Perspective, Industrial and Corporate Change,12(2), 387-411
[17] Coe D., Helpman E. (1995), International R&D Spillovers, European EconomicReview, 39(5), 859-887
[18] Cohen W., Levinthal D. (1989), Innovation and Learning: The Two Faces of R&D,Economic Journal, 99(397), 569-596
[19] D’Costa A. (2003), Uneven and Combined Development: Understanding India’sSoftware Exports, World Development, 31(1), 211-226
[20] Eaton J., Kortum S. (2001), Trade in Capital Goods, European Economic Review,45, 1195-1235
[21] Engelbrecht H. (1997), International R&D Spillovers, Human Capital and Pro-ductivity in OECD Economies: An Empirical Investigation, European EconomicReview, 41(8), 1479-1488
[22] Fagerberg J. (1994), Technology and International Differences in Growth Rates,Journal of Economic Literature, 32(3), 1147-1175
[23] Gerschenkron A. (1962), Economic Backwardness in Historical Perspective: A Bookof Essays, Harvard University Press, Cambridge, MA
[24] Gleditsch, K. (2003), Distance between Capital Cities Data, version 4 June 2003,available at http://privatewww.essex.ac.uk/~ksg/data-5.html, accessed on Novem-ber 15th, 2011
[25] Griffith R., Redding S., Van Reenen (2003), R&D and Absorptive Capacity: Theoryand Empirical Evidence, Scandinavian Journal of Economics, 105(1), 99-118
[26] Griffith R., Redding S., Van Reenen J. (2004), Mapping the Two Faces of R&D:Productivity Growth in a Panel of OECD Industries, Review of Economics andStatistics, 86(4), 883-895
[27] Griliches, Z. (1984), Market Value, R&D, and Patents, NBER Chapters, in: R &D, Patents, and Productivity, National Bureau of Economic Research, Inc. 249-252
16
[28] Griliches Z., Lichtenberg F. (1984), R&D and Productivity Growth at the IndustryLevel: is There Still a Relationship?, in Griliches Z. (ed.), R&D, Patents andProductivity, NBER and Chicago University Press, Chicago
[29] Hall B., MacGarvie M. (2010), The Private Value of Software Patents, ResearchPolicy, 39(7), 994-1009
[30] Henry M., Kneller R., Milner C. (2009), Trade, Technology Transfer and NationalEfficiency in Developing Countries, European Economic Review, 53(2), 237-254
[31] Kim S., Saravanakumar M. (2012), Economic Reform and Total Factor Productiv-ity Growth in Indian Manufacturing Industries, Review of Development Economics,16(1), 152-166
[32] Kneller R. (2005), Frontier Technology, Absorptive Capacity and Distance, OxfordBulletin of Economics and Statistics, 67(1), 1-24
[33] Kneller R., Stevens P. (2003), The Specification of the Aggregate Production Func-tion in the Presence of Inefficiency, Economic Letters, 81(2), 223-226
[34] Kneller R., Stevens P. (2006), Frontier Technology and Absorptive Capacity: Ev-idence from OECD Manufacturing Industries, Oxford Bulletin of Economics andStatistics, 68(1), 1-21
[35] Koop G., Osiewalski J., Steel M. (1999), The Components of Output Growth: AStochastic Frontier Analysis, Oxford Bulletin of Economics and Statistics, 61(4),455-487
[36] Koop G., Osiewalski J., Steel M. (2000), Modelling the Sources of Output Growthin a Panel of Countries, Journal of Business and Economic Studies, 18(3), 284-289
[37] Kumbhakar S., Ortega-Argiles R., Potters L., Vivarelli M., Voigt P. (2011), Cor-porate R&D and Firm Efficiency: Evidence from Europe’s Top R&D Investors,Journal of Productivity Analysis, forthcoming
[38] Lall S., Pietrobelli C. (2002), Failing to Compete: Technology Development andTechnology Systems in Africa, Edward Elgar, Cheltenham
[39] Liao H., Liu X., Holmes M., Weyman-Jones T. (2009), The Impact of ForeignR&D on Total Factor Productivity in the East Asian Manufacturing Industry, TheManchester School, 77(2), 244-270
[40] Lotti, F., Schivardi, F. (2005), Cross Country Differences in Patent Propensity: AFirm-Level Investigation, Giornale degli Economisti e Annali di Economia, 64 (4),469-502
[41] Madden G., Savage S., Bloxham P. (2001), Asian and OECD International R&DSpillovers, Applied Economic Letters, 8(7), 431-435
[42] Madsen J., Islam R., Ang J. (2010), Catching Up to the Technology Frontier: TheDichotomy Between Innovation and Imitation, Canadian Journal of Economics,43(4), 1389-1411
[43] Mastromarco C. (2008), Foreign Capital and Efficiency in Developing Countries,Bulletin of Economic Research, 60(4), 351-374
17

[44] Miller S., Upadhyay M. (2000), The Effects of Openess, Trade Orientation, andHuman Capital on Total Factor Productivity, Journal of Development Economics,63(2), 399-423
[45] Nelson R., Phelps E. (1966), Investment in Humans, Technological Diffusion, andEconomic Growth, American Economic Review, 56(1/2), 69-75
[46] Okabe M. (2002), International R&D Spillovers and Trade Expansion: Evidencefrom East Asian Economies, Asian Economic Bulletin, 19(2), 141-154
[47] Prescott E. (1998), Needed: A Theory of Total Factor Productivity, InternationalEconomic Review, 39(3), 525-551
[48] Rojas-Suarez L. (2010), The International Financial Crisis: Eight Lessons for andfrom Latin America, Working Paper No. 202, Center for Global Development,Washington
[49] Senhadji A. (2000), Sources of Economic Growth: An Extensive Growth Account-ing Exercise, IMF Staff Papers, 47(1), 129-158
[50] Tsai K., Wang J. (2004), R&D Productivity and the Spillover Effects of High-TechIndustry on the Traditional Manufacturing Sector: The Case of Taiwan, WorldEconomy, 27(10), 1555-1570
[51] Van Ark B., Inklaar R., McGuckin R. (2003), ’Changing Gear’: Productivity, ICTand Service Industries in Europe and the United States, in Christensen J., MaskellP. (eds.), The Industrial Dynamics of the New Digital Economy, Edward Elgar,Cheltenham
[52] Verspagen B. (1991), A New Empirical Approach to Catching Up or Falling Behind,Structural Change and Economic Dynamics, 2(2), 359-380
[53] Wade R. (1990), Governing the Market: Economic Theory and the Role of Gov-ernment in East Asian Industrialization, Princeton University Press, Princeton
[54] Wang Y. (2007), Trade, Human Capital, and Technology Spillovers: An Industry-Level Analysis, Review of International Economics, 15(2), 269-283
18
6 Appendix
Table 6: Sector classification (ISIC Rev. 3)
15 Food and beverages Low-tech16 Tobacco products Low-tech
17 Textiles Low-tech18 Wearing apparel Low-tech
19 Leather, leather products and footwear Low-tech20 Wood products (excl. furniture) Low-tech
21 Paper and paper products Low-tech22 Printing and publishing Low-tech
23 Coke,refined petroleum products, nuclear fuel Low-tech24 Chemicals and chemical products High-tech
25 Rubber and plastics products Low-tech26 Non-metallic mineral products Low-tech
27 Basic metals Low-tech28 Fabricated metal products Low-tech
29 Machinery and equipment n.e.c. High-tech30 Office, accounting and computing machinery High-tech
31 Electrical machinery and apparatus High-tech32 Radio,television and communication equipment High-tech
33 Medical, precision and optical instruments High-tech34 Motor vehicles, trailers, semi-trailers High-tech
35 Other transport equipment High-tech36 Furniture; manufacturing n.e.c. Low-tech
19
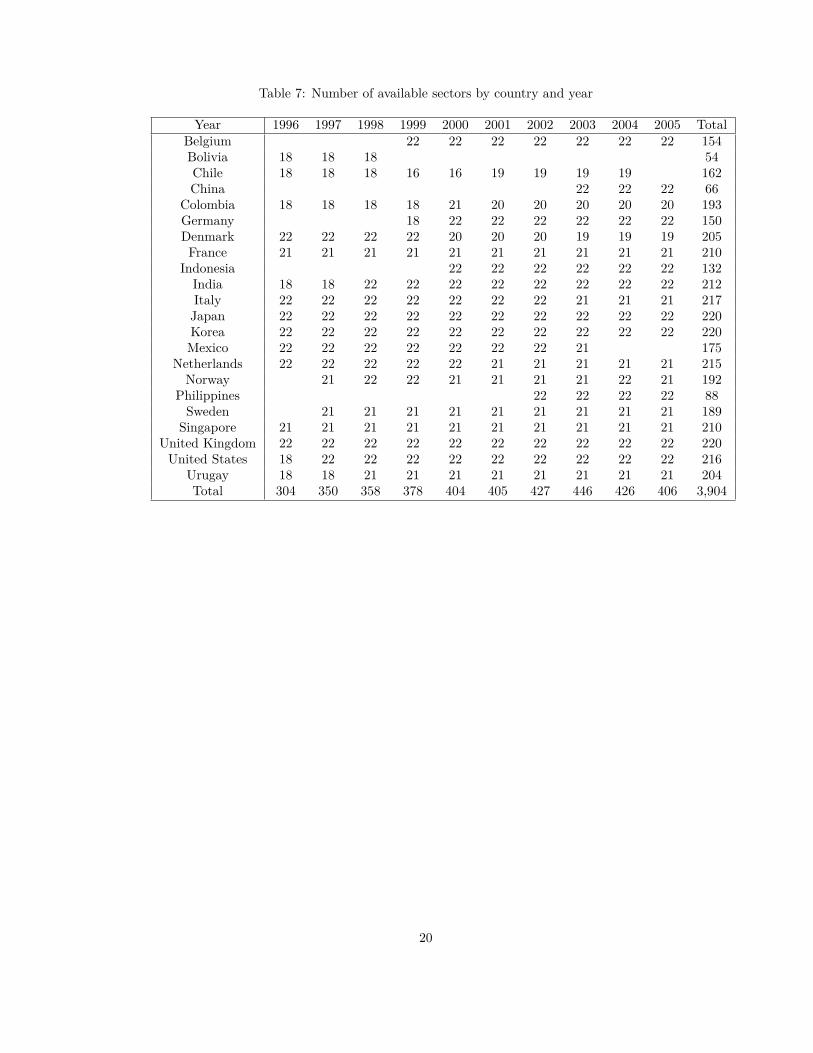
Table 7: Number of available sectors by country and year
Year 1996 1997 1998 1999 2000 2001 2002 2003 2004 2005 TotalBelgium 22 22 22 22 22 22 22 154Bolivia 18 18 18 54Chile 18 18 18 16 16 19 19 19 19 162China 22 22 22 66
Colombia 18 18 18 18 21 20 20 20 20 20 193Germany 18 22 22 22 22 22 22 150Denmark 22 22 22 22 20 20 20 19 19 19 205France 21 21 21 21 21 21 21 21 21 21 210
Indonesia 22 22 22 22 22 22 132India 18 18 22 22 22 22 22 22 22 22 212Italy 22 22 22 22 22 22 22 21 21 21 217
Japan 22 22 22 22 22 22 22 22 22 22 220Korea 22 22 22 22 22 22 22 22 22 22 220Mexico 22 22 22 22 22 22 22 21 175
Netherlands 22 22 22 22 22 21 21 21 21 21 215Norway 21 22 22 21 21 21 21 22 21 192
Philippines 22 22 22 22 88Sweden 21 21 21 21 21 21 21 21 21 189
Singapore 21 21 21 21 21 21 21 21 21 21 210United Kingdom 22 22 22 22 22 22 22 22 22 22 220
United States 18 22 22 22 22 22 22 22 22 22 216Urugay 18 18 21 21 21 21 21 21 21 21 204Total 304 350 358 378 404 405 427 446 426 406 3,904
20
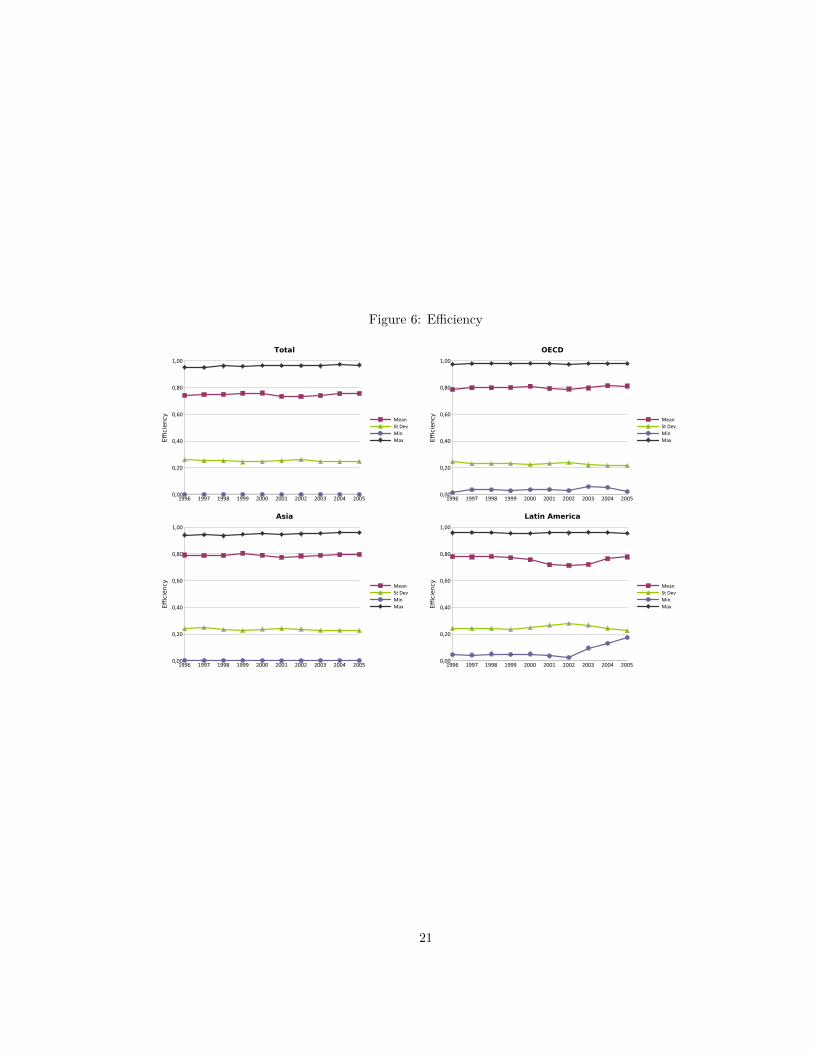
Figure 6: Efficiency
1996 1997 1998 1999 2000 2001 2002 2003 2004 20050,00
0,20
0,40
0,60
0,80
1,00
Efficiency
Mean
St Dev
Min
Max
Total
1996 1997 1998 1999 2000 2001 2002 2003 2004 20050,00
0,20
0,40
0,60
0,80
1,00
Efficiency
Mean
St Dev
Min
Max
OECD
1996 1997 1998 1999 2000 2001 2002 2003 2004 20050,00
0,20
0,40
0,60
0,80
1,00
Efficiency
Mean
St Dev
Min
Max
Asia
1996 1997 1998 1999 2000 2001 2002 2003 2004 20050,00
0,20
0,40
0,60
0,80
1,00
Efficiency
Mean
St Dev
Min
Max
Latin America
21
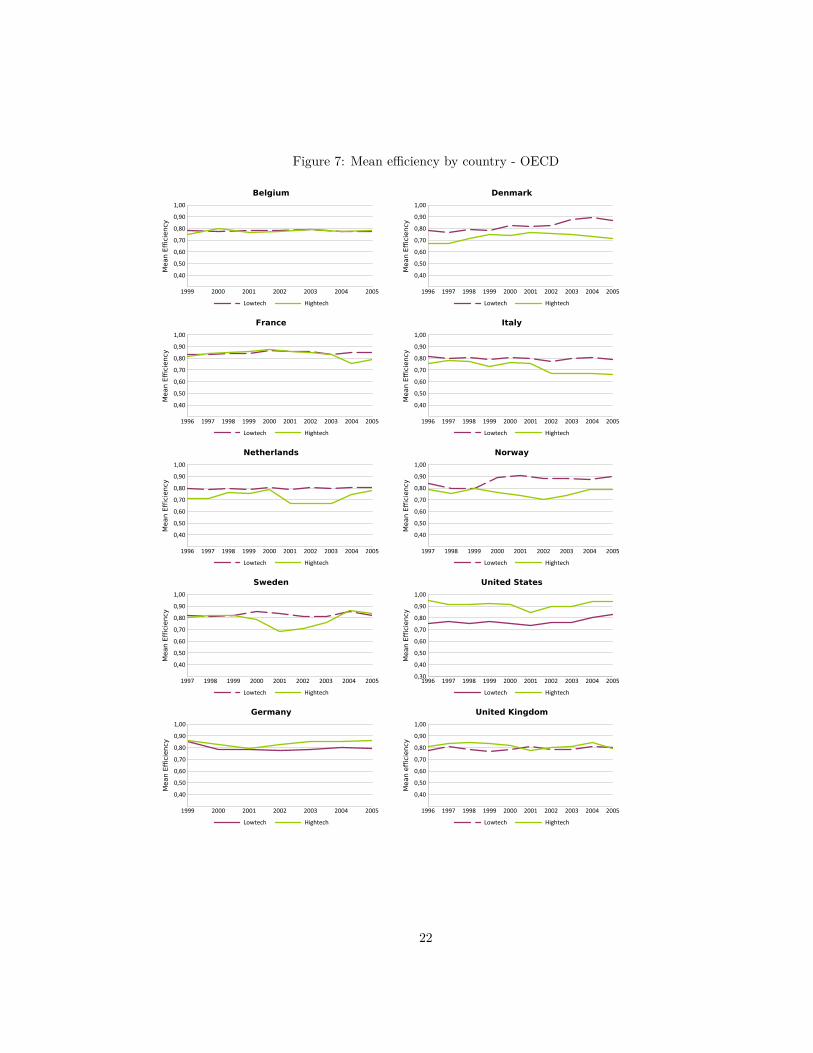
Figure 7: Mean efficiency by country - OECD
1999 2000 2001 2002 2003 2004 2005
0,40
0,50
0,60
0,70
0,80
0,90
1,00
Mean E
ffic
iency
Lowtech Hightech
Belgium
1996 1997 1998 1999 2000 2001 2002 2003 2004 2005
0,40
0,50
0,60
0,70
0,80
0,90
1,00
Mean E
ffic
iency
Lowtech Hightech
Denmark
1996 1997 1998 1999 2000 2001 2002 2003 2004 2005
0,40
0,50
0,60
0,70
0,80
0,90
1,00
Mean E
ffic
iency
Lowtech Hightech
France
1996 1997 1998 1999 2000 2001 2002 2003 2004 2005
0,40
0,50
0,60
0,70
0,80
0,90
1,00
Mean E
ffic
iency
Lowtech Hightech
Italy
1996 1997 1998 1999 2000 2001 2002 2003 2004 2005
0,40
0,50
0,60
0,70
0,80
0,90
1,00
Mean E
ffic
iency
Lowtech Hightech
Netherlands
1997 1998 1999 2000 2001 2002 2003 2004 2005
0,40
0,50
0,60
0,70
0,80
0,90
1,00
Mean E
ffic
iency
Lowtech Hightech
Norway
1997 1998 1999 2000 2001 2002 2003 2004 2005
0,40
0,50
0,60
0,70
0,80
0,90
1,00
Mean E
ffic
iency
Lowtech Hightech
Sweden
1996 1997 1998 1999 2000 2001 2002 2003 2004 20050,30
0,40
0,50
0,60
0,70
0,80
0,90
1,00
Mean E
ffic
iency
Lowtech Hightech
United States
1999 2000 2001 2002 2003 2004 2005
0,40
0,50
0,60
0,70
0,80
0,90
1,00
Mean E
ffic
iency
Lowtech Hightech
Germany
1996 1997 1998 1999 2000 2001 2002 2003 2004 2005
0,40
0,50
0,60
0,70
0,80
0,90
1,00
Mean e
ffic
iency
Lowtech Hightech
United Kingdom
22
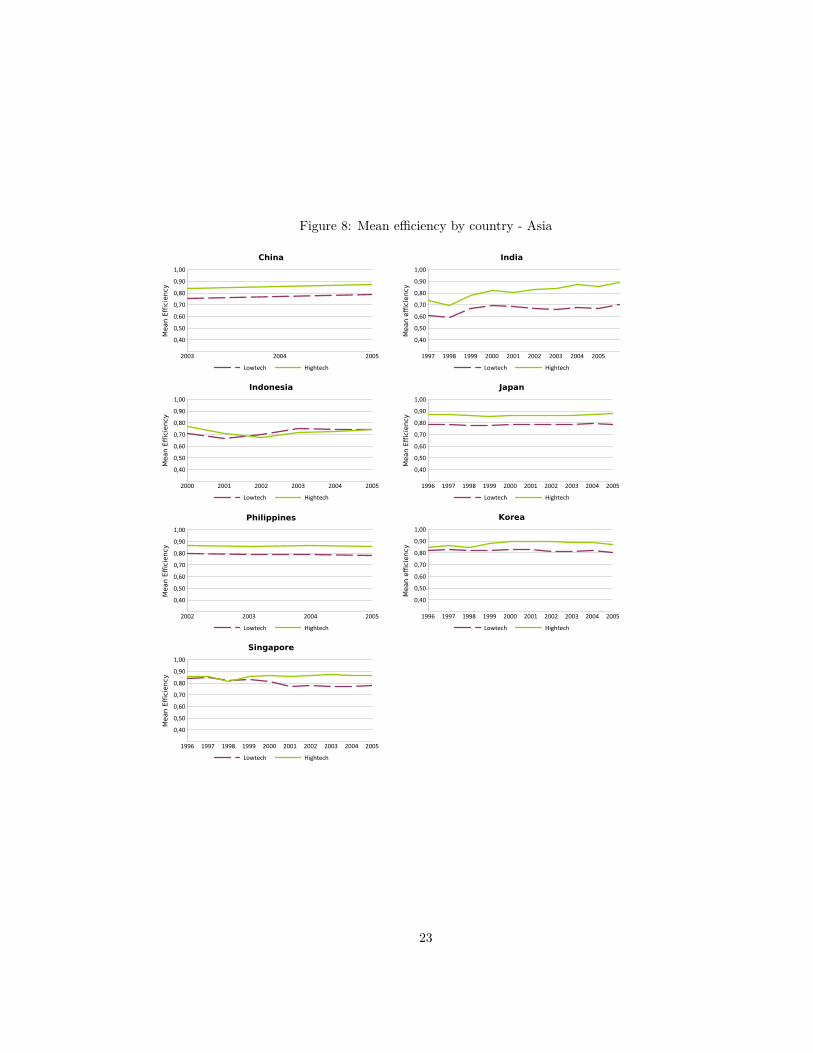
Figure 8: Mean efficiency by country - Asia
2003 2004 2005
0,40
0,50
0,60
0,70
0,80
0,90
1,00
Mean E
ffic
iency
Lowtech Hightech
China
1997 1998 1999 2000 2001 2002 2003 2004 2005
0,40
0,50
0,60
0,70
0,80
0,90
1,00
Mean e
ffic
iency
Lowtech Hightech
India
2000 2001 2002 2003 2004 2005
0,40
0,50
0,60
0,70
0,80
0,90
1,00
Mean E
ffic
iency
Lowtech Hightech
Indonesia
1996 1997 1998 1999 2000 2001 2002 2003 2004 2005
0,40
0,50
0,60
0,70
0,80
0,90
1,00M
ean E
ffic
iency
Lowtech Hightech
Japan
2002 2003 2004 2005
0,40
0,50
0,60
0,70
0,80
0,90
1,00
Mean E
ffic
iency
Lowtech Hightech
Philippines
1996 1997 1998 1999 2000 2001 2002 2003 2004 2005
0,40
0,50
0,60
0,70
0,80
0,90
1,00
Mean e
ffic
iency
Lowtech Hightech
Korea
1996 1997 1998 1999 2000 2001 2002 2003 2004 2005
0,40
0,50
0,60
0,70
0,80
0,90
1,00
Mean E
ffic
iency
Lowtech Hightech
Singapore
23
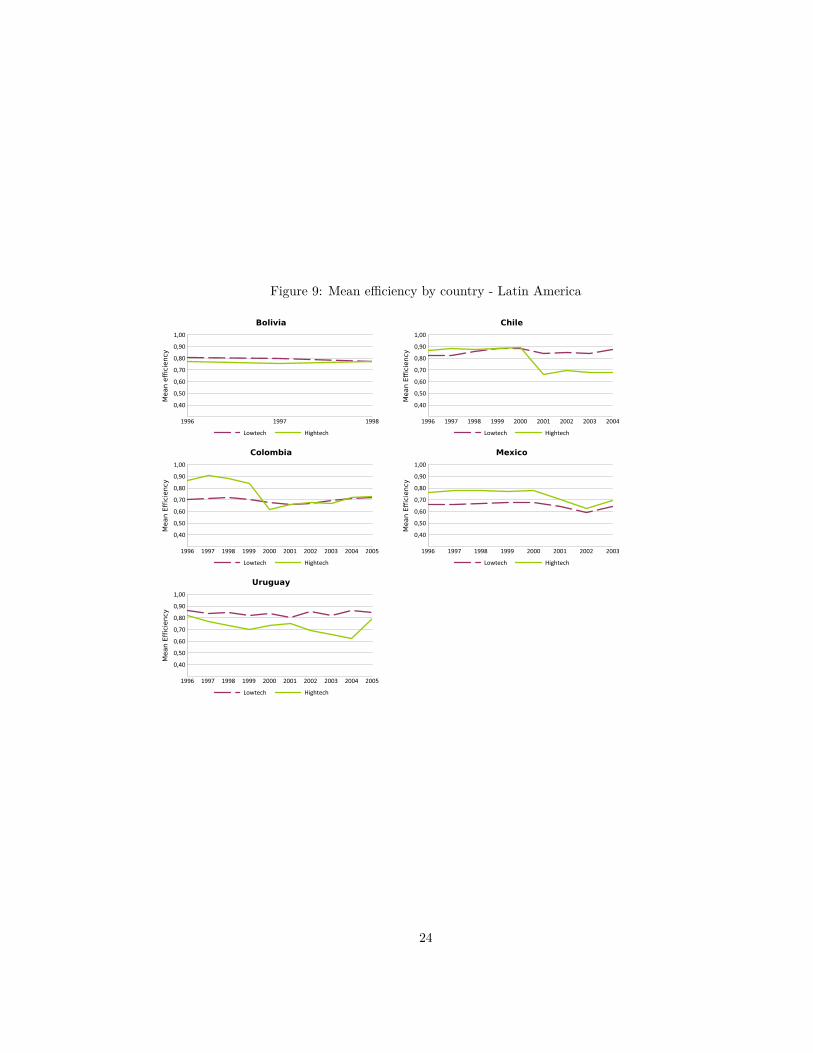
Figure 9: Mean efficiency by country - Latin America
1996 1997 1998
0,40
0,50
0,60
0,70
0,80
0,90
1,00
Mean e
ffic
iency
Lowtech Hightech
Bolivia
1996 1997 1998 1999 2000 2001 2002 2003 2004
0,40
0,50
0,60
0,70
0,80
0,90
1,00
Mean E
ffic
iency
Lowtech Hightech
Chile
1996 1997 1998 1999 2000 2001 2002 2003 2004 2005
0,40
0,50
0,60
0,70
0,80
0,90
1,00
Mean E
ffic
iency
Lowtech Hightech
Colombia
1996 1997 1998 1999 2000 2001 2002 2003
0,40
0,50
0,60
0,70
0,80
0,90
1,00
Mean E
ffic
iency
Lowtech Hightech
Mexico
1996 1997 1998 1999 2000 2001 2002 2003 2004 2005
0,40
0,50
0,60
0,70
0,80
0,90
1,00
Mean E
ffic
iency
Lowtech Hightech
Uruguay
24

2012 © IMT Institute for Advanced Studies, Lucca
Piazza San ponziano 6, 5100 Lucca, Italy. www.imtlucca.it