Embed Size (px)
Citation preview

University of Windsor University of Windsor
Scholarship at UWindsor Scholarship at UWindsor
Electronic Theses and Dissertations Theses, Dissertations, and Major Papers
4-15-2017
Absorption/Adsorption Properties of Peroxidase-Catalyzed Absorption/Adsorption Properties of Peroxidase-Catalyzed
Polyphenolic Precipitates Using 4-(Phenylazo) Benzoic Acid as a Polyphenolic Precipitates Using 4-(Phenylazo) Benzoic Acid as a
Model Sorbate Model Sorbate
Kayven Wayne Beemer University of Windsor
Follow this and additional works at: https://scholar.uwindsor.ca/etd
Recommended Citation Recommended Citation Beemer, Kayven Wayne, "Absorption/Adsorption Properties of Peroxidase-Catalyzed Polyphenolic Precipitates Using 4-(Phenylazo) Benzoic Acid as a Model Sorbate" (2017). Electronic Theses and Dissertations. 5930. https://scholar.uwindsor.ca/etd/5930
This online database contains the full-text of PhD dissertations and Masters’ theses of University of Windsor students from 1954 forward. These documents are made available for personal study and research purposes only, in accordance with the Canadian Copyright Act and the Creative Commons license—CC BY-NC-ND (Attribution, Non-Commercial, No Derivative Works). Under this license, works must always be attributed to the copyright holder (original author), cannot be used for any commercial purposes, and may not be altered. Any other use would require the permission of the copyright holder. Students may inquire about withdrawing their dissertation and/or thesis from this database. For additional inquiries, please contact the repository administrator via email ([email protected]) or by telephone at 519-253-3000ext. 3208.

Absorption/Adsorption Properties of Peroxidase-Catalyzed Polyphenolic Precipitates Using 4-(Phenylazo) Benzoic Acid as a Model Sorbate
By
Kayven Beemer
A Thesis
Submitted to the Faculty of Graduate Studies
through the Department of Chemistry and Biochemistry
in Partial Fulfillment of the Requirements for
the Degree of Master of Science
at the University of Windsor
Windsor, Ontario, Canada
2017
© 2017 Kayven Beemer
“Absorption/Adsorption Properties of Peroxidase-Catalyzed Polyphenolic Precipitates Using 4-(phenylazo) Benzoic Acid as a
Model Sorbate”
by
Kayven Beemer
APPROVED BY:
__________________________________________________
N. Biswas
Department of Civil & Environmental Engineering
__________________________________________________
J.R. Green
Department of Chemistry & Biochemistry
__________________________________________________
K. Taylor, Advisor
Department of Chemistry & Biochemistry
March 24, 2017

iii
DECLARATION OF ORIGINALITY
I hereby certify that I am the sole author of this thesis and that no part of this thesis has been
published or submitted for publication. I certify that, to the best of my knowledge, my thesis
does not infringe upon anyone’s copyright nor violate any proprietary rights and that any ideas,
techniques, quotations, or any other material from the work of other people included in my
thesis, published or otherwise, are fully acknowledged in accordance with the standard
referencing practices. Furthermore, to the extent that I have included copyrighted material that
surpasses the bounds of fair dealing within the meaning of the Canada Copyright Act, I certify
that I have obtained a written permission from the copyright owner(s) to include such
material(s) in my thesis and have included copies of such copyright clearances to my appendix.
I declare that this is a true copy of my thesis, including any final revisions, as approved by my
thesis committee and the Graduate Studies office, and that this thesis has not been submitted
for a higher degree to any other University or Institution.

iv
ABSTRACT
The adsorption or absorption of 4-(phenylazo)benzoic acid onto polyphenolic precipitates shows
promise as a model system for adsorption and absorption of hydrophobic waste compounds.
Using 1 mM of phenol under conditions used for enzyme conversion with soybean peroxidase
and hydrogen peroxide (1 U/mL soybean peroxidase and 1.5 mM hydrogen peroxide) two
conditions of ad/absorption were characterized with the Langmuir isotherm. These conditions,
hereby referred to as static and dynamic, consist of ad/absorption onto phenolic precipitates
either during enzymatic conversion of phenol (dynamic) or after enzymatic conversion of phenol
(static). Both the dynamic and static systems showed high affinity for phenolic precipitates with
Langmuir association constants of 0.088 and 0.13 L/mg, respectively. The dynamic system
showed a 3-fold greater maximum ab/adsorption capacity than the static system, 51 and 16
mg/g, respectively. During the characterization process the pKa of 4-(phenylazo)benzoic acid
was determined to be 2.45 and the possibility of enzyme-catalyzed reductive splitting of the azo-
bond was studied. The characterization of the ad/absorption of 4-(phenylazo)benzoic acid onto
phenolic precipitates showed good fit with the Langmuir isotherm. This opens the possibility of
characterization of other adsorption systems with phenolic precipitates for the purpose of
expanding the scope of the SBP enzymatic process as a waste-water treatment method beyond
its direct substrates.

v
DEDICATION
To my family thanks for all the support you’ve given me throughout these years.

vi
ACKNOWLEDGEMENTS
I would like to convey my sincere appreciation to my advisers and those on my committee. I
would like to thank Dr. Keith Taylor and Dr. Nihar Biswas for their patience, support and valuable
suggestions throughout my Master’s study. I would also like to thank Dr. James Green and Dr.
Jatinder Bewtra for their recommendations.
I would also like to thank Nedhal Al-Nidawy, Marlene Bezaire and Elizabeth Kickham for all the
help they provided over the years.
To my friends and colleagues: Neda Mashhadi, Miao Chen, Wei Feng, Laura Cordova Villegas,
Wenhao Chen, Sherin Thomas Varghese, Andrew Schoof, Baturh Yarkwan, Nathalie Jimenez and
Debjani Mukherjee, thanks for the assistance and good times for the past couple of years.

vii
TABLE OF CONTENTS
DECLARATION OF ORIGINALITY .....................................................................................................iii.
ABSTRACT ………………………………………………………………………………………….…..…………………………………iv.
DEDICATION……………………………………………………………………………….………………………………………………v.
ACKNOWLEDGEMENTS...................................................................................................................vi.
LIST OF TABLES................................................................................................................................x.
LIST OF FIGURES..............................................................................................................................xi.
LIST OF ABBREVIATIONS ……………………………………………………………………………………………………..…...xiii.
1. Introduction..................................................................................................................................1
1.1 BTEX Group Compounds...........................................................................................................2
1.2 Phenol as a pollutant and phenolic polymers..........................................................................3
1.3 Soybean Peroxidase..................................................................................................................4
1.4 Peroxidase reaction mechanism...............................................................................................5
1.5 Objectives and Scope................................................................................................................6
2. Literature Review.........................................................................................................................8
2.1 Phenol.......................................................................................................................................8
2.2 4-(phenylazo)benzoic acid........................................................................................................9
2.3 Structure of Enzyme Polymers in Particular Phenolic Precipitates...........................................9
2.4 Azo Bond Cleavage.................................................................................................................11
2.5 Langmuir Adsorption Model...................................................................................................16
3. Materials and Experimental Methods .......................................................................................18
3.1 Materials ................................................................................................................................18
3.1.1 Enzymes ..............................................................................................................................18
3.1.2 Buffers.................................................................................................................................18
3.1.3 Reagents .............................................................................................................................18
3.1.4 Aromatic Compounds........................................................................................................18
3.2 Analytical Equipment .............................................................................................................19
3.2.1 Ultraviolet-Visible Spectroscopy .......................................................................................19
3.2.2 Centrifuge .........................................................................................................................19
3.2.3 pH meter ……………………………………..………………………………….....……………………………………….19

viii
3.2.4 High Performance Liquid Chromatography (HPLC) ...........................................................19
3.2.5 Other Equipment ..........................................................................................………………….19
3.3 Analytical Methods ................................................................................................................20
3.3.1 Enzyme Stock Solution Preparation...................................................................................20
3.3.2 4-(phenylazo)benzoic acid and SBP enzymatic reaction....................................................20
3.3.3 Dynamic Absorption Method............................................................................................20
3.3.4 Enzymatic reaction of 4-aminobenzoic acid (PABA)..........................................................20
3.3.5 Acidification of PABA polymer...........................................................................................21
3.3.6 pKa determination of 4-(phenylazo)benzoic acid..............................................................21
3.3.7 Enzyme Activity Assay........................................................................................................21
3.3.8 Hydrogen Peroxide Concentration Test ............................................................................22
3.3.9 Phenolic Precipitate Dry Mass...........................................................................................22
3.3.10 Extraction Method...........................................................................................................22
3.3.11 Static Adsorption method................................................................................................23
3.3.12 Langmuir Analysis............................................................................................................23
3.3.13 HPLC analysis...................................................................................................................24
3.3.14 Buffer Preparation...........................................................................................................24
4. Results........................................................................................................................................25
4.1 pKa Determination.................................................................................................................25
4.2 Initial dynamic absorption tests.............................................................................................28
4.3 4-(Phenylazo)benzoic acid enzymatic conversion..................................................................30
4.4 Para-aminobenzoic acid and aniline.......................................................................................32
4.5 Para-aminobenzoic acid enzymatic conversion.....................................................................36
4.6 Low concentration 4-(phenylazo)benzoic acid enzymatic conversion...................................42
4.7 Initial static adsorption tests..................................................................................................44
4.8 Extraction of 4-(phenylazo)benzoic acid from phenolic precipitates.....................................46
4.9 Langmuir static analysis..........................................................................................................51
4.10 Langmuir dynamic analysis...................................................................................................54
5. Discussion ..................................................................................................................................58
5.1 pKa Determination.................................................................................................................58

ix
5.2 Initial dynamic absorption tests.............................................................................................59
5.3 4-(Phenylazo)benzoic acid enzymatic conversion..................................................................60
5.4 P-aminobenzoic acid enzymatic conversion...........................................................................60
5.5 Low concentration 4-(phenylazo)benzoic acid enzymatic conversion...................................62
5.6 Initial static adsorption tests..................................................................................................63
5.7 Extraction of 4-(Phenylazo)benzoic Acid................................................................................65
5.8 Langmuir Analysis...................................................................................................................66
6. Conclusions.................................................................................................................................73
REFERENCES...................................................................................................................................74
APPENDIX A (SBP activity assay).....................................................................................................79
APPENDIX B (Hydrogen Peroxide Assay)........................................................................................80
APPENDIX C (Langmuir Isotherm)..................................................................................................82
APPENDIX D (Standard Curves)......................................................................................................84
VITA AUCTORIS………………………………………………………………………………………………………………………....89

x
LIST OF TABLES
Table 1-1: Physical properties of the BTEX group compounds (benzene, toluene, ethylbenzene and xylenes)…………….………….………….………….………….……………….………….………….……………………………2
Table 1-2: Comparison of SBP and HRP-C catalytic efficiency at pH 5 and 6.8………………………........4
Table 2-1: Chemical and physical properties of phenol...................................................................8
Table 3-1: HPLC Methods...............................................................................................................24
Table 4-1: Initial dynamic absorption tests....................................................................................29
Table 4-2: Experiments to determine the possibility of 4(phenylazo)benzoic acid reacting with SBP..................................................................................................................................................31
Table 4-3: Enzymatic Conversion tests for PABA using SBP and hydrogen peroxide……...............37
Table 4-4: Experiments to confirm the polymerization of PABA by precipitating the polymer.....39
Table 4-5: Experiments to determine the extent of polymerization of PABA under lower concentration conditions.....................….………….………….………….………….………….………….…………….41
Table 4-6: Experiments to determine the quality of 4-(phenylazo)benzoic acid as a substrate of SBP under low enzyme and hydrogen peroxide conditions........................………………………………..43
Table 4-7: Initial static adsorption tests..........................................................................................45
Table 4-8: Dynamic absorption extraction test..............................................................................47
Table 4-9: Static adsorption extraction test...................................................................................49
Table 4-10: Dry mass of the suspension before and after extraction............................................50
Table 4-11: Data for the Langmuir analysis of static adsorption shown in Figure 4-19.................51
Table 4-12: Data for the Langmuir analysis of static adsorption shown in Figure 4-20.................53
Table 4-13: Data for the Langmuir analysis of dynamic absorption in Figure 4-21........................54
Table 4-14: Data for the Langmuir analysis of dynamic absorption shown in Figure 4-22............55
Table 5-1: Langmuir analysis for both static and dynamic systems of 4-(phenylazo)benzoic acid ad/absorption onto phenolic precipitates.....................................................................................66
Table 5-2: Langmuir analysis for benzene and toluene onto activated carbon F-400...................71
Table C-1: Static Langmuir analysis.................................................................................................83
Table C-2: Dynamic Langmuir analysis...........................................................................................84

xi
LIST OF FIGURES
Figure 1-1: The structure of soybean peroxidase created by RCSB PDB four letter code 1FHF…....5
Figure 2-1: Structure of phenol.....................................................………….………….…………………………8
Figure 2-2: Structure of 4-(phenylazo)benzoic acid.........................................................................9
Figure 2-3: Polymerization of phenol in the presence of SBP........................................................11
Figure 2-4: Asymmetric azo bond cleavage of CP6R......................................................................13
Figure 2-5: Symmetric azo bond cleavage of CP6R .......................................................................15
Figure 4-1: Absorption spectrum for an acidic solution of Azo......................................................25
Figure 4-2: Absorption spectrum for a basic solution of Azo.........................................................26
Figure 4-3: Titration of 4-(phenylazo)benzoic acid with sodium hydroxide...................................27
Figure 4-4: The first derivative of the titration curve in Figure 4-3................................................28
Figure 4-5: Initial dynamic absorption test results of Table 4-1.....................................................29
Figure 4-6: 4-(phenylazo)benzoic acid enzymatic conversion results of Table 4-2........................32
Figure 4-7: HPLC chromatogram of 4-(phenylazo)benzoic acid, PABA and aniline in the same solution……………………………………………………………………………………………………………………………………..33
Figure 4-8: No-enzyme control for a 4-(phenylazo)benzoic acid enzymatic conversion test.........33
Figure 4-9: Chromatogram of the no-enzyme control in Figure 4-8 measured at 325 nm............34
Figure 4-10: Chromatogram of a no-H2O2 control for a 4-(phenylazo)benzoic acid enzymatic conversion………………………………….………….………………...………….………….………….……………………………35
Figure 4-11: Chromatogram for a 4-(phenylazo)benzoic acid enzymatic conversion....................36
Figure 4-12: PABA enzymatic conversion results of Table 4-3.......................................................37
Figure 4-13: PABA acidification results of Table 4-4.......................................................................39
Figure 4-14: Low concentration PABA enzymatic conversion results of Table 4-5........................41
Figure 4-15: 4-(phenylazo)benzoic acid low concentration enzymatic conversion results of Table 4-6…………………….………….………………….………….………….………….………….………….………….………….………44
Figure 4-16: Initial static adsorption results of Table 4-7...............................................................46
Figure 4-17: Dynamic absorption extraction results of Table 4-8..................................................47
Figure 4-18: Static extraction results of Table 4-9..........................................................................49
Figure 4-19: Linearized Langmuir analysis of 4-(phenylazo)benzoic acid adsorption onto phenolic precipitates under static conditions data Table 4-11........………….…………………………….……………....52
Figure 4-20: Langmuir analysis of 4-(phenylazo)benzoic acid adsorption onto phenolic precipitates under static conditions, data of Table 4-12...............................................................53

xii
Figure 4-21: Linearized Langmuir analysis of 4-(phenylazo)benzoic acid absorption onto phenolic precipitates under dynamic conditions, data Table 4-13...............................................................55
Figure 4-22: Langmuir analysis of 4-(phenylazo)benzoic acid absorption onto phenolic precipitates under dynamic conditions, data Table 4-14…...........………….………….………….…..………56
Figure D-1: 4-(phenylazo)benzoic acid standard curve for 5 mM buffer stock solution................85
Figure D-2: 4-(phenylazo)benzoic acid standard curve for 100% acetonitrile stock solution........86
Figure D-3: PABA standard curve for concentrations from 7.58 – 75.8 μM...................................87
Figure D-4: PABA standard curve for concentrations from 0.076 – 0.76 mM................................87
Figure D-5: Aniline standard curve.................................................................................................88

xiii
LIST OF ABBREVIATIONS
Azo – 4-(phenylazo)benzoic acid
PABA – para-aminobenzoic acid
SBP – soybean peroxidase
HRP – horseradish peroxidase
HPLC – high performance liquid chromatography
BTEX – benzene, toluene, ethylbenzene and xylenes
CP6R - crystal ponceau 6R
HOBT – hydroxybenzotriazole
BET - Brunauer–Emmett–Teller
GAC – granular activated carbon

1
Chapter 1
1. Introduction:
Enzymatic methods have been developed in recent decades to treat wastewater as a
complement to or replacement of conventional methods. One class of enzyme that has been
extensively investigated is oxidative enzymes, primarily peroxidases and laccases. Soybean
peroxidase (SBP) is a peroxidase that can be used as a removal agent to “clean out” organic
materials from water that are substrates of SBP through oxidative means. Many studies have
shown that SBP is an effective treatment method for the removal of phenols and anilines from
wastewater by causing the substrate to form oligomers and polymers of sufficient size to
precipitate out of the solution. A limitation of SBP as a wastewater treatment method is that it
can only be used for its substrates. Many toxic compounds that are found in wastewater are
hydrophobic in nature and only sparingly soluble in water. For example, the solubility of toluene,
one of the BTEX group compounds which are highly toxic to humans and part of industrial waste,
is 0.52 g/L[2]. Toluene is not a substrate of SBP and therefore cannot be removed from
wastewater through the enzymatic process. The enzymatic process for phenol however, does
create a polymer resin to which organic compounds like toluene could adhere. Previous studies
were done using BTEX group compounds to show this adsorption onto the resin formed by SBP-
catalyzed reaction of phenol. The BTEX group of compounds proved too volatile for reliable
analysis[32] and so a model compound was chosen to characterize this interaction. The model
compound 4-(phenylazo)benzoic acid was chosen because it was not considered a substrate of
SBP and it is relatively hydrophobic.

2
1.1 BTEX Group Compounds:
BTEX group compounds (benzene, toluene, ethylbenzene and xylenes) are by-products of many
industrial processes and they pose a serious problem due to their high water solubility. Benzene
can be found in gasoline, toluene is used as a paint solvent and is commonly found in petroleum
products, ethylbenzene is used as a gasoline fuel additive and xylenes are found in gasoline and
used as industrial solvents[2]. Some physical properties of these compounds are shown in Table
1-1.
Table 1-1: Physical properties of the BTEX group compounds (benzene, toluene, ethylbenzene and
xylenes).
Benzene Toluene Ethylbenzene Xylene Reference
Density
(g/mL)
0.8765 0.8669 0.8670 0.8685 2
Polarity Non-polar Non-polar Non-polar Non-polar 2
Water
Solubility
(g/L)
1.78 0.52 0.15 0.15 2
Exposure to BTEX group compounds in gasoline has been linked to skin irritation, dizziness,
headache, sleepiness and loss of coordination in the short term where as prolonged exposure
can affect the liver, kidney and blood systems.
Recent methods of BTEX group compound treatment in wastewater involves taking advantage of
the non-polar structure of these compounds by providing a surface that is favourable for
adsorption. One example of this is the use of carbon nanotubes to enhance BTEX group surface
adsorption[3]. Methods like the use of carbon nanotubes which enhance the adsorption of these
compounds are costly with prices of around $400,000 per metric tonne of carbon nanotubes[9].
Alternative methods like the use of granular activated carbon (GAC) or the use of a peroxidase
like SBP along with a substrate of SBP could allow for the cheap and easy production of a surface

3
for BTEX group adsorption. This would make the removal of BTEX group compounds through
adsorption methods more viable as the group compounds could then be removed cheaply while
also treating other toxic compounds such as phenol using the enzymatic reaction. Phenol and
BTEX are likely to co-occur in refinery waste streams, for example[33].
1.2 Phenol as a pollutant and phenolic polymers:
Phenolic compounds occur naturally in water and soil through decomposition of biological
waste. They are also produced industrially from many different sectors and hence are present in
many wastewater treatment plants. Most industrially discharged phenols are from the pulp
paper and wood industry which had an average effluent concentration of 0.4 mg/L[10]. Phenols
can be removed from wastewater through an enzyme-catalyzed process using peroxidases like
horseradish peroxidase (HRP) or SBP. This system is well documented and everything from
removal effectiveness, reaction kinetics, the chemical mechanism and many different
peroxidases have been studied. Enzymatic treatment of phenol or any other substrate involves
oxidation of the substrate to a free radical, non-enzymatic radical coupling and subsequent
polymerization to create phenolic polymers. These are oligomer or polymer level chains of
phenol compounds that get too large to remain dissolved in the aqueous solution and thus
precipitate out. The polymers are particularly non-polar and make a good surface for non-polar
compounds such as BTEX group compounds to adhere to. If the binding were favourable, the
usefulness of SBP and other enzymes in wastewater treatment would increase due to the ability
to remove non-polar toxic compounds as well as its substrates.

4
1.3 Soybean Peroxidase:
Soybean peroxidase is a member of the class III plant peroxidase superfamily. It can be found in
the seed coat of soybeans and, like other peroxidases, it has been used to catalyze the oxidation
of phenols, anilines and other aromatic substrates with hydrogen peroxide[16]. In comparison
with horseradish peroxidase (HRP), the more extensively studied peroxidase, SBP shows 57%
amino acid sequence homology and is more thermally stable than HRP[16]. This may be due to an
increased ionic and hydrophobic interaction at the heme cavity that helps stabilize its native
conformation[13]. Optimal phenol polymerization using SBP is at pH = 6.4 but greater than 90% of
its catalytic activity is retained in the pH range of 5.7-7.0[17]. SBP’s thermal stability is not only
greater than HRP’s but is also quite high in its own right, losing no activity after a 12 h incubation
at 70°C[18].
When comparing SBP to HRP-C in terms of catalytic efficiency the constants used are kcat
(catalytic constant) and Km (Michaelis constant) with the catalytic efficiency being defined as the
kcat/Km. The comparison of catalytic efficiency at pH = 5.0 and 6.8 with hydrogen peroxide (at 0.5
mM, a non-rate-limiting concentration) and 2,2'-azino-bis(3-ethylbenzothiazoline-6-sulphonic
acid) (ABTS; a common substrate for activity assay) for HRP and SBP are shown in the table
below.
Table 1-2: Comparison of SBP and HRP-C catalytic efficiency at pH 5.0 and 6.8
Enzyme kcat (s-1) KM (μM-1) kcat/Km (μM -1s-1) pH Reference
SBP 1230 ± 58 173 ± 9 7.1 ± 0.1 6.8 13
SBP 2663 ± 17 45 ± 1 59.2 ± 0.9 5.0 13
HRP-C 736 ± 10 178 ± 8 4.1 ± 0.1 6.8 13
HRP-C 810 ± 11 270 ± 8 3 ± 0.1 5.0 14
K constants are with ABTS and H2O2 as substrates

5
The active site of SBP contains a heme group consisting of 4 pyrrole rings connected by methine
bridges coordinated to Fe (III). The entire structure of SBP is shown in Figure 1-1.
Figure 1-1: The structure of soybean peroxidase created by RCSB PDB four letter code 1FHF[34]
1.4 Peroxidase reaction mechanism:
The peroxidase mechanism comes from HRP studies though the mechanism for SBP is the same.
The three-step reaction process is shown below where in the first step the native form of the
6
enzyme is oxidized by hydrogen peroxide for a loss of 2 electrons and becomes compound I
while hydrogen peroxide is reduced to water. In the second step compound I oxidizes the
substrate (AH, example phenol) and generates a free radical (A·) and becomes compound II. In
step 3 compound II oxidizes another substrate molecule, generating another free radical and
returns HRP to its native state[19].
HRP[FeIII] +H2O2 Compound I [FeIV = O, porphyrin π – cation radical] +H2O
Compound I [FeIV = O, porphyrin π – cation radical] + AH Compound II [FeIV = O] + A· + H+
Compound II [FeIV = O] + AH HRP[FeIII] + A + OH—
The radicals formed by the above reaction couple to form a dimer which can be further oxidized
by SBP for form trimers or tetramers. This process continues until the polymer is too big to
remain dissolved and precipitates out. The first two steps are very fast compared to the third,
which is the rate-determining step[19]. From the reaction it would be expected that a 2:1 molar
ratio of AH to hydrogen peroxide would be required to facilitate the reaction. In reality it is much
higher as the oxidation of reaction intermediates consume hydrogen peroxide during
subsequent cycles of the oligomerization reaction. The experimental ratios vary for different
substrates but are typically 1:1 or even higher[20].
1.5 Objectives and Scope
The objectives for this study were as follows:
1. To determine the extent to which 4-(phenylazo)benzoic acid ad/absorbs onto phenolic
precipitates.
2. To measure the difference between dynamic and static ad/absorption and determine their
effectiveness.

7
3. To obtain a Langmuir analysis of any relevant ad/absorption systems.
4. To determine if ad/absorption onto hydrophobic precipitates could be a viable method for
removing toxic non-substrates of SBP from wastewater.
The scope of the study includes:
1. Determining the pKa of 4-(phenylazo)benzoic acid
2. Determining if 4-(phenylazo)benzoic acid undergoes reductive azo-bond splitting in the
presence of SBP and hydrogen peroxide.
3. Determining whether static or dynamic ad/absorption is more effective.
4. Determining the viability of using phenolic precipitates to remove toxic non-substrates of SBP
from wastewater.

8
Chapter 2
2. Literature Review:
2.1 Phenol:
Phenol is a white crystalline solid at room temperature. The chemical formula is C6H5OH with a
molecular mass of 94.11 g/mol.
Figure 2-1: Structure of phenol.
Below is a table of chemical and physical properties of phenol.
Table 2-1: Chemical and physical properties of phenol
Property Reference
Melting point (°C) 41 4
Boiling point (°C) 182 4
Vapour pressure (Pa) 47 5
pKa 9.99 5
Log Koc (carbon water
partition coefficient)
1.15–3.49 10
Log Kow (octanol water
partition constant)
1.46 11
Solubility in water (g/L) 88.3 12

9
The toxicity of phenol has been widely studied. Phenol can cause severe skin and eye and
mucous membrane irritation [10]. Studies of phenol as a carcinogen show correlation between
cancer mortality and exposure to phenol. Long term phenol exposure can cause damage to the
heart, lungs, liver and kidneys [15].
2.2 4-(phenylazo)benzoic acid:
4-(phenylazo)benzoic acid is a relatively hydrophobic compound, Figure 4-2, that contains
benzene rings, a carboxylic acid group and an azo bond linking the two rings together. The
chemical formula is C13H10N2O2 with a molecular mass of 226.23 g/mol. It is an orange powder at
room temperature, has a melting point of 242-244°C[22] and is sparsely soluble in water.
Figure 2-2: Structure of 4-(phenylazo)benzoic acid
2.3 Structure of Enzyme Polymers in Particular Phenolic Precipitates:
As mentioned in the peroxidase reaction mechanism section, peroxidases like SBP form radicals
which bind together substrate molecules into oligomers and polymers. This reaction continues
as long as the substrate polymer is small enough to remain dissolved in water. Once the polymer
is large enough it is precipitated out removing the substrate from the water and thus ending the
reaction. This reaction can be carried further if a water-miscible solvent is used such as acetone
or ethanol, which would allow the polymer to remain dissolved in the solution to undergo more
10
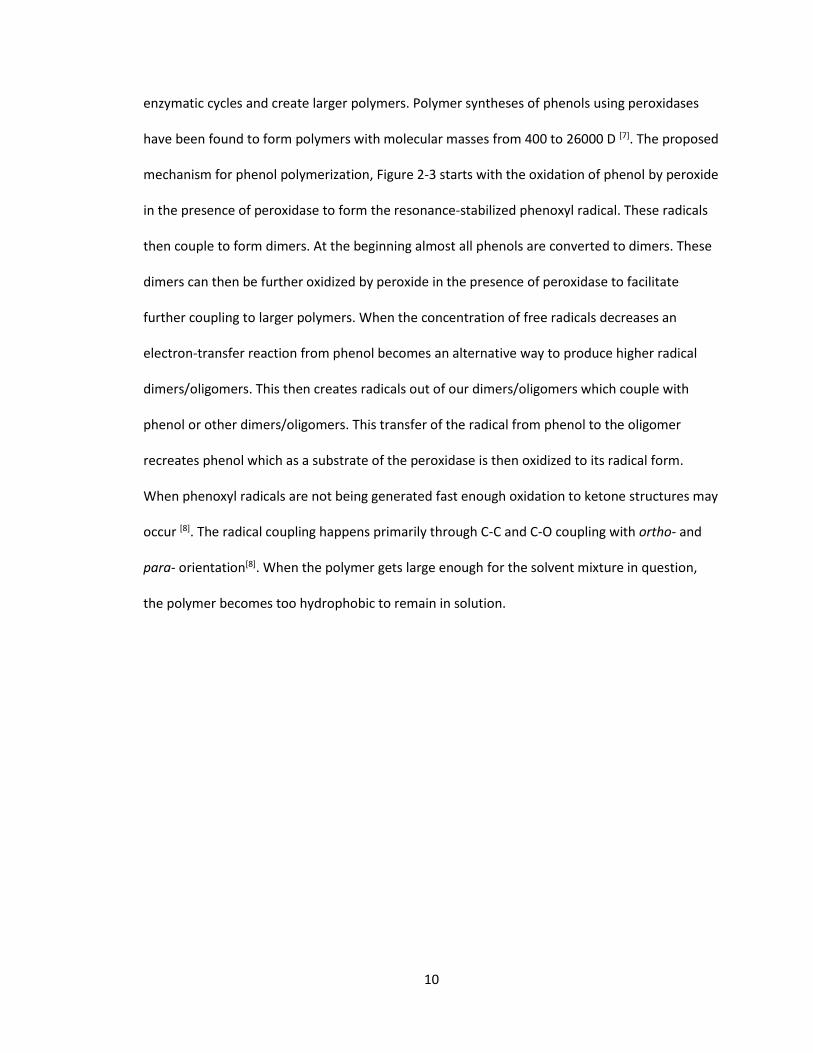
enzymatic cycles and create larger polymers. Polymer syntheses of phenols using peroxidases
have been found to form polymers with molecular masses from 400 to 26000 D [7]. The proposed
mechanism for phenol polymerization, Figure 2-3 starts with the oxidation of phenol by peroxide
in the presence of peroxidase to form the resonance-stabilized phenoxyl radical. These radicals
then couple to form dimers. At the beginning almost all phenols are converted to dimers. These
dimers can then be further oxidized by peroxide in the presence of peroxidase to facilitate
further coupling to larger polymers. When the concentration of free radicals decreases an
electron-transfer reaction from phenol becomes an alternative way to produce higher radical
dimers/oligomers. This then creates radicals out of our dimers/oligomers which couple with
phenol or other dimers/oligomers. This transfer of the radical from phenol to the oligomer
recreates phenol which as a substrate of the peroxidase is then oxidized to its radical form.
When phenoxyl radicals are not being generated fast enough oxidation to ketone structures may
occur [8]. The radical coupling happens primarily through C-C and C-O coupling with ortho- and
para- orientation[8]. When the polymer gets large enough for the solvent mixture in question,
the polymer becomes too hydrophobic to remain in solution.
11
Figure 2-3: Polymerization of phenol in the presence of SBP.
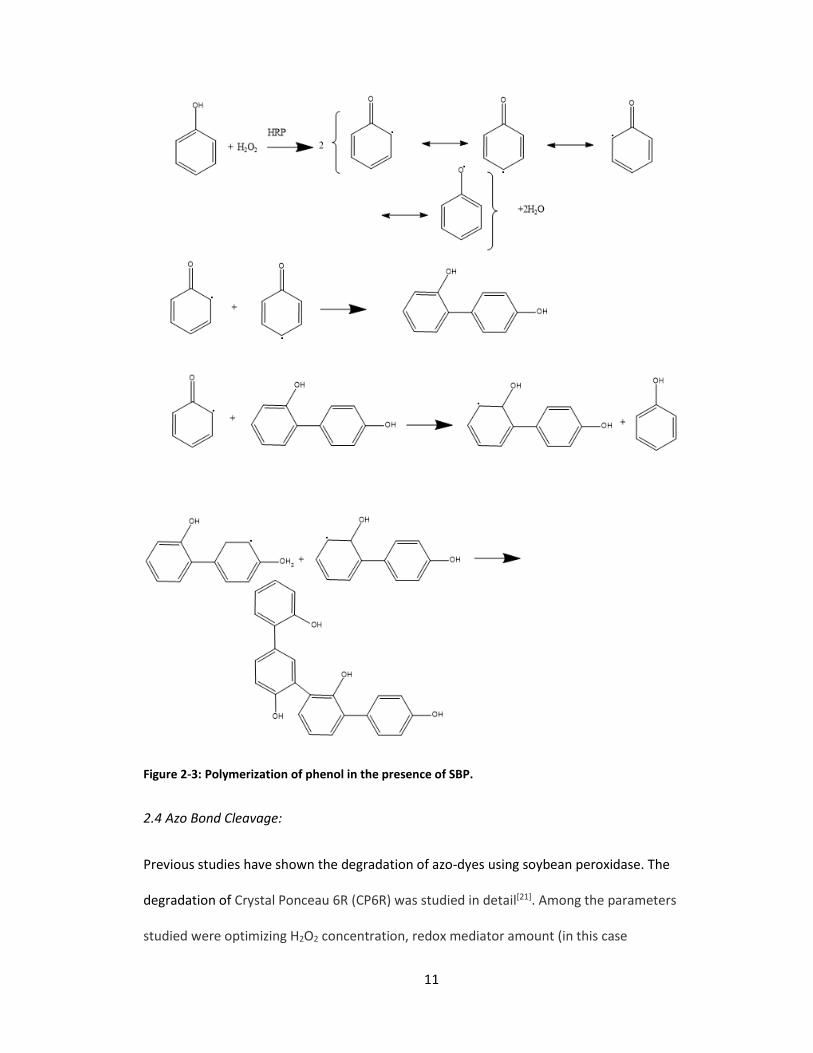
2.4 Azo Bond Cleavage:
Previous studies have shown the degradation of azo-dyes using soybean peroxidase. The
degradation of Crystal Ponceau 6R (CP6R) was studied in detail[21]. Among the parameters
studied were optimizing H2O2 concentration, redox mediator amount (in this case

12
hydroxybenzotriazole or HOBT was used) and pH of the solution. CP6R was found to resist
degradation without the addition of a redox mediator and so HOBT was used at 50 μM to ensure
dye degradation. Hydrogen peroxide concentrations as well as pH were also optimized in this
study. CP6R was found to undergo a reaction pathway through SBP and HOBT that involved the
oxidation of CP6R to create a CP6R radical. The overall reaction is very similar to the general
peroxidase reaction mechanism except it includes a transfer of the radical from HOBT to SBP.
This reaction is a 4-step reaction with the first step being native SBP reacts with hydrogen
peroxide to become compound I and water. The second step sees the abstraction of hydrogen
from HOBT which forms compound II and a HOBT radical. The third step involves a second
abstraction of hydrogen forming a second HOBT radical and the recovery of native SBP. The final
reaction involves a HOBT radical attacking the CP6R and abstracting a hydrogen forming a CP6R
radical. The reaction scheme is shown below.
SBP [FeIII]+H2O2 SBP [FeIV = O, porphyrin π – cation radical] +H2O Compound I (SBP [FeIV = O, porphyrin π – cation radical] +HOBT ) Compound II (SBP [FeIV = O] + ∙HOBT) Compound II (SBP [FeIV = O] +HOBT) SBP [FeIII] + ∙HOBT +H2O ∙HOBT+CP6R HOBT+ ∙CP6R
Two different reaction pathways have been proposed for azo bond cleavage, asymmetric and
symmetric bond cleavage. Asymmetric reaction, Figure 2-4, cleaves at a C-N site to create an
N=NH group and a ketone in the respective fragments. Degradation continues after this point to
produce carboxylic acids as the end product of this reaction pathway.

13
Figure 2-4: Asymmetric azo bond cleavage of CP6R[21]
14
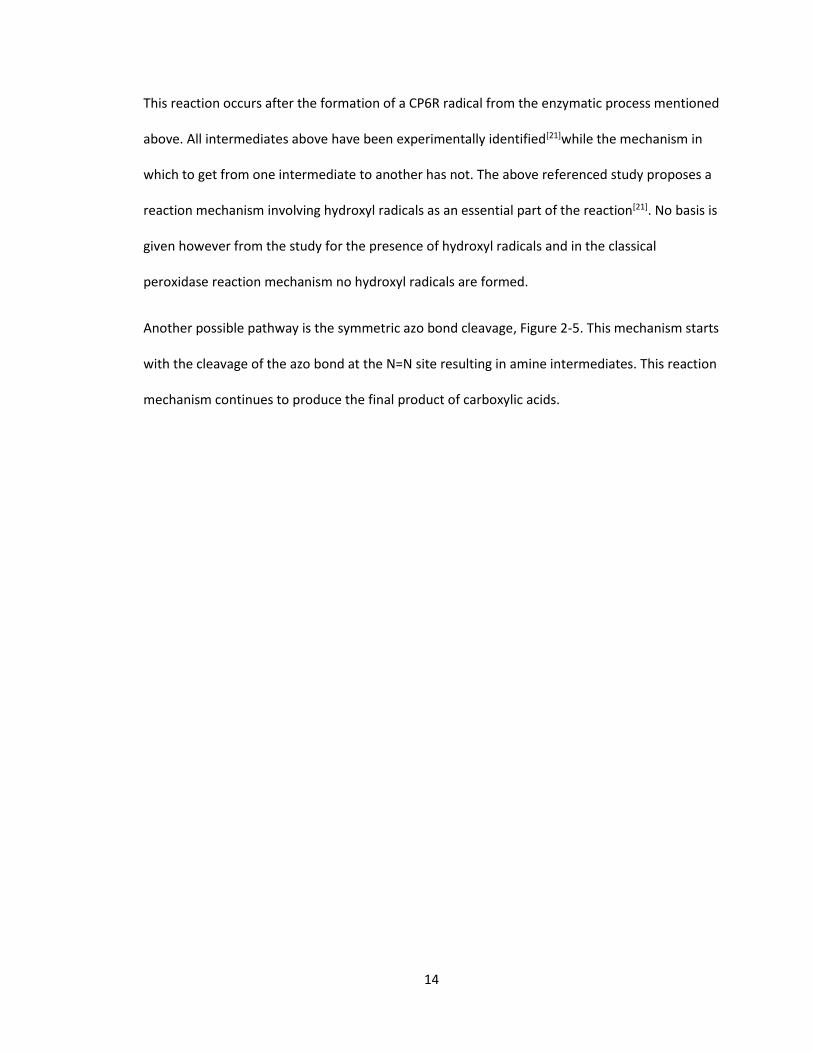
This reaction occurs after the formation of a CP6R radical from the enzymatic process mentioned
above. All intermediates above have been experimentally identified[21]while the mechanism in
which to get from one intermediate to another has not. The above referenced study proposes a
reaction mechanism involving hydroxyl radicals as an essential part of the reaction[21]. No basis is
given however from the study for the presence of hydroxyl radicals and in the classical
peroxidase reaction mechanism no hydroxyl radicals are formed.
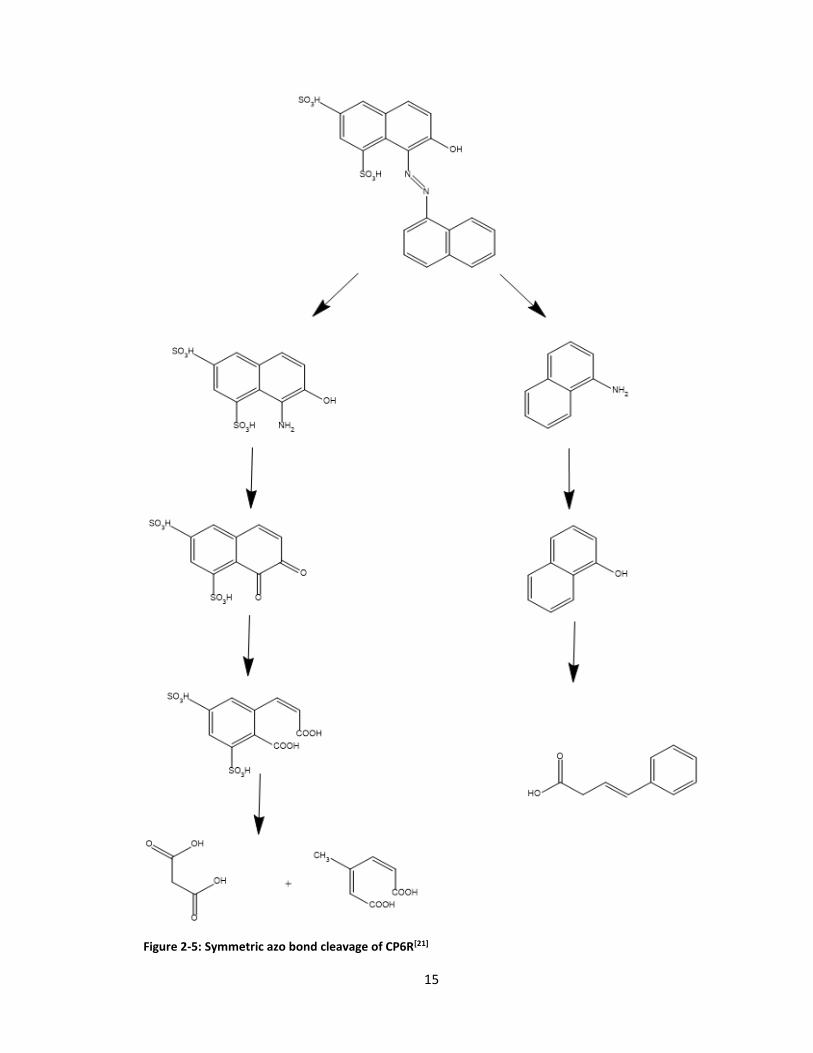
Another possible pathway is the symmetric azo bond cleavage, Figure 2-5. This mechanism starts
with the cleavage of the azo bond at the N=N site resulting in amine intermediates. This reaction
mechanism continues to produce the final product of carboxylic acids.
15
Figure 2-5: Symmetric azo bond cleavage of CP6R[21]

16
As mentioned previously the referenced study gives a reaction mechanism involving hydroxyl
radicals but no basis for their presence. After the symmetric bond cleavage instead of continuing
like the above reactions to form carboxylic acids, it is possible that SBP would oxidize the newly
formed anilines to create new radicals that then couple together to form polymers. Analogously
in both the asymmetric and symmetric azo bond cleavage the α-naphthol product could also
undergo oxidization from SBP and form polymers from there.
2.5 Langmuir Adsorption Model:
The Langmuir adsorption model is a very common model to measure the adsorption of a
substance onto a surface. The model makes three assumptions: 1) all adsorption sites on the
surface are equivalent, 2) each adsorption site can only be occupied by one molecule and only a
monolayer forms and 3) the adsorbed molecules do not interact with one another. This model’s
assumptions are obviously not applicable to every adsorption scenario as it simplifies the
molecular interactions greatly but it has still been used as a starting point for characterization of
adsorbed molecules. The Langmuir isotherm is given by the equation below.
𝑄𝑒
𝑄𝑚=
𝐾𝐶𝑒
1 + 𝐾𝐶𝑒
Where Qe is the adsorption capacity at equilibrium (mg/g), Qm is the maximum adsorption
capacity (mg/g), K is the Langmuir adsorption constant and Ce is the equilibrium concentration of
the adsorbate (mg/L). A linear form of the Langmuir constant was also used for preliminary
analysis of the adsorption system.
𝐶𝑒
𝑄𝑒=
1
𝑄𝑚𝐾+
𝐶𝑒
𝑄𝑚

17
The linear form, while useful for initial analyses, carries with it a greater amount of error. The
linear form plots Ce vs Ce/Qe which are not entirely independent variables as both involve the
value of Ce. This increases the amount of error in the linear regression and was plotted primarily
due to the ease of calculation with linear regression. All systems plotted linearly were also
plotted in the more classical form of the Langmuir model as well to avoid excess error.
Adsorption analysis is useful in quantifying uptake molecules by the phenolic precipitates
formed by peroxidase reactions.

18
Chapter 3
Materials and Experimental Methods
3.1 Materials
3.1.1 Enzymes
Crude dry solid SBP (Industrial Grade lot #18541NX) was obtained from Organic Technologies
(Coshocton, OH) and stored at -15℃. Liquid ARP (Arthromyces ramosus peroxidase) concentrate
(SP-502, activity 1200 U/mL) was obtained from Novzymes (Franklinton, NC). Both enzyme stock
solutions were stored at 4℃.
3.1.2 Buffers
Monobasic and dibasic sodium phosphate were purchased from BDH (Toronto, ON). HPLC grade
acetonitrile and water were purchased from Fisher Scientific Co (Fair Lawn, NJ). Ammonium
acetate was purchased from Sigma Aldrich (St. Louis, MO).
3.1.3 Reagents
Hydrogen peroxide (30% w/v) was purchased from ACP Chemicals Inc. and stored at 4℃. 4-
aminoantipyrine (4-AAP) was purchased from BDH (Toronto, ON) and stored at room
temperature.
3.1.4 Aromatic Compounds
Crystalline phenol, 4-(phenylazo)benzoic acid and aniline were purchased from Sigma Aldrich (St.
Louis, MO) and stored at room temperature. Para-aminobenzoic acid (PABA) was purchased
from Sigma Aldrich (St. Louis, MO) and stored at 4℃.

19
3.2 Analytical Equipment:
3.2.1 Ultraviolet-Visible Spectroscopy:
UV-Vis spectroscopy was done using an Agilent 8453 UV-Visible spectrophotometer. Cuvettes
used were made of quartz with a path length of 1 cm and purchased from Hellma Analytics
(Müllheim, Germany)
3.2.2 Centrifuge:
Centrifugation was done using a Corning LSETM compact centrifuge with 6*50 mL and 6*15 mL
centrifuge tubes at 4000 rpm.
3.2.3 pH meter:
Oakalon PC700 pH meter with a stainless steel micro pH probe was used to measure the pH of
all solutions in this study. Calibration buffers at pH =4.00, 7.00 and 10.00 were purchased from
ACP inc (Slough, England).
3.2.4 High Performance Liquid Chromatography (HPLC):
HPLC data was measured using Waters HPLC system with crucial components of the HPLC being
model 2489 UV/Visible detector, model 1525 binary HPLC Pump, and model 2707 auto-sampler.
3.2.5 Other Equipment:
Magnetic stir bars of various sizes were purchased from Fisher Scientific Co., syringes 10 mL and
5 mL were purchased from BD medical technologies, 0.2 μm filters were purchased from
Sarstedt (North Rhine-Westphalia, Nümbrecht, Germany) and 0.45 μm filter paper from
Advantec MFS (Dublin, CA).

20
3.3 Analytical Methods:
3.3.1 Enzyme Stock Solution Preparation:
SBP stock solution was prepared using 0.12-0.14 g of solid enzyme and 100 mL of distilled water.
These two components were mixed for 24 h then centrifuged for 15 minutes at 4000 rpm. The
supernatant was then separated from the pellet and stored at 4℃. The activity was measured
before every experiment.
3.3.2 4-(phenylazo)benzoic acid and SBP enzymatic reaction:
Batch reactors were made up using 1 U/mL of SBP, 1.5 mM hydrogen peroxide, 5 mM phosphate
buffer (pH = 7.0) and various small concentrations of 4-(phenylazo)benzoic acid ranging from 20
μM- to 80 μM. Two controls were used, one without hydrogen peroxide and one without
enzyme. In place of either hydrogen peroxide of enzyme the controls were diluted with an
equivalent volume of water. These solutions were left overnight then filtered and analyzed the
following day using HPLC.
3.3.3 Dynamic Absorption Method:
Batch reactors were made up as above but with the inclusion of 1 mM phenol.
3.3.4 Enzymatic reaction of 4-aminobenzoic acid (PABA):
Batch reactors were made up as for 4-(phenylazo)benzoic acid, but with varying concentrations
of PABA ranging from 7 μM to 1 mM, instead.
21
3.3.5 Acidification of PABA polymer:
To ensure that a loss in PABA concentration was due to a polymerization via the enzymatic
reaction a reacted solution of PABA was acidified to precipitate any soluble polymers that may
have been formed. This was accomplished by the addition of 200 μL of formic acid into a 25 mL
initial volume. The acidified solution was then analyzed by HPLC and UV-VIS spectra were taken
to discern changes in the absorbance.
3.3.6 pKa determination of 4-(phenylazo)benzoic acid:
In order to accurately determine the concentration of 4-(phenylazo)benzoic acid, the pKa
needed to be determined. The pKa of 4-(phenylazo)benzoic acid was determined by titration
with sodium hydroxide. The pH was measured by a Oakalon PC700 pH meter with a stainless
steel micro pH probe. A titration curve was plotted and analyzed by CurTiPot (software by Ivano
Gebhardt Rolf Gutz, Institute of Chemistry, University of Sao Paulo).
3.3.7 Enzyme Activity Assay:
A colourimetric kinetic assay was used to measure SBP activity. The assay measures the initial
rate of formation of a pink chromophore at 510 nm when an enzymatic sample is mixed with a
reagent to form a solution of SBP, 10 mM phenol, 40 mM phosphate buffer (pH=7.4), 0.2 mM
hydrogen peroxide and 2.4 mM 4-AAP. The sample dilution was adjusted to give an absorbance
value less than 1 and an initial absorbance before reaction of no more than 0.1. The absorbance
is measured via a UV-VIS spectrophotometer. A regular assay was done via the mixing of 50 μL of
diluted enzyme with 950 μL of reagent. Once the sample is mixed readings were taken for 30 s,
once every 5 s. The activity is expressed in U/mL where one unit (U) is defined as the amount
that catalyzes 1 μmol of hydrogen peroxide in one minute. Full details are given in Appendix A.

22
3.3.8 Hydrogen Peroxide Concentration Test:
A colourmietric end-point assay was used to measure hydrogen peroxide concentration. The
assay measures the absorbance of a pink chromophore at 510 nm when a sample of hydrogen
peroxide is mixed to form a solution of hydrogen peroxide, 10 mM phenol, 12.5 mM 4-AAP, 50
mM phosphate buffer (pH = 7.4), and 0.31 mL of Novozymes ARP concentrate. The absorbance
of this solution was measured after 15 minutes. Concentrations from 0.01 mM to 0.1 mM were
used to construct the standard curve. The concentration is then determined from the standard
curve established under the same conditions. Full details are given in Appendix B.
3.3.9 Phenolic Precipitate Dry Mass:
The dry mass of phenolic precipitate per volume of a standard suspension (described in Section
3.3.11) was measured by cleaning three Buchner funnels, oven drying and cooling them in a
desiccator. A known aliquot of precipitate suspension was then transferred to the funnel and
vacuum filtered. The funnels were then placed in an oven at 100°C for one day to fully dry, then
cooled in a desiccator and weighed. The precipitate dry mass is defined as the average change in
mass of the three funnels.
3.3.10 Extraction Method:
Extractions were carried out on mixtures from both static and dynamic adsorption/absorption of
4-(phenylazo)benzoic acid on phenolic precipitate. For the dynamic method, a phenolic
polymerization reaction was carried out in both the experimental batch reactor and in 3
separate batch reactors with no 4-(phenylazo)benzoic acid. The precipitates in the 3 non-
experimental batch reactors were measured using the phenolic precipitate dry mass method.
The experimental suspension was centrifuged for 20 minutes at 4000 rpm and the supernatant
was removed. The pellet was resuspended in 100% acetonitrile and was allowed to stir for 30

23
minutes. The concentration of 4-(phenylazo)benzoic acid was determined for both the
supernatant of the experimental suspension and the acetonitrile extract. The resulting
concentrations were then compared. The static method was done similarly except the
precipitate was taken from a pre-made suspension fluid of already reacted phenol. The
suspension fluid is described in more detail in the static adsorption method (Section 3.3.11).
3.3.11 Static Adsorption method:
To observe the adsorption of 4-(phenylazo)benzoic acid onto phenolic precipitates after
enzymatic reaction, a suspension of phenolic precipitates was created. This mixture was made
using 10 U/mL of SBP, 10 mM phenol and 12.5 mM hydrogen peroxide in a volume of 1 L. The
resulting suspension was stirred overnight to ensure it was consistent throughout. An aliquot of
2.5 mL was then added to a 22.5 mL volume batch reactor to make a total volume of 25 mL. The
batch reactor contained 4-(phenylazo)benzoic acid and 5 mM pH= 7.0 phosphate buffer. The
resulting suspension was left overnight then filtered and 4-(phenylazo)benzoic acid
disappearance from the supernatant was measured by HPLC.
3.3.12 Langmuir Analysis:
A Langmuir analysis was done using batch reactors made up in either the dynamic or static
absorption/adsorption methods described earlier. Many concentrations of 4-(phenylazo)benzoic
acid were used from 4 μM to 88 μM while the precipitate mass was kept constant. Five different
points were obtained where at least 2 points lay above and below the half-saturation point so as
to support the validity of the curve. Each point was done in triplicate and the curve was fitted to
the Langmuir adsorption model.
𝑄𝑒
𝑄𝑚=
𝐾𝐶𝑒
1 + 𝐾𝐶𝑒
24
Qe is the absorption capacity at equilibrium (mg/g), Qm is the maximum absorption capacity
(mg/g), K is the Langmuir absorption constant and Ce is the equilibrium concentration of the
absorbate (mg/L).
3.3.13 HPLC analysis:
HPLC was done in reverse-phase mode on a C18 bonded phase with an isocratic elution for all
analyses. The mobile phase for the various compounds used are shown in the table below. All
methods were developed at an injection volume of 10 μL, a flow rate of 1.0 mL/min and ambient
temperature, as shown in Table 3-1.
Table 3-1: HPLC Methods
Compound Method Wavelength (nm)
4-(phenylazo)benzoic acid 70% acetonitrile, 30% 5
mM pH = 7.0 phosphate
buffer or 40% acetonitrile,
60% 5 mM pH = 7.0
phosphate buffer
325
PABA 40% acetonitrile, 60% pH
= 7.0 ammonium acetate
buffer
280
Aniline 40% acetonitrile, 60% 5
mM pH = 7 ammonium
acetate buffer
280
3.3.14 Buffer Preparation:
Multiple buffers were used in these experiments but the main buffer used was a sodium
phosphate buffer at a pH of 7.0 for batch reactors, and activity tests at a pH of 7.4. Ammonium
acetate buffer, pH = 7.0 was also used for some HPLC analyses.

25
Chapter 4
4. Results:
4.1 pKa Determination:
Before any enzymatic reactions could be carried out, a method to quantitatively determine 4-
(phenylazo)benzoic acid (hereafter occasionally abbreviated as ‘Azo’) concentration was needed.
HPLC was used to carry out the concentration measurements, but to get a reproducible
measurement it was necessary to ensure that Azo was consistently protonated or deprotonated
during the analysis. The absorbance spectrum of 4-(phenylazo)benzoic acid was measured at pH
= 1.03 and at pH = 12.25. The absorbance maximum for both these wavelengths was found to be
325 nm but the magnitude changed dramatically. At the pH of 1.03 the absorbance at 325 nm
was found to be 0.0907 ± 0.0003, whereas for a pH of 12.25 the absorbance at 325 nm was
found to be 0.1737 ± 0.0003. This is a two-fold difference between magnitude of the acidic and
basic absorbance. The spectra of Azo at pH = 1.03 and pH = 12.25 are shown in Figure 4-1 and 4-
2.
Figure 4-1: Absorption spectrum for an acidic solution of Azo. 1.5 mg of Azo was added to 250 mL (26.5
μM) but the actual dissolved concentration was not tested. The above stock solution was filtered and 25
mL was taken and acidified using 200 μL of HCl (pH = 1.03) then measured using a UV-vis
spectrophotometer.

26
Figure 4-2: Absorption spectrum for a basic solution of Azo. 1.5 mg of Azo was added to 250 mL (26.5
μM) but the actual dissolved concentration was not tested. 25 mL of the above stock solution was filtered
and made basic by adding NaOH to a final concentration of 48.2 mM (pH = 12.25) then measured using a
UV-vis spectrophotometer.
Since enzymatic reactions done after this point are analyzed using HPLC to determine
concentration and since HPLC uses the absorption at specific wavelengths it is necessary to make
sure the extinction coefficient does not change between reactions. If Azo was protonated in
some cases but not in others comparing their absorbance to a standard to determine
concentration would be unreliable. To ensure that the measurements taken are reliable, the pKa
of 4-(phenylazo)benzoic acid was determined by titration of the aforementioned acid against
sodium hydroxide, as seen in Figure 4-3.

27
Figure 4-3: Titration of 4-(phenylazo)benzoic acid with 11mM sodium hydroxide (R2=0.9996). The
titration curve is a curve fit created using CurTiPot. There is a small blip at 8-10 mL which is due to the
function being a curve fit function not a graph of the Henderson-Hasselbalch equation. Error is calculated
from the standard deviation of triplicate measurements using the formula, Standard error = (Standard
deviation)/ √n, where n is the number of measurements.
The first derivative of the titration curve shown in Figure 4-4 gives the equivalence point at 10.51
± 0.05 mL. The half-equivalence point is therefore at 5.26 ± 0.05 mL which corresponds to the
pKa for the compound of 2.45 ± 0.03. The error is calculated using the standard deviation of the
fitted pH values of the curve from the following equation: Standard error = (Standard deviation)/
√n where n is the number of measurements. All experiments hereafter were conducted at a pH
greater than 4.45. At pH values greater than 4.45, 99% of Azo can be said to be deprotonated
which ensures reproducible measurements for HPLC chromatograms of Azo in the future. The
pH value usually used was 7.0 because this is above 4.45 and it is a useful pH for phenol
polymerization.
0
2
4
6
8
10
12
14
-5 0 5 10 15 20 25
pH
Volume (mL)
known pH values Trendline

28
Figure 4-4: The first derivative of the titration curve in Figure 4-3. This figure shows the equivalence point
at the highest value of the curve (10.51 ± 0.05 mL). Error is calculated from the standard deviation of
triplicate measurements using the formula, Standard error = (Standard deviation)/ √n, where n is the
number of measurements.
4.2 Initial dynamic absorption tests:
Initial tests were conducted under conditions designed to give 95% conversion for phenol
polymerization using enzymatic treatment. These conditions were 1 U/mL enzyme, 1 mM phenol
and 1.5 mM hydrogen peroxide at pH= 7.0 using 5 mM phosphate buffer with a reaction time of
24 hours. Due to its limited solubility, 4-(phenylazo)benzoic acid was added to a nominal
concentration above saturation and excess was filtered out after stirring for 24 hours. The initial
concentration determined using the no-SBP control and Azo absorbed is done as the difference
between the no-phenol control and the experimental. There was an unexpected difference
between the no-SBP and no-phenol controls investigated further in the following section. The
errors for the controls and the experimental were calculated from the standard deviation of
-2
0
2
4
6
8
10
12
14
16
-5 0 5 10 15 20 25
dp
H/d
V
Volume (mL)
1st derivative of titration curve

29
triplicate measurements using the following formula, Standard Error = (Standard Deviation)/ √n,
where n is the number of replicate measurements (3). The error for the difference between the
two controls and Azo absorbed columns were calculated using the error propagation when
subtracting values (for the difference of A-B, σA+B = √(σA2+σB
2)). All error calculations are done in
this manner. The data from the initial dynamic tests are shown in Table 4-1 and Figure 4-5,
below.
Table 4-1: Initial dynamic absorption tests.
Azo in a control
with no SBP
(μM, μg)
Azo in a control
with no phenol
(μM, μg)
Azo in the
experimental
(μM, μg)
Difference
between the
two controls
(μM, μg)
Azo
absorbed
(μM, μg)
27.6 ± 0.4,
156 ± 2
25.1 ± 0.4,
142 ± 2
23.5 ± 0.4,
133 ± 2
2.5 ± 0.5,
14 ± 3
1.6 ± 0.7,
9 ± 4
Reaction conditions were 1 U/mL of SBP, 1.5 mM H2O2, 1 mM phenol and 5 mM phosphate buffer, pH =
7.0 and reaction time of 24 h. Azo absorbed is determined by the difference between the experimental
and the no-phenol control. Error in controls and the experimental is calculated from the standard
deviation of triplicate HPLC injections using the formula, Standard error = (Standard deviation)/ √n, where
n is the number of measurements (3). Error in the calculated values is calculated using the error
propagation when subtracting values (for the difference of A-B σA+B = √(σA2+σB
2))
Figure 4-5: Initial dynamic absorption test results of Table 4-1.
27.6
25.123.5
2.51.6
0
5
10
15
20
25
30
No-SBP Control No-Phenol Control Experimental Difference Betweenthe two Controls
Absorbed
Co
nce
ntr
atio
n (
μM
)
Dynamic Absorption Test

30
4.3 4-(phenylazo)benzoic acid enzymatic conversion:
Although Azo was intended as a passive ad/absorbate in this work, during the initial dynamic
absorption tests there was a difference in concentration between the no-phenol control and the
no-SBP control, as noted above. If all of the loss of Azo measured in the experimental was due to
absorption there should be no difference between the two controls. The difference of 2.5 ± 0.5
μM leads to the possibility that 4-(phenylazo)benzoic acid reacts with SBP. Because Azo does not
have any functional groups that are common substrates of SBP, the likely reason for the loss in
concentration is azo-bond cleavage, either symmetrical or asymmetrical. Other studies have
shown azo-bond reduction in the presence of SBP[21] and its mechanisms are discussed in more
detail in the literature review. Such a reaction could result in p-aminobenzoic acid (PABA) and
aniline. Both PABA and aniline are substrates of SBP so tests were conducted to determine if this
reaction takes place and if so to what extent.
An initial test was done with 4-(phenylazo)benzoic acid, SBP, hydrogen peroxide and pH= 7.0
phosphate buffer. Three sets of batch reactors were tested by HPLC analysis, one at 3 hours and
the other two at 24 hours. The tests were done using a stock solution with a known mass of Azo
added to make a concentration of 45 – 60 μM and 5 mM pH = 7.0 phosphate buffer. The actual
concentration of 4-(phenylazo)benzoic acid was less than 45 – 60 μM since 4-(phenylazo)benzoic
acid did not fully dissolve before being used and any excess was filtered out. The actual
concentration was determined by HPLC. Hydrogen peroxide was added to 1.5 mM as well as 1
U/mL of SBP (the conditions for phenol polymerization) diluting the stock solution slightly. Two
controls were run, one without SBP and one without hydrogen peroxide. In both controls the
volume was made up with distilled water of the same volume as the missing component. The
amount of Azo reacted is determined by the difference between the concentration in the

31
experimental reactor and the average concentration of the two controls. The resulting
concentrations are shown in the Table 4-2 and Figure 4-6.
Table 4-2: Experiments to determine the possibility of 4(phenylazo)benzoic acid reacting with SBP.
Azo in a control
with no hydrogen
peroxide (μM, μg)
Azo in a control
with no SBP
(μM, μg)
Azo in an
experimental
reactor (μM, μg)
Azo reacted
(μM, μg)
After 3 hours 42.1 ± 0.4,
238 ± 2
41.3 ± 0.4,
234 ± 2
40.5 ± 0.4,
229 ± 2
1.2 ± 0.6,
7 ± 3
After 24 hours 39.5 ± 0.4,
223 ± 2
39.6 ± 0.4,
224 ± 2
36.9 ± 0.4,
209 ± 2
2.7 ± 0.6,
15 ± 3
After 24 hours 56.0 ± 0.7,
317 ± 4
54.6 ± 0.7,
309 ± 4
53.7 ± 0.7,
304 ± 4
2 ± 1,
11 ± 6
Experiments were done using 1.5 mM hydrogen peroxide and 1 U/mL SBP with a 5 mM phosphate buffer
pH = 7.0. One experiment was stopped after 3 h and the other two after 24 h. The amount of Azo reacted
is determined by the difference between the concentration in the experimental reactor and the average
concentration of the two controls. Error in controls and the experimental is calculated from the standard
deviation of triplicate HPLC injections using the formula, Standard error = (Standard deviation)/ √n, where
n is the number of measurements (3). Error in the calculated values is calculated using the error
propagation when subtracting values (for the difference of A-B σA+B = √(σA2+σB
2))

32
Figure 4-6: 4-(phenylazo)benzoic acid enzymatic conversion results of Table 4-2.
The experiment analyzed after 3 h shows very little if any reaction of Azo with SBP. After 24 h
the amount reacted was higher but still small (< 5%). Further tests to determine if 4-
(phenylazo)benzoic acid was reacting in the presence of SBP were needed.
4.4 Para-aminobenzoic acid and aniline:
The proposed mechanism for 4-(phenylazo)benzoic acid reacting with SBP involves reductive
splitting of the azo-bond, which would produce PABA and aniline as daughter compounds. Thus,
tests were done to attempt to find PABA and aniline as by-products of enzymatic reaction. To do
this, it was necessary to be able to distinguish the peaks for aniline and PABA in a HPLC
chromatogram. This means they should be well-separated from each other and from parent Azo.
HPLC conditions to achieve this and a representative chromatogram are shown in Figure 4-7.
PABA appears as the first peak followed by Azo and aniline, respectively.
42.1 41.3 40.5 39.5 39.636.9
56 54.6 53.7
1.2 2.7 2
0
10
20
30
40
50
60
Co
nce
ntr
atio
n (
μM
)
4-(phenylazo)benzoic Acid Enzymatic Conversion
3 Hours 24 hours 24 hours 2
33
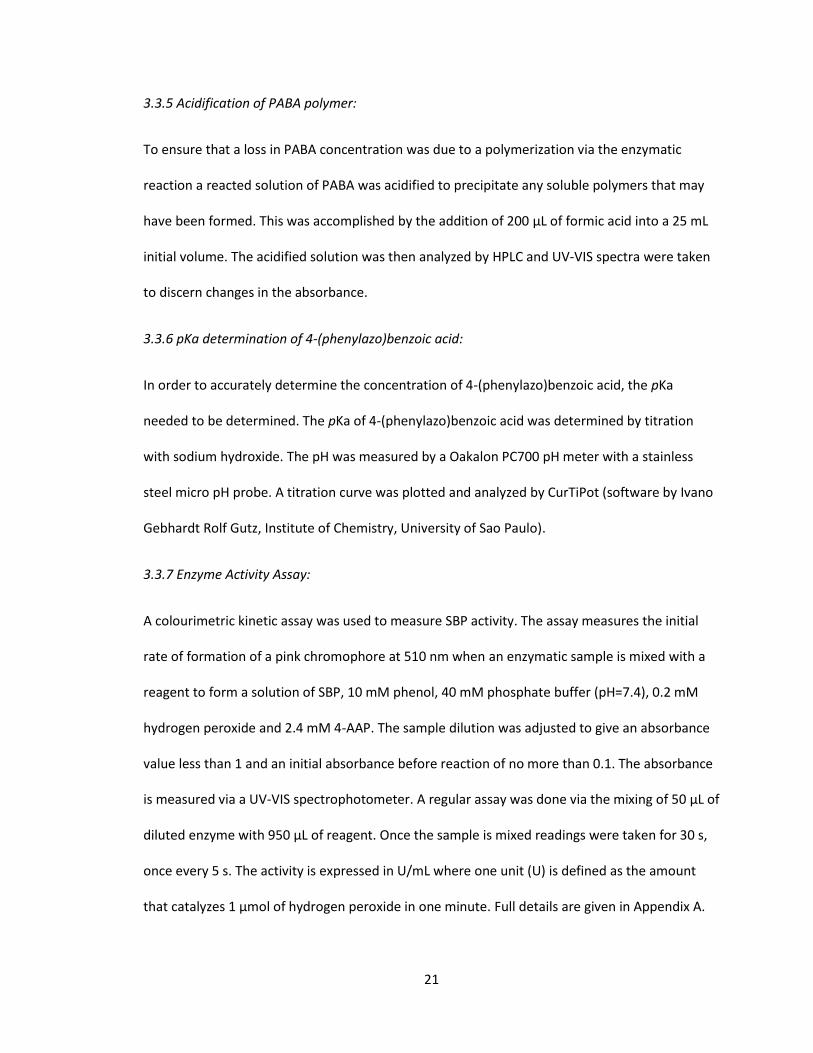
Figure 4-7: HPLC chromatogram of 4-(phenylazo)benzoic acid, PABA and aniline in the same solution.
The mobile phase was 40% ACN and 60% aqueous ammonium acetate, pH = 7.0, flow rate 1.0 mL/min.
This chromatogram was measured at 280 nm. PABA and Azo were added at a concentration of 117 ± 4 μM
and 118.7 ± 0.7 μM respectively. Aniline was added at a nominal concentration of 0.1 mM.
The enzymatic reaction with 4-(phenylazo)benzoic acid and SBP was then run again this time
looking for PABA or aniline HPLC peaks. The chromatogram for the no-enzyme control is shown
in Figure 4-8.
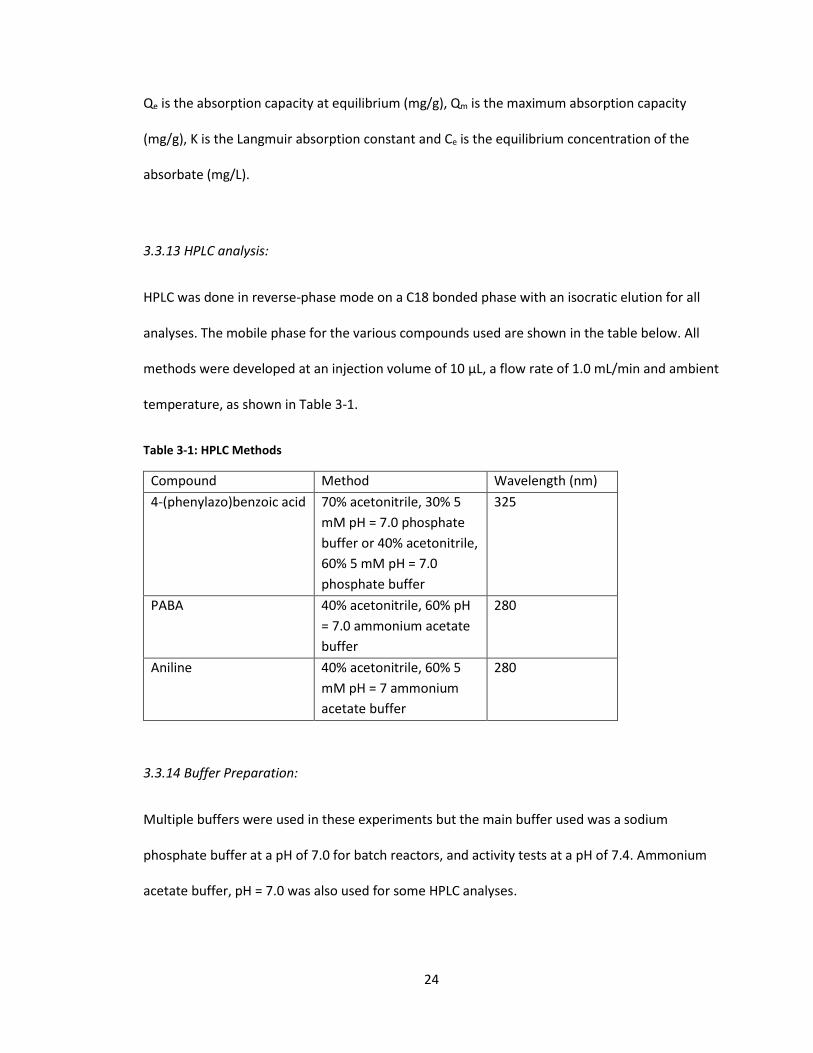
Figure 4-8: No-enzyme control for a 4-(phenylazo)benzoic acid enzymatic conversion. Reaction
conditions were 68.7 ± 0.7 μM Azo and 1.5 mM H2O2 left for 24 h. The mobile phase was 40% ACN and
60% aqueous ammonium acetate, pH = 7.0, flow rate 1.0 mL/min. This chromatogram was measured at
280 nm.
The above chromatogram was expected to have only one peak as the only compound it contains
that absorbs at 280 nm is Azo. The second peak has the correct time for Azo under these
conditions and so is labeled as 4-(phenylazo)benzoic acid. The first peak is hypothesized to be
the cis- isomer of Azo as it has a slightly different time and absorption spectrum. The trans-
isomer of 4-(phenylazo)benzoic acid has its highest peak at 325 nm with two smaller peaks at
231 nm and 427 nm[25]. In comparison the cis- isomer has 3 peaks at 251, 298 and 427 nm[25].
Previous standard injections did not detect this second peak but those chromatograms were
measured at 325 nm, not 280 nm as in Figure 4-8. At 325 nm the first peak disappears as the cis-

34
isomer has its absorbance shifted away from 325 nm down to 298 nm. Figure 4-9 shows the
same no-enzyme control in Figure 4-8 but measured at 325 nm instead of 280 nm.
Figure 4-9: Chromatogram of the no-enzyme control in Figure 4-8 measured at 325 nm.
At 325 nm, a peak for 4-(phenylazo)benzoic acid at 1.8 minutes has an area of 436700 ± 900. A
second peak appears at 1.3 minutes with an area of 13420 ± 90. In contrast these same peaks
measured at 280 nm give areas of 111000 ± 700 and 51700 ± 300 for the 1.8 minute and 1.3
minute peaks, respectively. The shift in absorbance from 325 nm to 280 nm for the peak at 1.8
minutes corresponds to a loss of 75% of the peak area whereas for the peak at 1.3 minutes
corresponds to an increase in peak area of 285%. This is a 3-fold increase in absorbance for the
first peak and a 4-fold decrease for the second. This provides further evidence that the peak at
1.3 minutes corresponds to this cis- form of Azo and the peak at 1.8 minutes corresponds to the
trans- form. Since Azo is the only compound in this solution that provides signatures in the 280-
325 nm range the second peak is concluded to be the cis- form of Azo.
Figure 4-10 shows the chromatogram for the control with no hydrogen peroxide. The only
difference between this chromatogram and the one in Figure 4-8 is the presence of SBP and
absence of hydrogen peroxide. This difference has produced a third peak at around 0.99
minutes. Since SBP was absent in the previous control and present in this one this peak is likely
SBP or impurities from the enzyme solution.

35
Figure 4-10: Chromatogram of a no-H2O2 control for a 4-(phenylazo)benzoic acid enzymatic conversion.
The reaction conditions were 68.6 ± 0.7 μM Azo and 1 U/mL of SBP. The mobile phase was 40% ACN and
60% aqueous ammonium acetate, pH = 7.0, flow rate 1.0 mL/min. This chromatogram is measured at 280
nm.
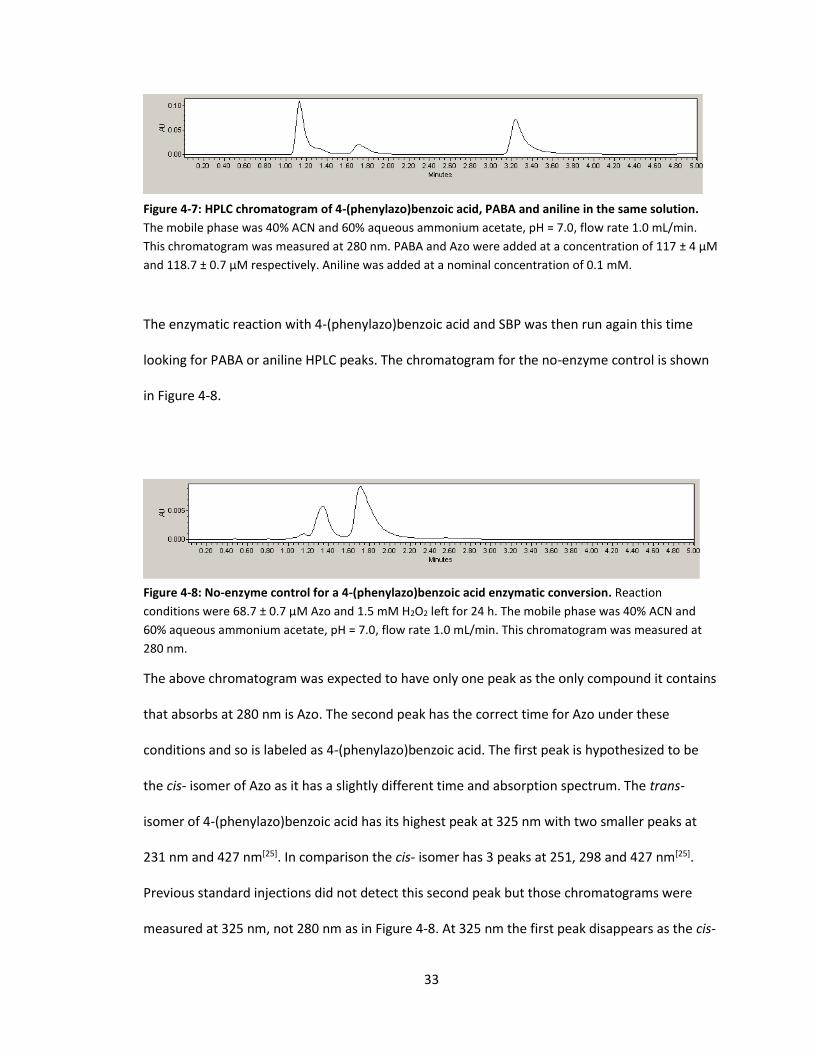
The chromatogram for SBP-catalyzed reaction of Azo, Figure 4-11, shows the same 3 peaks as
the no-hydrogen peroxide control. PABA if it existed would be expected to appear at 1.1 minutes
and overlap with peaks at 0.99 and 1.3 minutes. A PABA peak corresponding to the expected
concentration (4 ± 1 μM) should have an area of around 24000. This would be easily detectable
despite the two unexpected peaks, one of enzyme impurities and the other of the cis- isomer of
Azo. The expected concentration of PABA for this reaction is 4 ± 1 μM because 4 ± 1 μM of 4-
(phenylazo)benzoic acid was lost during the reaction and azo-bond reduction is a 1:1 reaction.
Aniline is also not detected at 3.3 minutes time so no direct evidence of azo-bond splitting has
been found as neither product was detected. Aniline is a known substrate of SBP under the
reaction conditions and is a light-sensitive substance so, at the low concentration in which it
would have been produced, it is unlikely that detectable amounts of aniline would be found[24].
PABA however is very stable in water and detectable in the concentrations expected to be
produced in this reaction. PABA is also expected to act as a substrate for SBP. It has not been
documented, however, how good a substrate it is. Thus tests were next done to determine if
PABA is a good enough substrate of SBP to polymerize under the conditions used for Azo, thus
explaining its absence in the chromatogram of Figure 4-11.
36
Figure 4-11: Chromatogram for a 4-(phenylazo)benzoic acid enzymatic conversion. The reaction
conditions were 64.2 ± 0.7 μM Azo, 1 U/mL of SBP and 1.5 mM H2O2. The mobile phase was 40% ACN and
60% aqueous ammonium acetate, pH = 7.0, flow rate 1.0 mL/min. This chromatogram is measured at 280
nm.
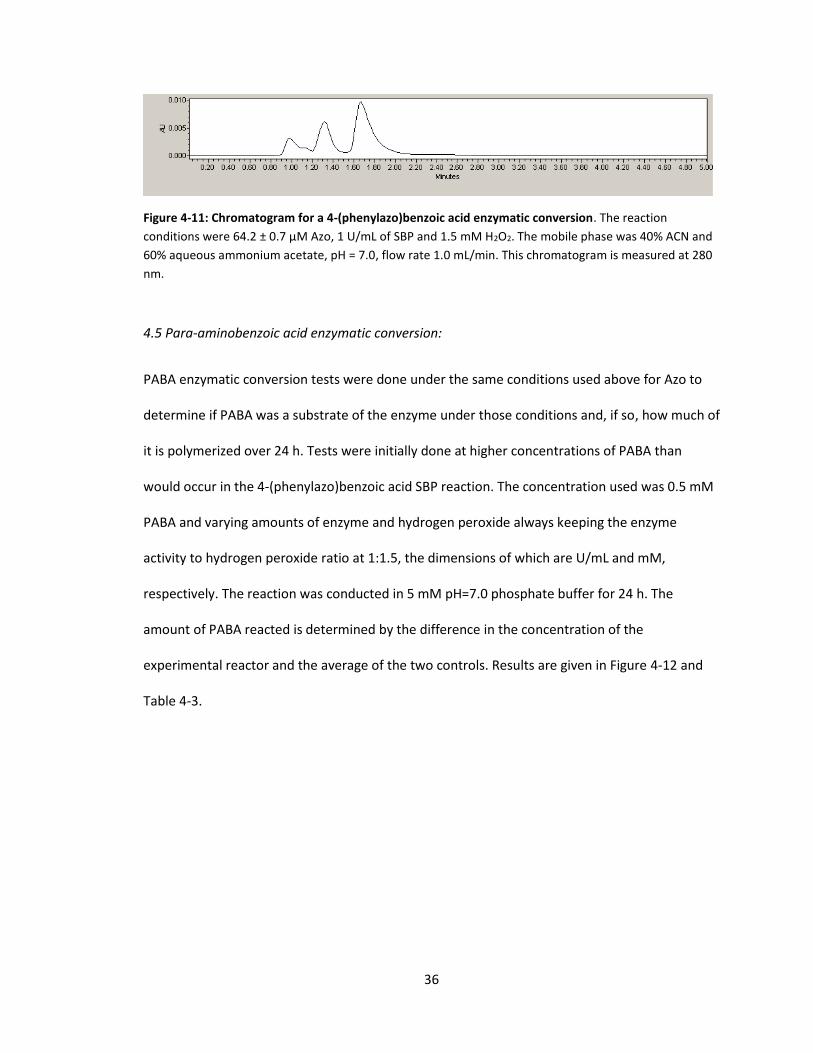
4.5 Para-aminobenzoic acid enzymatic conversion:
PABA enzymatic conversion tests were done under the same conditions used above for Azo to
determine if PABA was a substrate of the enzyme under those conditions and, if so, how much of
it is polymerized over 24 h. Tests were initially done at higher concentrations of PABA than
would occur in the 4-(phenylazo)benzoic acid SBP reaction. The concentration used was 0.5 mM
PABA and varying amounts of enzyme and hydrogen peroxide always keeping the enzyme
activity to hydrogen peroxide ratio at 1:1.5, the dimensions of which are U/mL and mM,
respectively. The reaction was conducted in 5 mM pH=7.0 phosphate buffer for 24 h. The
amount of PABA reacted is determined by the difference in the concentration of the
experimental reactor and the average of the two controls. Results are given in Figure 4-12 and
Table 4-3.

37
Table 4-3: Enzymatic Conversion tests for PABA using SBP and hydrogen peroxide.
PABA in a control
with no SBP (mM,
mg)
PABA in a control
with no hydrogen
peroxide (mM,
mg)
PABA in
experimental
reactor (mM, mg)
PABA reacted
(mM, mg)
0.5 U/mL SBP
and 0.75 mM
H2O2
0.46 ± 0.05,
1.6 ± 0.2
0.45 ± 0.05,
1.5 ± 0.2
0.26 ± 0.06,
0.9 ± 0.2
0.20 ± 0.08,
0.7 ± 0.3
1 U/mL SBP
and 1.5 mM
H2O2
0.43 ± 0.04,
1.5 ± 0.1
0.47 ± 0.05,
1.6 ± 0.2
0.23 ± 0.07,
0.8 ± 0.2
0.22 ± 0.09,
0.8 ± 0.3
0.25 U/mL
SBP and
0.375 mM
H2O2
0.43 ± 0.05,
1.5 ± 0.2
0.44 ± 0.04,
1.5 ± 0.1
0.36 ± 0.04,
1.2 ± 0.1
0.08 ± 0.08,
0.3 ± 0.3
All tests had a reaction time of 24 hours and included 5 mM pH=7.0 phosphate buffer. PABA reacted is
determined by the difference between the concentration in the experimental reactor and the average
concentration of the two controls. Error in controls and the experimental is calculated from the standard
deviation of triplicate HPLC injections using the formula, Standard error = (Standard deviation)/ √n, where
n is the number of measurements (3). Error in the calculated values is calculated using the error
propagation when subtracting values (for the difference of A-B σA+B = √(σA2+σB
2))
Figure 4-12: PABA enzymatic conversion test results of Table 4-3.
0.46 0.45 0.470.43
0.260.2
0.08
0.43 0.44
0.36
0.23 0.22
-0.1
0
0.1
0.2
0.3
0.4
0.5
0.6
Co
nce
ntr
atio
n (
mM
)
PABA Enzymatic Conversion
0.5 U/mL SBP and 0.75 mM Hydrogen Peroxide 1 U/mL SBP and 1.5 mM Hydrogen Peroxide
0.25 U/mL SBP and 0.375 mM Hydrogen Peroxide

38
As seen from the above data, PABA is indeed a substrate of the enzyme. Of the concentrations
tested, the best ratio of PABA concentration to SBP activity and H2O2 concentration gave a 49%
conversion using 1 U/mL of SBP and 1.5 mM of hydrogen peroxide.
While the PABA tests did indeed show that PABA is capable of reacting under the conditions
used for 4-(phenylazo)benzoic acid enzymatic conversion tests, it did not immediately produce
an easily seen precipitate as SBP reactions usually do. A colour change was observed in the
reaction from clear to an orange colour, however, which, with the decrease in PABA
concentration, suggests that the polymers were formed and were still soluble in the reaction
solution. The above test was then repeated without buffer with a starting pH of 4.29 ± 0.06 and
after the reaction the solution was acidified by adding 200 uL of formic acid to give a pH of 2.24
± 0.01 and filtered in an attempt to remove any polymers or oligomers that may have been
formed during the reaction. This succeeded and almost all of the visible colour was removed and
the solution looked clear. Results are shown in Table 4-4 and Figure 4-13.

39
Table 4-4: Experiments to confirm the polymerization of PABA by precipitating the polymer.
PABA in a
control with no
SBP (mM, mg)
PABA in a
control with no
hydrogen
peroxide (mM,
mg)
PABA in an
experimental
reactor before
acidification
(mM, mg)
PABA in an
experimental
reactor after
acidification
(mM, mg)
PABA reacted
(mM, mg)
0.45 ± 0.05,
1.5 ± 0.2
0.42 ± 0.05,
1.4 ± 0.2
0.20 ± 0.08,
0.7 ± 0.3
0.20 ± 0.08,
0.7 ± 0.3
0.2 ± 0.1,
0.7 ± 0.3
PABA was polymerized by SBP using a 1:2:3 ratio of PABA concentration (mM) to enzyme concentration
(U/mL) to hydrogen peroxide concentration (mM). The reaction was carried out for 24 h in water and then
acidified with 200 uL of formic acid. The amount of PABA reacted is determined by the difference between
the concentration in the experimental reactor and the average concentration of the two controls. Error in
controls and the experimental is calculated from the standard deviation of triplicate HPLC injections using
the formula, Standard error = (Standard deviation)/ √n, where n is the number of measurements (3). Error
in the calculated values is calculated using the error propagation when subtracting values (for the
difference of A-B σA+B = √(σA2+σB
2))
Figure 4-13: PABA acidification test results of Table 4-4.
The above evidence confirms that PABA does indeed react in the presence of SBP and hydrogen
peroxide. This could explain the lack of PABA found in 4-(phenylazo)benzoic acid enzymatic
conversion tests. Under the same conditions as used in the 4-(phenylazo)benzoic acid enzymatic
0.450.42
0.2 0.2 0.2
0
0.1
0.2
0.3
0.4
0.5
0.6
No SBP No HydrogenPeroxide
ExperimentalBefore Acidification
Experimental AfterAcidification
Reacted
Co
nce
ntr
atio
n (
mM
)
PABA Acidification

40
conversion tests (1 U/mL SBP, 1.5 mM hydrogen perozide, 5 mM pH=7.0 phosphate buffer for 24
h) PABA concentration decreased by 0.22 ± 0.09 mM. The projected maximum concentration
that could be found in 4-(phenylazo)benzoic acid enzymatic conversion tests is equal to the loss
in Azo due the azo-bond reduction reaction. The loss in previous tests of Azo was at most 4 μM
so this small amount of PABA polymerizing before the solution was tested would explain its
absence in any chromatograms.
Previous experiments done using SBP to polymerize compounds has shown some evidence that
lower concentration substrates actually react worse than higher concentration substrates, the
rationale being that the enzyme becomes inactivated by peroxide before the substrate is
polymerized[26]. To test whether PABA acted the same way a lower concentration solution was
measured. Two tests were done using a 61 and 7 μM PABA with 1 U/mL of SBP and 1.5 mM
hydrogen peroxide concentrations in 5 mM phosphate buffer, pH = 7.0. The amount of PABA
reacted was determined by taking the difference between the experimental reactor
concentration and the average concentration of the two controls. The results from these tests
are shown in Table 4-5 and Figure 4-14.

41
Table 4-5: Experiments to determine the extent of polymerization of PABA under lower concentration
conditions.
PABA in a control with
no SBP (μM, μg)
PABA in a control with
no hydrogen peroxide
(μM, μg)
PABA in an
experimental
reactor (μM, μg)
PABA reacted
(μM, μg)
62 ± 1,
212 ± 3
61 ± 1,
209 ± 3
57 ± 1,
195 ± 3
5 ± 2,
17 ± 7
7 ± 2,
24 ± 7
7 ± 2,
24 ± 7
6.5 ± 2,
22 ± 7
0.5 ± 3,
2 ± 10
For each reaction 1 U/mL of SBP and 1.5 mM of H2O2 was used as well as 5 mM pH=7.0 phosphate buffer.
The amount of PABA reacted is determined by the difference between the concentration in the
experimental reactor and the average concentration of the two controls. Error in controls and the
experimental is calculated from the standard deviation of triplicate HPLC injections using the formula,
Standard error = (Standard deviation)/ √n, where n is the number of measurements (3). Error in the
calculated values is calculated using the error propagation when subtracting values (for the difference of
A-B σA+B = √(σA2+σB
2))
Figure 4-14: Low concentration PABA enzymatic conversion test results of Table 4-5.
It appears that under lower concentration conditions similar to the concentration of 4-
(phenylazo)benzoic acid in previous tests, the percent of PABA lost throughout the reaction
went down considerably. An earlier PABA test under the same conditions had an initial
62 6157
5 7 7 6.50.5
-10
0
10
20
30
40
50
60
70
Co
nce
ntr
atio
n (
μM
)
Low Concentration PABA Enzymatic Conversion Test
61μM Test 7μM Test

42
concentration of 0.5 mM. The reacted concentration for this test was approximately 49% of the
initial concentration compared to 8% with the 61 μM test. Likewise, the test done at 7 μM
showed a 7% reaction under the same conditions. This may be due to the process of enzyme
inactivation in the presence of excess hydrogen peroxide and very little reducing substrate. This
small decrease in PABA concentration should mean that if Azo did react with SBP through the
proposed mechanism of azo-bond reduction, PABA should be detectable in the products. This
assumes that the presence of Azo does not change the conditions of the reaction. It is possible,
however, that as a result of the process in which the azo-bond is reduced the reaction of its
daughter compound could become more likely. This could explain its absence in the
chromatogram.
The possibility of azo-bond reduction as a possible confounding factor in regards to the
ad/absorption phenomenon of this study has been shown to account for little or none of the
decrease of Azo concentration in the aqueous phase. Further experiments where there is a
possibility of azo-bond reduction, a control without the addition of phenol have been run. This
control would give the maximum loss of Azo due to azo-bond reduction possible as under the
experimental reactor conditions Azo would be in competition with phenol for interaction with
SBP thus decreasing the amount of azo-bond reduction occurring. Any concentration of Azo said
to be ab/adsorbed in this study is corrected against any decrease of concentration in the no-
phenol control.
4.6 Low concentration 4-(phenylazo)benzoic acid enzymatic conversion:
The lack of conversion in 24 h through the SBP reaction for 4-(phenylazo)benzoic acid was
originally thought to be due to Azo’s poor quality as a substrate for SBP. Another possibility is
that it could actually be due to the low concentration compared to the relatively high enzyme

43
and hydrogen peroxide concentrations that were used in the preliminary tests, thus leading to
SBP inactivation by peroxide. To help ascertain the quality of Azo as a substrate under reaction
conditions a test was conducted with lower concentrations of SBP and hydrogen peroxide. The
test was done with 32 μM 4-(phenylazo)benzoic acid, 40 mU/mL of SBP and 60 μM hydrogen
peroxide in 5 mM phosphate buffer, pH = 7.0. The amount of Azo reacted is determined to be
the difference between the concentration of Azo in the experimental reactor and the average of
the concentrations of the two controls. The results are shown in Table 4-6 and Figure 4-15.
Table 4-6: Experiments to determine the quality of 4-(phenylazo)benzoic acid as a substrate of SBP
under low enzyme and hydrogen peroxide conditions.
Azo in a control
with no SBP (μM,
μg)
Azo in a control
with no hydrogen
peroxide (μM, μg)
Azo in an
experimental
reactor (μM, μg)
Azo reacted
(μM, μg)
32.7 ± 0.2,
184 ± 1
32.9 ± 0.2,
186 ± 1
32.8 ± 0.2,
186 ± 1
0 ± 0.3,
0 ± 2
The test contained 40 mU/mL of SBP, 60 mM of hydrogen peroxide and 5 mM of pH = 7.0 phosphate
buffer. The amount of Azo reacted is determined by the difference between the concentration in the
experimental reactor and the average concentration of the two controls. Error in controls and the
experimental is calculated from the standard deviation of triplicate HPLC injections using the formula,
Standard error = (Standard deviation)/ √n, where n is the number of measurements (3). Error in the
calculated values is calculated using the error propagation when subtracting values (for the difference of
A-B σA+B = √(σA2+σB
2))

44
Figure 4-15: 4-(phenylazo)benzoic acid low concentration enzymatic conversion test results of Table 4-6.
As seen from the above table, the lower SBP and hydrogen peroxide concentrations did not
increase the percentage of Azo that reacted. It in fact decreased to approximately 0 μM reacted.
This shows that 4-(phenylazo)benzoic acid was not failing to react due to excess enzyme in
previous tests and, therefore, under the reaction conditions Azo is a poor substrate of the
enzyme.
4.7 Initial static adsorption tests:
To determine the effectiveness of phenolic polymer in capturing 4-(phenylazo)benzoic acid both
dynamic and static tests were conducted. A dynamic absorption test is defined to be the
absorption of 4-(phenylazo)benzoic acid during a phenol polymerization reaction and a static test
is defined as adsorption after the phenol polymerization reaction was complete. To perform a
static analysis, a large quantity of phenolic precipitates was made beforehand using 10 mM
phenol, 10 U/mL of enzyme and 15 mM hydrogen peroxide with no buffer. This resulting
32.7 32.9 32.8
0
-5
0
5
10
15
20
25
30
35
No SBP No Hydrogen Peroxide Experimental Reacted
Co
nce
ntr
atio
n (
μM
)
4-(phenylazo)benzoic acid Low Concentration Enzymatic Conversion

45
suspension, at 1.4 ± 0.4 mg/mL by dry weight determination, was tested for enzyme activity and
hydrogen peroxide concentration 24 h after the reaction had started. Residual enzyme activity
was found to be 0.12 ± 0.01 U/mL with no remaining hydrogen peroxide. Static tests were then
performed by taking 22.5 mL of a known concentration of 4-(phenylazo)benzoic acid with 5 mM
phosphate buffer pH=7.0 and adding 2.5 mL of suspension. With the 1 in 10 dilution, the resulting
phenolic precipitate mass should be comparable to any dynamic tests done with 1 mM of phenol
as performed earlier. With a residual enzyme activity of 0.012 ± 0.001 U/mL in the reaction
solution and no hydrogen peroxide remaining, any loss of Azo would be due to adsorption onto
the phenolic precipitates and not because of 4-(phenylazo)benzoic acid reacting with SBP. Initial
static tests were conducted using the above protocol and left stirring for 24 h. The difference in
concentration between the control and experimental is defined as the amount adsorbed, as
shown in Table 4-7 and Figure 4-16. From the dry weight of the phenolic polymer solids found in
later tests, the adsorption of Azo in this test amounts to 4 ± 2 mg/g (the theoretical adsorption is
calculated using dry weights determined later in the static Langmuir analysis, since the same
phenolic polymer suspension was used for both experiments).
Table 4-7: Initial static adsorption tests.
Azo in a control
with no
precipitate (μM,
μg)
Azo in an
experimental
reactor (μM, μg)
Azo adsorbed
(μM, μg)
36.1 ± 0.2,
204 ± 1
33.8 ± 0.2,
191 ± 1
2.3 ± 0.3,
13 ± 2
The experimental reactor contains 22.5 mL of a known concentration 4-(phenylazo)benzoic acid and 5 mM
phosphate buffer pH = 7.0. 2.5 mL of phenolic precipitate suspension is then added to the solution and left
for 24 h. The difference in concentration between the control and experimental is defined as the amount
adsorbed. Error in controls and the experimental is calculated from the standard deviation of triplicate
HPLC injections using the formula, Standard error = (Standard deviation)/ √n, where n is the number of
measurements (3). Error in the calculated values is calculated using the error propagation when
subtracting values (for the difference of A-B σA+B = √(σA2+σB
2))

46
Figure 4-16: Initial static adsorption test results of Table 4-7.
4.8 Extraction of 4-(phenylazo)benzoic acid from phenolic precipitates:
Since the foregoing results are indirect, to gain further evidence of the loss of 4-
(phenylazo)benzoic acid due to adsorption/absorption onto the phenolic precipitates, an
extraction test was performed. This test involved attempting to extract any ab/adsorbed 4-
(phenylazo)benzoic acid from the phenolic precipitate by suspending it in acetonitrile. The
concentration of Azo in the acetonitrile would then be measured by HPLC. The extraction test
was done by centrifuging a dynamic or static reaction suspension at 4000 rpm for 20 minutes
and removing the supernatant. The pellet was then re-suspended in 25 mL of acetonitrile and
allowed to stir for 30 minutes. The acetonitrile solution was then tested for Azo and any
phenolic precipitates were removed. A dynamic test was done using 1 mM phenol, 1 U/mL SBP,
1.5 mM hydrogen peroxide, 5 mM phosphate buffer pH = 7.0 and 40 μM 4-(phenylazo)benzoic
acid. A control with no phenol was introduced to determine any possible loss of 4-
(phenylazo)benzoic acid due to reaction with SBP. The solution was left for 24 h and centrifuged
36.133.8
2.3
0
5
10
15
20
25
30
35
40
Control Experimental Absorbed
Co
nce
ntr
atio
n (
μM
)
Static Adsorption Test

47
and re-suspended by the process described above. The amount of Azo lost is defined as the
difference between the concentration in the experimental reactor and the control which
contains no phenol. The results are in Table 4-8 and Figure 4-17.
Table 4-8: Dynamic absorption extraction test.
Azo in a
control with
no SBP (μM,
μg)
Azo in a
control with
no phenol
(μM, μg)
Azo in an
experimental
reactor (μM, μg)
Azo lost (μM,
μg)
Azo recovered
in acetonitrile
(μM, μg)
40.7 ± 0.2,
230 ± 1
39.6 ± 0.2,
224 ± 1
35.4 ± 0.2,
200 ± 1
4.2 ± 0.3,
24 ± 2
6.5 ± 0.4,
37 ± 2
The test was done using 1 U/mL of SBP, 1.5 mM H2O2, 1 mM phenol and 5 mM pH = 7.0 phosphate buffer.
The amount of Azo lost is defined as the difference between the concentration in the experimental
reactor and the control which contains no phenol. Error in controls and the experimental is calculated
from the standard deviation of triplicate HPLC injections using the formula, Standard error = (Standard
deviation)/ √n, where n is the number of measurements (3). Error in the calculated values is calculated
using the error propagation when subtracting values (for the difference of A-B σA+B = √(σA2+σB
2))
Figure 4-17: Dynamic absorption extraction test results of Table 4-8.
40.739.6
35.4
4.26.5
0
5
10
15
20
25
30
35
40
45
no SBP No Phenol Experimental Azo lost Recovered
Co
nce
ntr
atio
n (
μM
)
Dynamic absorption Extraction Test

48
The concentration of Azo found in the dynamic test was too high, since it exceeded the amount
of Azo concentration reacted. This may be due to the extracted pellet still being “wet” when it is
suspended in acetonitrile. Some small amount of water with residual amounts of Azo would be
transferred along with the pellet into the acetonitrile mixture thereby increasing the amount of
Azo found in the system. The exact amount of solution transferred along with the pellet is
unknown but it amounts to approximately 2 mL. 2 mL of the solution would increase the
concentration of the acetonitrile solution by 2.8 μM. If the pellet contained 4.2 ± 0.3 μM of Azo
the additional 2.8 μM would account for the increase to 6.5 ± 0.4 μM in recovered Azo. To deal
with this excess Azo, a wash step may have been added to the extraction test where the
phenolic precipitates could have been washed with water to decrease the concentration of
soluble Azo. This however runs the risk of loss of phenolic precipitates with each wash step and
was not conducted.
A static extraction test was also done using 2.5 mL of phenolic precipitate suspension and a
solution of 22.5 mL of 5 mM phosphate buffer pH=7.0 and 86 μM 4-(phenylazo)benzoic acid. The
reaction mixture was left for 24 h then the centrifugation pellet was re-suspended using the
same methods as before in acetonitrile. The amount of azo lost is the difference between the
concentration of the experimental and control reactors. The results are shown in Table 4-9 and
Figure 4-18.

49
Table 4-9: Static adsorption extraction test.
Azo in a control
with no
suspension (μM,
μg)
Azo in an
experimental
reactor (μM, μg)
Azo lost (μM, μg) Azo recovered in
acetonitrile (μM,
μg)
86.7 ± 0.2,
490 ± 1
81.6 ± 0.2,
461 ± 1
5.1 ± 0.2,
29 ± 1
5.8 ± 0.4,
33 ± 2
The test was done using 2.5 mL of suspension and 22.5 mL of 5 mM phosphate buffer pH = 7.0 and a
known concentration of 4-(phenylazo)benzoic acid. The amount of azo lost is the difference between the
concentration of the experimental and control reactors. Error in controls and the experimental is
calculated from the standard deviation of triplicate HPLC injections using the formula, Standard error =
(Standard deviation)/ √n, where n is the number of measurements (3). Error in the calculated values is
calculated using the error propagation when subtracting values (for the difference of A-B σA+B = √(σA2+σB
2))
Figure 4-18: Static extraction test results of Table 4-9.
The concentration of Azo found in acetonitrile was again slightly higher than the concentration
of Azo calculated to have been adsorbed onto the precipitate. This is likely due to the same
reason as mentioned for the dynamic test above. The pellet for the static test was better formed
86.781.6
5.1 5.8
0
10
20
30
40
50
60
70
80
90
100
Control Experimental Azo lost Recovered
Co
nce
ntr
atio
n (
μM
)
Static Extraction Test

50
and so less water was transferred along with the pellet (less than 0.5 mL). The mass of the
precipitate was measured in both the experimental and the acetonitrile solutions as some
precipitate was lost during centrifugation, Table 4-10.
Table 4-10: Dry mass of the suspension before and after extraction.
Mass in experimental
precipitate (mg)
Mass in acetonitrile precipitate
(mg)
4.2 ± 0.6 3.4 ± 0.3
Error is calculated from the standard deviation of triplicate runs using the formula Standard error =
(Standard deviation)/ √n where n is the number of measurements (3).
The theoretical mass of precipitate from 1 mM phenol at 100% conversion is 2.35 mg. This is less
than the values found in the dry weight determinations above, this is likely due to impurities in
the SBP solution used to make the phenolic precipitates as well as the mass of the enzyme itself.
For the purposes of this study the dry weight is assumed to be the mass of the phenolic
precipitates only.
As shown, some precipitate was lost during the transfer so this extraction method does not
prove the ab/adsorption of 4-(phenylazo)benzoic acid onto the precipitate both due to the loss
in precipitate between transfers and due to the pellet being wet as discussed earlier. The loss of
precipitate would cause a decrease in the measured concentration of Azo recovered in
acetonitrile while at the same time the pellet being wet would cause an increase. Both of these
factors cause the measured concentration of Azo in acetonitrile to be different than the
concentration of Azo suspected to have ab/adsorbed onto the phenolic precipitates. Because
the concentration measured during this experiment is not equal to the concentration of Azo
ab/adsorbed, this extraction cannot be used as proof of the ab/adsorption of 4-
(phenyazo)benzoic acid onto phenolic precipitates. This along with the following Langmuir
analysis, however, supports the hypothesis that 4-(phenylazo)benzoic acid is being ab/adsorbed
in these reactions by the precipitate.

51
4.9 Langmuir static analysis:
To determine the favourability of the adsorption of 4-(phenylazo)benzoic acid onto phenolic
precipitates a Langmuir analysis was done using variable concentrations of 4-(phenylazo)benzoic
acid from 4 μM to 88 μM with an equilibration time of 24 h. A linearization of the Langmuir
analysis was done first using the equation Ce/Qe = 1/(Qm*K) + Ce/Qm where Ce is the equilibrium
concentration of the adsorbate free in solution (mg/L), Qe is the solid phase concentration at
equilibrium (mg/g), Qm is the maximum absorption capacity (mg/g) and K is the Langmuir
absorption constant. Table 4-11 below shows the values used in this linear plot and the
linearization itself is shown in Figure 4-19. The half-saturation value can be determined by taking
the inverse of the Langmuir constant K. The values used in the Langmuir analysis were chosen so
that at least 2 values appear both above and below the half-saturation point. While the
Langmuir analysis is reported for both the linear and direct-fit forms only the direct-fit was used
to determine if these 2 points are in the correct locations.
Table 4-11: Data for the Langmuir analysis of static adsorption shown in Figure 4-19.
Ce (mg/L) Ce/Qe (g/L)
0.72 ± 0.04 0.5 ± 0.2
1.5 ± 0.04 0.7 ± 0.3
3.00 ± 0.04 0.6 ± 0.2
8.13 ± 0.04 1 ± 0.4
18.36 ± 0.04 1.6 ± 0.7
Each row corresponds to the x and y values for a single point used in the linearized Langmuir analysis in
Figure 4-19. Ce is the equilibrium concentration of the adsorbate (mg/L) and Qe is the solid phase
equilibrium concentration (mg/g) which is calculated from the difference between the equilibrium
concentration in solution and the initial concentration factoring in the precipitate mass. The reaction time
is 24 h. Error is calculated from the standard deviation of triplicate HPLC injections using the formula
Standard error = (Standard deviation)/ √n where n is the number of measurements (3).

52
Figure 4-19: Linearized Langmuir analysis of 4-(phenylazo)benzoic acid adsorption onto phenolic
precipitates under static conditions data Table 4-11.
The Langmuir isotherm can be fitted to the above linear equation where the slope is 1/Qm and
the y-intercept is 1/Qm*K. From this the values for the adsorption capacity (Qm) and the
Langmuir adsorption constant (K) were determined to be 17 ± 2 mg/g and 0.121 ± 0.002 L/mg
respectively. The half-saturation point for the linearization was determined to be 8.3 ± 0.1 mg/L.
After the preliminary check using a linear model, the data were directly fit to the standard
Langmuir isotherm model using the equation ϴ=KCe/(1+KCe) where theta is the adsorption
capacity at equilibrium divided by the maximum adsorption capacity (Qe/Qm), K is the Langmuir
adsorption constant and Ce is the equilibrium concentration of the adsorbate (mg/L). Table 4-12
below shows the values from the same measurements as Table 4-11 used in the direct fit to the
Langmuir curve and the direct fit itself is shown in Figure 4-20.
y = 0.0595x + 0.4916R² = 0.9697
0
0.5
1
1.5
2
2.5
0 5 10 15 20
Ce/
Qe
(mg/
L/m
g/g)
Ce (mg/L)
Langmuir Linearization of Static Adsorption

53
Table 4-12: Data for the Langmuir analysis of static adsorption shown in Figure 4-20.
Ce (mg/L) Qe (mg/g)
0.72 ± 0.04 1.4 ± 0.6
1.50 ± 0.04 2.2 ± 0.9
3.00 ± 0.04 5 ± 2
8.13 ± 0.04 8 ± 3
18.36 ± 0.04 12 ± 4
Each row corresponds to the x and y values of a single point used in Figure 4-20. Ce is the equilibrium
concentration of the adsorbate (mg/L) and Qe is the solid phase equilibrium concentration (mg/g) which is
calculated from the difference between the equilibrium concentration in solution and the initial
concentration factoring in the precipitate mass. The reaction time was 24 h. Error is calculated from the
standard deviation of triplicate HPLC injections using the formula Standard error = (Standard deviation)/
√n where n is the number of measurements (3).
Figure 4-20: Langmuir analysis of 4-(phenylazo)benzoic acid adsorption onto phenolic precipitates under
static conditions, data of Table 4-12.
From Figure 4-20, the R2 value obtained was 0.9880 and the values for Qm and K were
determined to be 16.0 ± 0.5 mg/g and 0.13 ± 0.01 L/mg, respectively. The half-saturation point
for the direct fit was determined to be 7.6 ± 0.6 mg/L, thus at least 2 points are above and below
this value. A better fit for the data was obtained using the direct fit to the Langmuir model than
0
2
4
6
8
10
12
14
16
18
0 5 10 15 20 25 30 35
Qe
(mg/
g)
Ce (mg/L)
Langmuir Static Adsorption Model

54
the linearization and so the constants determined from it will be considered the more accurate
ones. The equation for this Langmuir analysis of a static system is shown below.
𝑄𝑒
16=
0.13𝐶𝑒
1 + 0.13𝐶𝑒
4.10 Langmuir dynamic analysis:
To determine the effective difference between a static and a dynamic system a Langmuir
analysis was done on a dynamic system as well. The dynamic system used Azo concentrations
between 4 μM and 80 μM for 4-(phenylazo)benzoic acid. A linearization of the Langmuir analysis
was done first using the equation Ce/Qe = 1/(Qm*K) + Ce/Qm where Ce is the equilibrium
concentration of the absorbate (mg/L), Qe is the absorption capacity at equilibrium (mg/g), Qm is
the maximum absorption capacity (mg/g) and K is the Langmuir absorption constant. The
standard model of the Langmuir analysis was also graphed using the equation ϴ=KCe/(1+KCe)
where theta is the adsorption capacity at equilibrium divided by the maximum adsorption
capacity (Qe/Qm) and K and Ce are the same as above. Table 4-11 below shows the values used in
this linearization and the linear plot is shown in Figure 4-21.
Table 4-13: Data for the Langmuir analysis of dynamic absorption in Figure 4-21.
Ce (mg/L) Ce/Qe (g/L)
0.72 ± 0.04 0.21 ± 0.03
1.39 ± 0.04 0.25 ± 0.03
2.72 ± 0.04 0.25 ± 0.03
12.56 ± 0.04 0.51 ± 0.06
18.19 ± 0.04 0.56 ± 0.06
Each row corresponds to the x and y values of a single point used in Figure 4-21 Ce is the equilibrium
concentration of the adsorbate (mg/L) and Qe is the solid phase equilibrium concentration (mg/g) which is
calculated from the difference between the equilibrium concentration in solution and the initial
concentration factoring in the precipitate mass. The reaction time was 24 h. Error is calculated from the
standard deviation of triplicate HPLC injections using the formula Standard error = (Standard deviation)/
√n where n is the number of measurements (3).

55
Figure 4-21: Linearized Langmuir analysis of 4-(phenylazo)benzoic acid absorption onto phenolic
precipitates under dynamic conditions, data Table 4-13.
The Langmuir isotherm can be fitted to the above linear equation where m=1/Qm and b =
1/Qm*K. From this the values for the adsorption capacity (Qm) and the Langmuir adsorption
constant (K) were determined to be 48 ± 4 mg/g and 0.098 ± 0.001 L/mg respectively. The half-
saturation point for the linearization was determined to be 10.2 ± 0.1 mg/L thus, at least 2
values are above and below. Table 4-14 below shows the values used in this direct fit and the
direct fit itself is shown in Figure 4-22.
Table 4-14: Data for the Langmuir analysis of dynamic absorption shown in Figure 4-22.
Ce (mg/L) Qe (mg/g)
0.71 ± 0.04 3.3 ± 0.4
1.39 ± 0.04 5.6 ± 0.6
2.72 ± 0.04 10 ± 1
12.56 ± 0.04 25 ± 3
18.19 ± 0.04 32 ± 4
Each row corresponds to the x and y values of a single point used in Figure 4-22. Ce is the equilibrium
concentration of the adsorbate (mg/L) and Qe is the solid phase equilibrium concentration (mg/g) which is
calculated from the difference between the equilibrium concentration in solution and the initial
concentration factoring in the precipitate mass. The reaction time was 24 hours. Error is calculated from
the standard deviation of triplicate HPLC injections using the formula Standard error = (Standard
deviation)/ √n where n is the number of measurements (3).
y = 0.0206x + 0.2111R² = 0.9804
0
0.1
0.2
0.3
0.4
0.5
0.6
0.7
0 5 10 15 20
Ce/
Qe
(mg/
L/m
g/g)
Ce (mg/L)
Langmuir Linearization of Dynamic Absorption

56
Figure 4-22: Langmuir analysis of 4-(phenylazo)benzoic acid absorption onto phenolic precipitates under
dynamic conditions, data Table 4-14.
From Figure 4-22 the R2 value obtained was 0.9922 and the values for Qm and K were
determined to be 51 ± 3 mg/g and 0.088 ± 0.008 L/mg, respectively. A better fit for the data was
obtained using the direct fit to the Langmuir model than the linearization and so the constants
determined from it will be used as the more accurate ones. The half saturation point is at Ce=11
± 1 mg/L, thus at least 2 data points are above and below it. This helps verify the validity of the
fit. The equation for the dynamic system is shown below.
𝑄𝑒
51=
0.088𝐶𝑒
1 + 0.088𝐶𝑒
There is a large difference between the size of the error in the static and dynamic tests. The
large amount of error in the static test comes from the measurement of precipitate dry mass.
When comparing the error for the precipitate dry mass in the static test to the same error in the
dynamic test the applicable numbers are ± 1 and ± 0.2, respectively. This is the only major
difference in error between the two tests and so is the cause of the large difference in the final
0
5
10
15
20
25
30
35
40
0 5 10 15 20 25 30 35
Qe
Ce (mg/L)
Langmuir Dynamic Absorption Model

57
error for the Langmuir analyses. All measured values for both tests are given in Tables C-1 and C-
2 in Appendix C.

58
Chapter 5
5. Discussion:
5.1 pKa Determination:
The purpose of this study was to construct a model system for the adsorption of various organic
compounds onto phenolic precipitates to expand the use of SBP as a wastewater treatment
method. 4-(phenylazo)benzoic acid was chosen as a model compound since it was considered a
non-substrate of the enzyme that was moderately hydrophobic and has a strong absorbance
that could be easily detected allowing for high sensitivity in measurements. The moderate
hydrophobicity of Azo was important for this study as a compound was needed that both
dissolved in appreciable quantities in aqueous solution but also adsorbed in appreciable
quantities to phenolic precipitates. Since the equilibrium between adsorbed and dissolved
quantities of Azo was to be studied both adsorbed and dissolved quantities needed to be large
enough to be accurately measured. For the purpose of concentration measurements the
absorbance of the compound needed to be consistent, thus the pKa of the compound had to be
determined. Knowing the pKa would allow the use of buffers to ensure either the complete
protonation or deprotonation of 4-(phenylazo)benzoic acid in all subsequent tests which is
important as the presence or absence of a proton would change the absorbance spectrum of
Azo. Early measurements of the absorption spectra of Azo shown in Figures 4-1 and 4-2 gives the
same wavelength of maximum absorption (325 nm) but with a two-fold difference in the
intensity of that absorption (the conjugate base having the higher absorbance). The pKa was
determined to be 2.45 ± 0.03 by the standard deviation of the titration curve fit of 4-
(phenylazo)benzoic acid with concentrated sodium hydroxide shown in Figure 4-3. Comparing
the pKa value for Azo to the value of the pKa for benzoic acid of 4.19 [29] it shows Azo to be more
59
acidic. This follows directly from the difference in structure between Azo and benzoic acid as the
difference between the two is the addition of an azo-bond to the ring system. An azo-bond is a
strong electron withdrawing group (EWG) which stabilizes the acceptance of a negative charge
in the conjugate base. Azo would therefore have a higher acidity than benzoic acid due to the
addition of the azo-bond. After the determination of the pKa, 5 mM phosphate buffer pH = 7.0
was used as the aqueous part of the mobile phase for HPLC measurements. This pH would cause
Azo to be completely deprotonated thus giving consistent absorbance readings.
To ensure a consistent absorbance spectrum of Azo for these tests we might have alternatively
used an isosbestic wavelength. If an isosbestic wavelength existed it would not have been at this
compound’s maximum wavelength of absorbance because the intensity at that wavelength
varied between acidic and basic conditions (Figure 4-1 and 4-2). The maximum wavelength of
absorbance was used because it gave a higher extinction coefficient allowing lower
concentrations of Azo to be measured accurately.
5.2 Initial dynamic absorption tests:
Initial dynamic adsorption tests were done for the disappearance of Azo during in situ
polymerization of phenol. These initial tests as shown in Table 4-1 and Figure 4-5 report
moderate decreases in 4-(phenylazo)benzoic acid concentration of approximately 15% from 27.6
μM in the aqueous phase. Only 6% or 4.03 mg/g loss could be said to have come from
absorption onto the phenolic precipitates however as a 9% or 6.26 mg/g loss was found in a
reactor with no phenolic precipitates (mg of Azo per gram of phenolic precipitate). These values
are theoretical values as the mass of phenolic precipitate here was not measured. The values are
calculated by assuming 95% conversion of 1 mM of phenol into phenolic precipitate. A possible

60
reason for the loss of 4-(phenylazo)benzoic acid without the presence of phenolic precipitates
could be SBP-catalyzed azo-bond reduction[21].
5.3 4-(phenylazo)benzoic acid enzymatic conversion:
Previous studies[21] have shown azo-bond reductive cleavage in the presence of SBP. How the
azo-bond reduction occurs exactly is explained in more detail in the literature review section
but, for the purposes of this study, the production of Azo’s daughter compounds in this reaction
is what were looked into. Azo-bond reduction would result in two compounds: p-aminobenzoic
acid and aniline. Both of these compounds are substrates of SBP so the production of these
compounds could lead not only to the decrease in Azo concentration without the formation of
polymeric precipitates, but it could also provide a pathway for the enzymatic conversion of any
PABA or aniline produced. Neither PABA nor aniline were found during 4-(phenylazo)benzoic
acid enzymatic conversion reactions shown in Table 4-2 and Figure 4-6 but a small loss, 4-6% (of
around 50 μM), of 4-(phenylazo)benzoic acid concentration after 24 h was observed in the
presence of SBP and hydrogen peroxide.
5.4 p-aminobenzoic acid enzymatic conversion:
To justify the loss of 4-(phenylazo)benzoic acid by enzymatic conversion and the absence of any
daughter compounds (PABA or aniline) in the reaction solution, a test of PABA as a substrate of
SBP was conducted. Aniline was not tested as aniline is light-sensitive and for the reaction time
of 24 h it was not guaranteed to remain in any measurable concentration[24]. PABA tests were
conducted on high and low concentrations of PABA to determine the effectiveness of the
enzymatic conversion. Initial tests were done at 0.5 mM of PABA with differing concentrations of
SBP and hydrogen peroxide, shown in Table 4-3 and Figure 4-12. These tests showed a loss of
49% under the same reaction conditions that were used with 4-(phenylazo)benzoic acid

61
enzymatic conversion tests and phenol polymerization. These results, coupled with the expected
production of a maximum of 7 μM PABA in 4-(phenylazo)benzoic acid enzymatic conversion
tests, show that more than enough PABA reacted in that time period. During this test a colour
change was observed but no precipitate was seen. To provide further evidence of enzymatic
conversion of PABA, the solution was acidified which caused the precipitation of what is
speculated to be dissolved polymers in solution. PABA concentration values for the acidification
shown in Table 4-4 and Figure 4-13 show no change for the concentration of PABA before and
after acidification. Acidification caused the removal of most of the colour seen in the solution,
providing further evidence for the likelihood of PABA enzymatic conversion. It is possible,
however, that SBP during 4-(phenylazo)benzoic acid tests was inactivated due to low
concentrations of substrate compared to enzyme and hydrogen peroxide concentrations as has
been shown in previous studies[26]. Tests with PABA at lower concentrations were done because
of this and shown in Table 4-5 and Figure 4-14. These tests show a decrease of 8% in PABA
concentration when the initial concentration was 61 μM and 7% when the original concentration
was 7 μM. The latter is in the range expected to be formed from the Azo reaction. This supports
the hypothesis of enzyme inactivation at low concentrations but does not explain why PABA was
not found in 4-(phenylazo)benzoic acid enzymatic conversion tests. It is possible however that
the presence of 4-(phenylazo)benzoic acid prevents the inactivation of the enzyme and thus
allows the conversion of most of the produced PABA.
Reductive cleavage of the azo-bond in 4-(phenylazo)benzoic acid was not proven by the above
tests though it still remains a plausible explanation for the loss in Azo concentration found
throughout this study. Asymmetric cleavage is also still a possibility for the loss of Azo as the
search for the products of asymmetric cleavage was not a part of this study and so has not been
ruled out. The loss of Azo has always been in very small amount: from 3-9% of the total

62
concentration. This loss has always been smaller than the overall decrease in concentration seen
in the presence of phenolic precipitates, which suggests that even if azo-bond reduction is
occurring, it is not the only reason why Azo concentration is going down in these experiments. If
azo-bond reduction occurs it does so with the use of SBP. When SBP is in the presence of phenol
and 4-(phenylazo)benzoic acid there would be competition between the two substrates. This
competition would lead to a smaller decrease in Azo concentration due to enzymatic conversion
in the presence of phenol compared to a reaction that contained no phenol. This would mean
that if a control was made that contained no phenol any decrease in Azo concentration in the
control through azo-bond cleavage would be equal to or less than the loss of Azo in an
experimental reactor that contained phenol i.e this control gives an upper limit for azo-bond
cleavage. Because of the possibility of azo-bond cleavage in these reactions, a control that
contained no phenol was used and any amount of Azo said to be absorbed is defined as the
difference in concentration between the experimental reactor that contained phenol and the
no-phenol control. It is possible that initial dynamic test values of Azo adsorption were as high as
15% but could also be as low as 6%. For the purposes of this study the lower value is used.
In general, the maximum amount of Azo lost that is potentially due to enzymatic conversion is
very small (around 1.1 to 2.6 μM). While the amount of Azo lost this way is not zero, it is small
enough to not significantly affect the analysis of Azo ab/adsorption and thus using a control
system to correct for this small loss was deemed appropriate.
5.5 Low concentration 4-(phenylazo)benzoic acid enzymatic conversion:
With evidence of SBP inactivation at low reducing substrate concentration found in PABA
enzymatic conversion tests, the question arose as to how good a substrate is 4-
(phenylazo)benzoic acid. All tests of Azo’s enzymatic conversion have been done with

63
concentrations of Azo being far lower than what would normally be used for enzymatic
conversion. To confirm that Azo’s small decrease in concentration is due to its poor quality as a
substrate and not to enzyme inactivation in the presence of high concentration of hydrogen
peroxide, a test was done with lower SBP and hydrogen peroxide concentrations while keeping
the concentration of Azo close to what it was previously (32.7 μM of Azo was used in this test
compared to 27.6 μM in the initial dynamic tests). This test was done with 40 mU/mL of enzyme
and 60 μM of hydrogen peroxide and shown in more detail in Table 4-6 and Figure 4-15. This is a
30-fold decrease in the ratio of enzyme and hydrogen peroxide to substrate concentration when
comparing this test to the initial dynamic absorption test. No change was seen in the
concentration of 4-(phenylazo)benzoic acid after 24 h, which shows that Azo is indeed a poor
substrate and that the lack of enzymatic conversion was not due to SBP inactivation in earlier
tests.
5.6 Initial static adsorption tests:
Static adsorption tests were conducted for 4-(phenylazo)benzoic acid adsorption onto pre-
formed phenolic precipitates. These phenolic precipitates were created prior to reaction and so
any loss of 4-(phenylazo)benzoic acid could not be due to its enzymatic conversion. The solution
containing the phenolic precipitates is referred to as the suspension. The residual activity of SBP
in the suspension from preparation of the phenolic polymer was ≤ 0.01 U/mL with no hydrogen
peroxide remaining in solution, Thus there is no path for enzymatic conversion of Azo and any
decrease in its concentration in these tests would be due to adsorption. Compared to previous
tests where absorption occurred under dynamic conditions, this static system should exhibit
adsorption. Absorption is the accumulation of a molecular species throughout the bulk of a solid
whereas adsorption is the accumulation of a molecular species on the surface of a solid. Static
tests should result in adsorption due to the fact that the phenolic precipitates have already been

64
formed and only the surface is accessible. This is in contrast to dynamic tests that happen during
the formation of phenolic precipitates which would result in both the surface and the bulk of the
solid being available for capturing Azo.
Earlier studies of the adsorption characteristics of phenolic precipitates were done to
characterize the adsorption of SBP itself onto phenolic precipitates with the goal of eluting SBP.
This study showed that the minimum SBP activity to remove 1 mM of phenol could be reduced
from 1.2 U/mL to 0.5 U/mL by freeing the adsorbed SBP on the phenolic precipitate itself[36]. This
implies that any polymers used in this study would have adsorbed SBP effectively “blocking”
possible adsorption sites. The amount of SBP blocking sites should not significantly hinder Azo
adsorption however. The adsorption capacity of SBP onto phenolic precipitates for static uptake
has been shown to be 3.44 U/mg with a Langmuir constant of 4.91[36]. With 1 U/mL of SBP in all
experiments this would give an adsorbed amount of 2.65 U/mg which is less than the adsorption
capacity of 3.44 U/mg leaving sites open for Azo. This would be the case if SBP had undergone
static adsorption in this study, which it did not. SBP instead underwent dynamic adsorption as
the adsorption took place when the precipitate was forming. This would greatly increase the
adsorption capacity allowing for many more open “sites” for Azo to bond to thus causing it to
block less sites for Azo static adsorption. On top of the relationship between dynamic and static
ab/adsorption there is also the relationship between SBP and Azo specifically concerning their
size. SBP as a protein molecule would occupy far more of the surface than Azo meaning many
Azo molecules should be capable of “fitting” where one SBP molecule would. With the
knowledge that SBP is absorbing dynamically, SBP is a larger molecule than Azo and there still
being available adsorption sites if SBP had adsorbed statically, we can conclude that the
presence of SBP on the surface of the phenolic precipitates should not significantly hinder Azo
adsorption. The specifics of this interaction however is not explored in this study.

65
Initial tests shown for static adsorption in Table 4-7 and Figure 4-16 showed a decrease of 6.4%
or 4 ± 2 mg of Azo/g of phenolic precipitate due to adsorption, assuming a phenolic precipitate
mass equal to the phenolic precipitate mass used later in the Langmuir analysis of the static
system. Both this static test and the Langmuir analysis later used the same suspension and so
should have a similar dry mass loading.
5.7 Extraction of 4-(Phenylazo)benzoic Acid:
Extraction tests were carried out to provide further evidence of 4-(phenylazo)benzoic acid
adsorption onto phenolic precipitates. These tests were done by conducting either a dynamic or
a static ab/adsorption, then isolating the phenolic precipitates and suspending them in an equal
volume of acetonitrile. The concentration of Azo in acetonitrile after 30 minutes of stirring was
16.0% of the initial available concentration for the dynamic and 6.7% for the static capture. This
information is provided in detail in Table 4-8 and Figure 4-17 for the dynamic test and Table 4-9
and Figure 4-18 for the static. The recovery is comparable to the concentration of Azo lost in the
static tests but shows a deviation in the dynamic test. The deviation may be due to a large
amount of experimental solution being transferred with the phenolic precipitates into the
amount recovered reactor. Some of the experimental solution was transferred due to a loose
pellet after centrifugation which prevented complete separation of the solution and the pellet.
As explained in more detail in the Results section, the amount of experimental solution
transferred with the pellet was large enough to account for the increase in concentration
observed in the acetonitrile solution used to extract Azo. Both the dynamic and static tests show
a concentration in the recovered reactor that cannot be accounted for simply by any solution
transferred with the pellet. A similar extraction experiment was done previously in this lab in a
different study using Triton X-100 and phenolic precipitates. This extraction used ethanol in
place of acetonitrile and found complete recovery of Triton X-100 from the surface of the

66
phenolic precipitates[1] providing support for use of such an extraction method. Because of this,
the current experiments are interpreted as providing qualitative support for the hypothesis that
the 4-(phenylazo)benzoic acid lost was ab/adsorbed onto the precipitates.
5.8 Langmuir Analysis:
Langmuir analyses were done for both static and dynamic systems to test the viability of 4-
(phenylazo)benzoic acid ab/adsorption onto phenolic precipitates as a treatment method. The
analysis gave an adsorption maximum value for static adsorption as 16.0 ± 0.5 mg of Azo/g of
precipitate and a Langmuir constant of 0.13 ± 0.01 L/mg. For the dynamic test the absorption
maximum was determined to be 51 ± 3 mg of Azo/g of precipitate and the Langmuir constant
was determined to be 0.088 ± 0.008 L/mg. The figures that correspond to these analyses are
Figures 4-19 and 4-20 for the static analysis and Figure 4-21 and 4-22 for the dynamic. Table 5-1
summarizes.
Table 5-1: Langmuir analysis for both static and dynamic systems of 4-(phenylazo)benzoic acid
ad/absorption onto phenolic precipitates
K (L/mg) K-1 (mg/L) Qm (mg/g)
Static adsorption 0.13 ± 0.01 7.7 ± 0.6 16.0 ± 0.5
Dynamic absorption 0.088 ± 0.008 11 ± 1 51 ± 3
The dynamic system had 3-fold greater capacity for sorption 4-(phenylazo)benzoic acid
compared to the static system. This could be due to more surface area being accessible in the
dynamic absorption than in the static which is more easily explained using the “onion” analogy.
An onion has layers of “skin” or in our case layers of surface area. The inner surface layer forms
first and adsorbs some Azo, then the next layer forms on top of that and adsorbs some Azo and
so on. This increases the available surface area for Azo to adsorb which thus increases the
ad/absorbing capacity. The static and dynamic ab/adsorption show similar K values (0.13, 0.088

67
L/mg). The K constant for the Langmuir analysis corresponds to the affinity between the sorbent
and the sorbate. A high K value means that most of the sorbate is ab/adsorbed at equilibrium
whereas a low K value means most ab/adsorbate is left in solution at equilibrium. The higher K
values for both the dynamic and static tests suggest a high affinity for Azo binding to the
phenolic precipitates. This is likely due to the hydrophobicity of the compound as a whole which
discourages dissolution into the aqueous phase. The half-saturation points for both static and
dynamic ab/adsorption are relatively similar (7.7, 11.4 mg/L, respectively). The half-saturation
point remains relatively constant because both systems involve the same ad/absorbent and
ad/absorbate which has the same affinity for the surface of phenolic precipitates.
It is important to mention that the Langmuir analyses for both the static and dynamic systems
are both done at pH = 7.0. This gives us the analysis of the ab/adsorption characteristics of the
benzoate form of 4-(phenyazo) benzoic acid not the acidic form (pKa = 2.45). The ad/absorption
is likely hampered by the presence of a negative charge on Azo which means that the analysis of
the acid form would likely give a higher ab/adsorption affinity and a higher maximum
ab/adsorption capacity. The entire system of course would only work for lower concentrations
of Azo as the acid form is far less soluble in water than the conjugate base.
If one were to attempt to remove Azo from solution using this method where a maximum
efficiency of removal was desired, a fraction of Qe/Qm of approximately 50%[1] would be used.
This means that for a reasonable concentration of Azo for the static system around 8 mg of Azo
per gram of precipitate (25.5 for the dynamic system) could be removed rather than 16 mg/g (51
mg/g for the dynamic system) as the maximum adsorption capacity implies. To get to 16 mg/g
from this system removed would take a very high equilibrium concentration (Ce) that would not
only take a long time to adsorb but would also exceed the solubility of Azo in solution. Because
of the high equilibrium concentration required, only ~13% of the total concentration would be

68
removed by adsorption even if the equilibrium concentration required didn’t exceed Azo’s
solubility. More reasonable numbers of removal from these systems therefore come from the
middle of the Langmuir curve (8 and 25.5 mg/g). These ad/absorption capacities are quite small
and thus if Azo was a wastewater contaminant this method would not be an effective way of
removing it from wastewater. The Langmuir constants on the other hand show high affinity for
ad/absorption which shows promise for using phenolic precipitates to potentially remove other
compounds from wastewater.
The initial dynamic and static ad/absorption tests that were shown in Table 4-1, Figure 4-5 and
Table 4-7, Figure 4-16, respectively, can be compared to the later full Langmuir analyses. The
precipitate dry mass was not measured for either of these initial tests but assuming the same
precipitate dry mass as measured in the Langmuir analyses (since the same suspension was
used) one could find comparable numbers. For the initial dynamic test 133 μg of Azo was at
equilibrium in a 25 mL solution with a measured absorbed value of 9 ± 4 μg. These values in
terms of Ce and Qe used in the Langmuir analyses (using the precipitate dry mass measured
during the Langmuir analyses) gives a Ce value of 5.32 ± 0.08 mg/L and a Qe value of 5 ± 2 mg/g.
Plugging in a value of 5.32 ± 0.08 for Ce into the dynamic Langmuir equation yields a calculated
Qe of 16 ± 2 mg/g. These numbers are largely different but the initial dynamic test absorbed
value was not the only mass of Azo lost from equilibrium in that experiment. An assumption was
made in the initial dynamic test conditions discussed in more detail in earlier sections that the
presence of phenol would not affect the enzymatic conversion of Azo. This assumption was
made to simplify the problem. The addition of phenol however should affect the enzymatic
conversion through a competition between phenol and Azo for SBP, one which would decrease
the amount of enzymatic conversion of Azo. 9 μg is the lowest value for absorbed Azo measured
in the initial dynamic test, though because of this competition it could be as high as 23 μg. If 23

69
μg were absorbed and none at all reacted with SBP the measured value for Qe would be 12 ± 3
mg/g instead. Comparing this new value with a calculated value of 16 ± 2 mg/g gives us a
measured and calculated value within error of one another which makes the two experiments
consistent.
Doing the same comparison for the initial static test and the Langmuir static analysis give a
measured Ce value of 7.64 ± 0.04 mg/L and a measured Qe value of 4 ± 2 mg/g. These values are
calculated from the equilibrium and adsorbed masses given in Table 4-7 along with the
measured precipitate dry mass in Table C-1 in Appendix C. Plugging in 7.64 ± 0.04 mg/L into the
static Langmuir equation a Qe value of 8 ± 1 mg/g is found. The error on both of these number is
quite high and could give us a measured value of as high as 6 mg/g and a calculated value as low
as 7 mg/g. This shows a small discrepancy between the initial static adsorption test and the
Langmuir analysis that is likely due to the error in both experiments.
In comparing the absorption capacity of phenolic precipitates for 4-(phenylazo)benzoic acid to
the absorption capacity of a previously measured compound, the non-ionic surfactant Triton X-
100, the ad/absorption capacity for Azo is significantly lower (Triton X-100 had an ad/absorption
capacity of 258 mg/g[1]). This could be due to the greater hydrophobicity of the octyl- or nonyl-
group in Triton X-100 compared to less hydrophobic phenylazo group of 4-(phenylazo)benzoic
acid. The K value of Triton X-100 on the other hand is lower than the K value for both systems of
Azo (Triton X-100 had a K value of 0.029 L/mg[1]). This shows that despite the greater
hydrophobicity of Triton X-100, Azo appears to have a greater affinity for adsorption onto
phenolic precipitates. This could be due to Triton X-100’s tendency to form micelles in aqueous
solution (critical micelle concentration 207 mg/L[35]). By forming a micelle at higher
concentration levels Triton X-100 could show a preference for the micellar phase instead of

70
forming a monolayer onto phenolic precipitates. This would translate to a lower measured
affinity for phenolic precipitates.
Another study looked at the difference between benzene and toluene adsorption onto activated
carbon (named in the study as F-400 from Calgon Carbon, Pittsburgh, Pennsylvania) using a
Langmuir analysis. The surface area of F-400 was 877.8 m2/g measured using Brunauer-Emmett-
Teller (BET) analysis[30]. The maximum adsorption capacity for benzene and toluene onto F-400
at pH = 7.0 were reported by the authors study to as 183.3 and 194.1 mg/g respectively.
Comparing these to 16 mg/g for Azo static uptake or 51 mg/g for Azo dynamic uptake, both
benzene and toluene adsorbed in far greater quantities. This is likely due to F-400’s having a
greater surface area than phenolic precipitates and interactions between hydrophobic surfaces
and carboxylate acid groups. The surface area of phenolic precipitates have not been measured,
however, so it is impossible to say for certain. The Langmuir constants for benzene and toluene
under the same conditions were found to be 0.0765 and 0.0841 L/mg, respectively [30], relatively
similar to 0.13 and 0.088 L/mg for the Azo static and dynamic tests of the current study.
The change in adsorption capacity and affinity of F-400 for benzene and toluene were also
measured at three different pH’s (3, 7 and 11)[30], Table 5-2. At these pH’s the Langmuir constant
for both benzene and toluene is essentially invariant. The pH of the system does not affect the
structure of benzene or toluene in the same way as Azo so this unchanging Langmuir constant is
unlikely to occur for Azo as well.
The adsorption capacity at across the pH range is, however, slightly different in showing a higher
adsorption capacity, the higher the pH. This trend is not likely to hold for Azo and phenolic
precipitates as more basic solutions cause Azo to form its conjugate base which would increase
its hydrophilicity making it less likely to adsorb onto a hydrophobic surface. Furthermore, the

71
phenolic precipitates themselves would have significant negative charge at pH 11 due to
ionization of phenolic groups.
The exact numbers for Qm and K for benzene and toluene are summarized in Table 5-2.
Table 5-2: Langmuir analysis for benzene and toluene onto activated carbon F-400[30].
pH 3 7 11
Qm (mg/g) benzene: 152
toluene: 166
benzene: 183
toluene: 194
benzene: 219
toluene: 231
K (L/mg) benzene: 0.0777
toluene: 0.0849
benzene: 0.0765
toluene: 0.0841
benzene: 0.0775
toluene: 0.0862
F-400 was oxidized with nitric acid in a second part of this study to give a sample, F-400Cox, with
a more oxygenated surface which allows the analysis of that effect on the adsorption of
hydrophobic compounds. For the more oxygenated surface both the adsorption capacity and the
adsorption affinity decreased for both benzene and toluene (Qm = 144, 122 mg/g and K = 0.0540,
0.0563 L/mg at pH = 7.0 for benzene and toluene, respectively[30]). The BET analysis of this new
surface gave a surface area of 938 m2/g which is slightly larger than the measured surface area
for F-400. This would suggest that the decrease in both adsorption capacity and affinity is due to
the addition of oxygenated groups. Phenolic precipitates have a surface made from the
polymerization of phenol and will display phenolic oxygen groups similar to or greater in number
than in F-400Cox. This would support the idea that phenolic precipitates act as a worse
adsorption surface for unfunctionalized aromatics than activated carbon since oxygenated
groups appear to decrease adsorption capacity and affinity.
For further comparison, a study constructed a Langmuir adsorption curve for benzoic acid onto
granular activated carbon (GAC) at 25°C and pH = 7.0[27]. The Langmuir analysis of this system
gave an adsorption capacity of Qm = 472 mg of benzoic acid per gram of granular activated
carbon and a Langmuir constant of K = 0.0325 L/mg[27]. Compared to Azo static adsorption onto
72
phenolic precipitates, it appears that Azo has a better affinity due to having a 4-fold greater
Langmuir constant but a 30-fold lower adsorption capacity. The larger K value is likely due to the
polarity of benzoic acid compared to Azo. Because Azo has a “tail” made of an azo phenyl group,
it is more hydrophobic than benzoic acid and thus more likely to interact with a hydrophobic
surface. The lower adsorption capacity is likely due to the specific surface area differences
between GAC and phenolic precipitate, GAC having a far larger surface area per gram than
phenolic precipitates. In the present study, the adsorbent’s mass was measured and it was
assumed that an increase in mass would cause an increase in the adsorption effects explored.
The real measure of a surface’s adsorption ability, however, is not its mass but its surface area. A
larger surface area corresponds to a larger adsorption capacity and the large difference in
adsorption capacity measured in both these studies is likely due to GAC having the larger specific
surface area. This is not known for sure, GAC is a commonly used adsorbent and so its surface
area has been measured many times in the literature (for example one study gives GAC a surface
area of 1435 m2/g[28] another gives surface areas of 967 and 559 m2/g[31]) but surface area for
phenolic precipitates has not been determined. The large contrast between adsorption
capacities however is consistent with this rationale.
From the analysis of Azo we can conclude that the method of treating hydrophobic compounds
proposed in this study is a potentially viable method. The ad/absorption does occur and fits
closely to the Langmuir function. The percent concentrations ad/absorbed of 4-
(phenylazo)benzoic acid are low but the effectiveness of these systems would vary among
compounds.

73
Chapter 6
6. Conclusions:
In this study, a model compound (4-(phenylazo)benzoic acid) was used to characterize the
ab/adsorption process onto a phenolic polymer created through enzymatic conversion of phenol
with soybean peroxidase and hydrogen peroxide. 4-(phenyazo)benzoic acid has been shown to
ab/adsorb in measurable quantities onto phenolic precipitates with high Langmuir constants
showing good affinity. The ab/adsorption system has been measured and dynamic absorption
has been shown to be better than static adsorption. SBP enzymatic removal has been shown to
be a viable treatment method to treat toxic hydrophobic non-substrates in wastewater along
with substrates of SBP like phenol. The ad/absorption does occur and fits closely to the Langmuir
function, thereby enabling quantitative implementations. The percent concentrations
ad/absorbed of 4-(phenylazo)benzoic acid are low but the effectiveness of these systems would
vary among compounds. The sorption process investigated gives a decent ab/adsorption
capacity and opens up the possibility of using phenolic precipitates and thus expands the scope
of the enzymatic method for a polishing treatment of wastewater to include low concentrations
of organic compounds that are not substrates of SBP.

74
References:
1. Feng, Wei, "Utilization of Phenolic Precipitates to Enhance Soybean Peroxidase-Catalyzed
Wastewater Treatment". Electronic Theses and Dissertations. University of Windsor (2013)
4944.
2. Mitra S, Roy P. "BTEX: A Serious Ground-water Contaminant." Research Journal of
Environmental Sciences 5(5) (2011), 394-398.
3. Pourzamani H, Masood A, Majd S, Fadaei S. "Benzene Removal by Hybrid of Nanotubes and
Magnetic Nanoparticle from Aqueous Solution." Desalination and Water Treatment, (2015)
19038-19049
4. Verschueren K. "Handbook of Environmental Data on Organic Chemicals", Van Nostrand
Reinhold Co., New York, (1983) 983.
5. Dean J, Lange N. "Lange's Handbook of Chemistry", McGraw-Hill, New York (1992), 30-50.
6. Hansch C, Leo A, Hoekman D. "Exploring QSAR, American Chemical Society", Washington, DC
(1995), 32.
7. Dordick J, Marletta M, Klibanov A. "Polymerization of Phenols Catalyzed by Peroxidase in
Nonaqueous Media". Biotechnology and Bioengineering 30(1) (1987), 31-36.
8. Ghoul M, Chebil L. "Enzymatic Polymerization of Phenolic Compounds by Oxidoreductases",
Springer, New York (2012), 4-6.
9. Ren J, Licht S. "Tracking airborne CO2 mitigation and low cost transformation into valuable
carbon nanotubes" Scientific Reports (2016).
10. Environment Canada "Priority Substance List Assessment Report: Phenol" (2000), 14- 32.

75
11. Fujita T, Iwasa J, Hansch C. "A New Substituent Constant, π, Derived from Partition
Coefficients", Journal of the American Chemical Society 86(23) (1964), 5175-5180.
12. Blackman G, Parke M, Garton G. "The Physiological Activity of Substituted Phenols. I.
Relationships Between Chemical Structure and Physiological Activity" Archives of Biochemistry
and Biophysics 54(1) (1955), 45-54.
13. Kamal J, Behere D. "Activity, Stability and Conformational Flexibility of Seed Coat Soybean
Peroxidase", Journal of Inorganic Biochemistry 94(3) (2003), 236-242.
14. Smith A, Sanders S, Thorneley R, Burke J, Bray R. "Characterisation of a Haem Active-Site
Mutant of Horseradish Peroxidase, Phe41 → Val, with Altered Reactivity Towards Hydrogen
Peroxide and Reducing Substrates", European Journal of Biochemistry 207(2) (1992), 507-519.
15. ATSDR Public Health Statement for Phenol, p. 4, Accessed on Oct 20th (2008), 2016
16. Henriksen A, Mirza O, Indiani C, Teilum K, Smulevich G, Welinder K, Gajhede M. "Structure of
Soybean Seed Coat Peroxidase: A Plant Peroxidase with Unusual Stability and Haem-Apoprotein
Interactions" Protein Science 10(1) (2001), 108-115.
17. Wright H, Nicell J "Characterization of Soybean Peroxidase for the Treatment of Aqueous
Phenols", Bioresource Technology 70(1) . (1999), 69-79.
18. McEldoon J, Dordick J" Unusual Thermal Stability of Soybean Peroxidase" Biotechnology
Progress 12(4) (1996), 555-558.
19. Deyhimi F, Nami F. "Peroxidase-Catalyzed Electrochemical Assay of Hydrogen Peroxide: A
Ping-Pong Mechanism", International Journal of Chemical Kinetics 44(10) (2012), 699-704.

76
20. Yu J, Taylor K, Zou H, Biswas N, Bewtra J. "Phenol Conversion and Dimeric Intermediates in
Horseradish Peroxidase-Catalyzed Phenol Removal from Water", Environmental Science and
Technology 28(12) (1994), 2154-2160.
21. Ali L, Algaithi R, Habib H, Souka U, Rauf M, Ashraf S. "Soybean Peroxidase-Mediated
Degradation of an Azo Dye– a Detailed Mechanistic Study." BMC Biochemistry (2013), 14-35.
22. "Benzoic acid, 4-(phenylazo)-." National Institutes of Standards and Technology (2016). Web.
29 Mar. 2017. http://webbook.nist.gov/cgi/cbook.cgi?ID=C1562932&Type=IR-SPEC&Index=1
23. "Chemical Elements Listed by Electronegativity." Lenntech. Web. 25 Nov. 2016.
http://www.lenntech.com/periodic-chart-elements/electronegativity.htm
24. "Aniline." Chemical Book. Web. 8 Nov. 2016.
http://www.chemicalbook.com/ChemicalProductProperty_EN_CB7169544.htm
25. Shi H, Ge W, Oh H, Pattinson S, Huggins J, Talmon Y, Hart D, Raghaven S, Zakin J.
"Photoreversible Micellar Solution as a Smart Drag-Reducing Fluid for Use in District
Heating/Cooling Systems." Langmuir (2012), 102-109.
26. Baynton K, Bewtra J, Biswas N, Taylor K. "Inactivation of Horseradish Peroxidase by Phenol
and Hydrogen Peroxide: A Kinetic Investigation." Biochimica et Biophysica Acta (BBA) - Protein
Structure and Molecular Enzymology (1994), 272-278.
27. Ghorbanian S, Abolghasemi H, Radpour S, Mousavian M. "Developing a New Approach to
Temperature and pH Effects in the Modelling of the Adsorption Isotherms of Benzoic Acid onto
Activated Carbon." Adsorption Science & Technology. (2008), 233-250.

77
28. Alighardashi A, Shahali S. "Removal of Nitrate from Synthetic Aqueous Solution and
Groundwater in a Continuous Pilot System using Chemical Activated Carbon Derived from
Walnut Shell." Water Practice & Technology. (2016), 784-795.
29. "Table of Acids with Ka and pKa Values." At
http://clas.sa.ucsb.edu/staff/Resource%20folder/Chem109ABC/Acid,%20Base%20Strength/Tabl
e%20of%20Acids%20w%20Kas%20and%20pKas.pdf
30. Wibowo N, Setyadhi L, Wibowo D, Setiawan J, Ismadji S. "Adsorption of benzene and toluene
from aqueous solutions onto activated carbon and its acid and heat treated forms: Influence of
surface chemistry on adsorption." Journal of Hazardous Materials. (2007), 237-242.
31. Ge˛sikiewicz-Puchalska A, Zgrzebnicki M, Michalkiewicz I, Narkiewicz U, Morawski A, and
Wrobel A. "Improvement of CO2 uptake of activated carbons by treatment with mineral acids."
Chemical Engineering Journal. (2017), 159-171.
32. Beemer K. "Adsorption of BTEX group Compounds onto Phenolic Precipitates Created by
Soybean Peroxidase." 59-410 undergraduate research project, Unviersity of Windsor (2014)
33. Steliga T, Jakubowicz P, and Kaputsa P. "Changes in toxicity during treatment of wastewater
from oil plant contaminated with petroleum hydrocarbons." Journal of Chemical Technology and
Biotechnology (2014), 1408-1418.
34. Henriksen A, Mirza O, Indiani C, Teilum K, Smulevich G, Welinder K, Gajhede M "Structure of
soybean seed coat peroxidase: a plant peroxidase with unusual stability and haem-apoprotein
interactions." Protein Sci. (2001), 108-115.
35. Chen, Miao, "Peroxidase-catalyzed 4-Phenylazophenol Polymerization in Micellar
Solution". Electronic Theses and Dissertations. University of Windsor, (2015), 5457.

78
36. Feng W, Taylor K, Biswas N, Bewtra J. "Soybean peroxidase trapped in product precipitate
during phenol polymerization retains activity and may be recycled." Journal of Chemical
Technology and Biotechnology (2013), 1429-1435.
37. Feng, W, Taylor K, Biswas N, Bewtra J. "Phenolic Precipitates from Soybean Peroxidase–
Catalyzed Wastewater Treatment: Concentrated Waste Serves to Concentrate Its Progenitor."
Journal of Hazardous, Toxic, and Radioactive Waste (2015), 2153 - 5515.

79
Appendix A: SBP Activity Assay
Soybean Peroxidase (SBP) Activity Assay:
A colourimetric assay was used to measure the activity of soybean peroxidase. SBP activity is
determined by a time-based measurement done on an assay reagent where the absorbance is
measured at 510 nm using a spectrophotometer. One unit (U) of SBP activity is defined as the
amount of SBP that catalyzes the conversion of 1 μmol of hydrogen peroxide in one minute
under the assay conditions.
Assay Reagent:
The assay reagent is made using a 100 mM phenol solution with 0.5 M pH = 7.4 phosphate
buffer (0.941 g of phenol, 1.31 g of monobasic sodium phosphate and 5.80 g of dibasic sodium
phosphate). 5 mL of this solution is mixed with 25 mg of 4-aminoantipyrine (4-AAP) and 0.1 mL
of 100 mM hydrogen peroxide and made up to 45 mL with water. Once constituted, this reagent
is used within 1 hour.
Procedure:
1. SBP stock solution is diluted to around 1 U/mL.
2. A 50 μL sample of SBP is injected into the cuvette.
3. The cuvette is placed in the spectrophotometer. The spectrophotometer is blanked in advance
at 510 nm with 950 uL of reagent plus 50 uL of water
4. 950 μL of the assay reagent is quickly added to the cuvette and measurements are started.
5. The computer takes measurements of the absorbance at 510 nm once every 5 seconds for 30
seconds and determines the rate.

80
6. SBP activity is calculated using the slope of the line and the dilution factor.
SBP Activity Calculation:
𝐴𝑐𝑡𝑖𝑣𝑖𝑡𝑦 𝑖𝑛 𝑡ℎ𝑒 𝑐𝑢𝑣𝑒𝑡𝑡𝑒 (𝑈
𝑚𝐿) =
𝑆𝑙𝑜𝑝𝑒 (𝐴𝑈𝑠
) ∗ (60𝑠
1min) ∗ 20 (𝑑𝑖𝑙𝑢𝑡𝑖𝑜𝑛 𝑓𝑎𝑐𝑡𝑜𝑟 𝑖𝑛 𝑡ℎ𝑒 𝑐𝑢𝑣𝑒𝑡𝑡𝑒)
6𝑚𝑖𝑛−1𝑐𝑚−1 ∗ 1 𝑐𝑚
= 𝑠𝑙𝑜𝑝𝑒 ∗ 200μmol
𝑚𝑖𝑛 (𝑈)
𝐴𝑐𝑡𝑖𝑣𝑖𝑡𝑦 𝑖𝑛 𝑆𝐵𝑃 𝑠𝑡𝑜𝑐𝑘 = 𝐴𝑐𝑡𝑖𝑣𝑖𝑡𝑦 𝑖𝑛 𝑡ℎ𝑒 𝑐𝑢𝑣𝑒𝑡𝑡𝑒 ∗ 𝑑𝑖𝑙𝑢𝑡𝑖𝑜𝑛 𝑓𝑎𝑐𝑡𝑜𝑟
Appendix B: Hydrogen Peroxide Assay
A colourimetric assay was used to measure the hydrogen peroxide concentration after the
reaction was complete. The combination of a known concentration of hydrogen peroxide and the
assay reagent forms a pink chromophore with a wavelength max at 510 nm. A series of known
concentrations of hydrogen peroxide are mixed with the assay reagent and the wavelength is
measured using a spectrophotometer. From this a standard curve is constructed and the
concentration of an unknown sample determined from that standard curve.
Assay Reagent:
The assay reagent is made using 12.5 mL of a 100 mM phenol 0.5 M pH = 7.4 phosphate buffer,
63.8 mg of 4-aminoantipyrine (to give 12.5 mM in the reagent), 0.313 mL of Novo ARP liquid
concentrate (approximately 1200 U/mL) and is made up to a volume of 25 mL.
Procedure:
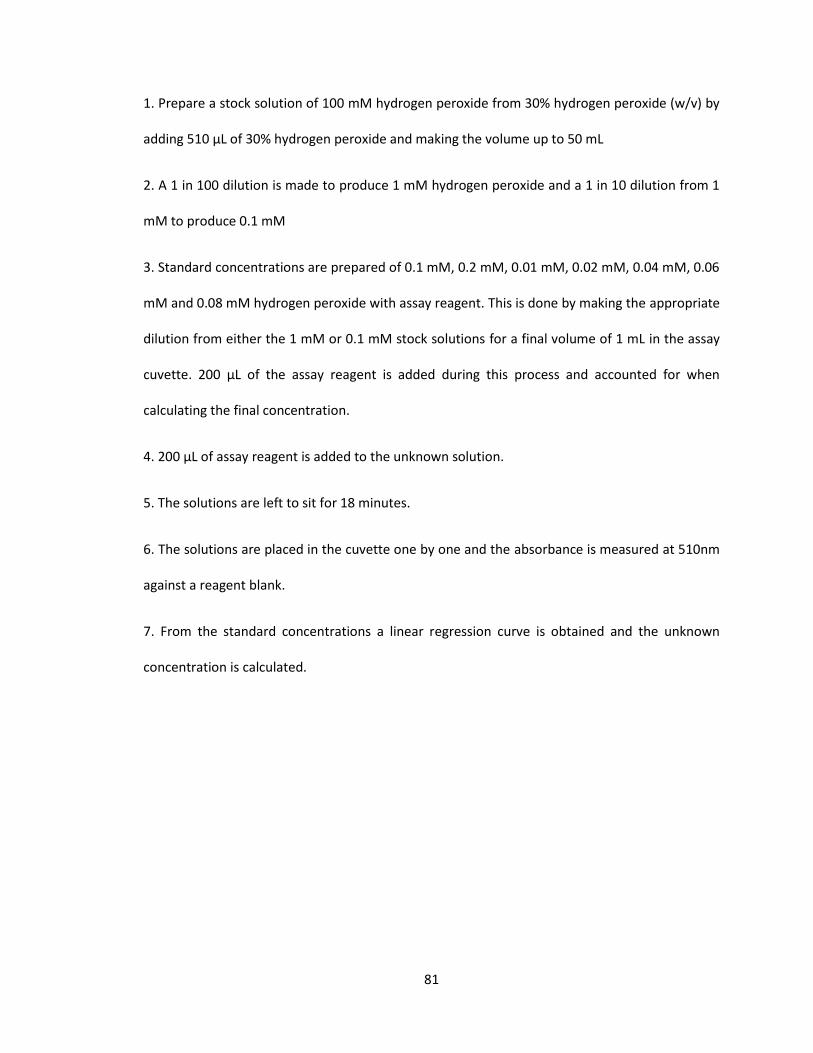
81
1. Prepare a stock solution of 100 mM hydrogen peroxide from 30% hydrogen peroxide (w/v) by
adding 510 μL of 30% hydrogen peroxide and making the volume up to 50 mL
2. A 1 in 100 dilution is made to produce 1 mM hydrogen peroxide and a 1 in 10 dilution from 1
mM to produce 0.1 mM
3. Standard concentrations are prepared of 0.1 mM, 0.2 mM, 0.01 mM, 0.02 mM, 0.04 mM, 0.06
mM and 0.08 mM hydrogen peroxide with assay reagent. This is done by making the appropriate
dilution from either the 1 mM or 0.1 mM stock solutions for a final volume of 1 mL in the assay
cuvette. 200 μL of the assay reagent is added during this process and accounted for when
calculating the final concentration.
4. 200 μL of assay reagent is added to the unknown solution.
5. The solutions are left to sit for 18 minutes.
6. The solutions are placed in the cuvette one by one and the absorbance is measured at 510nm
against a reagent blank.
7. From the standard concentrations a linear regression curve is obtained and the unknown
concentration is calculated.

82
Appendix C: Langmuir Isotherm
The Langmuir Isotherm has been used to characterize adsorption interactions as a function of the
adsorbate concentration. The Langmuir isotherm has three assumption 1) that all adsorption sites
are equivalent, 2) that each site can only one molecule and there is only a monolayer of coverage
and 3) that there is no interaction between adsorbed molecules. The general equation for the
Langmuir isotherm is shown below.
𝑄𝑒
𝑄𝑚=
𝐾𝐶𝑒
1 + 𝐾𝐶𝑒
Where Qe is the equilibrium adsorption capacity (mg/g), Qm is the maximum adsorption capacity
(mg/g), Ce is the equilibrium concentration of the adsorbate (mg/L) and K is the Langmuir
adsorption constant. The Langmuir isotherm is sometimes also written with ϴ where ϴ= Qe/Qm.
To plot the Langmuir isotherm both the initial and equilibrium concentrations of the adsorbate (4-
(phenylazo) benzoic acid) were measured using HPLC and the mass of the precipitate was
measured by vacuum filtration and oven drying.
For the Langmuir experiments whether by static or dynamic ad/absorption, a stock solution of 4-
(phenylazo)benzoic acid was used. The stock solution varied in initial concentration of Azo but
tended to be around 90 μM initially. The stock solution also contained 5 mM pH = 7.0 phosphate
buffer. Dilutions were made using 5 mM pH = 7.0 phosphate buffer to create 5 different
concentrations of Azo somewhat equally separated from 4 μM to 88 μM. These points were
chosen to ensure that at least 2 values lay above and below the half-saturation point for the
system. For the static experiments phenolic precipitates were then added from a standard
suspension in equal amounts to each solution (2.5 mL aliquot) such that all solutions totaled 25
mL. 2.5 mL of solution is also taken and vacuum filtered using a Buchner funnel and filter paper

83
(0.2 μm). This process is done in triplicate. The Buchner funnels are then oven dried overnight and
the difference in weight between the initial mass of the Buchner funnel and the mass of the new
system is defined as the precipitate mass.
For the dynamic experiments 250 μL of 100 mM phenol stock, 375 μL of 100 mM hydrogen
peroxide and an appropriate amount of SBP stock solution were added to create a solution which
contained 1 U/mL of SBP, 1.5 mM hydrogen peroxide and 1 mM phenol in a 25 mL solution. The
solutions were left for 24 hours and then a 1 mL sample was taken filtered and tested in HPLC.
The difference between the initial concentration of 4-(phenylazo) benzoic acid and the equilibrium
concentration is defined as the adsorbed amount.
Using the equilibrium concentration, precipitate mass and adsorbed amount the Langmuir curve
was then fit using Excel Solver. Tables of measured values for the static and dynamic Langmuir
analyses are shown below.
Table C-1: Static Langmuir analysis
Initial Concentration (mg/L) Equilibrium Concentration
(mg/L)
Measured Precipitate Mass
(mg)
0.91 ± 0.04 0.72 ± 0.04
3 ± 1
1.79 ± 0.04 1.50 ± 0.04
3.72 ± 0.04 3.00 ± 0.04
9.23 ± 0.04 8.13 ± 0.04
19.92 ± 0.04 18.36 ± 0.04
The above graph shows all measured values for the static Langmuir analysis. Concentration was
determined using HPLC and precipitate mass was measured using the above method. Error is calculated
from the standard deviation of triplicate runs using the formula Standard error = (Standard deviation)/ √n
where n is the number of measurements (3).

84
Table C-2: Dynamic Langmuir analysis
Initial Concentration (mg/L) Equilibrium Concentration
(mg/L)
Measured Precipitate Mass (mg)
0.98 ± 0.04 0.72 ± 0.04
2.0 ± 0.2 1.85 ± 0.04 1.39 ± 0.04
3.59 ± 0.04 2.73 ± 0.04
14.58 ± 0.05 12.56 ± 0.04
20.82 ± 0.04 18.19 ± 0.04
The above graph shows all measured values for the dynamic Langmuir analysis. Concentration was
determined using HPLC and precipitate mass was measured using the above method. Error is calculated
from the standard deviation of triplicate runs using the formula Standard error = (Standard deviation)/ √n
where n is the number of measurements (3).
Appendix D: Standard Curves
4-(phenylazo) benzoic acid:
4-(phenylazo) benzoic acid concentration was calculated using a standard curve of peak area vs
concentration obtained using an HPLC. The concentration is measured in μM and the peak area at
325 nm. The standard curve was made from the dilution of a stock solution of 4-(phenylazo)
benzoic acid and 5mM pH = 7.0 phosphate buffer. The dilutions were done with 5 mM pH = 7.0
phosphate buffer to maintain buffer concentration. Five different concentrations were obtained
and all points are triplicates. The five values for concentration were chosen such that they
corresponded to 1/10th, 2/10ths, 4/10ths, 8/10ths and 10/10ths of the stock solution. HPLC
conditions were 70% ACN and 30% 5 mM pH = 7.0 phosphate buffer. A standard curve is shown
in Figure D-1.

85
Figure D-1: 4-(phenylazo)benzoic acid standard curve for 5 mM buffer stock solution. Example standard
curve for Azo concentration (μM) vs HPLC peak area measured at 325 nm. Used to determine concentration
of any unknown samples. HPLC conditions used were 70% acetonitrile, 30% 5 mM phosphate buffer pH =
7.0.
A second type of standard curve for 4-(phenylazo) benzoic acid was used to calculate 4-
(phenylazo) benzoic acid concentration in a solution of 100% ACN. This standard was created in
the same manner as the one above except it was created from a stock solution of 4-(phenylazo)
benzoic acid in 100% ACN and diluted using 100% CAN
y = 9949x - 432.87R² = 0.9999
0
100000
200000
300000
400000
500000
600000
700000
0 10 20 30 40 50 60 70
Pea
k A
rea
Concentration (μM)
4-(Phenyazo)benzoic acid Standard Curve for 5 mM Phosphate Buffer Stock Solution

86
Figure D-2: 4-(phenylazo)benzoic acid standard curve for 100% acetonitrile stock solution. Example
standard curve for Azo concentration (μM) vs HPLC peak area measured at 325 nm. Used to determine
concentration of any unknown samples. HPLC conditions used were 70% acetonitrile, 30% 5 mM phosphate
buffer pH = 7.0.
Para-aminobenzoic acid:
PABA concentration was calculated using a standard curve of peak area vs concentration obtained
using an HPLC. The concentration is measured in both mM and μM and the peak area is measured
at 280 nm. The standard curve was made from the dilution of a stock solution of PABA and 5 mM
pH = 7.0 phosphate buffer. The dilutions were done with 5 mM pH = 7.0 phosphate buffer to
maintain buffer concentration. Five different concentrations were obtained and all points are
triplicates. The five values for concentration were chosen such that they corresponded to 1/10th,
2/10ths, 4/10ths, 8/10ths and 10/10ths of the stock solution. HPLC conditions were 40% ACN and
60% 5 mM pH = 7.0 ammonium acetate/phosphate buffer. Two standard curves one for mM levels
and one for μM levels are shown below.
y = 9658.7x - 22223R² = 0.9998
0.00
200000.00
400000.00
600000.00
800000.00
1000000.00
1200000.00
0.00 20.00 40.00 60.00 80.00 100.00 120.00
Pea
k A
rea
Concentration (μM)
4-(Phenylazo)benzoic acid Standard for 100% ACN Stock Solution.

87
Figure D-3: PABA standard curve for concentrations from 7.58 – 75.8 μM. Example standard curve for PABA
concentration (μM) vs HPLC peak area measured at 280 nm. Used to determine concentration of any
unknown samples. HPLC conditions used were 40% acetonitrile, 60% 5 mM phosphate buffer pH = 7.0.
Figure D-4: PABA standard curve for concentrations from 0.076 – 0.76 mM. Example standard curve for
PABA concentration (mM) vs HPLC peak area measured at 280 nm. Used to determine concentration of any
unknown samples. HPLC conditions used were 40% acetonitrile, 60% 5 mM ammonium acetate buffer pH =
7.0.
y = 6607.5x - 2685.2R² = 0.9958
0
100000
200000
300000
400000
500000
600000
0 10 20 30 40 50 60 70 80
Pea
k A
rea
Concentration (μM)
PABA Standard Curve
y = 8E+06x - 216464R² = 0.9936
0
1000000
2000000
3000000
4000000
5000000
6000000
7000000
0 0.1 0.2 0.3 0.4 0.5 0.6 0.7 0.8
Pea
k A
rea
Concentration (mM)
PABA Standard Curve

88
Aniline:
Aniline concentration was calculated using a standard curve of peak area vs concentration
obtained using an HPLC. The concentration is measured in μM and the peak area at 280 nm. The
standard curve was made from the dilution of a stock solution of aniline and 5mM pH = 7.0
phosphate buffer. The dilutions were done with 5 mM pH = 7.0 phosphate buffer to maintain
buffer concentration. Five different concentrations were obtained and all points are triplicates.
The five values for concentration were chosen such that they corresponded to 1/10th, 2/10ths,
4/10ths, 8/10ths and 10/10ths of the stock solution. HPLC conditions were 40% ACN and 60% 5mM
pH = 7.0 ammonium acetate buffer. The standard curve is shown below.
Figure D-5: Aniline standard curve. Example standard curve for aniline concentration (mM) vs HPLC peak
area measured at 280 nm. Used to determine concentration of any unknown samples. HPLC conditions used
were 40% acetonitrile, 60% 5 mM ammonium acetate buffer pH = 7.0.
y = 559.42x - 805.51R² = 0.9938
0.00
10000.00
20000.00
30000.00
40000.00
50000.00
60000.00
0.00 20.00 40.00 60.00 80.00 100.00 120.00
Pea
k A
rea
Concentration (μM)
Aniline Standard Curve

89
Vita Auctoris
Name: Kayven Wayne Beemer
Place of Birth: Windsor, Ontario, Canada
Year of Birth: 1992
Education: MSc, Chemistry and Biochemistry
University of Windsor
Windsor, Ontario, Canada
2017
BSc, Honours Biochemistry with Thesis
University of Windsor
Windsor, Ontario, Canada
2014