Embed Size (px)
Citation preview
Absorption by atmospheric gases of incoming and outgoing radiationNotes for instructor are in blue font.
Goals: Estimate the absorption by Earth’s atmosphere of both incoming and outgoing
radiation Contrast atmospheric constituents based on their absorption spectra Identify greenhouse and non-greenhouse gases based on their absorption spectra Estimate Earth’s surface temperature from satellite data
It would be useful for students to already have learned about blackbody radiation and Planck curves.
Pre-class preparation:Photocopy the worksheets. Keep separate piles of each of the following:
1. Activity 1, group 1 (one per individual, for 1/3 of the class)2. Activity 1, group 2, (one per individual, for 1/3 of the class)3. Activity 1, group 3 (one per individual, for 1/3 of the class)4. Activity 2, part 1 (one per group of 3 students)5. Activity 2, part 2 (one per group of 3 students)
Divide class into groups of 3 people (multiples of groups are fine). Each group initially examines data from one part of the electromagnetic spectrum that is relevant for Earth’s climate.
Group 1: Short-wave radiation (0.1-3 microns wavelength)Group 2: Infrared radiation (3-12 microns wavelength)Group 3: More infrared radiation (12-40 microns wavelength)
Activity 1: (This activity will take about 45 minutes) 1. Hand out the worksheets for Activity 1 to each of the three groups.2. Each group completes the worksheet together. Each individual completes a copy of
the page with the 8 panels of spectra to take with them to the next group.
Next, re-divide the class into XX groups of 3 people, with at least one individual from each of the “short-wave” “infrared” and “more infrared” groups. Extra people are OK, but all 3 parts of the spectrum should be represented in each new group.
Activity 2: (This activity will take about 45 minutes) 1. Hand out the worksheet for Activity 2.2. Groups complete the worksheet together. 3. Have groups simultaneously report:
a. Their top-ranked greenhouse gas, for today’s atmosphere on Earth (last ranking they do)
b. Their wavelength range for the atmospheric windowc. Their estimate of Earth’s surface temperature
The simultaneous reporting could be (1) written on paper that is handed in and compiled in real time by the instructor, or (2) clickers, if the answer choices are generated from the student groups, or (3) some other way to simultaneously report.Assessment:
See suggested assessment file.

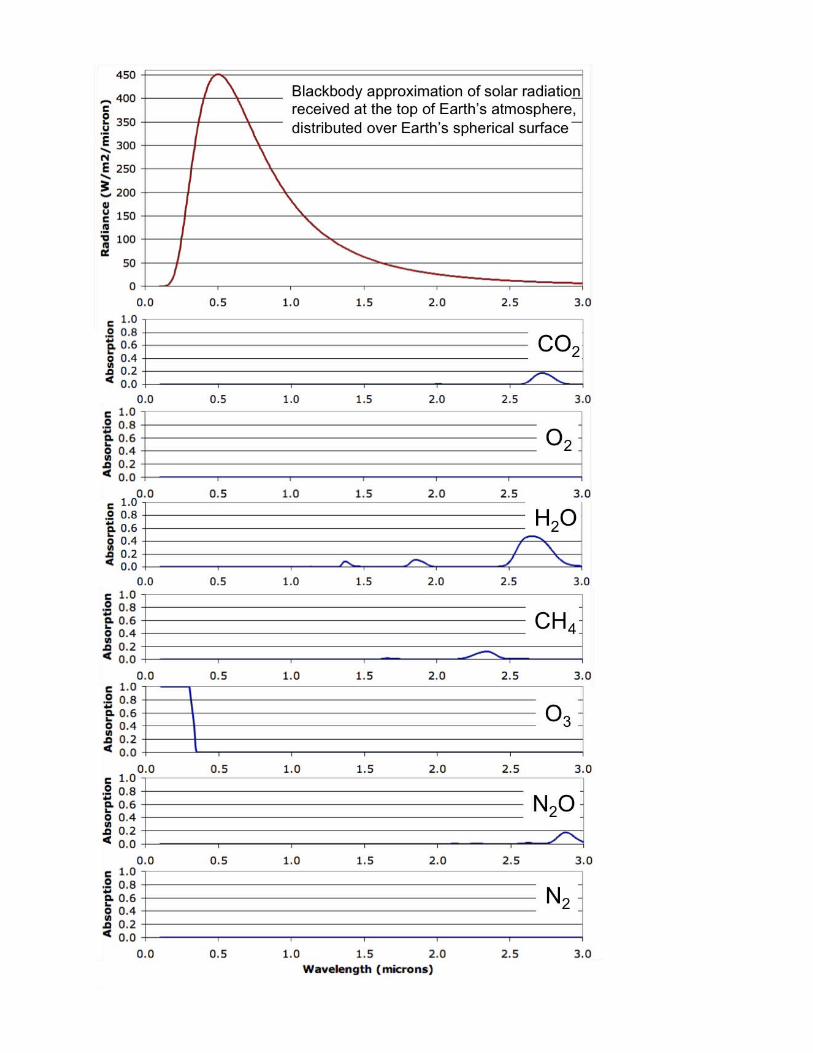
Activity 1, Group 1 (0.1-3 microns):This activity will take about 45 minutesOn the following page are plots showing (1) a blackbody approximation of solar radiation received at the top of Earth’s atmosphere, in the UV-visible-infrared wavelength range of 0.1 to 3 microns, The units used throughout this activity are W/m2/micron. The solar spectrum is scaled so the data represent average W/m2 received, spread equally over the spherical surface area of the Earth. The area under the curve should equal about 342 W/m2.(2) absorption by seven different atmospheric gases in this wavelength range. Absorption values range from zero (no absorption at that wavelength by that gas) to one (all radiation at that wavelength gets absorbed by that gas). All the absorption data for these activities were obtained from the HITRAN2008 data set available on SpectralCalc.com. You can replot the data if you’d like, from the spreadsheets provided with this activity. All are simulated absorption spectra for a gas cell 10 cm in length and volume mixing ratios of 0.1. They do not correspond to concentrations of these gases in Earth’s atmosphere.
Questions:1. On the top panel, draw what you think the solar radiation spectrum would look like
(from 0.1-3 microns) after passing through an atmosphere with all these gases (N2, O2, H2O, CO2, N2O, CH4, O3). Label appropriately. Student drawings should show downward-pointing absorption bands on the top panel, at the appropriate wavelengths for the gases shown. Some consideration of the strength of each absorption band should be evident. For example, if a peak of an absorption band is 0.5, students might draw an absorption band down to half of the blackbody radiation at that wavelength (though see Q4 notes). They might go the wrong way and draw peaks. You can let this go until after they meet in their second groups for Activity 2, where this will likely get addressed by other students. Or you could ask them something like “So, after passing through the atmosphere, there’s MORE radiation at this wavelength?”
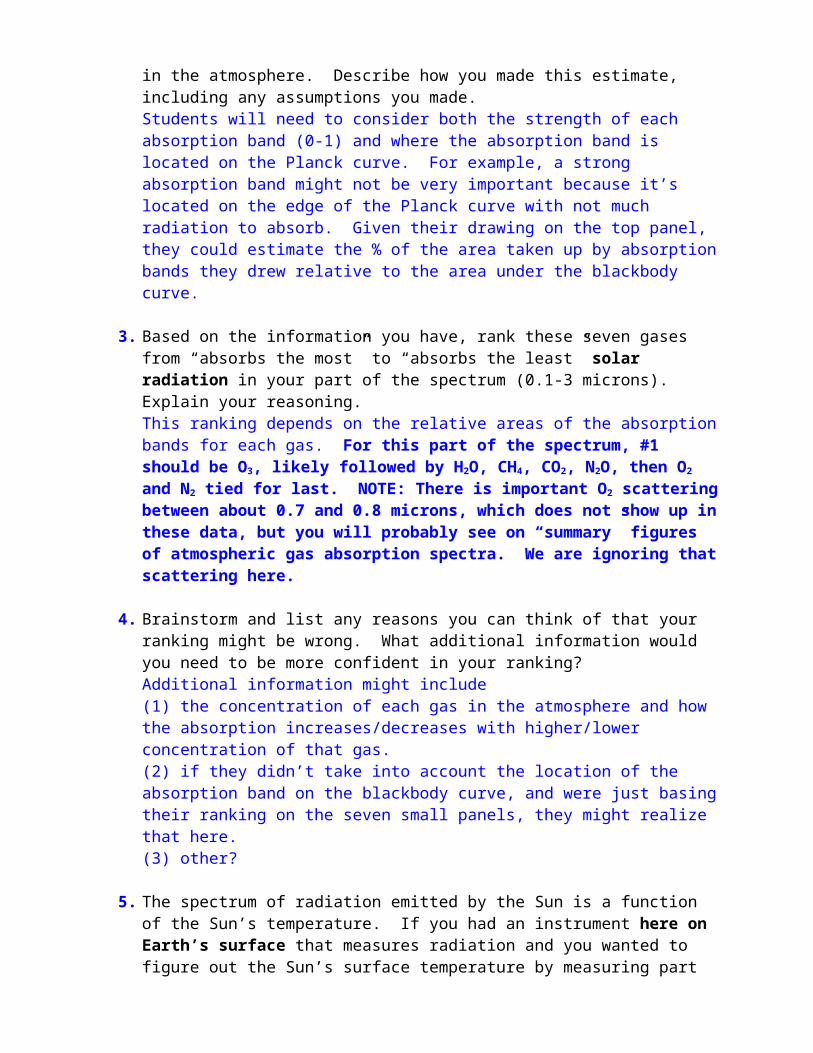
2. Estimate the total percentage of the solar radiation in this wavelength range (0.1-3 microns) that gets absorbed by gases in the atmosphere. Describe how you made this estimate, including any assumptions you made. Students will need to consider both the strength of each absorption band (0-1) and where the absorption band is located on the Planck curve. For example, a strong absorption band might not be very important because it’s located on the edge of the Planck curve with not much radiation to absorb. Given their drawing on the top panel, they could estimate the % of the area taken up by absorption bands they drew relative to the area under the blackbody curve.
3. Based on the information you have, rank these seven gases from “absorbs the most” to “absorbs the least” solar radiation in your part of the spectrum (0.1-3 microns). Explain your reasoning. This ranking depends on the relative areas of the absorption bands for each gas. For this part of the spectrum, #1 should be O3, likely followed by H2O, CH4, CO2, N2O, then O2 and N2 tied for last. NOTE: There is important O2 scattering between about 0.7 and 0.8 microns, which does not show up in these data, but you will
probably see on “summary” figures of atmospheric gas absorption spectra. We are ignoring that scattering here.
4. Brainstorm and list any reasons you can think of that your ranking might be wrong. What additional information would you need to be more confident in your ranking?Additional information might include (1) the concentration of each gas in the atmosphere and how the absorption increases/decreases with higher/lower concentration of that gas. (2) if they didn’t take into account the location of the absorption band on the blackbody curve, and were just basing their ranking on the seven small panels, they might realize that here. (3) other?
5. The spectrum of radiation emitted by the Sun is a function of the Sun’s temperature. If you had an instrument here on Earth’s surface that measures radiation and you wanted to figure out the Sun’s surface temperature by measuring part of the radiation spectrum coming in to Earth’s surface (between 0.1 and 3 microns), what wavelengths would you measure? Explain your reasoning. This is the first question to get students thinking about a useful application, and, ultimately, in Activity 2, to come up with appropriate wavelengths for the atmospheric window. In this case, imagine an instrument sitting on Earth’s surface pointing upward, measuring the radiation coming in. To estimate the Sun’s temperature, one would want to measure wavelengths that had the LEAST interference from atmospheric gases (since in this case we’re measuring the radiation that makes it through the atmosphere). For this group (0.1-3 microns), a reasonable range is about 0.4-1.3 microns, between the right side of the O3 absorption band and the left side of the shortest wavelength H2O band. Students might argue for other parts of the spectrum with no apparent absorption bands, e.g. 1.45-1.75 microns. One thing to consider is that there is less radiation coming in at those wavelengths compared to the part of the spectrum closer to the Planck peak, so 0.4-1.3 might be a better choice.

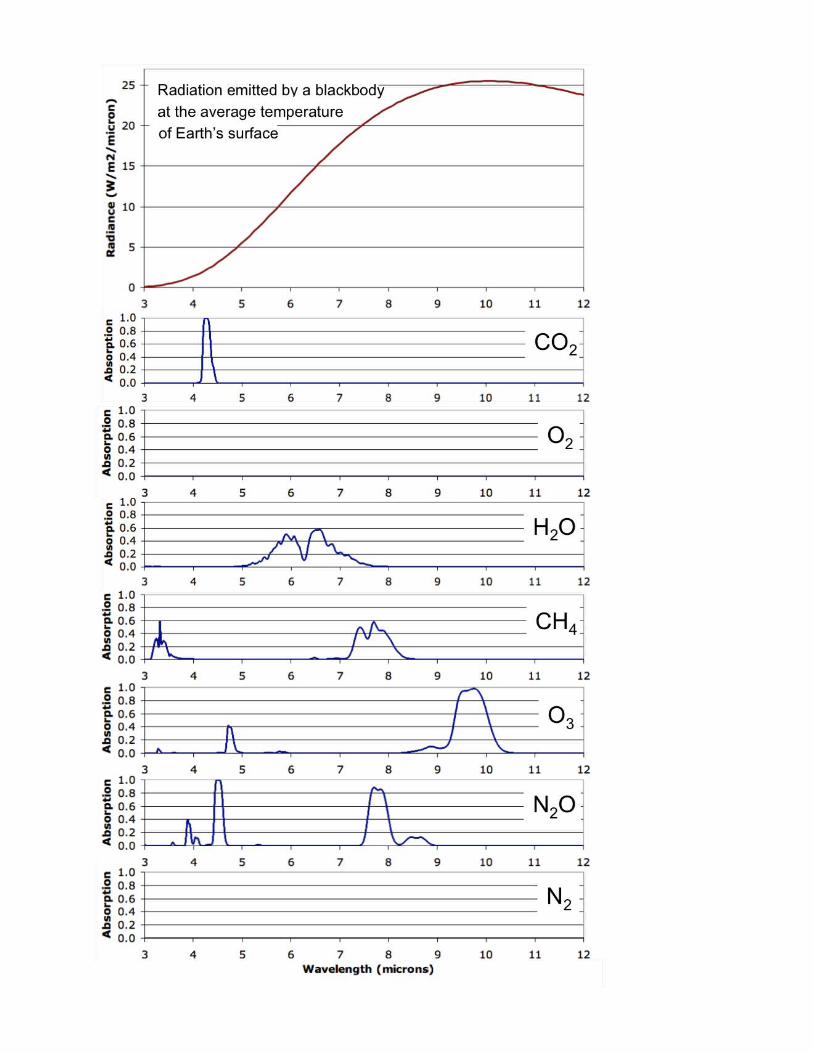
Activity 1, Group 2 (3-12 microns):On the following page are plots showing (1) radiation emitted by a blackbody the same average temperature as the Earth’s surface, in the infrared wavelength range of 3 to 12 microns, The area under the curve from Group 2 and Group 3 together should equal about 342 W/m2, balancing the incoming radiation from Group 1.(2) absorption by seven different atmospheric gases in this wavelength range. Absorption values range from zero (no absorption at that wavelength by that gas) to one (all radiation at that wavelength gets absorbed by that gas).
Questions:1. On the top panel, draw what you think the Earth’s radiation spectrum would look
like (from 3-12 microns) after passing through an atmosphere with all these gases (N2, O2, H2O, CO2, N2O, CH4, O3). Label appropriately. Student drawings should show downward-pointing absorption bands on the top panel, at the appropriate wavelengths for the gases shown. Some consideration of the strength of each absorption band should be evident. For example, if a peak of an absorption band is 0.5, students might draw an absorption band down to half of the blackbody radiation at that wavelength (though see Q4 notes). They might go the wrong way and draw peaks. You can let this go until after they meet in their second groups for Activity 2, where this will likely get addressed by other students. Or you could ask them something like “So, after passing through the atmosphere, there’s MORE radiation at this wavelength?”
2. Estimate the total percentage of the radiation emitted by Earth’s surface in this wavelength range (3-12 microns) that gets absorbed by gases in the atmosphere. Describe how you made this estimate, including any assumptions you made. Students will need to consider both the strength of each absorption band (0-1) and where the absorption band is located on the Planck curve. For example, a strong absorption band might not be very important because it’s located on the edge of the Planck curve with not much radiation to absorb. Given their drawing on the top panel, they could estimate the % of the area taken up by absorption bands they drew relative to the area under the blackbody curve.
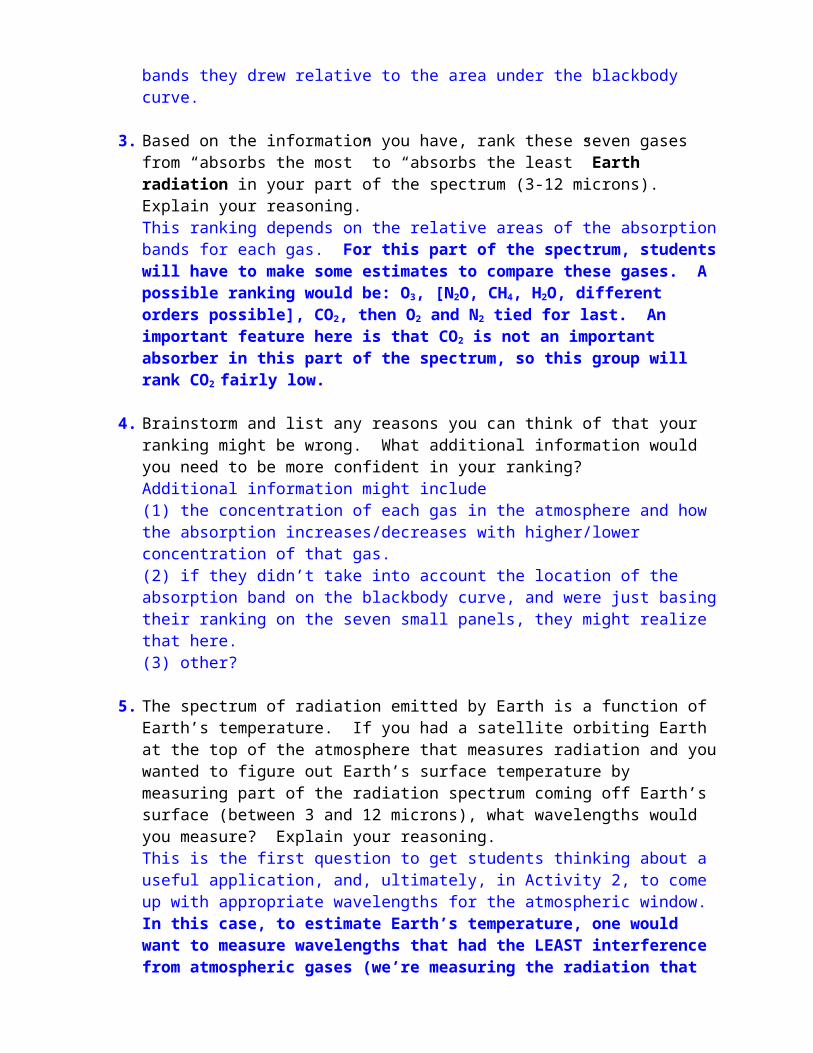
3. Based on the information you have, rank these seven gases from “absorbs the most” to “absorbs the least” Earth radiation in your part of the spectrum (3-12 microns). Explain your reasoning. This ranking depends on the relative areas of the absorption bands for each gas. For this part of the spectrum, students will have to make some estimates to compare these gases. A possible ranking would be: O3, [N2O, CH4, H2O, different orders possible], CO2, then O2 and N2 tied for last. An important feature here is that CO2 is not an important absorber in this part of the spectrum, so this group will rank CO2 fairly low.
4. Brainstorm and list any reasons you can think of that your ranking might be wrong. What additional information would you need to be more confident in your ranking?Additional information might include (1) the concentration of each gas in the atmosphere and how the absorption increases/decreases with higher/lower concentration of that gas.

(2) if they didn’t take into account the location of the absorption band on the blackbody curve, and were just basing their ranking on the seven small panels, they might realize that here. (3) other?
5. The spectrum of radiation emitted by Earth is a function of Earth’s temperature. If you had a satellite orbiting Earth at the top of the atmosphere that measures radiation and you wanted to figure out Earth’s surface temperature by measuring part of the radiation spectrum coming off Earth’s surface (between 3 and 12 microns), what wavelengths would you measure? Explain your reasoning. This is the first question to get students thinking about a useful application, and, ultimately, in Activity 2, to come up with appropriate wavelengths for the atmospheric window. In this case, to estimate Earth’s temperature, one would want to measure wavelengths that had the LEAST interference from atmospheric gases (we’re measuring the radiation that makes it through the atmosphere). For this group (3-12 microns), a reasonable range is about 10.3-12 microns, between the right side of the O3 absorption band and the end of their spectrum. This range should be what the groups come up with for the atmospheric window later in Activity 2.

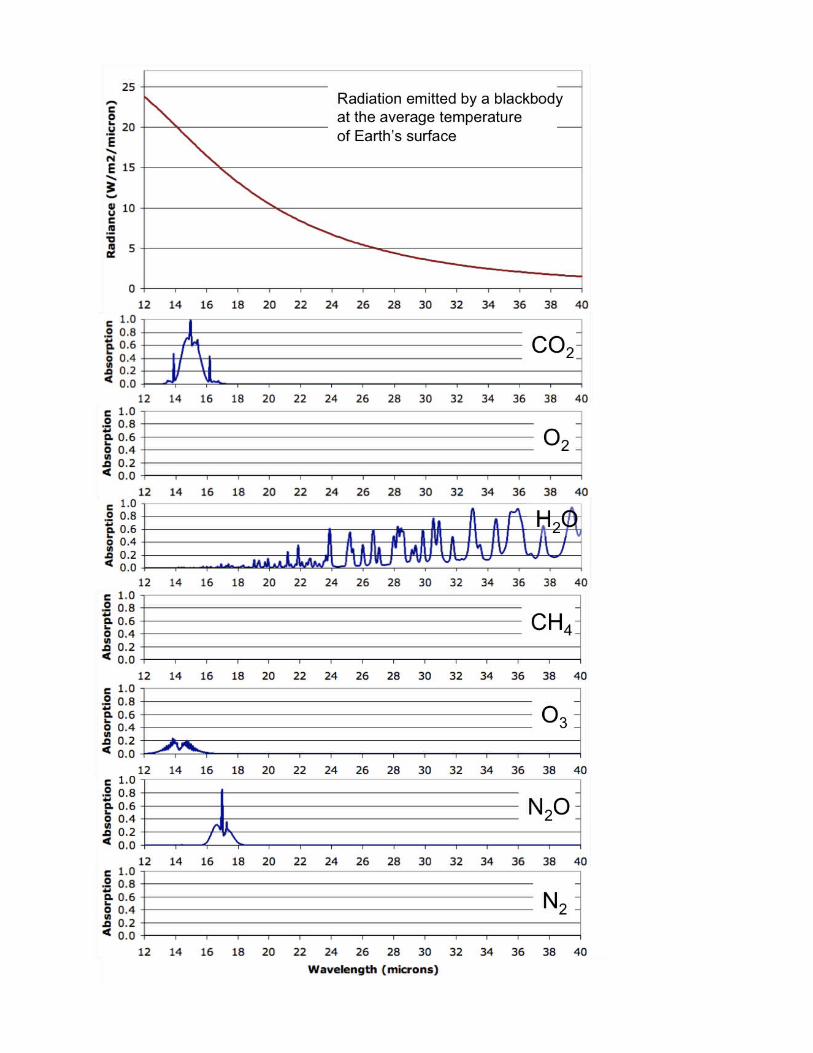
Activity 1, Group 3 (12-40 microns):On the following page are plots showing (1) radiation emitted by a blackbody the same average temperature as the Earth’s surface, in the infrared wavelength range of 12 to 40 microns, The area under the curve from Group 2 and Group 3 together should equal about 342 W/m2, balancing the incoming radiation from Group 1.(2) absorption by seven different atmospheric gases in this wavelength range. Absorption values range from zero (no absorption at that wavelength by that gas) to one (all radiation at that wavelength gets absorbed by that gas).
Questions:1. On the top panel, draw what you think the Earth’s radiation spectrum would look
like (from 12-40 microns) after passing through an atmosphere with all these gases (N2, O2, H2O, CO2, N2O, CH4, O3). Label appropriately. Student drawings should show downward-pointing absorption bands on the top panel, at the appropriate wavelengths for the gases shown. Some consideration of the strength of each absorption band should be evident. For example, if a peak of an absorption band is 0.5, students might draw an absorption band down to half of the blackbody radiation at that wavelength (though see Q4 notes). They might go the wrong way and draw peaks. You can let this go until after they meet in their second groups for Activity 2, where this will likely get addressed by other students. Or you could ask them something like “So, after passing through the atmosphere, there’s MORE radiation at this wavelength?”
2. Estimate the total percentage of the radiation emitted by Earth’s surface in this wavelength range (12-40 microns) that gets absorbed by gases in the atmosphere. Describe how you made this estimate, including any assumptions you made. Students will need to consider both the strength of each absorption band (0-1) and where the absorption band is located on the Planck curve. For example, a strong absorption band might not be very important because it’s located on the edge of the Planck curve with not much radiation to absorb. Given their drawing on the top panel, they could estimate the % of the area taken up by absorption bands they drew relative to the area under the blackbody curve.
3. Based on the information you have, rank these seven gases from “absorbs the most” to “absorbs the least” Earth radiation in your part of the spectrum (12-40 microns). Explain your reasoning. This ranking depends on the relative areas of the absorption bands for each gas. For this part of the spectrum, students will have to make some estimates to compare these gases, particularly to decide between H2O (many absorption bands, but at wavelengths on the tail of the Planck curve) and CO2 (one strong absorption band near the peak of the Planck curve). A possible ranking would be: H2O, CO2, [O3, N2O, different order possible], then CH4, O2 and N2 tied for last.
4. Brainstorm and list any reasons you can think of that your ranking might be wrong. What additional information would you need to be more confident in your ranking?Additional information might include (1) the concentration of each gas in the atmosphere and how the absorption
increases/decreases with higher/lower concentration of that gas. (2) if they didn’t take into account the location of the absorption band on the blackbody curve, and were just basing their ranking on the seven small panels, they might realize that here. (3) other?
5. The spectrum of radiation emitted by Earth is a function of Earth’s temperature. If you had a satellite orbiting Earth at the top of the atmosphere that measures radiation and you wanted to figure out Earth’s surface temperature by measuring part of the radiation spectrum coming off Earth’s surface (between 12 and 40 microns), what wavelengths would you measure? Explain your reasoning. This is the first question to get students thinking about a useful application, and, ultimately, in Activity 2, to come up with appropriate wavelengths for the atmospheric window. In this case, to estimate Earth’s temperature, one would want to measure wavelengths that had the LEAST interference from atmospheric gases (we’re measuring the radiation that makes it through the atmosphere). For this group (12-40 microns), there’s not much that’s very good. They might select the wavelengths just to the right of 12 microns, or 18-19 microns, or perhaps one of the wavelength ranges in which H2O absorption is small.

Activity 2, groups with representatives from the 3 parts of the spectrum. This activity will take about 45 minutesYou should have at least one person from:(1) 0.1-3 microns (2) 3-12 microns (3) 12-40 microns
To do, Part 1: 1. Line up your three worksheets (folding might help) and examine each gas’
absorption spectrum across all these wavelengths.Since the horizontal axes are different total ranges for each of the 3 groups, the horizontal scaling won’t be perfect.
2. Explain to your group what considerations you (and your previous group) used to draw on the top panel of your worksheet. If you have discrepancies among the groups’ approaches, figure out a common approach and make any needed changes on your worksheet.
Questions, Part 1:1. Based on the MORE COMPLETE information you now have, rank these seven gases
from “absorbs the most” to “absorbs the least” Earth radiation.Students will have to somehow deal with “per micron”, since the horizontal ranges are not the same for Group 2 (9 micron range) and Group 3 (28 micron range). For example, the absorption peak for O3 at about 9-10 microns “looks” similar to the CO2 absorption peak from 14-16 microns, but the CO2 peak spans 2 microns instead of 1. A possible likely ranking would be H2O, CO2, O3, N2O, CH4, with O2 and N2 tied for last.
2. Compare this list to each of the original lists from the 3-12 micron group and the 12-40 micron group. Write down any discrepancies here, and explain why you think there are discrepancies. Neither group had the complete picture, so there will be discrepancies.
3. Compare your new list of absorbers of Earth radiation to the list of absorbers of solar radiation from the 0.1-3 micron group. What’s the same about these lists? What’s different? O3 is the primary important gas on both lists. They might also mention that H2O, CO2, CH4, and N2O all have absorption bands in both ranges, though not in the UV or visible.
4. Based on the information you have, which of these seven atmospheric gases are greenhouse gases? Which are NOT greenhouse gases?Greenhouse gases: H2O, CO2, O3, CH4, N2ONot greenhouse gases: N2 and O2
5. Based on the MORE COMPLETE information you now have, repeat the last question from the first activity, which is: The spectrum of radiation emitted by Earth is a function of Earth’s temperature. If you had a satellite orbiting Earth at the top of the atmosphere that measures radiation and you wanted to figure out Earth’s surface temperature by measuring part of the radiation spectrum coming off its surface, what wavelengths would you measure? Explain your reasoning.

This is your estimate for the “atmospheric window”. 10.3-12 microns is the best choice.
To do, Part 2: On the following page is a plot showing (1) Five smooth curves representing radiation emitted from blackbodies at different temperatures. There’s one curve for each of 220K, 240K, 260K, 280K, 300K (2) The wiggly line is the radiation that would be measured by a satellite at 12 km altitude above Earth’s surface, looking down toward Earth’s surface, for today’s atmospheric composition.
Questions, Part 2:1. The satellite curve doesn’t follow any of the blackbody curves. Why not? Explain all
of the features of the satellite curve that you can. Students should identify particular absorption features associated with particular gases, e.g. the CO2 absorption bands between 14 & 16 microns and 4-4.5 microns, H2O absorption between 5 & 7 microns, and the many bands at the longer wavelengths, the O3 absorption band between 9 & 10 microns, CH4 between 7 & 8 microns (a bit difficult to see), etc.
2. Based on this new satellite information, rank the greenhouse gases you identified earlier from most to least important in today’s atmosphere. Explain your reasoning.Students will have to estimate how much radiation has been absorbed in each band, which requires estimating what the radiation spectrum would have looked like before any interaction with atmospheric gases. They might rough in an estimate of the blackbody spectrum, then estimate the areas of the absorption bands to do this ranking. Likely possible ranking: H2O, CO2, CH4, [O3, N2O]. There is overlap among the different gases, so CH4, O3, and N2O in particular may be difficult to disentangle here.
3. Based on this plot, estimate Earth’s surface temperature. Explain how you did it. If, in the previous question, student roughed in an estimate of the original blackbody curve, they should see an overlap of their rough estimate with the satellite spectrum in the atmospheric window they identified. Since there are no absorption bands by Earth’s atmospheric gases in the window, the data measured by the satellite can be used to approximate Earth’s surface temperature. Students should compare the satellite curve to the reference blackbody curves on the figure. In the atmospheric window (about 10.3-12 microns wavelength), the satellite data follow a blackbody curve that represents emission by something about 286-288K (need to interpolate between the 300K and 280K reference curves).