Embed Size (px)
Citation preview

Absorption, Fluorescence, and Quantum Yield for Growth in Nitrogen-Limited DunaliellatertiolectaAuthor(s): Heidi M. Sosik and B. Greg MitchellSource: Limnology and Oceanography, Vol. 36, No. 5 (Jul., 1991), pp. 910-921Published by: American Society of Limnology and OceanographyStable URL: http://www.jstor.org/stable/2837588 .
Accessed: 16/06/2014 08:29
Your use of the JSTOR archive indicates your acceptance of the Terms & Conditions of Use, available at .http://www.jstor.org/page/info/about/policies/terms.jsp
.JSTOR is a not-for-profit service that helps scholars, researchers, and students discover, use, and build upon a wide range ofcontent in a trusted digital archive. We use information technology and tools to increase productivity and facilitate new formsof scholarship. For more information about JSTOR, please contact [email protected].
.
American Society of Limnology and Oceanography is collaborating with JSTOR to digitize, preserve andextend access to Limnology and Oceanography.
http://www.jstor.org
This content downloaded from 194.29.185.230 on Mon, 16 Jun 2014 08:29:42 AMAll use subject to JSTOR Terms and Conditions
Limnol Oceanogr, 36(5), 1991, 9 10-921 ? 1991, by the American Society of Limnology and Oceanography, Inc.
Absorption, fluorescence, and quantum yield for growth in nitrogen-limited Dunaliella tertiolecta
Heidi M. Sosik and B. Greg Mitchell Marine Research Division, 0218, Scripps Institution of Oceanography, UCSD, La Jolla, California 92093
Abstract
The effects of steady state nitrogen limitation on the optical properties of Dunaliella tertiolecta were investigated. Growth rate was varied in a continuous culture under constant irradiance and temperature with absorption, fluorescence, and cellular characteristics including pigment contents determined at each steady state. The cellular concentration of Chl a increased with growth rate while Chl-a-specific absorption and fluorescence both decreased. In addition, the quantum yield for growth varied by more than a factor of 3.5 over the growth conditions examined, with the highest yield in the most rapidly growing cells. The decrease in magnitude of Chl-a-specific optical properties is caused by pigment package effects and changes in the abundance of accessory pigments relative to Chl a. Changes in absorption and fluorescence properties are consistent with theoretical predictions for discrete packages. In addition, pigment-based reconstruction techniques overesti- mate the magnitude of both in vivo and unpackaged absorption by D. tertiolecta under these growth conditions. The observed variability in Chl-a-specific absorption and quantum yield is a funda- mental aspect of phytoplankton physiology that should be incorporated into models of oceanic primary production.
Optical measurements from in situ pro- filing instruments, moorings, aircraft, and satellites provide information at temporal and spatial scales not possible with tradi- tional biological oceanographic techniques. The potential for this information to en- hance understanding of primary productiv- ity in the ocean depends on models that relate optical properties to photosynthesis. Although bio-optical models for primary production and phytoplankton growth have been developed and are being evaluated (Bannister 1979; Kiefer and Mitchell 1983; Smith et al. 1989), an increased knowledge of the sources and magnitude of variability in the parameters of these models is critical for accurate assessment of modeling capa- bilities.
An important component of these models involves prediction of photosynthetic pro- duction or growth from light and chloro- phyll data. Variability in this relationship may be caused by changes in Chl a-specific
Acknowledgments This work was supported in part by ONR contract
N00014-89-J-1071 to B.G.M. and an NSF graduate fellowship to H.M.S.
We thank R. R. Bidigare for the HPLC analysis of pigments and J. Kitchen for providing technical spec- ifications on the spectral characteristics of the Sea Tech fluiorometer.
absorption or changes in the quantum yield of photosynthesis. The spectral Chl-specific absorption coefficient, aph*(X) (units given in list of notation), is an important param- eter of the models; it provides an estimate of the amount of light absorbed by phyto- plankton cells from knowledge of ambient irradiance and Chl a concentration. The photosynthetic quantum yield, Oph, is the efficiency with which the absorbed light is used for C fixation. Knowledge of the vari- ability in these physiological parameters with growth conditions is important in accurately applying bio-optical models to diverse oceanographic regions and condi- tions.
Modeling primary production over large scales also relies on estimates of pigment data from remote sensing. The accuracy of current algorithms for retrieving phyto- plankton pigment concentrations from op- tical data is limited by lack of knowledge concerning the variability in pigment-spe- cific light absorption. This variability in- cludes both changes in aph*(X) and changes in the relative importance of phytoplank- ton, detritus, and dissolved material as ab- sorbers in the water column (e.g. Morel 1988; Mitchell and Holm-Hansen 1991). Thus physiological variability in pigment-specific absorption can potentially be important in estimating the biomass of primary produc-
910
This content downloaded from 194.29.185.230 on Mon, 16 Jun 2014 08:29:42 AMAll use subject to JSTOR Terms and Conditions
Optics and nitrogen limitation 911
Notation
aph(X), aT(AX), Absorption coefficient for phyto- acm(X) plankton in vivo, after solubiliza-
tion in 0.5% Triton X-100, and for intracellular material, m-'
aph*(X), Chl a-specific absorption coefficient aTx*(X), for phytoplankton in vivo, after aSO(X), solubilization in 0.5% Triton acm*(X) X- 100, for a solution of cell mate-
rial, and for intracellular material, m2 (mg Chl a)-'
a,*(X) Specific absorption coefficient for pigment i, m2 (mg pigment i)-'
bb(X) Backscatter coefficient, m-' c Intracellular concentration of Chl a,
mg m-3 C, Concentration of pigment i in a cell
suspension, mg m-3 d Cell diameter, Am D(X), G Detection or geometric constant, di-
mensionless EO(X) Growth irradiance, mol quanta m-2
d-' nm-1 E(X) Fluorescence excitation irradiance,
mol quanta m-2 s-' nm-1 F Fluorescence from a single cell,
quanta s-' F Broadband fluorescence per cell, rel-
ative quanta s-' cell-' Broadband fluorescence per Chl a,
relative quanta s-' (mg Chl a)-' Qa(X) Absorption efficiency, dimensionless Qa*(X) Packaging parameter, dimensionless Xe, xf Wavelength of excitation light and
fluoresced light, nm Specific growth rate (base e), d-'
'Oph, 109 Quantum yield for photosynthesis and growth, mol C (mol quanta)-'
Of Quantum yield for fluorescence, mol quanta fluoresced (mol quanta ab- sorbed)-'
p' Optical thickness along the particle diameter, dimensionless
ers as well as the production realized by that biomass.
Chl a-specific absorption at the blue peak and kph have been shown to vary in labo- ratory cultures by at least fourfold and ten- fold, respectively. Differences in aPh*(X)
among species have been observed, and variability within species caused by changes in growth irradiance has been well docu- mented. This variability in aph*(X) is attrib- uted in part to pigment packaging effects that vary with cell size and pigment content per cell (Morel and Bricaud 1981; Mitchell and Kiefer 1988) as well as changes in the
abundance of accessory pigments relative to Chl a (Bricaud et al. 1983; Sathyendranath et al. 1987; Bemer et al. 1989). In addition to variability in aph*(X), there are differences in 1ph among species and as a function of growth irradiance for a single species (Kiefer and Mitchell 1983; Falkowski et al. 1985; Sakshaug et al. 1989).
Other factors besides light can lead to physiological adaptations that result in vari- ability in the optical properties of phyto- plankton cells. Chl a-specific absorption and quantum yield have been shown to be af- fected by N depletion in batch cultures (Welschmeyer and Lorenzen 1981; Cleve- land and Perry 1987). The physiological ef- fects of starvation may be quite different, however, from those observed under steady state nutrient limitation in continuous cul- ture. Although aph*(X) can vary under steady state N-limited growth, Kiefer and Mitchell (1983) hypothesized that there should be no effect on qph. Recent studies of phytoplank- ton in N-limited continuous culture have shown significant variability in both aph*(X)
and ph (Chalup and Laws 1990; Herzig and Falkowski 1989). Before the effects of phys- iological variability on bio-optical model- ing of primary production can be evaluated, a more complete characterization of this variability and its sources is necessary.
In vivo fluorescence is another optical property widely used to characterize pri- mary producers in the ocean. Measure- ments can be made rapidly over a range of scales. Accurate assessment of phytoplank- ton biomass is limited, however, by vari- ability in the relationship between in vivo fluorescence and other variables like Chl a concentration. Previous studies of labora- tory cultures have documented that for a single species fluorescence per Chl a varies with growth conditions such as light and nutrient availability (e.g. Kiefer 1973; Mitchell and Kiefer 1988; Sosik et al. 1989), but further investigations into the sources of this variability are necessary to reliably interpret fluorescence signals from natural samples.
In this work, we have examined the effects of steady state N03--limited growth on pig- mentation, absorption, and fluorescence in the marine chlorophyte Dunaliella terti-
This content downloaded from 194.29.185.230 on Mon, 16 Jun 2014 08:29:42 AMAll use subject to JSTOR Terms and Conditions
912 Sosik and Mitchell
olecta. The roles of pigment packaging and pigment composition in determining light utilization efficiency have been considered and the results placed in the context of theoretical work on absorption and fluores- cence by single cells.
Materials and methods Dunaliella tertiolecta Butcher (FCRG
culture collection) was maintained in NO3-- limited continuous culture at four dilution rates. The vessel was kept at 22?C; sterile GPM media (Loeblich 1975) at full strength except with 40 ,uM NO3- was used for di- lution, and the cultures were stirred contin- uously and bubbled with sterile, water-sat- urated air. Constant light was provided with "cool-white" fluorescent lamps at an irra- diance of 165 ,umol quanta m-2 s-I for all dilution rates. Light intensity was measured with a Biospherical Instruments QSL-100 quantum scalar irradiance meter. Absolute spectral irradiance was determined from these measurements and the relative spec- trum for "cool-white" lamps provided by General Electric. In each case, analysis was conducted when fluorescence of the cell sus- pension remained constant for at least 2 d and always after at least 10 d at a constant dilution rate. Specific growth rate ,u (base e) was determined as the dilution rate of the culture (flow rate divided by the culture vol- ume).
Subsamples of the cell suspensions were filtered onto Whatman GF/C glass-fiber fil- ters and stored immediately at - 70?C in cryotubes flushed with N2 gas. These sam- ples were later analyzed for pigments by re- verse-phase, high-performance liquid chro- matography (HPLC) following the methods described by Bidigare (1989). Additional samples were filtered onto previously com- busted GF/C filters and frozen in combust- ed Pyrex test tubes. After desiccation of these samples, carbon and nitrogen contents were measured with a Perkin Elmer P-E 2400 CHN elemental analyzer. Cell density and equivalent spherical cell volume were de- termined on a Coulter Electronics 64-chan- nel, model ZH electronic particle counter. After 15 min of dark incubation, fluores- cence of the cell suspension was measured on a Turner Designs model 10 fluorometer.
Bulk fluorescence was also measured with a Sea Tech in situ fluorometer after a di- lution of 1: 40 with filtered seawater.
Absorption properties were determined with a dual-grating Perkin Elmer lambda 6 UV/VIS spectrophotometer equipped with an integrating sphere. Conventional spec- troscopic techniques do not provide accu- rate measurements of absorption for parti- cles in suspension (Shibata 1958), but the integrating sphere allows collection of light scattered by particles in the forward direc- tion thus improving absorption estimates. Cell suspensions were concentrated about fivefold by centrifugation. In vivo spectral absorption, aph(X), was measured on the concentrated samples in a 1-cm cuvette. Fresh culture medium was used in the ref- erence beam. Backscattered light is not col- lected by the integrating sphere, so our es- timates are potentially greater than the true aph(X). Based on the results of Bricaud et al. (1983), however, we do not expect that the backscatter coefficient, bb(X), was ever > 1% of aph(X). Absorption was also measured on unconcentrated cell suspensions, but spec- tra were found to be noisy for optical den- sities <0.02. Comparison of the magnitude of peak absorption before and after concen- tration showed a linear increase with con- centration factor, which was calculated from cell densities determined with the Coulter counter.
In addition to determining in vivo ab- sorption, we treated a subsample of the con- centrated suspension with the detergent Tri- ton X- 100 at a final concentration of 0.5%, with subsequent sonication. This treatment disrupts the cells and thylakoid membranes, removing pigment package effects without extraction by organic solvents (Berner et al. 1989). Spectral absorption, aTX(X), was de- termined on these solubilized cells with 0.5% Triton X-100 in filtered seawater as a ref- erence. This treatment to remove package effects should not be considered a general one as we have worked with other species and found variable success with disruption. A further limitation of the Triton X method involves spectral shifts in the wavelengths of peak absorption when compared to in vivo absorption. We have observed shifts toward shorter wavelengths of 1 nm at the
This content downloaded from 194.29.185.230 on Mon, 16 Jun 2014 08:29:42 AMAll use subject to JSTOR Terms and Conditions
Optics and nitrogen limitation 913
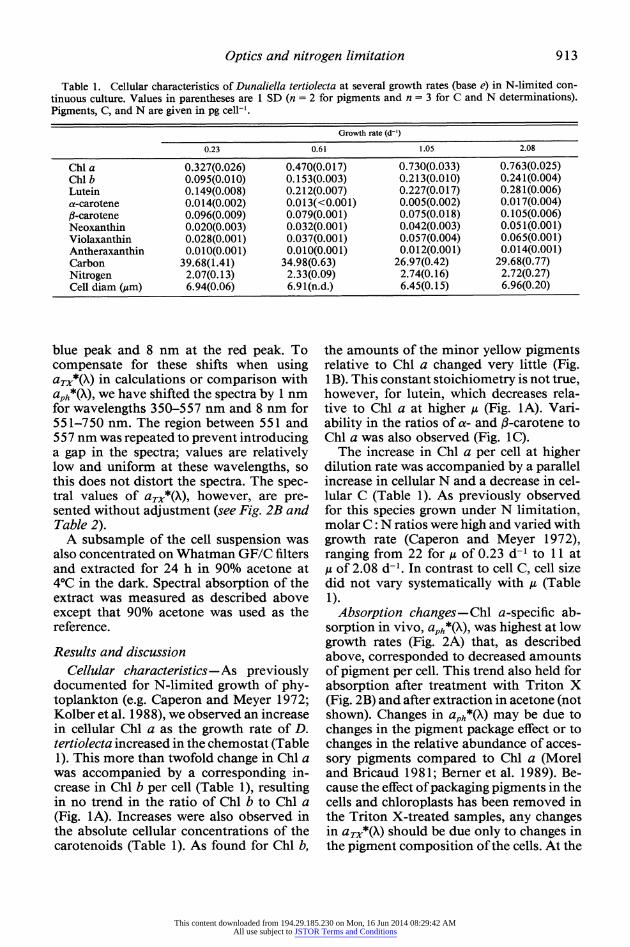
Table 1. Cellular characteristics of Dunaliella tertiolecta at several growth rates (base e) in N-limited con- tinuous culture. Values in parentheses are 1 SD (n = 2 for pigments and n = 3 for C and N determinations). Pigments, C, and N are given in pg cell-'.
Growth rate (d-')
0.23 0.61 1.05 2.08
Chl a 0.327(0.026) 0.470(0.017) 0.730(0.033) 0.763(0.025) Chl b 0.095(0.010) 0.153(0.003) 0.213(0.010) 0.241(0.004) Lutein 0.149(0.008) 0.212(0.007) 0.227(0.017) 0.281(0.006) a-carotene 0.014(0.002) 0.013(<0.001) 0.005(0.002) 0.017(0.004) 1-carotene 0.096(0.009) 0.079(0.001) 0.075(0.018) 0.105(0.006) Neoxanthin 0.020(0.003) 0.032(0.001) 0.042(0.003) 0.051(0.001) Violaxanthin 0.028(0.001) 0.037(0.001) 0.057(0.004) 0.065(0.001) Antheraxanthin 0.010(0.001) 0.010(0.001) 0.012(0.001) 0.014(0.001) Carbon 39.68(1.41) 34.98(0.63) 26.97(0.42) 29.68(0.77) Nitrogen 2.07(0.13) 2.33(0.09) 2.74(0.16) 2.72(0.27) Cell diam (jum) 6.94(0.06) 6.91(n.d.) 6.45(0.15) 6.96(0.20)
blue peak and 8 nm at the red peak. To compensate for these shifts when using aTX*(X) in calculations or comparison with aph*(X), we have shifted the spectra by 1 nm for wavelengths 350-557 nm and 8 nm for 55 1-750 nm. The region between 551 and 557 nm was repeated to prevent introducing a gap in the spectra; values are relatively low and uniform at these wavelengths, so this does not distort the spectra. The spec- tral values of aTX*(X), however, are pre- sented without adjustment (see Fig. 2B and Table 2).
A subsample of the cell suspension was also concentrated on Whatman GF/C filters and extracted for 24 h in 90% acetone at 4?C in the dark. Spectral absorption of the extract was measured as described above except that 90% acetone was used as the reference.
Results and discussion Cellular characteristics-As previously
documented for N-limited growth of phy- toplankton (e.g. Caperon and Meyer 1972; Kolber et al. 19 8 8), we observed an increase in cellular Chl a as the growth rate of D. tertiolecta increased in the chemostat (Table 1). This more than twofold change in Chl a was accompanied by a corresponding in- crease in Chl b per cell (Table 1), resulting in no trend in the ratio of Chl b to Chl a (Fig. 1A). Increases were also observed in the absolute cellular concentrations of the carotenoids (Table 1). As found for Chl b,
the amounts of the minor yellow pigments relative to Chl a changed very little (Fig. 1 B). This constant stoichiometry is not true, however, for lutein, which decreases rela- tive to Chl a at higher ,u (Fig. 1A). Vari- ability in the ratios of a- and (3-carotene to Chl a was also observed (Fig. 1C).
The increase in Chl a per cell at higher dilution rate was accompanied by a parallel increase in cellular N and a decrease in cel- lular C (Table 1). As previously observed for this species grown under N limitation, molar C: N ratios were high and varied with growth rate (Caperon and Meyer 1972), ranging from 22 for ,u of 0.23 d-l to 11 at ,u of 2.08 d-1. In contrast to cell C, cell size did not vary systematically with ,u (Table 1). Absorption changes-Chl a-specific ab-
sorption in vivo, aph*(X), was highest at low growth rates (Fig. 2A) that, as described above, corresponded to decreased amounts of pigment per cell. This trend also held for absorption after treatment with Triton X (Fig. 2B) and after extraction in acetone (not shown). Changes in aph*(X) may be due to changes in the pigment package effect or to changes in the relative abundance of acces- sory pigments compared to Chl a (Morel and Bricaud 1981; Berner et al. 1989). Be- cause the effect of packaging pigments in the cells and chloroplasts has been removed in the Triton X-treated samples, any changes in aTX*(X) should be due only to changes in the pigment composition of the cells. At the
This content downloaded from 194.29.185.230 on Mon, 16 Jun 2014 08:29:42 AMAll use subject to JSTOR Terms and Conditions
914 Sosik and Mitchell
0.5
A Lutein: Chl a
\ Chl b: Chl a
0.4-
0.3
0.10
~~~~~~~B
L0.08- B
o 0.06
* Violexanthin: Chl a .p 0.04 *Neoxanthirn: Chl a
A, Antherxanthin : Cl a
bO 0.02- A
0.00- 1 ' I
0.41 C'
* , -carotene : Chl a 0.3- * a-carotene: Chl a
0.21
0.1 -j
0.0 0.5 1.0 1.6 2.0 2.5 Growth rate (d-)
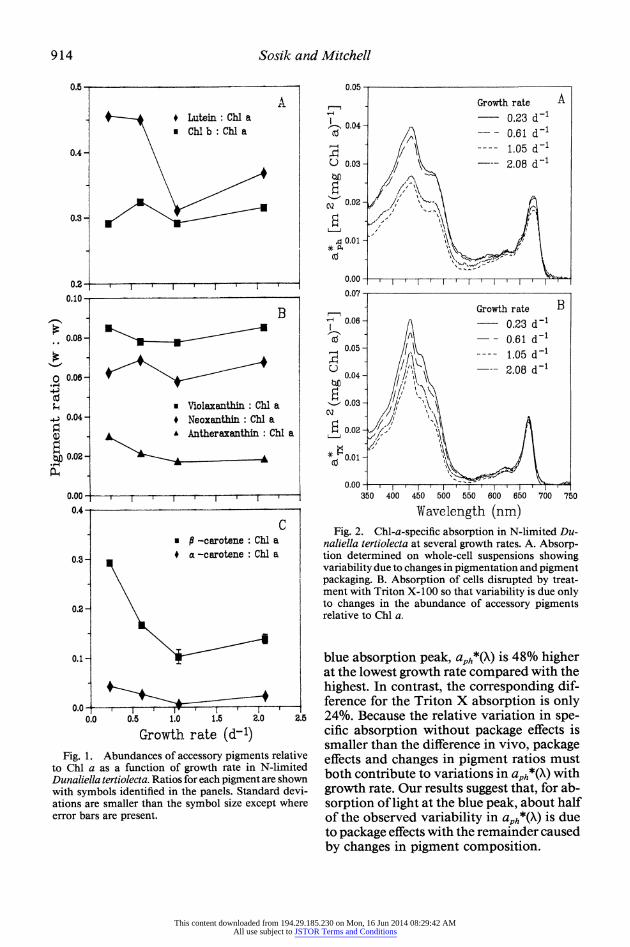
Fig. 1. Abundances of accessory pigments relative to Chli a as a function of growth rate in N-limited Dunaliella tertiolecta. Ratios for each pigrnent are shown with symbols identified in the panels. Standard devi- ations are smaller than the symbol size except where error bars are present.
0.05 -
,_ Growth rate A 0.23 d1
co 0.04- S\-- 0.61 d-1 ---- 1.05 d-1
0 0.03 / \ 2.08 d
\ 0.02 /102
,q0.01 -,
co.o 0.00 -
0.07 -
Growth rate B 0.06- 0.23 d-1
co / l- 0.61 d1 ~0.05
- --1.05 d-1
0 ~~~~~~~2.08d'1 0.04 -
0 0Q > 0o.02 /1-'~
0.00 -
350 400 450 500 550 600 650 700 750
Wavelength (nm) Fig. 2. Chl-a-specific absorption in N-limited Du-
naliella tertiolecta at several growth rates. A. Absorp- tion determined on whole-cell suspensions showing variability due to changes in pigmentation and pigment packaging. B. Absorption of cells disrupted by treat- ment with Triton X- 100 so that variability is due only to changes in the abundance of accessory pigments relative to Chl a.
blue absorption peak, aph*(X) is 48% higher at the lowest growth rate compared with the highest. In contrast, the corresponding dif- ference for the Triton X absorption is only 24%. Because the relative variation in spe- cific absorption without package effects is smaller than the difference in vivo, package effects and changes in pigment ratios must both contribute to variations in aph*(X) with growth rate. Our results suggest that, for ab- sorption of light at the blue peak, about half of the observed variability in aph*(X) is due to package effects with the remainder caused by changes in pigment composition.
This content downloaded from 194.29.185.230 on Mon, 16 Jun 2014 08:29:42 AMAll use subject to JSTOR Terms and Conditions
Optics and nitrogen limitation 915
Changes in pigment composition are ex- pected to affect specific absorption at the blue Chl a peak because absorption spectra for accessory pigments overlap the Chl a spectrum in this region. Examination of the pigment ratio data (Fig. 1) shows that re- sponse of the various accessory pigments to increased N limitation differs. It is apparent that the most important changes leading to increased aTx*(X) at low A are in lutein and d-carotene relative to Chl a. Although the other pigments remain in fairly constant proportions to Chl a or are present at rel- atively low levels, lutein and 3-carotene ra- tios are higher particularly at the two lowest ,. These growth rates also correspond to the highest aTX*(X) (Fig. 2B). In addition, at a ,4 of 1.05 d-l the ratios are the lowest and aTX*(X) is also lowest.
Although changes in pigment composi- tion play a significant role in determining in vivo absorptive properties, as the com- parison of absorption for whole cells and solubilized cells indicates, the packaging of pigments into discrete particles is also im- portant. A theoretical framework for un- derstanding this package effect has been de- veloped (Duysens 1956; Morel and Bricaud 1981), and its applicability for describing changes in absorption properties of light- limited algal cultures has been verified (Sathyendranath et al. 1987; Bricaud et al. 1988). Variability in aph*(X) observed for nutrient-limited growth has not previously been interpreted with respect to the model of pigment packaging. In addition, an im- portant parameter of the model, absorption by intracellular matter, acm(X), has re- mained largely uncharacterized. It is pos- sible to estimate the magnitude and vari- ability in acm(X) from Triton X absorption measurements and cellular pigment con- centrations.
Theoretical work on absorption by dis- crete particles allows absorption efficiency as a function of wavelength, Qa(X), to be predicted based on cell size and acm(X) (Morel and Bricaud 1981). The product of aTX*(X) and the intracellular concentration of Chl a (c) is an estimate of acm(X),
acm(X) = aTx*(X) c. (1)
Whereas Morel and Bricaud (1981) as-
sumed a constant value of acm (= 2 x 10⁵
m-1) at the blue peak for calculation of Qa, we found that values varied from 1. 1 to 2.3 X 10⁵ m-1 mainly due to changes in c. At the red absorption peak, values were as low as 0.4 x 10⁵ m-1 due to the decreased Chl a-specific absorption at red wavelengths compared to blue and the lack of absorption by accessory pigments at red wavelengths.
Morel and Bricaud (1981) have described absorption efficiency as a theoretical func- tion of the dimensionless parameter, p'(X). This parameter represents the optical thick- ness of a particle along its diameter and is defined as
p'(X) = acm(X) d (2)
where d is the particle diameter. The ab- sporption efficiency, Qa(X), is the fraction of the photons incident on the geometric cross- section of the cell that is absorbed by the cell. From the absorption coefficient for phytoplankton in a suspension aph(X), Qa(X) can be calculated as
Qa(=aph (X) V 3 Qa(A)-(ird2/4) N- (3)
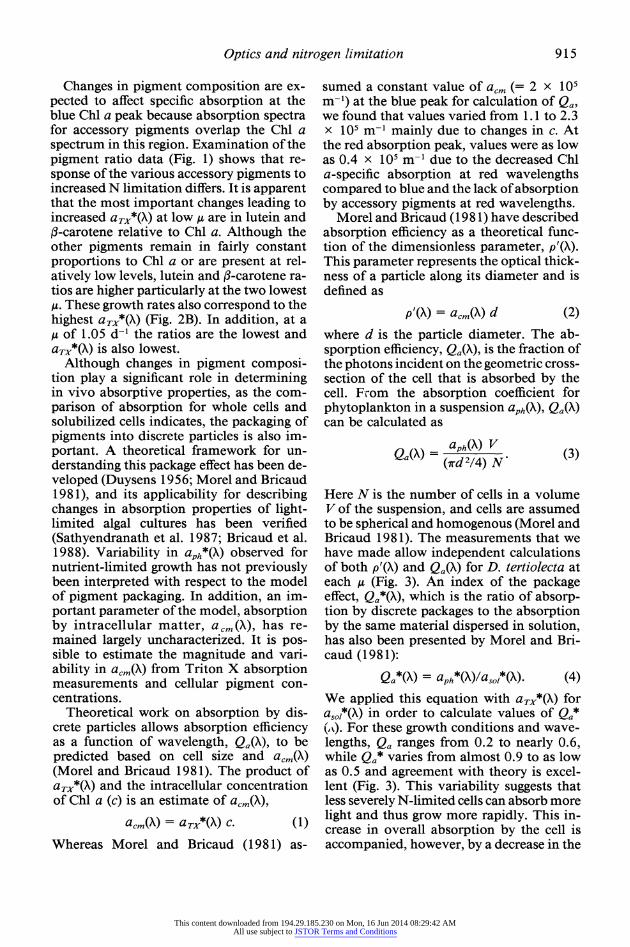
Here N is the number of cells in a volume V of the suspension, and cells are assumed to be spherical and homogenous (Morel and Bricaud 1981). The measurements that we have made allow independent calculations of both p'(X) and Qa(X) for D. tertiolecta at each ,i (Fig. 3). An index of the package effect, Qa*(X), which is the ratio of absorp- tion by discrete packages to the absorption by the same material dispersed in solution, has also been presented by Morel and Bri- caud (1981):
Qa*(X) = aph*(X)/aSol*(X). (4)
We applied this equation with aTx*(X) for as0i*(X) in order to calculate values of Qa* (0). For these growth conditions and wave- lengths, Qa ranges from 0.2 to nearly 0.6, while Qa* varies from almost 0.9 to as low as 0.5 and agreement with theory is excel- lent (Fig. 3). This variability suggests that less severely N-limited cells can absorb more light and thus grow more rapidly. This in- crease in overall absorption by the cell is accompanied, however, by a decrease in the
This content downloaded from 194.29.185.230 on Mon, 16 Jun 2014 08:29:42 AMAll use subject to JSTOR Terms and Conditions
916 Sosik and Mitchell
1.0
Qa
0.8
06 A, Q. (436) CZ 0.6- ;\ + Q* (436)
O Qa (676) a' 0.4 - * Q* (676)
0.2-
0.0- 0 2 4 6 8 10
p' = acm d
Fig. 3. In vivo absorption efficiency (Qa) and the packaging parameter (Qa*) at the red and blue absorp- tion peaks as a function of cellular optical thickness (p') for each of the growth conditions examined. Qa. Qa* and p' are estimated from measurements with Eq. 1-4 as described in the text; the theoretical relation- ships of Morel and Bricaud ( 1981) are shown for com- parison (solid lines).
efficiency with which each molecule of pig- ment absorbs.
Pigment reconstruction of absorption- Because of the need for accurate estimates of aph*(X) in bio-optical models, a great deal of effort is currently being focused on the determination of this parameter for natural samples. Because other absorbing particles are present in these samples, direct mea- surements of particulate absorption are not sufficient to specify aph*(X). This problem has led to the development of alternative methods for deriving aph*(X), including re- construction of aph*(X) from HPLC data on individual pigment abundances (Bidigare et al. 1987). By summing the contributions of each of the individual pigments, aph*(X) can be estimated:
aph*(X) = ai*(X) C,/Chl a. (5)
Here a*(AX) is the specific absorption coef- ficient of pigment i at wavelength X, C, the concentration of pigment i in the suspen- sion, and Chl a the concentration of Chl a in the suspension.
We have made this calculation for each of the growth conditions studied using the spectral specific absorption coefficients for Chl a, Chl b, and photoprotective carot- enoids from Bidigare et al. (1990). Because these coefficients are derived from absorp-
0.07 Pigment reconstruction
--Triton X Cd 0.06- Theoretical solution
In vivo ' 0.04 / -
0031 =
0.00-
400 450 500 550 600 650 700 750
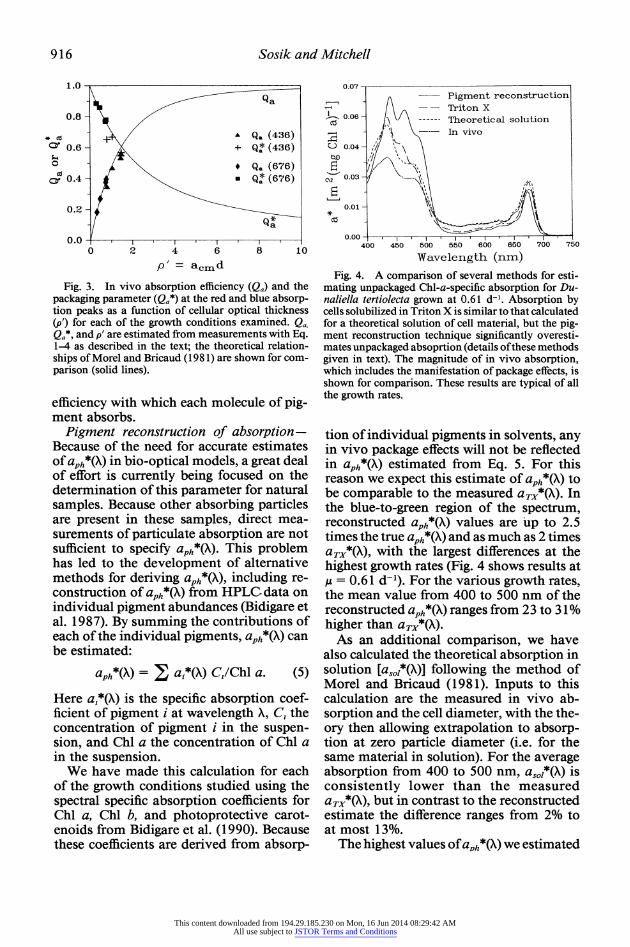
Wavelength (nm) Fig. 4. A comparison of several methods for esti-
mating unpackaged Chl-a-specific absorption for Du- naliella tertiolecta grown at 0.61 d-1. Absorption by cells solubilized in Triton X is similar to that calculated for a theoretical solution of cell material, but the pig- ment reconstruction technique significantly overesti- mates unpackaged absoprtion (details ofthese methods given in text). The magnitude of in vivo absorption, which includes the manifestation of package effects, is shown for comparison. These results are typical of all the growth rates.
tion of individual pigments in solvents, any in vivo package effects will not be reflected in aPh*(X) estimated from Eq. 5. For this reason we expect this estimate of aph*(X) to be comparable to the measured aTx*(X). In the blue-to-green region of the spectrum, reconstructed aph*(X) values are up to 2.5 times the true aph*(X) and as much as 2 times aTX*(X), with the largest differences at the highest growth rates (Fig. 4 shows results at ,u = 0.61 d-'). For the various growth rates, the mean value from 400 to 500 nm of the reconstructed aph*(X) ranges from 23 to 31% higher than aTX*(X).
As an additional comparison, we have also calculated the theoretical absorption in solution [asoi*(X)] following the method of Morel and Bricaud (1981). Inputs to this calculation are the measured in vivo ab- sorption and the cell diameter, with the the- ory then allowing extrapolation to absorp- tion at zero particle diameter (i.e. for the same material in solution). For the average absorption from 400 to 500 nm, as0i*(X) is consistently lower than the measured aTX*(X), but in contrast to the reconstructed estimate the difference ranges from 2% to at most 13%.
The highest values of ah*(X) we estimated
This content downloaded from 194.29.185.230 on Mon, 16 Jun 2014 08:29:42 AMAll use subject to JSTOR Terms and Conditions
Optics and nitrogen limitation 917
with the pigment reconstruction technique correspond to values of Qa(X) that are higher than the theoretical maximum of 1. Un- doubtedly package effects must be included before this method can provide realistic es- timates. The reason for the discrepancy be- tween aTX*(X) and the estimate of aPh*(X) from pigment reconstruction, however, re- mains elusive. The overestimate seems to be due mainly to the contribution of lutein, although the other carotenoids also play a role. It is possible that the magnitude of absorption by these carotenoids in vivo is significantly different than in organic sol- vents due to more than package effects. Re- cent application of the pigment reconstruc- tion technique in a dinoflagellate includes a correction for package effects (Nelson and Prezelin 1990), but our observations suggest that even this modification would not give accurate results for D. tertiolecta. We spec- ulate that the molar extinction coefficient for some of these pigments in organic sol- vents is greater than the corresponding co- efficient for the same pigment in theoretical aqueous solution. Whether this type of problem exists for other taxa with different pigmentation must be tested with further study of laboratory cultures.
Fluorescence changes-Fluorescence from a single cell has been described by a theo- retical model that incorporates the role of pigment packaging in modifying light ab- sorption efficiency and intracellular reab- sorption of fluorescence (Collins et al. 1985; Mitchell and Kiefer 1988). This model can be applied to conditions of broadband ex- citation and emission and can be modified to estimate the relative fluorescence mea- sured by a specific detector, thus allowing the model to be evaluated with our data set. Collins et al. (1985) presented a functional form for fluorescence emission from a cell which is generalized here to reflect the ef- fects of both excitation and emission wave- lengths:
F(Xe, Xf) = Of (Xe, Xf) E(Xe) Qa(Xe)
* (7d2/4) Qa*(Af). (6)
Here of is the quantum yield for fluores- cence, E is the incident irradiance, and Xe and Xf are the excitation and emission
wavelengths. This generalized equation should be applicable in cases where multiple chromaphores with different quantum yields such as chlorophyll and phycoerythrin may be contributing to the fluoresced light and is valid for both excitation and emission spectra. It is also possible to express fluo- rescence in terms of aph*(Xe), aph*(Xf), and acm(Xf) if the available information is not sufficient to determine absorption efficien- cies (Mitchell and Kiefer 1988).
For spectrally specified excitation irra- diance and absorption properties, Qa(X) and Qa*(X), Eq. 6 can be integrated over the ranges of Xe and Xf to give the total flux of fluoresced quanta in a broad emission band as a result of polychromatic excitation. In order to calculate the flourescence from a single cell measured by a specific instru- ment, it is necessary to scale the total flux to include the detection characteristics D(Xf) and the geometric constant G that indicates the fraction of the emitted light intercepted by the detector. The resulting expression is
F=G iieD(Xf) F(Xe, Xf) dAe dAf (7) Af Ae
where F is the fluorescence from a single cell for broadband excitation and emission, and F(Xe, Xf) is as defined in Eq. 6 with E(Xe) the product of the spectral irradiance emit- ted by the excitation source and the trans- mission properties of any filters or optical components between the source and the sample. Similarly, the detection function D(Xf) is the product of the transmission of any emission filters or optical components and the response of the detector at each wavelength Xf. This fluorescence can also be expressed per unit of Chl as F* which is simply F divided by the cellular concentra- tion of Chl a.
Consistent with the foregoing theory, variability with growth rate documented for specific absorption is also evident in the flu- orescence data. Despite differences in spec- tral characteristics, results for the Sea Tech fluorometer (Table 2) and trends observed with the Turner Designs fluorometer were similar. For comparison of trends, all flu- orescence data have been expressed in rel-
This content downloaded from 194.29.185.230 on Mon, 16 Jun 2014 08:29:42 AMAll use subject to JSTOR Terms and Conditions
918 Sosik and Mitchell
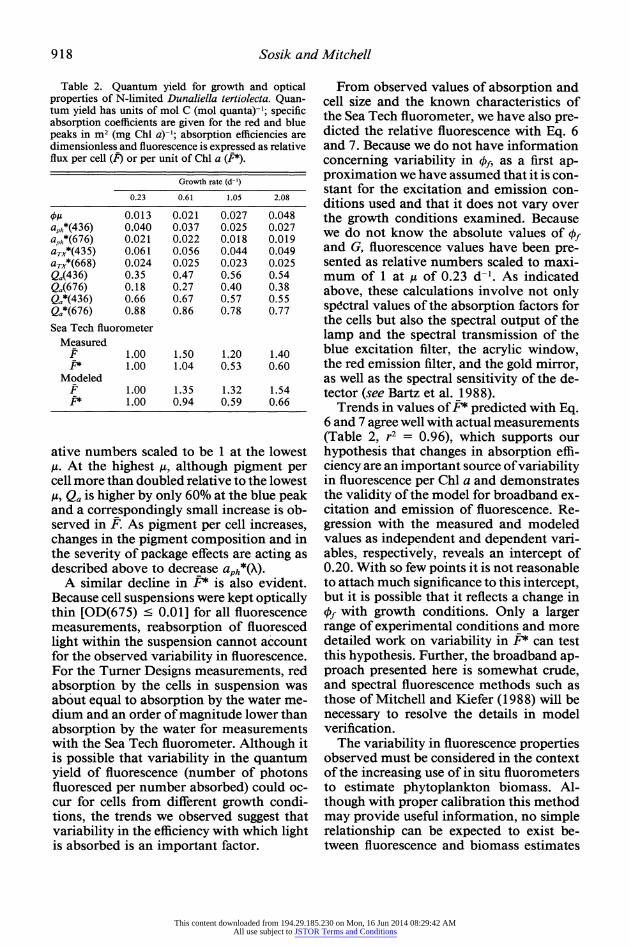
Table 2. Quantum yield for growth and optical properties of N-limited Dunaliella tertiolecta. Quan- tum yield has units of mol C (mol quanta)-'; specific absorption coefficients are given for the red and blue peaks in m2 (mg Chl a)-'; absorption efficiencies are dimensionless and fluorescence is expressed as relative flux per cell (F) or per unit of Chl a (FP).
Growth rate (d-')
0.23 0.61 1.05 2.08
OA 0.013 0.021 0.027 0.048 aph*(436) 0.040 0.037 0.025 0.027 aph*(676) 0.021 0.022 0.018 0.019 aTX*(435) 0.061 0.056 0.044 0.049 aTX*(668) 0.024 0.025 0.023 0.025 Qa(436) 0.35 0.47 0.56 0.54 Qa(676) 0.18 0.27 0.40 0.38 Qa*(436) 0.66 0.67 0.57 0.55 Qa*(676) 0.88 0.86 0.78 0.77 Sea Tech fluorometer
Measured F 1.00 1.50 1.20 1.40 F* 1.00 1.04 0.53 0.60
Modeled F 1.00 1.35 1.32 1.54 F* 1.00 0.94 0.59 0.66
ative numbers scaled to be 1 at the lowest ,u. At the highest ,u, although pigment per cell more than doubled relative to the lowest /,g Qa is higher by only 60% at the blue peak and a correspondingly small increase is ob- served in F. As pigment per cell increases, changes in the pigment composition and in the severity of package effects are acting as described above to decrease aph*(X).
A similar decline in PF is also evident. Because cell suspensions were kept optically thin [OD(675) ' 0.01] for all fluorescence measurements, reabsorption of fluoresced light within the suspension cannot account for the observed variability in fluorescence. For the Turner Designs measurements, red absorption by the cells in suspension was about equal to absorption by the water me- dium and an order of magnitude lower than absorption by the water for measurements with the Sea Tech fluorometer. Although it is possible that variability in the quantum yield of fluorescence (number of photons fluoresced per number absorbed) could oc- cur for cells from different growth condi- tions, the trends we observed suggest that variability in the efficiency with which light is absorbed is an important factor.
From observed values of absorption and cell size and the known characteristics of the Sea Tech fluorometer, we have also pre- dicted the relative fluorescence with Eq. 6 and 7. Because we do not have information concerning variability in f, as a first ap- proximation we have assumed that it is con- stant for the excitation and emission con- ditions used and that it does not vary over the growth conditions examined. Because we do not know the absolute values of of and G, fluorescence values have been pre- sented as relative numbers scaled to maxi- mum of 1 at ,u of 0.23 d-1. As indicated above, these calculations involve not only spectral values of the absorption factors for the cells but also the spectral output of the lamp and the spectral transmission of the blue excitation filter, the acrylic window, the red emission filter, and the gold mirror, as well as the spectral sensitivity of the de- tector (see Bartz et al. 1988).
Trends in values of F* predicted with Eq. 6 and 7 agree well with actual measurements (Table 2, r2 = 0.96), which supports our hypothesis that changes in absorption effi- ciency are an important source of variability in fluorescence per Chl a and demonstrates the validity of the model for broadband ex- citation and emission of fluorescence. Re- gression with the measured and modeled values as independent and dependent vari- ables, respectively, reveals an intercept of 0.20. With so few points it is not reasonable to attach much significance to this intercept, but it is possible that it reflects a change in of with growth conditions. Only a larger range of experimental conditions and more detailed work on variability in F* can test this hypothesis. Further, the broadband ap- proach presented here is somewhat crude, and spectral fluorescence methods such as those of Mitchell and Kiefer (1988) will be necessary to resolve the details in model verification.
The variability in fluorescence properties observed must be considered in the context of the increasing use of in situ fluorometers to estimate phytoplankton biomass. Al- though with proper calibration this method may provide useful information, no simple relationship can be expected to exist be- tween fluorescence and biomass estimates
This content downloaded from 194.29.185.230 on Mon, 16 Jun 2014 08:29:42 AMAll use subject to JSTOR Terms and Conditions
Optics and nitrogen limitation 919
such as Chl a concentration. Both variabil- ity with growth conditions for a single spe- cies and the potential for interspecific dif- ferences must be considered. In addition, the lack of knowledge concerning variability in the quantum yield for fluorescence con- tinues to limit applications such as the use of natural fluorescence to estimate produc- tivity.
Quantum yieldfor growth -The quantum yield at the irradiance under which cells have been grown, O, can be determined from a spectral version of the model of Kiefer and Mitchell (1983):
A = O Chl: C f aph*(X) Eo(X) dX. (8)
Here ,u is the specific growth rate of the cells, EO(X) is the spectral growth irradiance, and Chl: C is the cellular Chl a: C ratio. Solving this equation for O at each of the growth rates examined results in nearly fourfold variability in O, with values decreasing as N limitation increases (Table 2).
A potential source of variability in O or Oph is changes in aph*(X) due to pigment- ratio shifts. If the abundance of photopro- tective pigments increases relative to photo- synthetic pigments, aph*(X) is expected to increase but the energy available for C fix- ation would decrease. The result is a de- crease in O with higher aph*(X), consistent with our observations of increased abun- dance of lutein and 3-carotene relative to Chl a at low ,u. This increase in aph*(X) can only account for -25% of the change we oberved in OA, however, because O varied by more than threefold and pigment-ratio- induced changes in aph*(X) were much smaller (see Table 2).
Many factors besides aph*(X) may con- tribute to a decrease in O, including changes in respiration relative to photosynthesis with growth rate. Although we have not mea- sured respiration in this study, it is unlikely that increased respiration relative to growth could account for all of the decrease in O observed at low ,. For N-limited growth of Pavlova lutheri, Chalup and Laws (1990) found a more than twofold increase in kph
with ,u and also demonstrated an increase in Oph with decreased irradiance at the same dilution rate. For N limitation of Isochrysis
galbana at a single irradiance, Herzig and Falkowski (1989) observed a range in + similar to our observations and additionally found that variability in ph was 85% of that for 0,
Additional sources of variability in quan- tum yield were not investigated in this study. Changes in energy transfer efficiency, in the reaction center turnover time, or in the abundance of pigment in photosystem 1 rel- ative to photosystem 2 could all contribute to changes in 0. Although Cleveland and Perry (1987) have implicated these mech- anisms to explain quantum yield changes in transition from nutrient-replete to nutrient- starved conditions, results may differ for cultures allowed to adapt to a steady state N-limited growth condition. Using pump and probe fluorescence techniques and im- munochemistry, Kolber et al. (1988) sug- gested that N limitation in several species, including D. tertiolecta, leads to a decrease in the energy conversion efficiency of photo- system 2 caused by a loss of functional re- action centers or inefficient energy transfer to the reaction centers.
All of these results suggest that studies considering photosynthetic efficiency as in- dependent of nutrient availability must be viewed with caution. Kiefer and Mitchell (1983) hypothesized that ph is a function only of irradiance, consistent with their model for growth of Thalassiosirafluviatilis in which spectrally averaged aPh* was as- sumed to be constant. Sakshaug et al. (1989) used a similar fitting technique to model growth rate under a large number of light- and nutrient-limited conditions and found a constant value of the product aph* * ph to be adequate for a given irradiance. The con- clusion that ph iS only a function of growth irradiance alone and not of nutrient limi- tation, however, has not been substantiated by studies in which light absorption and photosynthetic efficiency have been mea- sured (e.g. this study; Kolber et al. 1988; Herzig and Falkowski 1989).
Conclusion It is evident that variability in the phys-
iological responses of phytoplankton to growth conditions cannot be ignored in bio- optical characterization of ocean waters both
This content downloaded from 194.29.185.230 on Mon, 16 Jun 2014 08:29:42 AMAll use subject to JSTOR Terms and Conditions
920 Sosik and Mitchell
with respect to productivity and optical properties. Models for the remote estima- tion of pigments or for propagation of light through the water column rely on accurate knowledge of the relationships between pig- ments and in situ optical properties. For example, recent work suggests that predic- tions with current algorithms for pigment estimation may lead to significant errors for the Antarctic Ocean (Mitchell and Holm- Hansen 1991). These errors result from variability in aph*(X) and in the relative abundance of phytoplankton and other ab- sorbing material in the water column. Es- timating photosynthetic biomass from in situ fluorescence measurements is equally complex and can be significantly affected by the physiological state of the phytoplank- ton.
Bio-optical models of phytoplankton growth and productivity must also incor- porate physiological variability if light ab- sorption is to be accurately related to C fix- ation. Working with a model similar to that of Kiefer and Mitchell (1983), Sakshaug et al. (1989) found that, compared to other model parameters, changes in the value of aph* caused relatively large errors in mod- eled growth rate. Increasing evidence of large variability in the optical properties of phy- toplankton with growth conditions suggests that modification of existing models to in- corporate physiology and environmental conditions besides light intensity must be a high priority. A major obstacle to the achievement of this goal continues to be a lack of comprehensive physiological studies that include simultaneous measurement of pigments and optical properties for a wide range of species and growth conditions.
References BANNISTER, T. T. 1979. Quantitative description of
steady state, nutrient-saturated algal growth, in- cluding adaptation. Limnol. Oceanogr. 24: 76-96.
BARTZ, R., R. W. SPiNRAD, AND J. C. KITCHEN. 1988. A low power, high resolution, in situ fluorometer for profiling and moored applications in water, p. 157-170. In Ocean Optics 9, Proc. SPIE 925.
BERNER, T., K. WyMAN, AND P. G. FALKOWSKI. 1989. Photoadaptation and the package effect in Duna- liella tertiolecta (Chlorophyceae). J. Phycol. 25: 70-78.
BIDIGARE, R. R. 1989. Photosynthetic pigment com- position of the brown tide alga: Unique chloro-
phyll and carotenoid derivatives, p. 57-75. In E. M. Cosper et al. [eds.], Coastal and estuarine stud- ies. Springer.
, M. E. ONDRUSEK, J. H. MoRRow, AND D. KIE- FER. 1990. In vivo absorption properties of algal pigments, p. 290-302. In Ocean Optics 10, Proc. SPIE 1302.
, R. C. SMITH, K. S. BAKER, AND J. MARRA. 1987. Oceanic primary production estimates from measurements of spectral irradiance and pigment concentrations. Global Biogeochem. Cycles 1: 171- 186.
BRICAUD, A., A. L. BEDHOMME, AND A. MOREL. 1988. Optical properties of diverse phytoplanktonic spe- cies: Experimental results and theoretical inter- pretation. J. Plankton Res. 10: 851-873.
, A. MOREL, AND L. PRIEUR. 1983. Optical efficiency factors of some phytoplankters. Limnol. Oceanogr. 28: 816-832.
CAPERON, J., AND J. MEYER. 1972. Nitrogen-limited growth of marine phytoplankton- 1. Changes in population characteristics with steady-state growth rate. Deep-Sea Res. 19: 601-618.
CHALup, M. S., AND E. A. LAWS. 1990. A test of the assumptions and predictions of recent microalgal growth models with the marine phytoplankter Pavlova lutheri. Limnol. Oceanogr. 35: 583-596.
CLEVELAND, J. S., AND M. J. PERRY. 1987. Quantum yield, relative specific absorption and fluorescence in nitrogen-limited Chaetoceros gracilis. Mar. Biol. 94: 489-497.
COLLINS, D. J., D. A. KIEFER, J. B. SooHoo, AND I. S. McDERMID. 1985. The role of reabsorption in the spectral distribution of phytoplankton fluo- rescence emission. Deep-Sea Res. 32: 983-1003.
DUYSENS, L. N. M. 1956. The flattening of the ab- sorption spectrum of suspensions, as compared to that of solutions. Biochim. Biophys. Acta 19: 1- 12.
FALKOWSKI, P. G., Z. DUBINSKY, AND K. WYMAN. 1985. Growth-irradiance relationships in phytoplank- ton. Limnol. Oceanogr. 30: 311-321.
HERZIG, R., AND P. G. FALKOWSKI. 1989. Nitrogen limitation in Isochrysis galbana (Haptophyceae). 1. Photosynthetic energy conversion and growth efficiency. J. Phycol. 25: 462-471.
KIEFER, D. A. 1973. Chlorophyll a fluorescence in marine centric diatoms: Responses of chloroplasts to light and nutrient stress. Mar. Biol. 23: 39-46.
, AND B. G. MITCHELL. 1983. A simple steady state description of phytoplankton growth based on absorption cross section and quantum efficien- cy. Limnol. Oceanogr. 28: 770-776.
KOLBER, Z., J. ZEHR, AND P. G. FALKOWSKI. 1988. Effects of growth irradiance and nitrogen limita- tion on photosynthetic energy conversion in pho- tosystem 2. Plant Physiol. 88: 923-929.
LOEBLICH, A. R., III. 1975. A seawater medium for dinoflagellates and the nutrition of Cachonina niei. J. Phycol. 11: 80-86.
MITCHELL, B. G., AND 0. HoLM-HANsEN. 1991. Bio- optical properties of Antarctic waters: Differenti- ation from temperate ocean models. Deep-Sea Res. 38: 1009-1028.
, AND D. A. KIEFER. 1988. Chlorophyll a spe-
This content downloaded from 194.29.185.230 on Mon, 16 Jun 2014 08:29:42 AMAll use subject to JSTOR Terms and Conditions
Optics and nitrogen limitation 921
cific absorption and fluorescence excitation spec- tra for light-limited phytoplankton. Deep-Sea Res. 35: 639-663.
MOREL, A. 1988. Optical modeling ofthe upper ocean in relation to its biogenous matter content (case 1 waters). J. Geophys. Res. 93: 10,749-10,768.
, AND A. BRICAUD. 1981. Theoretical results concerning light absorption in a discrete medium, and applications to specific absorption of phyto- plankton. Deep-Sea Res. 28: 1375-1393.
NELSON, N. B., AND B. B. PREZELIN. 1990. Chromatic light effects and physiological modeling of absorp- tion properties of Heterocapsa pygmaea (= Glen- odimium sp.). Mar. Ecol. Prog. Ser. 63: 37-46.
SAKSHAUG, E., K. ANDRESEN, AND D. A. KIEFER. 1989. A steady state description of growth and light ab- sorption in the marine planktonic diatom Skele- tonema costatum. Limnol. Oceanogr. 34: 198-205.
SATHYENDRANATH, S., L. LAZZARA, AND L. PRIEUR. 1987. Variations in the spectral values of specific absorption of phytoplankton. Limnol. Oceanogr. 32: 403-415.
SHIBATA, K. 1958. Spectroscopy of intact biological materials. Absolute and relative measurements of their transmission, reflection and absorption spec- tra. J. Biochem. 45: 599-623.
SMITH, R. C., B. B. PREZELIN, R. R. BIDIGARE, AND K. S. BAKER. 1989. Bio-optical modeling of pho- tosynthetic production in coastal waters. Limnol. Oceanogr. 34: 1524-1544.
SOSIK, H. M., S. W. CHISHOLM, AND R. J. OLSON. 1989. Chlorophyll fluorescence from single cells: Inter- pretation of flow cytometric signals. Limnol. Oceanogr. 34: 1749-1761.
WELSCHMEYER, N. A., AND C. J. LORENZEN. 1981. Chlorophyll-specific photosynthesis and quantum efficiency at subsaturating light intensities. J. Phy- col. 17: 283-293.
Submitted: 12 September 1990 Accepted. 22 January 1991
Revised: 28 May 1991
This content downloaded from 194.29.185.230 on Mon, 16 Jun 2014 08:29:42 AMAll use subject to JSTOR Terms and Conditions


![omonas gracilis and Dunaliella sp.] in laboratory batch](https://img.pdfslide.us/doc/110x75/61bd177961276e740b0f4389/omonas-gracilis-and-dunaliella-sp-in-laboratory-batch-.jpg)