Embed Size (px)
Citation preview
ABSORPTION CHARACTERISTICS OF IMPACT
VIBRATION ABSORBERS
by
CAGLAROZERDIM, B.S.
A THESIS
IN
MECHANICAL ENGINEERING
Submitted to the Graduate Faculty
of Texas Tech University in Partial Fulfillment of the Requirements for
the Degree of
MASTER OF SCIENCE
IN
MECHANICAL ENGINEERING
ACKNOWLEDGEMENTS
I would like to thank my committee chairman. Dr. Stephen Ekwaro-Osire for
providing me the opportunity to work under him during my graduate study. His excellent
guidance and encouragement helped me a lot in the completion of this study. I am also
gratefiil to the members of my committee, Dr. Atila Ertas and Dr. Timothy T. Maxwell
for serving as my committee members.
I would like to extend my special thanks to my research mates. Christian Kamm
and Morshed Khandaker in the Product Design & Development Lab, for their friendship
and cooperation throughout my study.
My most precious thanks go to my parents, Ilhan and Nil Ozerdim for their
continuous support through all my life.

TABLE OF CONTENTS
ACKNOWLEDGEMENTS ii
ABSTRACT v
LIST OF FIGURES vi
LIST OF SYMBOLS ix
1 INTRODUCTION 1
1.1 Introduction 1
1.2 Vibrations 1
1.2.1 Elements of Vibrations 1
1.2.2 Controlling Vibrations 3
1.2.2.1 Active Control 3
1.2.2.2 Passive Control 4
1.3 Impact Vibration Absorbers 5
1.3.1 Introduction 5
1.3.2 Theoretical Studies 5
1.3.3 Experimental Studies 7
1.4 Objectives 9
1.5 Scope of Work 9
2 EXPERIMENTS 36
2.1 Introduction 36
2.2 Experimental Setup 36
2.2.1 Introduction .., 36
2.2.2 Signal Generator and Control 37
2.2.3 Amplifier 38
2.2.4 Shaker Table 38
2.2.5 Experimental Models 39
2.2.6 Transducers 40
2.2.7 Data Acquisition 41
2.3 Experimental Methodology 42
iii

2.3.1 Introduction 42
2.3.2 Transient Vibration 42
2.3.3 Forced Vibration 43
3 RESULTS AND DISCUSSION 55
3.1 Introduction 55
3.2 Transient Vibration 55
3.2.1 Natural Frequency 55
3.2.2 Decay Characteristics 55
3.2.3 Parametric Studies on Decay Characteristics 56
3.3 Forced Vibration 56
3.3.1 Pendulum Length Effect 56
3.3.1.1 Simple IVA 56
3.3.1.2 Compound IVA 57
3.3.1.3 Comparisons 57
3.3.2 Parametric Studies on Compound IVA 58
3.3.2.1 Clearance 58
3.3.2.2 Excitation Amplitude 58
3.3.2.3 Impact Mass 59
4 CONCLUSIONS 79
REFERENCES 80
APPENDIX: TABLE OF EXPERIMENTS 85
IV
ABSTRACT
This research deals with passive vibration control of a primary mass using impact
vibration absorbers (IVA). Primary mass is the structure for which the vibrations are to
be mitigated. Different types of IVAs have been proposed, studied and used in practical
applications. This research is on two types of IVAs, namely, simple IVA and compound
IVA. In simple IVA the impact mass hangs from a pendulum not connected to the
primary mass. In compound IVA the impact mass hangs from a pendulum connected to
the primary mass.
The first objective of this research was to compare the effect of the pendulimi arm
length on the absorption characteristics of the simple and compound IVA. The second
objective was to determine the effect of the mass ratio, excitation amplitude, and
clearance between impact walls on absorber efficiency of the compound IVA model.
For transient vibration involving compound IVAs it was shown that the longest
pendulum was more efficient than the shortest pendulum. The largest clearance was more
efficient than the smallest clearance. For the largest initial displacement the vibrations
were attenuated faster than for the smallest initial displacement. For forced vibrations, the
simple IVA (compare to the compound IVA) has a more pronoimced inefficient
absorption region. This is due to the apparent shift of the resonance point. On the other
hand the con^und IVA hardly has a clear inefficient absorption region. In the respective
absorption region, it is noted that the single IVA has a more prominent vibration
absorption level. It was also noted that for the simple IVA the shortest pendulum length is
the most efficient, while for the compound IVA the shortest pendulum length is the least
efficient.

LIST OF FIGURES
1.1: Transient response for linear viscous damping 10
1.2: Frequency-response curve for (a) a linear spring, (b) a hardening spring, and
(c) a softening spring 11
1.3: A schematic diagram of the mechanism 12
1.4: N-Floored building with absorber 13 1.5: Pendulum-type absorber 14
1.6: Experimental setup for impact vibration absorber model 15
1.7: Types of impact vibration absorbers (a) single-unit IVA, (b) multi-unit IVA,
(c) hybrid IVA, (d) compound IVA 16
1.8: IVA models 17
1.9: IVA model 18
1.10: A schematic diagram of the model showing the coordinate frame 19
1.11: Model of multi-unit impact damper 20
1.12: Vibration absorber model 21
1.13: Two-DOF model of the end-milling cutter 22
1.14: Dynamical models of percussion machine and its interaction with tool and operator 23
1.15: Experimental setup with (a) single-DOF primary system (b) two-DOF
primary system 24
1.16: Experimental setup for IVA 25
1.17: Pendulum-type IVA model 26
1.18: rVA model on the pylon model in laboratory 27
1.19: The IVA installed in the bridge pylon 28
1.20: IVA model with impacting ball 29
1.21: IVA model for different locations of impact mass 30
1.22: IVA model with shot-filled container 31
1.23: Experimental setup 32
1.24: Mechanical model of IVA 33
1.25: Two-DOF IVA model 34
VI
1.26: Experimental setup for IVA 35
2.1: Experiments conducted and parameters studied 45
2.2: Experiment setup: (a) signal generator controller, (b) amplifier, (c) shaker, (d) accelerometer, (e) signal conditioner, (f) primary structure, (g) absorber, and
(h) acquisition and analysis system. 46
2.3: Simple IVA model 47
2.4: Complete solid model of simple IVA setup 48
2.5: Complete sohd model of impact mass (secondary mass) 49
2.6: Compovmd IVA model 50
2.7: Complete solid model of compound IVA setup 51
2.8: Front panel ofLabVIEW program used for data acquisition 52
2.9: Front panel of LabVIEW program used for psd calculation 53
2.10: Front panel of LabVIEW program used for extraction of frequency response
plots 54
3.1: Time series of transient vibration of system without compound IVA 60
3.2: Probability spectral density of transient vibration of system without compoimd IVA 61
3.3: Decay characteristics of system transient vibration with and without simple IVA (L = 250 mm, \i = 0.045, D = 4.912 mm, e = 400 micro-strains) 62
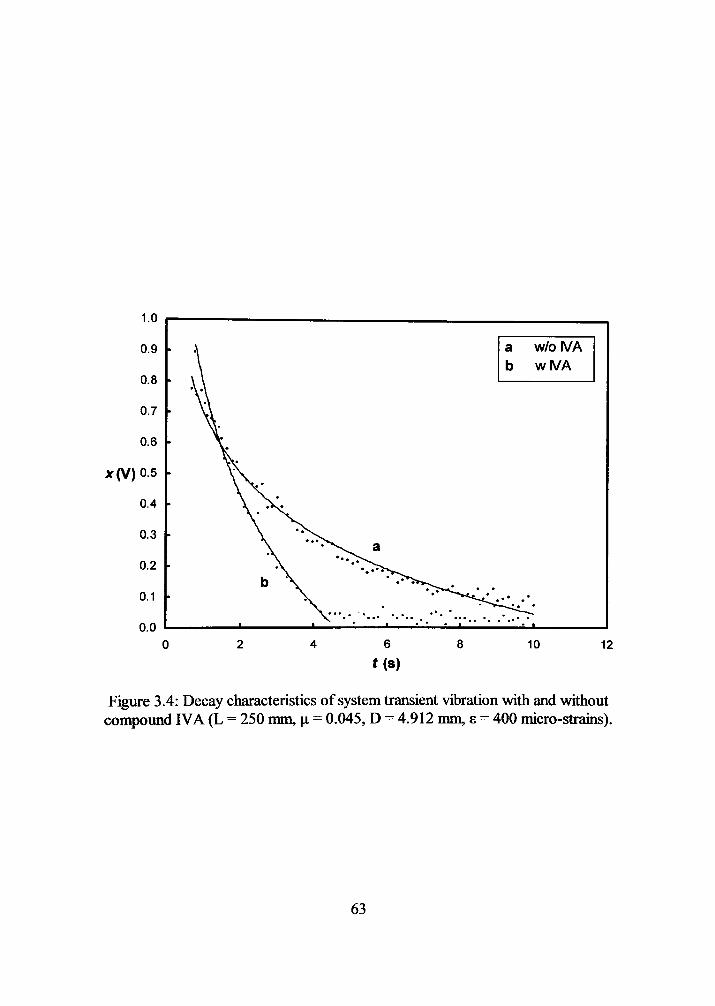
3.4: Decay characteristics of system transient vibration with and without compound IVA (L = 250 mm, \i = 0.045, D = 4.912 mm, 8 = 400 micro-strains) 63
3.5: Effect of pendulum length on rate of decay (Compound IVA, \i = 0.045, D = 4.912 mm, e - 400 micro-strains) 64
3.6: Effect of clearance on the rate of decay (Compovmd IVA, L = 250 mm, \i = 0.045, s = 400 micro-strains) 65
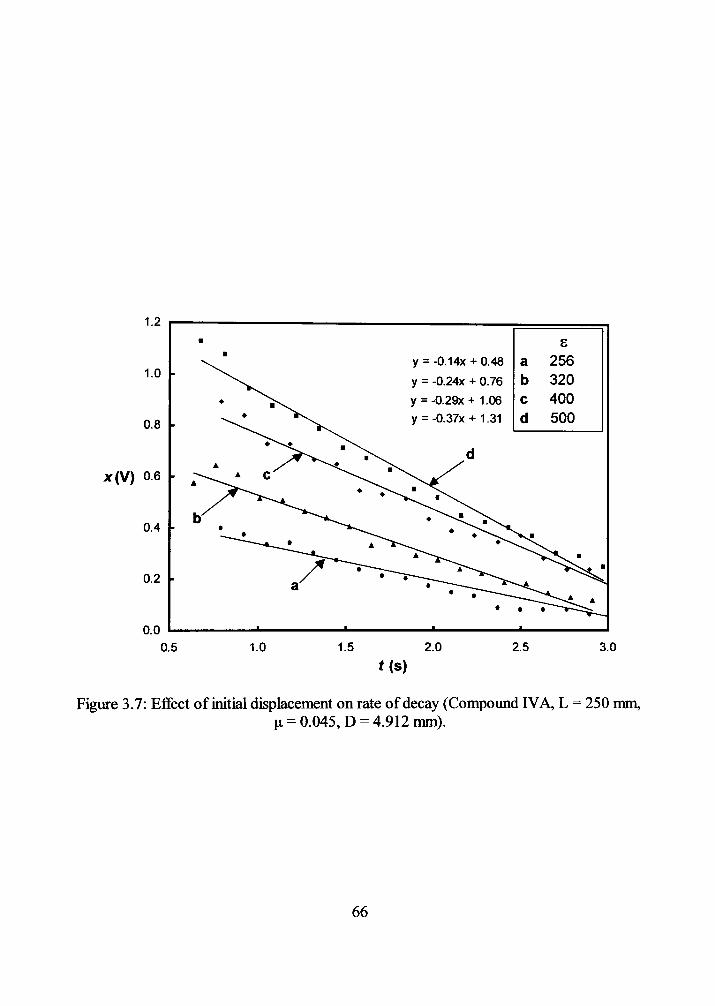
3.7: Effect of initial displacement on rate of decay (Compound IVA, L = 250 mm, i = 0.045, D - 4.912 mm) 66
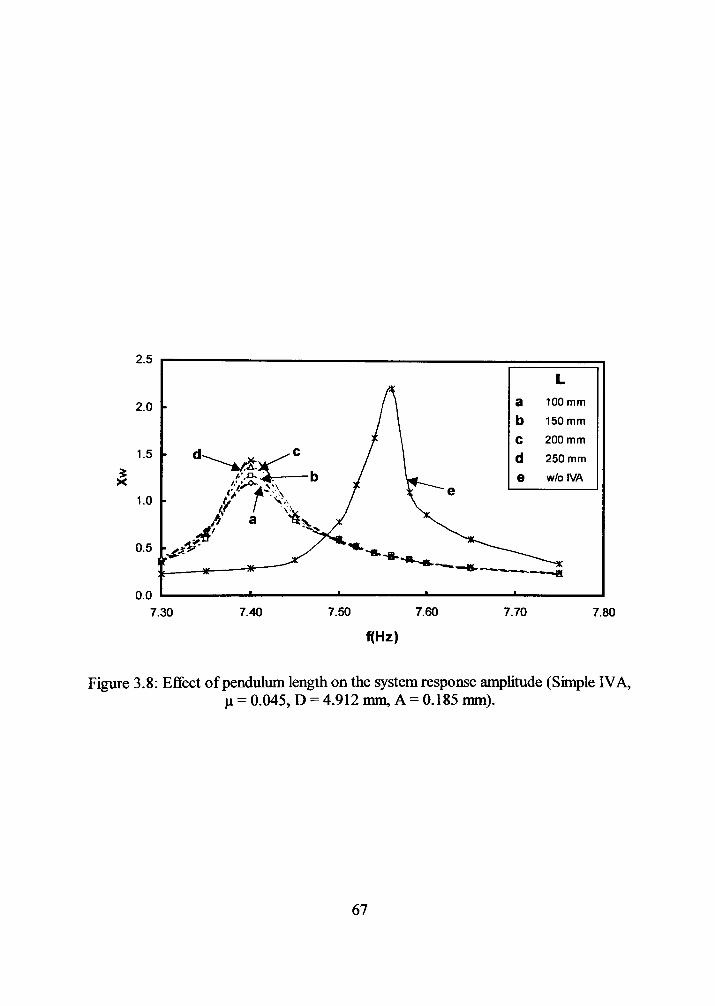
3.8: Effect of pendulum length on the system response amplitude (Simple IVA, ^ = 0.045, D - 4.912 nrni, A = 0.185 mm) 67
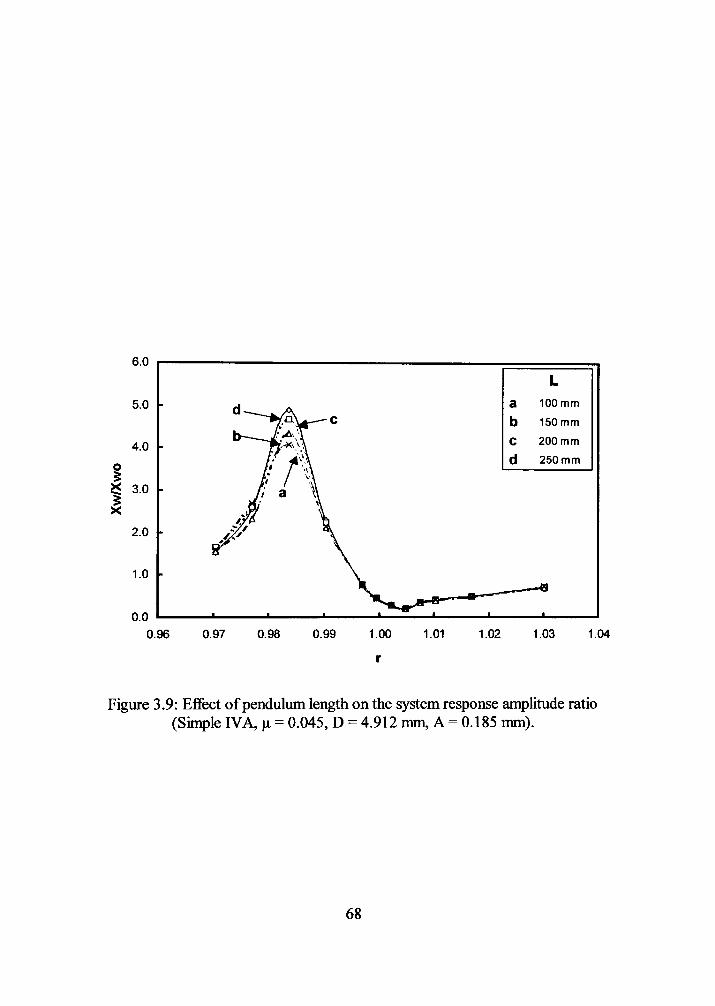
3.9: Effect of pendulimi length on the system response amplitude ratio (Simple IVA, i = 0.045, D = 4.912 mm, A - 0.185 mm) 68
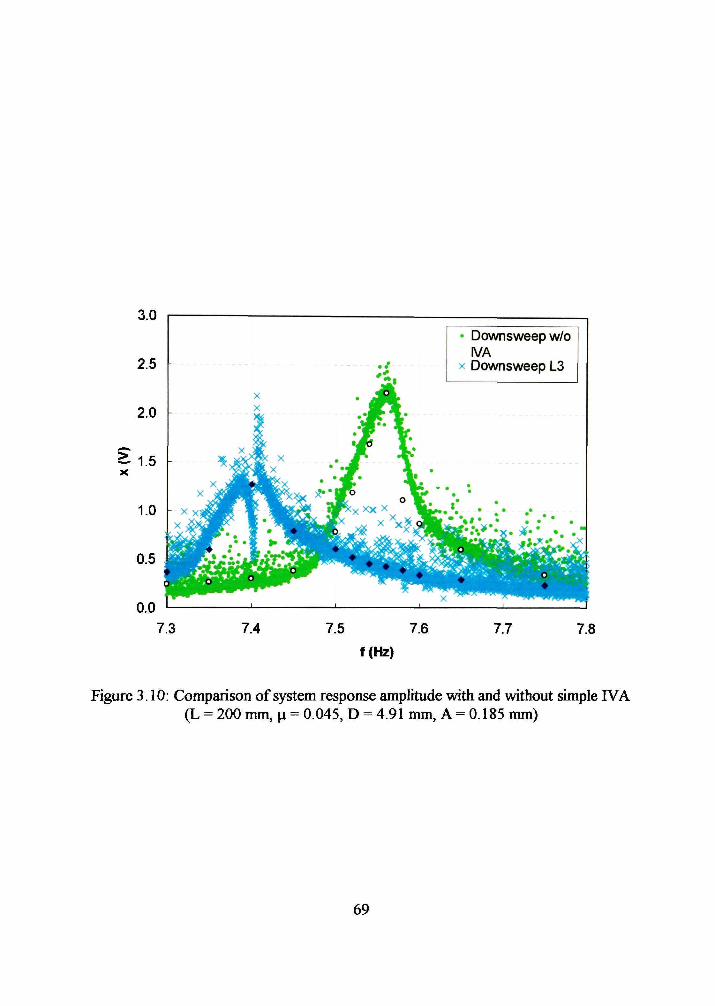
3.10: Comparison of system response amplitude with and without simple IVA (L = 200 mm, n - 0.045, D = 4.91 mm, A = 0.185 mm) 69
3.11: Effect of pendulum length on the system response amplitude (Compound IVA,
vii
|x = 0.045, D = 4.912 mm, A = 0.185 mm) 70
3.12: Effect of clearance on the system response amplitude (Compound IVA, L = 250 mm, ^ = 0.045, A = 0.185 mm) 71
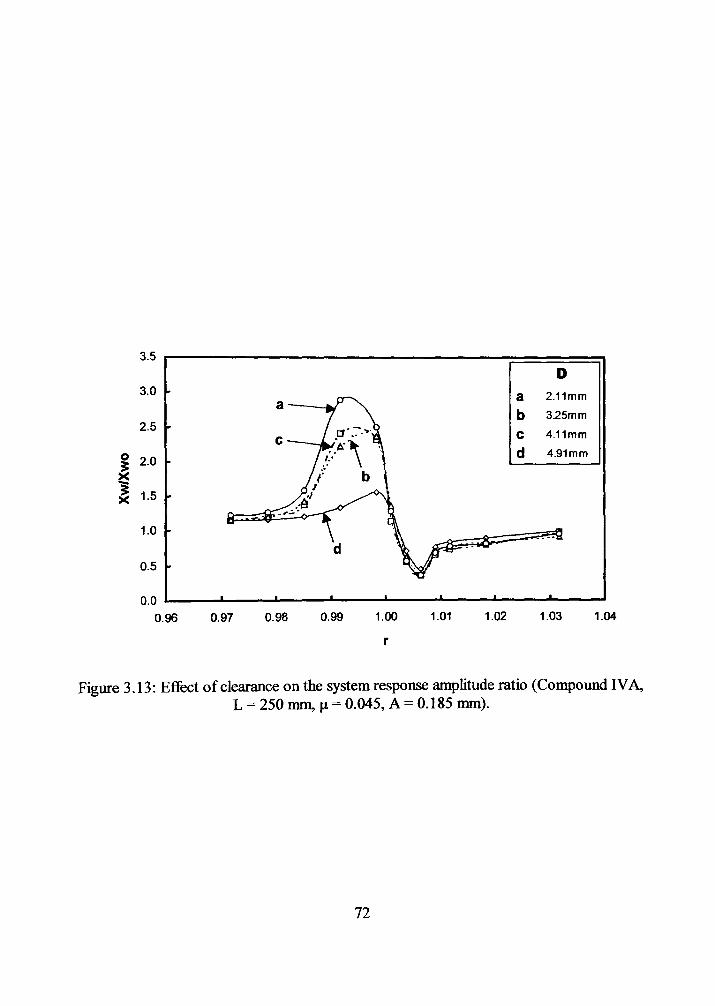
3.13: Effect of clearance on the system response amplitude ratio (Compound IVA, L = 250 mm, n = 0.045, A = 0.185 mm) 72
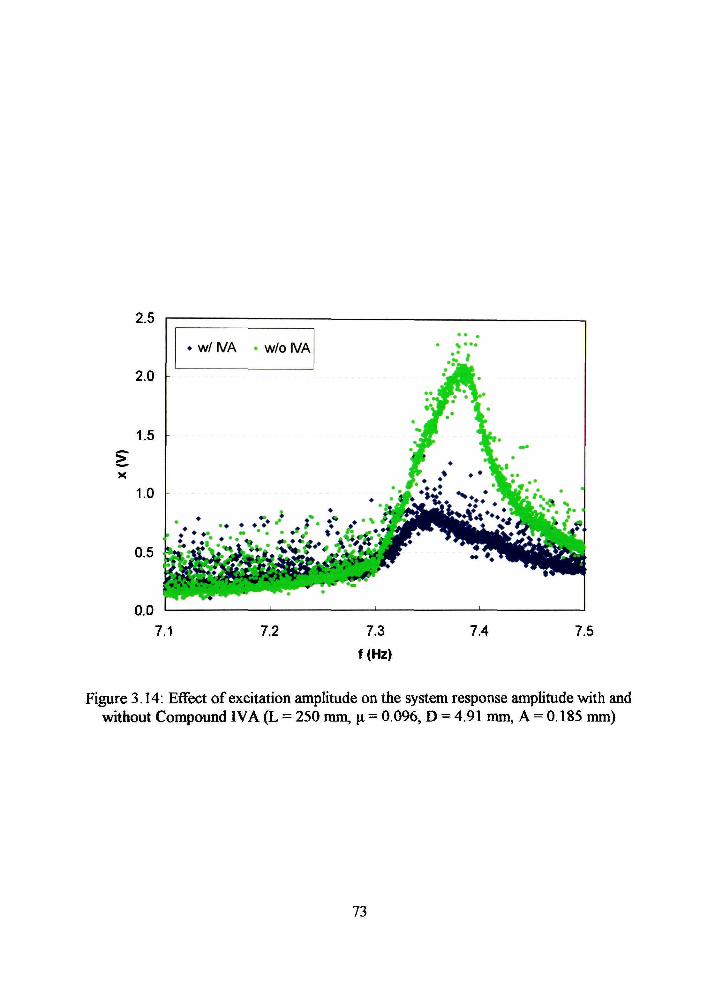
3.14: Effect of excitation amplitude on the system response amplitude with and without Compound IVA (L = 250 mm, \i = 0.096, D = 4.91 mm, A = 0.185 mm) .73
3.15: Effect of excitation amplitude on the system response amplitude with and without Compound IVA (L - 250 mm, \i = 0.096, D = 4.91 mm, A = 0.160 mm) .74
3.16: Effect of excitation amplitude on the system response amplitude with and without Compound IVA (L = 250 mm, \i = 0.096, D = 4.91 mm, A = 0.127 mm) .75
3.17: Mass ratio effect on the response amplitude with and without compound IVA (L = 200 mm, n = 0.045, D = 4.91 mm, A = 0.185 mm) 76
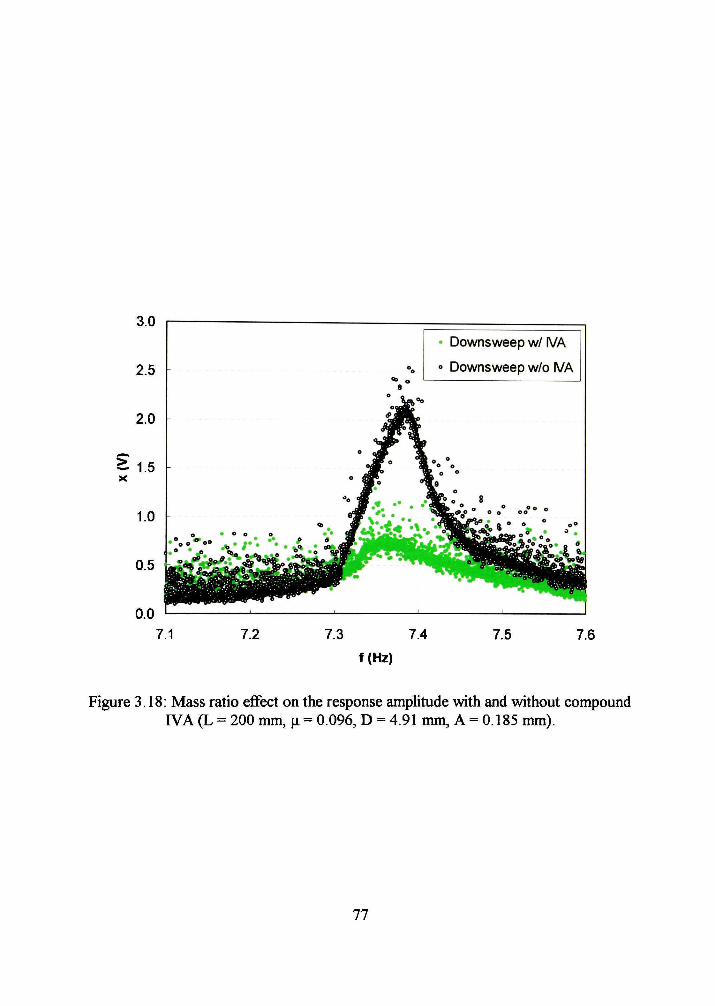
3.18: Mass ratio effect on the response amplitude with and without compoimd IVA (L = 200 mm, \i = 0.096, D = 4.91 mm, A = 0.185 mm) 77
3.19: Mass ratio effect on the response amplitude with and without compound IVA (L = 200 mm, \i = 0.145, D = 4.91 mm, A = 0.185 mm) 78
vm

LIST OF SYMBOLS
A Zero-to-peak amplitude of excitation (mm).
c Damping ratio (N-sec/m).
D Clearance between impact mass and impact walls (mm).
F Initial displacement.
k Stiffiiess (N/m^).
/ Length of leaf beams (mm).
L Length of Pendulum.
mi Mass of primary mass (kg).
m2 Mass of impact vibration absorber (kg).
r Frequency ratio, f/f„ or w/w„.
t Time (s).
jc Deflection of primary mass from equilibrium position (m).
z Deflection of IVA from equilibrium position (m).
6 Logarithmic decrement.
^ Damping factor.
/ Frequency of vibration, excitation frequency (Hz).
/„ Natural frequency (Hz).
// Mass ratio, /w/ mi.
w Frequency of vibration, excitation frequency (rad/s).
M>„ Circular natural frequency (rad/s).
0 Angle of rotation of pendulum (degrees).
IX
CHAPTER 1
INTRODUCTION
11 Introduction
The study of vibrations deals with such bodies under oscillatory motions and with
the forces associated with them. Vibrations are one of the most common aspects of life.
Since most of the engineering machines and structures experiences some degree of
vibrations, engineers have to consider issue of vibrations in the designing process [1].
Vibrations may occur due to the design of the machinery as vibrations caused by an
engine, or they may occur due to natural reasons such as buildings under excitation of
earthquake, ships under excitation of sea waves or simply a flagpole under excitation of
wind. It is usually required to control the vibrations because it causes fatigue and failure
of the components that are under vibrations, and discomfort for the people.
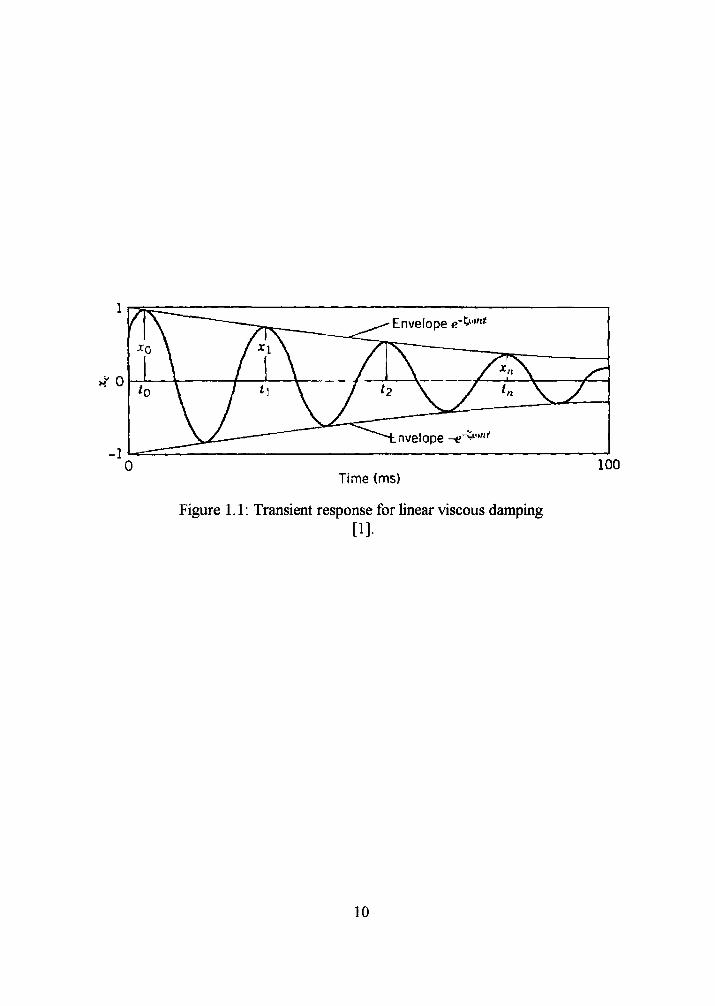
Vibrations can be classified as forced and transient vibrations. Transient
vibrations are also referred as free vibrations. In forced vibrations case there is an
external excitation of the system that is oscillating. However, in transient vibrations case
system oscillates under the action of forces inherent in the system itself The system
under transient vibrations oscillates at one or more of its natural frequencies. Figure 1.1
shows an example of transient response for linear viscous damping.
1.2 Vibrations
1.2.1 Elements of Vibrations
When a system is placed in motion, oscillation will take place at the natural
frequency fa, which is a property of the system [1]. The natural frequency of the system
can be determined by solving equation of motion of the system. However, if the system is
non-linear this solution is usually very complicated sometimes even unsolvable. Another
way of determining natural frequency is using transient experiment results. By using
power spectral density (psd) estimation, which is described detailed in [2], the damped
frequency ©a can be found. Then using Logarithmic Decrement Equation (Equation 1.1)
and Damping Factor (Equation 1.2) in the following formulas [3] it is possible to
calculate natural frequency (Equation 1.3, 1.4):
n (1.1)
XQ : The cycle amplitude at time t = to in Figure 1.1
Xp: The cycle amplitude at time t = tn in Figure 1.1
d ^ = ^ 1 JW (1-2)
co„=a>,\\-CY (1-3)
/ „ = f (1.4)
Resonance is the vibratory behavior where the excitation frequency is close or
equal to the natural frequency of the system under excitation [4]. When resonance occurs
system response amplitudes reach their largest values. Failure of the any component of
the system is expected to be in this region so in designing process attempting to keep
oscillation frequencies as far as possible from the loading frequency is an important
engineering issue. In linear systems the peak of the amplitude response of the system is
nearly corresponds to the natural frequency of the system. However, in non-linear
systems the peak of the amplitude response is shifted slightly. The direction of the shift
depends on the properties that cause non-linearity.
Determining stiffiiess as a fiinction of force applied gives us load-deflection
characteristic of a mechanical system. Most of the time load-deflection characteristics of
mechanical systems are non-linear. Two types of non-linear load-deflection
characteristics are hardening and softening. Both types of non-linear load-deflection
characteristics allow for varying the actual stifl&iess by moving the working point along
the characteristic. There are many materials that show non-linear deformation
characteristics. For example deformation of cast iron and concrete components have
softening load-deflection characteristics. For rubber when it is under compression loading
2

it has hardening load-deflection characteristics but under shear loading it shows softening
load-deflection characteristics. Another reason that causes non-linearity is changing of
system geometry due to large deformations or due to a special geometry designed in
order to obtain changing stiffiiess [5]. Frequency response curves for a linear spring,
hardening spring and softening spring is shown in Figure 1.2.
Systems involving vibro-impact, with masses collide with rigid or elastic barriers
during their oscillations, shows strong non-linear characteristics. The non-linearity is
mainly due to extremely rapid velocity changes caused by impacts. These changes are
usually treated as being instantaneous which occurs as velocity jumps and they cause
strong non-linear behavior even if the system itself is linear before impacts [6].
1.2.2 Controlling Vibrations
1.2.2.1 Active Control
Active vibrations control systems are vibration absorbers that get feedback from
the system under excitation and according to this feedback drive necessary devices to
reduce the vibrations. So, it has the ability to change the parameters of absorber
according to the magnitude of the vibrations. The advantages of active vibrations control
systems over passive ones they include broader bandwidth and higher control authority.
Since operation conditions of a controlled system change in time, passive absorbers can
lose effectiveness in some bandwidths and may even increase vibrations. However, they
are also more expensive and there is a higher risk of failure. They usually need a power
source and maintenance [7].
Different active control methods are used for active vibrations control. Kang [8]
used smart electio-rheological composites for active control. Sakamoto [9] also used
electro-rheological liquids but as a sloshing damper. Figure 1.3 shows the model that is
used in that research. Tentor [10] used the help of electromagnetic forces in his model.
The electromagnetic tuned dynamic vibration absorber that is used in this study enables
vibration reduction around a tuned frequency. This research uses permanent magnets in
conjunction with an electromagnet to change system stiffiiess in order to shift absorbers
natural frequency and the combined system cancellation frequency range. An
electromechanical vibration absorber studied by Nagem [11]. In this study Nagem
replaced a passive mechanical absorber system with an active system that consists of an
electromechanical transducer and a resonant electrical circuit. It is shown that by tuning
the electrical circuit properly, the vibrations amplitude response of the system on which
absorber attached, is reduced considerably. Some of the other studies that are on active
vibrations control are [12-15].
1.2.2.2 Passive Control
Passive vibrations control unUke active ones fimctions without external supply
that is; they do not require any power source. Instead they use the energy stored in the
structure as potential or kinetic energy. It is not possible to control absorber parameters
during the absorption of vibrations. The simple device compared to active ones often
consists of a reaction mass and a spring element. This simple passive absorber system is
proven to be very effective for reducing excessive vibrations of machinery, buildings,
bridges, and many other engineering applications with relatively low cost [16].
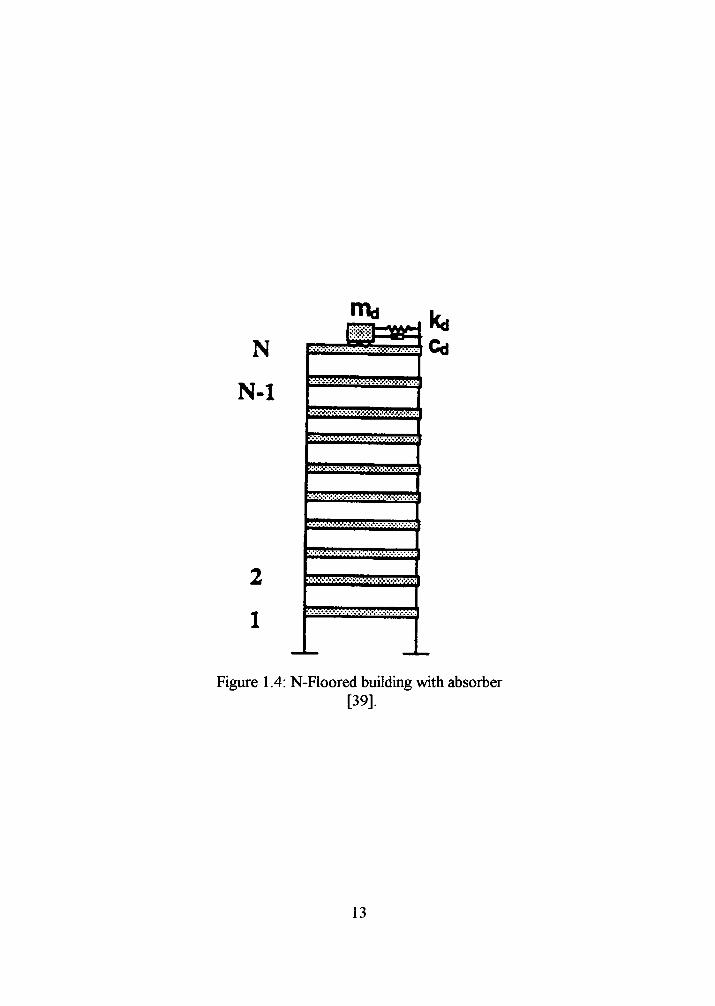
The most common passive control that is used and studied is a simple mass and
spring system attached to the structure for which vibrations to be reduced. Figure 1.4
shows such a model that is designed to apply to a building. Another common used
passive controller is pendulum type absorber that is studied experimentally and
theoretically by researchers [17-19]. Figure 1.5 shows such a pendulum type passive
absorber where a pendulum with a tip mass attached to a beam to reduce its amplitude
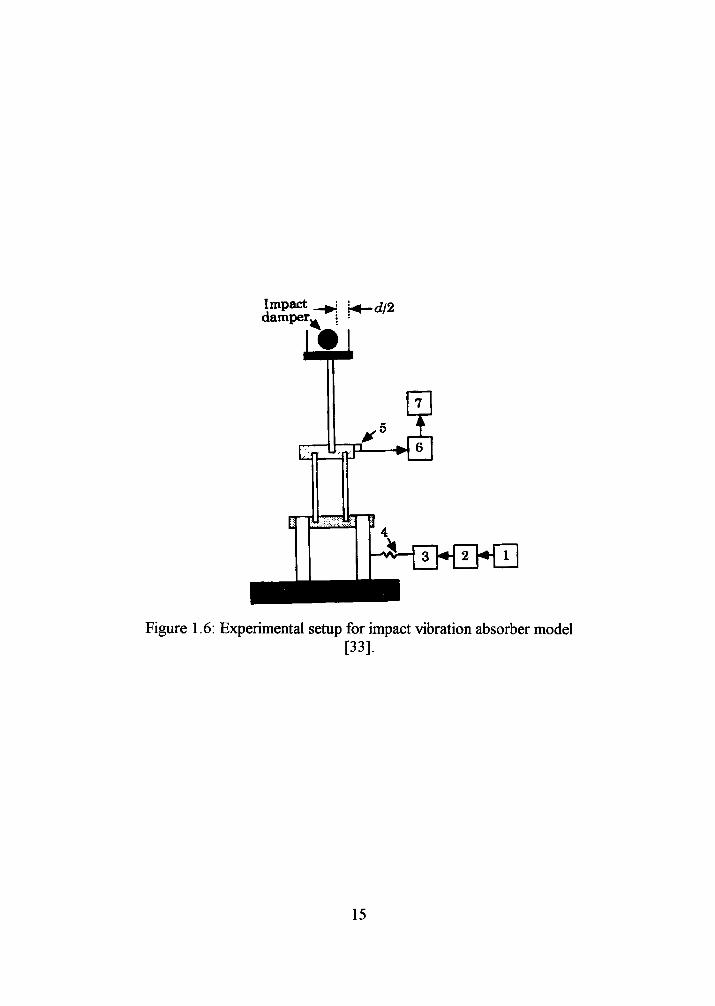
response to vibrations. Adding an impact damper is another approach that is studied.
Figure 1.6 shows an impact vibration model that is studied experimentally. The
collusions that occur between primary mass and impact mass reduce the vibrations of
primary mass.
There are a large number of studies that refers to direct engineering applications
for passive controllers. A pendulum absorber is proposed for ropeway carriers that are
usually under excitation of wind [20]. Jacquot [21] studied vibration absorbers to control
vibrations of rectangular simply supported plates for application to printed wiring boards

under excitation of random acoustic fields. Alii [22] focused on control of overhead
cranes in his study.
1.3 Impact Vibration Absorbers
1.3.1 Introduction
One of the most effective passive control methods is adding an impact vibration
absorber to the system under excitation. Impact vibration absorbers, which are referred as
IVA in this study, consist of an impact mass that is located such that it makes collisions
with the main mass that is vibrating. The transfer of momentum to the mass from the
main mass and dissipation of energy in every impact provides reduction in amplitude
response of the main mass.
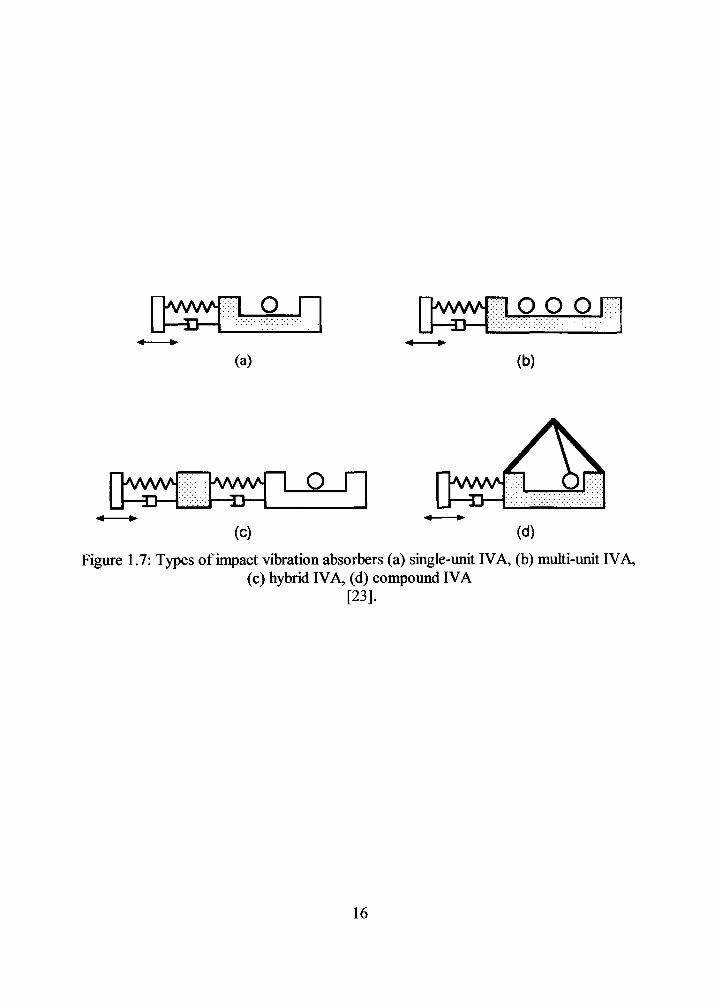
Desen [23] classified the IVAs that are studied so far in four categories: (a)
single-unit IVAs, (b) multi-unit IVAs, (c) hybrid IVAs, and (d) compound IVAs (Figure
1.7). Single-unit IVAs consists of an impact mass that is not attached to the primary
system. Multi-unit IVAs uses more than one impact masses to for reduction of vibrations.
Hybrid IVAs are combination of impact vibration absorber with a different type of
absorber such as a mass-spring-damper absorber. Con^und IVAs is similar to single-
unit IVAs, but unlike single-unit impact mass is attached to the primary system. Current
study deals with single-unit IVA, which is referred as simple IVA model, and compound
IVA model.
1.3.2 Theoretical Studies
Forced oscillators with impacts at rigid stops have been widely studied as
examples of simple non-Unear systems. Such systems are of interest because a large
number of physical systems display behavior, which can be classified as impacting. In
such cases more theoretical analyses have been done compared experimental studies to
avoid the noise or wear caused by repeated unacceptable large impacts [24].
Figure 1.8 shows two impact damper models that are studied numerically [25],
[26]. Both the transfer of momentum to the loose mass from the main system and
dissipation of energy in every impact provide the mechanism for controlling the
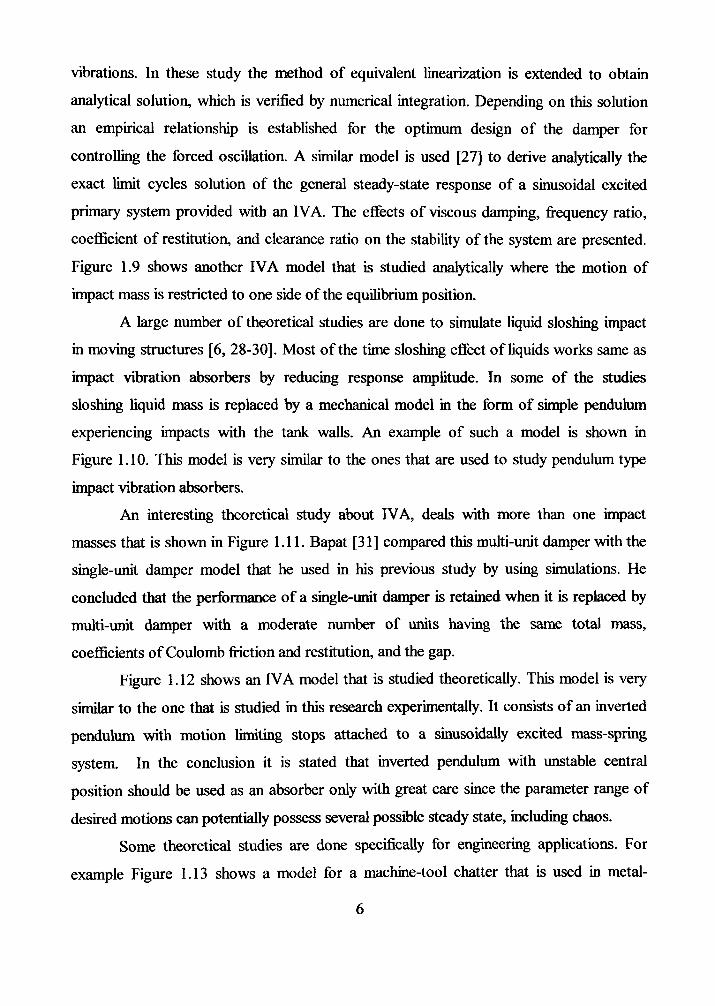
vibrations. In these study the method of equivalent linearization is extended to obtain
analytical solution, which is verified by numerical integration. Depending on this solution
an empirical relationship is established for the optimum design of the damper for
controlling the forced oscillation. A similar model is used [27] to derive analytically the
exact limit cycles solution of the general steady-state response of a sinusoidal excited
primary system provided with an IVA. The effects of viscous damping, frequency ratio,
coefficient of restitution, and clearance ratio on the stability of the system are presented.
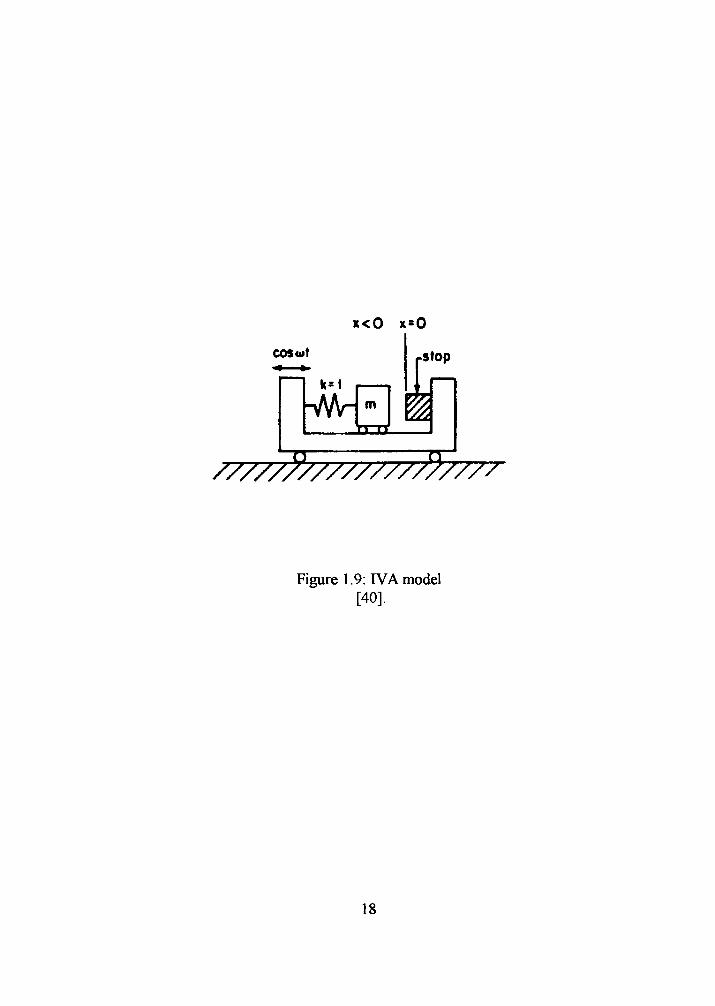
Figure 1.9 shows another IVA model that is studied analytically where the motion of
impact mass is restricted to one side of the equilibrium position.
A large number of theoretical studies are done to simulate liquid sloshing impact
in moving structures [6, 28-30]. Most of the time sloshing effect of liquids works same as
impact vibration absorbers by reducing response amplitude. In some of the studies
sloshing liquid mass is replaced by a mechanical model in the form of simple pendulum
experiencing impacts with the tank walls. An example of such a model is shown in
Figure 1.10. This model is very similar to the ones that are used to study pendulum type
impact vibration absorbers.
An interesting theoretical study about IVA, deals with more than one impact
masses that is shown in Figure 1.11. Bapat [31] compared this multi-unit damper with the
single-unit damper model that he used in his previous study by using simulations. He
concluded that the performance of a single-unit d a n ^ r is retained when it is replaced by
multi-unit damper with a moderate number of units having the same total mass,
coefficients of Coulomb friction and restitution, and the gap.
Figure 1.12 shows an IVA model that is studied theoretically. This model is very
similar to the one that is studied in this research experimentally. It consists of an inverted
pendulum with motion limiting stops attached to a sinusoidally excited nass-spring
system. In the conclusion it is stated that inverted pendulum with unstable central
position should be used as an absorber only with great care since the parameter range of
desired motions can potentially possess several possible steady state, including chaos.
Some theoretical studies are done specifically for engineering applications. For
example Figure 1.13 shows a model for a machine-tool chatter that is used in metal-
6
cutting process. Excessive vibrations occur of the cutting tool relative to the workpiece
causes a rough surface finish and dimensional inaccuracy of the work. Additionally
undesired vibrations accelerate the wear of cutting tool and components. In this study a
passive IVA is proposed and analyzed numerically. Another study investigates
interactions of the hand-held percussion machine with the operator to improve the
machine capacity and to reduce the reaction on the operator. Figure 1.14 shows the model
that is used for this study.
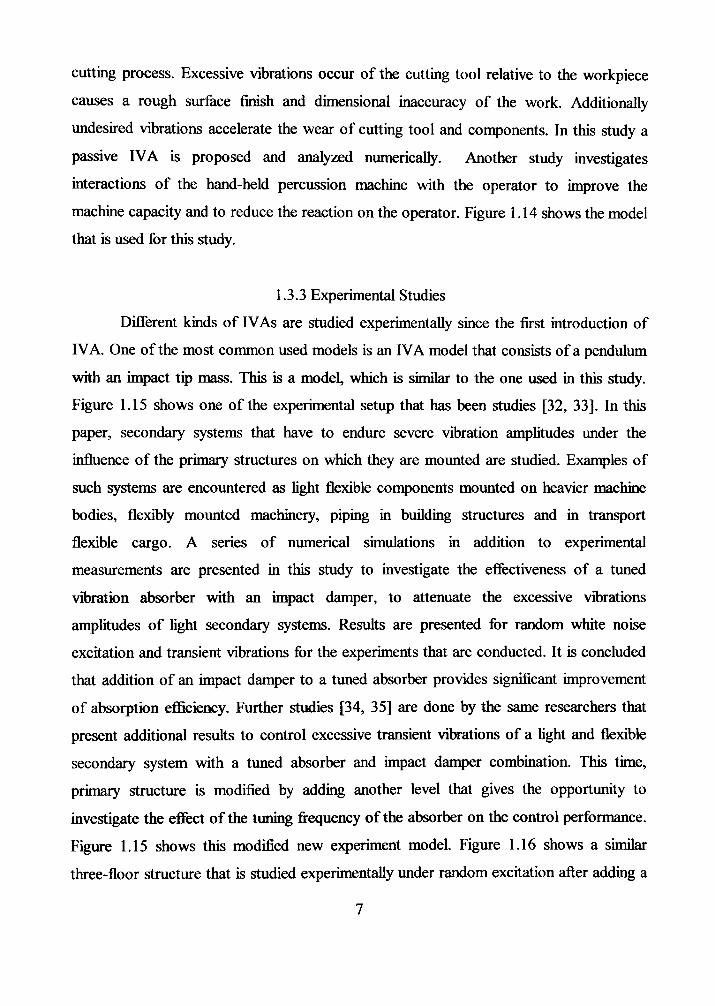
1.3.3 Experimental Studies
Different kinds of IVAs are studied experimentally since the first introduction of
IVA. One of the most common used models is an IVA model that consists of a pendulum
with an impact tip mass. This is a model, which is similar to the one used in this study.
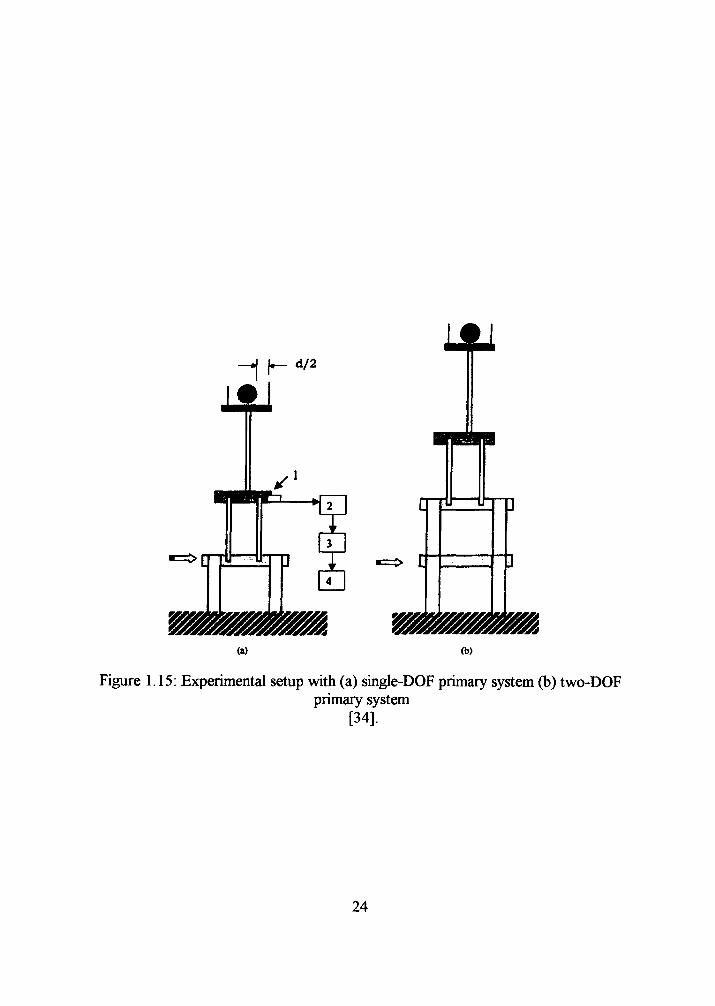
Figure 1.15 shows one of the experimental setup that has been studies [32, 33]. In this
paper, secondary systems that have to endure severe vibration amplitudes under the
influence of the primary structures on which they are mounted are studied. Examples of
such systems are encountered as light flexible components mounted on heavier machine
bodies, flexibly mounted machinery, piping in building structures and in transport
flexible cargo. A series of numerical simulations in addition to experimental
measurements are presented in this study to investigate the effectiveness of a tuned
vibration absorber with an impact damper, to attenuate the excessive vibrations
amplitudes of light secondary systems. Results are presented for random white noise
excitation and transient vibrations for the experiments that are conducted. It is concluded
that addition of an impact damper to a tuned absorber provides significant improvement
of absorption efficiency. Further studies [34, 35] are done by the same researchers that
present additional results to control excessive transient vibrations of a light and flexible
secondary system with a tuned absorber and impact damper combination. This time,
primary structure is modified by adding another level that gives the opportunity to
investigate the effect of the tuning frequency of the absorber on the contiol performance.
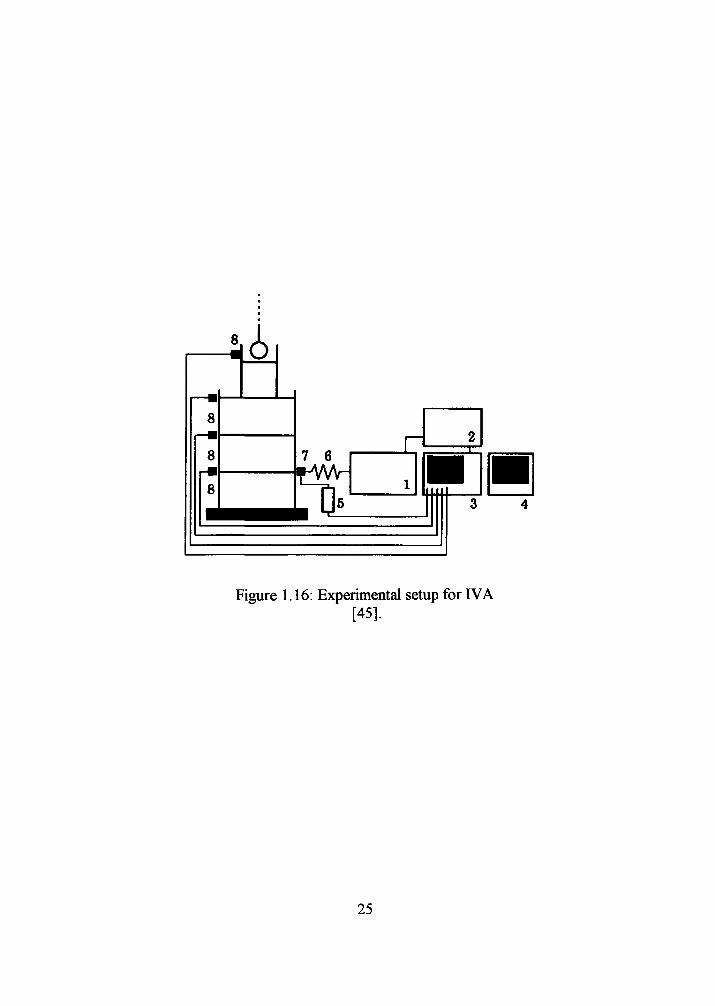
Figure 1.15 shows this modified new experiment model. Figure 1.16 shows a similar
three-floor structure that is studied experimentally under random excitation after adding a
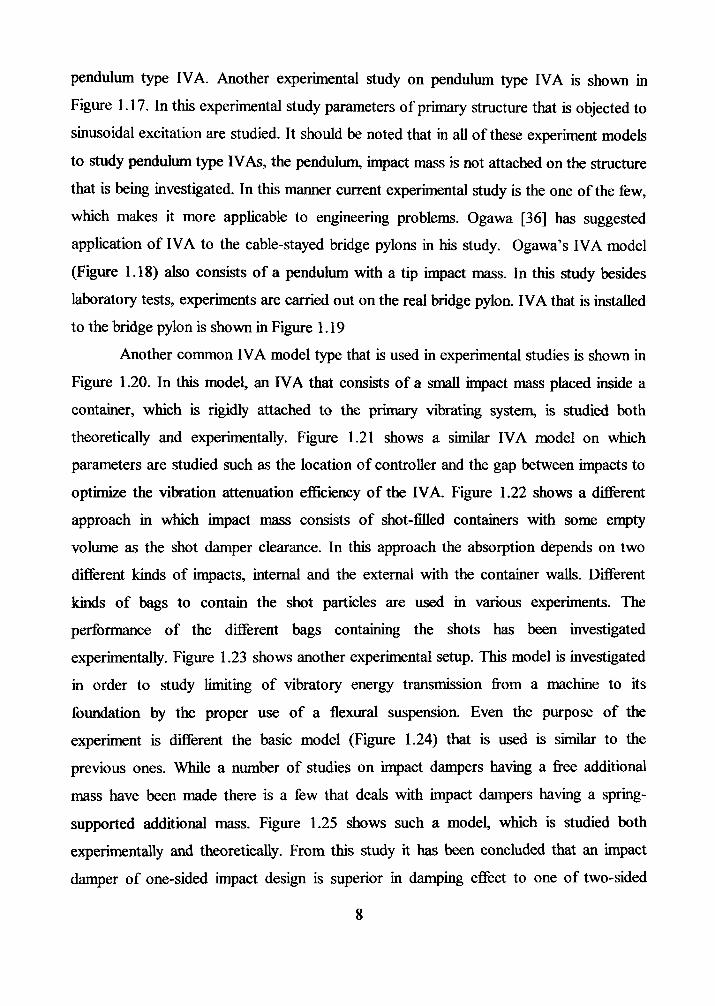
pendulum type IVA. Another experimental study on pendulum type IVA is shown in
Figure 1.17. In this experimental study parameters of primary structure that is objected to
sinusoidal excitation are studied. It should be noted that in all of these experiment models
to study pendulum type IVAs, the pendulum, impact mass is not attached on the structure
that is being investigated. In this manner current experimental study is the one of the few,
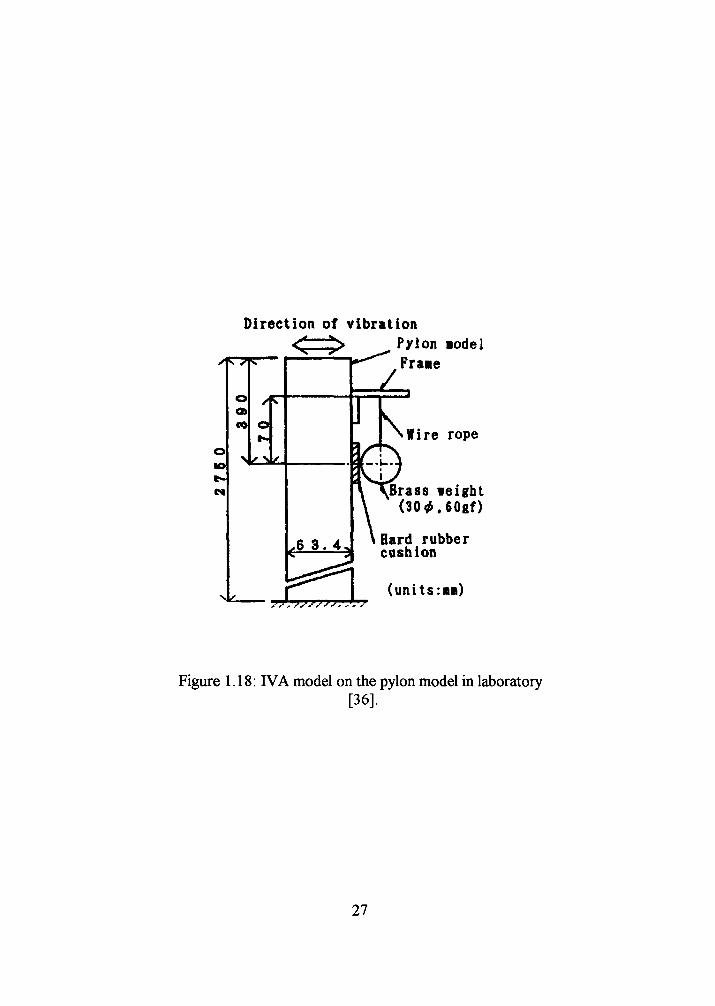
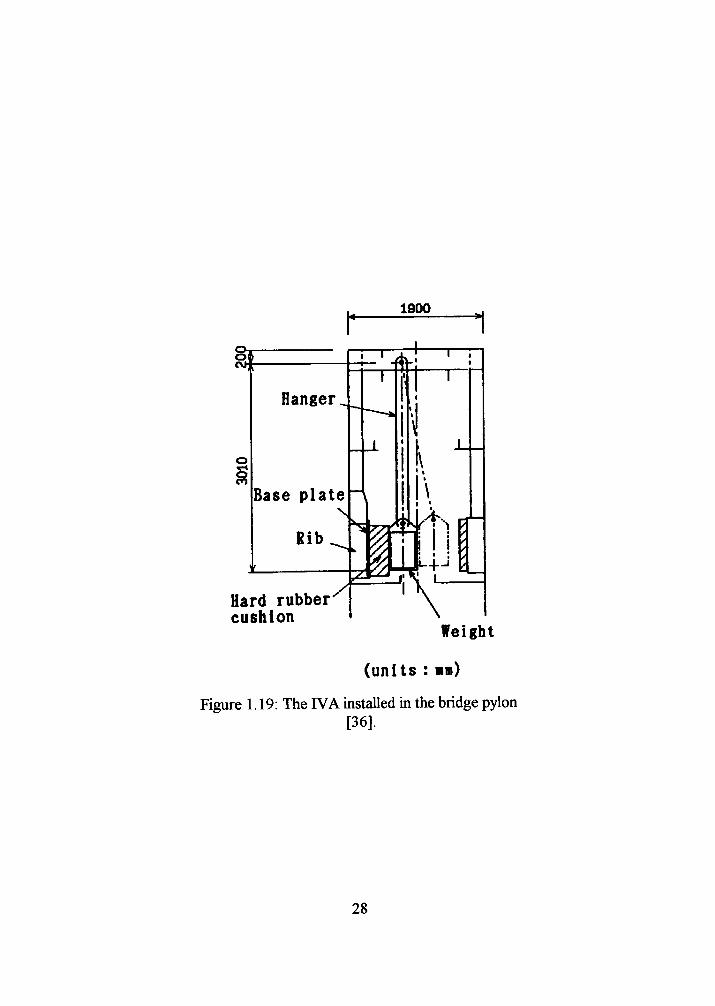
which makes it more applicable to engineering problems. Ogawa [36] has suggested
application of IVA to the cable-stayed bridge pylons in his study. Ogawa's IVA model
(Figure 1.18) also consists of a pendulum with a tip impact mass. In this study besides
laboratory tests, experiments are carried out on the real bridge pylon. IVA that is installed
to the bridge pylon is shown in Figure 1.19
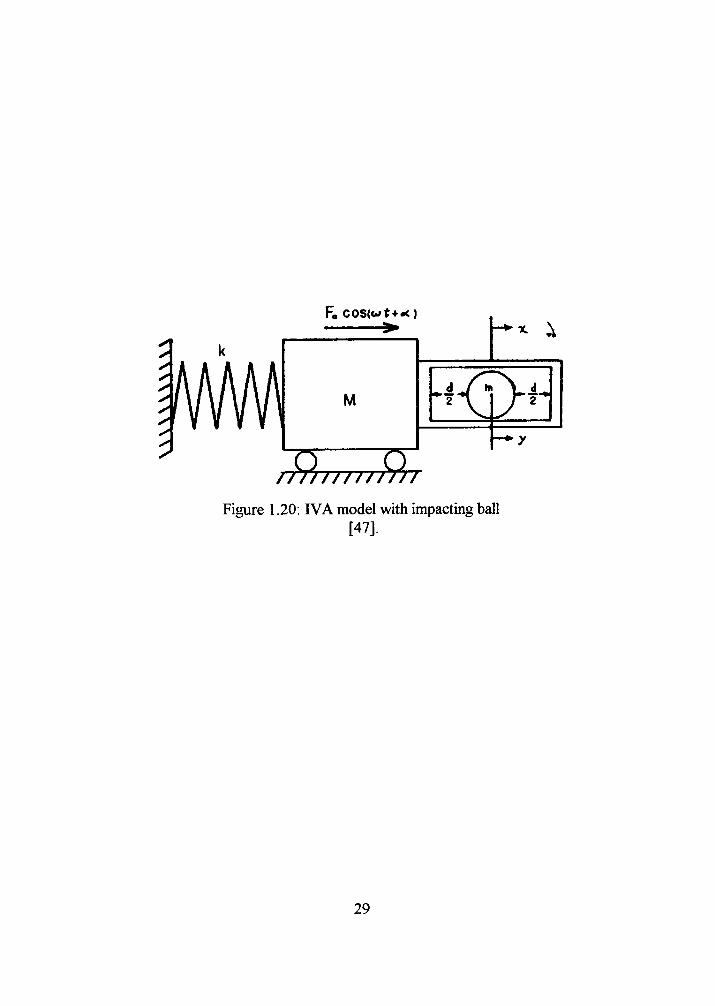
Another common IVA model type that is used in experimental studies is shown in
Figure 1.20. In this model, an IVA that consists of a small impact mass placed inside a
container, which is rigidly attached to the primary vibrating system, is studied both
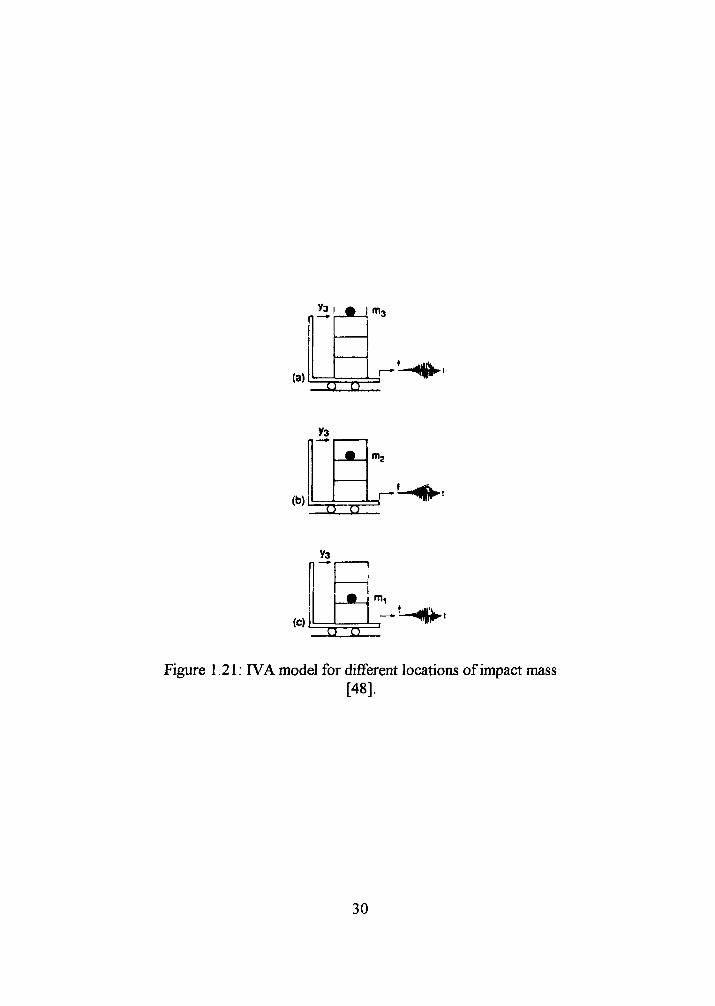
theoretically and experimentally. Figure 1.21 shows a similar IVA model on which
parameters are studied such as the location of controller and the gap between impacts to
optimize the vibration attenuation efficiency of the IVA. Figure 1.22 shows a different
approach in which impact mass consists of shot-filled containers with some empty
volume as the shot damper clearance. In this approach the absorption depends on two
different kinds of impacts, internal and the external with the container walls. Different
kinds of bags to contain the shot particles are used in various e)q)eriments. The
performance of the different bags containing the shots has been investigated
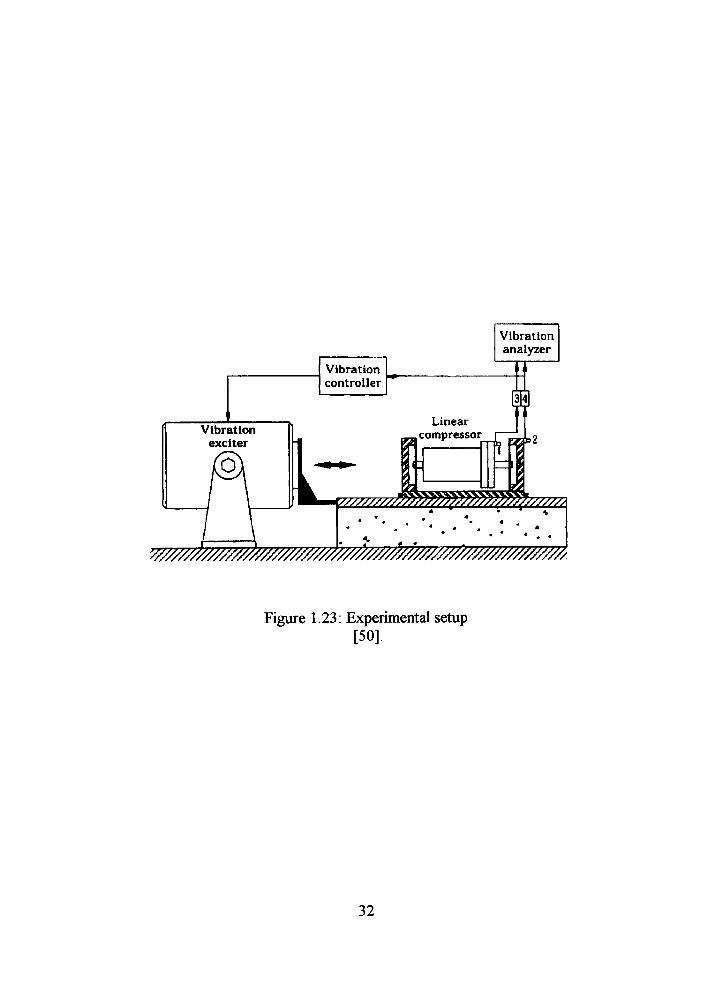
experimentally. Figure 1.23 shows another experimental setup. This model is investigated
in order to study limiting of vibratory energy transmission from a machine to its
foundation by the proper use of a flexural suspension. Even the purpose of the
experiment is different the basic model (Figure 1.24) that is used is similar to the
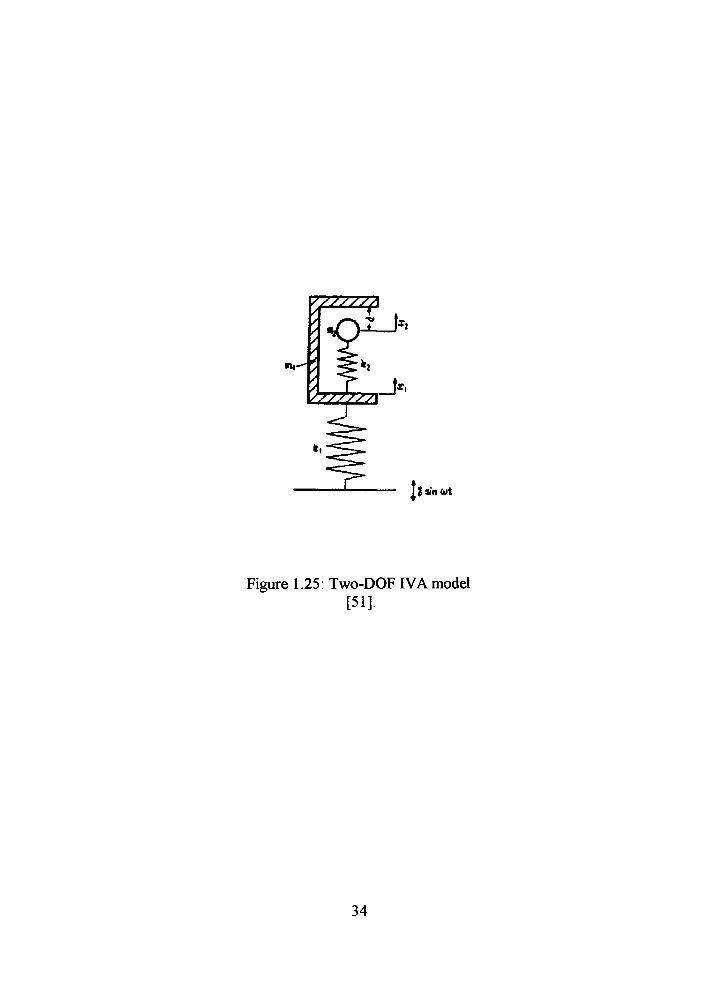
previous ones. While a number of studies on impact dampers having a free additional
mass have been made there is a few that deals with impact dampers having a spring-
supported additional mass. Figure 1.25 shows such a model, which is studied both
experimentally and theoretically. From this study it has been concluded that an impact
damper of one-sided impact design is superior in damping effect to one of two-sided
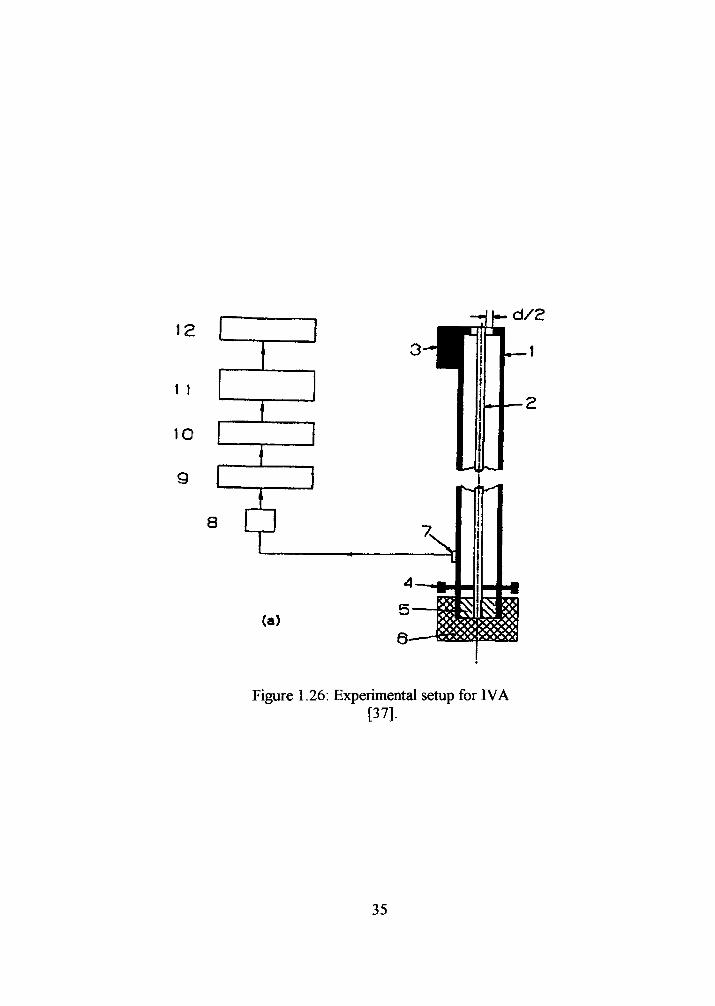
impact design. Hoang [37] has proposed an application of IVA to control oscillations of
robot arms that are induced either by suddenly braking to a stop after a new positioning
or after hitting a stop block. Figure 1.26 shows the model that is studied experimentally
in this paper. It is concluded that the proposed technique is capable of producing
significant reductions in vibrations as compared to the uncontrolled arm.
1.4 Objectives
The objective of this research is to compare the sensitivity of the attachment point
of pendulum for two different models of IVAs, which are, referred as simple and
compound IVA, under sinusoidal excitation. Additionally another objective is to
determine the effect of the mass ratio, excitation amplitude, and clearance between
impact walls on absorber efficiency of the compound IVA model.
1.5 Scope of Work
The first IVA model referred as simple IVA model that is studied is a non-linear
and single DOF while the second IVA model referred, as compound IVA model is a non
linear and two DOF. For the simple IVA model, the time series data of the primary mass,
for two different amount of impact mass, two different excitation amplitudes, and four
different lengths of IVA pendulum are recorded. For the compound IVA model, the time
series data of the primary mass and the IVA which includes the excitation amplitude, the
primary mass displacement, and FVA displacement for four different amounts of impact
mass, four different excitation amplitude, four different lengths of IVA pendulum, and
four different gaps between impact walls are recorded. The time series data is used to
obtain the motion plots. This data is used to compare the sensitivity of the attachment
point of pendulum for two different models of IVA and to show the effects of other
system parameters on system response of the compound IVA model. The results are
compared with published results where it is appropriate. Discussions and conclusions
have been made regarding the effectiveness of two different models of IVA.
Time (ms)
Figure 1.1: Transient response for linear viscous damping [1].
10

(b) (0
Figure 1.2: Frequency-response curve for (a) a linear spring, (b) a hardening spring, and (c) a softening spring
[38].
11
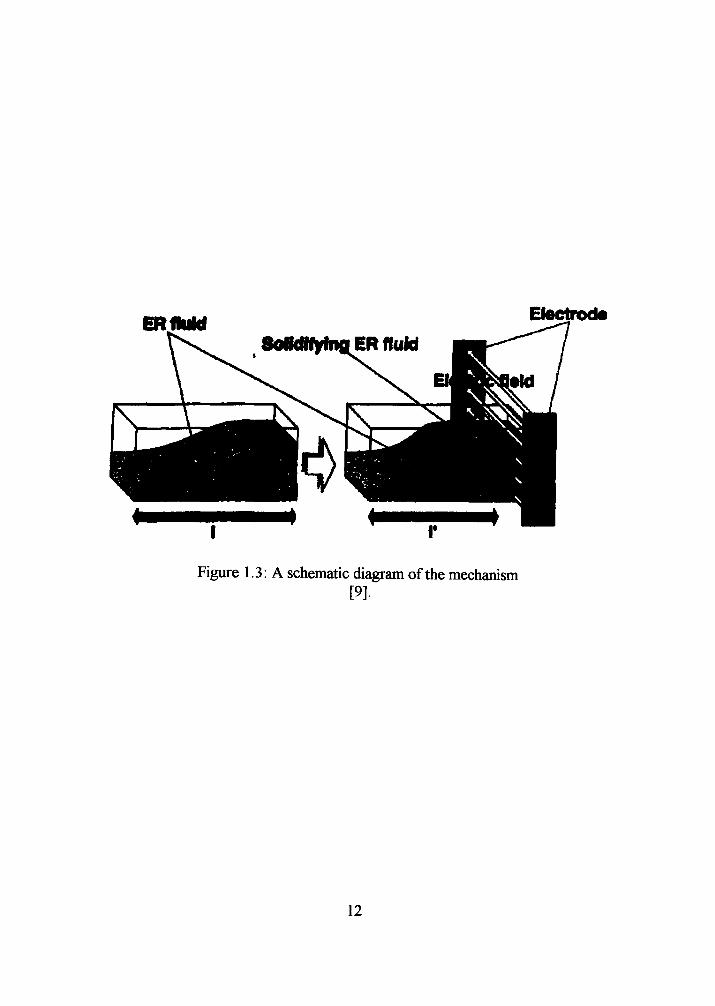
ERIIuM Eleetroda
Figure 1.3: A schematic diagram of the mechanism [9].
12
N
N-l
2
1
Figure 1.4: N-Floored building with absorber [39].
13

Figure 1.5: Pendulum-type absorber [18].
14
Impact _ ^ 1 —d/2 damper^
i±l
En a I
IS^^-Ml
\\—I r—I I— '^— 3 • 2 • 1
Figure 1.6: Experimental setup for impact vibration absorber model [33].
15
o_n O O P •< • < »
(a) (b)
["[AAAAA|W^^|AAMAn Q n (c)
Figure 1.7: Types of impact vibration absorbers (a) single-unit IVA, (b) multi-unit IVA, (c) hybrid IVA, (d) compound IVA
[23].
16

Self-excitation '^^••^^ "^^
(a)
I—Ai n-^2 |< *\* *\^%
Self-excitation 7$^ 7 ^
(b)
Figure 1.8: IVA models [25].
17
x<0 x = 0
COSoit
k=1
DUX i
/7777^^7777777^7777
Figure 1.9: FVA model [40].
18
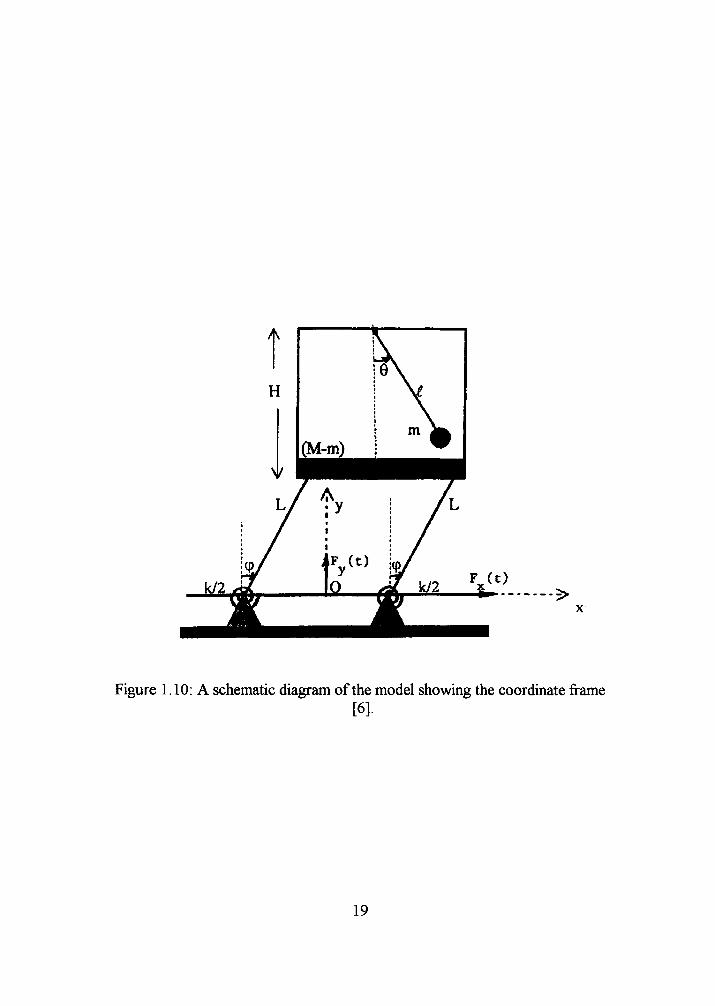
Figure 1.10: A schematic diagram of the model showing the coordinate frame [6].
19

• ^ sm fl/
Figure 1 IT Model of multi-unit impact damper [41].
20
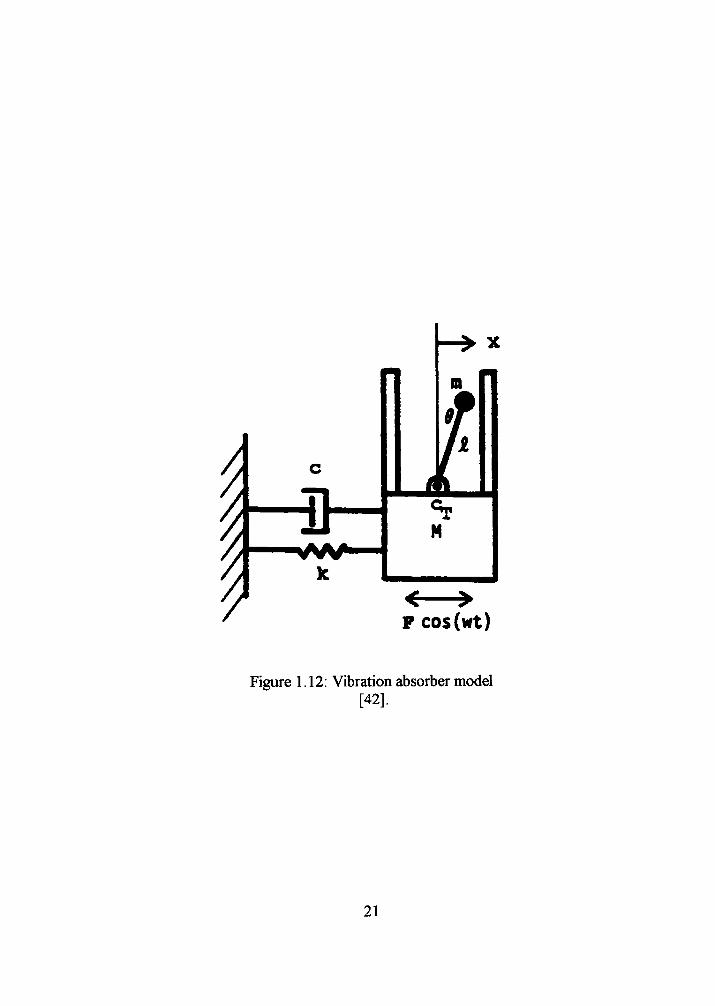
Figure 1.12: Vibration absorber model [42].
21
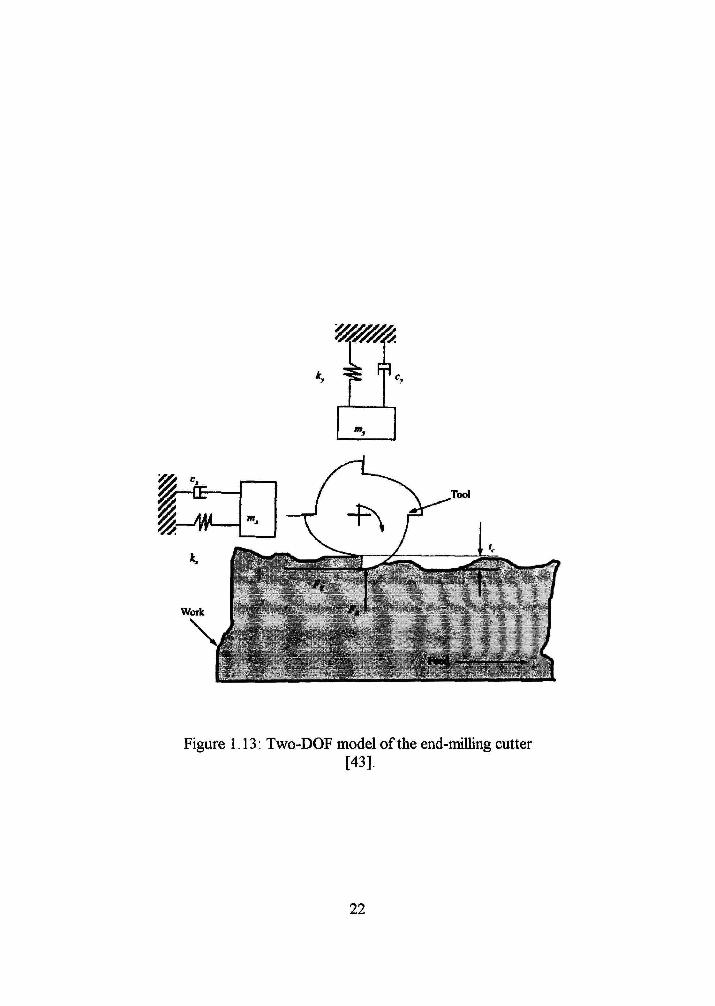
Figure 1.13: Two-DOF model of the end-milling cutter [43].
22

X
0-^
\^XV<5:XNX (a)
V^VVCN:^^^ (b)
Figure 1.14: Dynamical models of percussion machine and its interaction with tool and operator
[44].
23
(a)
L±l
Q
(b)
Figure 1.15: Experimental setup with (a) single-DOF primary system (b) two-DOF primary system
[34].
24
6 8
8 7 6 rh -fWr :JU
Figure 1.16: Experimental setup for IVA [45].
25

At, Cf I
y = A sin(27i ft) Figure 1.17: Pendulum-type IVA model
[46].
26
Direction of vibration ^ ^ — ^ ^ Pylon lodel
Praie
re rope
Brass leight (30^.60gf)
Bard rubber cushion
(units:an)
Figure 1.18: IVA model on the pylon model in laboratory [36].
27
1900
Hard rubber cushion
Weight
(units : nn)
Figure 1.19: The FVA installed in the bridge pylon [36].
28
Fo cos(wt+«<)
M
/rnunf/Tu Figure 1.20: FVA model with impacting ball
[47].
29
(a)
"3
_ C
• m
0 ,'
Y3
(b) TTTT
vs
(c),
• J " ^ 1
u~Tr
Figure 1.21: IVA model for different locations of impact mass [48].
30

'^^^^^^ T 777-
Figure 1.22: IVA model with shot-filled container [49].
31
Vibration controller
Vibration exciter b. fa
mymwmm^zzzs^
y////////////////^^^^^ V
Figure 1.23: Experimental setup [50].
32

Mf}. xid
" I I I ^ v
t i y > Foundation
Figure 1.24: Mechanical model of IVA [50].
33
sin<Kt
Figure 1.25: Two-DOF FVA model [51].
34
—lk-d/2 12
1 1
10
9 JJL
s
(a)
^
Figure 1.26: Experimental setup for FVA [37].
35
CHAPTER 2
EXPERIMENTS
2.1 Introduction
Two different models, simple and compound IVA models were designed to
conduct experiments. To conduct experiments a variety of mechanical and electronic
equipments from different manufacturer companies were installed to the models. Each of
the equipment had to be setup properly in order to get best results. Experiments were
conducted with and without IVA in order to study the absorption efficient of the each
rVA model. Additionally, some system parameters were studied in order to observe their
effect on the absorption. These parameters that studied were length of the impact
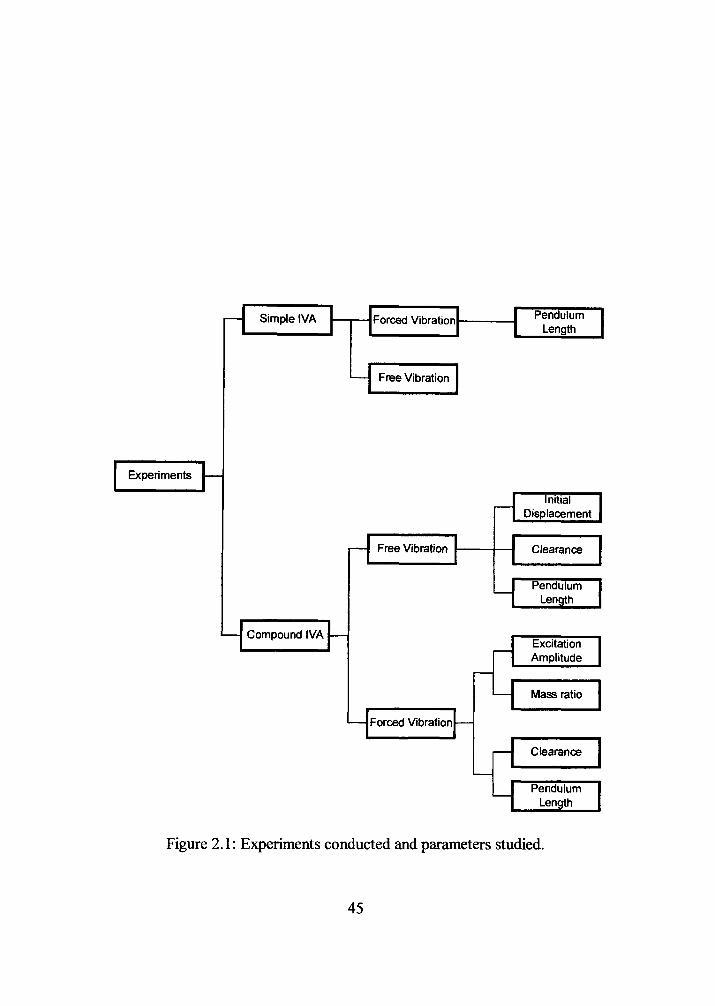
pendulum, mass ratio, excitation amplitude, and clearance between impact walls. Figure
2.1 shows a chart of experiments that were conducted.
2.2 Experimental Setup
2.2.1 Introduction
Figure 2.2 shows the layout of experimental setup. The setup consists of (a) signal
generator controller, (b) amplifier, (c) shaker, (d) accelerometer, (e) signal conditioner,
(f) primary structure, (g) absorber, and (h) acquisition and analysis system.
PC-based digital vibration controller was used for signal generation and driving
the MB Dynamics Model S6K power amplifier, which supplied power to the MB
Dynamics Model CIO the shaker. Controller got feedback signal from the PCB
Piezotronics accelerometer attached on the shaker. The shaker was connected to the
primary structure to excite it horizontally. Displacement data was collected by
accelerometer, which was attached to the second floor of the primary structure. All of the
accelerometers were powered by signal conditioners. The accelerometer attached to the
primary structure was cormected to National Instruments AT MIO-16E-2 data acquisition
board that was installed to a Personnel Computer. The data is analyzed with the same
computer by using LabVIEW Version 6i software. Additionally an MEM Type CEA-06-
36
250UR-350 strain gage was attached on one of the beams of primary structure to
determine the initial displacement applied to the model in transient vibration experiments.
2.2.2 Signal Generator and Control
The signal generator used in this study was part of a complete vibration control
system from Data Physics Corporation [52]. The signal generator was able to produce
five kind of signals, namely, random, sine, classical shock, sine-on-random, and random-
on-random. In this study, only the sine wave was used for the forced vibration
experiments. The signal generator user interface was based on Windows NT, and was
arranged with straightforward dialog boxes, pull down menus, and a toolbar for quick
access to editors and tables. The generator was programmable for frequency sweep
experiments for a duration defined by number of sweeps or time, and frequency dwell
experiments at a series of frequencies. The required input parameters for the sweep
experiments included: excitation amplitude, start- and end-frequency, up or down sweep,
and sweep rate. The required input parameters for the dwell experiments included:
excitation amplitude, and dwell or excitation frequency.
The controller used was model SignalCalc 550 from Data Physics Corporation
[52]. This controller allowed for closed loop vibration control that required a large
amount of real time computations. In controller, this computational load is spread over
multiple 40 MHz digital signal processors (DSP). Three DSPs support each set of four
charmels. With distributed processing, the controller maintained gap free (real-time)
operation regardless of the number of input charmels. Differential inputs on all charmels
eliminate potential ground loop problems and provide a high level of protection against
noisy environments. The specifications of the controller were:
- 40 MHz, Floating Point DSP,
- Output Ranges: Programmable 0 to ± 10 Volt,
- Dynamic Range: Greater than 92 dB,
- ADC Type: 18-bit successive approximation,
- DAC Type: 16-bit successive approximation.
37
The controller controlled the shaker by continuously measuring the acceleration
of the shaker table and comparing this response to the desired acceleration. The desired
acceleration is the value calculated by the controller required for the specified zero-to-
peak displacement during the period of the specified sine wave. For this purpose an
accelerometer was connected to shaker table to get feedback signal to the PC-based
digital controller. Displacement either acceleration signal was chosen as the feedback
signal depending on the experiment that was conducted. The reason for this was the
difference in performance of the controller for different experiments using different
feedback signals. When the displacement signal was chosen for feedback signal it was
converted to acceleration in the process of comparing it to desired acceleration by
controller. After the process of comparing accelerations the required driving volts were
calculated and supplied to the shaker by the help of an amplifier connected to both PC-
based digital controller and shaker.
2.2.3 Amplifier
A power amplifier used in this study was model S6K from MB Dynamics [53].
The signal from the signal generator was transmitted to the amplifier. The amplifier was
designed for use with electrodynamic shakers operating in Random, Shock or Sine test
modes. The parameters that could be set at the amplifier were type of operation mode and
the gain. The type of mode used in this study was sine. The gain of the an^lifier was set
to a medium level and was not changed through out the whole experimental study.
2.2.4 Shaker Table
The shaker table used in this study was of the electrodynamic type, model CIO,
produced by MB Dynamics [53]. It is a high-frequency vibration exciter. Forced-air
cooling provides eflBcient cooling for continuous operation at rated force. The
performance ratings are as follows:
- Force Output; 1200 lbs. Vector (continuous duty sinusoidal input), 850 lbs.
rms (noise testing 15 - 2000 cps bandwidth), 2550 lbs. peak (noise testing
15 - 2000 cps bandwidth)
38

- Frequency Range; 2 to 3000 cps
- Total Table Displacement; 1 in. (±1/2") between stops, continuous rating
±1/2" except as limited by 70 in. / sec. Velocity or 1200-lb. Force.
Shaker table was connected to the experiment model by using bolts and was used
to excite the model in the specified frequencies and amplitudes.
2.2.5 Experimental Models
Figure 2.3 shows simple IVA model that was studied. The simple FVA model was
designed and modeled by the mean of 3D modeling software Pro/Engineer 2001 which is
a product of PTC, Parametric Technology Corporation [54]. Figure 2.4 shows the model
that has been created in Pro/Engineer. It was a structure that consisted of two floors with
the first floor (base) attached to the shaker by bolts. The base was mounted on four
wheels and it was constrained in such way that it could move only in one axis. The shaker
excited the base horizontally. In this study, the second floor will be referred to as the
primary mass. The primary mass was mounted on four 1.65 mm thick, 25.4 mm wide,
and 220 mm long steel beams, which behaved as leaf springs. The amplitude response of
the primary mass to the excitation was studied. Impact walls were attached to the primary
by using bolts. These impact walls could be moved to adjust desired clearance between
them by the means of slots, which are cut in the primary mass.
As shown in Figure 2.3 and 2.4, impact vibration absorber (IVA) consisted of a
pendulum with an impact mass at the end. The impact mass was designed such that it was
possible to add or remove mass easily. A steel frame was built to carry the IVA. The
frame was located in such a position that the IVA hung between impact walls of primary
mass. When the primary mass was excited the FVA impacted with the impact walls and
these impacts reduced the vibration of the system. The IVA could slide on the beam of
the steel frame where it was attached so that it was possible to change the length of the
pendulum. The impact mass which is also referred as the secondary mass (Figure 2.5)
consisted of a main mass of 38.1 mm diameter and mass of an 86 g. Two pairs of 46 g
and 93 g masses could be added to this main mass forming in four different combinations
of secondary masses. Similar or equivalent IVA models are studied previously [23, 33,
39
46]. The simple IVA model is one-degree-of freedom because it can move only in one
axis until impacts start. When amplitude is large enough for impacts to occur, the
interactions between impact mass and primary mass makes the system two-degree-of
freedom. It is a non-linear system because the beams used in the primary structure shows
characteristics of hardening spring [5]. Another reason for non-linearity is sudden
changes in the velocity caused by impacts, which is discussed fiirther in [6].
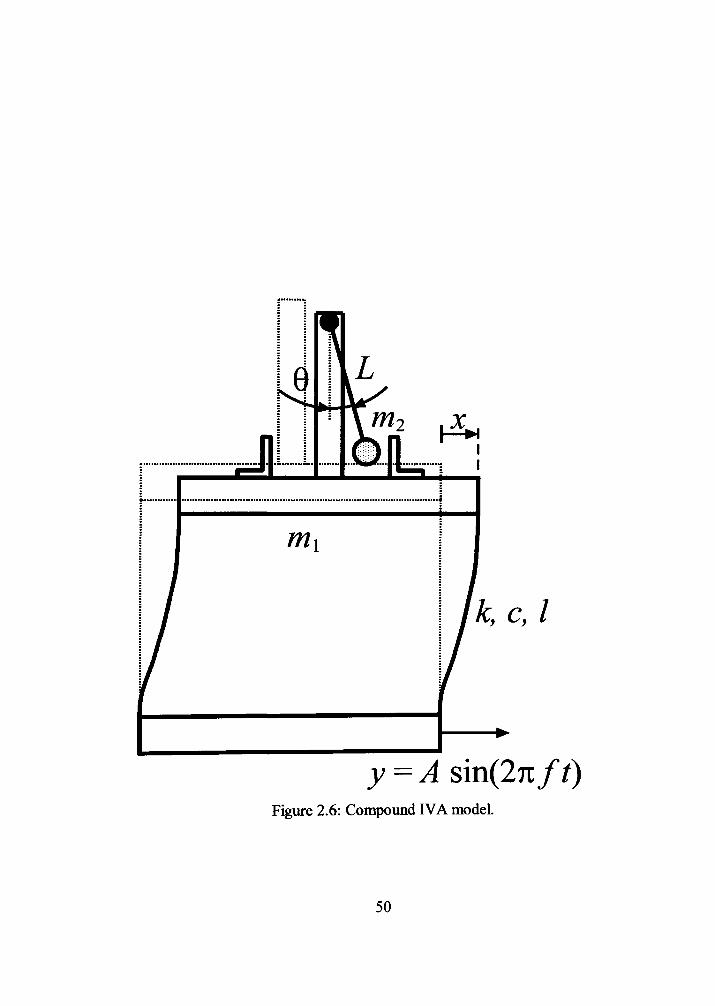
Figure 2.6 shows compound IVA model that was studied. The compound IVA
model w£is also designed and modeled using of Pro/Engineer. The solid model is shown
in Figure 2.7. In the compound IVA model, a square cross-section aluminum beam was
added by using bolts to the primary mass, which was used in simple IVA model. This 270
mm long beam was used to cormect IVA to the primary mass. The IVA consisted of a
pendulum with an infq)act mass same as the one used in simple IVA model The
attachment of pendulum to the aluminum beam was a bearing that was holding pivot
point of the pendulum. The attachment was designed such that it could slide along the
beam allowing different lengths of pendulum. It was designed as light as possible to
minimize the natural frequency difference between the systems that having different
lengths of pendulum. The compound IVA model constituted a two-degree-of freedom
system. Because there are two independent displacement parameters in the equation of
motion including displacement 'x' of the primary mass and angle '0' of secondary mass.
The compound IVA model is a nonlinear system because of the beams used in the
primary structure showing characteristics of hardening spring [5] and the changes in the
velocity caused by impacts [6]. Another reason for non-linearity is coupling effect caused
by swinging pendulum.
2.2.6 Transducers
PCB Piezotronics [55] accelerometers and signal conditioners were used for
control and data acquisition purposes. For each accelerometer suitable signal conditioner
was selected to supply enough voltage to power it. Two different accelerometer models
were used for feedback signal, which were connected to shaker table. PCB Model
353B52 accelerometer that has 490 volts/inch sensitivity is used with a PCB Model
40
480C02 signal conditioner for the experiments that were without IVA. This
accelerometer showed poor performance for the experiments with the IVA because of the
noise that was created by the IVA. So that, a more sensitive PCB Model 353B34
accelerometer which has 99.1 vohs/inch sensitivity with a PCB Model 480B10 signal
conditioner used for the experiments with IVA. This accelerometer and signal conditioner
could use displacement signal instead of acceleration signal as the feedback signal.
Displacement signal has lower noise compared to acceleration signal due to mathematical
derivation that increases noise [56]. PCB Model 350A14 accelerometer that has 490
volts/inch sensitivity was used with PCB Model 480C02 signal conditioner for collecting
displacement data of primary mass. This accelerometer is specially designed for
applications or tests that involve mild impact loading.
2.2.7 Data Acquisition
The data acquisition was performed using LabVIEW software, which was
installed to a personal computer equipped with National Instruments [57] model AT
MIO-16E-2 data acquisition board. The board was connected externally to a cormector
block model SCB-68 also from National Insti-uments. This is a shielded I/O connector
block for interfacing I/O signals to plug-in DAQ devices with 68-pin connectors.
Combined with the shielded cables the connecter block has very low-noise signal
termination. LabVIEW is a graphical programming language specially designed to take
measurements, analyze data, and present results to the user [58]. This software saves a lot
of time in programming compared to traditional programming languages because of its
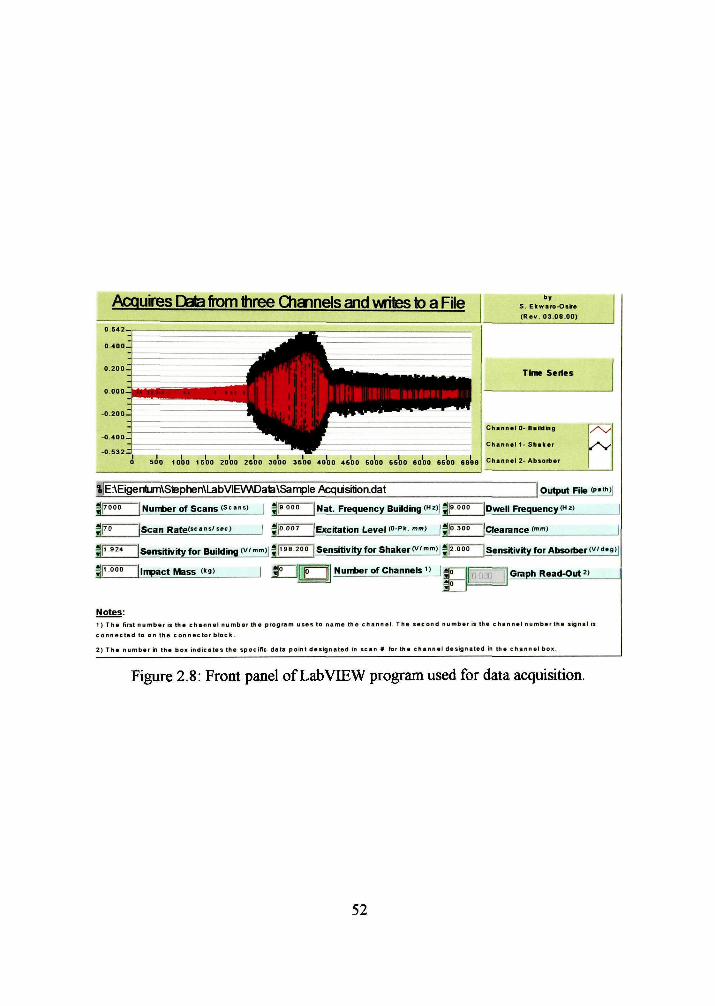
versatile graphical user interface. Figure 2.8 shows a snapshot of LabVIEW program to
collect data. This program enables to collect data from two charmels, dispkicement data
for the primary mass and displacement data for the shaker. Figure 2.9 shows a snapshot
of LabVIEW program for psd calculation. This program enables to calculate tiie psd of
collected data for transient vibration experiments to determine the natural frequency of
the system. Figure 2.10 shows a snapshot of LabVIEW program for analyzing the
collected data. It filters the noise from the raw data and reorganizes it in the desired way
to present it.
41
2.3 Experimental Methodology
2.3.1 Introduction
For simple IVA model the natural frequency was tuned to approximately 7.5 Hz
with the IVA not activated. For compound IVA model the natural frequency was tuned
when impact pendulum was locked. The impact pendulum natural frequency was 1 Hz
for longest length of pendulum. So the natural frequency ratio was around 0.134. Due to
change in attachment point of pendulum there was a small difference in natural frequency
while conducting experiments for different lengths of impact pendulunL This difference
was minimized by designing a very light attachment. For each system that was using
different parameters natural frequencies were recorded in the experiment table in the
Appendix A. For each experiment a data acquisition rate of 70 scans/sec was used. This
scan rate was chosen to avoid aliasing [3].
Transient vibration experiments were conducted with initial displacements
applied to the primary structure to conduct for both of the IVA models to study
characteristics of the decay and inclination of different system parameters. Two kinds of
forced vibration experiments were carried out, namely, dwell and sweep experiments. It
was observed that dwell experiments were more accurate compared to sweep
experiments. So, most of the parametric studies were done by conducting dwell
experiments. However, it was easier to see characteristics of primary mass amplitude
response by using sweep data. Downsweep experiments were also conducted to confirm
dwell experiments. To keep track of experiments an experimental table that is shown in
appendbc is created by MS Excel. In this experiment table it is possible to see the values
of each parameter for each experiment that was conducted.
2.3.2 Transient Vibration
Desired initial displacements were applied to the primary structure to conduct
transient vibration experiments for both of the IVA models. This was done by pulling the
primary structure until the desired value was read from the strain gage that was attached
to one the beams of the primary structure. This experiment was conducted with and
42
witiiout simple IVA to see characteristics of the decay. For the compound IVA model a
parametric study was performed in order to see the inclination of different parameters
such as length of pendulum and clearance between impact walls. Four length, four
clearance, and four initial displacements were used in transient experiments on compound
IVA model. While conducting a study on one of the parameters other parameters were
kept constant. Details of parameters that were used in experiments are shown in the
experiment table in the appendix.
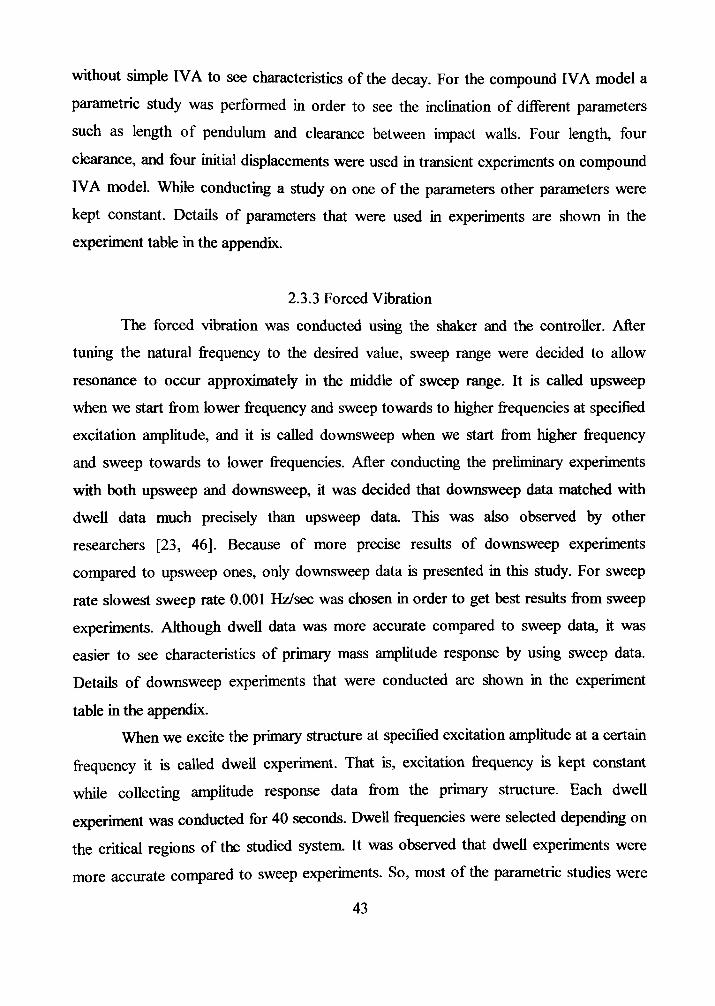
2.3.3 Forced Vibration
The forced vibration was conducted using the shaker and the controller. After
tuning the natural frequency to the desired value, sweep range were decided to allow
resonance to occur approximately in the middle of sweep range. It is called upsweep
when we start from lower frequency and sweep towards to higher frequencies at specified
excitation amplitude, and it is called downsweep when we start from higher frequency
and sweep towards to lower frequencies. After conducting the preliminary experiments
with both upsweep and downsweep, it was decided that downsweep data matched with
dwell data much precisely than upsweep data. This was also observed by other
researchers [23, 46]. Because of more precise results of downsweep experiments
compared to upsweep ones, only downsweep data is presented in this study. For sweep
rate slowest sweep rate 0.001 Hz/sec was chosen in order to get best results from sweep
experiments. Although dwell data was more accurate compared to sweep data, it was
easier to see characteristics of primary mass amplitude response by using sweep data.
Details of downsweep experiments that were conducted are shown in the experiment
table in the appendix.
When we excite the primary structure at specified excitation amplitude at a certain
frequency it is called dwell experiment. That is, excitation frequency is kept constant
while collecting amplitude response data from the primary structure. Each dwell
experiment was conducted for 40 seconds. Dwell frequencies were selected depending on
the critical regions of the studied system. It was observed that dweU experiments were
more accurate compared to sweep experiments. So, most of the parametric studies were
43

done by conducting dwell experiments. Details of dwell experiments that were conducted
are shown in the experiment table in the Appendbc A.
44
Simple IVA Forced Vibration
Free Vibration
Pendulum Length
Experiments
Compound IVA
Free Vibration
Forced Vibration
Initial Displacement
Clearance
Pendulum Length
Excitation Amplitude
Mass ratio
Clearance
Pendulum Length
Figure 2.1: Experiments conducted and parameters studied.
45

Figure 2.2: Experiment setup: (a) signal generator contioller, (b) amplifier, (c) shaker, (d) accelerometer, (e) signal conditioner, (f) primary structure, (g) absorber, and (h)
acquisition and analysis system.
46
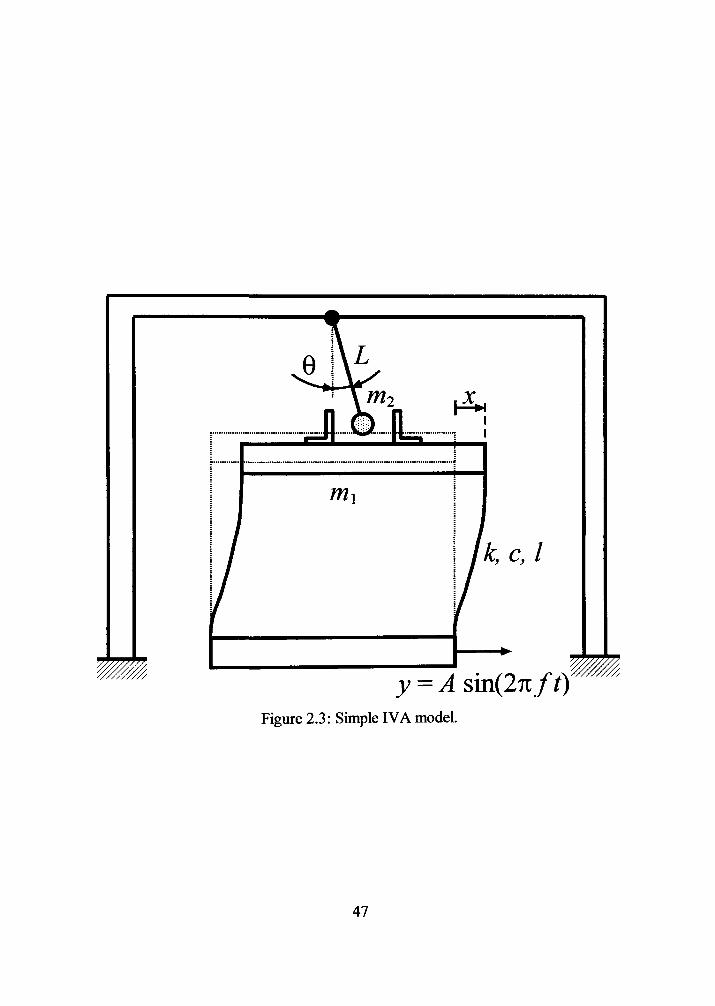
y = A sin(27i/0 Figure 2.3: Simple IVA model.
47
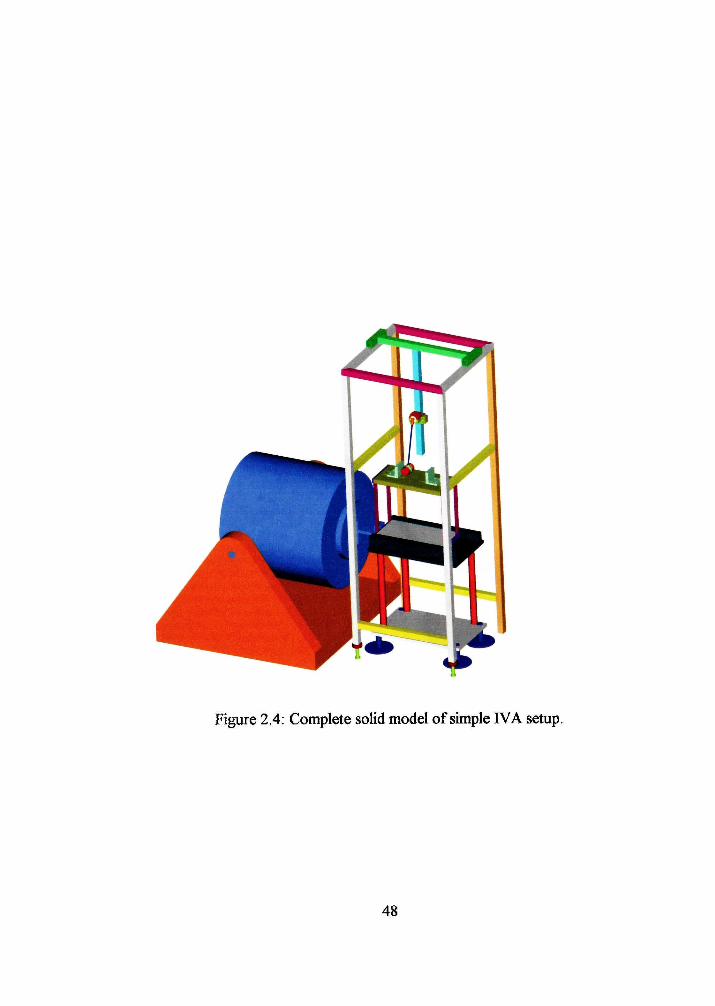
Figure 2.4: Complete solid model of simple FVA setup.
48
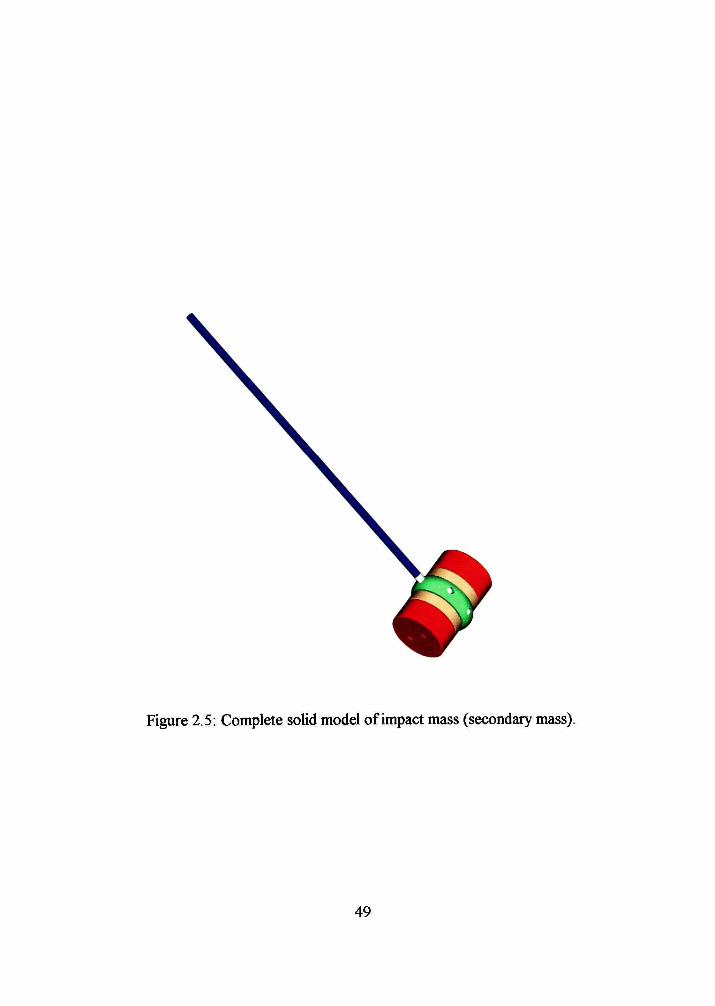
Figure 2.5: Complete solid model of impact mass (secondary mass).
49
AC, Cf I
y = A sm(2nft) Figure 2.6: Compound IVA model.
50
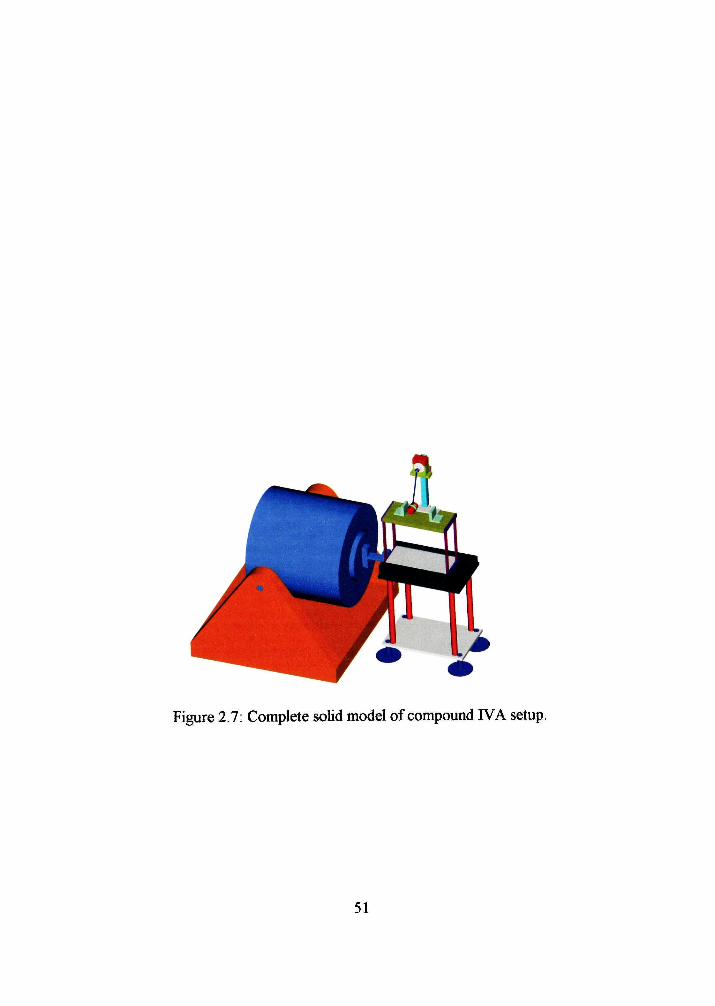
Figure 2.7: Complete solid model of compound FVA setup.
51
Acquires Dab from three Channels and writes to a File
D . 4 0 0 -
0 . 2 0 0 -
0 . 0 0 0 -
0 . 2 0 0 -
_
W^ '' ll 1
k : 1 1
iii'' llHIIIIIIililMilliiiiiMi
by S. Ehwaro-Osve (Rev. 03.08.00)
Time Series
Ctiannal 0- Building
Channel 1- Shaker
Channel 2- Absorber
%|E:\EigentiJm\Stephen\LabVIE\AADate\SampleAcquisition.dat Output File <!"•'
g|70oo |Nunt)erof Scans'S""') | |9 00° |Nat. Frequency Building ("'J^i^ooo |Dwell Frequency'"')
[Scan Rate("'"»^"') gjooo? [Excitation Level "-PI''""") j^l"-^"" [Oearance'""")
a|i.924 Isensitivityfor Building'V'""")|^P° ^°° |SensitivityforSliaker(v''""')^;2 °°° "|Sensitivityfor Absorticr(v''''9)
gp-'"'° Impact Mass fa) ^ ^ 1 |5 1 Nunt)er of Channels') Graph Read-Out )
Notes: 1) The first number is the channel number the program uses to name the channel. The second number is the channel number the signal is
connected to on the c onnector block .
2) The number in the box indicates the specific data point designated in scan « for the channel designated tn the channel box-
Figure 2.8: Front panel of LabVIEW program used for data acquisition.
52

Generates PSD of 3 Channel Data by S. Ekwaro-OsfiB
Raw Data
Building
1.0E-2..
1.0E-4.S
i l l l l l l l l l l l l l l l l l l I I I I I I I I I I I I I I I I I I l l l l l l l l l 0.0 2.0 4.0 6.0 8.0 10 0
Shaker oE+o_
1 .0E -2 -
1.0E-4_
1.0E-6_
0 0 2 0 4 0 6.0 8.0 10.0
| i M i n t I I I n i l I I I I I I I I I I I I I I I I I I I I I Mil ( K ' K i r i r i 0.0 0.2 0.4 0.6 O.a 1.0
Absoiber .oE*o_r
l i l t ti MM f i r I I I 0.0 2.0 4.0 6.0 8.0 10.0
%|E:\Bgenlum\Stephen\LabVIEV\AData\sampleda1a.dat Input file IP"")
(7s i N u n t e r of Scans ( S " " ' ) | |° ° ° ° J Nat. Frequency BuiMing ("')| |9 ooo |Dwell Frequency ("')
|7o I Scan Rate*" • " " " ' ) I |o.°°7 |Excitation Leveic-P"''") | |° aoo jciearancefi")
fi"^^^ Isensitwityfor Building 0"''<^\ |1 °°° [Sensitivity for Shaker t^'") | |i ooo |sensitivityforAt)sort)er('"'''8)
g|7oooo-| MaxinumPata Points] | ' ° °° jlirpact Mass "•) 1' [Total Points Ptotted(P") J
Figure 2.9: Front panel of LabVIEW program used for psd calculation.
53
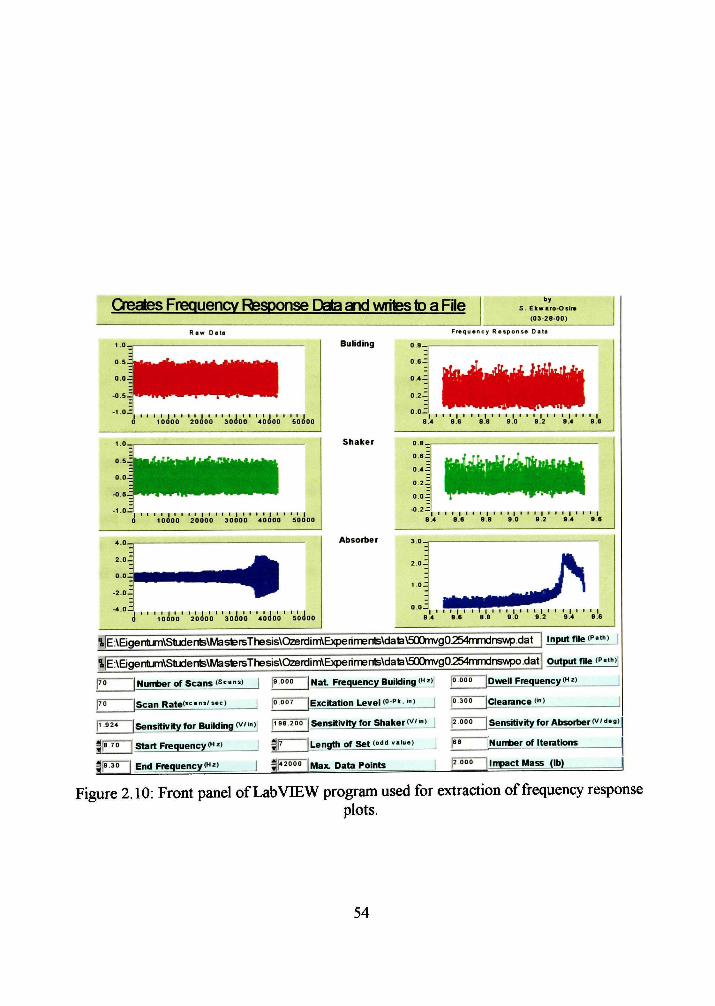
Creates Frequency Response Data and writes to a File by S. Ekw aro-Osire
(03-28-00)
Frequency Response Data
Building
Shaker
I I I t I I I I I I t I I I I I I I I J I I I I J 10000 20000 30000 40000 SOQOO
^|E:\Bgerilijn\S1udent5\MastereThesis\CterdimVExperirnerte\data\50OTwg0-254mmdrTswp.dat | input file (P"")
t|E:\BgerTlLim\Studerils\MastereThesis\OzerdimVExperimenls\dafa\500mvg0254mmdnswpo.dat| Output file tP'""|
p° I Nunter of Scans (Scans) | |Ooo
|7o Iscan Rate(»""='"') | 1° •""
P_°f<_Jsensitivity for Building (v'i")| l'°»-"°
|8 7° I Start FrequencylH^) | ^F
|8 30 I End Frequency*"') ^142000 -JL-
Nat Frequency BuiMing("')i jo ooo [Dwell Frequency*"')
Excitation Level *O-P>• J") | |o 3oo [gearance''")
Sensitivity for Shaker *v' "•) 1 Sensitivity for Absort>er'V'''«o)
Length of Set (°'''' "aiue) | |68 Nunter of Iteiattons
Max Data Points J |2ooo [impact Mass (lb)
Figure 2.10: Front panel of LabVIEW program used for extraction of frequency response plots.
54
CHAPTER 3
RESULTS AND DISCUSSION
3.1 Introduction
In this chapter results obtained from the transient vibration and forced vibration
experiments are presented. For the transient vibration results on decay characteristics and
the factors affecting the same are presented. In the forced vibration, the results on the
parametric study of factors affecting the response amplitude are presented. The
parameters investigated included pendulum length, clearance, excitation amplitude, and
impact mass.
3.2 Transient Vibration
3.2.1 Natural Frequency
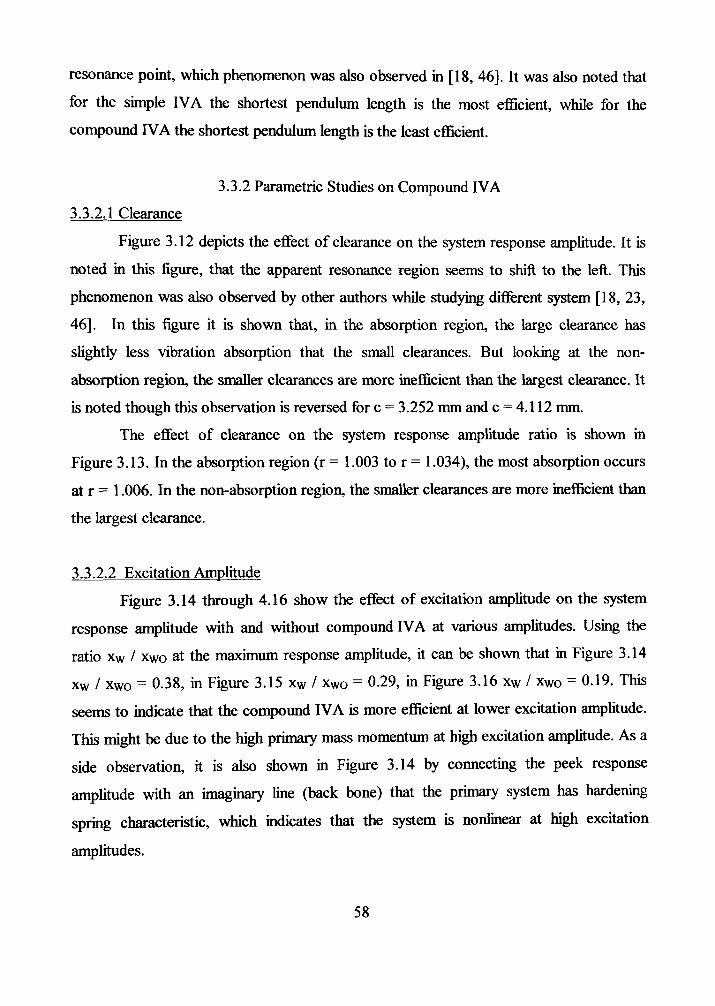
The typical free vibration of the primary system is shown in Figure 3.1. The data
was collected for 10 seconds, after releasing the system from the initial displacement.
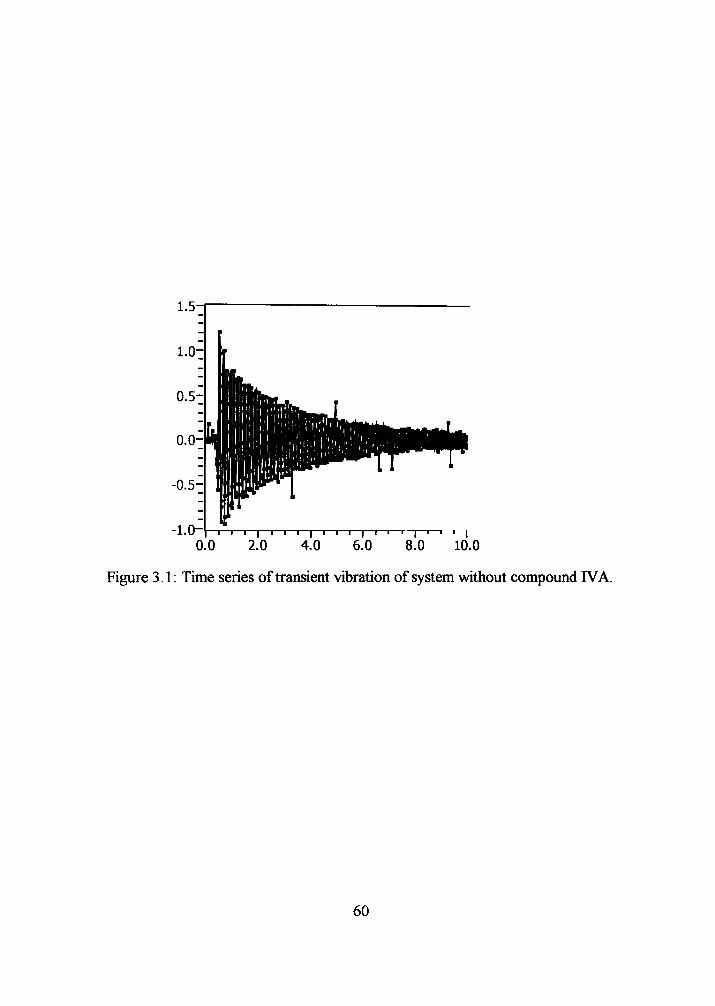
The natural frequency of the primary system was determined by calculating the psd
(Figure 3.2) of the free vibration time series. For this system the natural was determined
to be 7.5 Hz, indicated as a peek in the psd graph. The natural frequency was maintained
for all the experiments run in this study.
3.2.2 Decay Characteristics
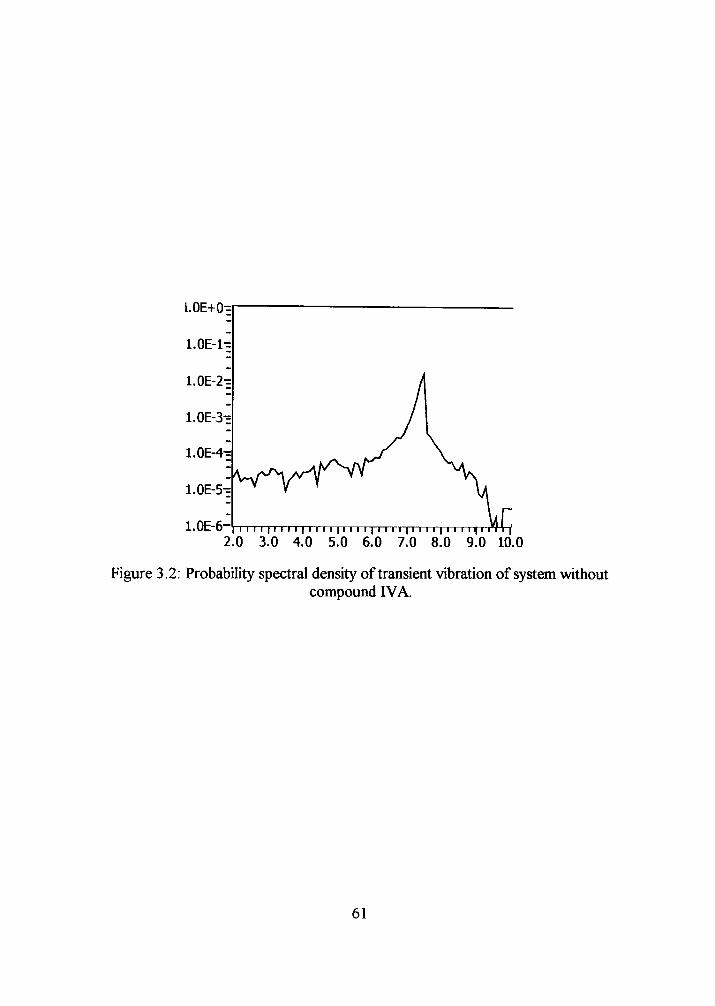
Figure 3.3 depicts the decay characteristics of system transient vibration with and
without simple FVA. The data was collected for 10 seconds. The transient amplitude
response is approximated by a logarithmic fiinction. On the other hand, the amplitude
response for the case when the simple FVA is active, is approximated by a linear line.
This latter result is consistent with results obtained by other researchers [23, 46]. For the
given system parameters, the compound IVA reduced the decay time by approximately
half
The decay characteristics of system transient vibration with and without
compound IVA are plotted in Figure 3.4. The data was collected for 10 seconds. The
55
decay characteristics were well approximated by a logarithmic fimction. In this figure, it
can be seen that when the compound IVA is introduced the vibrations diminish much
fester, which is indicated by a steeper decent. For the given system parameters, the
compound IVA reduced the decay time by approximately half
3.2.3 Parametric Studies on Decay Characteristics
In this section the parameters that affect the decay characteristics were studied.
The data analyzed was reduced from 10 seconds to 3 seconds. Figure 3.5 shows the effect
of length on the decay characteristics of the compovmd IVA. The four data sets were
approximated by linear fimctions. The inclination of the longest pendulvmi (L = 250 mm)
was higher than that of the shortest pendulum (L = 100 mm), with the medium lengths
felling in between these two.
Figure 3.6 depicts the effect of clearance on the rate of decay for the compound
IVA. The largest clearance (C = 4.91 nmi) had the highest inclination and the smallest
clearance (C = 2.11 mm) had the lowest inclination, with the inclinations of the mediimi
clearances falling in between. This result was also observed by other researchers studying
similar impact vibration absorbers [46].
Effect of initial displacement on rate of decay is shown in Figure 3.7. The largest
initial displacement (F = 500 micro strains) had the highest inclination, followed by F =
400 micro strains, then F = 320 micro strains, and F = 256 micro strains. This is due the
higher impacts caused by large initial displacements. This results is consistent with that
observed by other researchers [46].
3.3 Forced Vibration
3.3.1 Pendulum Length Effect
3.3.1.1 Simple IVA
Figure 3.8 depicts the effect of pendulum length on the system response
amplitude. In this figure it is observed that on the introduction of the impact mass, the
apparent system resonance seems to shift to a new location (approximately f = 7.40). In
the absorption region, the simple IVA absorbs the vibrations. In this region it is observed
56
the pendulum length has minimal influence on the absorption characteristics. This
absorber is inefficient in the region out of the absorption range. Around / = 7.40 the
pendulum length has impact on the absorption characteristics of the simple IVA. Around
this frequency, the longest pendulum length (L = 250 mm) is the least eflBcient, followed
by L = 200 mm, then L = 150 mm, and lastly L = 100 mm.
Figure 3.9 depicts the effect of pendulum length on the system response
amplitude ratio. In this figure the absorption region is defined as r = 0.994 to r = 1.030. In
this figure, the absorber is most effective at r = 1.005, and least eflBcient at r = 0.984. In
the least eflBcient region, the length clearly impacts the absorption characteristics. In this
region increasing the pendulimi length increases the ineflBciency of the absorber.
To verify the shift in the amplitude response with IVA, downsweep experiments
were conducted. Figure 3.10 depicts the downsweep experiments plotted with the dwell
experiments. For the anq)litude response with IVA the parameters used were L = 200
mm, \i = 0.045, D = 4.91 mm. While for the amplitude response without IVA the
parameters used was A = 0.185 mm. From the figure it can be seen that the downsweep
data matched the dwell data, thus confirming the apparent shift in the resonance point.
3.3.1.2 Compound IVA
Figure 3.11 shows the effect of pendulum length on the system response
amplitude. In this figure clearly the pendulum length has an effect on the absorption
characteristics of the compoimd IVA. For aU lengths, the most absorption occurs at the
resonance regions. It is observed that the longest pendulum length (L = 250 mm) is the
most eflBcient, followed by L = 200 mm, then L = 150 mm, and lastly L = 100 nmL
3.3.1.3 Comparisons
From Figure 3.8 and 4.11, it is observed that the simple IVA (compare to the
compoimd IVA) has a more pronounced ineflBcient absorption region. In fact, the
compound IVA hardly has a clear efficient absorption region. In the respective absorption
region, it is noted that the simple IVA has a more prominent vibration absorption level.
The ineflficient absorption region of the simple IVA is due to the apparent shift of the
57
resonance point, which phenomenon was also observed in [18, 46]. It was also noted that
for the simple IVA the shortest pendulum length is the most efficient, while for the
compound IVA the shortest pendulum length is the least eflBcient.
3.3.2 Parametric Studies on Compound IVA
3.3.2.1 Clearance
Figure 3.12 depicts the effect of clearance on the system response amplitude. It is
noted in this figure, that the apparent resoiance region seems to shift to the left. This
phenomenon was also observed by other authors while studying diflferent system [18, 23,
46]. In this figure it is shown that, in the absorption region, the large clearance has
sUghtly less vibration absorption that the small clearances. But looking at the non-
absorption region, the smaller clearances are more inefficient than the largest clearance. It
is noted though this observation is reversed for c = 3.252 mm and c = 4.112 mm.
The effect of clearance on the system response amplitude ratio is shown in
Figure 3.13. In the absorption region (r = 1.003 to r = 1.034), the most absorption occurs
at r = 1.006. In the non-absorption region, the smaller clearances are more inefficient than
the largest clearance.
3.3.2.2 Excitation Amplitude
Figure 3.14 through 4.16 show the effect of excitation amplitude on the system
response amplitude with and without compound IVA at various amplitudes. Using the
ratio xw / xwo at the maximum response amplitude, it can be shovra that in Figure 3.14
xw / Xwo = 0.38, in Figure 3.15 xw / xwo = 0.29, in Figure 3.16 xw / xwo = 0.19. This
seems to indicate that the compound IVA is more efficient at lower excitation amplitude.
This might be due to the high primary mass momentum at high excitation amplitude. As a
side observation, it is also shown in Figure 3.14 by connecting the peek response
amplitude with an imaginary line (back bone) that the primary system has hardening
spring characteristic, which indicates that the system is nonlinear at high excitation
amplitudes.
58

3.3.2.3 Impact Mass
Figure 3.17 through 3.19 show the eflfect of impact mass on the system response
amplitude with and without compound IVA at various masses. In Figure 3.17 the dwell
data for the response with the IVA is also plotted. It is in good agreement with the
downsweep data. It is also noted for the downsweep data at the resonance region the
controllability of the shaker was not smooth as indicated. Using the ratio xw / xwo at the
maximum response amplitude, it can be shown that in Figure 3.17 xw / xwo = 0.77, in
Figure 3.18 xw / xwo = 0.34, in Figure 3.19 xw / xwo = 0.16. This seems to indicate that
the compound IVA is more efficient at larger impact masses. This might be due to the
high relative momentum of the impact mass. These results are in agreement with the
results published by other authors [23,46, 59,60].
59
T—I—I—I 1—I 1 1—I—1—I—I—I—I 1—I—•—I 1 I
0.0 2.0 4.0 6.0 8.0 10.0
Figure 3.1: Time series of transient vibration of system without compound FVA.
60
l.OE-6- I I i I I I 11 I I I I I I I 1111r 1 I
2.0 3.0 4.0 5.0 6.0 7.0 8.0 9.0 10.0
Figure 3.2: Probability spectral density of transient vibration of system without compound FVA.
61
x(V)
0.9
0.8
0.7
0.6
0.5
0.4
0.3
0.2
0.1
0.0
*
•
-
•
,
• \ *
\ \ •
\ ***'-''' ^ b \ . .^^s>.^
\ - ''** >>-o
\ - • • • - . -
1 1 — — - J : — ' • ' • '
a w/o IVA b wIVA
•
• •, ._*
• • " •k
6
Ms) 10 12
Figure 3.3: Decay characteristics of system transient vibration with and without simple FVA (L - 250 mm, n = 0.045, D = 4.912 mm, e = 400 micro-strains).
62
1.0
0.9
0.8
0.7
0.6
X(V) 0 5
0.4
0.3
0.2
0.1 h
0.0
lA
•
•
•
•
\
\ x' \ '^S^
b
*"-*^\.^ a
a w/o IVA b wIVA
6
Ms) 10 12
Figure 3.4: Decay characteristics of system transient vibration with and without compound IVA (L = 250 mm, \i 0.045, D = 4.912 mm, s = 400 micro-strains).
63

1.0
0.9
0.8
0.7
0.6 I-
X(V) 0.5
0.4
0.3 •
0.2 •
0.1 -
0.0
0.5
y = -0.2917x + 1.058
1.0
a b c d
L 100mm
150mm
200mm
250mm
1.5 2.0 2.5
Ms) 3.0
Figure 3.5: Eflfect of pendulum length on rate of decay (Compound IVA, \i = 0.045, D = 4.912 mm, e = 400 micro-strains).
64
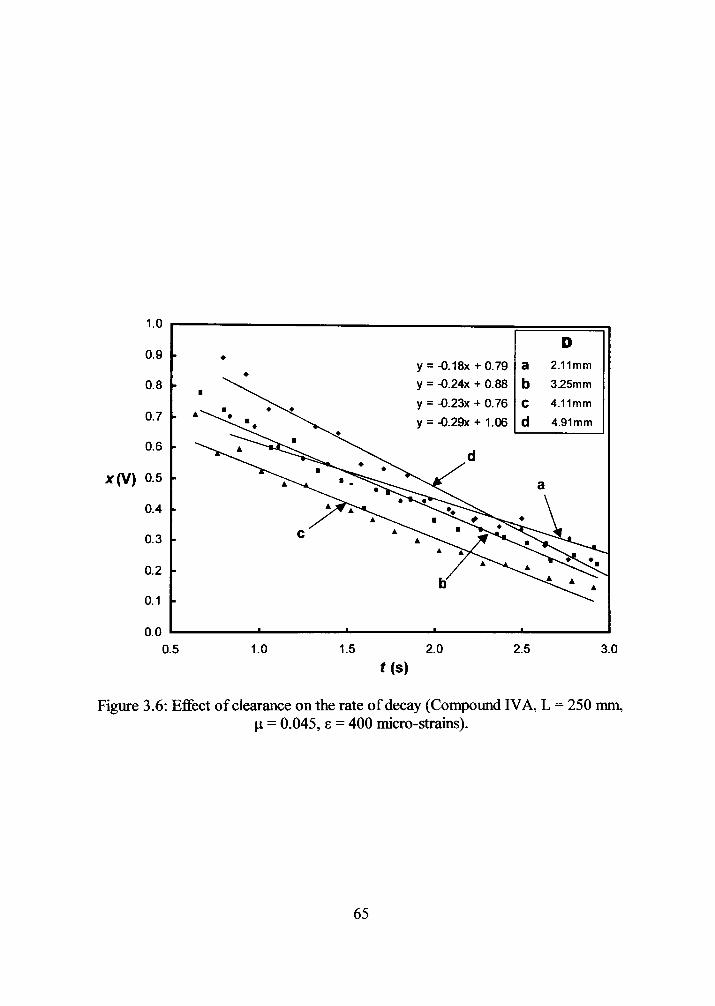
Figure 3.6: Eflfect of clearance on the rate of decay (Compound IVA, L = 250 mm, H = 0.045, 8 - 400 micro-strains).
65
X ( V ) 0.6 •
Figure 3.7: Eflfect of initial displacement on rate of decay (Compound IVA, L = 250 mm, H = 0.045, D = 4.912 mm).
66
I
7.80
Figure 3.8: Eflfect of pendulum length on the system response amplitude (Simple IVA, H = 0.045, D = 4.912 mm, A = 0.185 mm).
67
6.0
5.0
4.0
o
S< 3.0
X
2.0
1.0 -
0.0
•
•
-
d ^
'•ft
6 ^
~~~^fj°^j^ ^
// a \\
a b c d
L 100mm
150 mm
200 mm
250 mm
0.96 0.97 0.98 0.99 1.00 1.01
r
1.02 1.03 1.04
Figure 3.9: Eflfect of pendulum length on the system response amplitude ratio (Simple IVA, ^ = 0.045, D - 4.912 mm, A = 0.185 mm).
68
3.0 Downsweep w/o IVA Downsweep L3
Figure 3.10; Comparison of system response amplitude with and without simple FVA (L = 200 mm, \i = 0.045, D = 4.91 mm, A = 0.185 mm)
69

2.5
2.0
X
1.5
1.0
0.5
0.0 7.30
dl^
a b c d e
L 100 mm
150 mm
200 mm
250 mm
v\//olVA
7.40 7.50 7.60
f(Hz)
7.70 7.80
Figure 3.11: Eflfect of pendulum length on the system response amplitude (Compound IVA, n = 0.045, D = 4.912 mm, A = 0.185 mm).
70

0.0
a b c d e
D
2.11 mm
3.25 mm
4.11 mm
4.91 mm
w/o IVA
7.3 7.4 7.5 7.6
f(Hz)
7.7 7.8
Figure 3.12: Effect of clearance on the system response amplitude (Compound IVA, L = 250 mm, n = 0.045, A = 0.185 mm).
71
I
3.5
3.0
2.5
2.0
1.5 I-
1.0
0.5
0.0
-
•
-
3 * / ' " ^
f b
d \ ^^^^^^^^
a b c d
D 2.11mm
3.25mm
4.11mm
4.91mm
0.96 0.97 0.98 0.99 1.00
r
1.01 1.02 1.03 1.04
Figure 3.13: Eflfect of clearance on the system response amplitude ratio (Compound IVA, L = 250 mm, fi = 0.045, A = 0.185 mm).
72
2.5
2.0
> X
1.5
1.0
• w/ IVA w/o IVA
. • • • • ee • . • • » J % * / • _ ^ * , • : • > > \ • • • • >
0.0 7.1 7.2 7.3
f(Hz)
7.4 7.5
Figure 3.14: Eflfect of excitation amplitude on the system response amplitude with and without Compound IVA (L = 250 mm, n = 0.096, D = 4.91 mm, A = 0.185 mm)
73

2.5
2.0
X
1.5
1.0
0.5
0.0 7.1 7.2 7.3
f(Hz)
7.4 7.5
Figure 3.15: Eflfect of excitation amplitude on the system response amplitude with and without Compound IVA (L = 250 mm, n = 0.096, D = 4.91 mm, A = 0.160 mm)
74

2.5
2.0
1.5
>
1.0
0.5
0.0
• w/ IVA w/o IVA •
•
7.1 7.2 7.3
f(Hz)
7.4 7.5
Figure 3.16: Eflfect of excitation amplitude on the system response amplitude with and without Compound FVA (L = 250 mm, n = 0.096, D = 4.91 mm, A = 0.127 mm)
75

3.0 » Downsweep w/o IVA - Downsweep w/ IVA o Dwell w/ IVA
Figure 3.17: Mass ratio eflfect on the response amplitude with and without compound IVA (L = 200 mm, ^ = 0.045, D = 4.91 mm, A = 0.185 mm).
76
3.0
2.5
2.0
^ 1 . 5
1.0
0.5
0.0
. _ o^
8 O a
O M H B A
1 , , 1
Downsweep w/ IVA
<> Downsweep w/o IVA
L°»°-t o o
A o
1 1
7.1 7.2 7.3 7.4 7.5 7.6
f(Hz)
Figure 3.18: Mass ratio effect on the response amplitude vAth and without compound IVA (L = 200 mm, i = 0.096, D = 4.91 mm, A = 0.185 mm).
77

3.0
2.5
Downsweep w/ IVA
Downsweep w/o IVA
Figure 3.19: Mass ratio eflfect on the response amplitude with and without compound FVA (L = 200 mm, ji = 0.145, D = 4.91 mm, A = 0.185 mm).
78
CHAPTER 4
CONCLUSIONS
For transient vibration involving compound IVAs it was shown that the longest
pendulum (L = 250 mm) was more eflBcient than the shortest pendulum (L = 100 mm).
The largest clearance (C = 4.91 mm) was more efficient than the smallest clearance (C =
2.11 mm). For the largest initial displacement (F = 500 microstrains) the vibrations were
attenuated faster than for the smallest initial displacement (F = 256 microstrains).
The simple IVA (compare to the compound FVA) has a more pronounced
inefficient absorption region. The ineflficient absorption region of the simple FVA is due
to the apparent shift of the resonance pomt. On the other hand the compound FVA hardly
has a clear ineflficient absorption region. In the respective absorption region, it is noted
that the simple FVA has a more prominent vibration absorption level. It was also noted
that for the simple IVA the shortest pendulum length is the most efficient, while for the
compound FVA the shortest pendulum length is the least efficient.
Furthermore, for the compound IVA, it was shown that the smaller clearances are
more ineflficient than the largest clearance. The FVA is more efficient at lower excitation
amplitude, and more eflficient at larger impact masses.
79

REFERENCES
[I] W. T. Thomson, Theory of vibration with applications. Englewood Cliffs, N.J.: Prentice-HaU, 1972.
[2] I. Qqek, Vibration absorbers for flexible structures under random excitation: Theory and experiments. Dissertation, Texas Tech University, 1999.
[3] K. G. McConnell, Vibration testing: Theory and practice. New York: J. Wiley, 1995.
[4] H. Benaroya, Mechanical vibration: Analysis, uncertainties, and control. Upper Saddle River, N.J.: Prentice Hall, 1998.
[5] E. I. Rivin, Stiffness and damping in mechanical design. New York: Marcel Dekker, 1999.
[6] M. A. El-Sayad, S. N. Hanna, and R. A. Ibrahim, "Parametric excitation of nonlinear elastic systems involving hydrodynamic sloshing impact," Nonlinear Dynamics, vol. 18, pp. 25-50, 1999.
[7] J. Q. Sun, M. R. Jolly, and M. A. Norris, "Passive, adaptive and active tuned vibration absorbers - a survey," Journal of Mechanical Design, vol. 117, pp. 234-242, 1995.
[8] Y. K. Kang, J. Kim, and S. B. Choi, "Passive and active damping characteristics of smart electro- rheological composite beams," Smart Materials & Structures, vol. 10, pp. 724-729, 2001.
[9] D. Sakamoto, N. Oshimo, and T. Fukuda, "Tuned sloshing damper using electro-rheological fluid," Smart Materials & Structures, vol. 10, pp. 963-969, 2001.
[10] L. B. Tentor and A. L. Wicks, "Electromagnetic tuned dynamic vibration absorber - experimental characterization.," in International Modal Analysis Conference, 2001, pp. 1048-1053.
[II] R. J. Nagem, S. I. Madanshetty, and G. Medhi, "An electromechanical vibration absorber," Journal of Sound and Vibration, vol. 200, pp. 551-556, 1997.
[12] D. Filipovic and D. Schroder, "Bandpass vibration absorber," Journal of Sound and Vibration, vol. 214, pp. 553-566, 1998.
[13] S. S. Oueini, A. H. Nayfeh, and J. R. Pratt, "A nonlinear vibration absorber for flexible structures," Nonlinear Dynamics, vol. 15, pp. 259-282,1998.
80
[14] T. Kakinouchi, T. Asano, K. Tanida, and N. Takahashi, "Active mass damper demonstration for ship vibration reduction," Naval Engineers Journal, vol. 104, pp. 46-52, 1992.
[15] K. Nonami, H. Nishimura, and W. Cui, "Disturbance cancellation control for vibration of multi-degree-of-freedom systems (case of using active vibration absorber and active dynamic vibration absorber)," JSME International Journal, vol. Series C, pp. 86,1994.
[16] G. Genta, Vibration of structures and machines: Practical aspects, 3rd ed. New York: Springer, 1999.
[17] O. Cuvalci and A. Ertas, "Pendulum as vibration absorber for flexible structures: Experiments and theory," Journal of Vibration and Acoustics-Transactions of the Asme, vol. 118, pp. 558-566, 1996.
[18] O. Cuvalci, "The effect of detuning parameters on the absorption region for a coupled system: A numerical and experimental study," Journal of Sound and Vibration, vol. 229, pp. 837-857, 2000.
[19] A. Ertas, O. Cuvalci, and S. Ekwaro-Osire, "Performance of pendulum absorber for a nonlinear system of varying orientation," Journal of Sound and Vibration, vol. 229, pp. 913-933,2000.
[20] H. Matsuhisa, R. Gu, Y. Wang, O. Nishihara, and S. Sato, "Vibration control of a ropeway carrier by passive dynamic vibration absorbers," JSME International Journal, vol. 59, pp. 1717-1722, 1993.
[21] R. G. Jacquot, "Supperession of random vibration in plates using vibration absorbers," Journal of Sound and Vibration, vol. 248, pp. 585-596, 2001.
[22] H. Alii, "Passive control of overhead cranes," Journal of Sound and Vibration, vol. 5, pp. 443-459, 1999.
[23] I. C. Desen, Experimental study on an impact vibration absorber. Master's Thesis, Texas Tech University, 2000.
[24] S. Foale and S. R. Bishop, "Biftircations in impact oscillations," Nonlinear Dynamics, vol. 6, pp. 285-299,1994.
[25] S. Chatterjee and A. K. Mallik, "Biftircations and chaos in autonomous self-excited oscillators with impact damping," Journal of Sound and Vibration, vol. 191,pp. 539-562, 1996.
81
[26] S. Chatterjee, A. K. Mallik, and A. Ghosh, "Impact dampers for controlling self-excited oscillation," Journal of Sound and Vibration, vol. 193, pp. 1003-1014, 1996.
[27] W. B. Hu and L. C. Zhao, "Research in the limit cycle and stability of the two-degree-of-freedom nonautonomous impact damper," in Proceedings of SPIE, 1993, pp. 833-837.
[28] R. Ibrahim, M. A. El-Sayad, "Simultaneous parametric and internal resonances in systems involving strong non-linearities," Journal of Sound and Vibration 225, no, vol. 5, pp. 857 (29 pages), 1999.
[29] V. Pilipchuk and R. A. Ibrahim, "The dynamics of a non-linear system simulating liquid sloshing impact in moving structures," Journal of Sound and Vibration 205, no, vol. 5, pp. 593 (23 pages), 1997.
[30] V. N. Pilipchuk and R. A. Ibrahim, "Simulation of liquid sloshing impact in moving structures," Dynamics of Vibro-Impact Systems, pp. 141-150, 1999.
[31] C. N. Bapat and S. Sankar, "Single unit impact damper in free and forced vibration," Journal of Sound and Vibration, vol. 99, pp. 85-94,1985.
[32] F. Collette and S. E. Semercigil, "Response of a light secondary system with a modified tuned absorber to transient excitation," Imac Proceedings of the 16th International Modal Analysis Conference, Vols 1 and 2, voL 3243, pp. 595-601, 1998.
[33] S. Ma and S. E. Semercigil, "A modified passive tuned absorber for secondary systems under random excitation," Journal of Sound and Vibration, vol. 208, pp. 349-366, 1997.
[34] S. E. Semercigil and F. Collette, "Experiments with tuned absorber-impact damper combination," Journal of Sound and Vibration, vol. 256, pp. 179-188, 2002.
[35] F. Collette, D. Huynh, and S. E. Semercigil, "Further results with tuned absorber -impact damper combination," Imac-Xviii: A Conference on Structural Dynamics, Vols 1 and 2, Proceedings, vol. 4062, pp. 404-410,2000.
[36] K. Ogawa, T. Ide, and T. Saitou, "Application of impact mass damper to a cable-stayed bridge pylon," Journal of Wind Engineering and Industrial Aerodynamics, vol.72,pp. 301-312,1997.
[37] P. Hoang and S. E. Semercigil, "A passive controller for the flexible robot arm," in Proceedings of the Engineering Systems Design and Analysis Conference, 1992, pp. 197-202.
82
[38] A. H. Nayfeh and D. T. Mook, Nonlinear oscillations. New York: Wiley, 1979.
[39] M. N. S. Hadi and Y. Arfiadi, "Optimum design of absorber for mdof structures," Journal of Structural Engineering, \o\. 124, pp. 1272-1280, 1998.
[40] S. W. Shaw and P. J. Holmes, "A periodically forced impact oscillator with large dissipation," Journal of Applied Mechanics, vol. 50, pp. 849-857, 1983.
[41] C. N. Bapat and S. Sankar, "Multiunit impact damper re-examined," Journal of Sound and Vibration, vol. 103, pp. 457-469, 1985.
[42] J. Shaw and S. W. Shaw, "The onset of chaos in a two-degree-of-freedom impacting system," Journal of Applied Mechanics, vol. 56, pp. 168-174, 1989.
[43] S. Semercigil and L. Chen, "Preliminary computations for chatter control in end milling," Journal of Sound and Vibration, vol. 249, pp. 622-633 (12 pages), 2002.
[44] V. I. Babitsky, "Hand-held percussion machine as discrete non-linear converter," Journal of Sound and Vibration, vol. 214, pp. 165-182, 1998.
[45] F. S. Collette, "A combined tuned absorber and pendulum impact damper under random excitation," Journal of Sound and Vibration, vol. 216, pp. 199-213, 1998.
[46] S. Ekwaro-Osire and I. C. Desen, "Experimental study on an impact vibration absorber," Journal of Vibration and Control, vol. 7, pp. 475-493, 2001.
[47] D. M. Egle, "An investigation of an impact vibration absorber," Journal of Engineering for Industry, pp. 653-661, 1967.
[48] S. F. Masri and R. K. Miller, "Active parameter control of nonlinear vibrating structures," Journal of Applied Mechanics, vol. 56, pp. 658-666, 1989.
[49] C. Cempel and G. Lotz, "Efficiency of vibrational energy dissipation by moving shot," Journal of Structural Engineering, vol. 119, pp. 2642-2652, 1993.
[50] V. I. Babitsky and A. M.Veprik, "Univers2d bumpered vibration isolator for severe environment," Journal of Sound and Vibration, vol. 218, pp. 269-292, 1998.
[51] M. Kato, M. Dazai, and H. Takase, "Study on impact damper having a spring-supported additional mass," Bulletin of JSME, vol. 19, pp. 103-109, 1976.
[52] Data Physics Corporation, Solutions in signal processing, www.dataphysics.com, 2002.
[53] MB Dynamics, Pioneers of vibration testing, www.mbdynamics.com, 2002.
83
[54] Parametric Technology Corporation, Ptc solutions, www.ptc.com, 2002.
[55] PCB Piezotronics, Industrial vibration monitoring, www.pcb.com, 2002.
[56] S. C. Chapra and R. P. Canale, Numerical Methods for Engineers, 2nd ed. New York: McGraw-Hill, 1988.
[57] National Instruments, Measurement and Automation, www.ni.com, 2002.
[58] J. Travis, Labview for everyone, 2nd ed. Upper Saddle River, NJ: Prentice Hall PTR, 1997.
[59] R. K. Roy, R. D. Rocke, and J. E. Foster, "The application of impact dampers to continuous sytems," Journal of Engineering for Industry, vol. 97, pp. 1317-1324, 1975.
[60] N. Popplewell and M. Liao, "A simple design procedure for optimum impact dampers," Journal of Sound and Vibration, vol. 146, pp. 519-526,1991.
84

APPENDIX: TABLE OF EXPERIMENTS 1
EXPE
RIM
ENT
1
1 2 3 4 5 6 7 8 9 10 11 12 13 14 15 16 17 18 19 20 21 22 23 24 25 26 27 28 29 30 31 3? 33 .34 35 .36 37 38 39 40 41 42 43 44 4'> 46 47 48 49 50
MODEL
c
. i E -o M 0
o
81 81 81 81 81 81 81 81 81 81 81 S I 81 81 82 82 82 82 82 82 82 82 82 82 82 82 S2 82 83 83 83 83 83 83 83 S3 83 83 83 83 83 83 84 84 84 84 84 84 84 84
>> 2 c = S IS c z s
11.
7.523 7.523 7.523 7.523 7.523 7.523 7.523 7.523 7.523 7.523 7.523 7.523 7.523 7.523 7.523 7.523 7.523 7.523 7.523 7.523 7.523 7.523 7.523 7.523 7.523 7.523 7.523 7.523 7.523 7.523 7.523 7.523 7.523 7.523 7.523 7.523 7.523 7.523 7.523 7.523 7.523 7.523 7.523 7.523 7.523 7.523 7.523 7.523 7.523 7.523
MASS
M
is E
--------------
0.086 0.086 0.086 0.086 0.086 0.086 0.086 0.086 0.086 0.086 0.086 0.086 0.086 0.086 0.086 0.086 0.086 0.086 0.086 0.086 0.086 0.086 0.086 0.086 0.086 0.086 0.086 0.086 0.086 0.086 0.086 0.086 0.086 0.086 0.086 0.086
.2 "S . I -
--------------
0.045 0.045 0.045 0.045 0.045 0.045 0.045 0.045 0.045 0.045 0.045 0.045 0.045 0.045 0.045 0.045 0.045 0.045 0.045 0.045 0.045 0.045 0.045 0.045 0.045 0.045 0.045 0.045 0.045 0.045 0.045 0.045 0.045 0.045 0.045 0.045
EXCITATION
tr d-
u. U. X
X S s Ul M
-7.300 7.350 7.400 7.450 7.500 7.520 7.540 7.560 7.580 7.600 7.650 7.750 7.800
-7.300 7.350 7.400 7.450 7.500 7.520 7.540 7.560 7.580 7.600 7.650 7.750 7.800
-7.300 7.350 7.400 7.450 7.500 7.520 7.540 7.560 7.580 7.600 7.650 7.750 7.800
-7.300 7.350 7.400 7.450 7.500 7.520 7.540
d- ,^
•o St c 3 Ul
--. ----------
7.300
-------------
7.300
-------------
7.300
--------
0) o
c 15
UL
-0.970 0.977 0.984 0.990 0.997 1.000 1.002 1.005 1.008 1.010 1.017 1.030
--
0.970 0.977 0.984 0.990 0.997 1.000 1.002 1.005 1.008 1.010 1.017 1.030
--
0.970 0.977 0.984 0.990 0.997 1.000 1.002 1.005 1.008 1.010 1.017 1.030
--
0.970 0.977 0.984 0.990 0.997 1.000 1.002
c
S | E
111
_ 0.185 0.185 0.185 0.185 0.185 0.185 0.185 0.185 0.185 0.185 0.185 0.185 0.185
-0.185 0.185 0.185 0.185 0.185 0.185 0.185 0.185 0.185 0.185 0.185 0.185 0.185
-0.185 0.185 0.185 0.185 0.185 0.185 0.185 0.185 0.185 0.185 0.185 0.185 0.185
-0.185 0.185 0.185 0.185 0.185 0.185 0.185
a
400 _ _ _ _ ---------
400
-------------
400
-------------
400
-------
CLEARANCE AND LENGTH
f l 1 (9
42.3 42.3 42.3 42.3 42.3 42.3 42.3 42.3 42.3 42.3 42.3 42.3 42.3 42.3 42.3 42.3 42.3 42.3 42.3 42.3 42.3 42.3 42.3 42.3 42.3 42.3 42.3
1 42.3 42.3 42.3 42.3 42.3 42.3 42.3 42.3 42.3 42.3 42.3 42.3 42.3 42.3 42.3 42.3 42.3 42.3 42.3 42.3 42.3 42.3 42.3
n O
--_ -----------
4.912 4.912 4.912 4.912 4.912 4.912 4.912 4.912 4.912 4.912 4.912 4.912 4.912 4.912 4.912 4.912 4.912 4.912 4.912 4.912 4.912 4.912 4.912 4.912 4.912 4.912 4.912 4.912 4.912 4.912 4.912 4.912 4.912 4.912 4.912 4.912
S .2 0) HI
--_ ------------
26.551 26.551 26.551 26.551 26.551 26.551 26.551 26.551 26.551 26.551 26.551 26.551 26.551
-26.551 26.551 26.551 26.551 26.551 26.551 26.551 26.551 26.551 26.551 26.551 26.551 26.551
-26,551 26.551 26.551 26.551 26.551 26.551 26.551
il €-« c 01 E
" • 1 150.00 150.00 150.00 150.00 150.00 150.00 150.00 150.00 150.00 150.00 150.00 150.00 150.00 150.00 250.00 250.00 250.00 250.00 250.00 250.00 250.00 250.00 250.00 250.00 250.00 250.00 250.00 250.00 200.00 200.00 200.00 200.00 200.00 200.00 200.00 200.00 200.00 200.00 200.00 200.00 200.00 200.00
150.00 150.00 150.00 150.00 150.00 150.00 150.00 150.00
85

II EX
PERI
MEN
T |
61 52 53 64 56 66 6 / 58 59 60 61 62 63 64 65 66 67 68 69 70 71 72 73 74 75 76 77 78 79 80 81 82 83 84 85 86 87 88 89 90 91 92 93 94 95 9fi 97 9R 99 100
MODEL
IS:S
impl
e C
:Com
poun
d
84 84 84 84 84 84 85 85 85 85 85 85 85 85 85 85 85 85 85 85 C6 C6 C6 C6 C6 C6 C6 C6 06 C6 C6 C6 C6 0 7 C7 C7 C7 C7 C7 C7 C7 07 C7 C7 07 C7 C8 C8 C8 C8
Nat
ural
Fr
eque
ncy
7.523 7.523 7.523 7.523 7.523 7.523 7.523 7.523 7.523 7.523 7.523 7.523 7.523 7.523 7.523 7.523 7.523 7.523 7.523 7.523 7.512 7,512 7.512 7.512 7.512 7.512 7.512 7.512 7.512 7.512 7.512 7.512 7.512 7.498 7.498 7.498 7.498 7.498 7.498 7.498 7.498 7.498 7.498 7.498 7.498 7.498 7.522 7.522 7.522 7.522
MASS
Impa
ct M
ass
M,
(kg)
0.086 0.086 0.086 0.086 0.086 0.086 0.086 0.086 0.086 0.086 0,086 0,086 0,086 0,086 0,086 0.086 0,086 0.086 0.086 0.086 0.086 0.086 0.086 0.086 0,086 0.086 0,086 0,086 0.086 0.086 0.086 0.086 0,086 0,086 0,086 0,086 0,086 0,086 0,086 0.086 0,086 0,086 0.086 0.086 0,086 0,086 0,086 0.086 0.086 0.086
o
M ^
0.045 0.045 0,045 0,045 0,045 0,045 0,045 0.045 0,045 0.045 0.045 0.045 0.045 0,045 0,045 0,045 0.045 0.045 0.045 0.045
------------------------------
EXCITATION
Exc
. Fre
q.
(Sta
rt F
req.
) CD
, (H
z)
7.560 7.580 7,600 7.650 7.750 7.800
-7.300 7.350 7.400 7,450 7.500 7.520 7.540 7.560 7.580 7,600 7.650 7.750 7.800
-7.300 7.350 7.400 7,450 7,500 7,520 7,540 7,560 7,580 7,600 7,650 7,750
-7.300 7.350 7.400 7.450 7.500 7,520 7,540 7.560 7.580 7.600 7.650 7.750
-7.300 7.350 7.400
at N it £. •o Sf c 3 111
-----
7,300
-------------
7.300
------------------------------
Freq
uenc
y R
atio
ri
1,005 1,008 1,010 1.017 1.030
--
0,970 0,977 0.984 0.990 0.997 1,000 1.002 1.005 1.008 1.010 1.017 1.030
--
0.972 0.978 0.985 0,992 0.998 1,001 1.004 1.006 1.009 1.012 1.018 1.032
-0.974 0,980 0.987 0.994 1.000 1.003 1.006 1.008 1.011 1.014 1.020 1.034
-0.970 0.977 0.984
Exc
itatio
n
Am
pl.
A (m
m)
0.185 0,185 0.185 0.185 0.185 0.185
_ 0.185 0.185 0.185 0.185 0,185 0,185 0.185 0.185 0,185 0,185 0.185 0.185 0,185
-0.185 0.185 0,185 0.185 0.185 0.185 0.185 0,185 0.185 0.185 0.185 0.185
-0.185 0,185 0.185 0.185 0.185 0.185 0,185 0,185 0,185 0.185 0.185 0.185
-0.185 0.185 0.185
Initi
al D
ispl
.
-. . . --
400 --_ _ --_ ------
400 ------------
400
------------
400
---
CLEARANCE AND LENGTH
Wal
l-to
-Wal
l G
ap (
mm
)
42,3 42,3 42.3 42.3 42.3 42.3 42.3 42.3 42.3 42.3 42.3 42.3 42.3 42.3 42.3 42,3 42,3 42.3 42.3 42.3 42.3 42.3 42.3 42.3 42,3 42,3 42.3 42.3 42.3 42,3 42.3 42.3 42.3 42.3 42.3 42.3 42.3 42.3 42.3 42.3 42.3 42.3 42.3 42.3 42.3 42.3 42.3 42.3 42.3 42.3
Cle
aran
ce
D(m
m)
4.912 4.912 4.912 4.912 4.912 4.912 4.912 4.912 4.912 4,912 4,912 4.912 4.912 4.912 4,912 4.912 4,912 4,912 4,912 4.912
------------------------------
Cle
aran
ce
Rat
io d
/A
26.551 26.551 26,551 26,551 26,551 26,551
-26.551 26,551 26.551 26.551 26,551 26,551 26.551 26.551 26,551 26.551 26.551 26.551 26.551
------------------------------
Pen
dulu
m
Arm
L
(mm
)
150.00 150.00 150.00 150,00 150,00 150.00 100.00 100.00 100.00 100,00 100,00 100,00 100,00 100,00 100,00 100,00 100,00 100,00 100.00 100.00 250.00 250.00 250.00 250.00 250.00 250.00 250.00 250,00 250,00 250.00 250,00 250,00 250.00 200.00 200,00 200,00 200.00 200.00 200.00 200.00 200.00 200,00 200,00 200,00 200,00 200,00 150,00 150,00 150,00 150,00
86
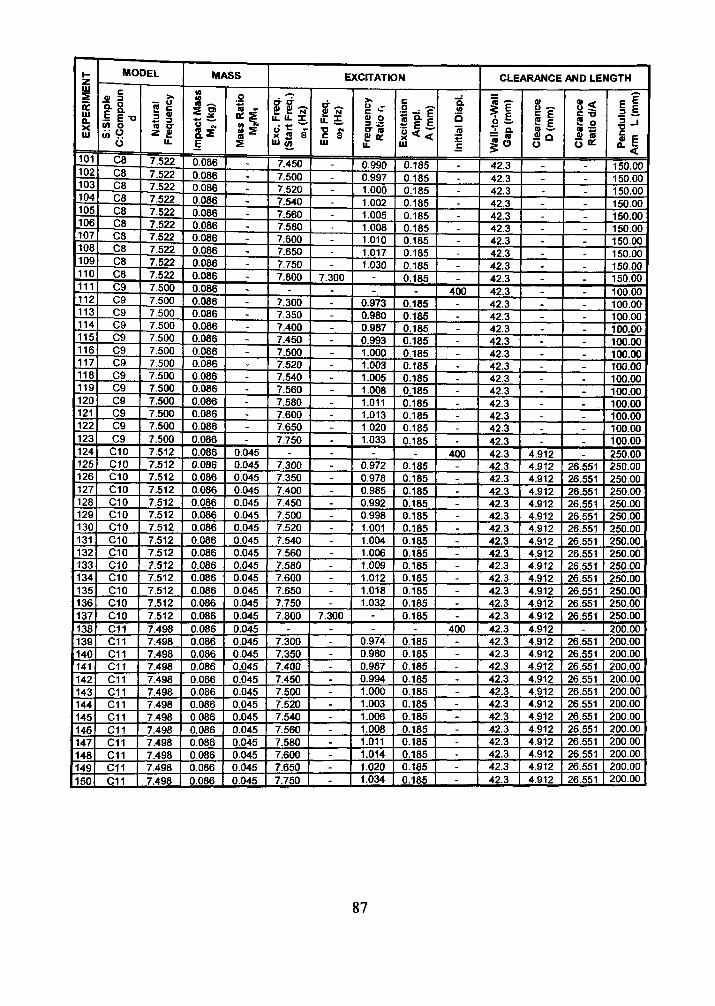
EX
PE
RIM
EN
T
l U l
102 103 104 106 106 10/ 108 109 110 111 112 113 114 115 116 117 118 119 120 121 122 123 124 125 126 127 128 129 130 131 132 133 134 135 136 137 138 139 140 141 142 143 144 145 146 147 148 149 150
MO
IS:S
impl
e C
:Com
poun
C8 08 08 08 0 8 08 0 8 08 08 08 09 0 9 0 9 09 09 09 0 9 0 9 09 09 0 9 0 9 0 9
CIO 010 010 CIO CIO CIO CIO CIO 010 010 010 CIO CIO CIO o i l 011 o i l 011 o i l 011 o i l o i l o i l o i l o i l o i l o i l
DEL
1Nat
ural
Fr
eque
ncy
7,522 7,522 7,522 7,522 7.522 7.522 7.522 7.522 7,522 7,522 7,500 7,500 7,500 7,500 7,500 7,500 7,500 7.500 7.500 7.500 7.500 7.500 7.500 7,512 7.512 7.512 7,512 7,512 7,512 7.512 7.512 7.512 7,512 7.512 7.512 7.512 7.512 7.498 7.498 7.498 7.498 7.498 7.498 7,498 7,498 7.498 7,498 7.498 7,498 7.498
MASS
1Impa
ct M
ass
MI
(kg)
0,086 0,086 0,086 0,086 0,086 0,086 0,086 0,086 0,086 0.086 0.086 0.086 0.086 0.086 0.086 0,086 0,086 0.086 0.086 0.086 0.086 0.086 0.086 0.086 0,086 0,086 0,086 0,086 0.086 0.086 0.086 0,086 0,086 0,086 0,086 0.086 0.086 0.086 0,086 0,086 0.086 0,086 0,086 0.086 0.086 0.086 0.086 0,086 0,086 0.086
.2
is to
-----------------------
0.045 0,045 0,045 0,045 0.045 0.045 0.045 0,045 0,045 0,045 0,045 0,045 0,045 0.045 0.045 0.045 0,045 0,045 0.045 0.045 0.045 0.045 0.045 0.045 0,045 0,045 0,045
EXCrrATION
Exc
. Fre
q.
(Sta
rt F
req.
) (0
1 (H
z)
7.450 7.500 7,520 7.540 7.560 7.580 7.600 7.650 7.750 7.800
-7.300 7.350 7.400 7.450 7,500 7,520 7.540 7.560 7.580 7,600 7,650 7,750
-7,300 7,350 7,400 7.450 7.500 7.520 7.540 7.560 7.580 7.600 7.650 7.750 7.800
-7.300 7.350 7.400 7,450 7,500 7,520 7.540 7.560 7,580 7.600 7.650 7.750
^ 17
c 3 Ul
-----. ---
7.300
--------------------------
7.300
-------------
Freq
uenc
y R
atio
Ti
0,990 0,997 1,000 1,002 1.005 1,008 1,010 1,017 1,030
--
0.973 0.980 0.987 0.993 1.000 1.003 1.005 1,008 1,011 1,013 1.020 1.033
-0,972 0,978 0,985 0.992 0,998 1,001 1,004 1,006 1,009 1.012 1.018 1.032
--
0.974 0.980 0.987 0.994 1,000 1,003 1,006 1.008 1.011 1.014 1,020 1.034
Exc
itatio
n
Am
pl.
A (m
m)
0.185 0,185 0.185 0,185 0.185 0.185 0,185 0,185 0,185 0.185
_ 0.185 0.185 0.185 0.185 0,185 0.185 0.185 0.185 0.185 0.185 0,185 0,185
-0.185 0.185 0,185 0.185 0.185 0.185 0.185 0.185 0.185 0.185 0.185 0.185 0.185
-0.185 0,185 0,185 0,185 0.185 0.185 0.185 0.185 0.185 0.185 0,185 0,185
Initi
al D
ispl
.
_ . _ _ _ _ _ _ . _
400 _ _ _ _ _ _ _ _ _ ---
400 -------------
400
------------
CLEARANCE AND LENGTH
Wal
l-to
-Wal
l G
ap (m
m)
42.3 42.3 42.3 42.3 42.3 42.3 42.3 42.3 42.3 42.3 42.3 42.3 42.3 42.3 42.3 42.3 42.3 42.3 42.3 42.3 42.3 42.3 42.3 42.3 42.3 42.3 42.3 42.3 42.3 42.3 42.3 42.3 42.3 42.3 42.3 42.3 42.3 42.3 42.3 42.3 42.3 42.3 42.3 42.3 42.3 42.3 42.3 42.3 42.3 42,3
Cle
aran
ce
0 (m
m)
_ _ _ _ _ _ _ _ _ _ _ _ _ _ _ _ _ _ _ _ -_ _
4,912 4,912 4,912 4.912 4.912 4.912 4,912 4.912 4,912 4,912 4.912 4.912 4.912 4.912 4.912 4.912 4.912 4.912 4.912 4.912 4.912 4.912 4,912 4.912 4.912 4.912 4.912
Cle
aran
ce
Rat
io d
/A
_ . . . . . . . . _ . _ _ _ _ _ _ _ _ _ _ _ _ _
26.551 26.551 26.551 26.551 26.551 26,551 26.551 26,551 26,551 26,551 26.551 26,551 26.551
-26.551 26.551 26.551 26.551 26,551 26,551 26.551 26,551 26.551 26,551 26,551 26,551
Pen
dulu
m
Arm
L
(mm
)
150.00 150.00 150.00 150.00 150.00 150.00 150,00 150,00 150.00 150,00 100,00 100.00 100.00 100.00 100,00 100.00 100.00 100.00 100.00 100.00 100.00 100.00 100.00 250,00 250.00 250,00 250,00 250.00 250,00 250,00 250.00 250.00 250,00 250.00 250.00 250.00 250.00 200,00 200.00 200.00 200,00 200,00 200,00 200,00 200,00 200,00 200.00 200.00 200.00 200.00
87

II EX
PER
IMEN
T |
161 152 163 164 166 16b 16/ 168 169 160 161 162 163 164 165 166 167 168 169 170 171 172 173 174 175 176 177 178 179 180 181 182 183 184 185 186 187 188 189 190 191 192 193 194 195 196 197 198 199 200
MODEL
c 0) 3
i E Tj OT O
u o i l 012 012 012 012 012 012 012 012 012 012 012 012 012 012 013 013 013 013 013 013 013 013 013 013 013 013 013 013 014 014 014 014 014 014 014 014 014 014 014 014 015 015 015 015 015 015 015 015 015
>>
3 % (0 c z s
u. 7.498 7.522 7.522 7.522 7.522 7.522 7.522 7.522 7.522 7.522 7.522 7.522 7.522 7.522 7.522 7.500 7.500 7.500 7.500 7.500 7.500 7.500 7.500 7,500 7,500 7,500 7.500 7.500 7.500 7,512 7,512 7,512 7.512 7,512 7.512 7.512 7.512 7,512 7,512 7.512 7.512 7.512 7.512 7.512 7.512 7.512 7.512 7.512 7.512 7.512
MASS
w to a .-.
E
0.086 0.086 0.086 0.086 0,086 0,086 0,086 0,086 0,086 0.086 0.086 0.086 0.086 0.086 0.086 0,086 0,086 0,086 0,086 0,086 0,086 0,086 0,086 0,086 0,086 0.086 0.086 0.086 0,086 0,086 0,086 0,086 0,086 0.086 0,086 0,086 0,086 0.086 0,086 0,086 0,086 0.086 0,086 0,086 0.086 0,086 0,086 0.086 0,086 0.086
.0
IS _z-DC S
0.045 0,045 0,045 0,045 0,045 0,045 0,045 0,045 0.045 0.045 0.045 0.045 0.045 0.045 0.045 0,045 0,045 0,045 0,045 0,045 0,045 0,045 0,045 0,045 0,045 0.045 0.045 0.045 0,045
---------------------
EXCITATION
d- d' £ S N-u. U. X d c "^ X JS S Ul w.
7.800 -
7,300 7,350 7,400 7,450 7.500 7.520 7.540 7.560 7.580 7.600 7.650 7.750 7.800
-7.300 7.350 7.400 7.450 7.500 7.520 7.540 7.560 7,580 7.600 7.650 7,750 7,800 7.300 7,350 7,400 7.450 7.500 7.520 7.540 7.560 7.580 7.600 7.650 7.750 7.300 7.350 7.400 7.450 7,500 7.520 7.540 7.560 7.580
d- ,.
c 3 Ul
7.300 _ _ _ -_ --------
7.300 -------------
7,300 ---------------------
>< 0 . r 01 0 ^ '^ ST " S! DC U.
--
0,970 0.977 0,984 0,990 0,997 1.000 1.002 1.005 1,008 1.010 1.017 1.030
--
0.973 0,980 0.987 0,993 1.000 1,003 1.005 1,008 1.011 1.013 1,020 1,033
-0,811 0,817 0.822 0.828 0.833 0.836 0.838 1.059 1.062 1.064 1.071 1.085 1,022 1,029 1,036 1,042 1.049 1.052 1,055 1,057 1.060
c
.t; E £ X ^ <
111
0.185 _
0.185 0.185 0,185 0.185 0.185 0.185 0,185 0,185 0.185 0.185 0,185 0,185 0.185
-0,185 0,185 0.185 0.185 0.185 0.185 0.185 0.185 0.185 0.185 0,185 0,185 0,185 0,127 0.127 0,127 0,127 0,127 0,127 0,127 0,127 0,127 0,127 0,127 0.127 0.160 0.160 0.160 0.160 0.160 0.160 0,160 0,160 0,160
a. a a .2 •? 'E _
400 _ _ _ _ _ _ _ _ _ _ . _ -
400 -_ --------------------------------
CLEARANCE AND LENGTH
If 6i. ^ a.
| 5 42.3 42.3 42.3 42.3 42,3 42,3 42,3 42,3 42,3 42.3 42.3 42.3 42.3 42,3 42,3 42.3 42.3 42.3 42.3 42,3 42.3 42.3 42.3 42.3 42.3 42.3 42.3 42,3 42,3 42.3 42.3 42.3 42.3 42.3 42.3 42.3 42.3 42,3 42,3 42,3 42,3 42,3 42,3 42,3 42.3 42,3 42,3 42,3 42.3 42.3
0
4.912 4.912 4.912 4.912 4.912 4.912 4,912 4,912 4,912 4,912 4.912 4,912 4.912 4.912 4.912 4.912 4.912 4.912 4.912 4,912 4.912 4.912 4.912 4.912 4,912 4.912 4.912 4.912 4.912
---------------------
8< 2 0 01 IS
26.551 _
26.551 26.551 26.551 26.551 26,551 26,551 26,551 26,551 26,551 26,551 26,551 26,551 26.551
. 26,551 26.551 26.551 26,551 26.551 26.551 26,551 26.551 26.551 26,551 26.551 26.551 26.551
---------------------
ii g E
200.00 150.00 150.00 150.00 150.00 150.00 150.00 150.00 150.00 150.00 150,00 150,00 150,00 150.00 150.00 100,00 100.00 100,00 100,00 100,00 100.00 100,00 100,00 100,00 100,00 100.00 100,00 100,00 100,00 250.00 250,00 250,00 250.00 250.00 250,00 250.00 250,00 250.00 250,00 250,00 250,00 250,00 250,00 250.00 250.00 250.00 250.00 250.00 250.00 250.00
88
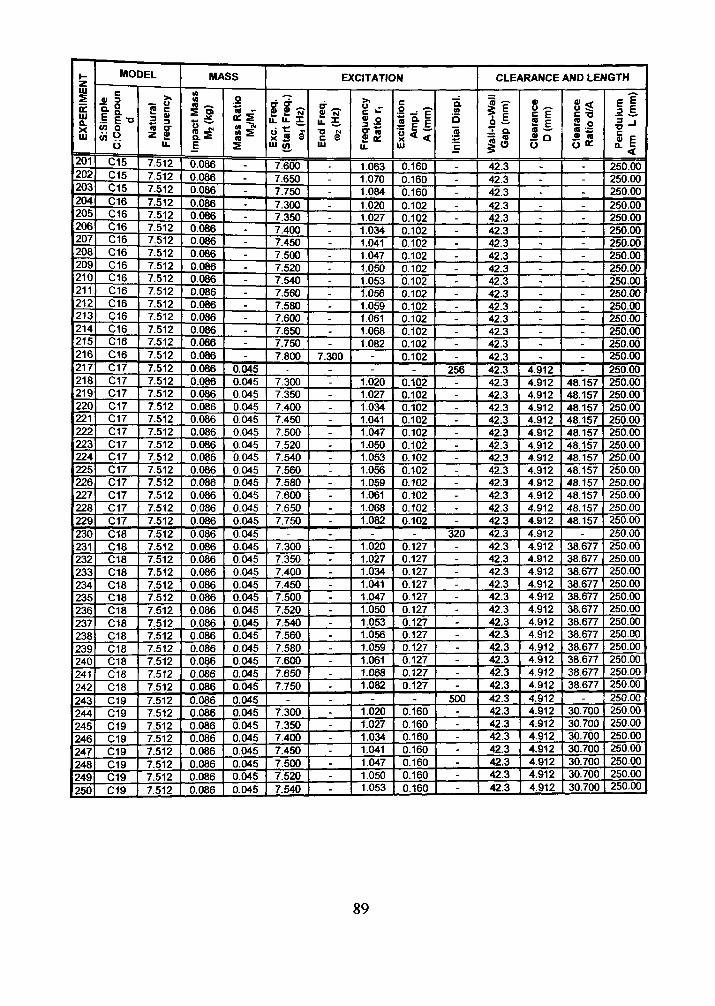
1 EX
PERI
MEN
T J
201 /U^ 203 2U4 206 206 20/ 208 209 210 211 212 213 214 215 216 217 218 219 220 221 222 223 224 225 226 227 228 229 230 231 232 233 234 235 236 237 238 239 240 241 242 243 244 245 246 247 248 249 250
MODEL
IS:S
impl
e C
:Com
poun
d
015 C15 015 016 016 016 016 016 016 016 016 016 016 016 016 016 017 017 017 017 017 017 017 017 017 017 017 017 017 018 018 018 018 018 018 018 018 018 018 018 C18 018 019 019 019 019 019 019 019 019
1Nat
ural
Fr
eque
ncy
7,512 7,512 7,512 7.512 7.512 7,512 7,512 7,512 7,512 7,512 7,512 7.512 7.512 7,512 7,512 7,512 7,512 7.512 7.512 7,512 7,512 7.512 7,512 7.512 7,512 7,512 7.512 7.512 7,512 7,512 7,512 7.512 7.512 7.512 7.512 7.512 7,512 7.512 7.512 7.512 7.512 7,512 7.512 7.512 7,512 7,512 7.512 7,512 7,512 7,512
MASS
Impa
ct M
ass
M2(
kg)
0.086 0,086 0,086 0.086 0.086 0.086 0,086 0,086 0.086 0.086 0.086 0.086 0.086 0.086 0.086 0,086 0,086 0,086 0,086 0,086 0,086 0.086 0.086 0.086 0.086 0.086 0.086 0,086 0,086 0,086 0,086 0.086 0.086 0,086 0,086 0,086 0.086 0.086 0,086 0.086 0.086 0.086 0.086 0.086 0.086 0.086 0.086 0.086 0.086 0.086
,2
a: S
---. ------------
0.045 0.045 0.045 0.045 0.045 0.045 0.045 0.045 0.045 0.045 0.045 0.045 0.045 0.045 0,045 0,045 0.045 0,045 0,045 0.045 0.045 0.045 0.045 0.045 0.045 0.045 0.045 0.045 0.045 0.045 0,045 0.045 0.045 0.045
EXCITATION
Exc
. Fre
q.
(Sta
rt F
req.
) •a
, (H
z)
7,600 7.650 7.750 7.300 7.350 7,400 7,450 7,500 7.520 7.540 7.560 7.580 7.600 7.650 7.750 7,800
-7,300 7,350 7,400 7,450 7,500 7,520 7.540 7.560 7.580 7,600 7,650 7.750
-7.300 7.350 7,400 7.450 7.500 7.520 7.540 7.560 7.580 7.600 7.650 7.750
-7.300 7.350 7.400 7.450 7.500 7.520 7.540
£ W
c 3 Ul
-_ -_ _ _ -_ _ ------
7.300 ----------------------------------
Freq
uenc
y R
atio
r^
1.063 1.070 1.084 1.020 1.027 1.034 1.041 1.047 1.050 1.053 1.056 1.059 1.061 1.068 1.082
--
1.020 1.027 1.034 1.041 1.047 1.050 1.053 1.056 1.059 1.061 1.068 1.082
-1.020 1.027 1.034 1.041 1.047 1.050 1.053 1.056 1.059 1.061 1.068 1.082
-1.020 1.027 1.034 1.041 1.047 1.050 1.053
Exc
itatio
n
Am
pl.
A (m
m)
0.160 0.160 0.160 0.102 0.102 0.102 0.102 0,102 0,102 0.102 0.102 0.102 0.102 0.102 0.102 0.102
-0.102 0.102 0.102 0.102 0,102 0,102 0,102 0.102 0.102 0.102 0,102 0,102
-0.127 0.127 0.127 0.127 0,127 0,127 0,127 0.127 0.127 0,127 0,127 0.127
-0.160 0.160 0.160 0.160 0.160 0.160 0.160
Initi
al D
ispl
.
_ _ _ . _ _ _ _ _ -------
256 ------------
320 ------------
500 -------
CLEARANCE AND LENGTH
Wal
l-to
-Wal
l G
ap (m
m)
42,3 42,3 42,3 42,3 42,3 42.3 42.3 42.3 42.3 42.3 42.3 42.3 42.3 42.3 42.3 42.3 42.3 42.3 42.3 42.3 42.3 42.3 42.3 42.3 42.3 42.3 42.3 42,3 42,3 42.3 42.3 42.3 42.3 42.3 42.3 42,3 42.3 42.3 42.3 42.3 42.3 42.3 42.3 42.3 42.3 42.3 42.3 42.3 42.3 42.3
Cle
aran
ce
D (
mm
)
, , -_ _ _ _ _ -. ------
4.912 4.912 4.912 4.912 4.912 4.912 4.912 4,912 4.912 4.912 4,912 4.912 4.912 4.912 4.912 4.912 4,912 4,912 4,912 4.912 4.912 4.912 4.912 4,912 4,912 4,912 4.912 4.912 4,912 4,912 4.912 4.912 4.912 4.912
Cle
aran
ce
Rat
io d
/A
-_ _ _ _ _ -_ _ --------
48.157 48.157 48.157 48.157 48.157 48,157 48,157 48.157 48.157 48,157 48.157 48.157
-38.677 38.677 38,677 38.677 38.677 38.677 38.677 38.677 38.677 38.677 38,677 38,677
-30.700 30.700 30.700 30.700 30.700 30.700 30.700
Pen
dulu
m
Am
i L
(m
m)
250.00 250.00 250.00 250,00 250.00 250.00 250.00 250.00 250.00 250.00 250.00 250,00 250,00 250.00 250.00 250,00 250,00 250.00 250.00 250.00 250,00 250.00 250,00 250,00 250,00 250,00 250.00 250.00 250.00 250.00 250.00 250.00 250.00 250,00 250,00 250,00 250,00 250,00 250.00 250,00 250.00 250.00 250.00 250.00 250,00 250,00 250,00 250,00 250,00 250.00
89

II EX
PERI
MEN
T 1
Zt>l
252 253 254 255 266 26/ 268 269 260 261 262 263 264 266 266 267 268 269 270 271 272 273 274 275 276 277 278 279 280 281 282 283 284 285 286 287 288 289 290 291 292 293 294 295 296
MO S
:Sim
ple
C:C
ompo
un
d
C19 019 019 019 019 O20 020 C20 O20 020 C20 O20 020 C20 O20 020 020 O20 021 021 021 021 021 021 021 021 021 021 021 021 021 022 022 022 022 022 022 022 022 022 022 022 022 022 823 C23
DEL
1Nat
ura
l Fr
eque
ncy
7,512 7,512 7,512 7.512 7.512 7,512 7,512 7,512 7,512 7,512 7,512 7,512 7,512 7.512 7,512 7,512 7,512 7,512 7.512 7.512 7,512 7,512 7,512 7.512 7.512 7.512 7.512 7.512 7.512 7.512 7.512 7.512 7.512 7.512 7.512 7.512 7.512 7,512 7,512 7.512 7.512 7.512 7.512 7.512 7.512 7.512
MASS
w w
ii E 0,086 0,086 0,086 0,086 0,086 0,086 0.086 0.086 0.086 0.086 0,086 0,086 0,086 0.086 0,086 0,086 0,086 0,086 0,086 0.086 0.086 0.086 0.086 0.086 0.086 0,086 0,086 0,086 0,086 0.086 0.086 0,086 0,086 0,086 0.086 0.086 0,086 0,086 0,086 0,086 0,086 0.086 0.086 0.086 0.184 0.278
.9
« 2 *
s 0.045 0,045 0,045 0,045 0,045 0,045 0,045 0,045 0,045 0.045 0.045 0.045 0.045 0.045 0,045 0,045 0,045 0.045 0.045 0,045 0,045 0,045 0.045 0,045 0,045 0.045 0.045 0.045 0.045 0.045 0.045 0.045 0.045 0.045 0.045 0,045 0,045 0,045 0,045 0,045 0,045 0.045 0,045 0,045 0.096 0.145
EXCITATION
Exc
. Fre
q.
(Sta
rt F
req.
) »<
(H
z)
7.560 7.580 7.600 7.650 7.750
-7.300 7.350 7.400 7,450 7,500 7,520 7.540 7.560 7.580 7.600 7.650 7.750
-7.300 7.350 7.400 7,450 7,500 7.520 7.540 7.560 7.580 7.600 7.650 7.750
-7.300 7,350 7,400 7,450 7,500 7,520 7,540 7,560 7,580 7,600 7,650 7,750 7,560 7,560
d- ^ £ X C 3 Ul
----------------------------------------------
Freq
uenc
y R
atio
u
1,056 1.059 1,061 1.068 1.082
_ 1.020 1.027 1.034 1.041 1.047 1.050 1,053 1,056 1.059 1.061 1.068 1.082
-1.020 1.027 1,034 1,041 1,047 1,050 1,053 1,056 1.059 1.061 1.068 1.082
-1,020 1,027 1,034 1,041 1,047 1,050 1,053 1,056 1,059 1.061 1.068 1,082 1,056 1.056
Exc
itatio
n
Am
pl.
A (m
m)
0,160 0,160 0,160 0,160 0.160
. 0.185 0,185 0.185 0.185 0,185 0,185 0.185 0.185 0,185 0,185 0,185 0,185
-0,185 0,185 0,185 0.185 0.185 0,185 0.185 0.185 0.185 0,185 0.185 0.185
-0.185 0.185 0.185 0.185 0.185 0.185 0,185 0,185 0,185 0.185 0.185 0.185 0,185 0.185
Initi
al O
ispl
.
_ _ _ _ _
400 _ _ _ _ _ _ ----_ -
400 . -. ---------
400 --------------
CLEARANCE AND LENGTH
Wal
l-to
-Wal
l G
ap (m
m)
42,3 42,3 42.3 42.3 42.3
40.64 40.64 40.64 40.64 40.64 40.64 40.64 40.64 40.64 40.64 40.64 40.64 40.64 41.5 41.5 41.5 41.5 41.5 41.5 41.5 41.5 41.5 41.5 41.5 41.5 41.5 39.50 39.50 39.50 39.50 39,50 39,50 39.50 39.50 39.50 39.50 39.50 39.50 39.50 42,30 42.30
Cle
aran
ce
D(m
m)
4.912 4,912 4.912 4.912 4.912 3.252 3.252 3.252 3.252 3.252 3.252 3.252 3,252 3,252 3.252 3.252 3.252 3.252 4.112 4.112 4.112 4,112 4.112 4.112 4.112 4.112 4,112 4,112 4.112 4.112 4.112 2.112 2.112 2.112 2.112 2.112 2.112 2.112 2.112 2.112 2.112 2,112 2.112 2.112 4.912 4.912
Cle
aran
ce
Rat
io d
/A
30.700 30.700 30.700 30.700 30.700
_ 17.578 17.578 17.578 17,578 17,578 17,578 17,578 17.578 17,578 17,578 17.578 17.578
_ 22.227 22,227 22.227 22,227 22,227 22.227 22.227 22,227 22.227 22.227 22.227 22.227
-11.416 11.416 11.416 11.416 11.416 11,416 11,416 11,416 11,416 11.416 11.416 11.416 26.551 26.551
Pen
dulu
m
Arm
L
(m
m)
250.00 250.00 250.00 250.00 250.00 250.00 250.00 250.00 250.00 250.00 250.00 250.00 250.00 250.00 250.00 250.00 250.00 250.00 250.00 250.00 250.00 250.00 250.00 250.00 250.00 250.00 250.00 250.00 250.00 250.00 250.00 250.00 250.00 250.00 250.00 250.00 250.00 250.00 250.00 250.00 250.00 250.00 250.00 250 00 250.00 250.00
90
PERMISSION TO COPY
In presentmg this thesis in partial fulfillment of the requirements for a master's
degree at Texas Tech University or Texas Tech University Health Sciences Center, 1
agree that the Library and my major department shall make it freely available for
research purposes. Permission to copy this thesis for scholarly purposes may be
granted by the Director of the Library or my major professor. It is understood that
any copying or publication of this thesis for financial gain shall not be allowed
without my further written permission and that any user may be liable for copyright
infringement.