Embed Size (px)
Citation preview
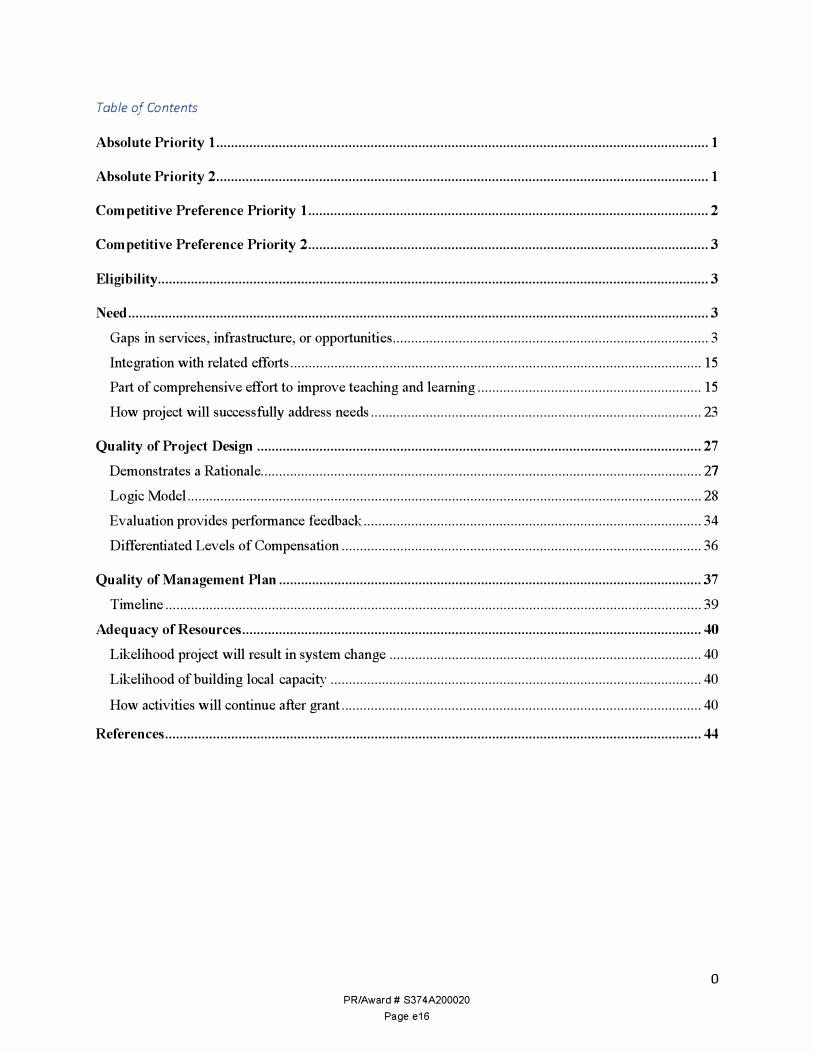
Table of Contents
Absolute Priority 1 ...................................................................................................................................... 1
Absolute Priority 2 ...................................................................................................................................... 1
Competitive Preference Priority 1 ............................................................................................................. 2
Competitive Preference Priority 2 ............................................................................................................. 3
Eligibility...................................................................................................................................................... 3
Need.............................................................................................................................................................. 3
Gaps in services, infrastructure, or opportunities.................................................................................. .... 3
Integration with related efforts ................................................................................................................ 15
Part of comprehensive effort to improve teaching and learning ............................................................. 15
How project will successfully address needs .......................................................................................... 23
Quality of Project Design ......................................................................................................................... 27
Demonstrates a Rationale ........................................................................................................................ 27
Logic Model ............................................................................................................................................ 28
Evaluation provides performance feedback ............................................................................................ 34
Differentiated Levels of Compensation .................................................................................................. 36
Quality of Management Plan ................................................................................................................... 37
Time line .................................................................................................................................................. 39
Adequacy of Resources ............................................................................................................................. 40
Likelihood project will result in system change ..................................................................................... 40
Likelihood of building local capacity ..................................................................................................... 40
How activities will continue after grant............................................................................................... ... 40
References.................................................................................................................................................. 44
PR/Award# S374A200020
Page e16
0
Absolute Priority 1: Performance-Based Compensation Systems (PBCS)
LEADing Onward is an innovative strategy to improve student performance through an
integrated approach to education. One critical tenet of this approach is the Performance-Based
Compensation plan for educators. This plan is unique in its approach linking teacher
development and student achievement through a consistent shared coaching experience grounded
in the Tennessee Educator Acceleration Model (TEAM) rubric. It describes how teachers can
receive annual raises of 1%-10% based on their performance measured by the TEAM rubric. It
assesses teachers' instruction, planning, environment, and professionalism through a system of
frequent observations, constructive feedback, student data, and professional development that
correlates with improvements in student achievement. Senior organizational and school leaders
will be eligible for bonus compensation based on their schools' results for student achievement,
attendance, teacher retention, and observable leadership behaviors.
Absolute Priority 2: High-Need Schools
LEADing Onward will serve the five public charter schools in the LEAD Public Schools
(LPS) network in Nashville, Tennessee. LPS has partnered with both the State and Metro
Nashville Public Schools to turnaround some of its most challenging schools. Half of the LPS
network consists of zone-enrolled schools; half are "fresh start" schools. LPS serves 3,000
th th students, predominantly minority and low-income children. These 5 through 12 grade students
are some of the most vulnerable in the city. Students enter LPS with a history of extreme
academic, social, and emotional deficits. Across the network, 76% are Economically
Disadvantaged. Schools range from 54. 7% to 100%. LPS schools have a history of difficulty
retaining highly effective teachers. A full description of needs by school is located on pages 4-
10.
PR/Award# S374A200020
Page e17
1
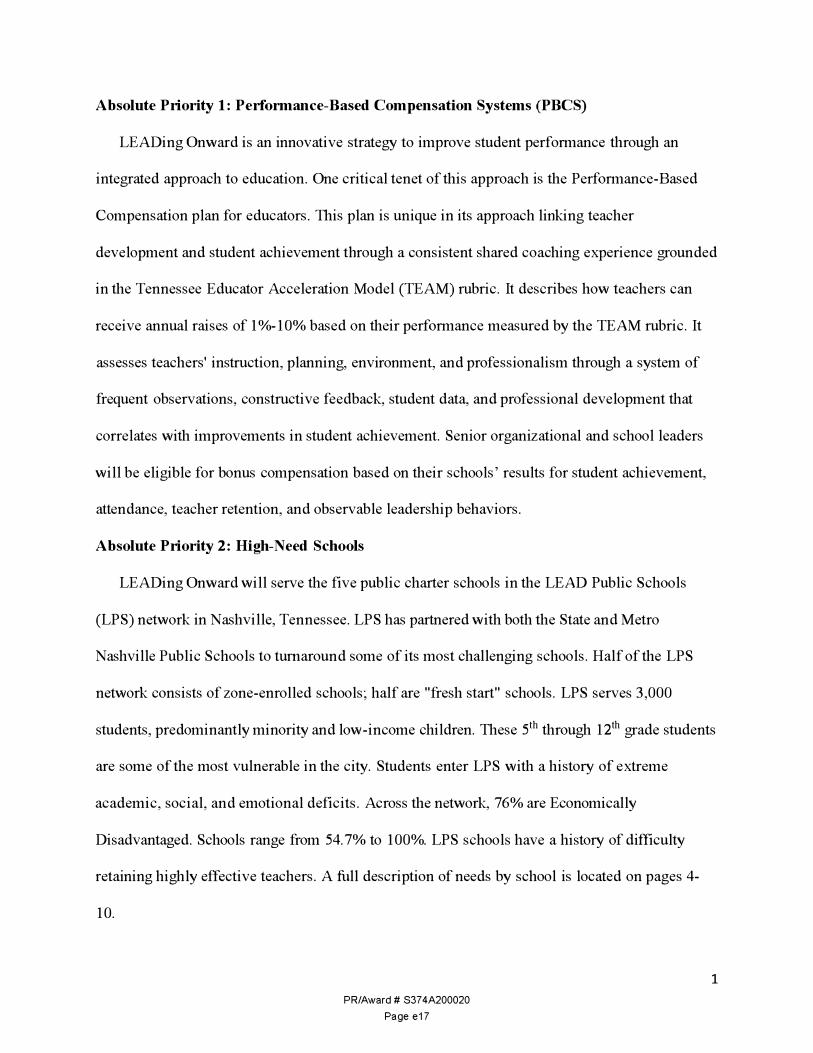
Competitive Preference Priority 1: Services in the Qualified Opportunity Zone
LPS provides services in Qualified Opportunity Zones. Two of its schools are in Opportunity
Zones. The other three are open-zoned and serve students in nearby Opportunity Zones.
(i.) Census tract numbers of the Qualified Opportunity Zones
• 47037016000 - LEAD Academy High School is in this census tract.
• 47037016000 - LEAD Cameron Middle School is in this census tract.
• 47037015628 - LEAD Southeast Middle School serves many students from this
census tract as a nearby Charter School with open enrollment. The school's census
tract is adjacent, number
47037015613.
• 47037013700 - LEAD
Brick Church Middle • Brick Church
School serves a high ■ Neely's Bend
number of students from [MO Academy
e Cameronthis census tract as a
LEAD Southeast nearby Charter School • Middle and High
with open enrollment. It
is located in an adjacent
census tract, The map above shows LEAD Charter Network School sites.
47037012701. Light blue borders show Opportunity Zones in Nashville.
This illustrates school locations in or near Opportunity Zones. • 47037010401 - LEAD
Neely's Bend Middle School serves a high number of students from this census tract.
It is a Charter School with open enrollment located nearby, in census tract
47037010602.
(ii.) How the applicant will provide services in the Qualified Opportunity Zones
LEAD Public Schools will provide services in Qualified Opportunity Zones through a
Performance-Based Compensation System for educators. This program will help ensure a higher
PR/Award# S374A200020
Page e18
2
quality of education in these neighborhoods, benefitting educators at these schools, students
attending them, and the entire community living in these Qualified Opportunity Zones.
Competitive Preference Priority 2
LEAD Public Schools has never received a grant and has never been a member of a group
that received a Teacher and School Leader Federal Grant or a Teacher Incentive Fund grant.
Eligibility
LEAD Public Schools (LPS) is a network of charter schools in Tennessee functioning as a
local education agency. In Tennessee, charter schools and Charter School Management
Organizations (CMO) operate through the authorization of local education agencies. LPS is a
charter school network with three Metro Nashville Public Schools-authorized schools and two
schools operating under Tennessee's Achievement School District (ASD). ASD is an LEA
established within Tennessee by the Tennessee First to the Top Act as an intervention for turning
around schools identified in the bottom 5% for school performance. ASD schools are run by ASD
staff or CMOs authorized to run them.
A. Need for Project
1. Gaps or weaknesses in services, infrastructure, or opportunities
Confronting the brutal facts: The teacher pipeline, At-Risk Students and Ourselves.
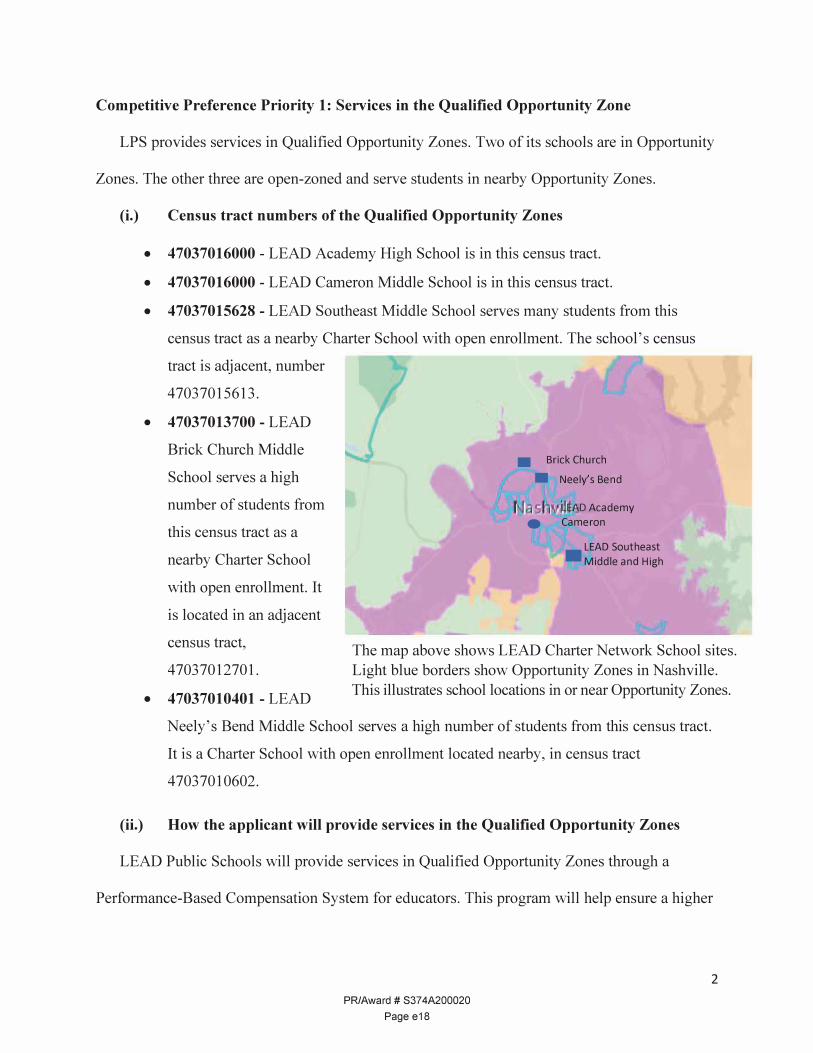
LEAD Public Schools and THE TEACHER GAP
Teacher employment and the number of jobs needed to keep up with
enrollment, 2003-2019
education as a whole are 8.4
Local public education employment
-------- ::::·:staring into the face of an
-
potentia
-
-
_
-
_ -
-
-----_ _
-
jobs : l -
:301.000
---
. . local publ c i60,000 jobs ,educat on job i
impending crisis. With a lost
!thortfall
shortage of qualified
teachers, ever-growing 7.6
2004 2006 2008 2010 2012 2014 2016 2018 2020
Source: EP analys s of Current Employment Statist cs public data ser es and U.S. Department of Education. National Center for Ed· 1 i i iucation Statsticsi
Jkonon.tic Poliey Insthu1e
PR/Award# S374A200020
Page e19
3
student needs, antiquated compensation and development structures, the challenge facing our
country is significant.
External market conditions
• The Economic Policy Institute (2019) showed a teacher shortage of 307,000. • Ingersoll (2018) determined 44% of teachers quit the profession within five years. • Even more troubling, Carver-Thomas and Darling-Hammond (2017) noted:
• Turnover rates are 50% higher for teachers in Title I schools, which serve
more low-income students. • Mathematics and science teacher turnover rates are nearly 70% greater in Title
I schools than in non-Title I schools. • Turnover rates are 70% higher for teachers in schools serving the largest
concentrations of students of color. • As more and more teachers leave the profession, even fewer are pursuing education
as a career. The Center for American Progress (2019) noted that Tennessee enrollment
in teacher preparation has declined programs declined by 47% from 2010 to 2018.
These external market pressures are extraordinary and have significantly impacted LPS.
Working with economically disadvantaged students who are significantly at-risk and enrolled in
Title I schools, LPS has averaged a 33% educator turnover over the last five years. In 2019, the
number of teacher applications at LPS was half what it was in 2015, dropping from 360 to 180.
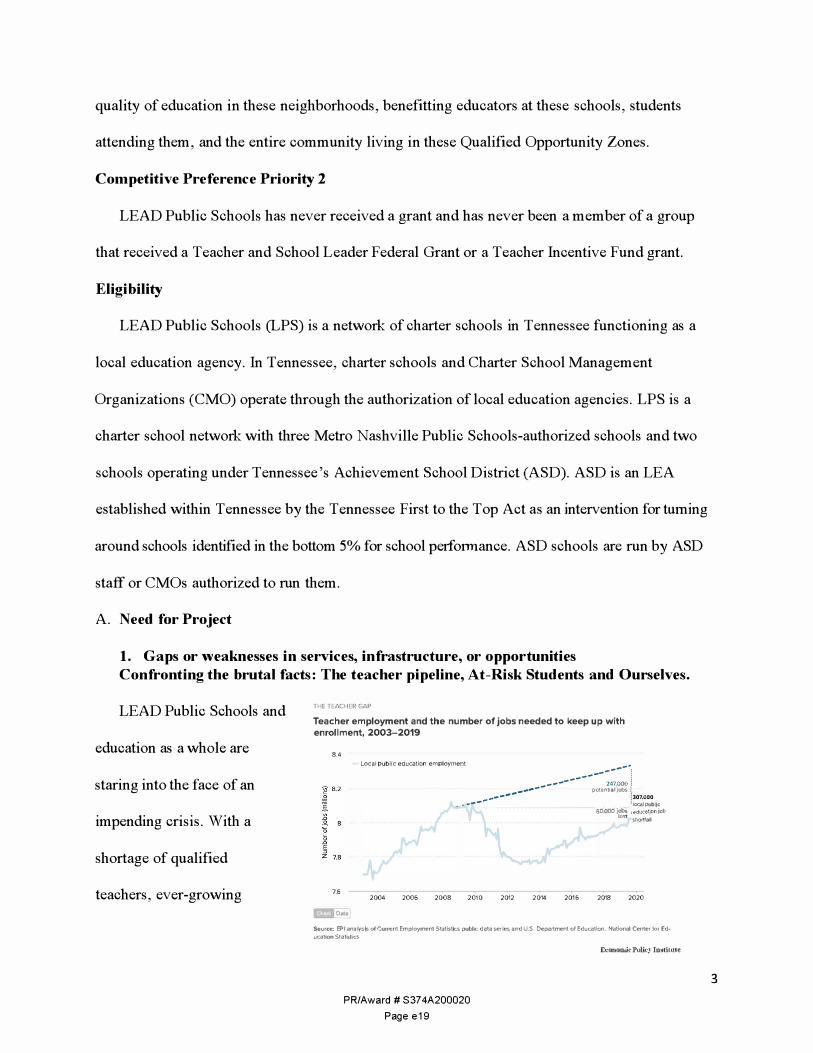
These shortages are most prevalent in high school math, science, ELL, and special education.
% of Teachers Retained
Brick Church
Neely's Bend
Cameron Middle
LEAD SE HS
LEAD SE MS
LEAD Academ
2018-2019 52% 50% 77% 100% 88% 70%
2019-2020 61% 68% 75% 81% 79% 79%
With declining teacher applications, LPS has focused its efforts on retaining current staff
members. Over the last two years, these efforts have yielded some successes but have also
highlighted the vulnerability of its two most challenged schools as shown in the above chart.
Neely's Bend and Brick Church, LPS schools authorized through ASD, serve the most high-need
PR/Award# S374A200020
Page e20
4
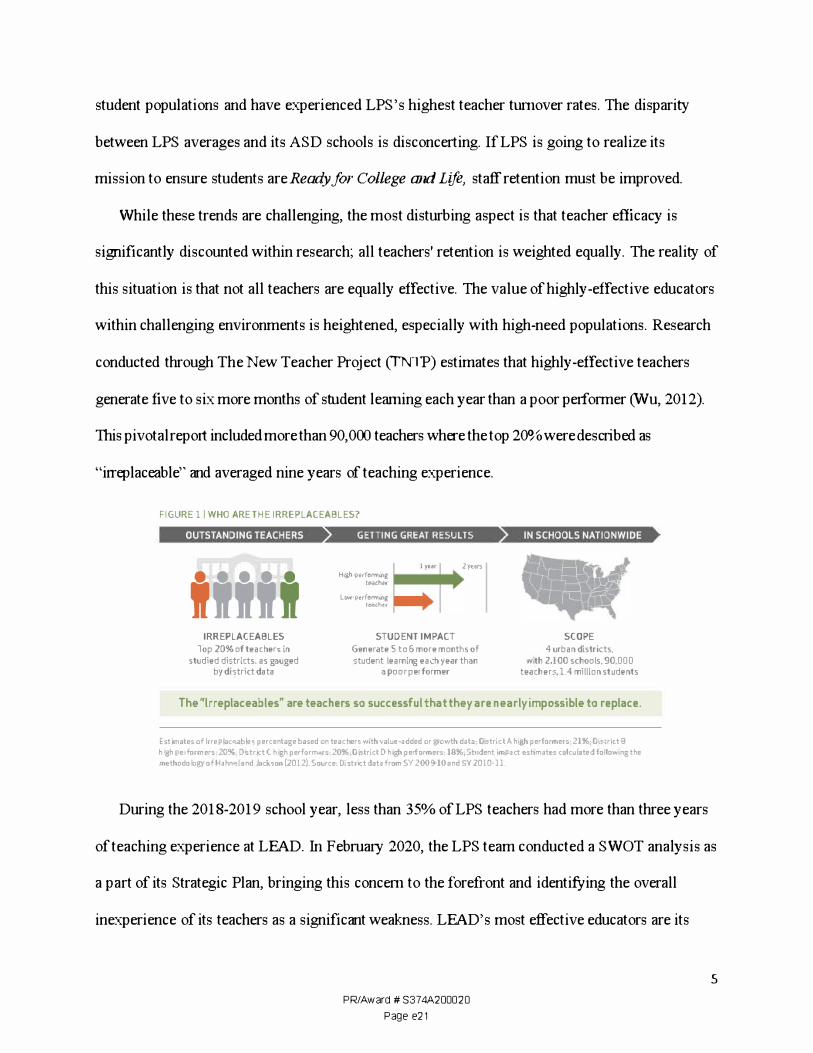
student populations and have experienced LPS 's highest teacher turnover rates. The disparity
between LPS averages and its ASD schools is disconcerting. IfLPS is going to realize its
mission to ensure students are Ready for College and Life, staff retention must be improved.
While these trends are challenging, the most disturbing aspect is that teacher efficacy is
significantly discounted within research; all teachers' retention is weighted equally. The reality of
this situation is that not all teachers are equally effective. The value of highly-effective educators
within challenging environments is heightened, especially with high-need populations. Research
conducted through The New Teacher Project (fNTP) estimates that highly-effective teachers
generate five to six more months of student learning each year than a poor performer (Wu, 2012).
This pivotal report included more than 90,000 teachers where the top 200/o were described as
"irreplaceable" and averaged nine years of teaching experience.
Est mates of lrrep aceab e s ercenp tage based on teachers W1thva\ue4 added or growth data; O,strict A h gh erp f r o mers: 21%: O sti ct B i l l i ri h gh pi erformers : 20% ; Dstr ct C h gh i i erformers: 20% ; O ,st rict D h gh erformers: 18% ; Sh.Jdent i mpact eshmates calcu l ai tep foi p d llowi ng the
methodo lo of Hahne d ks n (2012). S u : Di tn t d t f SY 2009· 10 l an J ac o o rce s c a a rom angy d SY 2010· l l.
During the 2018-2019 school year, less than 35% ofLPS teachers had more than three years
of teaching experience at LEAD. fu February 2020, the LPS team conducted a SWOT analysis as
a part of its Strategic Plan, bringing this concern to the forefront and identifying the overall
inexperience of its teachers as a significant weakness. LEAD's most effective educators are its
PR/Award # S37 4A200020
Page e21
5
FIGURE 11 WHO ARE THE IRREPLACEABLES?
, I GETTING GREAT RESULTS I I , I
2yms
11111 H�·l)tdOO'l'lll'lg
t�(he<
Low-i:>edoO'l'lll'lgt<Ntchtt
IRREPLACEABLES STUD ENT IMPACT SCOPE Top 20% of teachers in Generate 5 to 6 more months of 4 urban districts.
studied districts. as gauged student learning each year than w th 2.100 schools. 90.000 iby district data a poor performer teachers, 1. 4 million students
The "lrreplaceables" are teachers so successful that they are nearly impossible to replace.
most valuable resource. It is imperative to create conditions to attract, develop, and retain them. If
LPS is unable to confront and remedy this situation, the consequences are dire, according to
Garcia and Weiss (2019):
A lack of sufficient, qualified teachers threatens students' ability to learn. Instability in a school's teacher workforce negatively affects student achievement and diminishes teacher effectiveness and quality. High teacher turnover consumes economic resources that could be better deployed elsewhere. Filling a vacancy costs $21,000 on average. Carroll (2007) estimated that the total annual cost of turnover was $7.3 billion per year, a cost that would exceed $8 billion at present.
Serving the most At-Risk Students
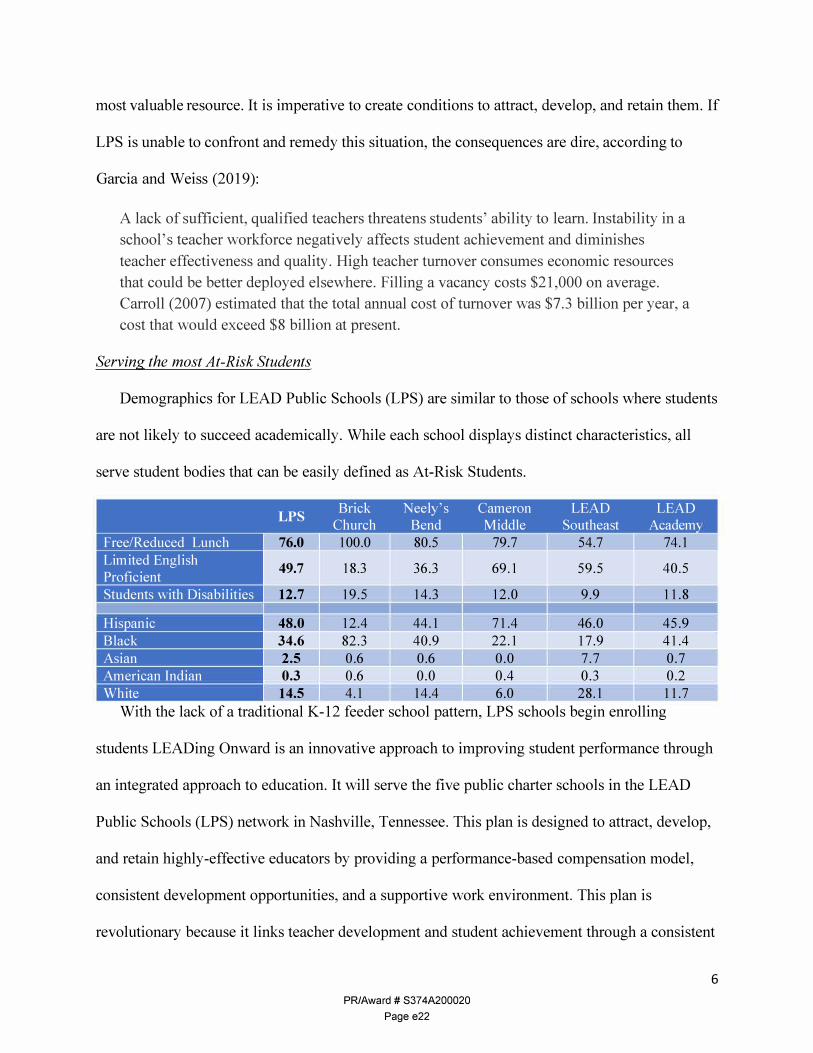
Demographics for LEAD Public Schools (LPS) are similar to those of schools where students
are not likely to succeed academically. While each school displays distinct characteristics, all
serve student bodies that can be easily defined as At-Risk Students.
LPS Brick
Church Neely's
Bend Cameron Middle
LEAD Southeast
LEADAcadem
Free/Reduced Lunch 76.0 100.0 80.5 79.7 54.7 74.1 Limited English Proficient
49.7 18.3 36.3 69.1 59.5 40.5
Students with Disabilities 12.7 19.5 14.3 12.0 9.9 11.8
His anic 48.0 12.4 44.1 71.4 46.0 45.9 Black 34.6 82.3 40.9 22.1 17.9 41.4 Asian 2.5 0.6 0.6 0.0 7.7 0.7 American Indian 0.3 0.6 0.0 0.4 0.3 0.2 White 14.5 4.1 14.4 6.0 28.1 11.7
With the lack of a traditional K-12 feeder school pattern, LPS schools begin enrolling
students LEADing Onward is an innovative approach to improving student performance through
an integrated approach to education. It will serve the five public charter schools in the LEAD
Public Schools (LPS) network in Nashville, Tennessee. This plan is designed to attract, develop,
and retain highly-effective educators by providing a performance-based compensation model,
consistent development opportunities, and a supportive work environment. This plan is
revolutionary because it links teacher development and student achievement through a consistent
PR/Award# S374A200020
Page e22
6
shared coaching experience grounded in the Tennessee Educator Acceleration Model (TEAM)
rubric. Teachers can receive annual raises of 1%-10% based on their performance, and school
leaders are eligible for bonus compensation based on their schools' results. Teacher performance
will be determined using the TEAM rubric. It assesses teachers' instruction, planning,
environment, and professionalism through a system of frequent observations, constructive
feedback, student data, and professional development that correlates with improvements in
student achievement. Senior organizational and school-based leaders earn bonus compensation
based on student achievement, attendance, teacher retention, and observable leadership
behaviors. Brick Church, Neely's Bend, and Cameron are all zoned enrollment schools that serve
elementary school student bodies that have been on the state's priority list within the last three
years. Alex Green Elementary is a feeder to LEAD Brick Church, Amqui Elementary is a feeder
to LEAD Neely's Bend, and John B. Whitsitt Elementary is a feeder to Cameron. The inclusion
of the elementary schools noted above signifies their student achievement ranked in the bottom
5% of all schools in the state. The students matriculating from these schools are significantly
behind their peers by the time they enter 5th grade at LEAD.
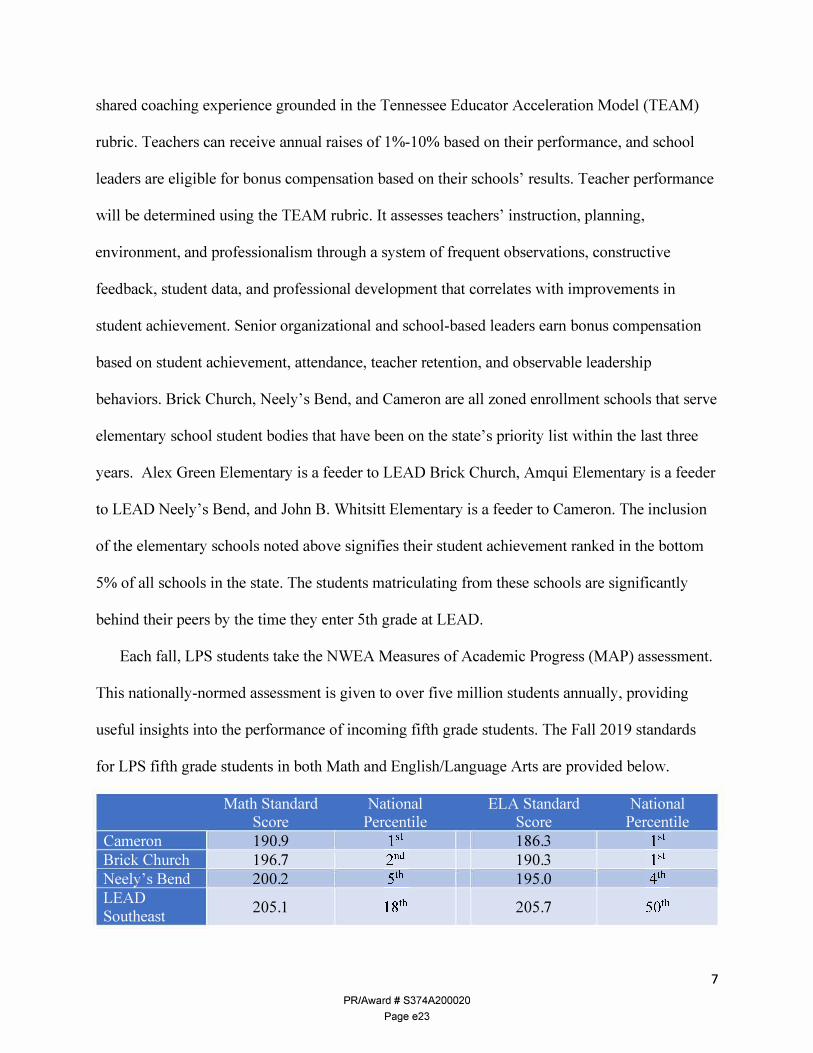
Each fall, LPS students take the NWEA Measures of Academic Progress (MAP) assessment.
This nationally-normed assessment is given to over five million students annually, providing
useful insights into the performance of incoming fifth grade students. The Fall 2019 standards
for LPS fifth grade students in both Math and English/Language Arts are provided below.
Math Standard National ELA Standard National Score Percentile Score Percentile
Cameron 190.9 186.3 Brick Church 196.7 190.3 Neel 's Bend 200.2 195.0 LEAD Southeast 205.1 205.7
PR/Award# S374A200020
Page e23
7
LPS students enter fifth grade substantially behind their peers. At the zoned enrollment
schools, they enter fifth grade below the 5th percentile. LEAD Cameron students scored at the 1st
percentile in both math and ELA. Brick Church students had similar scores. Neely's Bend was
slightly better but still well below expectations for beginning fifth-grade students. Open enrollment
students at LEAD Southeast Middle School scored higher but behind their peers, at the 18th
percentile for math. Their ELA scores appear to be on track; however, a handful of high
achieving students skew this average. A full 61 % of students (91 of 149) start fifth grade behind
their peers nationally. Furthermore, 33% of students begin fifth grade below the 20th percentile,
demonstrating significant reading gaps.
Improving Equity and Access to High-Performing Teachers
For LPS to achieve its goal of seeing every student Ready for College and Life, it is critical to
provide students with "irreplaceable" teachers by attracting, developing, and retaining highly
effective teachers. In the last five years, this has been a challenge since turnover rates have averaged
33%. In fact, from 2016 to 2019, LPS hired 205 different teachers while never having more than
185 teaching positions in a given year. Compounding this problem, the vast majority of teacher
applicants are first-year teachers.
Simply put, student achievement declines significantly when a highly-effective educator
producing 1.6 years of growth is replaced with a novice teacher producing 0.8 years of growth. A
student beginning the year at the 1st percentile with an ineffective teacher is likely to end the year
even further behind. However, that same student could easily grow from the 1st
20th percentile when placed with an effective educator, making up considerable ground a
putting them on the path to perform at grade level. Retaining highly effective educators year after
t vulnerable year is the key to sustained growth and closing the achievement gaps for the mos
nd
percentile to the
PR/Award# S374A200020
Page e24
8
students. LEADing Onward is designed to achieve this ideal by attracting, developing, and
retaining highly-effective educators.
In Tennessee, educators are evaluated using the Tennessee Educator Acceleration Model
(TEAM) Rubric. It measures educators' performance using ratings from one to five. A score of
five is significantly above expectations; a score of one is significantly below expectations. Scores
include Planning, Instruction, Environment, and Professionalism. The TEAM rubric is more
fully described on pages 26-29. Educators' ratings on this rubric vary widely across LPS schools.
Generally, schools with lowest teacher retention (page 4) have lower scores on teacher evaluation
(above), the highest percentage of economically disadvantaged students (page 6), and the lowest
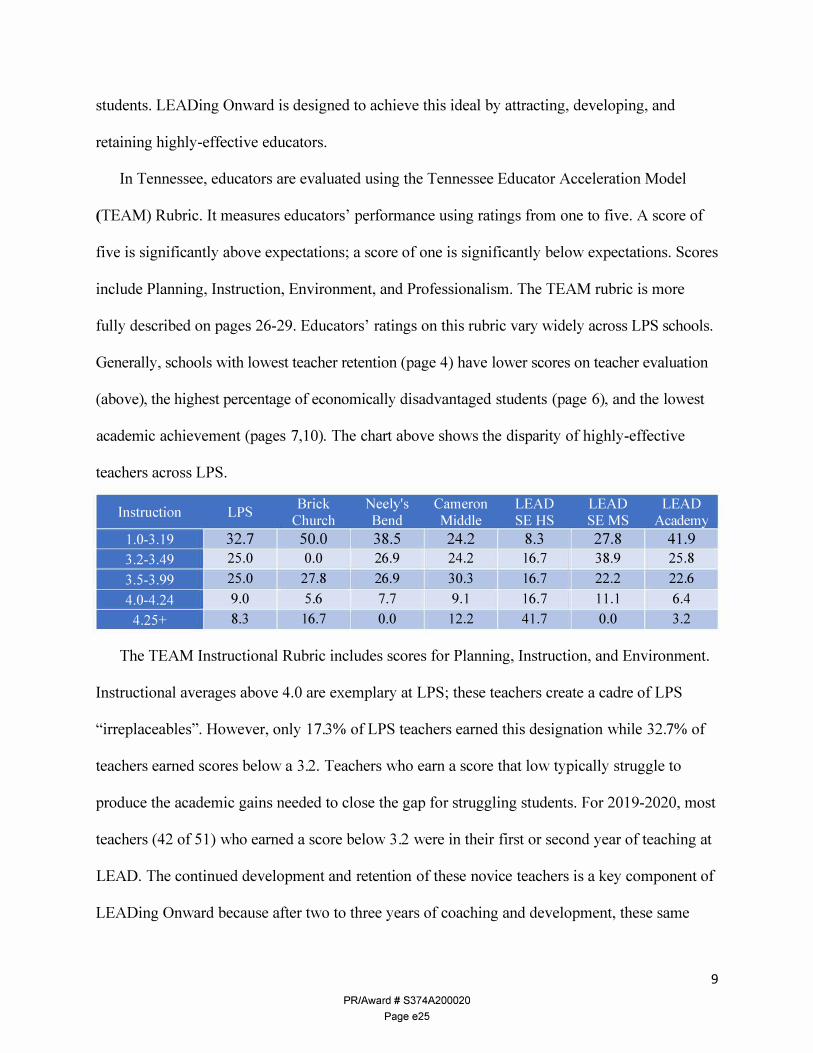
academic achievement (pages 7,10). The chart above shows the disparity of highly-effective
teachers across LPS.
.I ns truction
1.0-3.19
LPS
32.7
Brick Church
50.0
Neely's Bend
38.5
Cameron .
Middle
24.2
LEAD SE HS
8.3
LEAD SE MS
27.8
LEAD Academy
41.9 3.2-3.49 25.0 0.0 26.9 24.2 16.7 38.9 25.8
3.5-3.99 25.0 27.8 26.9 30.3 16.7 22.2 22.6
4.0-4.24 9.0 5.6 7.7 9.1 16.7 11.1 6.4
4.25+ 8.3 16.7 0.0 12.2 41.7 0.0 3.2
The TEAM Instructional Rubric includes scores for Planning, Instruction, and Environment.
Instructional averages above 4.0 are exemplary at LPS; these teachers create a cadre of LPS
"irreplaceables". However, only 17.3% of LPS teachers earned this designation while 32.7% of
teachers earned scores below a 3.2. Teachers who earn a score that low typically struggle to
produce the academic gains needed to close the gap for struggling students. For 2019-2020, most
teachers ( 42 of 51) who earned a score below 3 .2 were in their first or second year of teaching at
LEAD. The continued development and retention of these novice teachers is a key component of
LEADing Onward because after two to three years of coaching and development, these same
PR/Award# S374A200020
Page e25
9
teachers routinely produce exemplary student growth scores. Inevitably, losing these developing
teachers creates a pattern of one novice teacher replacing another with devastating impacts on
student achievement. To break the cycle at LEAD, continuity of staff and their development is
essential.
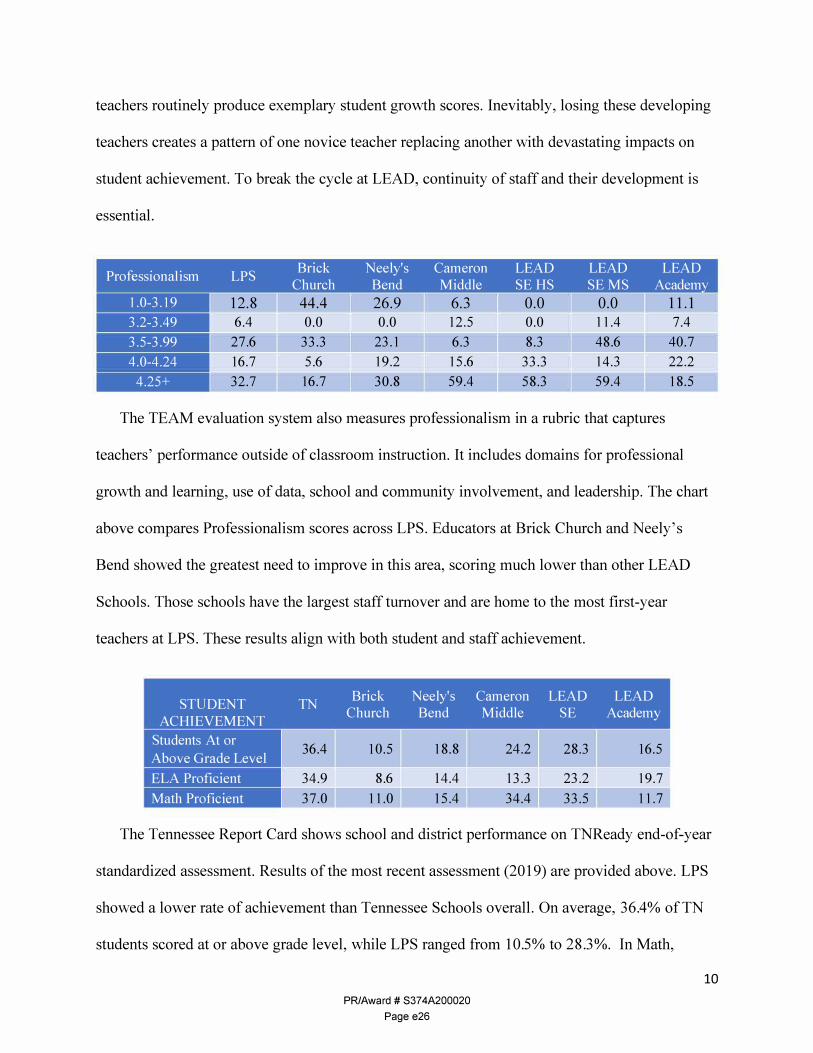
. . Brick Neely's Cameron LEAD LEAD LEADProtiessiona 1ism LPS
Church Bend Middle SE HS SE MS Academ 1.0-3.19 12.8 44.4 26.9 6.3 0.0 0.0 11.1 3.2-3.49 6.4 0.0 0.0 12.5 0.0 11.4 7.4
3.5-3.99 27.6 33.3 23.1 6.3 8.3 48.6 40.7
4.0-4.24 16.7 5.6 19.2 15.6 33.3 14.3 22.2
4.25+ 32.7 16.7 30.8 59.4 58.3 59.4 18.5
The TEAM evaluation system also measures professionalism in a rubric that captures
teachers' performance outside of classroom instruction. It includes domains for professional
growth and learning, use of data, school and community involvement, and leadership. The chart
above compares Professionalism scores across LPS. Educators at Brick Church and Neely's
Bend showed the greatest need to improve in this area, scoring much lower than other LEAD
Schools. Those schools have the largest staff turnover and are home to the most first-year
teachers at LPS. These results align with both student and staff achievement.
Brick Neely's Cameron LEAD LEADSTUDENT TN
Church Bend Middle SE AcademyACHIEVEMENT
Students At or 36.4 10.5 18.8 24.2 28.3 16.5
Above Grade Level
ELA Proficient 34.9 8.6 14.4 13.3 23.2 19.7
Math Proficient 37.0 11.0 15.4 34.4 33.5 11.7
The Tennessee Report Card shows school and district performance on TNReady end-of-year
standardized assessment. Results of the most recent assessment (2019) are provided above. LPS
showed a lower rate of achievement than Tennessee Schools overall. On average, 36.4% of TN
students scored at or above grade level, while LPS ranged from 10.5% to 28.3%. In Math,
PR/Award# S374A200020
Page e26
10
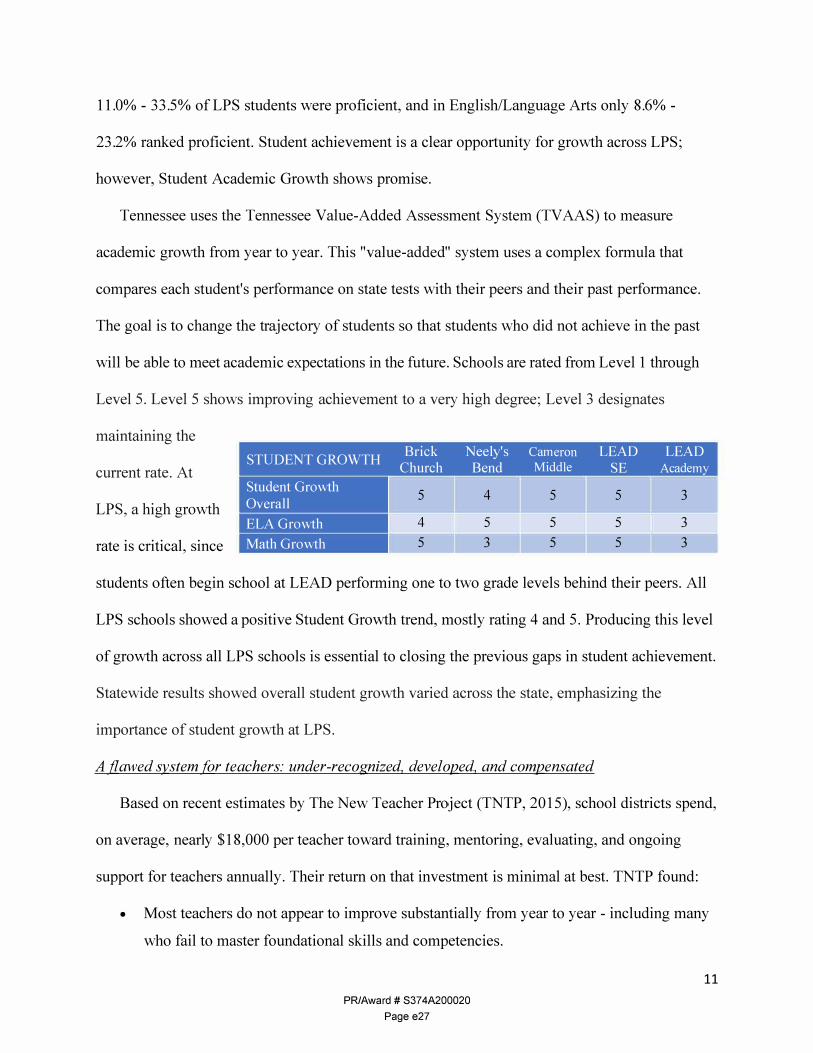
11.0% - 33.5% of LPS students were proficient, and in English/Language Arts only 8.6% -
23.2% ranked proficient. Student achievement is a clear opportunity for growth across LPS;
however, Student Academic Growth shows promise.
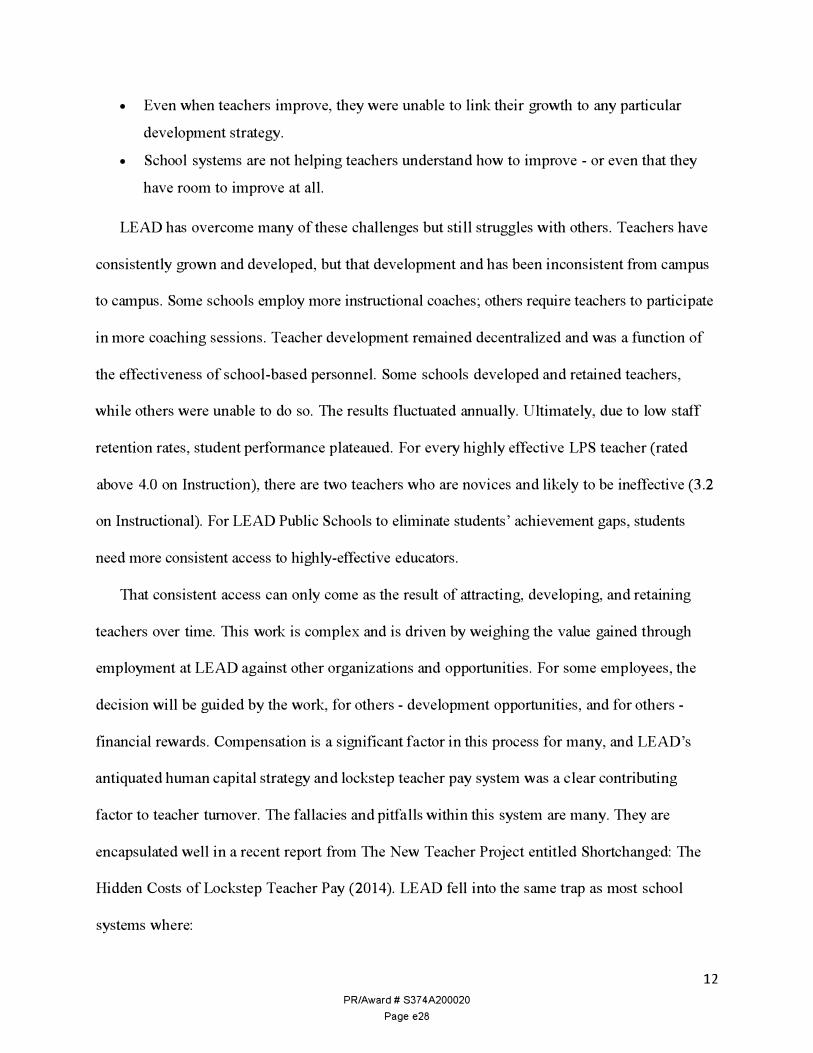
Tennessee uses the Tennessee Value-Added Assessment System (TV AAS) to measure
academic growth from year to year. This "value-added" system uses a complex formula that
compares each student's performance on state tests with their peers and their past performance.
The goal is to change the trajectory of students so that students who did not achieve in the past
will be able to meet academic expectations in the future. Schools are rated from Level 1 through
Level 5. Level 5 shows improving achievement to a very high degree; Level 3 designates
maintaining the STUDENT GROWTH
Brick Church
Neely's Bend
Ca eron ".1Middle
LEAD SE
LEADAcademy
Student Growth Overall
5 4 5 5 3
ELA Growth 4 5 5 5 3
Math Growth 5 3 5 5 3
current rate. At
LPS, a high growth
rate is critical, since
students often begin school at LEAD performing one to two grade levels behind their peers. All
LPS schools showed a positive Student Growth trend, mostly rating 4 and 5. Producing this level
of growth across all LPS schools is essential to closing the previous gaps in student achievement.
Statewide results showed overall student growth varied across the state, emphasizing the
importance of student growth at LPS.
A flawed system for teachers: under-recognized. developed. and compensated
Based on recent estimates by The New Teacher Project (TNTP, 2015), school districts spend,
on average, nearly $18,000 per teacher toward training, mentoring, evaluating, and ongoing
support for teachers annually. Their return on that investment is minimal at best. TNTP found:
• Most teachers do not appear to improve substantially from year to year - including many
who fail to master foundational skills and competencies.
PR/Award# S374A200020
Page e27
1 1
• Even when teachers improve, they were unable to link their growth to any particular
development strategy.
• School systems are not helping teachers understand how to improve - or even that they
have room to improve at all.
LEAD has overcome many of these challenges but still struggles with others. Teachers have
consistently grown and developed, but that development and has been inconsistent from campus
to campus. Some schools employ more instructional coaches; others require teachers to participate
in more coaching sessions. Teacher development remained decentralized and was a function of
the effectiveness of school-based personnel. Some schools developed and retained teachers,
while others were unable to do so. The results fluctuated annually. Ultimately, due to low staff
retention rates, student performance plateaued. For every highly effective LPS teacher (rated
above 4.0 on Instruction), there are two teachers who are novices and likely to be ineffective (3.2
on Instructional). For LEAD Public Schools to eliminate students' achievement gaps, students
need more consistent access to highly-effective educators.
That consistent access can only come as the result of attracting, developing, and retaining
teachers over time. This work is complex and is driven by weighing the value gained through
employment at LEAD against other organizations and opportunities. For some employees, the
decision will be guided by the work, for others - development opportunities, and for others -
financial rewards. Compensation is a significant factor in this process for many, and LEAD's
antiquated human capital strategy and lockstep teacher pay system was a clear contributing
factor to teacher turnover. The fallacies and pitfalls within this system are many. They are
encapsulated well in a recent report from The New Teacher Project entitled Shortchanged: The
Hidden Costs of Lockstep Teacher Pay (2014). LEAD fell into the same trap as most school
systems where:
PR/Award# S374A200020
Page e28
12
. . . the money devoted to teacher salaries is not actually paying for great teaching. Instead, it is paying for paper credentials and time on the job. Neither of these is a reliable indicator of student success, particularly beyond the first few years in the classroom. As a result, lockstep pay hampers recruitment, creates perverse incentives for retention, and ignores the urgency of bringing top talent to the schools that most need great teachers.
LPS understands that schools' core business is teaching and learning. Furthermore, teachers
are the single most critical component in closing students' achievement gaps. The problem with
lockstep teacher compensation is that it communicates and reinforces the opposite. It poses three
significant impediments for teachers:
1 . Low early-career salaries keep talented people from even considering teaching.
2 . Great teachers feel pressure to leave the classroom to earn more compensation and move
up the traditional career path, while less successful ones are encouraged to stay.
3 . The best teachers aren't recognized for leading classrooms where they are needed most.
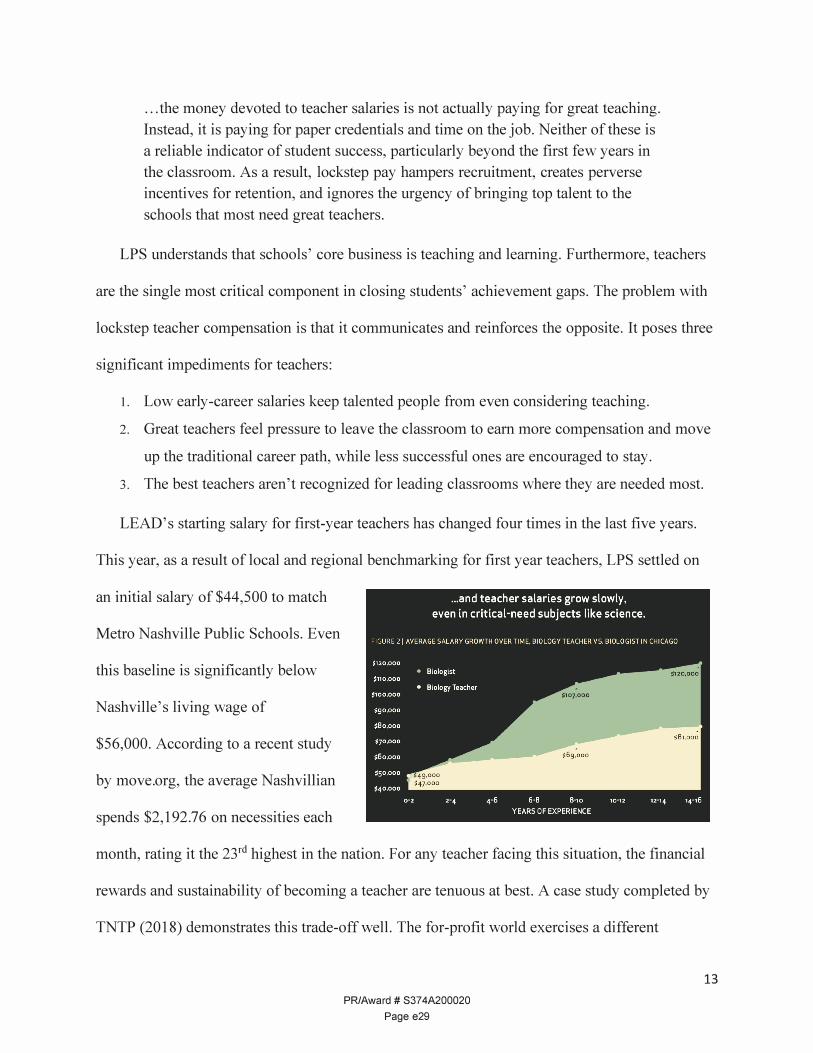
LEAD's starting salary for first-year teachers has changed four times in the last five years.
This year, as a result of local and regional benchmarking for first year teachers, LPS settled on
an initial salary of $44,500 to match
Metro Nashville Public Schools. Even
this baseline is significantly below
Nashville's living wage of
$56,000. According to a recent study
by move.org, the average Nashvillian
spends $2,192.76 on necessities each
month, rating it the 23rd highest in the nation. For any teacher facing this situation, the financial
rewards and sustainability of becoming a teacher are tenuous at best. A case study completed by
TNTP (2018) demonstrates this trade-off well. The for-profit world exercises a different
PR/Award# S374A200020
Page e29
13
compensation strategy where individuals can earn more and earn it earlier throughout their career
than they could in the classroom. The graph above illustrates this, comparing biologists with
biology teachers.
For LEAD teachers, the lockstep system for teacher pay created an internal pressure for the
best teachers to leave the classroom as quickly as possible. The upward trajectory of becoming
an Instructional Coach or Dean was the only opportunity to rapidly increase their compensation
trajectory as they would in any other profession. In addition, movement upward along the career
track was the only way to be recognized as an effective educator. It is good to move up and to
make more money, but this paradigm is contrary to what is best for students. To establish
teachers as the most critical resource in LPS, a system that rewards and recognizes their
contribution to the classroom and achieving incredible student outcomes must be implemented.
Within LPS and many other school districts, there is a strong disincentive for teachers to
teach where they are needed most. With a lockstep system of a large school district, teachers can
earn the same amount of compensation teaching at a highly affluent school in the suburbs as at a
Title I school. The emotional toll, the stress, and frequent lack of parent involvement mean Title
I schools often have a significantly more demanding work environment than schools in affluent
settings. Carver-Thomas and Darling-Hammond (2017) noted turnover was 50% higher in Title I
schools. As a result, effective educators working in these challenging environments face a choice:
continue teaching where they are needed the most or move on to teach somewhere else. If the
compensation is equal, a teacher's only leverage to create a more beneficial value proposition for
themselves is to seek the environment that allows them to feel most fulfilled in their personal
life. Given the challenges of these Title I schools, the only rational choice a teacher can make is
to move to an easier work environment. LEAD has recognized this disincentive and has chosen
PR/Award# S374A200020
Page e30
14
to overcome it. LEADing Onward has been intentionally crafted to attract, develop, and retain
the best teachers and keep them where they are needed most.
2. Integration with related efforts using existing funding streams
3. Part of a comprehensive effort to improve teaching and learning and support rigorous
academic standards for students
LEAD Public Schools (LPS) is conscientiously striving to be the "Best Place to Work" by
integrating new opportunities for educators to earn rewards based on their performance and
student outcomes. LPS believes in investing in teachers, recognizing they are the most important
in-school factor for student success. Since its inception 13 years ago, LPS has consistently
provided students across Nashville with substantial opportunities to access an excellent, college
preparatory 5th -12th grade education and has seen strong results. It has a history of college
acceptance for 100% of its graduates.
In 2019, in response to the needs outlined previously, LPS began researching and designing
an integrated approach aimed to improve student achievement and develop organizational
capacity. Through that review, one truth kept coming to the forefront; there were no silver
bullets. For decades, researchers have studied the educational landscape to understand what
ingredients create the most successful learning environments to promote student achievement.
Focusing on any single element within this environment could produce incremental changes for
student outcomes, but building the type of sustained radical transformation desired at LEAD, a
more integrated approach was required. That change could only be realized through intentional
leadership.
In a 2011 report titled Return on Leadership: Competencies that Generate Growth, Komm
and his colleagues found that having good people alone did make the most significant difference
in an organization's performance. Top performing organizations all had exceptional talent. They
stated, "having good leaders is not good enough; only excellence makes the difference." They
PR/Award# S374A200020
Page e31
15
found no standard formula for success. No specific set of skills or competencies universally
demonstrated the most significant impact. Leadership effectiveness varied depending upon the
organization and its unique and specific growth strategies. They further noted that the top-tier
leaders consistently made the most significant impact on the organization in three focused areas -
developing critical skills throughout the organization, team leadership, and change leadership.
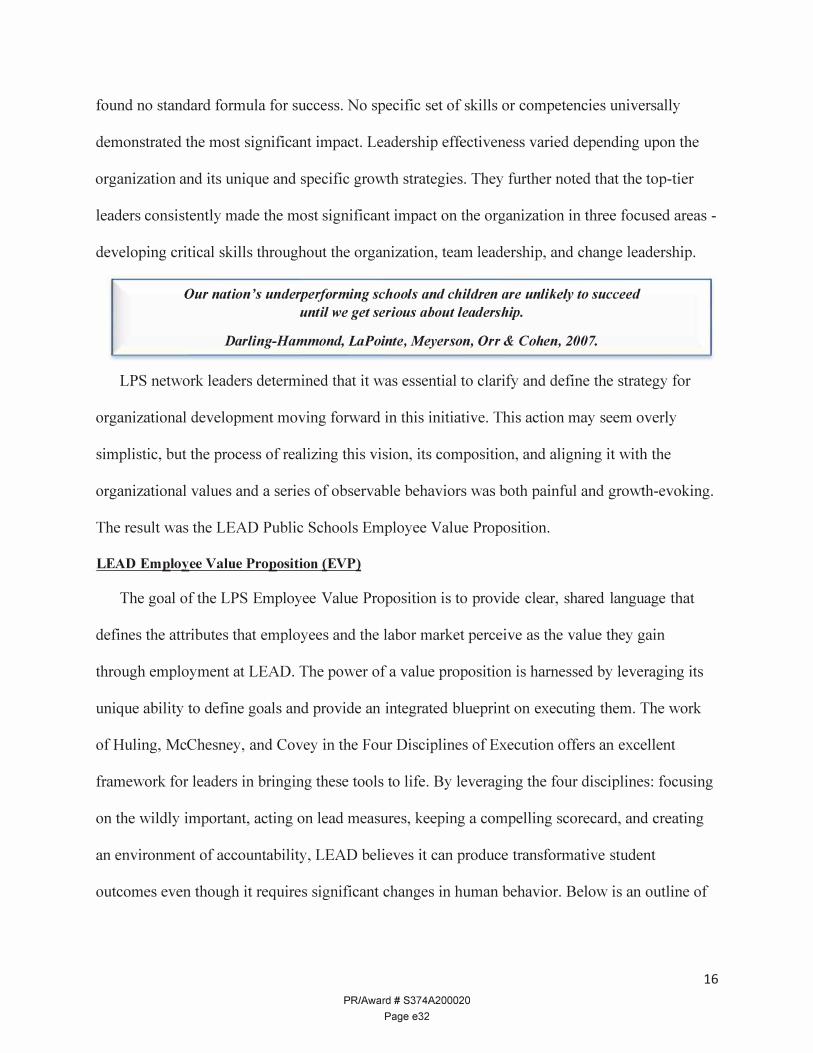
Our nation 's underperforming schools and children are unlikely to succeed until we get serious about leadership.
Darling-Hammond, LaPointe, Meyerson, Orr & Cohen, 2007.
LPS network leaders determined that it was essential to clarify and define the strategy for
organizational development moving forward in this initiative. This action may seem overly
simplistic, but the process of realizing this vision, its composition, and aligning it with the
organizational values and a series of observable behaviors was both painful and growth-evoking.
The result was the LEAD Public Schools Employee Value Proposition.
LEAD Employee Value Proposition (EVP)
The goal of the LPS Employee Value Proposition is to provide clear, shared language that
defines the attributes that employees and the labor market perceive as the value they gain
through employment at LEAD. The power of a value proposition is harnessed by leveraging its
unique ability to define goals and provide an integrated blueprint on executing them. The work
of Huling, McChesney, and Covey in the Four Disciplines of Execution offers an excellent
framework for leaders in bringing these tools to life. By leveraging the four disciplines: focusing
on the wildly important, acting on lead measures, keeping a compelling scorecard, and creating
an environment of accountability, LEAD believes it can produce transformative student
outcomes even though it requires significant changes in human behavior. Below is an outline of
PR/Award# S374A200020
Page e32
16
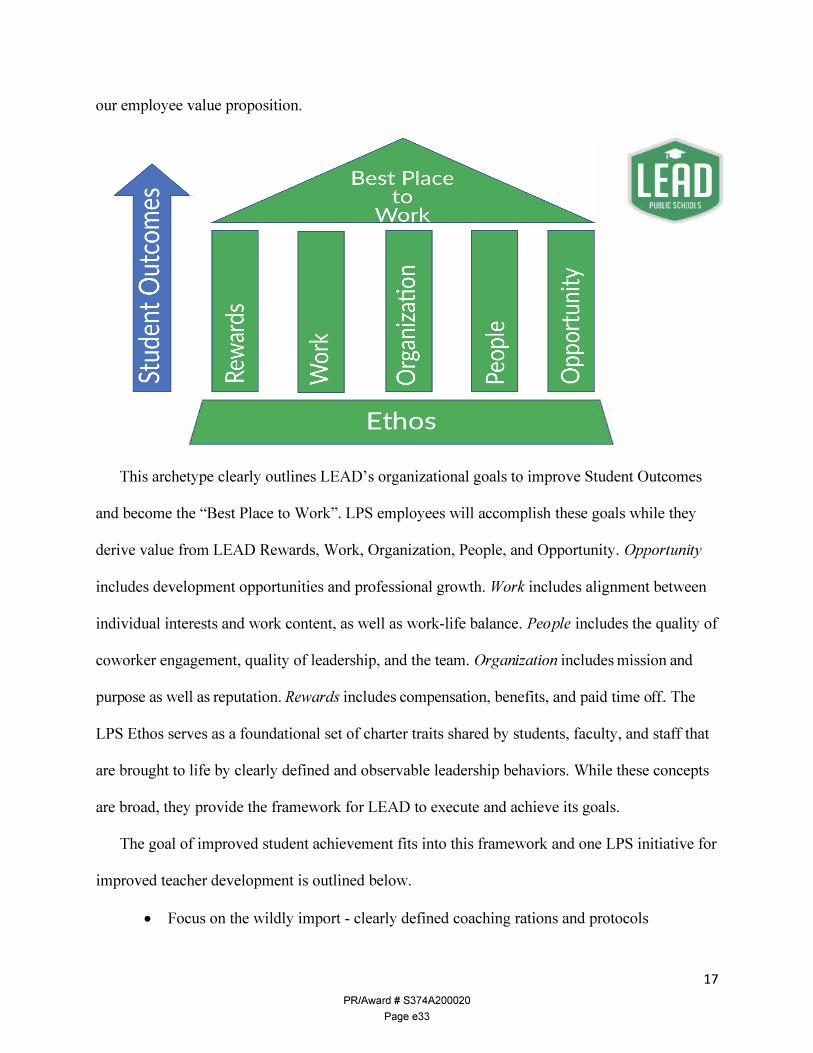
our employee value proposition.
LEAD PUBLIC SCHOOLS
Ethos
This archetype clearly outlines LEAD's organizational goals to improve Student Outcomes
and become the "Best Place to Work". LPS employees will accomplish these goals while they
derive value from LEAD Rewards, Work, Organization, People, and Opportunity. Opportunity
includes development opportunities and professional growth. Work includes alignment between
individual interests and work content, as well as work-life balance. People includes the quality of
coworker engagement, quality of leadership, and the team. Organization includes mission and
purpose as well as reputation. Rewards includes compensation, benefits, and paid time off. The
LPS Ethos serves as a foundational set of charter traits shared by students, faculty, and staff that
are brought to life by clearly defined and observable leadership behaviors. While these concepts
are broad, they provide the framework for LEAD to execute and achieve its goals.
The goal of improved student achievement fits into this framework and one LPS initiative for
improved teacher development is outlined below.
• Focus on the wildly import - clearly defined coaching rations and protocols
PR/Award# S374A200020
Page e33
17
• Act on leading measures - observe and respond to teachers' mastery of the five core
behavior management techniques • Keep a compelling scorecard - use a shared tracker with consistent language • Accountability - leadership discussions daily and weekly within school teams, bi
weekly meetings with principals and heads of school, monthly network data review
This process provides a clear plan for leaders to execute, while also creating value for
teachers. Teachers want to become more effective; they want to be coached. This initiative
differentiates LPS in the marketplace by providing an instructional coach for every eight teachers
to ensure all teachers have the support they need to become effective. Furthermore, it signals to
teachers that LPS will consistently coach and develop them by providing high-impact strategies
that produce significant student gains. By highlighting this goal, aligning resources, and creating
a shared importance through accountability, all LEAD members can embrace this behavioral
change. As a part of its EVP, other initiatives during the 2019-2020 school year included:
• A performance-based compensation strategy for teachers and leaders • An incentivized approach to keep the best teachers in the classroom • An established ratio of one instructional leader for every eight teachers • A defined leadership development program including executive coaching • A customized 360 survey tool to evaluate leadership development against a series of
observable behaviors grounded in LPS Ethos • Clear expectations for the development and management of teachers using Tennessee's
TEAM evaluation model • A best-in-class paid 16-week maternity plan
Integrated together, these initiatives are designed to produce significantly improved student
outcomes through improved retention of employees, improved ability to attract talent, clarity of
roles, responsibilities, more effective coaching and management, leadership readiness, and
alignment.
PR/Award# S374A200020
Page e34
18
- ---
--
-- � ff Finding, hiring, and Managing for
retaining the right talent performance results (includes staffing pl�nning, (includes motivating/engaging employees,
sourcing, interviewing, hiring quality conversations, shared priorities, and decisions, onboarding) developing employee skills and ropabilities)
• Ill
I I I • • • Ill Ill Ill
Fair compensation and the Building organization employee value proposition capacity and capability
(includes performance-based (includes leadership credibility,job compensation strategy, accountabilities, organization structure,
market data, incentive plans, total effective teams, and HR administration) compensation, and other benefits)
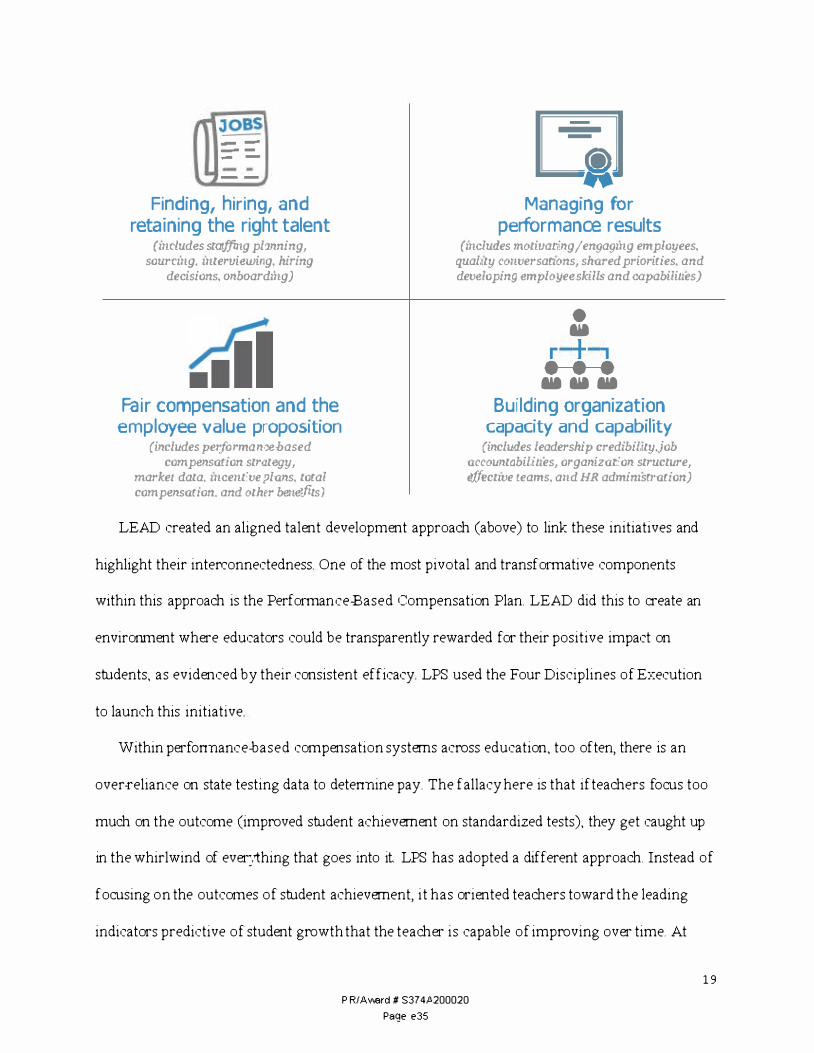
LEAD created an aligned talent development approach (above) to link these initiatives and
highlight their interconnectedness. One of the most pivotal and transformative components
within this approach is the Performance-Based Compensation Plan. LEAD did this to create an
environment where educators could be transparently rewarded for their positive impact on
sb.idents, as evidenced by their consistent efficacy. LPS used the Four Disciplines of Execution
to launch this initiative.
Within performance-based compensation systems across education, too often, there is an
over-reliance on state testing data to determine pay. The fallacy here is that ifteachers focus too
much on the outcome (improved sb.ident achievement on standardized tests), they get caught up
in the whirlwind of everything that goes into it LPS has adopted a different approach. Instead of
focusing on the outcomes of sb.ident achievement, it has oriented teachers toward the leading
indicators predictive of student growth that the teacher is capable of improving over time. At
PR/A'I\Elrd # S374A200020
Page e35
19
LEAD, there is a statistically significant positive correlation (0. 82) between TEAM evaluations
and TV AAS growth. This trend is significant because it allows teachers to focus on honing their
craft by leveraging the TEAM rubric to improve student outcomes through shared developmental
language and as a roadmap to improving instruction. Furthermore, it links teachers' coaching
with personal accountability and rewards them financially for their efforts.
Another element of the LPS PBCS is a year-end bonus for principals and organizational
leaders. While leading indicators drive the entire approach, a more balanced approach is used for
leaders: 50% of compensation is dependent upon student outcomes as measured by TNReady
achievement and growth, and the other 50% is driven by school culture, student attendance,
teacher retention, and professional growth.
Rewards focus on educator development and the process of improving rather than merely an
end result across the organization. This action creates an aligned environment where
compensation functions alongside Opportunity, People and Work to attract and develop and
retain educators. Southwest Airlines serves as an incredible case study of an organization that
has achieved similar goals through its unique employee value proposition. The company's
overall attitude can best be summarized by the airline's Co-founder and Chairman Emeritus Herb
Kelleher, who said, "The business of business is people." Southwest has been an organizational
leader with incredible customer ratings, minimal turnover, and high employee satisfaction. These
outcomes at Southwest were not the result of simply paying a premium for talent. Instead, they
were rooted in an overall strategy that incorporates hiring against culture fit, modeling the way,
aligning the work, and empowering and appreciating their employees. Along with compensation
and culture, they make a compelling and unique proposition within the labor market. LEAD
Public Schools (LPS) has a similar goal: to create a consistent culture of sustainable growth and
PR/Award# S374A200020
Page e36
20
student achievement through this same type of integrated strategy defined by the employee value
proposition.
One year ago, LPS secured funding from the Scarlett Family Foundation to begin this work
in earnest by establishing a new three-year program, Developing High-Performing School
Leaders. This project is helping LEAD identify and systematize strong teacher development
practices rooted in a common, content-specific vision for instruction for long-term talent
development. It is based on developmental leadership, using leadership coaching and supports to
assist leaders toward a better understanding of themselves to help others work toward excellent
instruction. Over three years, it will build on skills and knowledge for three cohort groups:
beginning with leaders at the organizational level and expanding to include school leaders, then
emerging leaders. Each cohort of educators will participate in executive coaching through the
Leadership Research Institute, Teach Like a Champion training through TNTP, and DesignED
coaching.
This program is designed to allow leaders to fully understand and leverage their individual
authentic leadership style and build a customized development plan. To help leaders understand
and articulate their unique and authentic leadership style, they will be assessed using a common
set of shared protocols. MAI Positive Core TM will be the primary assessment. It combines the
results of four highly-respected assessment tools to create a comprehensive and actionable
picture of individual and team strengths, leverage points, gaps, and targeted areas for
development. The four assessments include :
• Emergenetics Assessment - This assessment provides clear insights into preferred thinking styles and behavior preferences which are used to increase individual
effectiveness and expand the capacity to work with others. • VIA-IS: Signature Strengths Assessment - The Values in Action Inventory of
Strengths (VIA-IS) is a self-report questionnaire that measures 24 strengths of character
PR/Award# S374A200020
Page e37
21
organized under six core virtues. The VIA report identifies the respondent's signature
values. • Strengths Finder 2.0 - The results provide a stack ranking of the respondent's signature
talents and develop natural talent. • Kolbe - The Kolbe A Index measures a person's instinctive method of operation (MO);
how a person takes action and solves problems; identifies the ways he or she will be most productive.
• Thomas Kihnann Conflict Mode Instrument (TKI) - The TKI assists in understanding
your preferred conflict mode, five conflict resolution approaches, and expanded tools in resolving conflict.
An individual plan is created using information from those assessments, and executive
coaching begins. A 360-degree feedback tool is given to managers, peers, and direct reports and
is used to measure progress over time. This customized assessment is aligned with LEAD's ethos
through a series of observable leadership behaviors. It provides keen insights into authentic
leadership development across the organizational hierarchies. Once completed, this data is then
coupled with more targeted executive coaching, allowing leaders to develop faster over time in
their areas of most critical need. Currently, this initiative is in its second year. It began with
network-level leaders and will be followed by principal leadership, then assistant principals, and
instructional coaches. Through assessment and ongoing support, they will assist in diagnosing
the current impact of teacher development efforts, provide systemic development to instructional
leaders, and address organizational culture. This initiative is designed to retain excellent leaders
where everyone is committed and contributes to the organization's mission. Over time, it is
expected to contribute to the body of knowledge on school leadership and to support teacher
development and its effects on student outcomes.
Alongside these human capital initiatives, LPS invested in strongly-aligned curricula in
English/Language Arts and math to ensure students have access to rigorous, grade-appropriate
content. To support the curriculum and teacher development initiatives, LPS made additional
instructional coaching personnel investments, creating a 1 :8 ratio for teacher development. These
PR/Award# S374A200020
Page e38
22
efforts have proven effective; most teachers rated observation/feedback and professional
development as effective, according to 2020 Insight evaluation results at the end of the school
year.
These strategies, coupled with PBCS, align with LPS's recently-developed Strategic Plan. It
identified talent recruitment, talent and leadership development, and teacher shortages as the most
critical weaknesses. At the same time, Human Capital was the greatest strength, particularly
strengthening employee value, teacher development and compensation, leadership development, and
the depth and breadth of its Senior Leadership Team.
Additionally, LEADing Onward is aligned with Tennessee's Best for All initiative. Its focus
on setting all students on a path to success, particularly its three elements for educators
(Recruitment, Pathways, Development). This project employs Tennessee's Best for All
Recruitment strategies by continuing to support improvements to educator compensation,
Pathways strategies to elevate teacher leaders and professional development, and Development
strategies to support the development of effective leaders in schools. It also implements its
student strategy, Supports, quickly and appropriately responding to students' needs.
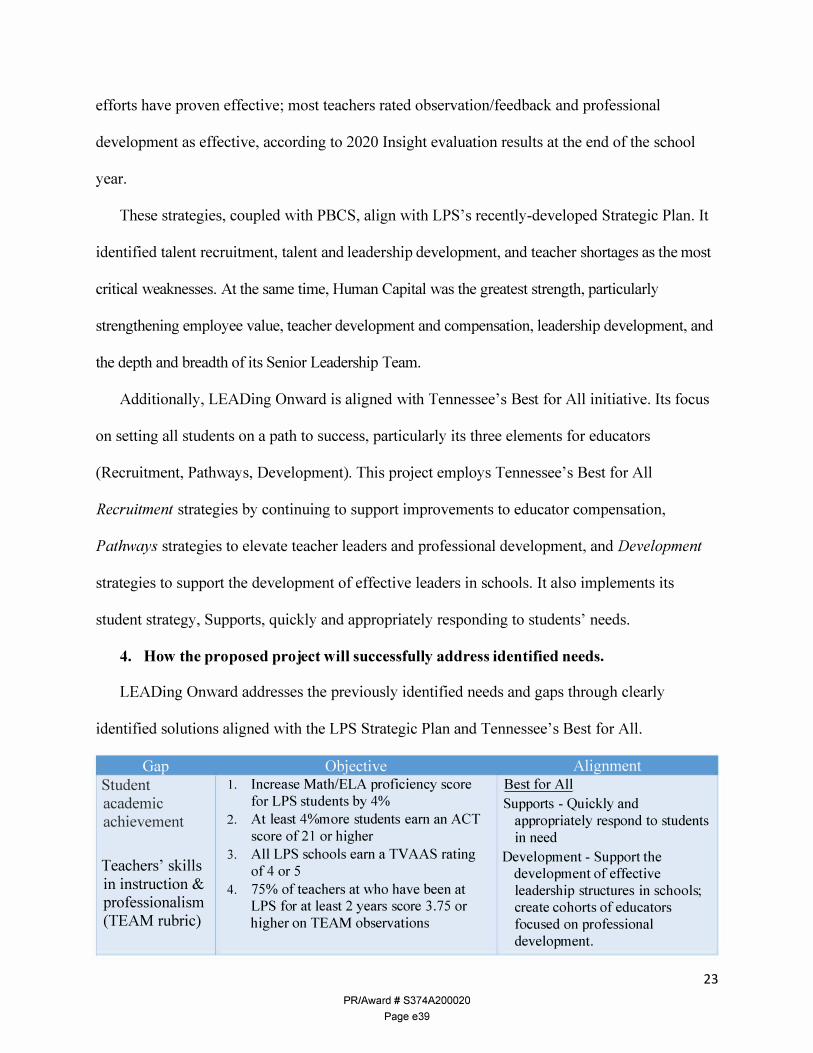
4. How the proposed project will successfully address identified needs.
LEADing Onward addresses the previously identified needs and gaps through clearly
identified solutions aligned with the LPS Strategic Plan and Tennessee's Best for All.
Gap Objective Alignment Student 1 . Increase Math/ELA proficiency score Best for All
academic for LPS students by 4% Supports - Quickly and
achievement 2 . At least 4%more students earn an ACT appropriately respond to students score of 21 or higher in need
Teachers' skills in instruction & professionalism (TEAM rubric)
3 . All LPS schools earn a TV AAS rating of 4 or 5
4 . 75% of teachers at who have been at LPS for at least 2 years score 3.75 or higher on TEAM observations
Development - Support the development of effective leadership structures in schools; create cohorts of educators focused on professional development.
PR/Award# S374A200020
Page e39
23
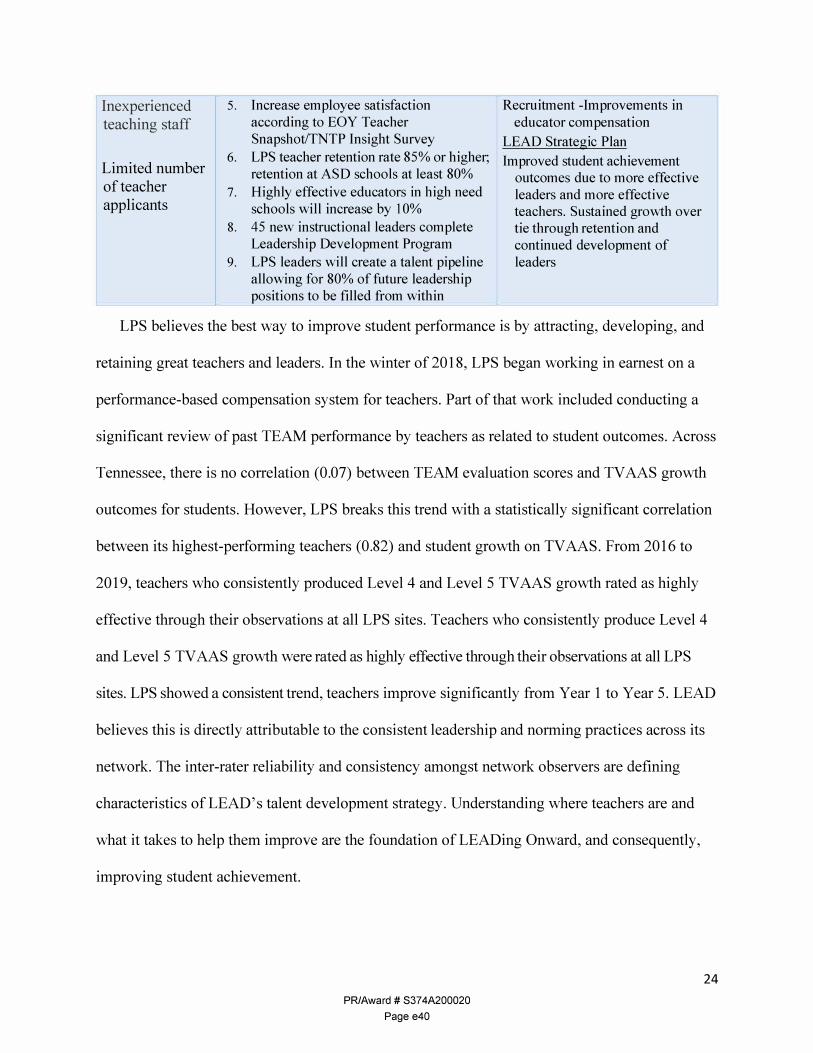
Inexperienced teaching staff
5 . Increase employee satisfaction according to EOY Teacher Snapshot/TNTP Insight Survey
Recruitment -Improvements in educator compensation
LEAD Strategic Plan
Limited number of teacher applicants
6 . LPS teacher retention rate 85% or higher; retention at ASD schools at least 80%
7 . Highly effective educators in high need schools will increase by 10%
Improved student achievement outcomes due to more effective leaders and more effective teachers. Sustained growth over
8 . 45 new instructional leaders complete tie through retention and Leadership Development Program continued development of
9 . LPS leaders will create a talent pipeline leaders allowing for 80% of future leadership positions to be filled from within
LPS believes the best way to improve student performance is by attracting, developing, and
retaining great teachers and leaders. In the winter of 2018, LPS began working in earnest on a
performance-based compensation system for teachers. Part of that work included conducting a
significant review of past TEAM performance by teachers as related to student outcomes. Across
Tennessee, there is no correlation (0.07) between TEAM evaluation scores and TV AAS growth
outcomes for students. However, LPS breaks this trend with a statistically significant correlation
between its highest-performing teachers (0.82) and student growth on TV AAS. From 2016 to
2019, teachers who consistently produced Level 4 and Level 5 TV AAS growth rated as highly
effective through their observations at all LPS sites. Teachers who consistently produce Level 4
and Level 5 TV AAS growth were rated as highly effective through their observations at all LPS
sites. LPS showed a consistent trend, teachers improve significantly from Year 1 to Year 5. LEAD
believes this is directly attributable to the consistent leadership and norming practices across its
network. The inter-rater reliability and consistency amongst network observers are defining
characteristics of LEAD's talent development strategy. Understanding where teachers are and
what it takes to help them improve are the foundation of LEADing Onward, and consequently,
improving student achievement.
PR/Award# S374A200020
Page e40
24
Nationally, one of the most significant critiques of performance-based compensation plans
for teachers is that they over-rely on student achievement data. Because of the strong positive
correlation between TEAM scores and TV AAS outcomes, LEAD chose to focus on the leading
edge internal indicators instead of the lagging student outcomes. This decision allowed teachers
to focus on a series of short-term concrete goals and action steps with their coach, as opposed to
the long-term and misguided approach of trying to "teach to the test". This formed the basis for
LEADing Onward, recognizing that teachers embraced the plan and that it would prove valuable
in improving student achievement.
Quality of the Project Design
1. The extent to which the proposed project demonstrates a rationale
LEADing Onward is the culmination of extensive research and collaborative planning
aligned with Tennessee's Best for All strategic plan and LEAD's desire to improve teaching and
learning across the Network. The LPS team was deliberate in seeking counsel and outside
expertise as it reviewed best practices related to organizational development, employee value
propositions, teacher and principal development, and performance-based compensation. LEAD
took an innovative approach in designing its plan. The team did not focus on a single strategy to
determine what worked. Instead, it analyzed each aspect of best practices in this context. LPS is
confident that LEADing Onward will produce positive outcomes for students during the funding
period and beyond, because its key program elements are based in sound evidence of principles
of human and organizational development as well as K-12 education. LEAD Public Schools
(LPS) believes that the best way to improve students' outcomes is by recruiting, developing, and
retaining highly-effective teachers and leaders. It developed a plan to redesign the Employee
Value Proposition by providing clear, shared language that describes "why". The "why" at
LEAD is clearly defined as significantly improved student outcomes and a desire to be the "Best
PR/Award# S374A200020
Page e41
25
Place to Work" in Nashville. Simon Sinek says, "People don't buy what you do; they buy
why you do it. And what you do simply proves what you believe". LEAD believes that by
looking critically at the work, the opportunity, and the rewards, they can craft an integrated
approach to develop and sustain capacity building across all organization levels for the
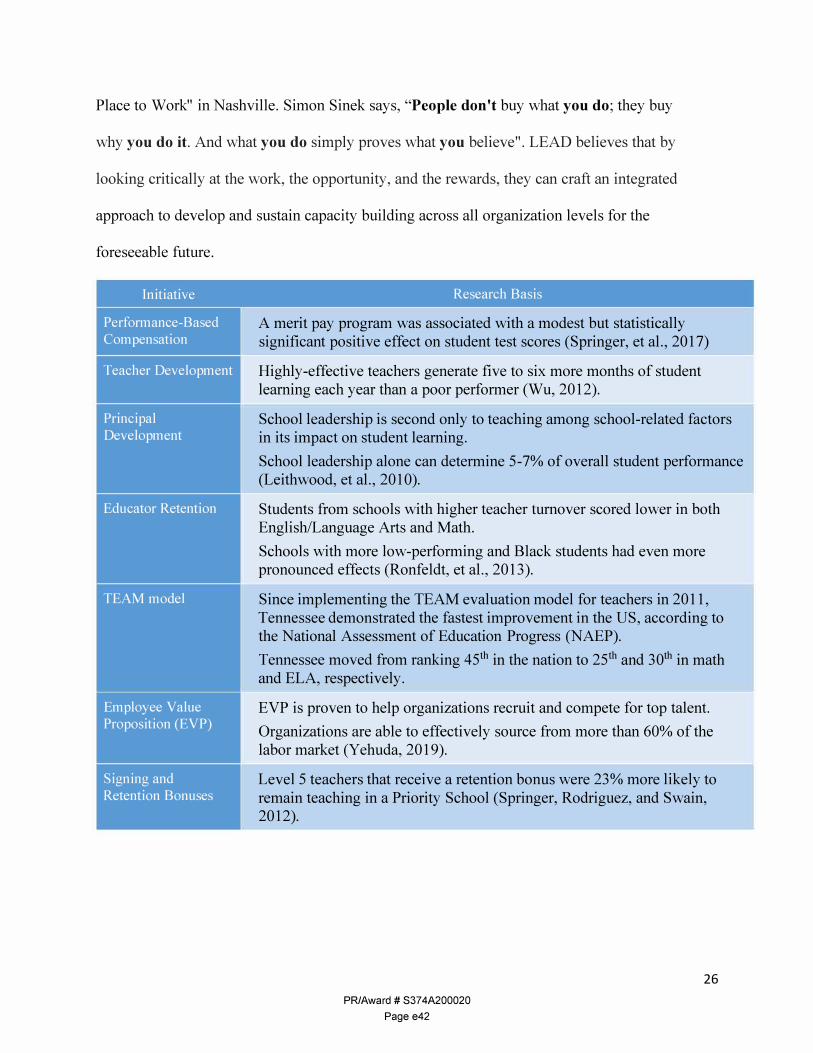
foreseeable future.
Initiative Research Basis
Performance-Based Compensation
A merit pay program was associated with a modest but statistically significant positive effect on student test scores (Springer, et al., 2017)
Teacher Development Highly-effective teachers generate five to six more months of student learning each year than a poor performer (Wu, 2012).
Principal Development
School leadership is second only to teaching among school-related factors in its impact on student learning. School leadership alone can determine 5-7% of overall student performance (Leithwood, et al., 2010).
Educator Retention Students from schools with higher teacher turnover scored lower in both English/Language Arts and Math. Schools with more low-performing and Black students had even more pronounced effects (Ronfeldt, et al., 2013).
TEAM model Since implementing the TEAM evaluation model for teachers in 2011, Tennessee demonstrated the fastest improvement in the US, according to the National Assessment of Education Progress (NAEP). Tennessee moved from ranking 45th in the nation to 25th and 30th in math and ELA, respectively.
Employee Value Proposition (EVP)
EVP is proven to help organizations recruit and compete for top talent. Organizations are able to effectively source from more than 60% of the labor market (Yehuda, 2019).
Signing and Retention Bonuses
Level 5 teachers that receive a retention bonus were 23% more likely to remain teaching in a Priority School (Springer, Rodriguez, and Swain, 2012).
PR/Award# S374A200020
Page e42
26
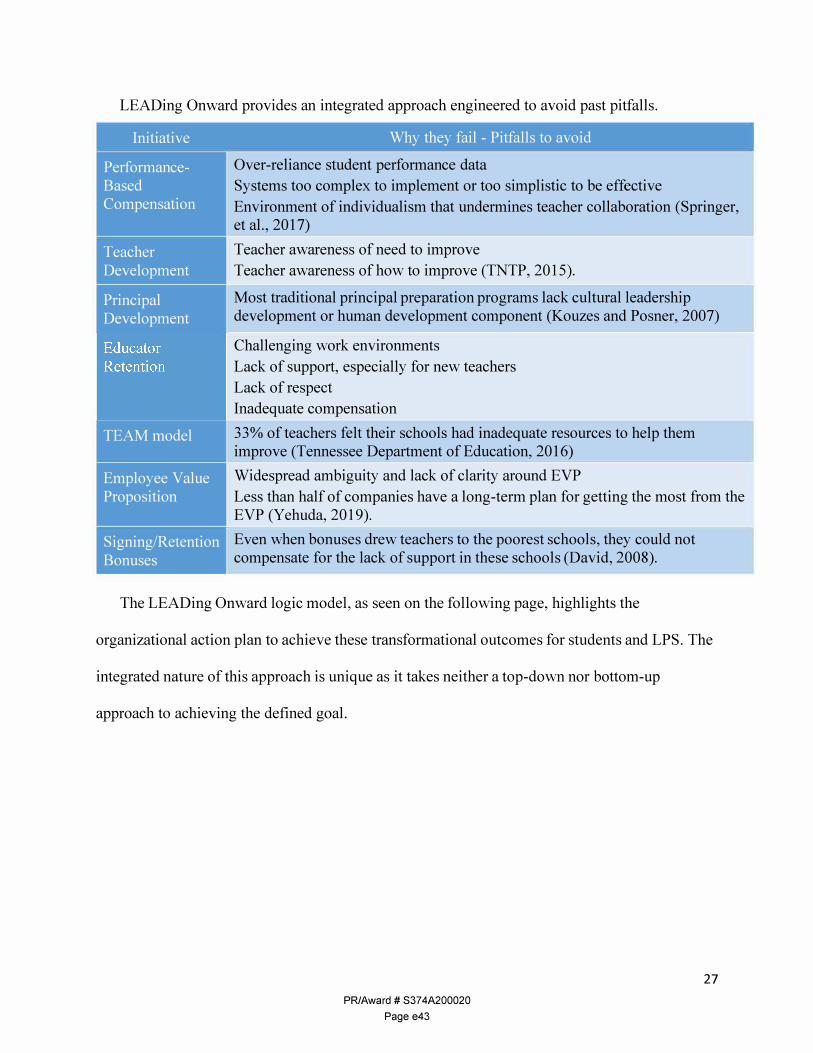
LEADing Onward provides an integrated approach engineered to avoid past pitfalls.
Initiative Why they fail - Pitfalls to avoid
Performance Over-reliance student performance data Based Compensation
Systems too complex to implement or too simplistic to be effective Environment of individualism that undermines teacher collaboration (Springer, et al., 2017)
Teacher Teacher awareness of need to improve Development Teacher awareness of how to improve (TNTP, 2015).
Principal Development
Most traditional principal preparation programs lack cultural leadership development or human development component (Kouzes and Posner, 2007)
Challenging work environments Lack of support, especially for new teachers Lack of respect Inadequate compensation
TEAM model 33% of teachers felt their schools had inadequate resources to help them improve (Tennessee Department of Education, 2016)
Employee Value Proposition
Widespread ambiguity and lack of clarity around EVP Less than half of companies have a long-term plan for getting the most from the EVP (Yehuda, 2019).
Signing/Retention Bonuses
Even when bonuses drew teachers to the poorest schools, they could not compensate for the lack of support in these schools (David, 2008).
The LEADing Onward logic model, as seen on the following page, highlights the
organizational action plan to achieve these transformational outcomes for students and LPS. The
integrated nature of this approach is unique as it takes neither a top-down nor bottom-up
approach to achieving the defined goal.
PR/Award# S374A200020
Page e43
27
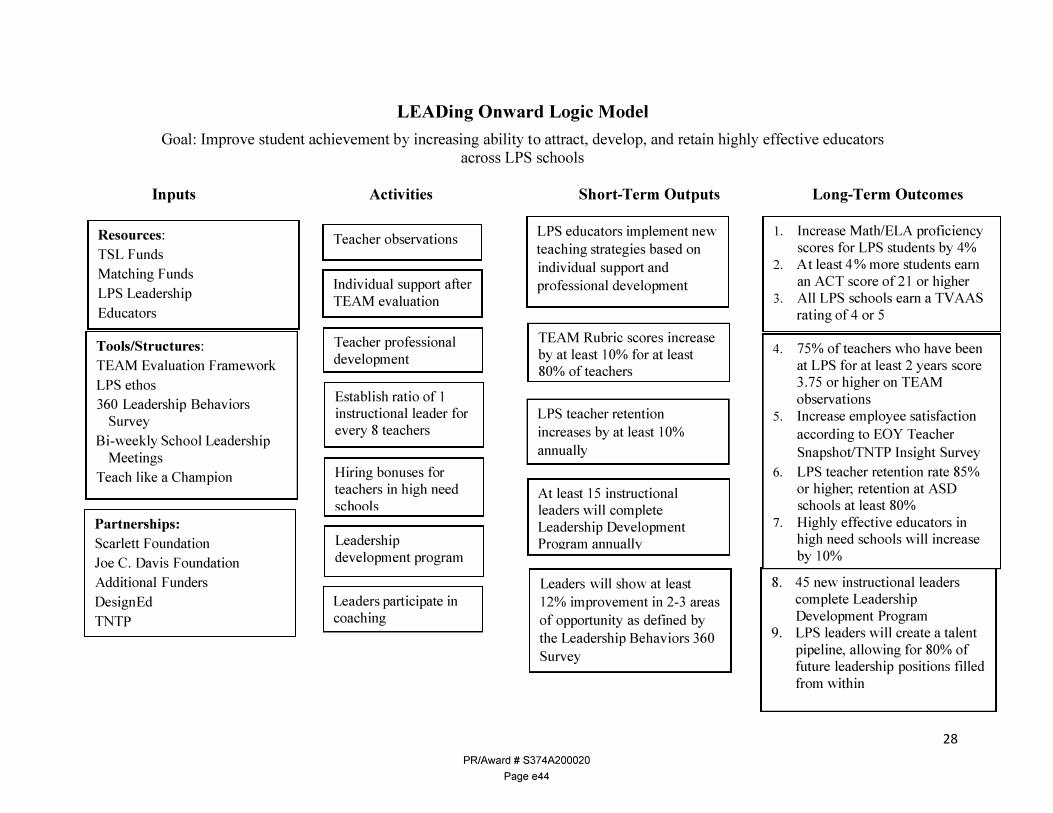
LEADing Onward Logic Model
Goal: Improve student achievement by increasing ability to attract, develop, and retain highly effective educators across LPS schools
Inputs
Resources :
TSL Funds
Matching Funds
LPS Leadership
Educators
Tools/Structures :
TEAM Evaluation Framework
LPS ethos
360 Leadership Behaviors Survey
Bi-weekly School Leadership Meetings
Teach like a Champion
Partnerships :
Scarlett Foundation
Joe C. Davis Foundation
Additional Funders
DesignEd
TNTP
Activities
Teacher observations
Individual support after TEAM evaluation
Teacher professional development
Establish ratio of 1 instructional leader for every 8 teachers
Hiring bonuses for teachers in high need school s
Leadership development program
Leaders participate in coaching
Short-Term Outputs
LPS educators implement new teaching strategies based on individual support and professional development
TEAM Rubric scores increase by at least 10% for at least 80% of teachers
LPS teacher retention increases by at least 10%
annually
At least 15 instructional leaders will complete Leadership Development Program annually
Leaders will show at least 12% improvement in 2-3 areas of opportunity as defined by the Leadership Behaviors 360 Survey
Long-Term Outcomes
1 . Increase Math/ELA proficiency scores for LPS students by 4%
2 . At least 4% more students earn an ACT score of 21 or higher
3 . All LPS schools earn a TV AAS rating of 4 or 5
4 . 75% of teachers who have been at LPS for at least 2 years score 3.7 5 or higher on TEAM observations
5 . Increase employee satisfaction according to EOY Teacher Snapshot/TNTP Insight Survey
6. LPS teacher retention rate 85% or higher; retention at ASD schools at least 80%
7 . Highly effective educators in high need schools will increase by 10%
8. 45 new instructional leaders complete Leadership Development Program
9. LPS leaders will create a talent pipeline, allowing for 80% of future leadership positions filled from within
PR/Award# S374A200020
Page e44
28
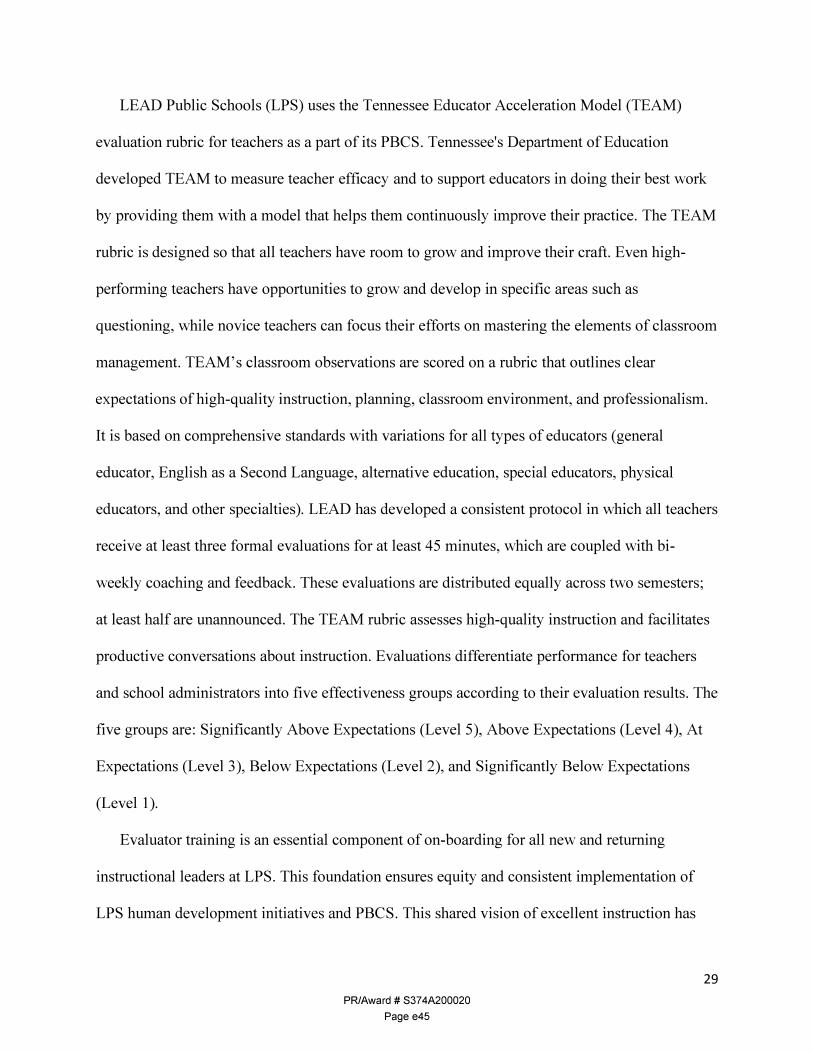
LEAD Public Schools (LPS) uses the Tennessee Educator Acceleration Model (TEAM)
evaluation rubric for teachers as a part of its PBCS. Tennessee's Department of Education
developed TEAM to measure teacher efficacy and to support educators in doing their best work
by providing them with a model that helps them continuously improve their practice. The TEAM
rubric is designed so that all teachers have room to grow and improve their craft. Even high
performing teachers have opportunities to grow and develop in specific areas such as
questioning, while novice teachers can focus their efforts on mastering the elements of classroom
management. TEAM's classroom observations are scored on a rubric that outlines clear
expectations of high-quality instruction, planning, classroom environment, and professionalism.
It is based on comprehensive standards with variations for all types of educators (general
educator, English as a Second Language, alternative education, special educators, physical
educators, and other specialties). LEAD has developed a consistent protocol in which all teachers
receive at least three formal evaluations for at least 45 minutes, which are coupled with bi
weekly coaching and feedback. These evaluations are distributed equally across two semesters;
at least half are unannounced. The TEAM rubric assesses high-quality instruction and facilitates
productive conversations about instruction. Evaluations differentiate performance for teachers
and school administrators into five effectiveness groups according to their evaluation results. The
five groups are: Significantly Above Expectations (Level 5), Above Expectations (Level 4), At
Expectations (Level 3), Below Expectations (Level 2), and Significantly Below Expectations
(Level 1).
Evaluator training is an essential component of on-boarding for all new and returning
instructional leaders at LPS. This foundation ensures equity and consistent implementation of
LPS human development initiatives and PBCS. This shared vision of excellent instruction has
PR/Award# S374A200020
Page e45
29
allowed LPS to strongly correlate instructional practices measured by the TEAM rubric into
leading indicators of student achievement, Key practices to ensure fidelity are extensive and
time-consuming, but this system wide fidelity allows LPS to leverage TEAM as a leading
indicator for student achievement on a consistent basis. They include:
• All observers achieve TEAM certification, which includes a sample assessment of scoring to ensure alignment with national raters at NIET.
• All observers norm consistently by practicing scoring and coaching together within the LPS network and their schools.
• New instructional leaders are provided the opportunity to norm at other LPS schools. • Walkthroughs during the first month of school and the first round of TEAM
observations are co-observed, pairing two instructional leaders at the same school to ensure fidelity.
• Network teams aggregate and analyze TEAM data reporting out trends to network leadership and principals.
• The Head of Academics and Innovation co-observes and collaboratively scores with all new instructional leaders across LPS.
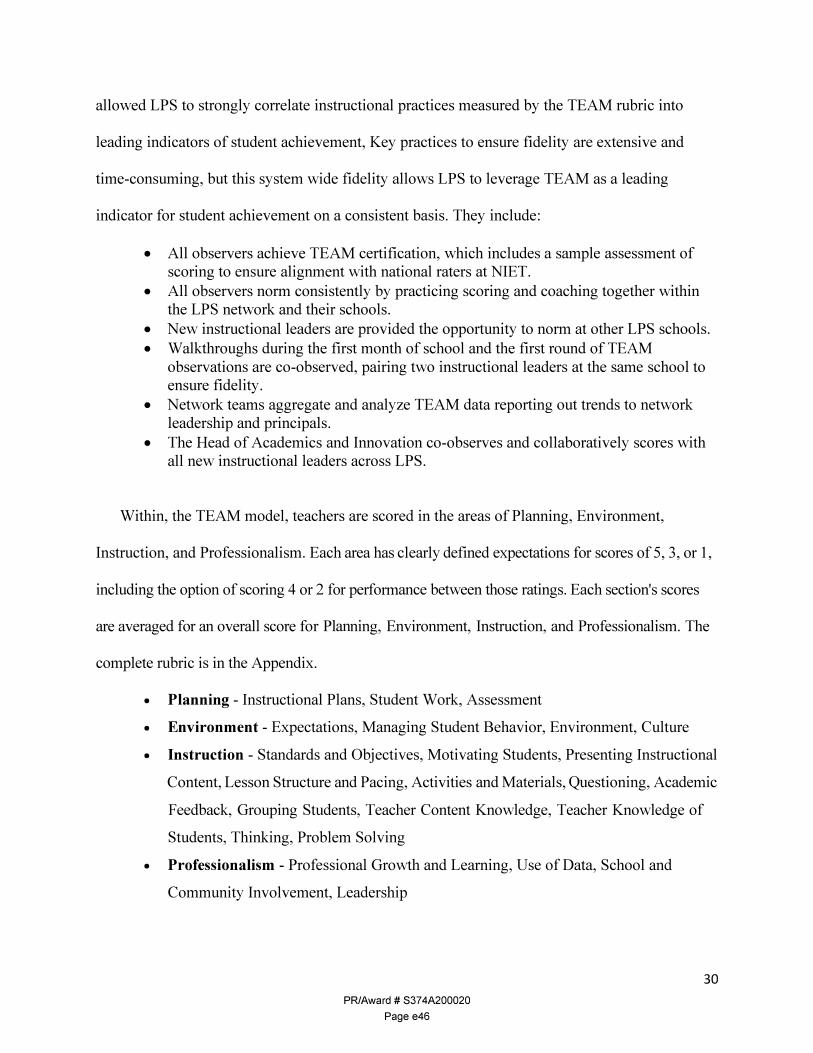
Within, the TEAM model, teachers are scored in the areas of Planning, Environment,
Instruction, and Professionalism. Each area has clearly defined expectations for scores of 5, 3, or 1,
including the option of scoring 4 or 2 for performance between those ratings. Each section's scores
are averaged for an overall score for Planning, Environment, Instruction, and Professionalism. The
complete rubric is in the Appendix.
• Planning - Instructional Plans, Student Work, Assessment • Environment - Expectations, Managing Student Behavior, Environment, Culture • Instruction - Standards and Objectives, Motivating Students, Presenting Instructional
Content, Lesson Structure and Pacing, Activities and Materials, Questioning, Academic
Feedback, Grouping Students, Teacher Content Knowledge, Teacher Knowledge of
Students, Thinking, Problem Solving • Professionalism - Professional Growth and Learning, Use of Data, School and
Community Involvement, Leadership
PR/Award# S374A200020
Page e46
30
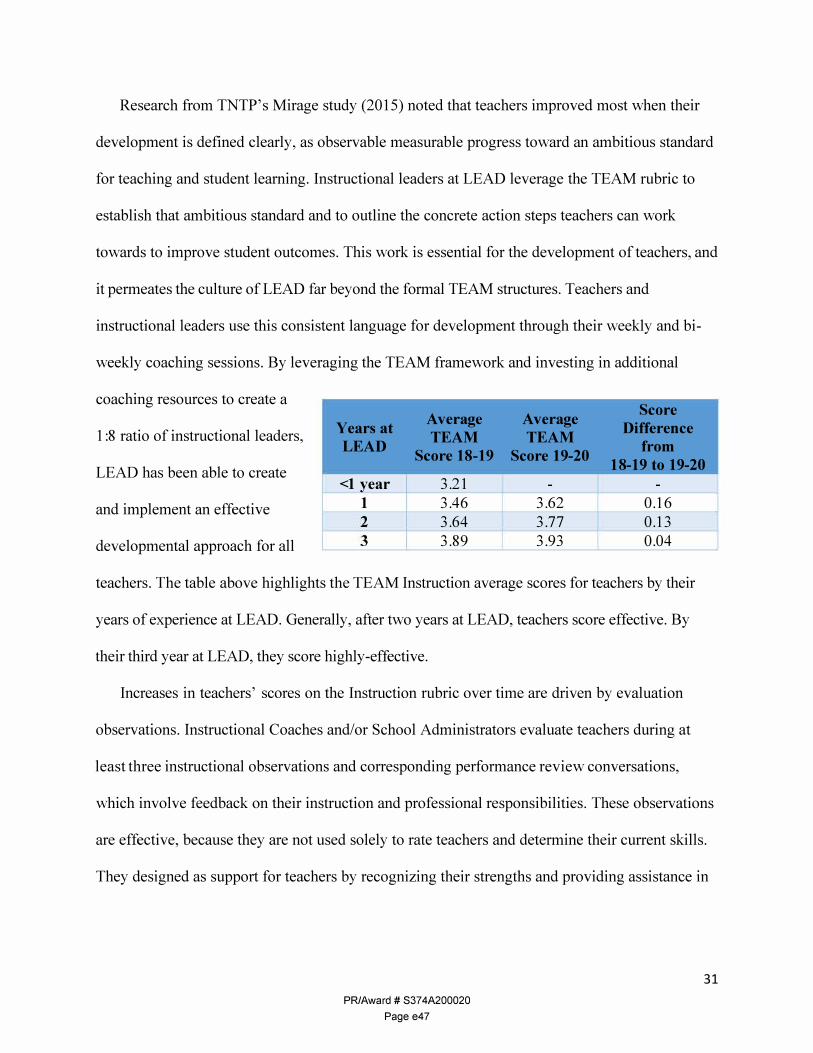
Research from TNTP's Mirage study (2015) noted that teachers improved most when their
development is defined clearly, as observable measurable progress toward an ambitious standard
for teaching and student learning. Instructional leaders at LEAD leverage the TEAM rubric to
establish that ambitious standard and to outline the concrete action steps teachers can work
towards to improve student outcomes. This work is essential for the development of teachers, and
it permeates the culture of LEAD far beyond the formal TEAM structures. Teachers and
instructional leaders use this consistent language for development through their weekly and bi
weekly coaching sessions. By leveraging the TEAM framework and investing in additional
coaching resources to create a
Years at LEAD
Average TEAM
Score 18-19
Average TEAM
Score 19-20
Score Difference
from 18-19 to 19-20
<l year 1
3.21 3.46
-
3.62 -
0.16 3.64 3.77 0.13 3.89 3.93 0.04
1 :8 ratio of instructional leaders,
LEAD has been able to create
and implement an effective
developmental approach for all
teachers. The table above highlights the TEAM Instruction average scores for teachers by their
years of experience at LEAD. Generally, after two years at LEAD, teachers score effective. By
their third year at LEAD, they score highly-effective.
Increases in teachers' scores on the Instruction rubric over time are driven by evaluation
observations. Instructional Coaches and/or School Administrators evaluate teachers during at
least three instructional observations and corresponding performance review conversations,
which involve feedback on their instruction and professional responsibilities. These observations
are effective, because they are not used solely to rate teachers and determine their current skills.
They designed as support for teachers by recognizing their strengths and providing assistance in
PR/Award# S374A200020
Page e47
3 1
developing areas that need improvement. During post-observation conferences, coaches provide
actual individualized professional development.
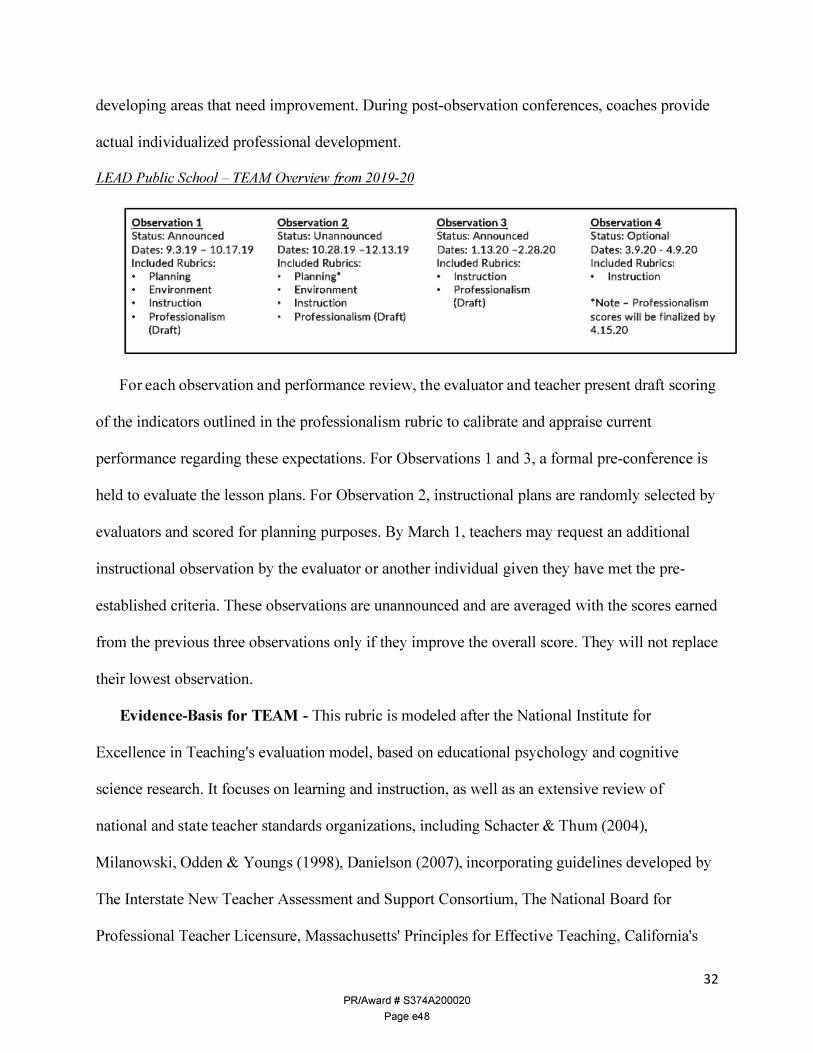
LEAD Public School - TEAM Overview from 2019-20
Observation 1
Status : Announced Dates: 9.3 .19 - 10.17.19 I ncluded Rubrics: • Plann ing • Environment • I nstruction • Professiona l ism
(D raft)
Observation 2
Status: U n a n nounced Dates: 10 .28 . 19 -12 .13 .19 Inc luded Rubrics : • P lann ing* • Env ironment • I n st ruction • P rofessiona l i sm (Draft)
Observation 3
Status : Announced Dates: 1 .13.20 -2.28.20 I nc luded Rub rics: • I n st ruction • P rofessi ona lism
(D raft)
Observation 4
Status: Optiona l Dates: 3 . 9 .20 - 4. 9 .20 I nc l uded Rubrics: • I n struction
*Note - Professional ism scores wi l l be fina lized by 4 .15 .20
For each observation and performance review, the evaluator and teacher present draft scoring
of the indicators outlined in the professionalism rubric to calibrate and appraise current
performance regarding these expectations. For Observations 1 and 3, a formal pre-conference is
held to evaluate the lesson plans. For Observation 2, instructional plans are randomly selected by
evaluators and scored for planning purposes. By March 1, teachers may request an additional
instructional observation by the evaluator or another individual given they have met the pre
established criteria. These observations are unannounced and are averaged with the scores earned
from the previous three observations only if they improve the overall score. They will not replace
their lowest observation.
Evidence-Basis for TEAM - This rubric is modeled after the National Institute for
Excellence in Teaching's evaluation model, based on educational psychology and cognitive
science research. It focuses on learning and instruction, as well as an extensive review of
national and state teacher standards organizations, including Schacter & Thum (2004),
Milanowski, Odden & Youngs (1998), Danielson (2007), incorporating guidelines developed by
The Interstate New Teacher Assessment and Support Consortium, The National Board for
Professional Teacher Licensure, Massachusetts' Principles for Effective Teaching, California's
PR/Award# S374A200020
Page e48
32
Standards for the Teaching Profession, Connecticut's Beginning Educator Support Program, and
The New Teacher Center's Developmental Continuum of Teacher Abilities.
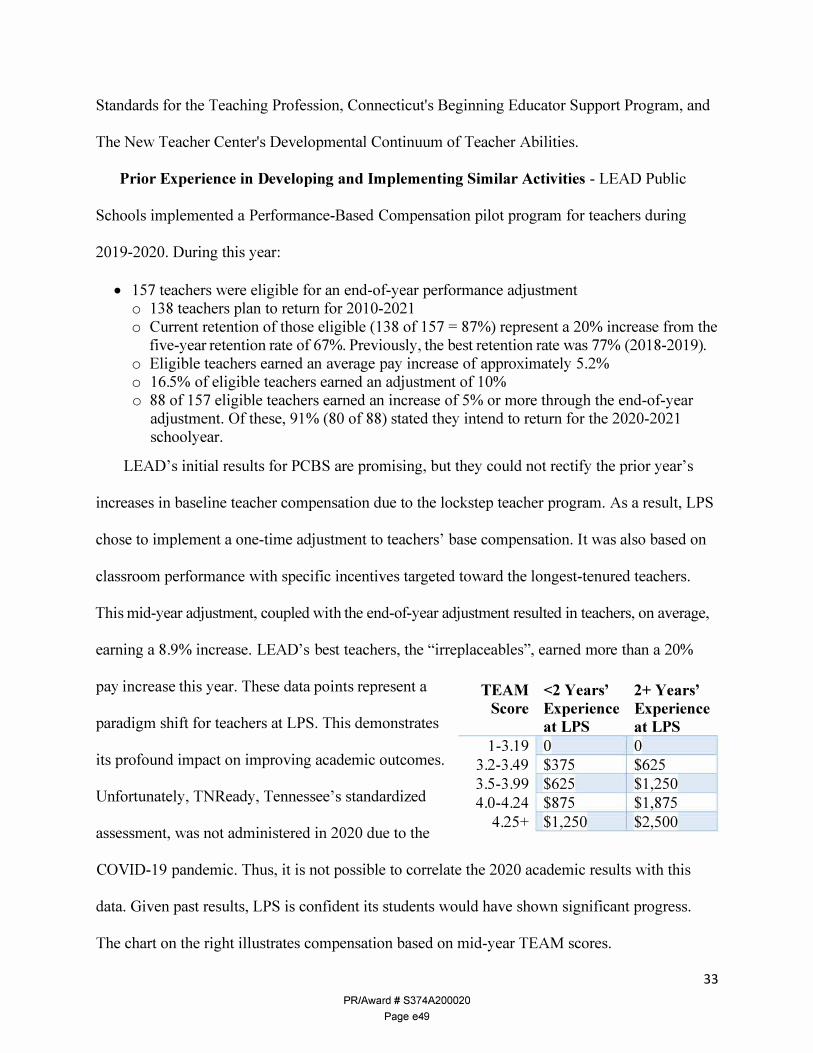
Prior Experience in Developing and Implementing Similar Activities - LEAD Public
Schools implemented a Performance-Based Compensation pilot program for teachers during
2019-2020. During this year:
• 157 teachers were eligible for an end-of-year performance adjustment o 138 teachers plan to return for 2010-2021 o Current retention of those eligible (138 of 157 = 87%) represent a 20% increase from the
five-year retention rate of 67%. Previously, the best retention rate was 77% (2018-2019). o Eligible teachers earned an average pay increase of approximately 5 .2% o 16.5% of eligible teachers earned an adjustment of 10% o 88 of 157 eligible teachers earned an increase of 5% or more through the end-of-year
adjustment. Of these, 91 % (80 of 88) stated they intend to return for the 2020-2021 school year.
LEAD's initial results for PCBS are promising, but they could not rectify the prior year's
increases in baseline teacher compensation due to the lockstep teacher program. As a result, LPS
chose to implement a one-time adjustment to teachers' base compensation. It was also based on
classroom performance with specific incentives targeted toward the longest-tenured teachers.
This mid-year adjustment, coupled with the end-of-year adjustment resulted in teachers, on average,
earning a 8.9% increase. LEAD's best teachers, the "irreplaceables", earned more than a 20%
pay increase this year. These data points represent a
paradigm shift for teachers at LPS. This demonstrates
its profound impact on improving academic outcomes.
Unfortunately, TNReady, Tennessee's standardized
assessment, was not administered in 2020 due to the
COVID-19 pandemic. Thus, it is not possible to correlate the 2020 academic results with this
data. Given past results, LPS is confident its students would have shown significant progress.
The chart on the right illustrates compensation based on mid-year TEAM scores.
PR/Award# S374A200020
Page e49
33
TEAM <2 Years' 2+ Years' Score Experience Experience
at LPS at LPS 1-3.19 0 0
3.2-3.49 $375 $625 3.5-3.99 $625 $1,2504.0-4.24 $875 $1,875
4.25+ $1,250 $2,500
LPS has experience successfully implementing large Federal and State grants. It secured a
Charter Schools Program grant for $4,000,000 over five years to open two new schools. They are
currently in good standing and achieving goals outlined. LPS implemented a Federal School
Improvement Grant to support its turnaround schools, a Priority Schools State Grant for
$350,000, a District Priority School Improvement Grant ($175,000), and a School Level
Competitive improvement Grant ($825,000). These grants provided additional support through
Instructional Coaches, Response to Intervention Coordinators, and training for coaches. It has
received Charter Schools Facilities Grants of $300,000-$400,000 annually for the past three
years to upgrade and support school sites.
2. Evaluation will provide performance feedback and permit periodic assessment of progress towards achieving intended outcomes.
Educator Feedback - LEADing Onward is designed with ongoing formative performance
feedback and support for educators after each observation and formative assessment of the
project's implementation and impact. Bi-weekly Leadership Team meetings at the school and
network level include data discussions on performance of educators and students. Data gathered
will inform decision-making for project modifications and will be used to help ensure the annual
objectives are accomplished and the final project goals are attained.
Fidelity checks of evaluators are an important ongoing element. They are a vital part of
initial training through the Tennessee Department of Education and include follow-up checks to
ensure fidelity across all evaluators in the state. LPS has built additional training protocols and
fidelity checks within its framework. Details of this plan are on pages 29-30.
Project Evaluation - Upon notification of funding, LPS will contract with an external
evaluator to ensure an objective evaluation designed to determine project impact, attainment of
objectives, and achievement of GPRA outcomes. The evaluator will have experience in
PR/Award# S374A200020
Page e50
34
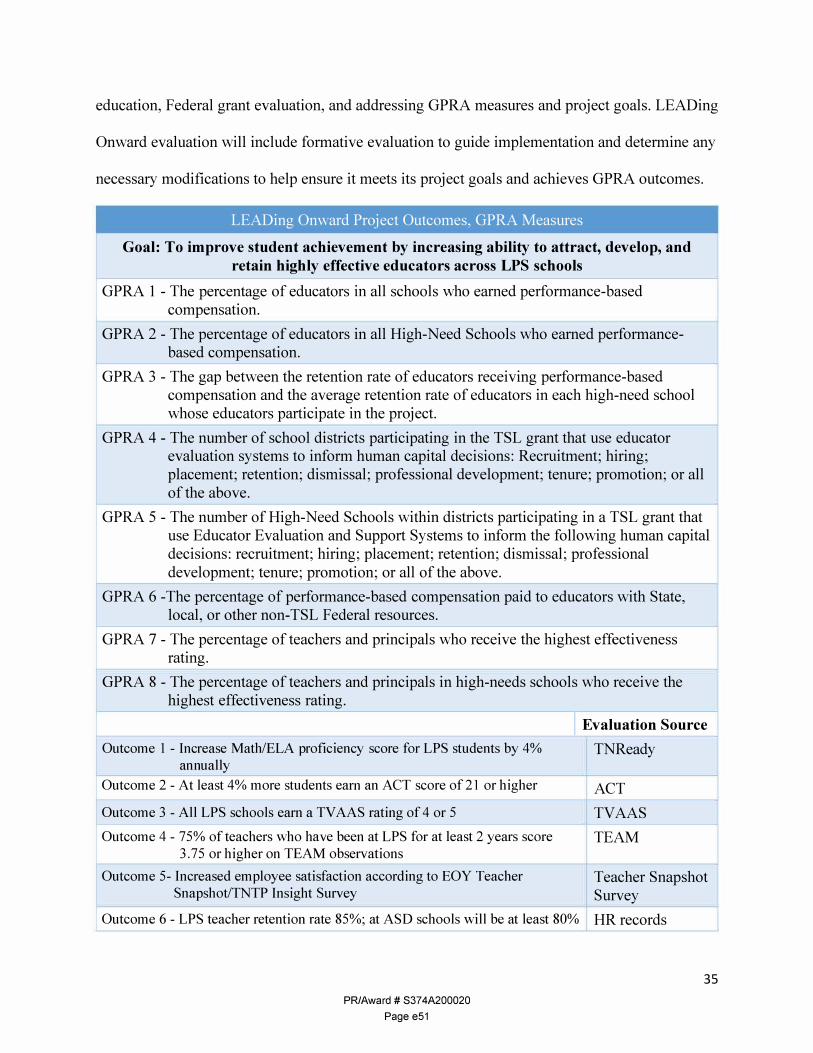
education, Federal grant evaluation, and addressing GPRA measures and project goals. LEADing
Onward evaluation will include formative evaluation to guide implementation and determine any
necessary modifications to help ensure it meets its project goals and achieves GPRA outcomes.
LEADing Onward Project Outcomes, GPRA Measures
Goal: To improve student achievement by increasing ability to attract, develop, and retain highly effective educators across LPS schools
GPRA 1 - The percentage of educators in all schools who earned performance-based compensation.
GPRA 2 - The percentage of educators in all High-Need Schools who earned performance-based compensation.
GPRA 3 - The gap between the retention rate of educators receiving performance-based compensation and the average retention rate of educators in each high-need school whose educators participate in the project.
GPRA 4 - The number of school districts participating in the TSL grant that use educator evaluation systems to inform human capital decisions: Recruitment; hiring; placement; retention; dismissal; professional development; tenure; promotion; or all of the above.
GPRA 5 - The number of High-Need Schools within districts participating in a TSL grant that use Educator Evaluation and Support Systems to inform the following human capital decisions: recruitment; hiring; placement; retention; dismissal; professional development; tenure; promotion; or all of the above.
GPRA 6 -The percentage of performance-based compensation paid to educators with State, local, or other non-TSL Federal resources.
GPRA 7 - The percentage of teachers and principals who receive the highest effectiveness rating.
GPRA 8 - The percentage of teachers and principals in high-needs schools who receive the highest effectiveness rating.
I Evaluation Source Outcome 1 - Increase Math/ELA proficiency score for LPS students by 4%
annually TNReady
Outcome 2 - At least 4% more students earn an ACT score of 21 or higher ACT Outcome 3 - All LPS schools earn a TV AAS rating of 4 or 5 TVAAS Outcome 4 - 75% of teachers who have been at LPS for at least 2 years score TEAM
3.75 or higher on TEAM observations
Outcome 5- Increased employee satisfaction according to EOY Teacher Snapshot/TNTP Insight Survey
Teach er Snapshot Survey
Outcome 6 - LPS teacher retention rate 85%; at ASD schools will be at least 80% HR records
PR/Award# S374A200020
Page e51
35
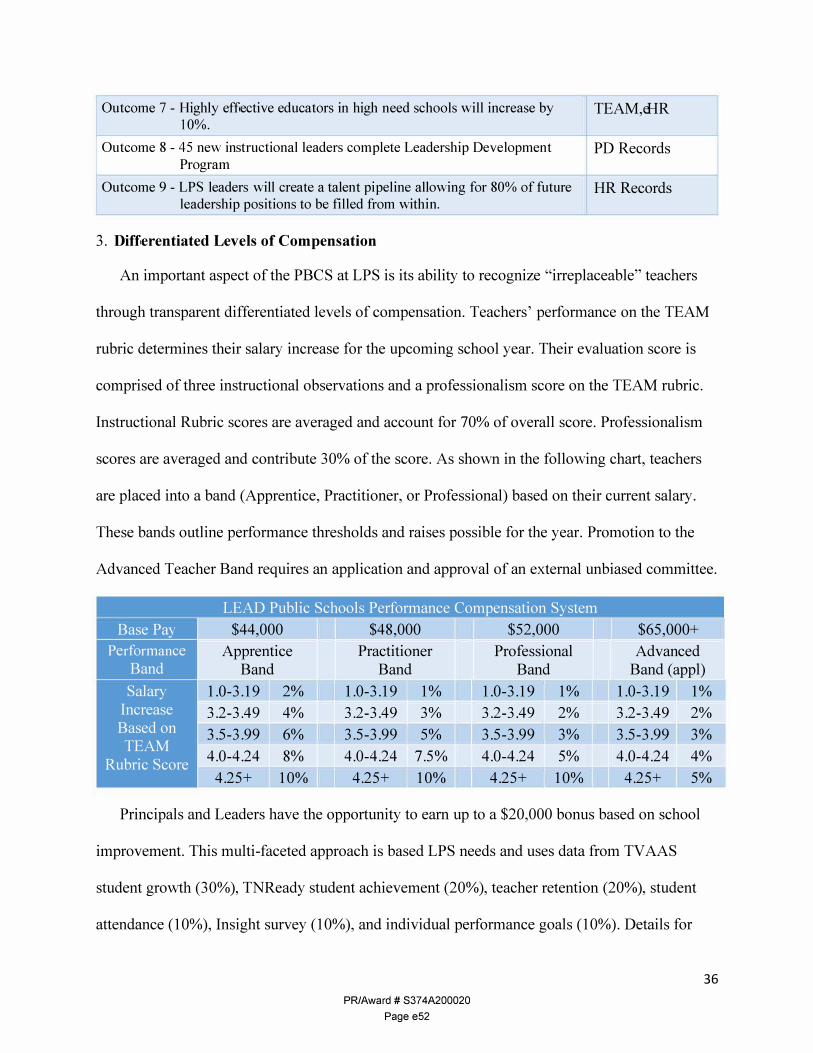
Outcome 7 - Highly effective educators in high need schools will increase by 1 0%.
TEAM,eHR
Outcome 8 - 45 new instructional leaders complete Leadership Development Program
PD Records
Outcome 9 - LPS leaders will create a talent pipeline allowing for 80% of future leadership positions to be filled from within.
HR Records
3. Differentiated Levels of Compensation
An important aspect of the PBCS at LPS is its ability to recognize "irreplaceable" teachers
through transparent differentiated levels of compensation. Teachers' performance on the TEAM
rubric determines their salary increase for the upcoming school year. Their evaluation score is
comprised of three instructional observations and a professionalism score on the TEAM rubric.
Instructional Rubric scores are averaged and account for 70% of overall score. Professionalism
scores are averaged and contribute 30% of the score. As shown in the following chart, teachers
are placed into a band (Apprentice, Practitioner, or Professional) based on their current salary.
These bands outline performance thresholds and raises possible for the year. Promotion to the
Advanced Teacher Band requires an application and approval of an external unbiased committee.
LEAD Public Schools Performance Compensation System Base Pay $44,000 $48,000 $52,000 $65,000+
Performance Band
Apprentice Band
Practitioner Band
Professional Band
Advanced Band (appl)
Salary Increase
1.0-3.19 3.2-3.49
2% 4%
1.0-3.19 3.2-3.49
1% 3%
1.0-3.19 3.2-3.49
1% 2%
1.0-3.19 3.2-3.49
1% 2%
Based on TEAM
Rubric Score
3.5-3.99 4.0-4.24
4.25+
6% 8%
10%
3.5-3.99 4.0-4.24
4.25+
5% 7.5% 10%
3.5-3.99 4.0-4.24
4.25+
3% 5%
10%
3.5-3.99 4.0-4.24
4.25+
3% 4% 5%
Principals and Leaders have the opportunity to earn up to a $20,000 bonus based on school
improvement. This multi-faceted approach is based LPS needs and uses data from TV AAS
student growth (30%), TNReady student achievement (20%), teacher retention (20%), student
attendance (10% ), Insight survey (10% ), and individual performance goals (10% ). Details for
PR/Award# S374A200020
Page e52
36
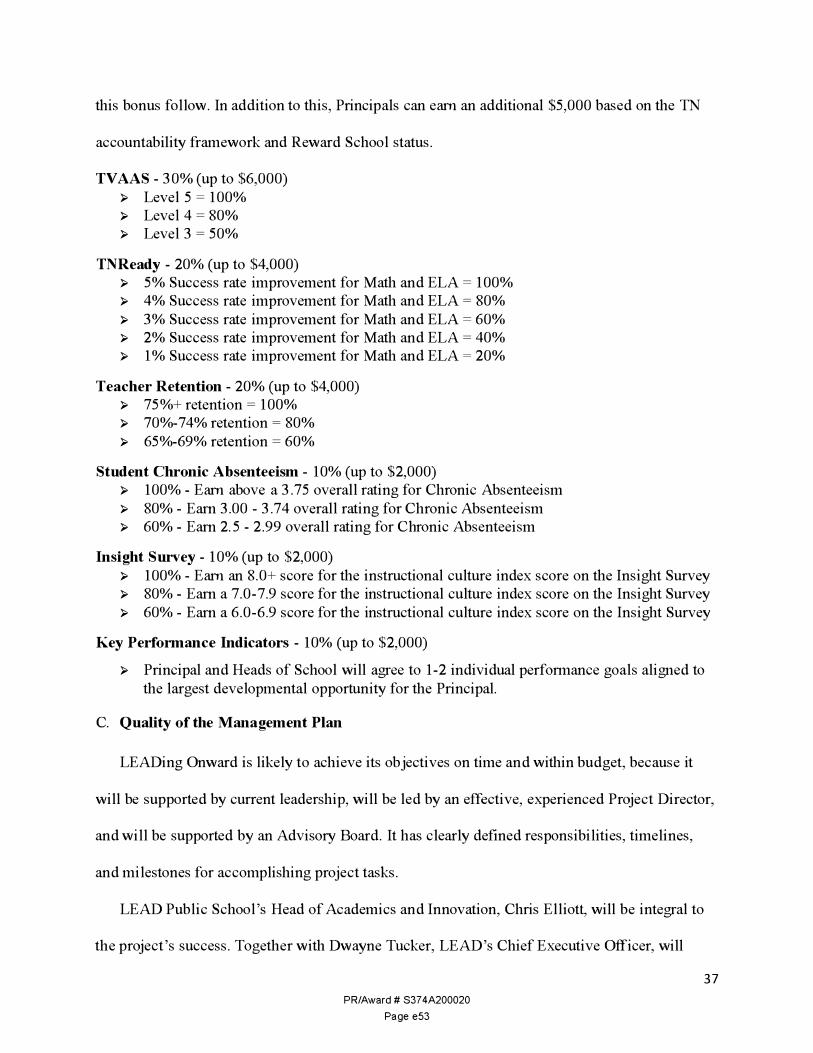
this bonus follow. In addition to this, Principals can earn an additional $5,000 based on the TN
accountability framework and Reward School status.
TV AAS - 30% (up to $6,000)
► Level 5 � 100% ► Level 4 � 80% ► Level 3 � 50%
TNReady - 20% (up to $4,000) ► 5% Success rate improvement for Math and ELA � 100% ► 4% Success rate improvement for Math and ELA � 80%
► 3% Success rate improvement for Math and ELA � 60% ► 2% Success rate improvement for Math and ELA � 40% ► 1 % Success rate improvement for Math and ELA � 20%
Teacher Retention - 20% (up to $4,000) ► 75%+ retention � 100% ► 70%-74% retention � 80%
► 65%-69% retention � 60%
Student Chronic Absenteeism - 10% (up to $2,000) ► 100% - Earn above a 3.75 overall rating for Chronic Absenteeism
► 80% - Earn 3.00 - 3.74 overall rating for Chronic Absenteeism ► 60% - Earn 2. 5 - 2.99 overall rating for Chronic Absenteeism
Insight Survey - 10% (up to $2,000)
► 100% - Earn an 8.0+ score for the instructional culture index score on the Insight Survey ► 80% - Earn a 7.0-7.9 score for the instructional culture index score on the Insight Survey
► 60% - Earn a 6.0-6.9 score for the instructional culture index score on the Insight Survey
Key Performance Indicators - 10% (up to $2,000)
► Principal and Heads of School will agree to 1-2 individual performance goals aligned to
the largest developmental opportunity for the Principal.
C. Quality of the Management Plan
LEADing Onward is likely to achieve its objectives on time and within budget, because it
will be supported by current leadership, will be led by an effective, experienced Project Director,
and will be supported by an Advisory Board. It has clearly defined responsibilities, timelines,
and milestones for accomplishing project tasks.
LEAD Public School's Head of Academics and Innovation, Chris Elliott, will be integral to
the project's success. Together with Dwayne Tucker, LEAD's Chief Executive Officer, will
PR/Award# S374A200020
Page e53
37
guide the project, ensuring it continues to adhere to the LEAD ethos and provide needed supports
for teachers and school leaders in improving performance and recognizing this through
compensation. He will allocate 25% of his time toward this initiative.
LPS will hire a Project Director (1.0 FTE) with experience in compensation analysis and
familiarity with talent development within an educational setting to lead and manage grant
implementation for this initiative. Ideally, this individual will be designated as a Certified
Compensation Professional (CCP). This credential is indicative of the type of subject matter
expertise that was instrumental in designing LEAD' s model and will be vital in moving forward.
The Project Director will direct, coordinate, and ensure the project's integrity by adhering to
Federal requirements, funding guidelines, and the LEADing Onward proposal. The Project
Director will monitor, track, and assess project goals and outcomes on an ongoing basis and
manage the grant budget, ensuring the expenditures are allowable and that the match is fully
attained. This individual will work closely with LPS Leadership and network with other
agencies, educational institutions, nonprofit organizations, and private sector businesses for
future program development and funding. The complete j ob description is in the Appendix.
The Vice President of Development, Eloise Alexis, will support this initiative, working with
the Project Director and current partners, seeking additional philanthropy to expand funding
necessary due to the compounding effect of salary increases, and working toward project
sustainability. She will also serve on the project's Advisory Board.
The LPS Director of Talent, Patrick Rudd, will support this initiative and work with the
Project Director in implementing the TEAM Evaluation Rubric and confirming that it is
implemented with fidelity. He will also serve on the project's Advisory Board.
PR/Award# S374A200020
Page e54
38
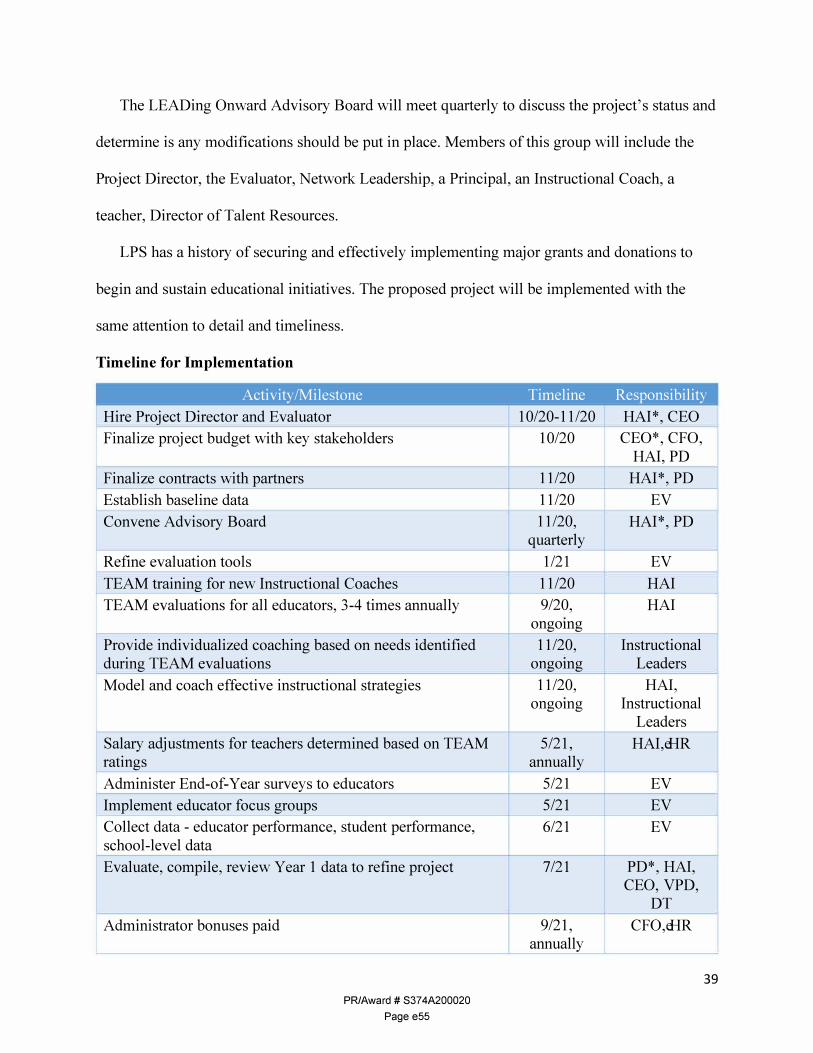
The LEADing Onward Advisory Board will meet quarterly to discuss the project's status and
determine is any modifications should be put in place. Members of this group will include the
Project Director, the Evaluator, Network Leadership, a Principal, an Instructional Coach, a
teacher, Director of Talent Resources.
LPS has a history of securing and effectively implementing major grants and donations to
begin and sustain educational initiatives. The proposed project will be implemented with the
same attention to detail and timeliness.
Timeline for Implementation
Activity /Milestone Timeline Responsibility Hire Project Director and Evaluator 10/20-11/20 HAI*, CEO Finalize project budget with key stakeholders 10/20 CEO*, CFO,
HAI, PD Finalize contracts with partners 11/20 HAI*, PD Establish baseline data 11/20 EV Convene Advisory Board 11/20,
quarterly HAI*, PD
Refine evaluation tools 1/21 EV TEAM training for new Instructional Coaches 11/20 HAI TEAM evaluations for all educators, 3-4 times annually 9/20, HAI
ongomg Provide individualized coaching based on needs identified during TEAM evaluations
11/20, ongomg
Instructional Leaders
Model and coach effective instructional strategies 11/20, ongomg
HAI, Instructional
Leaders Salary adjustments for teachers determined based on TEAM ratings
5/21, annually
HAI,eHR
Administer End-of-Year surveys to educators 5/21 EV Implement educator focus groups 5/21 EV Collect data - educator performance, student performance, school-level data
6/21 EV
Evaluate, compile, review Year 1 data to refine project 7/21 PD*, HAI, CEO, VPD,
DT Administrator bonuses paid 9/21,
annually CFO,eHR
PR/Award# S374A200020
Page e55
39
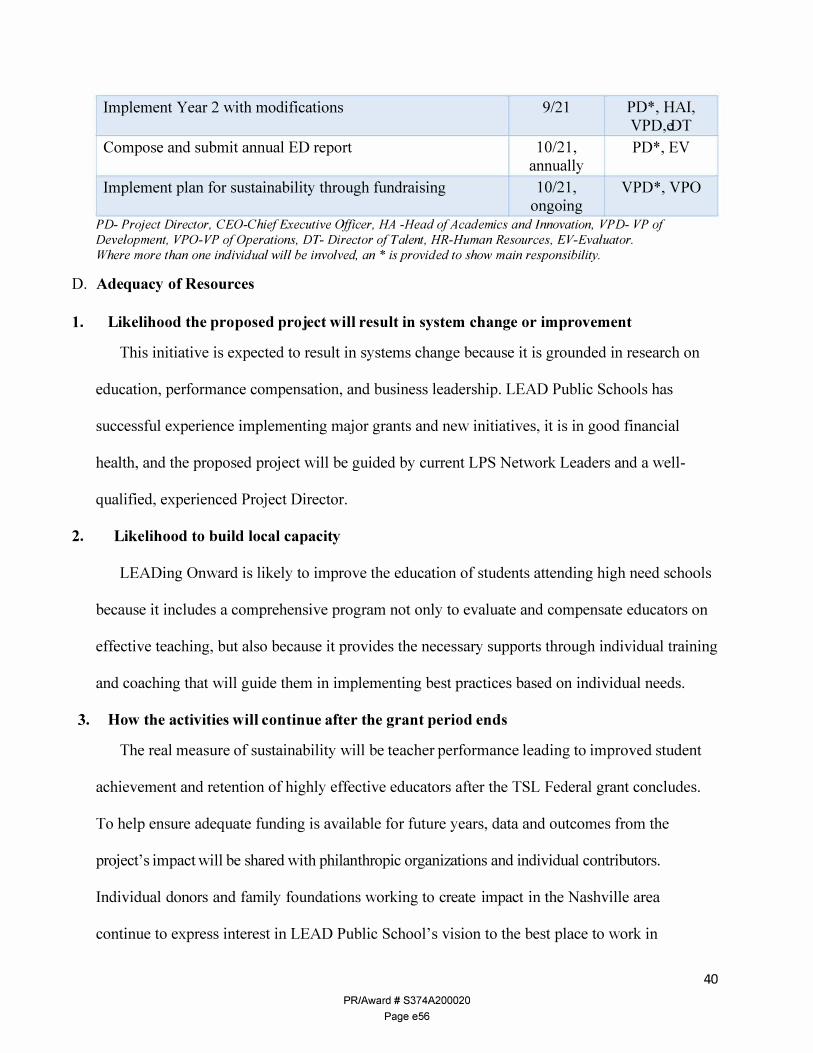
Implement Year 2 with modifications 9/21 PD*, HAI, VPD,eDT
Compose and submit annual ED report 10/21, PD*, EV annually
Implement plan for sustainability through fundraising 10/21, VPD*, VPO ongomg
PD- Project Director, CEO-Chief Executive Officer, HA -Head of Academics and Innovation, VPD- VP of
Development, VPO- VP of Operations, DT- Director of Talent, HR-Human Resources, EV-Evaluator.
Where more than one individual will be involved, an * is provided to show main responsibility.
D. Adequacy of Resources
1. Likelihood the proposed project will result in system change or improvement
This initiative is expected to result in systems change because it is grounded in research on
education, performance compensation, and business leadership. LEAD Public Schools has
successful experience implementing major grants and new initiatives, it is in good financial
health, and the proposed project will be guided by current LPS Network Leaders and a well
qualified, experienced Project Director.
2. Likelihood to build local capacity
LEADing Onward is likely to improve the education of students attending high need schools
because it includes a comprehensive program not only to evaluate and compensate educators on
effective teaching, but also because it provides the necessary supports through individual training
and coaching that will guide them in implementing best practices based on individual needs.
3. How the activities will continue after the grant period ends
The real measure of sustainability will be teacher performance leading to improved student
achievement and retention of highly effective educators after the TSL Federal grant concludes.
To help ensure adequate funding is available for future years, data and outcomes from the
project's impact will be shared with philanthropic organizations and individual contributors.
Individual donors and family foundations working to create impact in the Nashville area
continue to express interest in LEAD Public School's vision to the best place to work in
PR/Award# S374A200020
Page e56
40
the city, especially for teachers. The Vice President of Development will work with the CEO and
Board of Directors, the Project Director and current philanthropic partners to seek additional
philanthropy. LEAD will also continue efficient stewardship of the budget and other resources in
order to make as much available for the performance compensation program. This is critical
since educators will earn raises rather than bonuses for their PBCS. The LEAD Leadership Team
has a history of securing the funding for the pilot phase of this initiative, as well as for other
significant initiatives, and is expected to also accomplish this for LEADing Onward.
LPS augments its budget to ensure sufficient support for students and faculty through
funding from private foundations, corporate giving programs, special events and individual
donations. It is dedicated to actively raising philanthropic funds for the benefit of its students
from a variety of sources. It is supported by a number of different foundations and corporations,
including: Advance Financial, Ajax Turner, Broad, Capstar Bank, Charter School Growth Fund,
Clarcor, Deloitte, Frist, Lee, Nashville Rotary, Parks Family, Pinnacle, Scarlett, and the US
Department of Education. LPS It anticipates total philanthropic dollars of $1 M per year. For
example, LPS has secured significant funding through foundations, Federal grants, and State
grants. It is expected to continue to receive similar support throughout the life of this initiative,
during and after Federal funding.
All LPS schools are in good financial health, rated as "Excelling" in the Financial Framework.
LPS has obtained clean audits every year it has been in operations and has built a healthy cash
balance of over 60 days cash on hand. Its board, and especially the LPS Finance Committee, has
significant financial and accounting experience from the private sector. LPS Board members
have a history of 100% making monetary contributions and 100% making in-kind contributions.
PR/Award# S374A200020
Page e57
41
LPS purposefully provides conservative estimates of both revenue rates, enrollment and
major expenses in order to ensure that school budget targets are met the opening of financially
sustainable new school models, with each of the opening schools individually generating modest
surpluses at scale. Its schools benefit from the network-wide positive fund balance during the
first start up years and then begin to contribute to the positive fund balance over time.
Partners' Commitment
The matching gifts contributed in support of this grant will be funded utilizing private gifts
and grants, in-kind contributions, as well as public grant funds that align with the grant
deliverables and outcomes. They are more fully outlined in the Budget Match Narrative. The
LPS ethos of Commitment, Self-Reliance, Discipline, Courage and Serving Others drives not
only its behaviors in the classroom and offices across the network, but also guides development
and expenditures in network and school budgets.
LPS' s confidence in its ability to identify and secure grant matching funds is based on its
history of good stewardship of allocated budgets and philanthropic dollars. The commitment to
ethical and transparent leadership by the CEO, Board of Directors and Senior Leadership Team
have attracted support from local and national foundations, organizations, corporations and
individual donors. The CEO and Board are engaged in governance and fundraising, including
making their own significant investments in LEAD and bringing other current and prospective
donors to the table. Fundamentally, LEAD operates in the belief that the long hours and
outcomes-driven work that teachers and school leaders provide deserve a living wage, and access
to increases that can make a lasting impact on economic stability.
Support and Commitment from Educators
Dwayne Tucker, LEAD's Executive Director sought to attract and retain good teachers
through a model that incentivized a teacher's development in a straightforward way. Initially,
PR/Award# S374A200020
Page e58
42
teachers were skeptical about performance pay due to concerns about rewards based on student
test scores. However, they quickly recognized that this plan was specifically designed for them
based on their performance, acknowledging that as their performance improved student
achievement would, too. In fact, shortly after adopting this PBCS, one of the teachers, Alyssa
Patel, was quoted in the local newspaper, "It allows you to drive your own path forward which
you don't usually get in teaching."
LPS teachers completed an End-of-Year survey where it was clear they felt their school was
committed to improving their instructional practice and they overwhelmingly approved of the
PBCS and felt it was fair.
• 85.1 % felt fairly compensated for their work. ( 12. 8% were neutral.) • 87. 2% believed that this approach to compensation made sure that great teachers were
paid well. (12.8% were neutral.) • 63.8% felt that evaluation ratings were accurate reflections of teacher effectiveness.
(29.8% were neutral.)
Teacher support was clearly evident in the final, open-ended question: "What change have
you appreciated the most within our organization as an employee?" Nearly all (96%) identified
the compensation system and/or its supports. One teacher said, "I really appreciated the increased
amount of opportunities to receive personalized feedback on my instruction. Overall, I
appreciate the intentionality of increasing teachers' salary to keep good teachers teaching
longer. It was nice to see a substantial increase in salary this year and I look forward to the
future salary incentives provided by LPS in the future." Others stated "I have loved the
coaching relationships that have grown within my first year with LEAD. I feel seen and valued.
It motivates me to continue working hard." And "Unlike many organizations and companies
LEAD stands out and changes things that are important for employees. "
PR/Award# S374A200020
Page e59
43
References
Carver-Thomas, D. & Darling-Hammond, L. (2017). Teacher turnover: Why it matters and what we
can do about it. Palo Alto, CA: Leaming Policy Institute.
Darling-Hammond, L., Amrein-Beardsley, A., Haertel, E., & Rothstein, J. (2012). Evaluating
Teacher Evaluation. Phi Delta Kappan, 93(6), 8-15. doi: 10. l l 77/003172171209300603.
Darling-Hammond, L., LaPointe, M., Meyerson, D., Orr. M. T., & Cohen, C. (2007). Preparing
School Leaders for a Changing World: Lessons from Exemplary Leadership Development
Programs. Stanford, CA: Stanford University, Stanford Educational Leadership Institute.
Danielson, C. (2007). Enhancing Professional Practice: A Framework for Teaching. 2Nd Edition.
Alexandria, VA: ASCD.
Komm, A., McPherson, J., Lambsdorjf, M., Kelner, S., Renze-Westendorf, V. (2011). Return on
leadership: Competencies that generate growth.
Leithwood, K., Louis, K. S., Wahlstrom, K., Anderson, S., Mascall, B., & Gordon, M. (2010). How
Successful Leadership Influences Student Leaming: The Second Installment of a Longer
Story. Second International Handbook of Educational Change, 611-629. doi: 10.1007 /978-90-
481-2660-6 35
Milanowski, A., Odden, A. & Youngs, P. (1998). Teacher Knowledge and Skill Assessments and
Teacher Compensation: An Overview of Measurement and Linkage Issues. Journal of Personnel
Evaluation in Education 12, 83-101. https://doi.org/10.1023/A:1008078109575
PR/Award# S374A200020
Page e60
44
Ronfeldt, M., Loeb, S., & Wyckoff, J. (2013). How Teacher Turnover Harms Student
Achievement. American Educational Research Journal, 50(1), 4-36. doi:
10.3102/0002831212463813
Schacter, J., & Thum, Y. M. (2004). Paying for high- and low-quality teaching. Economics of
Education Review, 23(4), 411-430. doi: 10.1016/j .econedurev.2003.08.002
Springer, M. G., Swain, W. A., & Rodriguez, L.eA. (2016). Effective Teacher Retention
Bonuses. Educational Evaluation and Policy Analysis, 38(2), 199-221. doi:
10.3102/0162373715609687
TNTP. (2015). Shortchanged: The Hidden Costs of Lockstep Teacher Pay. Retrieved from
https://eric.ed.gov/ED559642
TNTP. (2018). The opportunity myth: What students can show us about how school is letting them
down.
TN TEAM Research. (n.d.). Retrieved May 6, 2020, from https://team-tn.org/research/
TN: A Tennessee Department of Education Website. (2016). Retrieved May 5, 2020, from
https:/ /team-tn.org/
Wu, M. (2012). The Irreplacebles: Understanding the real retention crisis in America 's schools.
TNTP.
Yehuda, J. (2019, July 12). Top 5 tips for aligning talent experience with business transformation.
Retrieved from https://www.willistowerswatson.com/en-US/Insights/2019/07/Top-5-tips-for
aligning-talent-experience-with-business-transformation
PR/Award# S374A200020
Page e61
45
![arXiv:1702.04434v1 [cs.CR] 15 Feb 2017 · for reselection is the absolute priority list: the UE always monitors and tries to camp on cells that run on higher priority frequencies](https://img.pdfslide.us/doc/110x75/5e68ab8b60fbe3671834d05a/arxiv170204434v1-cscr-15-feb-2017-for-reselection-is-the-absolute-priority.jpg)

![THE OVERSTATED ABSOLUTE PRIORITY RULE · 2016. 6. 26. · 2016] THE OVERSTATED ABSOLUTE PRIORITY RULE 583 In chapter 11, under federal law, the absolute priority rule only comes into](https://img.pdfslide.us/doc/110x75/6024311b97dfb86e47616e1e/the-overstated-absolute-priority-rule-2016-6-26-2016-the-overstated-absolute.jpg)


![arXiv:1702.04434v1 [cs.CR] 15 Feb 2017 · 2017-02-16 · for reselection is the absolute priority list: the UE always monitors and tries to camp on cells that run on higher priority](https://img.pdfslide.us/doc/110x75/5e6888e7b6240d6f957796f7/arxiv170204434v1-cscr-15-feb-2017-2017-02-16-for-reselection-is-the-absolute.jpg)