Embed Size (px)
Citation preview
JOU RNAL OF RESEARCH of the Notional Bureau of Standards - A. Physics and Chemistry Vol. 79A, No. 6 , Novem ber- December 1975
Absolute Isotopic Abundance Ratios and the Atomic
Weight of a Reference Sample of Silicon
I. L. Barnes, L. J . Moore, L. A. Machlan, T. J . Murphy, and W. R. Shields *
Institute for Materials Research, Nationa l Bureau of Standards, Washington , D.C. 20234
( August 27,1 975 )
Absolute va lues have been obtained for the isotopic a bundance ratios of a re fe rence sa mple of s ilicon us ing e lec tron impact mass spectrom etry. Sa mples of known isoto pic compos it ion pre pared fro m nearly isotopica lly pure sepa rated sili con isotopes we re used to ca librate the mass spectrome te rs. The res ult ing absolute ,sS i/,JOS i ratio = 29.74320 ± 0.00747 and the 29S i/,,°S i ratio = 1.50598 ± 0.00086 whic h yield atom pe rcen ts of '"S i = 92.229:n . 0.00155. " 'Si =,1.()6982 I 0.00124 and :lIISi = :). 10085 I
0.00074. The atomic weight ca lc ulated from thi s isotopic compos ition is 28.085526 · 0.000056. The indi cated un certainties are overall limit s of e rror based on 95 percent confidence limit s for th e means and a ll owan ces for th e effec ts of kn own sources of poss ibl e s yste ma tic e rror. A study of natura l '"S i/,IIIS i ratio variations re ported in the literature extend s tb e es timat ed uncert a int y in the atomic we ight of natural s ili con to ' 0.000.39.
Key word s: Absolut e ratios; a tomic we ight: iso topic abundance: s ili co n .
• Present aJdrt:ss: Tel edyne Isutopcs. Ti monium. Maryland 2 1200.
1. Introduction
The Analytical Spectrometry Sect.ion of the National Bureau of Standards is conducting a long term program of absolute isotopic abundance ratios and atomic weight determinations using thermal ionization mass spectrometry. Previous ele ments studied include silver [1] ,1 chlorine [2] , copper [3] , bromine [4] , chromium [5], magnesium [6], lead [7], boron r8], rubidium [9], rhenium [10], and potassium [I1J. This present work extends the study to silicon and demonstrates an expansion of the technique to include electron impact mass spectrometry.
Interest in the atomic weight of silicon was stimulated by the long-term project of the NBS Institute for Basic Standards to replace the kilogram as a standard of mass. Mass is the remaining triumvir of the m-k-s measure me nt syste m whose definition is expressed in terms of an artifact physical unit- the platinum-iridium I-kg mass that resides in Paris. The meter and second have been rede fined as multiples of measurable natural phenomena.
As a mil es tone in achieving this goal, a high purity silicon crystal of high lattice perfection was selected
I Figures in bracke ts indi ca te the li te rature refe rences at the e nd of thi s paper.
727
as a candidate for the measure ment of its unit cell dimen sion s , density and atomic we ight, with desired measurement uncertainti es for each of these at the parts-per-million level or less. Since sili con in nature consists of a mixture of three stable and nonradioactive isotopes ("8Si, :!~'Si. :lOSi). the uncertainty of the relative proportion s of these masses immediately became th e limiting error in the precise characterization of the silicon crys tal.
As a secondary objective, the atomic weight of silicon could also be combined with the crystal parameter measurements by the IBS to permit a new and direct redetermination of Avogadro's Constant [12].
Finally, also unanswered was the question of whether the atomic weight of the silicon crystal had been distorted during the zone refining purification process.
To achieve these objectives a project was begun to determine the absolute silicon isotope abundance ratios and, hence. the atomic weight of a reference sample of silicon, with an intermediate goal of ~ 10 part s- per-million (ppm) un ce rtainty in the atomi c weight.
To obtain absolute isotopic ratios from the observed or relative measurements made on a mass spectrometer it is necessary to calibrate the instrument using samples of accurately known isotopic ratios of the element
under study. These synthetic isotopic standards, prepared from chemically pure and very nearly isotopically pure separated isotope. provide a bias or fractionation correction (calculated isotope ratio·observed isotope ratio) which when applied to the observed isotope ratio of the reference sample being calibrated allow an absolute ratio to be calculated for this sample. The atomic weight can then be calculated from the absolute isotopic abundances and the atomic masses reported by Wapstra and Gove [13].
Prior to 1948 the accepted atomic weight of silicon was 28.06 based on the work of Baxter et a!. [14] meas' uring the ratios SiCL: 4 Ag and SiBr4: 4 Ag. Based on the isotopic ratios measured by White and Cameron [15] and others the value 28.086 ± 0.001 was accepted [16] but the error limits were expanded to ~0.003 [17] based on the report of lhe variations of silicon isotopes by Allenby [18].
2. Experimental Procedure
2.1. Mass Spectrometry
Isotope ratio measurements were made on a 60° extended fli ght path 15 cm (6 inch) mass spectrometer. The mass spectrometer was equipped with a "2" focusing thin lens source [19] (see below). The collector was a deep bucket Faraday Cage type equipped with a 50 percent transmission grid shadowing a series of electron suppression grids [20]. The measuring circuit consisted of two state·of·the·art vibrating reed electrometers with provisions for automatic range switch· ing. The output of the measuring system was fed into both an expanded scale recorder [21] and a digital system consisting of a voltage to frequency converter and a precision scaler-timer. In general both systems were used redundantly. The digital system and the range switching systems were under computer control.
Mass measurements were made by magnetic field switching. The magnetic field was controlled and changed with the use of a gaussmeter·controller. Source and collector slits were arranged so that complete resolution of each of the masses of interest was obtained.
The electron impact source used was similar to the thermal emission source normally used in our laboratory except that the shield was replaced with an elec· tron impact section consisting of a tungsten filament, impact chamber or "cage" and an electron trap. The trap plate was provided with an external electrical circuit so that it could be continuously heated to about 300 °C which reduced the background to negligible levels.
The sample gas was admitted to the impact region through a short section of Teflon 2 tubing from a leak of the type described by Shields [22].
2 Certain commerc ial products are identified in order 10 ad equa tely spec ify the expe ri mental procedure. In no case does such identification imply recommendation or endorsement by the National Bureau of Standards . nor does it imply that the products identified are necessaril y the best available for the purpose,
728
The operating parameters of the source were as follows:
Electron energy 50 e V Accelerating potential 4780 V Emission current 85 /-LA Trap current 80 /-LA Filament current 3.0 A
The various samples of reference materials and of separated isotopes prepared as described below were processed for analysis using essentially the system described by Reynolds and Verhoogen [23] in which solid barium fluosilicate (BaSiF(;) was heated to produce BaF 2 and gaseous SiF4 • The silicon tetrafluoride was collected and introduced into the mass spectrometer to become the source of the SiF 1 ions which were measured.
The vacuum system used for the preparation of the SiF4 was constructed of nickel and copper tubing instead of the glass system used by Reynolds and Verhoogen since it was believed that the glass itself might be the source of small amounts of water which might lead to the formation of SiF20 I . SiF~HO + and SiF~H~O ' ions as noted by them (see below).
The sample was placed in a 3/4·inch nickel tube approximately 30 cm long which was attached to a vacuum line through a "Dalton" fitting with an alum· inum gasket. The vacuum line constructed of 5/s·inch copper tubing contained a U·tube trap which was cooled with a mixture of dry ice-ethanol during processing of the sample. The silicon tetrafluoride gas was col· lected in a nickel sample tube cooled with liquid nitrogen.
In a typical sample preparation cycle a new sample tube was placed on the vacuum system evacuated to a pressure of < 10- 5 Pa (10 - 7 torr), the trap cooled , a tube furnace placed around the sample container and the tube baked at a temperature of 700 °C for 1 hr. The furnace was then turned off and the tube was allowed to cool to room temperature. The tube was removed from the system and 100 mg of the BaSiF» was added. The tube was reattached to the system and evacuated with a sample collecting tube attached to the system. When a pressure of < 10- 5 Pa (10 - 7 torr) was reached the U·tube trap was cooled and liquid nitorgen placed on the sample collecting tube. At this point the vacuum system was valved off, the furnace turned on and the sample heated to 410 °C (± 5 °C measured with a calibrated chromel-alumel thermocouple) at a rate of approximately r / min. Previous experiments had shown that at a temperature of 400 °C the sample had completely decomposed and the SiF 4 produced was quantitatively removed and collected. This was substantially in agreement with the results of Reynolds and Verhoogen. After a period of 10 min at 410 °C the furnace was turned off and allowed to cool to below 200 °C after which the main vacuum system valve was opened and the system pumped out for 15 min to remove any other gases in the system not held at liquid nitrogen temperature in the sample collecting tube. The sample
collecting tube valve was closed, the liquid nitrogen removed and the tu be was allowed to warm to room temperature after which it was connected to the mass spectrometer inlet manifold.
During subsequent analyses of the gas the sample collection tube was always cooled in a dry ice-ethanol bath to ensure that no water vapor would enter the spectrometer. Examination of the mass region of interest and for seven or eight mass units both above and below showed no sign of interfering peaks.
One further precaution was observed during sample preparation to ensure that no inadvertant isotopic contamination could occur. A number of sample tubes, sample collection tubes, and vacuum manifold U-traps were constructed, marked and tagged. A separate set was used for the preparation of each different sample.
2.2. Purification of Separated Silicon Isotopes
The final goal of achieving stoichiometric assays of the enriched isotopes at the 0.01 percent precision and accuracy level is strongly dependent on the chemical purity of each isotope. The enrichment of the ~HSi and :IOSi isotopes was done by electromagnetic separation at Oak Ridge National Laboratory (Union Carbide Nuclear Company). Collection of each high energy separated Si ion beam was effected with a graphite faraday cup. Thus the removal of the separated isotope from the graphite cup resulted in a material, as received at NBS, that was a mixture of SiO~. SiC and graphite. The silicon 28 was designated sam pIe 900390 and consisted of 4.452 g of mixed Si02 and SiC along with some graphite from the collector. The silicon 30 was designated sample 900490 and consisted of 200 mg of the same type mixture.
The ~RSi separated isotope sample was transferred to a 100 ml FEP-Teflon beaker and the silicon dioxide along with any silicon metal present in the material was dissolved by adding 16 g of 50 percent sodium hydroxide solution and diluting to 50 ml. The solution was digested overnight on a hot plate at about 80 °C and filtered through a close textured filter paper. The insoluble residue and filter paper were washed with water. transferred to a platinum crucible and the paper and residue were ignited over a Meeker burner. About 25 percent (l g) of the original material remained and was assumed to be silicon carbide.
The filtrate was split into two equal portions and each portion was diluted to 500 ml in Teflon beakers. Each portion was passed through a strongly acidic cation exchange column to remove sodium and other cations_ The columns were constructed from polystyrene and were approximately 33 cm long and of 2.5 cm inside diameter. They were filled to a height of 25 cm with Bio-Rad AG50 X 8, 100-200 mesh, cation exchange resin. The eluates were caught in Teflon beakers. Each column was washed with about 150 ml of water to completely remove the silicic acid, H/HSiO:;, from the column. The eluates and washings were then evaporated to dryness on a hot plate and the resulting hydrated silica, ~HSiO~ 'xH 20, was transferred to a 50-ml platinum crucible.
The 1 g of ~HSiC insoluble residue resulting from the filtration of the sodium hydroxide solution was decomposed by sodium carbonate fusion. About 5 g of sodium carbonate was added to a 20-ml platinum crucible and about 50 mg of the ~8SiC was added. The crucible was covered with a platinum cover and heated over a Meeker burner at moderate heat to fuse the Na~CO:; and react with the 28SiC. After a few min utes the heat was raised to the full Meeker burner temperature [or about 5 min. The crucible and contents were then cooled. the cover removed, a second 50 mg portion of ~8SiC added. and the Na2CO:; fusion repeated. This procedure was repeated until the entire sample of ~HSiC had been added and fused. One gram of Na2CO:l
was added to the original platinum crucible and fused to react with any remaining 28SiC. The sodium carbonate melts were dissol ved in about 400 ml of H20 in a 500-ml Teflon beaker. The solution was titrated with (l + 4) HCl to PH 5-6 (as determined by pH indicating paper), the CO 2 expelled by rapid stirring, and the solution was made alkaline with dilute sodium hydroxide to about pH 9. The solution was then passed through a cation exchange column as described for the sodium hydroxide solution of the soluble silica. The eluate was caught in a Teflon beaker, evaporated to dryness and the resulting hydrated silica was transferred to the platinum crucible that contained the previously separated silica. The crucible was then covered with a platinum cover and ignited in an electric muffle furnace at 800 °C for several hours. The total recovered ~8SiO~ weighed 4.185 g equivalent to 1.952 g of 28Si.
The :!OSi separated isotope mixture was taken into solution in a manner similar to the ~8Si procedure except on a reduced scale because of the smaller sample size. The total sample was transferred to a 100-ml FEP-Teflon beaker and the silicon dioxide and silicon metal were dissolved by adding 2 g of 50 percent sodium hydroxide and diluting to 50 ml. After overnight digestion on a hot plate at about 80°C, the solution was filtered through a close textured filter paper. The insoluble residue and filter paper were washed with H 20, transferred to a platinum crucible, and ignited over a Meeker burner. About 50 percent (97 mg) of the original material remained and was assumed to be :wSiC.
The filtrate containing the sodium hydroxide soluble (silicon was passed through a strongly acidic cation exchange column constructed from polypropylene and containing about 35 ml of Bio-Rad AG50 X 8 resin, 100-200 mesh_ The column was washed with 70 ml of water to completely remove the silicic acid, Hz 305i03, from the column and the eluate and washings were evaporated to dryness. The residue was transferred to a lO-ml platinum crucible and ignited to :305i02 over a Meeker burner.
The silicon carbide insoluble residue resulting from the filtration of the sodium hydroxide solution was decomposed by sodium carbonate fusion in the same manner as the ~8SiC except that only 1 g of Na2CO:l
was used_ Any :wSiC remaining in the original platinum crucible was dissolved by fusion with 0.2 g Na2CO:l .
The sodium carbonate melts were dissolved in about
729
100 ml of H 20 in a T eflon beaker. The solution was titrated with (1 + 4) H CI to pH 5--6 (as de termined by pH indicating paper) , the C O 2 was expelled by rapid s tirring , and the solution was made alkaline with dilute sodium hydroxide solution to about pH 9. Thi s solution was the n passed through the same cation column as the sodium hydroxide fraction and the column was washed with about 70 ml of H20. The eluate and washings were caught in a T eflon beaker. evaporated to dryness, and the residu e was tran sferred to the platinum c rucible that contain ed the pre viously separated 30Si02. The crucible was then covered with a platinum cove r and ignited to an electri c muffle furnace at 1000 °C for 1/2 h. The ~oSi0 2 recove red weighed 0.1814 g equivalent to 87.8 mg of aOSi.
Through out these procedures , the utmos t care was used to prevent contamination of the isotopes with natural silic on. All of the be ake rs, ion-exc hange columns ion-exchange resin s and filte r papers were cleaned with dilute high-purity hydroflu oric acid before use. All of the chemical reagents were selected for low silicon conte nt. For example, the total sys tem blank for the purification of the 30Si isotope amounted to 4 fL g of natural s ili con or about 0.0003 percent of the :loSi.
2 .3 . Preparation and Analysis of the Separated Isotope Solutions
The 4.18 ),!: of purifie d 2H Si0 2 was transfe rred to a 250-ml T e fl on beak er and di ssolved in a mixture of 130 ml of wa te r and 30 ml of hi gh-p urit y 48 percent hydroflu ori c ac id a t room te mperature. The solution was transfe rred to a tare d 500-ml Teflon bottle and diluted to a pproximately 300 g with wate r co ntainin),!: 30 ml of co nce ntrated hydroflu ori c acid to ),!:i ve a so lu tion cont ainin g a pproxim ate ly 0.18 mmol/),!: of H 2 2HS iF,; in 3N hydroflu ori c acid. Thi s solution was des i),!: nated "Si-28" .
The 0.181 g of purifi ed :10 Si0 2 was transfe rred to a 100-ml T e fl on bea ker and di ss olved in a mixture of 35 ml of wa te r and 7 ml of 48 perce nt hydroflu ori c ac id at roo m te mpe rature. The so lution was transferred to a 125 ml tare d FEP-Te fl on bo ttl e and diluted with water to ap proxim ate ly 55 g to give a so lution a pproximate ly 0.05 mmol/g of H 2 30SiF(; in 3N hydrofluoric acid. The solution was design ated "Si-30".
Sampl es of the " Si- 28" and " Si-30" were analyze d for im purit y e le ments by iso tope-dilution spark source mass s pectro met ry. Sam ples equi vale nt to abo ut 5 mg of sili con were sp ik ed with 10 - 7 cr of IO"A" 1:!7 Ba 44 Ca lll Cd 53C r W;C u 54 F e 41K 26 M- IT !I7 M~' (i2Ni '20(Q>b' 123S b ,' H2Se: 117S n', H6S r', 120 T e, 2 '~TI , (;7in. Af~e r th e' addit ion of 0.5 ml of pe rc hlori c acid to each sa m ple, th e s ili con m atri x was volatil ized as S iF 4 by evaporation to a s mall drop of pe rc hloric aci d. Th e drop was transfe rred to a pai r of gold wires, evapora ted onto the wires, and th e de pos it was analyzed by s pa rk source mass s pec trometry.
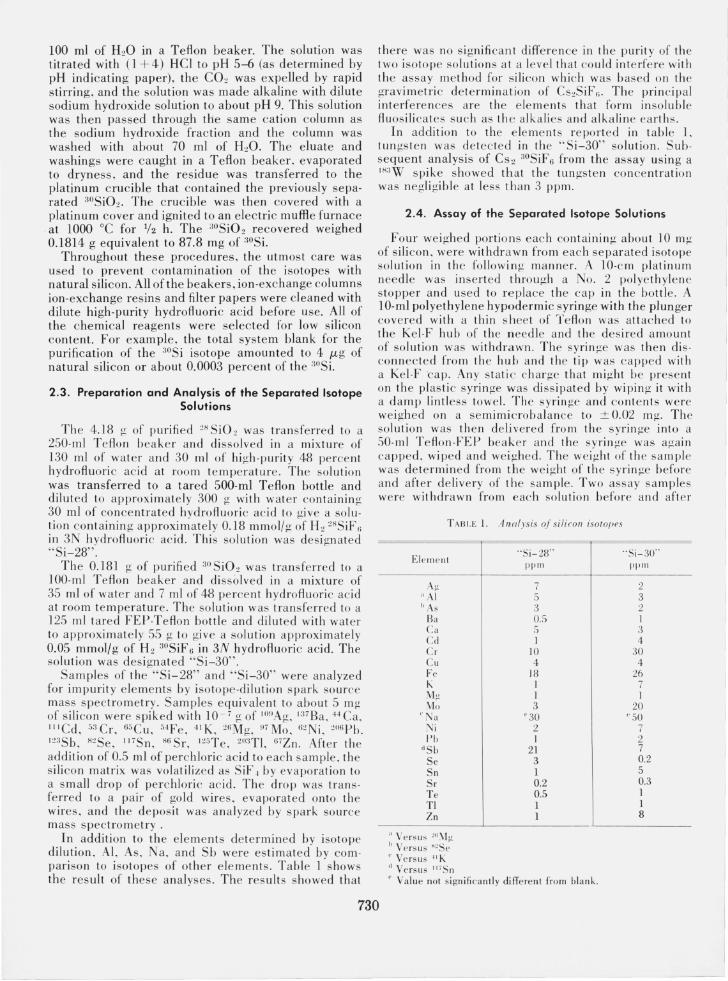
In addition to th e ele ments determined by iso tope dilution , AI, As, Na, and S b we re es tim a ted by compari son to isotopes of other e le me nts. T a ble I s hows the res ult of these analyses. The res ult s showed th at
the re was no s ignifi can t diffe re nce in the purit y of th e two iso tope solutions at a leve l th at co uld inte rfe re with th e assay me thod for s ili con which was based on the gravim etri c de te rmination of Cs2SiF,;. The prin ci pa l inte rfe re nces are the e le me nt s th at form insolubl c fluo sili cates s uch as th e alk alies and a lka line earth s.
In addition to the e le men ts re po rted in table 1, tun ),!:s te n was de tected in the •. Si-30" solution. S ubsequent analysis of CS2 :loS iF 6 from the assay using a lH:1 W s pi ke s howed that th e t un),!:s te n concentration was negli),!:ibl e a t less than 3 ppm.
2.4. Assay of the Separated Isotope Solutions
Four we i),!:h e d portions eac h containin),!: about 10 mg of s ili con , we re withdra wn from e ac h se pa rated isotope solution in th e followin),!: ma nne r. A lO-c m platinum needl e was inse rted t hrou),!: h a No. 2 polye th yle ne stopper and used to re place the ca p in the bottle . A 10-ml polyeth yle ne hypodermic syringe with the plunger covered with a thin s hee t of cj'e fl on was att ac hed to th e Kel-F hub of the n eedle and th e des ired amount of so lution was withdrawn. The syrin),!:e was th e n d isconn ec ted from th e hub a nd the tip was ca pped with a Ke l-F ·ca p. An y s tati c chargc that mi),!:ht be present on the plas ti c sy rini!e was di ss ipated by wi pin),!: it with a d amp lint less towel. Th e s yrin ge and cont e nts we re weighed on a se mi microbal ance to ± 0.02 m),!:. The solution was th e n delivered from th e syrin ),!:e into a 50-ml T e flon-FE!> bea k e r and th e syrin oe was aoa in cappe d , wiped a nd we ighed . The wei),!: ht :f th e sa ~p l e was de te rmin ed from the wei),!:ht of th e sy rin ),!:e before and a ft er de livery of the sa mple. Two assay s am ples were withdra wn from each so lution before and aft e r
TABI.E 1. Alwlysis of silicol1 is%lJeS
Et emen t
A)! " AI "As
Ba Ca Cd Cr Cu Fe J-.: :V1)! :'11"
,. Na
Ni I' ll
dS b Se S n Sr Te 1'1 Zn
" Versu- "; \'1 .. h Ve rs u ~ x:!S; ,. Versu s ·11 h d Versus "'Sn
··S i-28·· PI' III
7 .5 3 0 . .5 5 1
]0 4
18 1 1 3
'·30 2 1
21 3 1 0.2 0.5 I 1
l" Valu e not signi fican tl y different fro m blank.
··Si-30· · PI' III
2 3 :2 1 3 4
30 4
26 7 1
20 '·50
7 2 7 0.2 5 0.3 1 1 8
730
L_
withdrawin g the calibration samples to e ns ure that no change in con centration had occurred during thi s tim e interval (about 3 h).
Each weighed portion was then assayed as follows : The "Si-28" solution s were diluted to a pproximately 6 ml with I N HF. The "Si-30" aliquots we re 6 ml so no further dilution was required. A weighed aliqu ot of CsCl solution (100 mg CsCI/g) was added to th e separated isotope assay solution in an a mount to g ive a pproximately 10 percent excess of the s toichiometri c a mount required to yield ces ium fluosilicate , Cs2SiF f;.
Twenty grams of acetone were added to th e beaker , th e solution was covered and stored in a plastic box with an open beaker of acetone to prevent excessive loss of ace tone from the assay solution. After allowin g th e solution to s tand at least 48 h (the " Si-28" solution s tood [or 5 days) it was filt ered through a weighed 15-ml Munroe c ruc ibl e and was hed with approximately 20 ml o[ a 90 percent acetone/l0 percent wate r (v/v) soluti on. (The filtra te and washings were trans ferred bac k to th e original beake r and reserved for th e de te rmina tion of di ssolved a nd untransfen;ed silicon. ) The c rucibl e and contents were dri ed for 2 h at 110 °C, a llowed to cool in a des iccator , tra ns ferred to the case of a microbalance and allowed to s tand for a t leas t 1 h. The crucible and conte nts were we ighed to -+:-0.Q02 mg. A combination bl a nk and buoyancy correc tion was made by averaging three crucibles tha t had been used to filter blank samples carri ed through the procedure. The drying, cooling a nd weighing were re peated until constant weight was reached. The a ir weight of the Cs2SiF f; was the n determin ed and converted to vacuum we ight us ing a C hemical Rubber Hand boo k (54 th edition) value o[ 3.372 as the density of the salt. The micromoles of sili con present in the salt were de te rmined using a calc ulated a tomi c weight for sili con and 1973 atomi c weight values [or the other two eleme nts. The formula weights used we re 407.7782 for CS2 ~HSiF6 and 409.7463 for CS2 :lOSiF f; .
Th e filt ra te [ro m the prec ipitation of the ces iu m flu osili cate was tra ns fe rred to th e ori gin a l bea ker and abo ut 15 ml of wate r was added to ins ure th at any untra nsferred sa lt was di sso l ved . Th e ace tone was
re moved by e vaporatin g the so lution to ap proxim ate ly ] 5 ml.
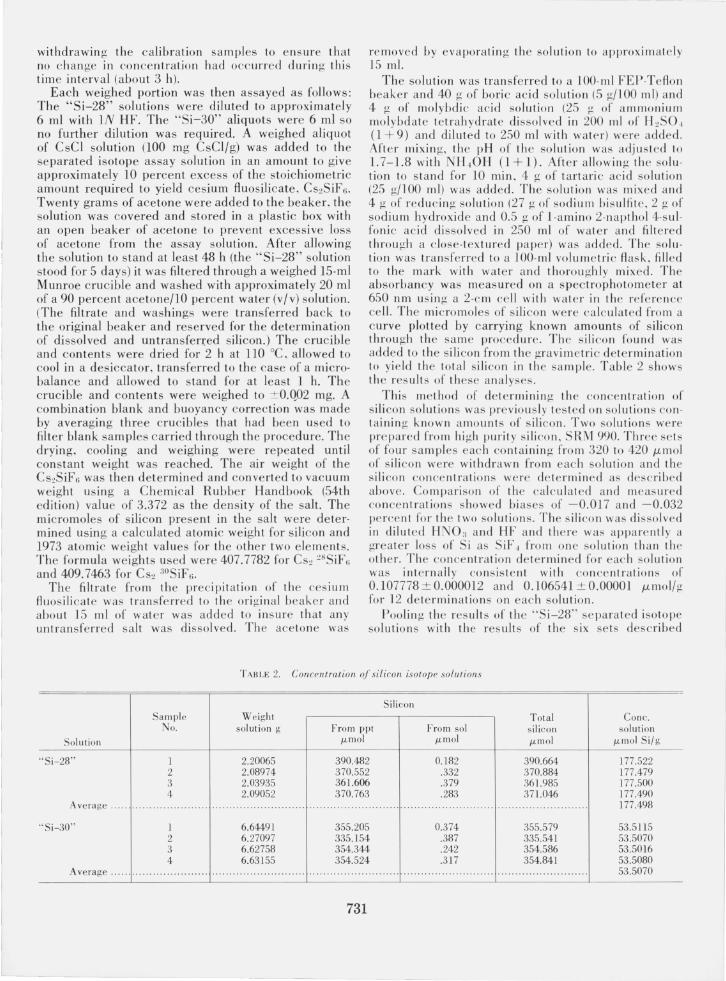
The solution was tra nsfe rred to a 100-ml FEP-T c fl on bea ker a nd 40 g of bori c ac id so lution (5 gil 00 ml ) and 4 g of molybdi c acid so lution (25 1£ of a mmoniu m molybdate te trahydrate di sso lved in 200 ml of H 2SO-l 0 + 9) a nd dilute d to 250 ml with wat E' r ) we re add ed. Aft e r mixin g, the pH of the so lution was adju s ted to 1. 7-1.8 with NH .,OH 0 + 1). After a ll owin g th e so lu ti on to s tand for 10 min , 4 1£ of tart ari c acid so lution (25 1£/100 ml ) was add ed . Th e so lution was mi xed a nd 4 g of redu cing so lution (27 1£ of sodium bi s ul fi te, 2 1£ of sodium hydro xid e and 0.5 1£ of I -a mino 2-n apthol 4-s ul foni c ac id di sso lved in 250 ml of wate r and filt e red through a c lose-textured pa pe r) was added. The so lution was trans ferred to a 100-ml volum etri c fl as k, fill ed to the mark with wa te r a nd thoroughl y mi xed . Th e absorbancy was measured on a spectrophotome ter a t 650 nm usin g a 2-c m ce ll with wa te r in th e re fe re nce ce ll. The mi cro moles of sili co n we re ca lc ul a ted from a curve plotted by carrying known amounts of s ili con through th e sa me procedure. Th e sili co n fo und was added to the s ili co n from the grav im c tri c dete rmina ti on to yie ld the tota l s ili co n in th e sa m ple. T a bl e 2 shows th e res ults of these ana lyses.
Thi s me th od of de te rminin g th e co nce ntra tion of s ili co n so lutions was pre vious ly tes ted on so lutions co nta inin g kn ow n amounts of s ili co n. T wo so lutions we re pre pared from hi gh purit y sili co n, SRM 990. Three se ts of four sa mpl es each co nta inin g fro m 320 to 420 }.Lm ol of s ili co n we re withdraw n from cach so luti on a nd th e s ili co n conce nt ra t ions we re dete r m i ned as described above. Co mpari son of th e calc ul ated and meas ured co ncentrations showed biases of - 0.01 7 a nd - 0.032 perce nt for th e t wo so luti ons. The s ili co n was di sso lved in d ilut ed HNO:; and HF a nd the re was appa re nt ly a grea te r loss of S i as S iF ., f rom one so lutio n th a n th e oth er. Th e conce ntration de term in ed for eac h so lution was inte rn ail y consis te nt with co ncentra ti ons of 0.107778 ± 0.000012 and 0.106541 ± 0 .00001 }.Lm ol/g for 12 de te rmin ations on each so lution.
P oolin g the res ult s of the "Si-28" se pa rated iso tope solutions with th e res ult s of the si x se ts desc ri bed
TAB LE 2. Concentration a/silicon isotope saint ions
Silicon Sa mpl e Weight Tota l Cone.
No. solution g From ppt From sol silicon solution Solution J1.m ol J1.m ol J1.m o l J1. mo l Sijg
"Si-28" 1 2.20065 390.482 0.182 390.664 177.522 2 2.08974 370.552 .332 370.884 177.479 3 2.03935 361.606 .379 36 l.985 177.500 4 2.09052 370. 763 .283 371.046 177.490
Avera[!;e . ... .. . ................. . . ... ... .................... ... ......... .... . ...... ......... . .... . ...... ... . . ... .. .. 177.498
"Si-30" 1 6.64491 355.205 0.374 355.579 53.5115 2 6.27097 335.154 .387 335.541 53.5070 3 6.62758 354.344 .242 354.586 53.5016 4 6.63155 354.524 .317 354.841 53.5080
Average ...... ........ . .. ........... , ....... ......... ............ ......... .. ............ .... ..................... 53.5070
731
above yields a value of 0.0000126 /Lmol/g for the s tand· ard deviation of an indi vidual measurement.
2.5. Isotopic Analysis of Separated Isotopes
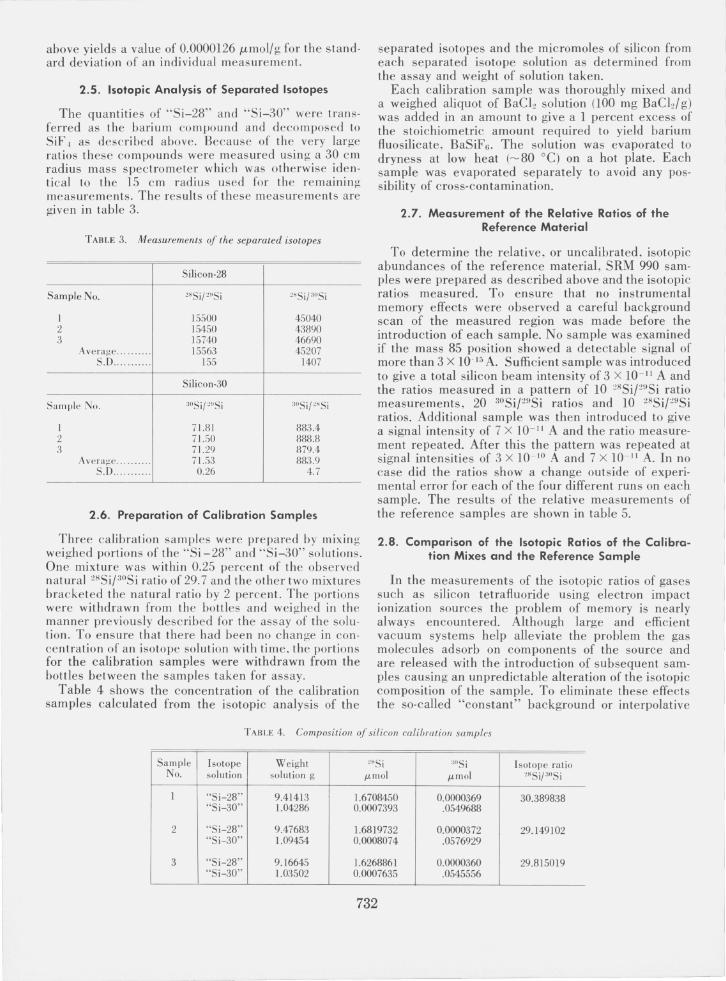
The quantities of " Si - 28" and "Si-30" were transfelTed as th e barium compound and decomposed to SiF 4 as described above. Because of the very large ratios these compounds were measured using a 30 cm radiu s mass spectrometer which was otherwise identical to the 15 cm rad ius used for the remaining measurements. The results of these measurements are given in tab le 3.
TABLE 3. Measurements of the separated isotopes
Si licon-28
Sample No. '"Si /'''S i " S i/""Si
I 15500 45040 2 15450 43890 3 15740 46690
Avcra~(' ........ . 15563 45207 S.D .......... 155 1407
Silicon·30
Sample No. ""Si/"'Si ""S i/ '"Si
1 71.8 1 883.4 2 71.50 888.8 3 71.29 879.4
AveraJ,!c ....... 7 1.53 883.9 S.D . ... . ..... 0.26 4.7
2.6. Preparation of Calibration Samples
Three calibratio n samples were prepared by mixing weighed portions of the "Si -28" and " Si-30" solutions. One mixture was within 0.25 percent of the observed natural ~HSirlOSi ratio of 29.7 and the other two mixtures bracketed the natural ratio by 2 percent. The portions were withdrawn from the bottles and weighed in the manner previously described for the assay of the solution. To ensure that there had been no change in concentration of an isotope solution with time. the portions for the calibration samples were withdrawn from the bottles between the samples taken for assay.
Table 4 shows the concentration of the calibration samples calculated from the isotopic analysis of the
separated isotopes and the micromoles of silicon from each separated isotope solution as determined from the assay and weight of solution taken.
Each calibration sample was thoroughly mixed and a weighed aliquot of BaCI~ solution (l00 mg BaCl~/ g) was added in an amount to give a 1 percent excess of the stoichiometric amount required to yield barium fluosilicate. BaSiF 6. The solution was evaporated to dryness at low heat (-80 QC) on a hot plate. Each sample was evaporated separately to avoid any possibility of cross-contamination.
2.7. Measurement of the Relative Ratios of the Reference Material
To determine the relative, or uncalibrated. isotopic abundances of the reference material , SRM 990 samples were prepared as described above and the isotopic ratios measured. To ensure that no instrumental memory effects were observed a careful background scan of the measured region was made before the introduction of each sample. No sample was examined if the mass 85 position showed a detectable signal of more than 3 X 10' 15 A. Sufficient sample was introduced to give a total sili con beam intensity of 3 X 10- 11 A and the ratios measured in a pattern of 10 ~8 Sir'Si ratio measurements, 20 30Sij2HSi ratios and 10 ~8SifHSi
ratios. Additional sample was then introduced to give a signal intensity of 7 X 10- 11 A and the ratio measurement repeated. After this the pattern was repeated at signal intensities of 3 X 10- 10 A and 7 X 10- 11 A. In no case did the ratios show a change outside of experimental error for each of the four different runs on each sample. The results of the relative measurements of the reference samples are shown in table 5.
2.S. Comparison of the Isotopic Ratios of the Calibration Mixes and the Reference Sample
In the measurements of the isotopic ratios of gases such as silicon tetrafluoride using electron impact ionization sources the problem of memory is nearly always encountered. Although large and efficient vacuum systems help alleviate the problem the gas molecules adsorb on components of the source and are released with the introduction of subsequent samples causing an unpredictable alteration of the isotopic composition of the sample. To eliminate these effects the so-called "constant" background or interpolative
TABLE 4. Composition of silicon calibration samples
Sample Isotope Weight '"Si ""S i Isotope ra tio No. solution so lution g ILm ol ILmol '"Si/""Si
1 "Si-28" 9.41413 1.6708450 0.0000369 30.389838 "Si- 30" 1.04286 0.0007393 .0549688
2 " Si-28" 9.47683 1.6819732 0.0000372 29.149102 "Si-30" 1.09454 0.0008074 .0576929
3 " Si-28" 9.16645 1.6268861 0.0000360 29.815019 " Si-30" 1.03502 0.0007635 .0545556
732
TABLE 5. Determination of relative ratios of reference sample (SRM 990)
Determination No.
I :2 3 4 5 6 7 8 9
10 II 12
Average ...... . S.D .......... .
Composition (Atom % ) 28 92.22389 29 4.67:208 '10 :3.10403
28/30 = 29.71099 :29/30 = 1.50517
28/29
19.74689 19.74790 19.7:3(i78 19.74016 19.73 '118 19.7:\143 19. 74:16 ~ 19.74626 19.7:,565 19.7:{7;30 19.7:>281 19.74000 19.7:393(i 0.00.')77
:\0/:29
0.665180 .664296 .664621 . 66:W:30 .66:\806 .6632114 .664.')62 .664026 .664692 .6646.')0 .66-1-752 .6647.'):\ .664379 .OOO"2(i
method was chosen for these measurements. The interpolati ve method which has been in use by the nuclear fuels industry for many years has been described in detail by Smith et al. [24] and by Rodden [25]. It consists essentially in the analysis of accurately known standards and samples in a prescribed and carefully timed pattern which permits the calculation of the precise ratio difference between samples and standards regardless of the actual isotopic ratios measured. The samples may be given accurate values through the differences measured and the known values of the standards. In this case two of the prepared synthetic mixes (A and B) were chosen with compositions slightly above and below the composition of the standard. The three samples were prepared in separate sample containers to contain exactly the same quantity of gas (within ± 0.5 percent) and the three containers were attached to the mass spectrometer and were analyzed in the following manner. Sample A was introduced into the instrument to give a total silicon ion beam of 3 X 10- 11 A. The ion beam was allowed to stabilize for exactly 2 min (all times given were controlled to " 1 s) after which 10 ratio measurements were made. The pump on the sample manifold was then opened and the system allowed to evacuate for 5 min after which the sample X was introduced as above. These measurements were repeated in the order A- X- 8 - 8 - X - A- A- X ... until a minimum of 10 A- X- 8 - 8 - X - A cycles were completed. From each cycle a ratio of differences may be calculated as
where Rx = average reading for sample entries R ..• = average reading for low standard entries R II = average reading [or high standard entries
and the standard related to the known values for the standards through
/\.\ = R/) (K II - K,.) + /'.1.
It is also possible to correct for a small amount of residual bias by use of an end point measurement. For this the standards are substituted for the unknown sample in a sequence A-A - 8 - 8 - 8 - 8 - A- A and the reverse from which the end point bias may be calculated as:
R _ Rx.I-R.1
/).1 - RII-R.I
R - R.\/I-R .I /)/1 - RII-R I
If no bias exists R liA will be equal to zero and R tUI
equal to 1. Normally this is not the case and the ratio of differences. R /) is corrected as:
R/) - R/).I R /)(corrected) = R R
/)/1- /) .1
The value of /\·x. the true isotopic ratio of the sample corrected for residual bias may then be calculated from the formula given for 1\.\ above. When this value of the true ~HSi/,wSi ratio is obtained a correction factor for the filament bias may be calculated using that and the observed ratio. This may be used to correct all other measured values to a "true" scale.
In addition to the above sequence another synthetic mix (C) had been prepared with isotopic ratios nearly identical to the reference material. This sample could be directly compared using the same timing program as given above in a C-X-C-X ... sequence. The values of X. the true ~HSirwSi ratio in the reference and the correction factor obtained are shown in table 6.
As a test of the validity of the above system this third mix C was substituted for the reference material X. in a A- C- 8 - 8 - C- A- A- . .. sequence. The value for the 2HSi/,wSi ratio calculated from this measurement agreed with that known from the chemical preparation to within 0.001 percent.
TABLE 6. Sammary of filament correction factor calculation
1. From comparison of mixes 2. 4 and SRM 990 R"leDrrected) = 0.48115
S.O.= 0.00428 True ("Sif!IJSi)"",, = :29.74608
2. From comparison of mix 5 and SRM 990
R . ('"Si/,lIISi)",1O 1.002.')12 atlo ("5i /,,"Si)-,
S.D. 0.000260 True ('"Si/""Si j,.,!It = 29.74031
3. Average true value = 29.74:320
. 29.74:320 4. Correc tion factor = 29.71099= 1.001084
5. Correction factor/mass unit = 1.000.')42
6. True (,"Si/,"'Si ),."" = 1.50598
733
3. Results and Discussion Calculation of Reference Sample
Atomic Weight
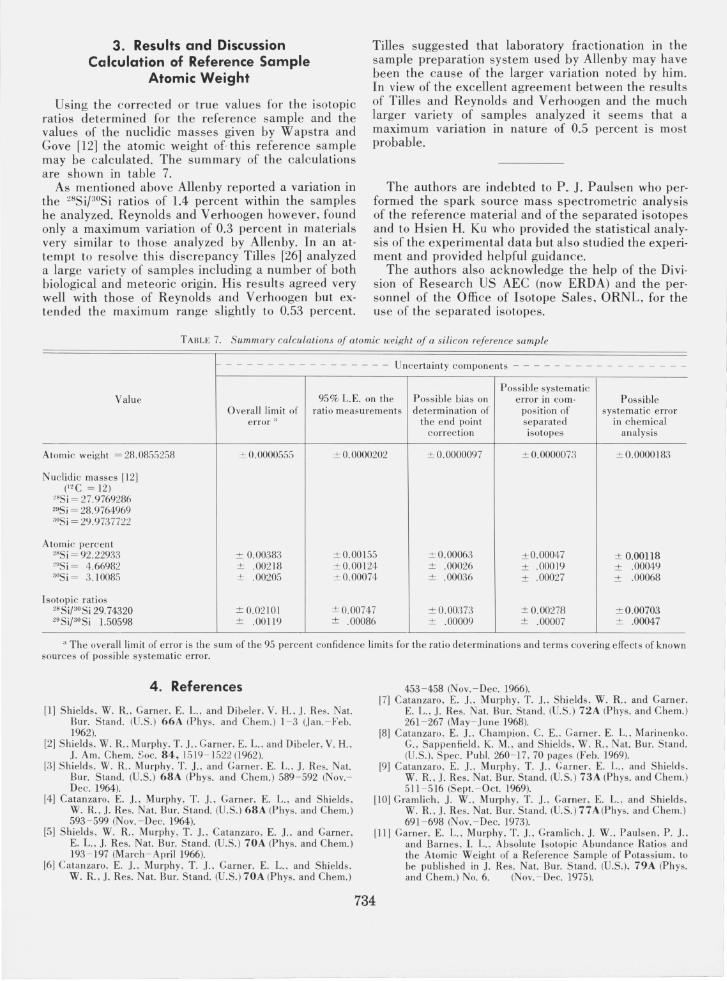
Using the corrected or true values for the isotopic ratios determined for the reference sample and the values of the nuclidic masses given by Wapstra and Cove [12] the atomic weight of- this reference sample may be calculated. The summary of the calculations are shown in table 7.
As mentioned above Allenby reported a variation in the ~8Si/~oSi ratios of 1.4 percent within the samples he analyzed. Reynolds and Verhoogen however, found only a maximum variation of 0.3 percent in materials very similar to those analyzed by Allenby. In an at· tempt to resolve this discrepancy Tilles [26] analyzed a large variety of samples including a number of both biological and meteoric origin. His results agreed very well with those of Reynolds and Verhoogen but ex· tended the maximum range slightly to 0.53 percent.
Tilles suggested that laboratory fractionation in the sample preparation system used by Allenby may have been the cause of the larger variation noted by him. In view of the excellent agreement between the results of Tilles and Reynolds and Verhoogen and the much larger variety of samples analyzed it seems that a maximum variation in nature of 0.5 percent is most probable.
The authors are indebted to P. 1. Paulsen who per· formed the spark source mass spectrometric analysis of the reference material and of the separated isotopes and to Hsien H. Ku who provided the statistical analy· sis of the experimental data but also studied the experi· ment and provided helpful guidance.
The authors also acknowledge the help of the Divi· sion of Research US AEC (now ERDA) and the per~ sonnel of the Office of Isotope Sales, ORNL , for the use of the separated isotopes.
TABLE 7. Summary calculations of atomic weight of a silicon reference sample
- - - - - - - - - - - - - - - - Uncertainty components - - - - - - - - - - - - - - - - -
Possible systematic Value 95% L.E. on the Possible bias on error in com- Possible
Overall limit of ratio measurements determination of position of systematic error error a the end point separated in chemical
correc tion isotopes analysis
Atomic weight = 28.0855258 ± 0.000055S ± O.0000202 ± 0.0000097 ± 0.0000073 ± 0.0000183
Nuclidic masses (12) (12C = 12)
"Si = 27 .9769286 "'Si = 28.9764969 :l°Si = 29.9737722
Atomic percent '·Si = 92.22933 ± 0.00383 ± 0.OOJ55 ± 0.00063 ± 0.00047 ± 0.00118 "'Si = 4.66982 ± .00218 ± 0.00124 ± .00026 ± .00019 ± .00049 :lUS i= 3.10085 ± .00205 ± 0.00074 ± .00036 ± .00027 ± .00068
Isotopic ratios 2'Si/"oSi 29.74320 ± 0.021 Ol ± 0.00747 ± 0.00373 ± 0.00278 ± 0.00703 29Si/""Si 1.50598 ± .00119 ± .00086 ± .00009 ± .00007 ± .00047
a The overall limit of error is the sum of the 95 percent confidence limits for the ratio determinations and terms covering effects of known sources of possible systematic error.
4. References
[1] Shields, W. R. , Garner. E. L.. and Dibeler. V. H .. J. Res. Nat. Bur. Stand. (U.S.) 66A Whys. and Chem.) 1- 3 (jan. - Feb. 1962).
[2] Shields. W. R. . Murphy. T. J .. Garner. E. L. . and Dibe ler , V. H .• J. Am. Chem. ~oc. 84, 1519- 1522 (1962).
13j Shields. W. R.. Murphy. T. J.. and Garner. E. L. . .r. Res. Nat. Bur. Stand. (U.S.) 68A Whys. and Chem.) 589 - 592 (Nov.Dec. 1964).
14] Catanzaro. E. J .• Murphy. T. J., Garner. E. L. . and Shields , W. R., J. Res. Nat. Bur. Stand. (U.S.) 68A Whys. and Chem.) 593-599 (Nov. - Dec. 1964).
[5] Shields, W. R.. Murphy. T. J.. Catanzaro, E. ] ., and Garner , E. L.. ]. Res. Nat. Bur. Stand. (U.S.) 70A (phys. and Chern.) 193 - 197 (March - April 1966).
[6J Catanzaro. E. J., Murphy. T . J.. Garner. E. L.. and Shields. W. R., J. Res. Nat. Bur. Stand. (U.S.) 70A (phys. and Chern.)
453-458 (Nov.-Dec. 1966). [7j Catanzaro, E. J.. Murphy, T . .J.. Shields. W. R.. and Garner.
E. L.. J. Res. Nat. Bur. Stand. (U.S.) 72A (phys. and Chern.) 261-267 (May-June 1968).
[8] Catanzaro. E. ]., Champion , C. E .. Garner. E. L., Marinenko. G., Sappenfield. K. M., and Shields, W. R. , Nat. Bur. Stand. (U.S.). Spec. Pub!. 260 - 17.70 pages (Feb. 1969).
19] Catanzaro, E. J. , Murphy, T. ].. Garner , E. L. . and Shields. W. R. , J. Res. Nat. Bur. Stand. (U.S.) 73A (phys. and Chern.) 511 - 516 (Sept. - Oct. 1969).
[10] Gramlich, ]. W. , Murphy. T. J .. Garner. E. L .. and Shields. W. R., J. Res. Nat. Bur. Stand. (U.S.) 77 A Whys. and Chern.) 691 - 698 (Nov. - Dec. 1973).
[11] Garner, E. L., Murphy. T. ]. . Gramlich. J. WoO Paulsen. P. ] .. and Barnes , I. L. , Absolute Isotopic Abundance Ratios and the Atomic Weight of a Reference Sample of Potassium. to be published in ]. Res. Nat. Bur. Stand. (U.S.). 79A (phys. and Chern.) No.6. (Nov. - Dec. 1975).
734
112J Deslattes. R. D .. Henins. A., Bowman.H. A., Schoonover. R. M .. Carrol. C. L .. Barnes. 1. L.. Machlan. L. A., Moore, L. .J.. and Shie ld s, W. R .. Phys. Rev. Lett. 33,463 - 466 (1974).
113] Wapstra. A. H .. and Cove. N. B .. Nuc lear Data Tables 9, 265-30 1 (l971).
114] Baxter. G. P .. Weath erill. P. r .. and Scripture. E. W .. .Jr.. Proc. Am. Acad. Arts Sci. 58, 24.5 - 268 (1923).
115J White. J. R.. and Cameron. A. E .. Phys. Rev. 74,991 - 1000 (1948).
116] Ca meron , A. E .. a nd Wichers. E .. .lA CS 84 ,4175- 4] 97 (1962). InJ Atomic Weights of the Elements- 1969, Pure App!. Chem. 21,
93 - 107 (1970). 1]8J Allenby. R . .1 .. Geochim. Cosmoch im. Acta 5, 40 - 48 (1954). 119] Shields . W. R .. (Ed.), Nat. Bur. Stand. (U.S.) Tech. Note 426.
53 pages (Sept. 1967).
[20] Shields, W. R. , (Ed. ), Nat. ·Bur. Stand: (U.S.) Tech. Note 277, p. 8 (July 1966).
121] Shields. W. R.. (Ed.). Nat. Bur. Stand. (U.S.) Tec h. Note 277. p. !O (july 1966).
122] Shields. W. R.. U.S. Patent 2.956.771 (1960). 1231 Reynold s. J. 11 .. and Verhoogen. J.. Geochim . Cosmochim.
Acta 3,224-234 (1953). 1241 Smith. R. L.. Shields. W. R .. and Tabor. C. D .. US AEC Report
GAT- l7Il Rev. I (1956). 125] Rodden, C. J.. (Ed.). Selected Measurement Methods for Plu·
tonium and Uranium in the Nuclear Fuel Cycle. 2nd ed. U.S. Atomic Energy Commission (1972).
126] Tilles. 0 .. .J. Ceophys. Res. 66,3003 - 3013 (l961).
(Paper 79A6- 870)
735
594-051 0 - 76 - 5


![Astronomy c ESO 2005 Astrophysics - delpeloso.com.br · Astrophysics The age of the Galactic thin disk from Th/Eu nucleocosmochronology I. Determination of [Th/Eu] abundance ratios,](https://img.pdfslide.us/doc/110x75/5c61eb8009d3f22c068b7c4c/astronomy-c-eso-2005-astrophysics-astrophysics-the-age-of-the-galactic-thin.jpg)