Embed Size (px)
Citation preview
Absoft Fx3 Debugger
Fx3 User Guide
Absoft Fx3 Debugger Fx3 User Guide
2781 Bond Street Rochester Hills, MI 48309 U.S.A. Tel (248) 853-0095 Fax (248) 853-0108 [email protected]
All rights reserved. No part of this publication may be reproduced or used in any form by any means, without the prior written permission of Absoft Corporation. THE INFORMATION CONTAINED IN THIS PUBLICATION IS BELIEVED TO BE ACCURATE AND RELIABLE. HOWEVER, ABSOFT CORPORATION MAKES NO REPRESENTATION OF WARRANTIES WITH RESPECT TO THE PROGRAM MATERIAL DESCRIBED HEREIN AND SPECIFICALLY DISCLAIMS ANY IMPLIED WARRANTIES OF MERCHANTABILITY OR FITNESS FOR ANY PARTICULAR PURPOSE. FURTHER, ABSOFT RESERVES THE RIGHT TO REVISE THE PROGRAM MATERIAL AND MAKE CHANGES THEREIN FROM TIME TO TIME WITHOUT OBLIGATION TO NOTIFY THE PURCHASER OF THE REVISION OR CHANGES. IN NO EVENT SHALL ABSOFT BE LIABLE FOR ANY INCIDENTAL, INDIRECT, SPECIAL OR CONSEQUENTIAL DAMAGES ARISING OUT OF THE PURCHASER'S USE OF THE PROGRAM MATERIAL. U.S. GOVERNMENT RESTRICTED RIGHTS — The software and documentation are provided with RESTRICTED RIGHTS. Use, duplication, or disclosure by the Government is subject to restrictions set forth in subparagraph (c) (1) (ii) of the Rights in Technical Data and Computer Software clause at 252.227-7013. The contractor is Absoft Corporation, 2781 Bond Street, Rochester Hills, Michigan 48309. ABSOFT CORPORATION AND ITS LICENSOR(S) MAKE NO WARRANTIES, EXPRESS OR IMPLIED, INCLUDING WITHOUT LIMITATION THE IMPLIED WARRANTIES OF MERCHANTABILITY AND FITNESS FOR A PARTICULAR PURPOSE, REGARDING THE SOFTWARE. ABSOFT AND ITS LICENSOR(S) DO NOT WARRANT, GUARANTEE OR MAKE ANY REPRESENTATIONS REGARDING THE USE OR THE RESULTS OF THE USE OF THE SOFTWARE IN TERMS OF ITS CORRECTNESS, ACCURACY, RELIABILITY, CURRENTNESS, OR OTHERWISE. THE ENTIRE RISK AS TO THE RESULTS AND PERFORMANCE OF THE SOFTWARE IS ASSUMED BY YOU. THE EXCLUSION OF IMPLIED WARRANTIES IS NOT PERMITTED BY SOME STATES. THE ABOVE EXCLUSION MAY NOT APPLY TO YOU. IN NO EVENT WILL ABSOFT, ITS DIRECTORS, OFFICERS, EMPLOYEES OR LICENSOR(S) BE LIABLE TO YOU FOR ANY CONSEQUENTIAL, INCIDENTAL OR INDIRECT DAMAGES (INCLUDING DAMAGES FOR LOSS OF BUSINESS PROFITS, BUSINESS INTERRUPTION, LOSS OF BUSINESS INFORMATION, AND THE LIKE) ARISING OUT OF THE USE OR INABILITY TO USE THE SOFTWARE EVEN IF ABSOFT HAS BEEN ADVISED OF THE POSSIBILITY OF SUCH DAMAGES. BECAUSE SOME STATES DO NOT ALLOW THE EXCLUSION OR LIMITATION OF LIABILITY FOR CONSEQUENTIAL OR INCIDENTAL DAMAGES, THE ABOVE LIMITATIONS MAY NOT APPLY TO YOU. Absoft and its licensor(s) liability to you for actual damages for any cause whatsoever, and regardless of the form of the action (whether in contract, tort, (including negligence), product liability or otherwise), will be limited to $50. Absoft, the Absoft logo, Fx, Fx3, Pro Fortran, and MacFortran are trademarks of Absoft Corporation Apple, the Apple logo, Velocity Engine, OS 9, and OS X are registered trademarks of Apple Computer, Inc. AMD64 and Opteron are trademarks of AMD Corporation CF90 is a trademark of Cray Research, Inc. IBM, MVS, RS/6000, XL Fortran, and XL C/C++ are trademarks of IBM Corp. Macintosh, NeXT, and NeXTSTEP, are trademarks of Apple Computer, Inc., used under license. MS-DOS is a trademark of Microsoft Corp. Pentium, Pentium Pro, and Pentium II are trademarks of Intel Corp. PowerPC is a trademark of IBM Corp., used under license. Sun and SPARC are trademarks of Sun Microsystems Computer Corp. UNIX is a trademark of the Santa Cruz Operation, Inc. Windows 95/98/NT/ME/2000 and XP are trademarks of Microsoft Corp. All other brand or product names are trademarks of their respective holders. Copyright © 1991-2006 Absoft Corporation and its licensor(s). All Rights Reserved Printed and manufactured in the United States of America. 1.0110906
The Fx3 Debugger............................................................................................................................................1 Introduction To Fx3 ............................................................................................................................. 1
How To Use This Manual................................................................................................................ 1 Preparing For Debugging..................................................................................................................... 2
Compiler Options............................................................................................................................. 2 Starting a Debugging Session .......................................................................................................... 2
Debugging Concepts............................................................................................................................ 5 Getting Started ................................................................................................................................. 5 Single Stepping ................................................................................................................................ 6 Using Breakpoints............................................................................................................................ 6 Displaying Variables........................................................................................................................ 8 Changing Variables.......................................................................................................................... 9 Debugging Hints ............................................................................................................................ 10
Fx3 Menus and Windows .................................................................................................................. 11 File Menu....................................................................................................................................... 11
Open… (Ctrl+O) ......................................................................................................................... 11 Close (Ctrl+W) ............................................................................................................................ 11 Quit ............................................................................................................................................ 11
View Menu.................................................................................................................................... 11 Find… (Ctrl+F) ........................................................................................................................... 11 Find Next (Ctrl+6)....................................................................................................................... 12 Go to Line… (Ctrl+L)................................................................................................................. 12 Up (Ctrl+U) ................................................................................................................................. 12 Down (Ctrl+D)............................................................................................................................. 12 Current Line (Ctrl+P) .................................................................................................................. 12
Debug Menu................................................................................................................................... 13 Continue (Ctrl+J) ........................................................................................................................ 13 Restart (F8) ................................................................................................................................ 13 Stop ............................................................................................................................................ 13 Kill (Ctrl+K) ................................................................................................................................ 13 Unload........................................................................................................................................ 13 Step Into (Ctrl+I) ......................................................................................................................... 13 Step Over (Ctrl+S) ...................................................................................................................... 14 Return (Ctrl+R) ........................................................................................................................... 14 Run To Selection (Ctrl+T)........................................................................................................... 14 Instruction Step Into (Ctrl+Shift+I) .............................................................................................. 14 Instruction Step Over (Ctrl+Shift+S) ........................................................................................... 14 Enable/Disable Breakpoint ........................................................................................................ 14 Clear All Breakpoints ................................................................................................................ 14
Executing Fx3 Commands During Initialization ............................................................................... 15 About .Fx3init ............................................................................................................................ 15 About Startup Scripts................................................................................................................. 15 A sample startup script............................................................................................................... 15
Debugging in the command window ................................................................................................. 16 Examining Program Source Code.................................................................................................. 16
Using the view command........................................................................................................... 16
Examining the Stack ...................................................................................................................... 16 Executing Your Program ............................................................................................................... 17
Resuming Program Execution ................................................................................................... 17 Executing Single Statements...................................................................................................... 18 Returning From Procedures ....................................................................................................... 18 Restarting Program Execution ................................................................................................... 19
Using Breakpoints to Stop Program Execution ............................................................................. 19 Setting Breakpoints.................................................................................................................... 19 Executing Commands When A Breakpoint Occurs................................................................... 20 Using Breakpoint Conditions..................................................................................................... 21 Using Breakpoint Ignore Counts ............................................................................................... 21 Disabling and Enabling Breakpoints ......................................................................................... 22 Removing Breakpoints............................................................................................................... 22
Displaying the Values of Variables ............................................................................................... 23 Displaying Simple Variables ..................................................................................................... 23 Displaying Arrays ...................................................................................................................... 23 Displaying User Defined Types................................................................................................. 24 Using the Expression Analyzer.................................................................................................. 24 Watching The Values of Variables ............................................................................................ 25 Changing the Values of Variables ............................................................................................. 25
Command Arguments ........................................................................................................................ 26 Identifier Scoping........................................................................................................................... 26
Implicit Scoping......................................................................................................................... 26 Specifying Symbols ....................................................................................................................... 27
Symbol Names ........................................................................................................................... 27 FORTRAN Symbols.................................................................................................................. 27
FORTRAN Data Types.......................................................................................................... 27 FORTRAN Subroutines and Functions ................................................................................. 28 FORTRAN Common Blocks................................................................................................. 28 FORTRAN Local Variables and Procedure Arguments........................................................ 28 FORTRAN Array Indexing ................................................................................................... 28 FORTRAN Character Substrings .......................................................................................... 28
C Symbols.................................................................................................................................. 29 C Data Types.......................................................................................................................... 29 C Functions ............................................................................................................................ 29 C Extern Variables................................................................................................................. 29 C Static Variables .................................................................................................................. 29 C Automatic Variables........................................................................................................... 30 C Array Indexing and Pointer Dereferencing ........................................................................ 30 C Structure and Union Members ........................................................................................... 30
Specifying Constants ..................................................................................................................... 31 Integer Constants ....................................................................................................................... 31 Decimal Constants ..................................................................................................................... 31 Octal Constants .......................................................................................................................... 31 Hexadecimal Constants.............................................................................................................. 31 Floating Point Constants ............................................................................................................ 31
Complex Constants .................................................................................................................... 32 Character String and C Character Constants ............................................................................. 32
Specifying Registers ...................................................................................................................... 32 Expression Interpretation ............................................................................................................... 33
Current Expression Language.................................................................................................... 33 Default Expression Language .................................................................................................... 33 Supported Language Operators.................................................................................................. 33 FORTRAN Operators ................................................................................................................ 33 C Operators ................................................................................................................................ 34 Value Expressions...................................................................................................................... 34 Address Expressions .................................................................................................................. 34 Operand Interpretation ............................................................................................................... 34
Command Reference .....................................................................................................................................1 addpath Specifying source file search paths............................................................................. 2 addressof Displaying the address of a symbol ............................................................................. 3 alias Specifying command abbreviations ..................................................................................... 4 attach Attaching to currently running processes ........................................................................ 5 break Setting breakpoints on code locations ............................................................................. 6 catch Stopping execution on C++ exceptions ........................................................................... 7 clear Removing breakpoints by address ....................................................................................... 8 codebreak Setting breakpoints on code locations ..................................................................... 9 commands Adding commands to a breakpoint ........................................................................ 10 condition Adding a condition to a breakpoint ........................................................................... 11 continue Resuming program execution .................................................................................... 12 core Debugging using a core file ............................................................................................... 13 cycle Skipping commands in a loop ........................................................................................ 14 databreak Stopping execution when data value changes............................................................ 15 delete Removing breakpoints by breakpoint id ........................................................................ 17 deletepath Removing source file search paths ........................................................................ 18 detach Stopping a debug session on an attached process ......................................................... 19 disable Deactivating program breakpoints or auto-display expressions................................... 20 disasm Displaying disassembled machine instructions ............................................................. 21 display Creating an auto-display expression ............................................................................. 22 down Specifying the active stack frame ................................................................................... 23 dump Displaying program memory ......................................................................................... 24 enable Activating program breakpoints or auto-display expressions ....................................... 25 exit Terminating execution of a command loop........................................................................ 26 filestatus Displaying FORTRAN I/O unit information .............................................................. 27 frame Specifying current stack frame....................................................................................... 28 handle Controlling signal actions.............................................................................................. 29 if Conditionally executing debugger commands ....................................................................... 30 info Displaying information about the current debugging session ........................................... 31 istepinto Executing single instructions ..................................................................................... 32 istepover Executing single instructions ..................................................................................... 33 jump Resuming execution at a different address .................................................................... 34 kill Terminating process execution .......................................................................................... 35
list args Displaying procedure arguments............................................................................... 36 list breakpoints Displaying program breakpoints...................................................................... 37 list canbreak Displaying executable source lines ...................................................................... 38 list classes Displaying C++ class names................................................................................. 39 list entries Displaying entry point information........................................................................ 40 list frame Displaying the active stack frame .............................................................................. 41 list functions Displaying program functions and procedures ................................................... 42 list globals Displaying global symbol information................................................................... 43 list locals Displaying local variable information....................................................................... 44 list members Displaying C++ class member information.......................................................... 45 list objects Displaying process object information .................................................................. 46 list processes Displaying processes under debugger control .................................................... 47 list signals Displaying current signal status ............................................................................ 48 list source Displaying source file information ........................................................................ 49 list statics Displaying static variable information .................................................................. 50 list symbols Display process data symbol information ............................................................. 51 list threads Displaying process thread information ................................................................. 52 list types Displaying symbol types ............................................................................................ 53 load Loading a program into the debugger ............................................................................... 54 print Displaying program variables ........................................................................................... 55 printarray Displaying the contents of arrays .......................................................................... 56 quit Ending a debugging session............................................................................................... 57 read Reading commands from a file .......................................................................................... 58 registers Displaying hardware registers .................................................................................. 59 return Returning from the current subroutine .......................................................................... 60 run Restarting program execution............................................................................................ 61 set Changing variable values .................................................................................................. 62 signal Resuming execution with a specific signal..................................................................... 63 stacktrace Displaying a stack trace............................................................................................. 64 stepinto Executing single source statements ........................................................................... 65 stepover Stepping over procedure calls ................................................................................... 66 stop Stopping process execution................................................................................................ 67 tbreak Setting a temporary breakpoint ..................................................................................... 68 thread Specifying the active thread ........................................................................................... 69 typeof Displaying the type of a symbol ..................................................................................... 70 until Resuming execution until a specified location................................................................... 71 up Specifying the active stack frame ....................................................................................... 72 use Specifying the active process ............................................................................................. 73 view Displaying program source code....................................................................................... 74 while Executing debugger commands in a loop ...................................................................... 75 x Displaying program memory ................................................................................................. 76
Appendix A Debugging On Windows..................................................................................77
Appendix B Debugging On Macintosh ...............................................................................79
Appendix C Debugging On Linux ............................................................................................81
Appendix D Fx3 Control Variables.........................................................................................83
1
The Fx3 Debugger
INTRODUCTION TO FX3 Fx3 is a multi-language, source-level symbolic debugger designed to meet the needs of both the casual and the professional programmer alike. It provides standard debugging capabilities such as breakpoints, stack trace, and variable display. Fx3 fully supports Fortran 90/95, FORTRAN 77, C, and C++. A debugger is a fundamental programming tool that is used to achieve a specific end. Fx3 is extremely easy to use and operates like any other program for your computer. There are no special graphical conventions to learn or Control and Alt key sequences to remember. Fx3 commands do exactly what you expect them to do. The depth of detail presented in the debugger is completely within your control.
How To Use This Manual
This manual has been designed to allow you to obtain the specific information you will need for effective debugging as quickly as possible. The following descriptions of the remaining sections will direct you to the sections necessary for your particular needs. • Preparing For Debugging
This section begins by describing how to compile and link your program with symbolic debugging information and start a debugging session.
• Basic Debugging Concepts
This section presents basic debugging concepts such as viewing source code, executing your program in the debugger, using breakpoints and displaying variables and other program information.
• Using Fx3
This section presents the graphical interface elements of Fx3.
• Command Arguments
This section provides details on specifying Fx3 command arguments. It discusses scooping issues, allowed constant formats, and symbol names.
• Command Reference
This section describes all available Fx3 commands.
• Appendices
The appendices discuss system operating system specific debugging information..
PREPARING FOR DEBUGGING This section describes how to prepare your program for debugging with Fx3 and how to begin a debugging session. It also introduces the use of breakpoints, single stepping, and examining variables. Source level debugging with Fx3 (or any debugger) requires that the symbolic information contained in the original source file be available to the debugger. Normally, this information is used only by the compiler during the early stages of parsing and lexical analysis and is then discarded after the object file has been created. Preparing a program for debugging consists primarily of setting the required compiler and linker options to create a file that preserves the symbol and line number information.
Compiler Options
Use the -g option with any Absoft compiler to direct the compiler to add symbol and line number information to the object file. This option must be enabled for each source file that you will want to have the source code displayed for while debugging. It is not required for files that you are not interested in. See the Appendices for specific information on your operating system. It is recommended that all optimization options be disabled while debugging. This is because the optimizers can greatly distort the appearance and order of execution of the individual statements in your program. Code can be removed or added (for loop unrolling), variables may be removed or allocated to registers (making it impossible to examine or modify them), and statements may be executed out of order.
Starting a Debugging Session
The Fx3 debugger is launched just like any other application on your system. You can double click on the Fx3 icon or type Fx3 in a shell command prompt. When you invoke the Fx3 debugger, you can specify options will control the actions that will occur during Fx3 initialization as well as the name of the program you wish to debug and any arguments you wish to pass to this program when it is executed.
The syntax for invoking the Fx3 command line debugger is as follows:
Fx3 {Fx3 options} {program name} {“program argument list”}
where Fx3 options are used to control the initial state of your debugging session. These options all begin with a ‘-‘ character and must precede the name of the program you wish to debug. Valid Fx3 options are:
-noFx3init suppresses reading and executing any .Fx3init files.
-nodefaultaliases suppresses processing of Fx3’s built-in command aliases.
-noFx3aliases suppresses reading and processing of any .Fx3alias files.
-s startup_script causes Fx3 to read and process a file of user specified commands during initialization.
Program name is the name of the program to start debugging. The specified program must exist in the current working directory or include a full or partial path to the directory where the program is located.
Program argument list is a quoted list of arguments to be passed to the program when it is executed under debugger control. If you wish to specify input or output redirection for the program you are debugging, include the redirection arguments inside the quoted argument list to prevent interpretation by the command shell.
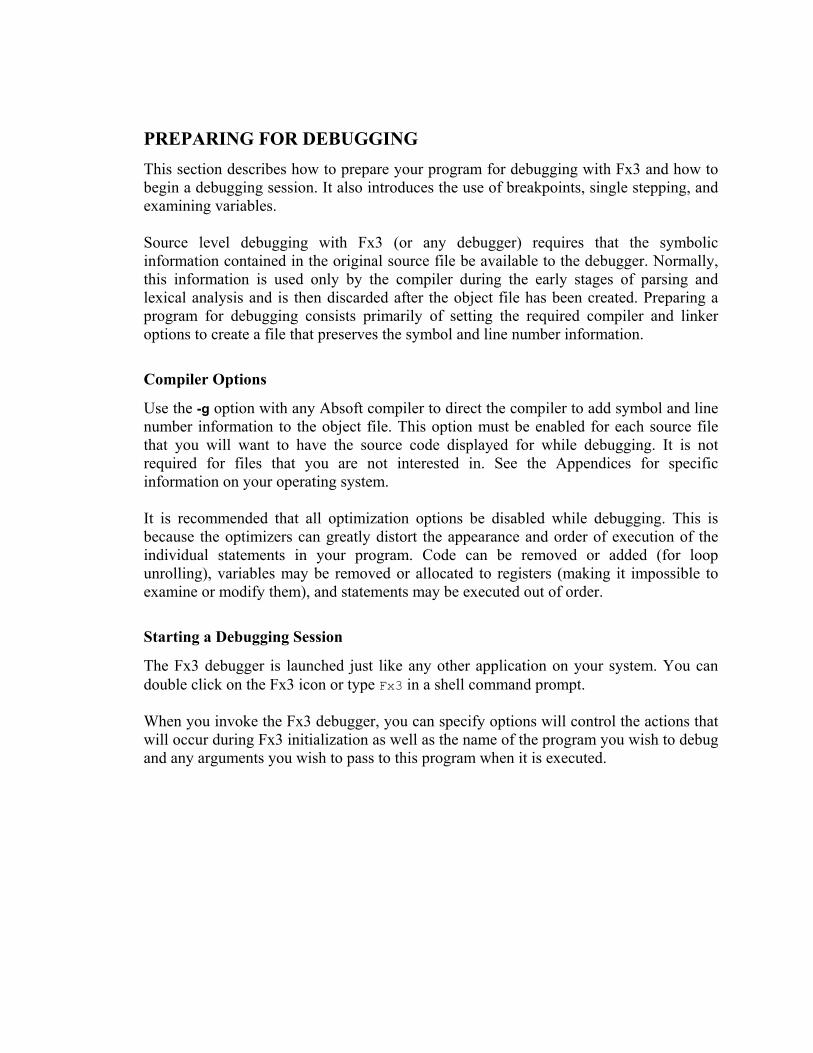
If you launched Fx3 by double-clicking on its icon or did not specify an executable filename as the command line argument, then from the Fx3 File menu, choose Open… and the name of the application that you wish to debug. The initial window that appears is the Load Program window and is used to establish and/or change command line arguments.
After Fx3 reads the symbol table and loads your application, it will execute its initialization code, and leave it ready for debugging at the first executable statement of the main program.
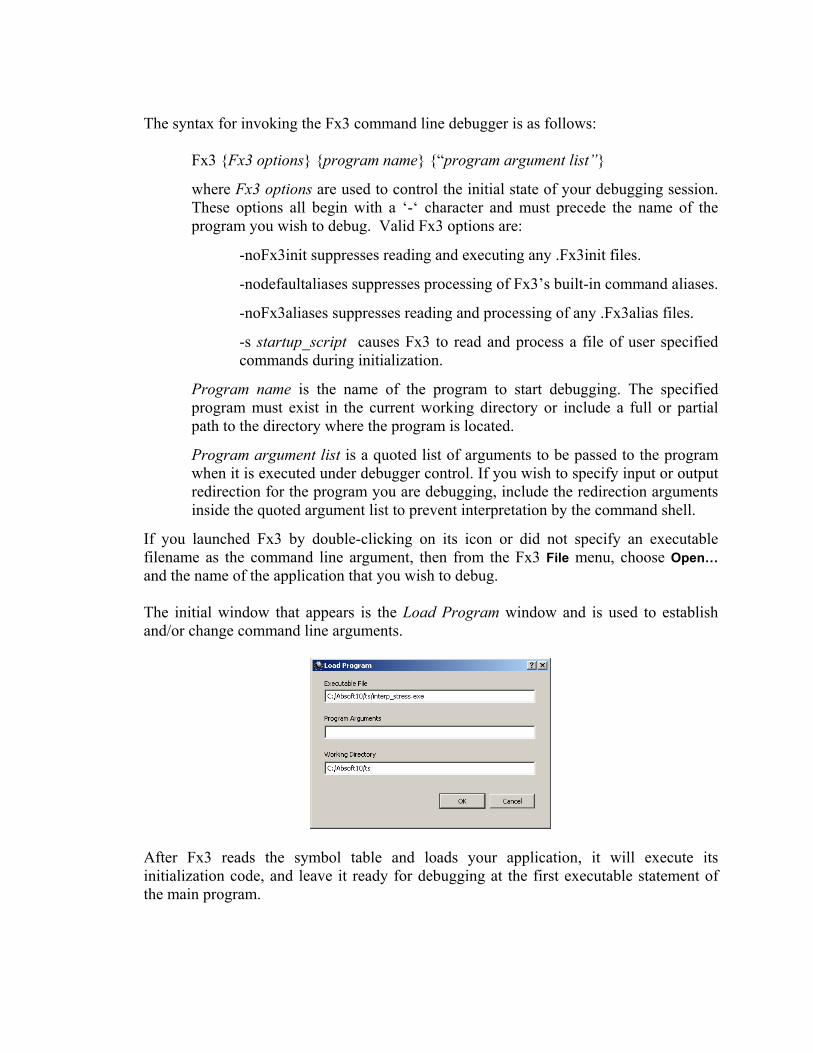
The Fx3 window is divided into two sections. The upper section displays source files, each in a separate pane, selected by tabs labeled with the file name. The lower section is used to maintain user variables, breakpoints, stack information, and the console window. These elements are also divided into panes, labeled with their function. The console pane is used to issue commands to Fx3 that are not part included in the menus and to receive status results of all commands. The Fx3 command set is described in the last two sections of this manual: Command Arguments and Command Reference. You can execute statements one-at-a-time by selecting the Step Into or Step Over commands from the Debug menu. Step Into will follow subroutine calls and function references, while Step Over will treat them as a single statement. The Return command, also in the Debug menu, will execute all of the remaining statements in a procedure as though they were a single statement and return you to the point of the call. There are buttons on the tool bar that you can use as short-cuts for all of these commands. Breakpoints are set by moving the arrow pointer to the far left of the source window where the source statement line numbers are shown. Move the arrow pointer into this area and click the left mouse button to set a breakpoint on that source statement line. A red indicator will be shown, indicating a breakpoint has been set at that line number. Clearing a breakpoint is accomplished by clicking the left mouse button on any line number where a breakpoint has been set. The variables in your program can be examined and/or modified in the Watches window which is normally displayed at the bottom of the Fx3 window. Three types of variables are displayed in their own panes: Locals, Arguments, or User.
Watches window
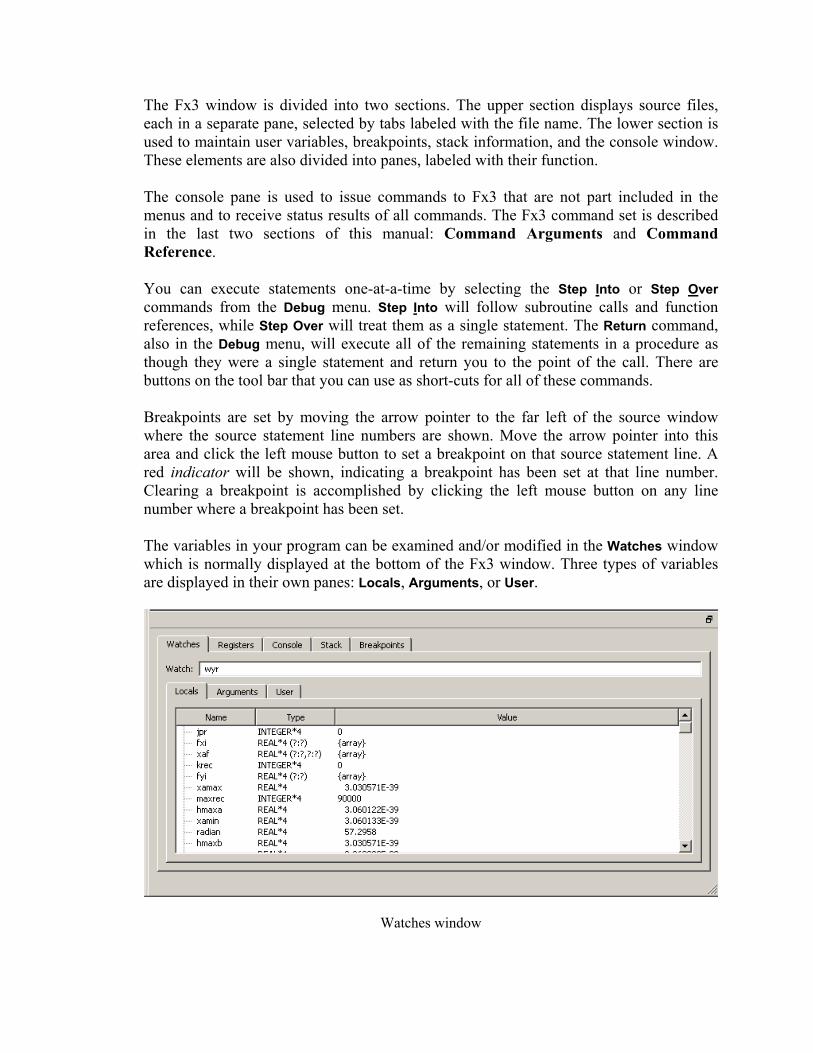
You can change the format of the value in the Watches window by clicking on it to select it and then clicking the right mouse button to show the variable format menu.
DEBUGGING CONCEPTS This section is intended for the less experienced programmer and presents basic debugging concepts such as single stepping through programs and using breakpoints. It also describes how to isolate problems in your program and get the most out of a debugging session
Getting Started
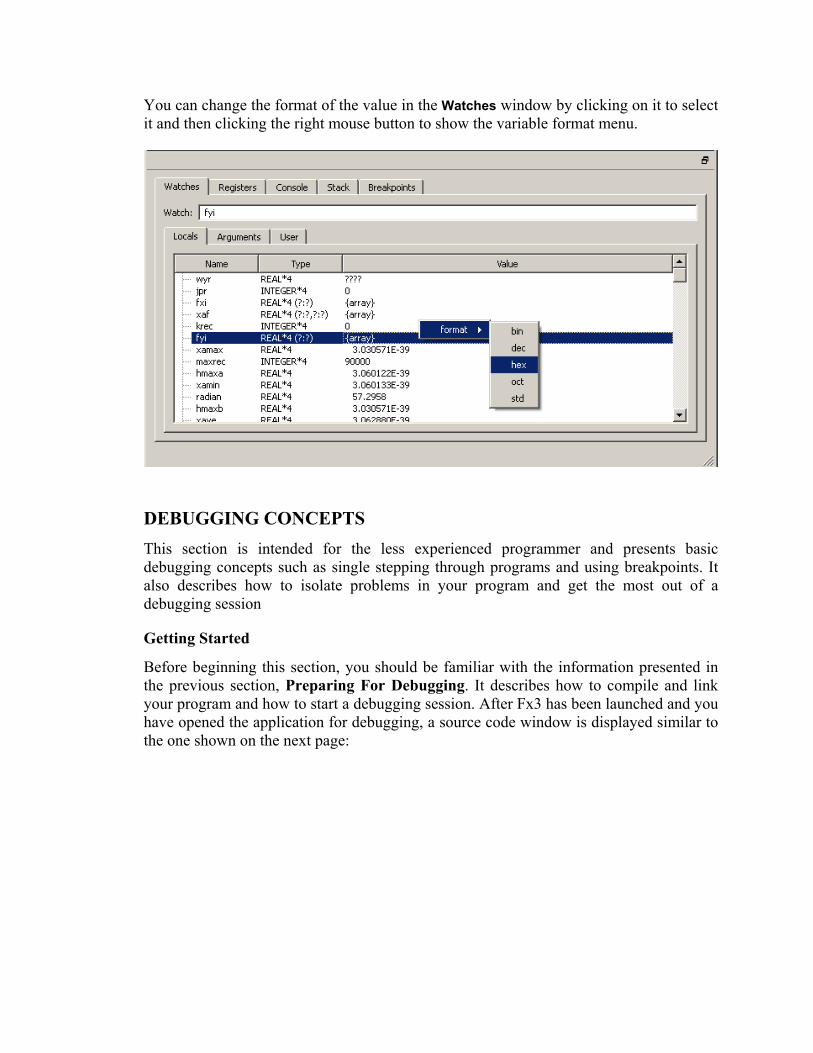
Before beginning this section, you should be familiar with the information presented in the previous section, Preparing For Debugging. It describes how to compile and link your program and how to start a debugging session. After Fx3 has been launched and you have opened the application for debugging, a source code window is displayed similar to the one shown on the next page:
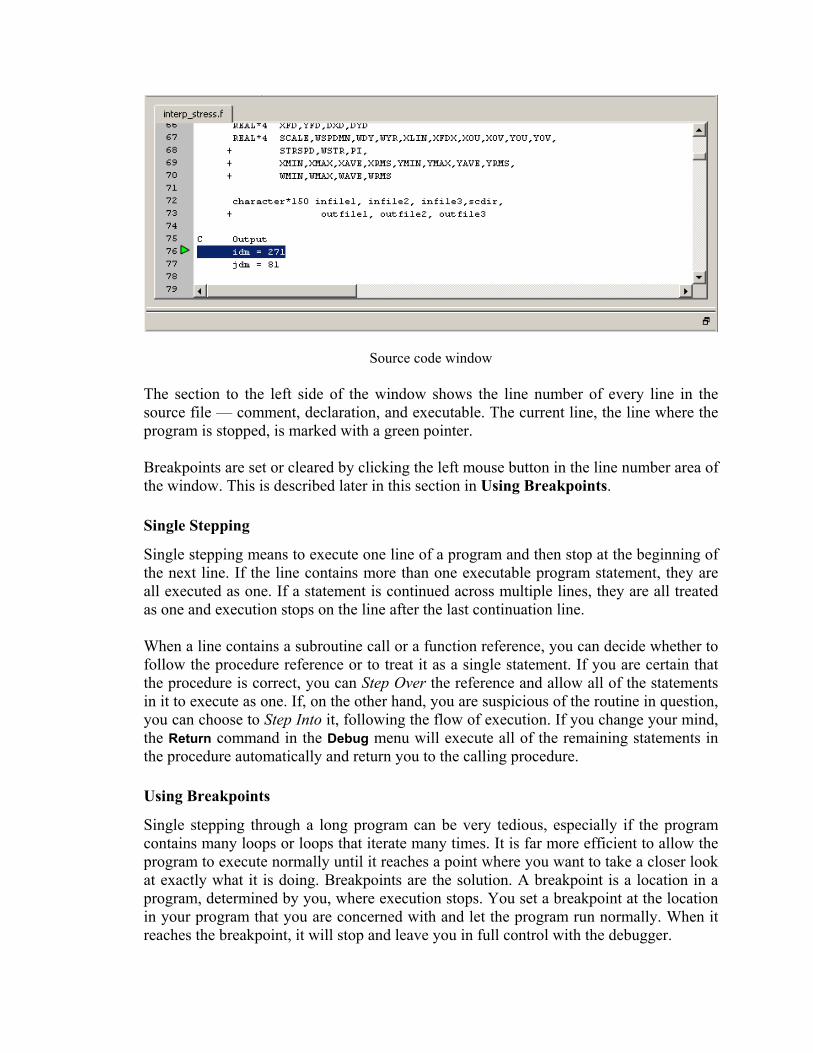
Source code window The section to the left side of the window shows the line number of every line in the source file — comment, declaration, and executable. The current line, the line where the program is stopped, is marked with a green pointer. Breakpoints are set or cleared by clicking the left mouse button in the line number area of the window. This is described later in this section in Using Breakpoints.
Single Stepping
Single stepping means to execute one line of a program and then stop at the beginning of the next line. If the line contains more than one executable program statement, they are all executed as one. If a statement is continued across multiple lines, they are all treated as one and execution stops on the line after the last continuation line. When a line contains a subroutine call or a function reference, you can decide whether to follow the procedure reference or to treat it as a single statement. If you are certain that the procedure is correct, you can Step Over the reference and allow all of the statements in it to execute as one. If, on the other hand, you are suspicious of the routine in question, you can choose to Step Into it, following the flow of execution. If you change your mind, the Return command in the Debug menu will execute all of the remaining statements in the procedure automatically and return you to the calling procedure.
Using Breakpoints
Single stepping through a long program can be very tedious, especially if the program contains many loops or loops that iterate many times. It is far more efficient to allow the program to execute normally until it reaches a point where you want to take a closer look at exactly what it is doing. Breakpoints are the solution. A breakpoint is a location in a program, determined by you, where execution stops. You set a breakpoint at the location in your program that you are concerned with and let the program run normally. When it reaches the breakpoint, it will stop and leave you in full control with the debugger.
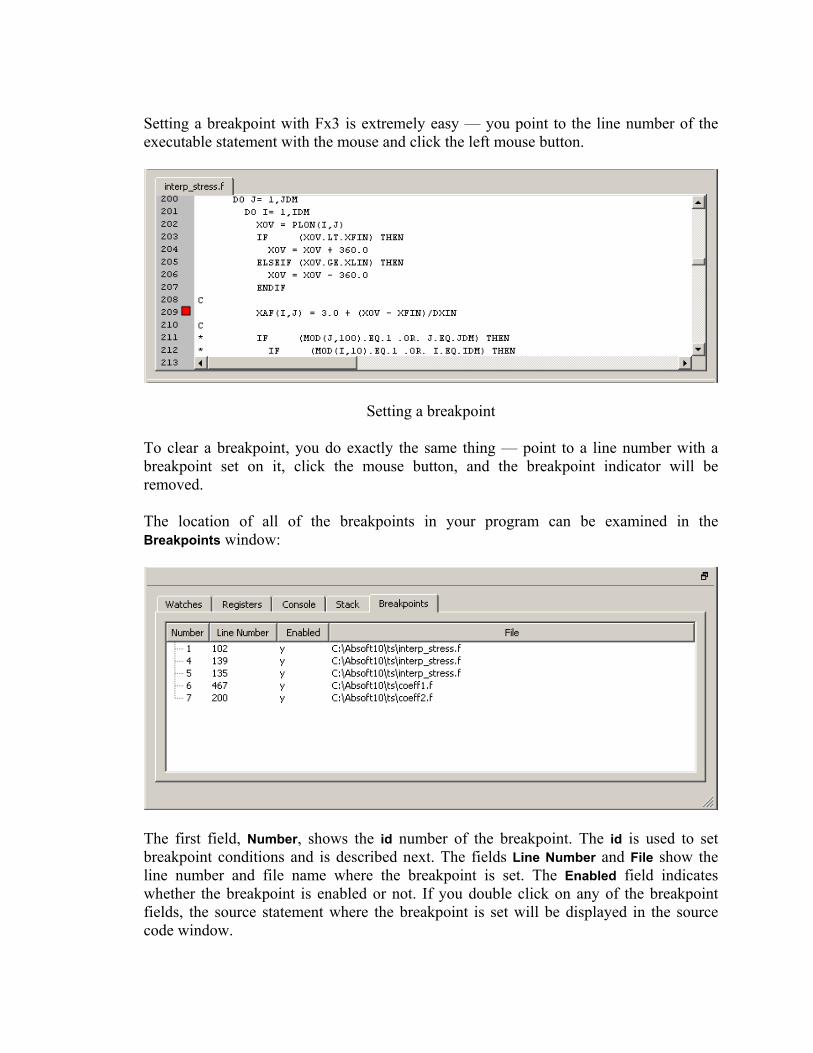
Setting a breakpoint with Fx3 is extremely easy — you point to the line number of the executable statement with the mouse and click the left mouse button.
Setting a breakpoint To clear a breakpoint, you do exactly the same thing — point to a line number with a breakpoint set on it, click the mouse button, and the breakpoint indicator will be removed. The location of all of the breakpoints in your program can be examined in the Breakpoints window:
The first field, Number, shows the id number of the breakpoint. The id is used to set breakpoint conditions and is described next. The fields Line Number and File show the line number and file name where the breakpoint is set. The Enabled field indicates whether the breakpoint is enabled or not. If you double click on any of the breakpoint fields, the source statement where the breakpoint is set will be displayed in the source code window.
To give you further control over execution, you can set more conditions than reaching the line where the breakpoint is set before stopping execution. This is very important if your program must execute the same statement many times before you are interested in stopping it. Additional conditions are placed on breakpoints from the Console window using the list breakpoints and the condition commands as follows:
1. Select the Console pane and enter the command list breakpoints. This will list information about the program breakpoints including their ids. You can also obtain the id in the breakpoint window described above.
2. Using the id for the desired breakpoint obtained in step 1, use the condition command to set a condition. For example:
condition 3 ((yag(1) .LT. 150) .OR. (yag(10) .GR. 1000))
See the Command Reference section later in the manual for more information on breakpoints and conditions.
Displaying Variables
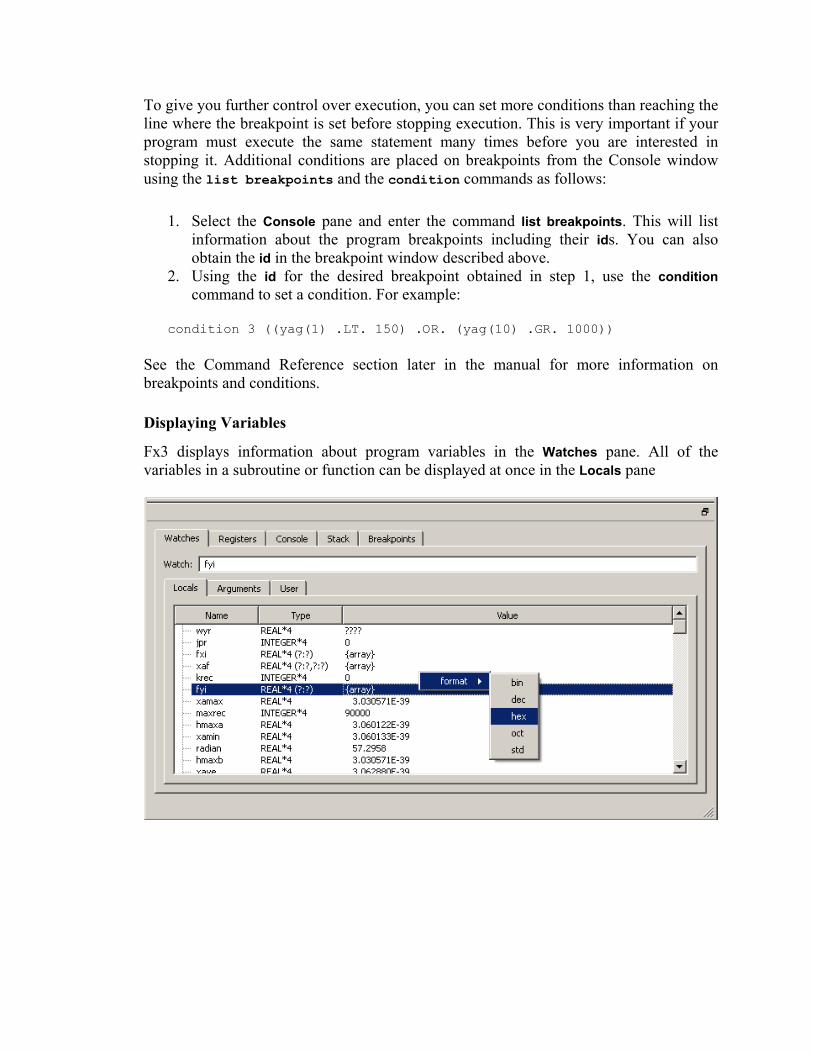
Fx3 displays information about program variables in the Watches pane. All of the variables in a subroutine or function can be displayed at once in the Locals pane
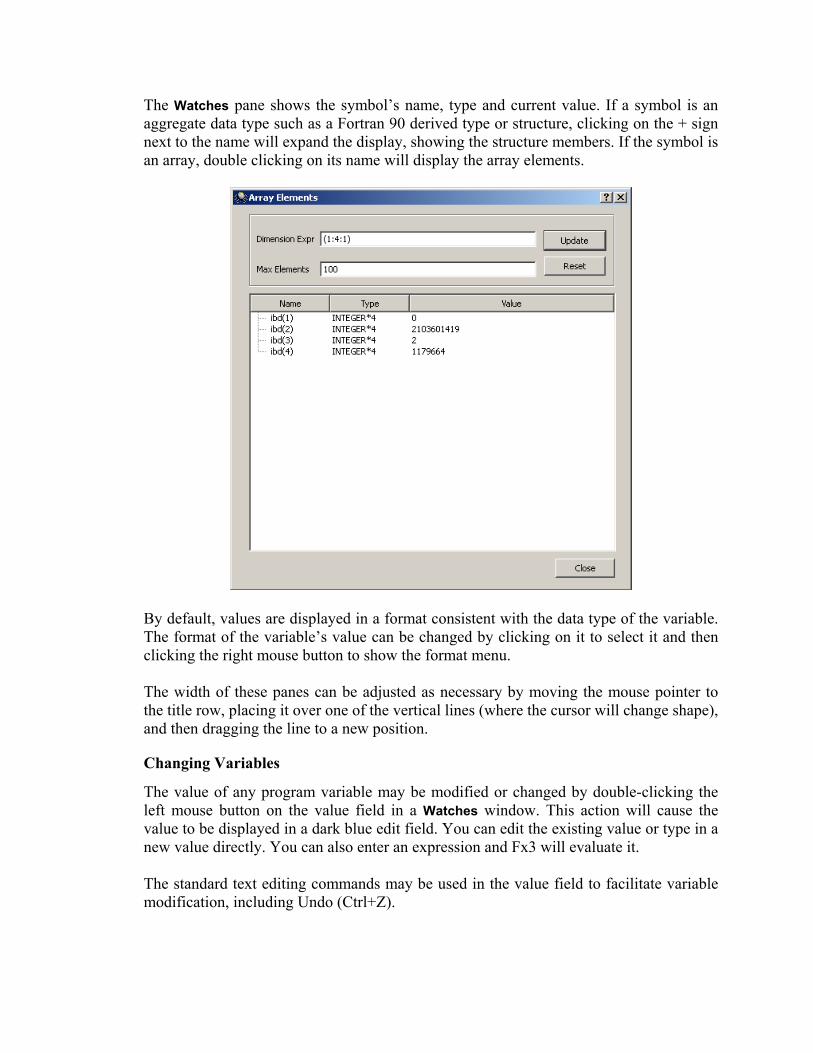
The Watches pane shows the symbol’s name, type and current value. If a symbol is an aggregate data type such as a Fortran 90 derived type or structure, clicking on the + sign next to the name will expand the display, showing the structure members. If the symbol is an array, double clicking on its name will display the array elements.
By default, values are displayed in a format consistent with the data type of the variable. The format of the variable’s value can be changed by clicking on it to select it and then clicking the right mouse button to show the format menu. The width of these panes can be adjusted as necessary by moving the mouse pointer to the title row, placing it over one of the vertical lines (where the cursor will change shape), and then dragging the line to a new position.
Changing Variables
The value of any program variable may be modified or changed by double-clicking the left mouse button on the value field in a Watches window. This action will cause the value to be displayed in a dark blue edit field. You can edit the existing value or type in a new value directly. You can also enter an expression and Fx3 will evaluate it. The standard text editing commands may be used in the value field to facilitate variable modification, including Undo (Ctrl+Z).
Debugging Hints
Fx3 cannot debug your program for you, but it can provide you with the information necessary to track down programming errors and logic faults. The key to gaining that information is asking the right questions. This section highlights some general guidelines and tips for getting the most out of a debugging session.
• If a program gives different results each time it is run, look for uninitialized variables and local variables that are being overwritten. Remember that local variables must declared in a SAVE statement in FORTRAN and with a static specifier in the C programming language in order to retain their definition status across procedure references.
• You can display the values of the local variables in a previous referencing procedure by changing the current frame in the Stack window as described under Program in the Fx3 Menus And Windows section.
• If you find yourself in a procedure that you are not interested in, use the Return command in the Debug menu to return immediately to referencing procedure. This command will execute all of the remaining statements in the function or subroutine and return you to point where it was referenced.
• If the value returned by a function is completely wrong, yet single stepping through the function itself seems to calculate the result correctly, check the function declarations and definitions. Absoft FORTRAN 77, like the C programming language is case sensitive by default. Also, incorrectly typing the precision of a floating point function produces incorrect results due to the different internal representations of single and double precision numbers.
• If you are experiencing difficulty with operating system API functions, pay particular attention to the data types and method of passing parameter lists to the routines. The VAL function must be used when passing a parameter by value in FORTRAN.
• Finding an obscure problem in a large program can be tedious and time consuming, especially if the program crashes. Try single stepping over calls to large subroutines and functions until the program fails. It is much easier to examine a problem more closely once you have isolated the problem to an individual procedure.
• Pointers are a powerful programming feature in any computer language, but they can also cause a tremendous amount of havoc when they are not initialized correctly or when they unexpectedly lose their definition status. In both cases, using null or dangling pointer usually leads to disaster. Incorporating pointers in your routines requires a defensive programming style.
FX3 MENUS AND WINDOWS This section describes the menu selections that are used to perform Fx3 commands and the windows that they control. The name of the command is given, followed by its Ctrl-key equivalent (if any) and a description of its function. File Menu
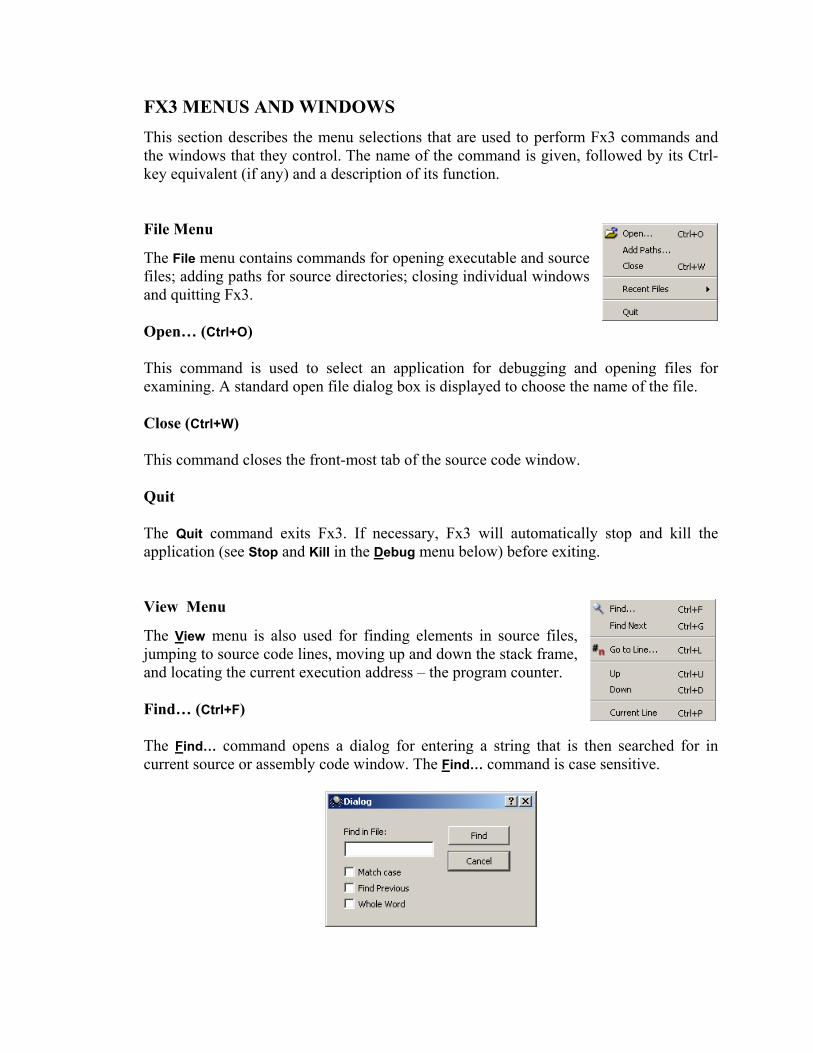
The File menu contains commands for opening executable and source files; adding paths for source directories; closing individual windows and quitting Fx3. Open… (Ctrl+O) This command is used to select an application for debugging and opening files for examining. A standard open file dialog box is displayed to choose the name of the file. Close (Ctrl+W) This command closes the front-most tab of the source code window. Quit The Quit command exits Fx3. If necessary, Fx3 will automatically stop and kill the application (see Stop and Kill in the Debug menu below) before exiting. View Menu
The View menu is also used for finding elements in source files, jumping to source code lines, moving up and down the stack frame, and locating the current execution address – the program counter. Find… (Ctrl+F) The Find… command opens a dialog for entering a string that is then searched for in current source or assembly code window. The Find… command is case sensitive.
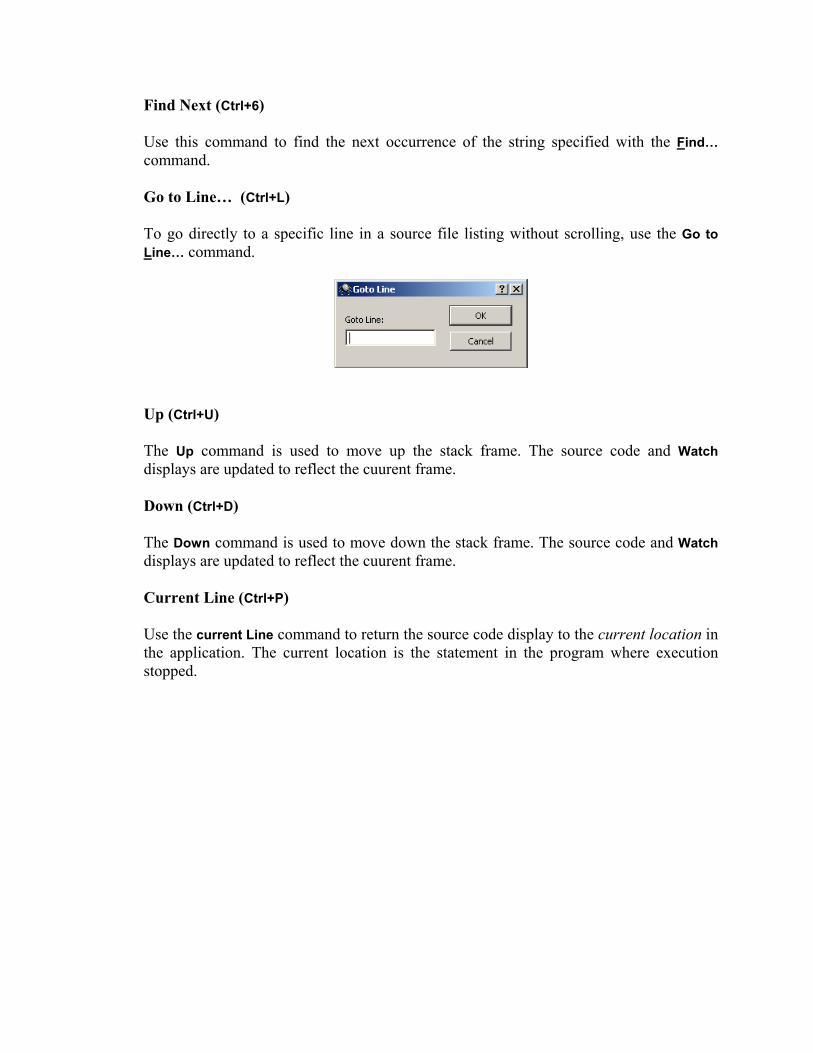
Find Next (Ctrl+6) Use this command to find the next occurrence of the string specified with the Find… command. Go to Line… (Ctrl+L) To go directly to a specific line in a source file listing without scrolling, use the Go to Line… command.
Up (Ctrl+U) The Up command is used to move up the stack frame. The source code and Watch displays are updated to reflect the cuurent frame. Down (Ctrl+D) The Down command is used to move down the stack frame. The source code and Watch displays are updated to reflect the cuurent frame. Current Line (Ctrl+P) Use the current Line command to return the source code display to the current location in the application. The current location is the statement in the program where execution stopped.
Debug Menu
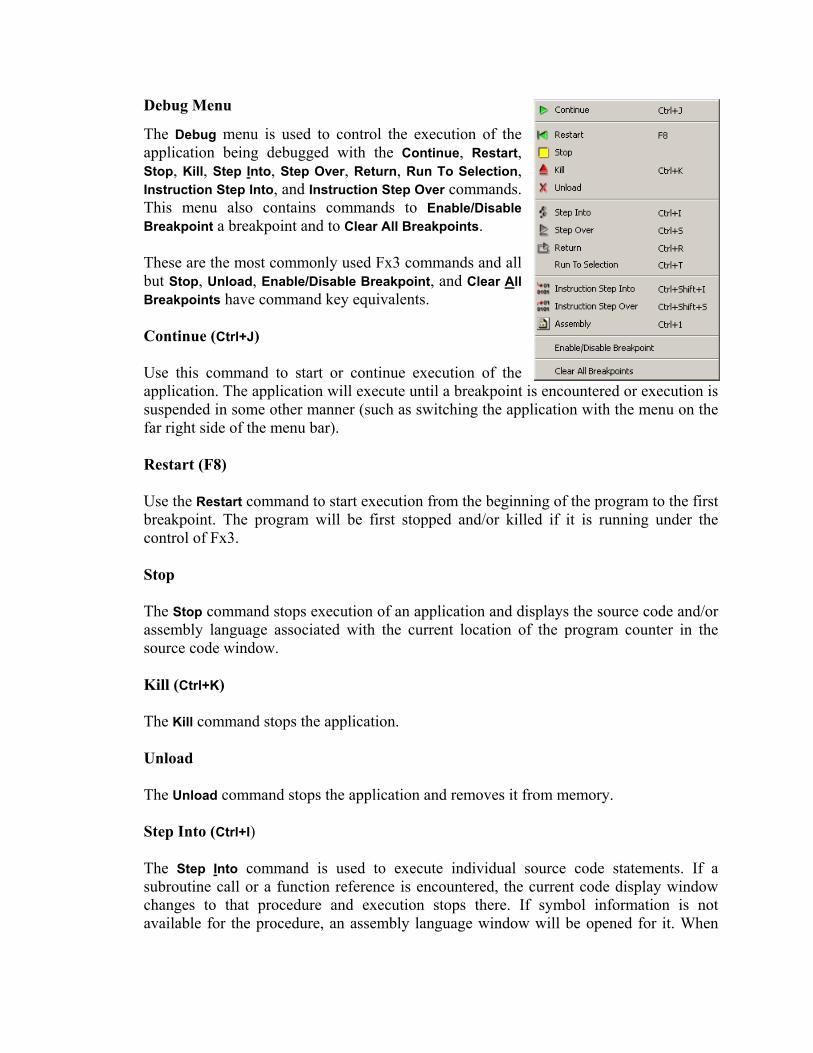
The Debug menu is used to control the execution of the application being debugged with the Continue, Restart, Stop, Kill, Step Into, Step Over, Return, Run To Selection, Instruction Step Into, and Instruction Step Over commands. This menu also contains commands to Enable/Disable Breakpoint a breakpoint and to Clear All Breakpoints. These are the most commonly used Fx3 commands and all but Stop, Unload, Enable/Disable Breakpoint, and Clear All Breakpoints have command key equivalents. Continue (Ctrl+J) Use this command to start or continue execution of the application. The application will execute until a breakpoint isuspended in some other manner (such as switching the application with the menu on the far right side of the menu bar).
s encountered or execution is
Restart (F8) Use the Restart command to start execution from the beginning of the program to the first breakpoint. The program will be first stopped and/or killed if it is running under the control of Fx3. Stop The Stop command stops execution of an application and displays the source code and/or assembly language associated with the current location of the program counter in the source code window. Kill (Ctrl+K) The Kill command stops the application. Unload The Unload command stops the application and removes it from memory. Step Into (Ctrl+I) The Step Into command is used to execute individual source code statements. If a subroutine call or a function reference is encountered, the current code display window changes to that procedure and execution stops there. If symbol information is not available for the procedure, an assembly language window will be opened for it. When
source line information is available, this command executes source statements in both source code windows and assembly language windows. Step Over (Ctrl+S) Similar to the previous command, the Step Over command is also used to execute individual source code statements, but it treats subroutine calls and function references as though they were single statements. When source line information is available, this command executes source statements in both source code windows and assembly language windows. Return (Ctrl+R) This command is used to automatically execute all of the remaining statements in the current subroutine or function and return to the statement (source code and/or assembly language) immediately following the point where it was referenced in the calling procedure. Run To Selection (Ctrl+T) Use this command to execute all of the statements from the current program counter position to the location of the caret in the code window. Instruction Step Into (Ctrl+Shift+I) The Instruction Step Into command is used to execute individual assembly language instructions. If a subroutine call is encountered, the current code display window changes to that procedure and execution stops there. Instruction Step Over (Ctrl+Shift+S) Similar to the previous command, the Instruction Step Over command is also used to execute individual assembly language instructions, but it treats subroutine calls as though they were single statements. Enable/Disable Breakpoint This command enables/disables the selected breakpoint in the Breakpoints pane. A disabled breakpoint is shown in black rather than red. Clear All Breakpoints Use this command to clear all of the breakpoints in the application.
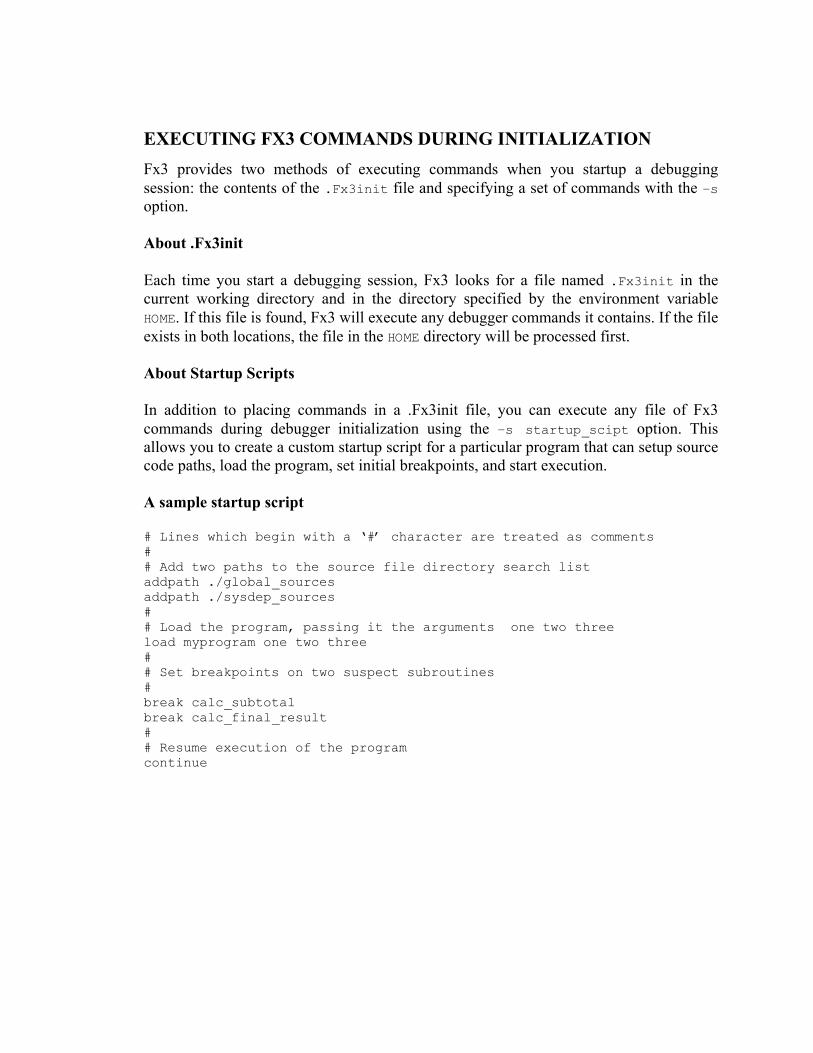
EXECUTING FX3 COMMANDS DURING INITIALIZATION Fx3 provides two methods of executing commands when you startup a debugging session: the contents of the .Fx3init file and specifying a set of commands with the –s option. About .Fx3init Each time you start a debugging session, Fx3 looks for a file named .Fx3init in the current working directory and in the directory specified by the environment variable HOME. If this file is found, Fx3 will execute any debugger commands it contains. If the file exists in both locations, the file in the HOME directory will be processed first. About Startup Scripts In addition to placing commands in a .Fx3init file, you can execute any file of Fx3 commands during debugger initialization using the –s startup_scipt option. This allows you to create a custom startup script for a particular program that can setup source code paths, load the program, set initial breakpoints, and start execution. A sample startup script # Lines which begin with a ‘#’ character are treated as comments # # Add two paths to the source file directory search list addpath ./global_sources addpath ./sysdep_sources # # Load the program, passing it the arguments one two three load myprogram one two three # # Set breakpoints on two suspect subroutines # break calc_subtotal break calc_final_result # # Resume execution of the program continue
DEBUGGING IN THE COMMAND WINDOW This section introduces debugging with the Fx3 debugger in the command window. It covers examining program source code, program execution, using breakpoints, and displaying variables and other program information.
Examining Program Source Code
The view command is the primary command you will use to examine the source code for your program. When your program stops at a location for which source code is available, Fx3 will automatically display the appropriate line of source. At this point, you can use the view command to see where your program is going next, where it has been, or to examine the contents of an include file to determine the value of a predefined constant. Using the view command While the view command allows you to examine any text file, its primary purpose is to display your program’s source code. You can specify which file to examine as the name of a source file either with a line number, or as the name of a procedure that has been compiled with debugging information. The first time a view command is issued with an argument after your program stops execution, it will display a window of source code around the specified line or procedure name. You can display additional lines of code by entering the view command with no arguments or by simply pressing the return key.
Example: You can use the following command to display lines from the source file lists.c centered on the 30th line:
(Fx3) view lists.c:30
To display source code for the function list_traverse, you can enter:
(Fx3) view list_traverse
Examining the Stack
Any time your program has stopped execution, you can use the Fx3 stack commands to display the current call chain, move up and down call chain, and examine procedure arguments. The stacktrace command displays the call chain from the point where your program is currently stopped up to its main routine. The stacktrace command can also be used to display the arguments through all the routines in the call chain
Example: To display your program’s current call chain and the arguments to each routine, enter:
(Fx3) stacktrace -a You can move up and down the in the call chain using the Fx3 commands up and down. These commands have the effect of changing the currently active stack frame, allowing you to view local variables for the routine represented by a given stack frame.
Executing Your Program
One of the major advantages of using a source level debugger is the ability to interactively control execution of your program. When you begin debugging session by specifying the name of your program as an argument to Fx3 or load it into Fx3 with the load command, Fx3 will start execution of the program and allow it to run until its main procedure is entered. For C and C++ programs this is the procedure named main and for FORTRAN programs this is the procedure declared with the PROGRAM statement. When this procedure is entered, Fx3 will stop the program and you will be able to control further execution using the commands discussed below. Resuming Program Execution After your program has stopped at its main procedure, you may wish to resume execution until an error occurs. Issuing the continue command will cause Fx3 to resume execution of your program until an error occurs or it runs to completion.
Example: You can enter the following command to resume execution of your program:
(Fx3) continue If your program is stopped on a breakpoint when you issue the continue command, Fx3 will temporarily disable the breakpoint once to allow program execution to move past it. You can specify an integer argument to the continue command to cause the breakpoint to be ignored an addition number of times.
Example: The following command resumes execution of your program and disables the breakpoint on the current line the next 5 times it is encountered:
(Fx3) continue 5
Executing Single Statements At certain times during a debugging session, you may want to execute your program one statement at a time. Fx3 provides two commands to accomplish this task. The stepinto command will execute the next source line of your program.
Example: You can enter the following command to execute the next statement in your program:
(Fx3) stepinto If a source statement to be executed with stepinto command is a call to a subroutine or function, execution will stop on the first executable source line of the subroutine or function. Often, you will not be interested in debugging that procedure. You can use the stepover command to treat any subroutine or function calls as part of the source line, causing execution to continue until the next source line.
Example: To execute the next source line without stopping in any subroutine or functions, you can enter:
(Fx3) stepover If desired, both the stepinto and stepover commands can be used to execute multiple statements. To do this, specify the number of statements to execute as an argument to these commands.
Example: To execute the next seven source lines without stopping in any subroutine or functions, you can enter:
(Fx3) stepover 7 Returning From Procedures When executing your program one statement at a time, you may find that you have entered a stepinto command when you really meant to enter a stepover command. Fx3 provides a command to get you back to the point of interest as quickly possible. The return command will resume execution until a procedure returns to its calling point.
Restarting Program Execution During the course of debugging session, you may wish to start your program over again, possibly specifying a new set of arguments. The run command allows you to do this. When you issue the run command, the current instance of your program is terminated, and a new instance is created. Unlike the initial process created with the load command, Fx3 does not stop your program in the main program unit when the run command is issued.
Example: To restart execution of your program with the arguments one two three and have its standard input redirected from the file input.dat, you can enter:
(Fx3) run one two three <input.dat Once arguments have been specified, Fx3 will continue to use those arguments until you specify different ones.
Using Breakpoints to Stop Program Execution
Although it is possible to use the stepinto and stepover commands to execute your program until you determine where the problem is, this process is tedious and inefficient for all but the smallest of programs. Your program may require a complex series of events to occur, or have to run for a considerable amount of time, before a problem shows up. Breakpoints allow you to execute your program at full speed until a specific procedure or source line is encountered. Setting Breakpoints You can install breakpoints in your program using the break command. The location of the breakpoint is specified as a source file and line number, the name of a program procedure, or as any executable address in the program.
Example: To set a breakpoint on line 150 of the source file linpak.f, you can enter:
(Fx3) break linpak.f:150
If execution is already stopped on a line in the file linpak.f, Fx3 allows you to specify only the desired line number:
(Fx3) break 150
After you install a breakpoint, Fx3 assigns it an integer breakpoint id number. You will use this breakpoint id to refer to the breakpoint when using the other Fx3 breakpoint commands described below. As a convenience, the id of the last breakpoint is stored in a debugger variable named %lastbreak. You can see a list of all the breakpoints that you have set and their breakpoint id numbers by using the list breakpoints command. Executing Commands When A Breakpoint Occurs Breakpoints can be used to execute other Fx3 commands by assigning a list of commands to be executed when a breakpoint stops program execution using the commands command. You might use this feature to print out the value of a variable each time a breakpoint is encountered.
Example: If you have created a breakpoint that has the breakpoint id 1, you can display the value of the variable I each time this breakpoint is encountered by entering:
(Fx3) commands 1 { print I } Multiple commands are be specified by separating each command with a semi-colon. By using multiple commands, you may be able to temporarily fix a problem without having to edit and recompile your source code. Since you can cause any list of Fx3 commands to be executed at a breakpoint, it is possible to stop program execution, change the value of a program variable, and then resume program execution without having to enter the commands each time the breakpoint is encountered.
Example: Consider the following FORTRAN function:
REAL FUNCTION sumarray(array,size) REAL array(size),result INTEGER I,array_size array_size = size DO i =1,array_size result = result+array(i) END DO sumarray = result END
Since the local variable result is not initialized to zero, this function will return unpredictable results. This problem can be temporarily fixed by with the following Fx3 commands:
Fx3) break sumarray (Fx3) commands %lastbreak { set result=0.0; continue; }
Using Breakpoint Conditions After you have installed a breakpoint in your program, you can arrange to have it stop execution only when a set of conditions is met. The Fx3 condition command is used to assign an expression to a breakpoint that will be evaluated each time the breakpoint is encountered. If the expression evaluates to a non-zero value, program execution will stop, otherwise it will be resumed automatically.
Example: If you have created a breakpoint that has the breakpoint id 1, you can cause this breakpoint to stop program execution only when the value of the variable I is equal the value 10 by entering:
(Fx3) condition 1 ( I .EQ 10 ) Using Breakpoint Ignore Counts After you have installed a breakpoint in your program, you can arrange to have it stop execution only after it has been encountered a certain number of times. The Fx3 ignore command is used to assign an ignore count to a breakpoint. Each time the breakpoint is encountered, the ignore count is decremented by one and when it reaches zero, program execution stops and the ignore count is reset to its original value.
Example: If you have created a breakpoint that has the breakpoint id 1, you can cause this breakpoint to stop program execution only after it has been encountered four times by entering:
(Fx3) ignore 1 4
Disabling and Enabling Breakpoints After you have installed one or more breakpoints in your program, you may wish to temporarily disable them for part of a debugging session. The Fx3 disable command allows you to disable a breakpoint and any commands that are associated with it until you re-enable the breakpoint with the Fx3 enable command.
Example: If you have created a breakpoint that has the breakpoint id 1, you can disable this breakpoint by entering:
(Fx3) disable 1
To re-enable this breakpoint later, enter:
(Fx3) enable 1 Removing Breakpoints After you have installed one or more breakpoints in your program, you may wish to remove them after they have served their purpose. The Fx3 delete and clear commands allow you to remove a breakpoint and any condition, ignore count and commands that are associated with it. The delete command accepts a breakpoint id to specify the breakpoint to be removed; the clear command accepts a source file and line number, procedure name, or executable address to specify the breakpoint to be removed.
Example: If you have created a breakpoint on line 150 if the file linpak.f that has the breakpoint id 1, you can remove this breakpoint by entering either of these two commands:
(Fx3) delete 1 (Fx3) clear linpak.f:150
Displaying the Values of Variables
Another advantage of source level debugging is the ability to display the values of program variables without having to insert special debugging statements into your program. Fx3 allows you to examine the contents of your program’s variables, arrays, and data structures whenever your program has stopped execution. Displaying Simple Variables The Fx3 print command is used to display the contents of your program’s variables. Fx3 will use the symbol information output by compilers to determine the appropriate output format for a variable, or you can specify an explicit output format.
Example: If a FORTRAN program defines the following variables:
INTEGER I REAL X COMPLEX Z
You can display their values with the following commands:
(Fx3) print I (Fx3) print X (Fx3) print Z
In the preceding example, the values of I, X, and Z will be displayed in a format appropriate for their respective types. You may also specify an explicit output format to use when displaying a variable. The various formats can be found in the section on the print later in this manual. Displaying Arrays When the name of an array is used with the print command, Fx3 will display every element of the array or the number of elements indicated by the debugger control variable %arraycount. Generally, you will not be interested in seeing all the elements of an array. Fx3 also allows you to specify individual array elements using the array indexing syntax of the current source language. There will be occasions where you are interested in examining a range of array elements Fx3 provides the printarray command to handle this situation.
Example:
Given the following FORTRAN array variables:
INTEGER IARRAY(10) REAL RARRAY(10,10)
You can display the first five elements of the array IARRAY and the first column of the array RARRAY by entering:
(Fx3) printarray –d (1:5) IARRAY (Fx3) printarray –d (1:10,1:1) RARRAY
Displaying User Defined Types The print command also allows you display the contents of C structures, C++ classes, and Fortran 95 TYPEs. When the name of a variable having a user defined type is specified with the print command, Fx3 will display all the members of the derived type. You can display individual members of a type by using the ->, ., and % operators. C and C++ pointers to user defined types, as well as other data types, can be dereferenced using the * operator. Fortran 95 pointers will automatically dereference when they have been assigned values. If you have declared an array as part of a user defined type, you can use the printarray command to display a range of the array’s elements by specifying the variable name followed by the appropriate operator and member name.
Example:
Given the following Fortran 95 declarations: TYPE(sometype)
INTEGER simple INTEGER iarray(10) END TYPE sometype TYPE(sometype) :: UTYPE
You can the following commands to display the entire data structure, the member simple, and the first five elements of the member iarray:
(Fx3) print UTYPE (Fx3) print UTYPE%simple (Fx3) printarray –d (1:5) UTYPE%iarray
Using the Expression Analyzer In addition to displaying the values of variables, you can also evaluate expressions that include variables, numeric constants, and source language operators. These expressions can be as simple as adding 10 to the contents of a variable or can include multiple variables, constants and source language operators.
Watching The Values of Variables At some point during a debugging session, you may want to observe the value of a variable change as your program executes. The display command allows you to create auto-display - variables and expressions to be displayed each time your program stops executing.
Example:
The following command will display the value of the array element a(i,j) each time program execution stops: (Fx3) display a(i,j)
Each auto-display expression is assigned an integer id when you create it with the display command. When you want to remove an auto-display, use the undisplay command with the value of the auto-display’s id. Changing the Values of Variables Fx3 allows you to modify the values of program variables any time execution of your program is stopped. The set command is used to assign new values to variables as well as altering the values of Fx3’s control variables. When assigning new values to variables, Fx3 will perform appropriate type conversions when possible and inform you when you have specified a value that is inappropriate for the variable you are modifying.
COMMAND ARGUMENTS In order get first time users started with Fx3 as quickly as possible, the previous sections have glossed over the details of specifying arguments to Fx3 commands. This section provides more detail on the items that can be specified as arguments to Fx3 commands. The section covers the following topics: • Identifier Scoping
Describes the scoping conventions used for Fx3 command arguments.
• Specifying Constants Describes the syntax for entering constants as command arguments.
• Specifying Registers Describes using machine registers as command arguments.
• Expression Interpretation Discusses the interpretation of variables, entry points and constants when used in expressions.
Identifier Scoping
Identifier scoping refers to the identifiers that are accessible at the current state of the program being debugged. Some arguments are not dependent upon the program and are always available. Program constants, as well as Fx3 Control Variables, internal variables within the debugger, would be examples of these types of arguments. Control Variables are listed in the appendices. Other arguments, such as local variables in the program, are only accessible when the procedure in which they were declared is active. Fx3 will implicitly determine the appropriate scope, or an identifier's scope can be explicitly stated when necessary. Implicit Scoping When identifiers are program specific items, Fx3 determines the appropriate scope using two sets of scoping information: the actual scope and the current scope. A program's actual scope is the source line, procedure name and source file which contain the next assembly language instruction to be executed, or the last assembly language instruction executed if a core file is being examined. By default, the current scope is identical to the actual scope. However, the current scope may be changed with the down, up, and frame commands listed in Command Reference section. Fx3 will use the procedure name defined by the current scope for searching the program's symbol table for local variables, and the file defined by the current scope when searching the program's symbol table for static variables and static functions.
Specifying Symbols
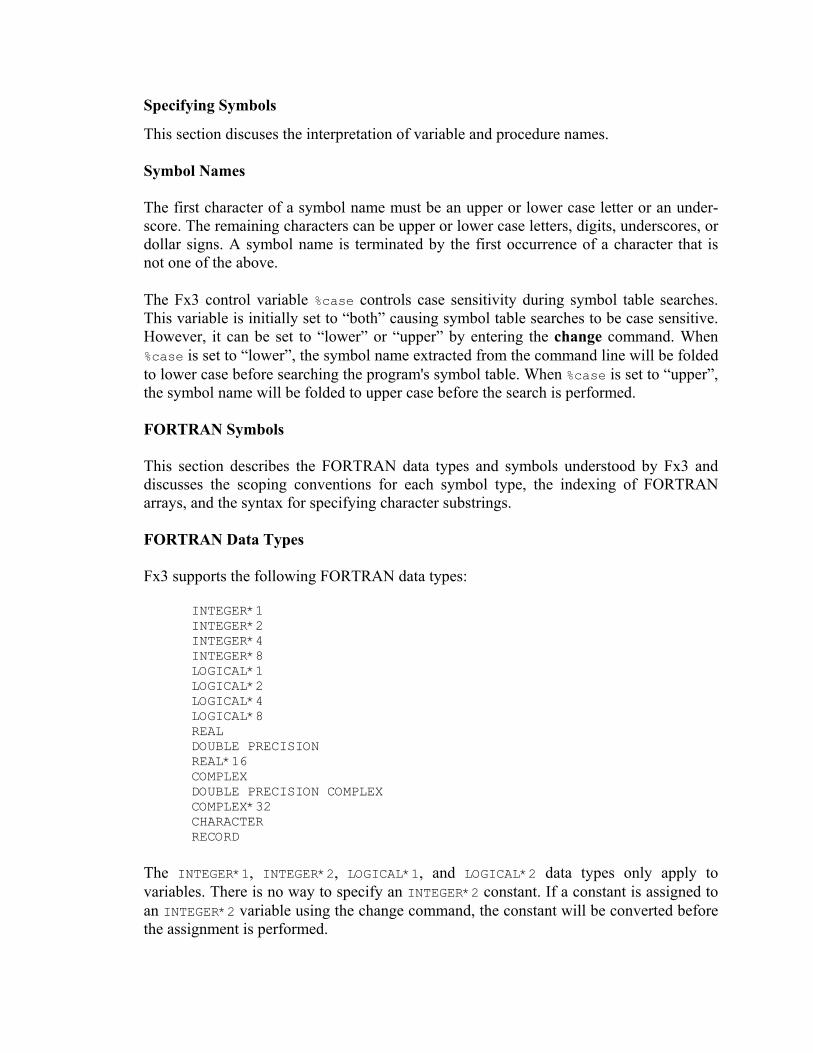
This section discuses the interpretation of variable and procedure names. Symbol Names The first character of a symbol name must be an upper or lower case letter or an under-score. The remaining characters can be upper or lower case letters, digits, underscores, or dollar signs. A symbol name is terminated by the first occurrence of a character that is not one of the above. The Fx3 control variable %case controls case sensitivity during symbol table searches. This variable is initially set to “both” causing symbol table searches to be case sensitive. However, it can be set to “lower” or “upper” by entering the change command. When %case is set to “lower”, the symbol name extracted from the command line will be folded to lower case before searching the program's symbol table. When %case is set to “upper”, the symbol name will be folded to upper case before the search is performed. FORTRAN Symbols This section describes the FORTRAN data types and symbols understood by Fx3 and discusses the scoping conventions for each symbol type, the indexing of FORTRAN arrays, and the syntax for specifying character substrings. FORTRAN Data Types Fx3 supports the following FORTRAN data types:
INTEGER*1 INTEGER*2 INTEGER*4 INTEGER*8 LOGICAL*1 LOGICAL*2 LOGICAL*4 LOGICAL*8 REAL DOUBLE PRECISION REAL*16 COMPLEX DOUBLE PRECISION COMPLEX COMPLEX*32 CHARACTER RECORD
The INTEGER*1, INTEGER*2, LOGICAL*1, and LOGICAL*2 data types only apply to variables. There is no way to specify an INTEGER*2 constant. If a constant is assigned to an INTEGER*2 variable using the change command, the constant will be converted before the assignment is performed.
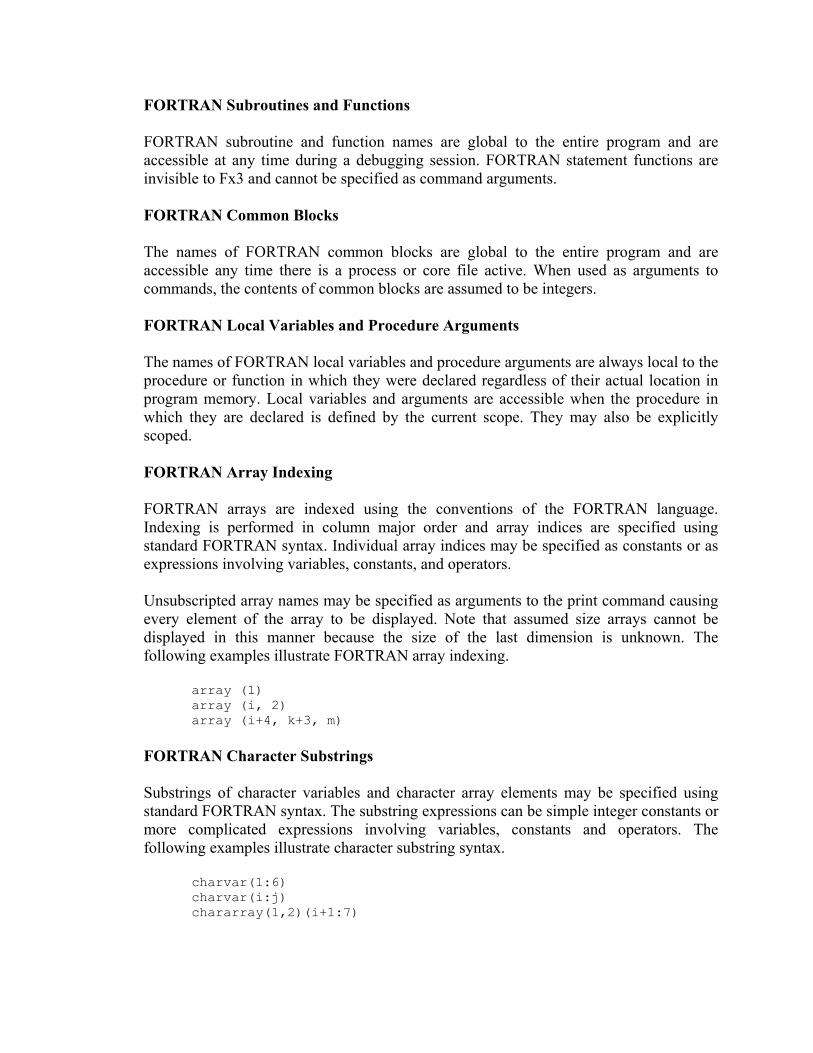
FORTRAN Subroutines and Functions FORTRAN subroutine and function names are global to the entire program and are accessible at any time during a debugging session. FORTRAN statement functions are invisible to Fx3 and cannot be specified as command arguments. FORTRAN Common Blocks The names of FORTRAN common blocks are global to the entire program and are accessible any time there is a process or core file active. When used as arguments to commands, the contents of common blocks are assumed to be integers. FORTRAN Local Variables and Procedure Arguments The names of FORTRAN local variables and procedure arguments are always local to the procedure or function in which they were declared regardless of their actual location in program memory. Local variables and arguments are accessible when the procedure in which they are declared is defined by the current scope. They may also be explicitly scoped. FORTRAN Array Indexing FORTRAN arrays are indexed using the conventions of the FORTRAN language. Indexing is performed in column major order and array indices are specified using standard FORTRAN syntax. Individual array indices may be specified as constants or as expressions involving variables, constants, and operators. Unsubscripted array names may be specified as arguments to the print command causing every element of the array to be displayed. Note that assumed size arrays cannot be displayed in this manner because the size of the last dimension is unknown. The following examples illustrate FORTRAN array indexing.
array (1) array (i, 2) array (i+4, k+3, m)
FORTRAN Character Substrings Substrings of character variables and character array elements may be specified using standard FORTRAN syntax. The substring expressions can be simple integer constants or more complicated expressions involving variables, constants and operators. The following examples illustrate character substring syntax.
charvar(1:6) charvar(i:j) chararray(1,2)(i+1:7)
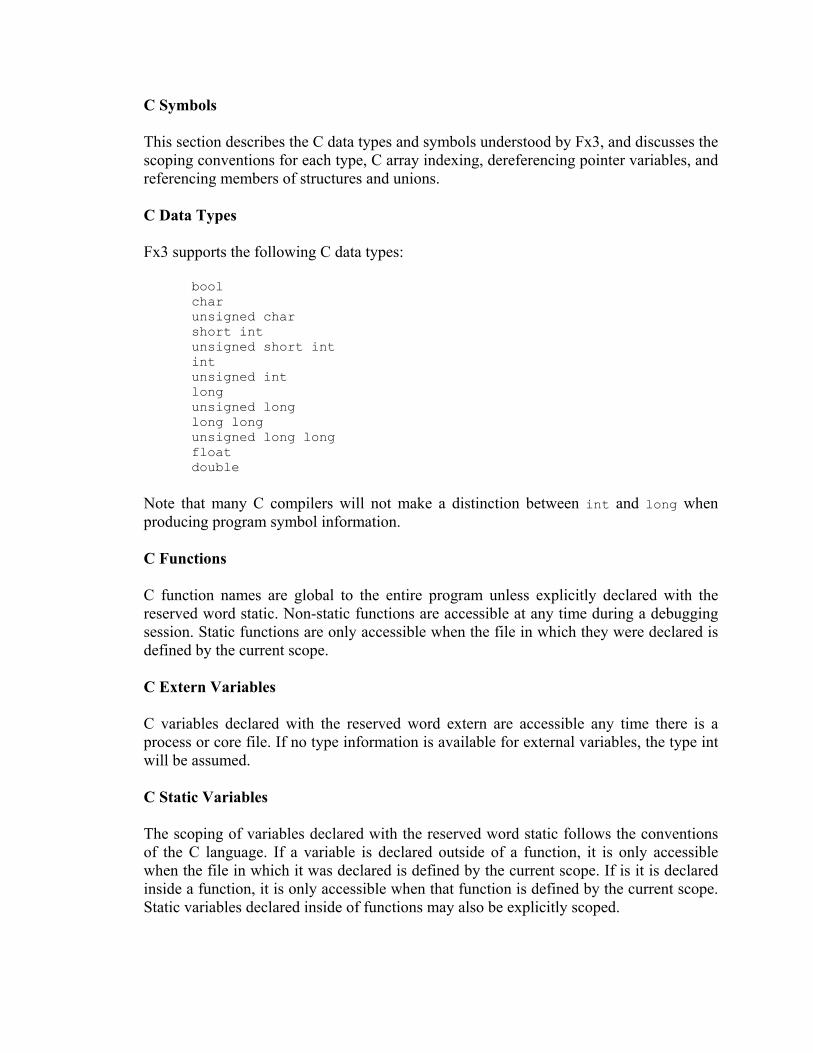
C Symbols This section describes the C data types and symbols understood by Fx3, and discusses the scoping conventions for each type, C array indexing, dereferencing pointer variables, and referencing members of structures and unions. C Data Types Fx3 supports the following C data types:
bool char unsigned char short int unsigned short int int unsigned int long unsigned long long long unsigned long long float double
Note that many C compilers will not make a distinction between int and long when producing program symbol information. C Functions C function names are global to the entire program unless explicitly declared with the reserved word static. Non-static functions are accessible at any time during a debugging session. Static functions are only accessible when the file in which they were declared is defined by the current scope. C Extern Variables C variables declared with the reserved word extern are accessible any time there is a process or core file. If no type information is available for external variables, the type int will be assumed. C Static Variables The scoping of variables declared with the reserved word static follows the conventions of the C language. If a variable is declared outside of a function, it is only accessible when the file in which it was declared is defined by the current scope. If is it is declared inside a function, it is only accessible when that function is defined by the current scope. Static variables declared inside of functions may also be explicitly scoped.
C Automatic Variables Automatic variables are only accessible while the function in which they were declared is defined by the current scope. Note that Fx3 does not distinguish between automatic variables declared at the beginning of a function and those declared within a block of the function's statements. C Array Indexing and Pointer Dereferencing Array indexing is performed using the conventions of the C language. Indexing is performed in row major order and indices are specified using standard C syntax. Individual indices can be specified as integer constants or as expressions involving variables, constants, and operators. Unsubscripted array names can be specified as arguments to the print command causing every element of the array to be displayed. The following examples illustrate C array indexing
array[l] array[i][1] array[i+1][j+1]
Pointer variables may be dereferenced using the “*” operator, or they may be indexed as if they had been declared as one dimensional arrays. Consider the following C program fragment:
int array[101]; int *aptr; aptr = array;
The following sets of commands will produce equivalent output.
print *aptr print aptr[0] print *(aptr+8) print aptr[2]
Note that Fx3 does not multiply the constant 8 by the size of an integer before performing the addition. C Structure and Union Members Structure and union members may be specified as command arguments by using the and “.” operators. The names of entire structures and unions may be specified as arguments to the print command causing every member of the structure or union to be displayed.
Specifying Constants
Constant arguments may be specified in one of the following forms: integer, floating point, complex, or character. The following sections provide details on each of these constant types. Integer Constants Integer constants can be entered in decimal, binary, octal, or hexadecimal form. Decimal Constants Decimal constants consist of an optional leading sign followed by a string of decimal digits [0-9]. Note that if a sign is not specified and the first digit is a zero, the constant will be interpreted as an octal integer as described below. The following are valid decimal constants:
10 -22 +100
Octal Constants Octal constants can be specified using the form familiar to C programmers, where an octal constant consists of a leading digit zero followed by a string of octal digits [0-7]. The following is an example of a valid octal constant:
0555 Hexadecimal Constants Hexadecimal constants can be specified using the form familiar to C programmers, where an hexadecimal constant consists of the leading digit zero followed the letter x or the letter X and a string of hexadecimal digits [0-9, A-F, or a-f]. The following is an example of a valid hexadecimal constant:
0x3f Floating Point Constants A floating point constant consists of an optional sign and string of decimal digits which contains a decimal point. A floating point constant may have an exponent. An exponent is specified by the letter 'E' or the letter 'D' followed by an optional sign and a string of decimal digits. If an exponent character is specified and the fractional portion of the constant is zero, the decimal point may be omitted.
A floating point constant is converted to double or single precision depending upon the specified exponent character. Floating point constants specified with a 'D' exponent character will be converted to double precision. Floating point constants specified with an 'E' exponent character, or without an exponent character, will be converted to single precision. The following are valid floating point constants:
12.0 -12.999 12. 999E12 12.9999D-12
Complex Constants A complex constant consists of a left parenthesis, followed by a pair of floating point constants separated by a comma, followed by a right parenthesis. Double precision complex constants are specified including a 'D' exponent character in one or both of the floating point constants.
The following are valid complex constants:
(12.0,12.0) (12.9999E-12,-12.9999E10) (100.0D0,200.0D0)
Character String and C Character Constants Character string constants are strings of ASCII characters delimited by either apostrophes or quotation marks. The delimiting character may be included in the string itself by representing it with two successive delimiting characters.
The following are examples of valid character string constants:
"hello world" 'hello world' "America's finest" 'America''s finest'
Specifying Registers
Registers are entered using the names accepted by the system assembler. In order to distinguish them from symbol names, they must be prefixed with the character “%”. When used in expressions, the data type of registers is assumed to be integer. However, if dedicated floating point registers are available they will be typed appropriately. The contents of registers are always retrieved from the actual scope and are available whenever a process or core file is active.
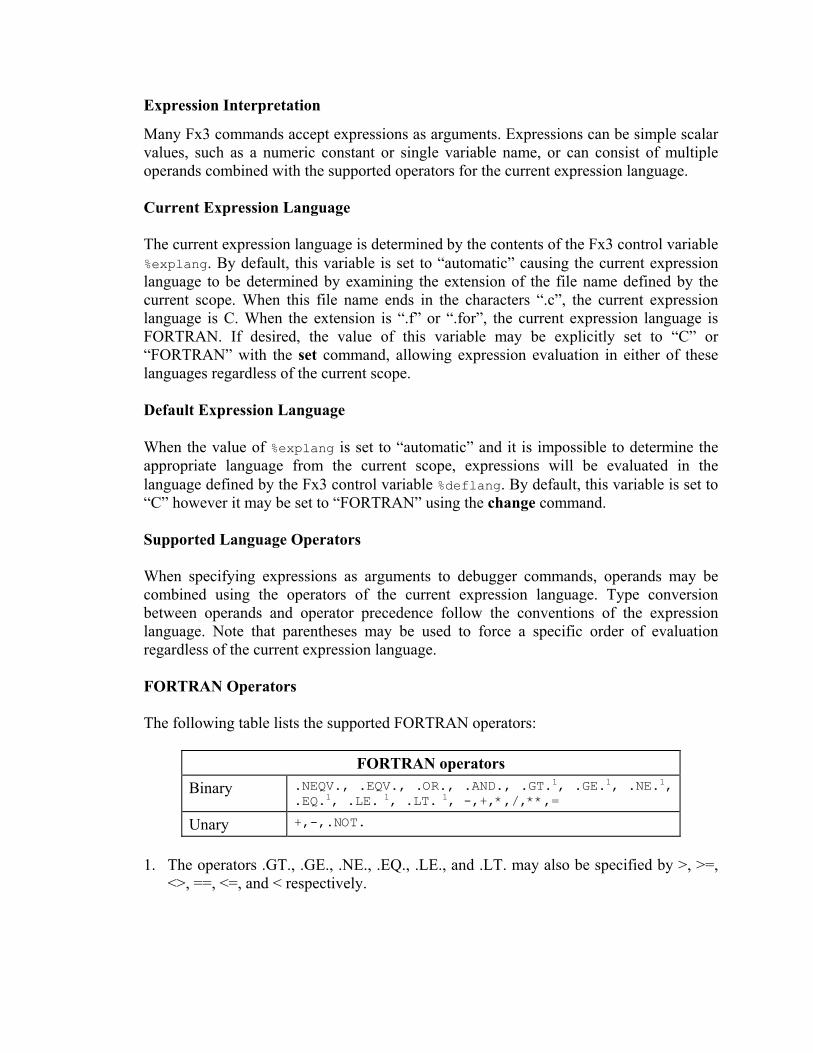
Expression Interpretation
Many Fx3 commands accept expressions as arguments. Expressions can be simple scalar values, such as a numeric constant or single variable name, or can consist of multiple operands combined with the supported operators for the current expression language. Current Expression Language The current expression language is determined by the contents of the Fx3 control variable %explang. By default, this variable is set to “automatic” causing the current expression language to be determined by examining the extension of the file name defined by the current scope. When this file name ends in the characters “.c”, the current expression language is C. When the extension is “.f” or “.for”, the current expression language is FORTRAN. If desired, the value of this variable may be explicitly set to “C” or “FORTRAN” with the set command, allowing expression evaluation in either of these languages regardless of the current scope. Default Expression Language When the value of %explang is set to “automatic” and it is impossible to determine the appropriate language from the current scope, expressions will be evaluated in the language defined by the Fx3 control variable %deflang. By default, this variable is set to “C” however it may be set to “FORTRAN” using the change command. Supported Language Operators When specifying expressions as arguments to debugger commands, operands may be combined using the operators of the current expression language. Type conversion between operands and operator precedence follow the conventions of the expression language. Note that parentheses may be used to force a specific order of evaluation regardless of the current expression language. FORTRAN Operators The following table lists the supported FORTRAN operators:
FORTRAN operators Binary .NEQV., .EQV., .OR., .AND., .GT.1, .GE.1, .NE.1,
.EQ.1, .LE. 1, .LT. 1, -,+,*,/,**,= Unary +,-,.NOT.
1. The operators .GT., .GE., .NE., .EQ., .LE., and .LT. may also be specified by >, >=,
<>, ==, <=, and < respectively.
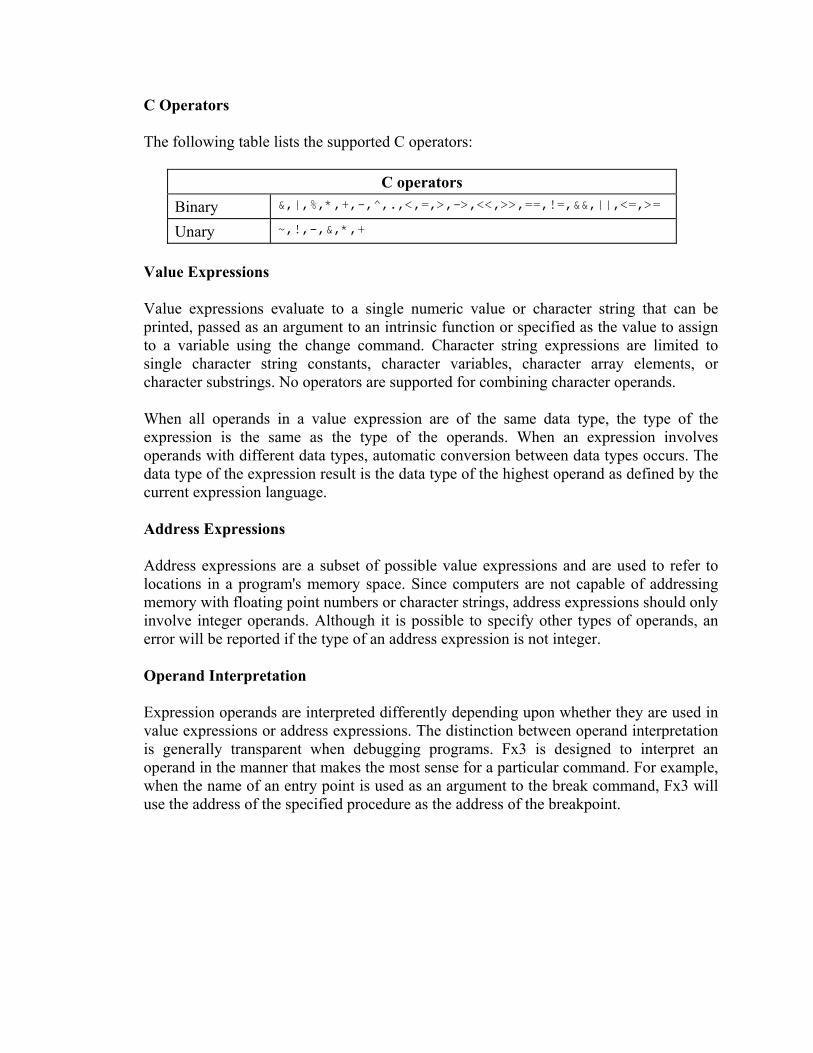
C Operators The following table lists the supported C operators:
C operators Binary &,|,%,*,+,-,^,.,<,=,>,->,<<,>>,==,!=,&&,||,<=,>=
Unary ~,!,-,&,*,+
Value Expressions Value expressions evaluate to a single numeric value or character string that can be printed, passed as an argument to an intrinsic function or specified as the value to assign to a variable using the change command. Character string expressions are limited to single character string constants, character variables, character array elements, or character substrings. No operators are supported for combining character operands. When all operands in a value expression are of the same data type, the type of the expression is the same as the type of the operands. When an expression involves operands with different data types, automatic conversion between data types occurs. The data type of the expression result is the data type of the highest operand as defined by the current expression language. Address Expressions Address expressions are a subset of possible value expressions and are used to refer to locations in a program's memory space. Since computers are not capable of addressing memory with floating point numbers or character strings, address expressions should only involve integer operands. Although it is possible to specify other types of operands, an error will be reported if the type of an address expression is not integer. Operand Interpretation Expression operands are interpreted differently depending upon whether they are used in value expressions or address expressions. The distinction between operand interpretation is generally transparent when debugging programs. Fx3 is designed to interpret an operand in the manner that makes the most sense for a particular command. For example, when the name of an entry point is used as an argument to the break command, Fx3 will use the address of the specified procedure as the address of the breakpoint.
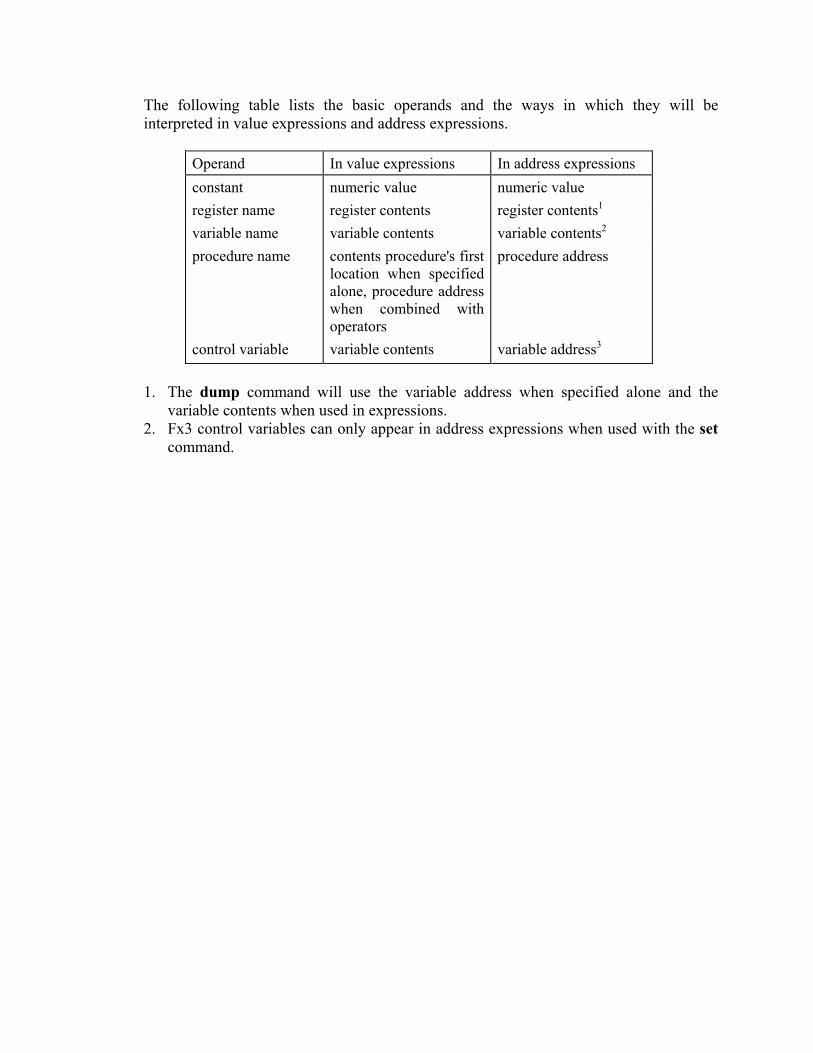
The following table lists the basic operands and the ways in which they will be interpreted in value expressions and address expressions.
Operand In value expressions In address expressions constant numeric value numeric value register name register contents register contents1 variable name variable contents variable contents2 procedure name contents procedure's first
location when specified alone, procedure address when combined with operators
procedure address
control variable variable contents variable address3 1. The dump command will use the variable address when specified alone and the
variable contents when used in expressions. 2. Fx3 control variables can only appear in address expressions when used with the set
command.

1
Command Reference This section describes each debugger command. In order to assist in finding a particular command, the commands are presented in alphabetical order and the name of each command is followed by a short description of its purpose.
addpath Specifying source file search paths
Description:
The addpath command augments the list of directories where the debugger will look for source files. By default, the debugger looks in the current directory and in any directories specified in the debugged program's debug information.
Usage:
addpath [-p process_list] source path
where –p process_list is a comma separated list of process ids. Specifying the word “all” as the process list will apply the command to all processes currently under debugger control. If a process_list is not specified, the current active process is used by default.
source path is a full or partially qualified directory specification given in the host operating system's path specification format.
Default alias:
directory
Example:
The following command adds the path /home/user/lib_source to the list of source file search paths used for all processes:
addpath /home/user/lib_source
The following command adds the relative path ../math/trig_source to the list of source file search paths used for the process p12:
addpath -p p12 ../math/trig_source
Notes:
Path specifications are given in the syntax of the host operating system. For example, on Linux and other POSIX based operating systems directories are separated by the '/' character. Windows directories are separated by the '\' character.
Related commands:
deletepath
addressof Displaying the address of a symbol
Description:
The addressof command displays the address of a symbol (or expression whose result evaluates to an address) in the active or specified process.
Usage:
addressof [ -p process_list ] [ -x ] [ -r ] [ -e ] expression
where –p process_list is a comma separated list of process ids. Specifying the word “all” as the process list will apply the command to all processes currently under debugger control. If a process_list is not specified, the current active process is used by default.
–x specifies that the resulting address is to be displayed in hexadecimal instead of decimal format.
-r specifies that symbols residing in registers display the system dependent name of their assigned register.
-e specifies that no further options are present and all following characters are part of the expression to be evaluated.
expression is a symbol name or expression to be evaluated given in the current source language’s expression syntax.
Default alias:
none
Example:
The following command displays the address of the variable cmd_cnt in hexadecimal format:
addressof –x cmd_cnt
The following command displays the address of the fifth element of a FORTRAN array named result_list:
addressof result_list(5)
Related commands:
dump, print, printarray, typeof
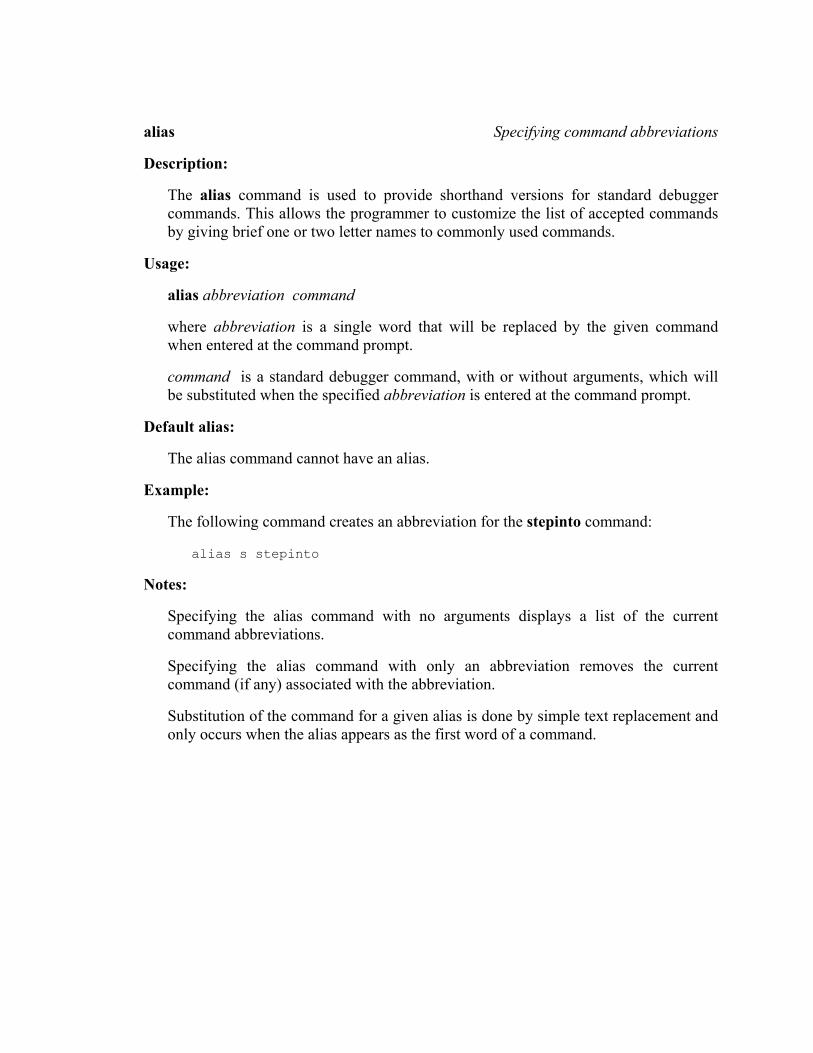
alias Specifying command abbreviations
Description:
The alias command is used to provide shorthand versions for standard debugger commands. This allows the programmer to customize the list of accepted commands by giving brief one or two letter names to commonly used commands.
Usage:
alias abbreviation command
where abbreviation is a single word that will be replaced by the given command when entered at the command prompt.
command is a standard debugger command, with or without arguments, which will be substituted when the specified abbreviation is entered at the command prompt.
Default alias:
The alias command cannot have an alias.
Example:
The following command creates an abbreviation for the stepinto command:
alias s stepinto
Notes:
Specifying the alias command with no arguments displays a list of the current command abbreviations.
Specifying the alias command with only an abbreviation removes the current command (if any) associated with the abbreviation.
Substitution of the command for a given alias is done by simple text replacement and only occurs when the alias appears as the first word of a command.
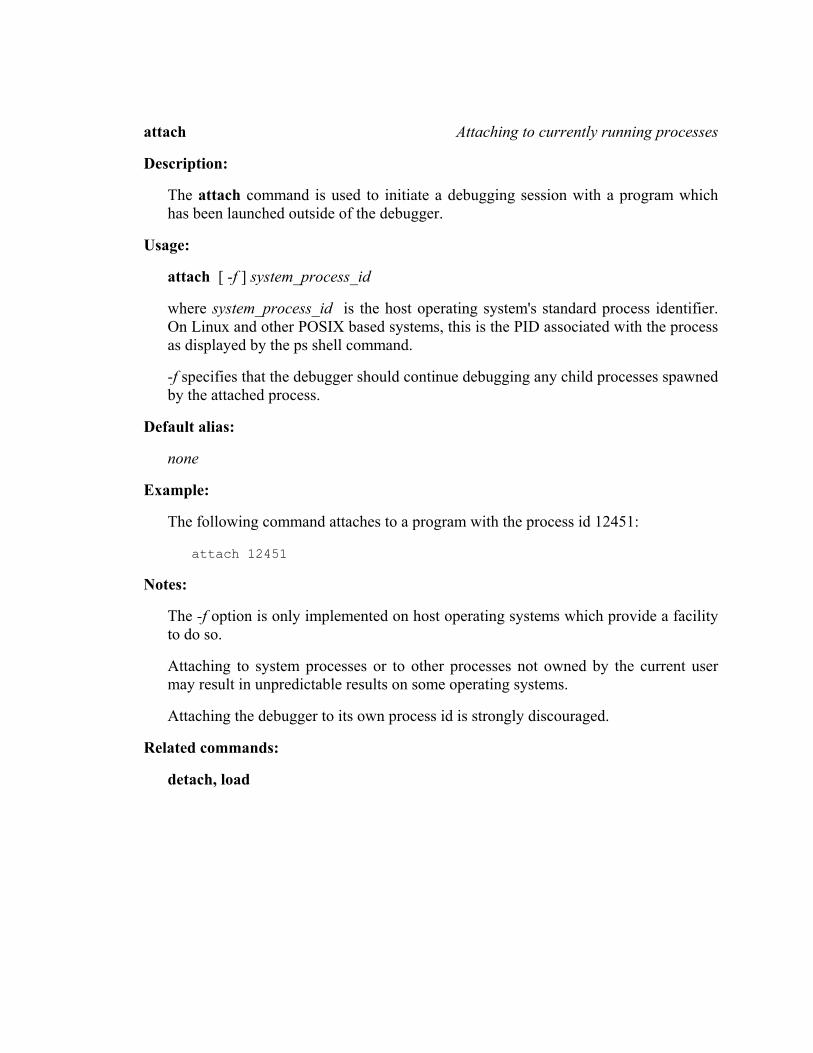
attach Attaching to currently running processes
Description:
The attach command is used to initiate a debugging session with a program which has been launched outside of the debugger.
Usage:
attach [ -f ] system_process_id
where system_process_id is the host operating system's standard process identifier. On Linux and other POSIX based systems, this is the PID associated with the process as displayed by the ps shell command.
-f specifies that the debugger should continue debugging any child processes spawned by the attached process.
Default alias:
none
Example:
The following command attaches to a program with the process id 12451:
attach 12451
Notes:
The -f option is only implemented on host operating systems which provide a facility to do so.
Attaching to system processes or to other processes not owned by the current user may result in unpredictable results on some operating systems.
Attaching the debugger to its own process id is strongly discouraged.
Related commands:
detach, load
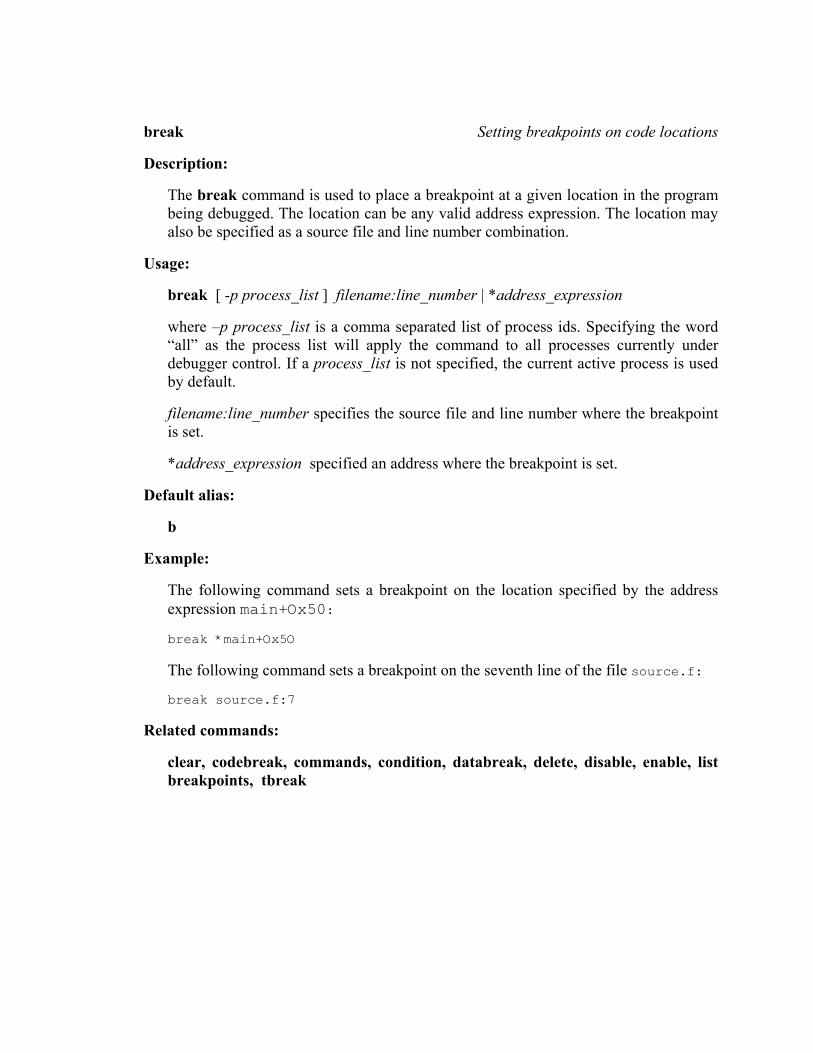
break Setting breakpoints on code locations
Description:
The break command is used to place a breakpoint at a given location in the program being debugged. The location can be any valid address expression. The location may also be specified as a source file and line number combination.
Usage:
break [ -p process_list ] filename:line_number | *address_expression
where –p process_list is a comma separated list of process ids. Specifying the word “all” as the process list will apply the command to all processes currently under debugger control. If a process_list is not specified, the current active process is used by default.
filename:line_number specifies the source file and line number where the breakpoint is set.
*address_expression specified an address where the breakpoint is set.
Default alias:
b
Example:
The following command sets a breakpoint on the location specified by the address expression main+Ox50:
break *main+Ox5O
The following command sets a breakpoint on the seventh line of the file source.f:
break source.f:7
Related commands:
clear, codebreak, commands, condition, databreak, delete, disable, enable, list breakpoints, tbreak
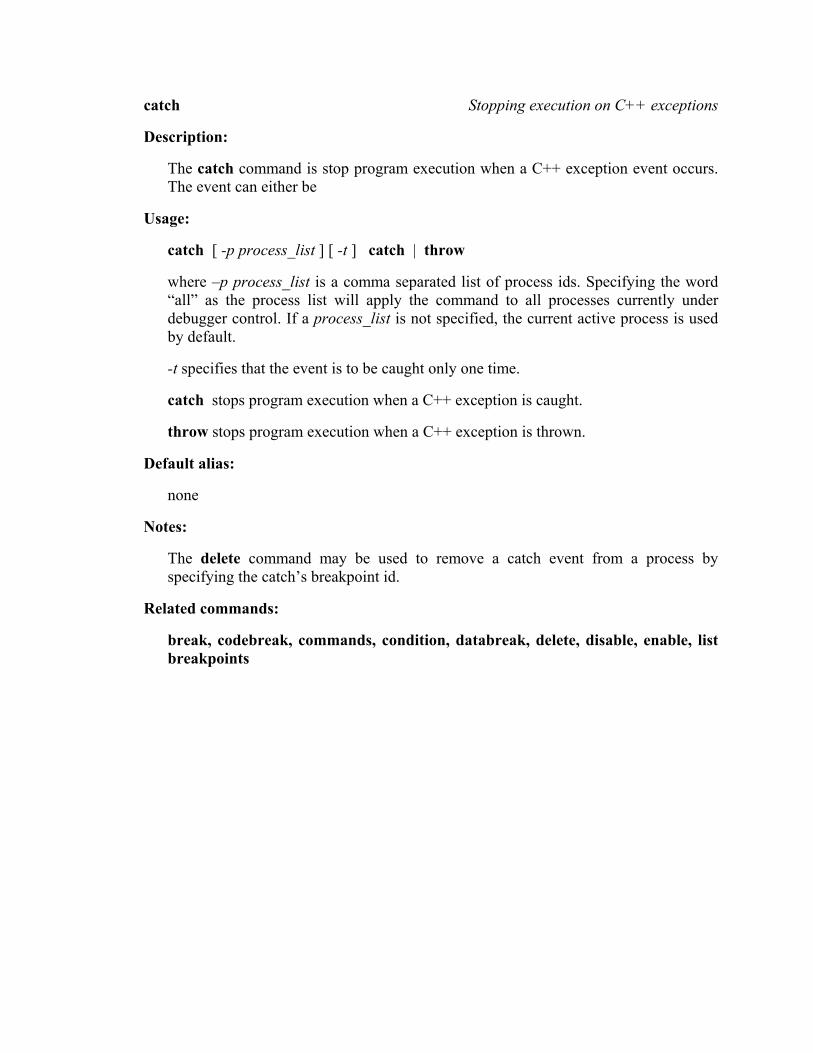
catch Stopping execution on C++ exceptions
Description:
The catch command is stop program execution when a C++ exception event occurs. The event can either be
Usage:
catch [ -p process_list ] [ -t ] catch | throw
where –p process_list is a comma separated list of process ids. Specifying the word “all” as the process list will apply the command to all processes currently under debugger control. If a process_list is not specified, the current active process is used by default.
-t specifies that the event is to be caught only one time.
catch stops program execution when a C++ exception is caught.
throw stops program execution when a C++ exception is thrown.
Default alias:
none
Notes:
The delete command may be used to remove a catch event from a process by specifying the catch’s breakpoint id.
Related commands:
break, codebreak, commands, condition, databreak, delete, disable, enable, list breakpoints
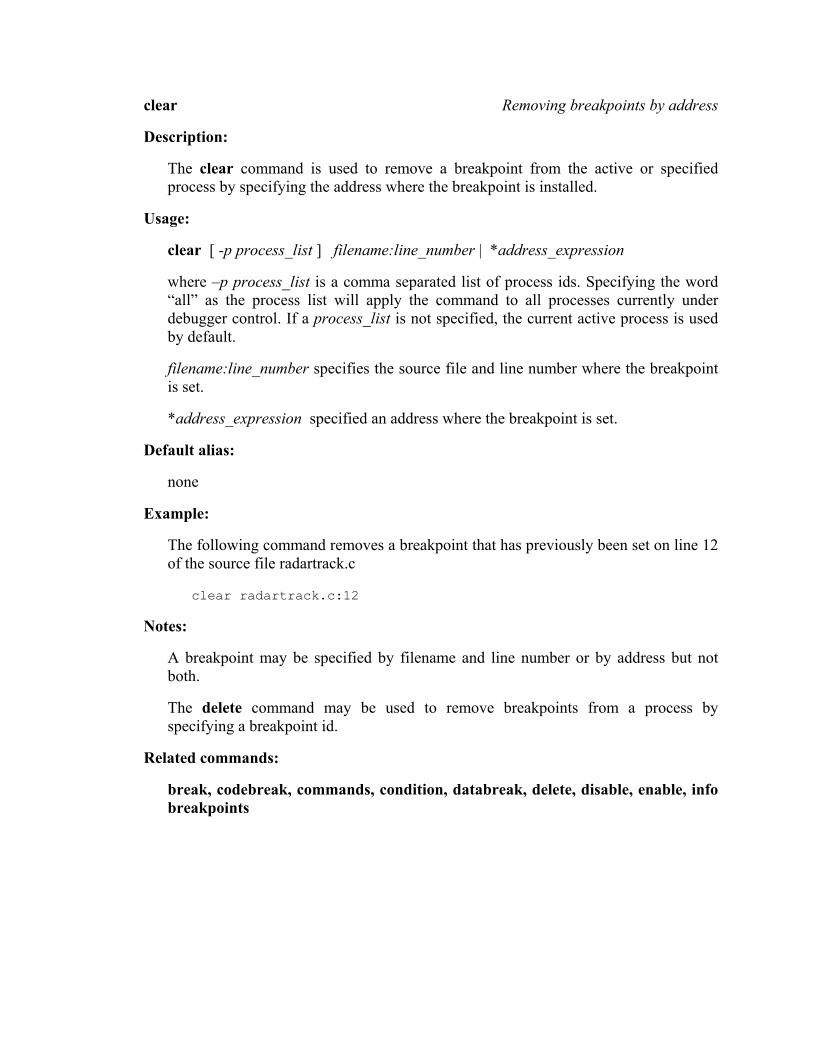
clear Removing breakpoints by address
Description:
The clear command is used to remove a breakpoint from the active or specified process by specifying the address where the breakpoint is installed.
Usage:
clear [ -p process_list ] filename:line_number | *address_expression
where –p process_list is a comma separated list of process ids. Specifying the word “all” as the process list will apply the command to all processes currently under debugger control. If a process_list is not specified, the current active process is used by default.
filename:line_number specifies the source file and line number where the breakpoint is set.
*address_expression specified an address where the breakpoint is set.
Default alias:
none
Example:
The following command removes a breakpoint that has previously been set on line 12 of the source file radartrack.c
clear radartrack.c:12
Notes:
A breakpoint may be specified by filename and line number or by address but not both.
The delete command may be used to remove breakpoints from a process by specifying a breakpoint id.
Related commands:
break, codebreak, commands, condition, databreak, delete, disable, enable, info breakpoints
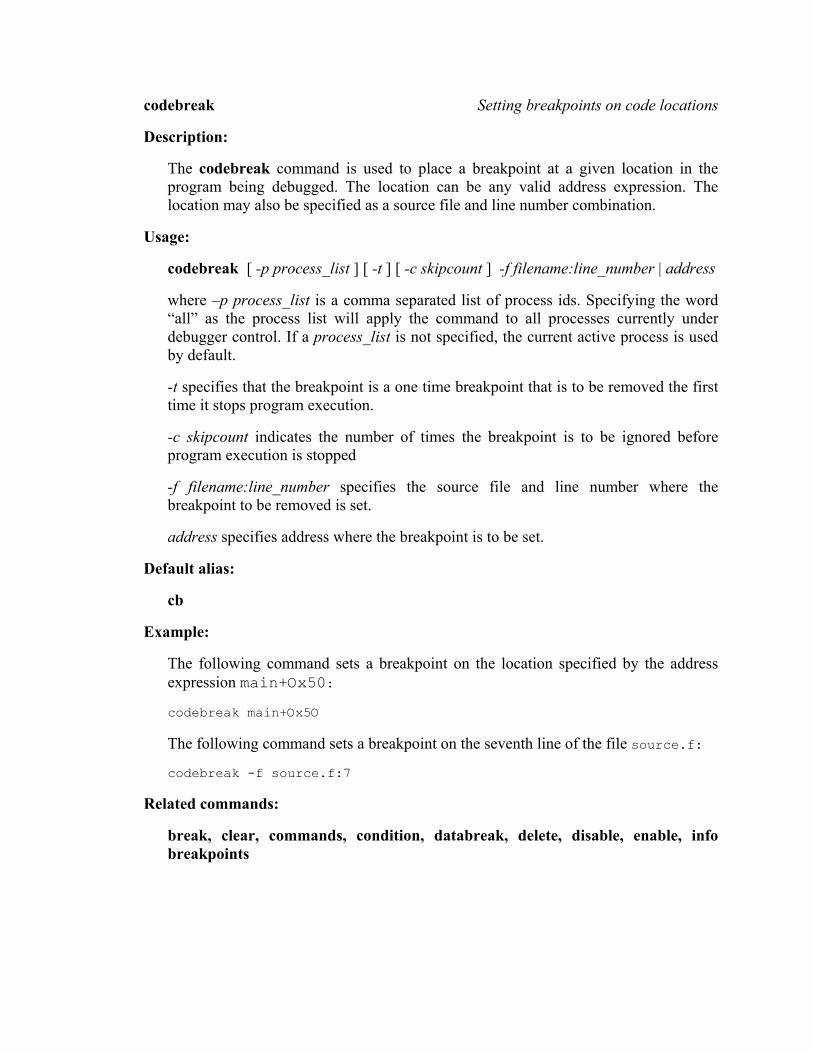
codebreak Setting breakpoints on code locations
Description:
The codebreak command is used to place a breakpoint at a given location in the program being debugged. The location can be any valid address expression. The location may also be specified as a source file and line number combination.
Usage:
codebreak [ -p process_list ] [ -t ] [ -c skipcount ] -f filename:line_number | address
where –p process_list is a comma separated list of process ids. Specifying the word “all” as the process list will apply the command to all processes currently under debugger control. If a process_list is not specified, the current active process is used by default.
-t specifies that the breakpoint is a one time breakpoint that is to be removed the first time it stops program execution.
-c skipcount indicates the number of times the breakpoint is to be ignored before program execution is stopped
-f filename:line_number specifies the source file and line number where the breakpoint to be removed is set.
address specifies address where the breakpoint is to be set.
Default alias:
cb
Example:
The following command sets a breakpoint on the location specified by the address expression main+Ox50:
codebreak main+Ox5O
The following command sets a breakpoint on the seventh line of the file source.f:
codebreak -f source.f:7
Related commands:
break, clear, commands, condition, databreak, delete, disable, enable, info breakpoints
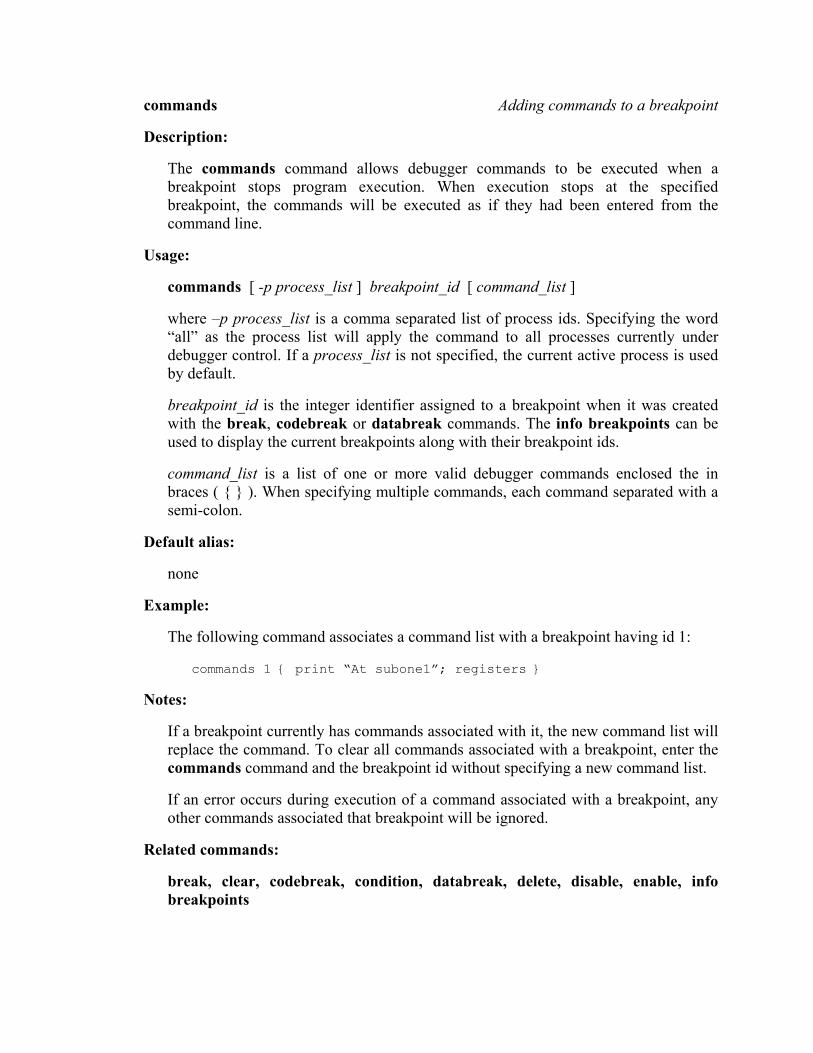
commands Adding commands to a breakpoint
Description:
The commands command allows debugger commands to be executed when a breakpoint stops program execution. When execution stops at the specified breakpoint, the commands will be executed as if they had been entered from the command line.
Usage:
commands [ -p process_list ] breakpoint_id [ command_list ]
where –p process_list is a comma separated list of process ids. Specifying the word “all” as the process list will apply the command to all processes currently under debugger control. If a process_list is not specified, the current active process is used by default.
breakpoint_id is the integer identifier assigned to a breakpoint when it was created with the break, codebreak or databreak commands. The info breakpoints can be used to display the current breakpoints along with their breakpoint ids.
command_list is a list of one or more valid debugger commands enclosed the in braces ( { } ). When specifying multiple commands, each command separated with a semi-colon.
Default alias:
none
Example:
The following command associates a command list with a breakpoint having id 1:
commands 1 { print “At subone1”; registers }
Notes:
If a breakpoint currently has commands associated with it, the new command list will replace the command. To clear all commands associated with a breakpoint, enter the commands command and the breakpoint id without specifying a new command list.
If an error occurs during execution of a command associated with a breakpoint, any other commands associated that breakpoint will be ignored.
Related commands:
break, clear, codebreak, condition, databreak, delete, disable, enable, info breakpoints
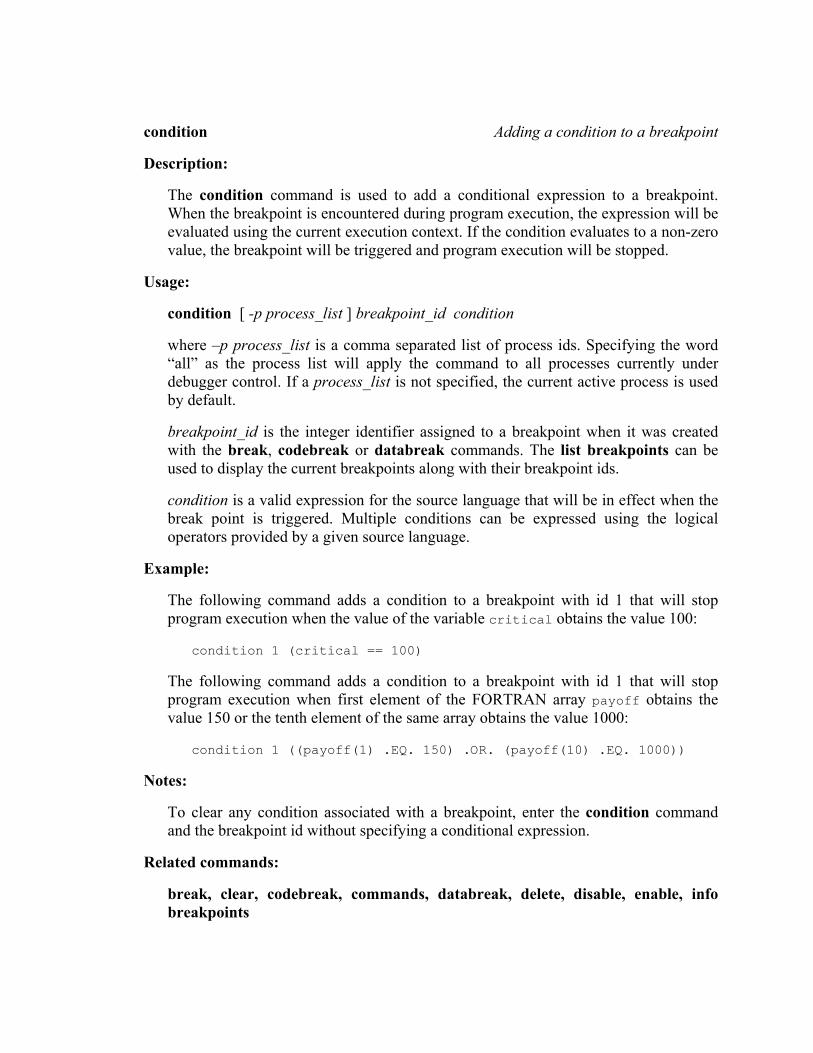
condition Adding a condition to a breakpoint
Description:
The condition command is used to add a conditional expression to a breakpoint. When the breakpoint is encountered during program execution, the expression will be evaluated using the current execution context. If the condition evaluates to a non-zero value, the breakpoint will be triggered and program execution will be stopped.
Usage:
condition [ -p process_list ] breakpoint_id condition
where –p process_list is a comma separated list of process ids. Specifying the word “all” as the process list will apply the command to all processes currently under debugger control. If a process_list is not specified, the current active process is used by default.
breakpoint_id is the integer identifier assigned to a breakpoint when it was created with the break, codebreak or databreak commands. The list breakpoints can be used to display the current breakpoints along with their breakpoint ids.
condition is a valid expression for the source language that will be in effect when the break point is triggered. Multiple conditions can be expressed using the logical operators provided by a given source language.
Example:
The following command adds a condition to a breakpoint with id 1 that will stop program execution when the value of the variable critical obtains the value 100:
condition 1 (critical == 100)
The following command adds a condition to a breakpoint with id 1 that will stop program execution when first element of the FORTRAN array payoff obtains the value 150 or the tenth element of the same array obtains the value 1000:
condition 1 ((payoff(1) .EQ. 150) .OR. (payoff(10) .EQ. 1000))
Notes:
To clear any condition associated with a breakpoint, enter the condition command and the breakpoint id without specifying a conditional expression.
Related commands:
break, clear, codebreak, commands, databreak, delete, disable, enable, info breakpoints
continue Resuming program execution
Description:
The continue command resumes execution of the program being debugged. Execution continues until the temporary breakpoint is encountered, a breakpoint is encountered, an error occurs, or the program runs to completion.
Usage:
continue [ -p process_list ] [ ignore_count]
where –p process_list is a comma separated list of process ids. Specifying the word “all” as the process list will apply the command to all processes currently under debugger control. If a process_list is not specified, the current active process is used by default.
ignore_count specifies the number of additional times to ignore a breakpoint on the line where a program is currently stopped. If the program is not currently stopped on a breakpoint, this argument to the continue command has no effect
Default alias:
c
Related commands:
istepinto, istepover, return, stepinto, stepover, until
core Debugging using a core file
Description:
The core command is used to load a program and an associated core file into the debugger to perform post crash debugging.
Usage:
core program_name [ corefile_name ]
where program_name is the name of an executable program.
corefile_name is the name of a core file produced from a previous run of the specified program. If corefile_name is not specified, the debugger looks for a file name “core” in the current directory and attempts to use it if one is located.
Example:
The following command starts a post crash session on a program named crash.out using the a core file named crash.core:
core crash.out crash.core
Notes:
Unpredictable results will occur if the specified core file does was not generated by the specified program.
Generation of core file is an operating system dependent operation, so the core command may not be available on all implementation of the debugger.
Related commands:
load
cycle Skipping commands in a loop
Description:
The cycle command is used to skip over commands in a command loop and re-evaluate the loop condition immediately.
Usage:
cycle
Example:
The following command sequence will print out every odd indexed element of the C array values:
set @loop = 0
while( @loop < 10 ) { \
set @loop = @loop+1; \
if ( (@loop % 2) == 0) cycle; \
print values[@loop]; }
Notes:
In the above example, @loop is a debugger convenience variable.
Related commands:
if, while
databreak Stopping execution when data value changes
Description:
The databreak command is used to install a hardware breakpoint on the address of a program variable or memory location. After the breakpoint has been installed, the program will stop the next time the variable’s value is modified or, optionally, accessed.
Usage:
databreak [ -p process_list ] [ -t ] [ -r ] [ -c skipcount ] address_expression
where –p process_list is a comma separated list of process ids. Specifying the word “all” as the process list will apply the command to all processes currently under debugger control. If a process_list is not specified, the current active process is used by default.
-t specifies that the breakpoint is a one time breakpoint that is to be removed the first time it stops program execution.
-r specifies that the breakpoint is also activated when the contents of the address are read.
-c skipcount indicates the number of times the breakpoint is to be ignored before program execution is stopped
address_expression specifies address where the breakpoint is to set. The address expression is evaluated using current source language and process scope at the time the breakpoint is set.
Default alias:
db
Example:
The following command sets a breakpoint that will stop program execution when the value of the variable constant_temp is changed:
databreak constant_temp
Notes:
The databreak command is only available on systems that provide support for hardware breakpoints. The number of breakpoints that can be set with the databreak command varies from system to system.

Related commands:
break, clear, codebreak, commands, condition, delete, disable, enable, info breakpoints
delete Removing breakpoints by breakpoint id
Description:
The delete command is used to remove one or more breakpoints from the active or specified process.
Usage:
delete [ -p process_list ] breakpoint_id | all
where –p process_list is a comma separated list of process ids. Specifying the word “all” as the process list will apply the command to all processes currently under debugger control. If a process_list is not specified, the current active process is used by default.
breakpoint_id is the integer identifier assigned to a breakpoint when it was created with the break, codebreak or databreak commands. The info breakpoints can be used to display the current breakpoints and their breakpoint_id.
all specifies that all current breakpoints are to be deleted from the specified process.
Default alias:
d
Example:
The following command deletes a breakpoint that was previously assigned the breakpoint id 10:
delete l0
Notes:
The clear command may be used to a remove breakpoint from a process by specifying a breakpoint address.
Related commands:
break, clear, commands, condition, codebreak, databreak, disable, enable, info breakpoints
deletepath Removing source file search paths
Description:
The deletepath command is used to remove a source file search path from the active or specified process.
Usage:
deletepath [ -p process_list ] -all | source path
where –p process_list is a comma separated list of process ids. Specifying the word “all” as the process list will apply the command to all processes currently under debugger control. If a process_list is not specified, the current active process is used by default.
-all specifies that all source paths should be removed.
source path is a full or partially qualified directory specification given in the host operating system's path specification format.
Related commands:
addpath
detach Stopping a debug session on an attached process
Description:
The detach command is used to terminate a debugging session on one or more processes which were loaded with the attach command.
Usage:
detach [ -p process_list ]
where –p process_list is a comma separated list of process ids. Specifying the word “all” as the process list will apply the command to all processes currently under debugger control. If a process_list is not specified, the current active process is used by default.
Example:
The following command detaches from a process with the process identifier p1:
detach –p p1
Notes:
Attaching to and detaching from running processes is an operating system specific feature and may not be present in all versions of the debugger.
Detaching from a process not loaded with the attach command may have unpredictable results.
Related commands:
attach
disable Deactivating program breakpoints or auto-display expressions
Description:
The disable command is used to deactivate a breakpoint or auto-display expression without removing it from the list of current breakpoints or auto-display expressions.
Usage:
disable [ -p process_list ] breakpoint_id
disable display [ -p process_list ] display_id
where –p process_list is a comma separated list of process ids. Specifying the word “all” as the process list will apply the command to all processes currently under debugger control. If a process_list is not specified, the current active process is used by default.
breakpoint_id is the integer identifier assigned to a breakpoint when it was created with the break, codebreak or databreak commands. The info breakpoints can be used to display the current breakpoints and their breakpoint_id.
display_id is the integer identifier assigned to an auto-display expression when it was created with the display command. The info displays command can be used to display the current auto-display expressions and their display_id.
Example:
The following command disables a breakpoint with the breakpoint id 12 in two processes with the process identifiers p1 and p7:
disable –p p1,p7 12
Related commands:
break, codebreak, commands, condition, databreak, display, enable, info breakpoints, info displays
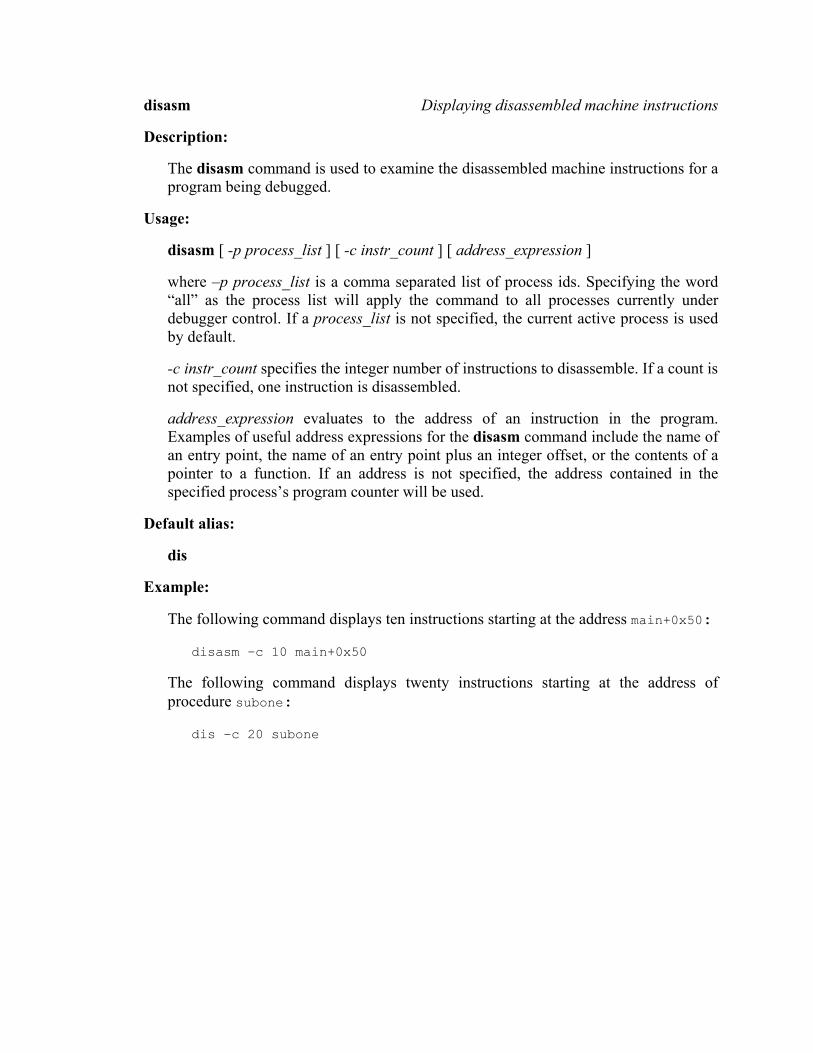
disasm Displaying disassembled machine instructions
Description:
The disasm command is used to examine the disassembled machine instructions for a program being debugged.
Usage:
disasm [ -p process_list ] [ -c instr_count ] [ address_expression ]
where –p process_list is a comma separated list of process ids. Specifying the word “all” as the process list will apply the command to all processes currently under debugger control. If a process_list is not specified, the current active process is used by default.
-c instr_count specifies the integer number of instructions to disassemble. If a count is not specified, one instruction is disassembled.
address_expression evaluates to the address of an instruction in the program. Examples of useful address expressions for the disasm command include the name of an entry point, the name of an entry point plus an integer offset, or the contents of a pointer to a function. If an address is not specified, the address contained in the specified process’s program counter will be used.
Default alias:
dis
Example:
The following command displays ten instructions starting at the address main+0x50:
disasm –c 10 main+0x50
The following command displays twenty instructions starting at the address of procedure subone:
dis –c 20 subone
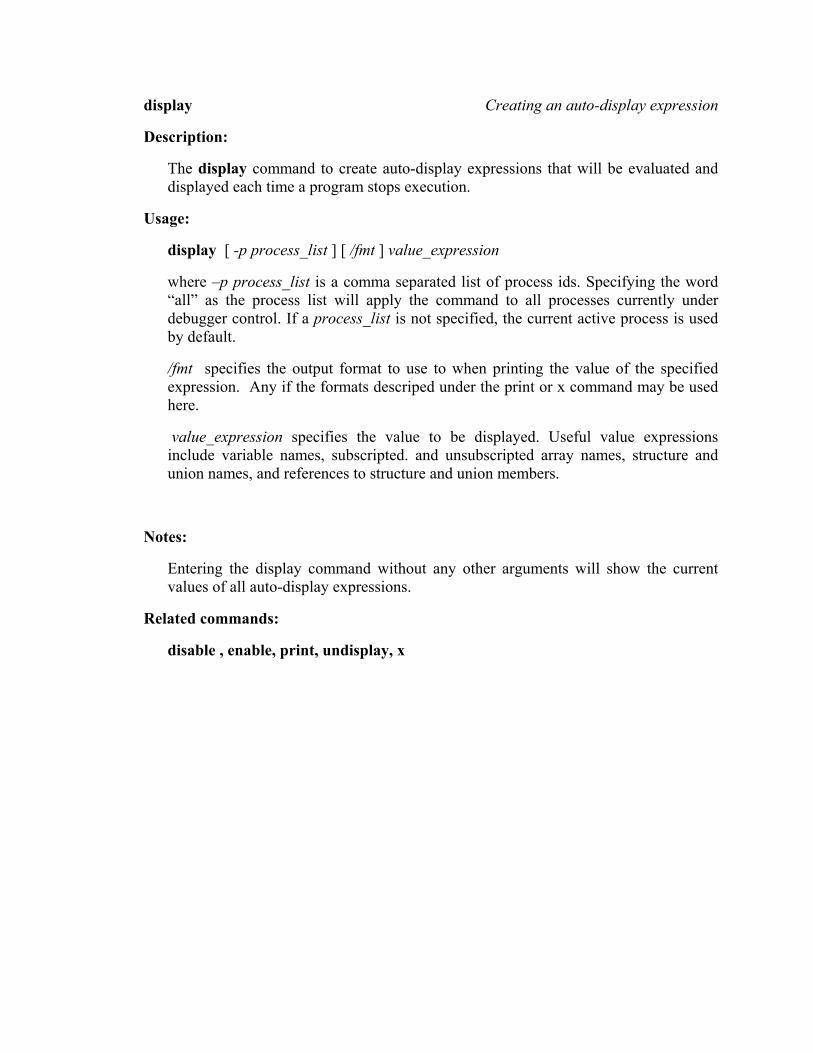
display Creating an auto-display expression
Description:
The display command to create auto-display expressions that will be evaluated and displayed each time a program stops execution.
Usage:
display [ -p process_list ] [ /fmt ] value_expression
where –p process_list is a comma separated list of process ids. Specifying the word “all” as the process list will apply the command to all processes currently under debugger control. If a process_list is not specified, the current active process is used by default.
/fmt specifies the output format to use to when printing the value of the specified expression. Any if the formats descriped under the print or x command may be used here.
value_expression specifies the value to be displayed. Useful value expressions include variable names, subscripted. and unsubscripted array names, structure and union names, and references to structure and union members.
Notes:
Entering the display command without any other arguments will show the current values of all auto-display expressions.
Related commands:
disable , enable, print, undisplay, x
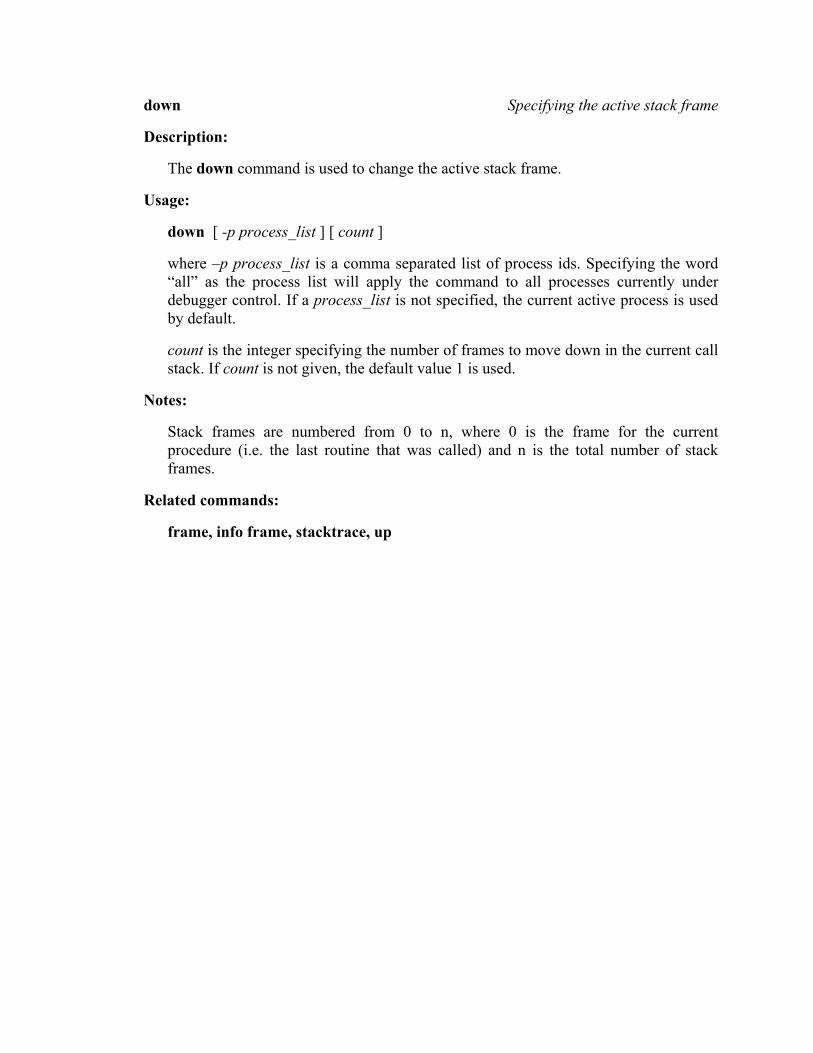
down Specifying the active stack frame
Description:
The down command is used to change the active stack frame.
Usage:
down [ -p process_list ] [ count ]
where –p process_list is a comma separated list of process ids. Specifying the word “all” as the process list will apply the command to all processes currently under debugger control. If a process_list is not specified, the current active process is used by default.
count is the integer specifying the number of frames to move down in the current call stack. If count is not given, the default value 1 is used.
Notes:
Stack frames are numbered from 0 to n, where 0 is the frame for the current procedure (i.e. the last routine that was called) and n is the total number of stack frames.
Related commands:
frame, info frame, stacktrace, up
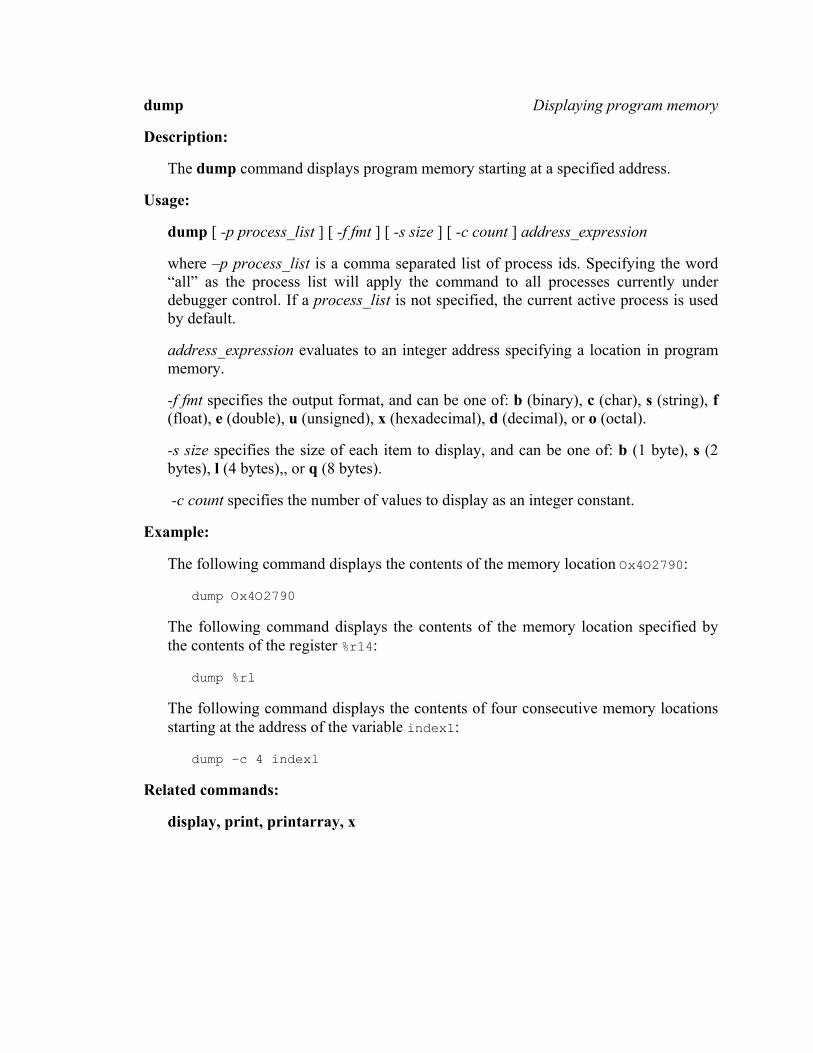
dump Displaying program memory
Description:
The dump command displays program memory starting at a specified address.
Usage:
dump [ -p process_list ] [ -f fmt ] [ -s size ] [ -c count ] address_expression
where –p process_list is a comma separated list of process ids. Specifying the word “all” as the process list will apply the command to all processes currently under debugger control. If a process_list is not specified, the current active process is used by default.
address_expression evaluates to an integer address specifying a location in program memory.
-f fmt specifies the output format, and can be one of: b (binary), c (char), s (string), f (float), e (double), u (unsigned), x (hexadecimal), d (decimal), or o (octal).
-s size specifies the size of each item to display, and can be one of: b (1 byte), s (2 bytes), l (4 bytes),, or q (8 bytes).
-c count specifies the number of values to display as an integer constant.
Example:
The following command displays the contents of the memory location Ox4O2790:
dump Ox4O2790
The following command displays the contents of the memory location specified by the contents of the register %r14:
dump %rl
The following command displays the contents of four consecutive memory locations starting at the address of the variable index1:
dump –c 4 indexl
Related commands:
display, print, printarray, x
enable Activating program breakpoints or auto-display expressions
Description:
The enable command is used to activate a breakpoint or auto-display expression which as been deactivated with the disable command.
Usage:
enable [ -p process_list ] breakpoint_id
enable display [ -p process_list ] display_id
where –p process_list is a comma separated list of process ids. Specifying the word “all” as the process list will apply the command to all processes currently under debugger control. If a process_list is not specified, the current active process is used by default.
breakpoint_id is the integer identifier assigned to a breakpoint when it was created with the break, codebreak or databreak commands. The info breakpoints can be used to display the current breakpoints and their breakpoint_ids.
display_id is the integer identifier assigned to an auto-display expression when it was created with the display command. The info displays command can be used to display the current auto-display expressions and their display_id.
Example:
The following command disables a breakpoint with the break point id 12 in two processes with the process ids p1 and p7:
enable –p p1,p7 12
Related commands:
break, clear, codebreak, commands, condition, databreak, delete, disable, display, list breakpoints, info displays
exit Terminating execution of a command loop
Description:
The exit command is used to terminate execution of a loop of debugger commands.
Usage:
exit
Example:
The following command sequence will print out elements 1 to 5 the C array values:
set @loop = 0
while( 1 ) { \
set @loop = @loop+1; \
if ( @loop == 6) exit; \
print values[@loop]; }
Notes:
In the above example, @loop is a debugger convenience variable.
Related commands:
cycle, if, while
filestatus Displaying FORTRAN I/O unit information
Description:
The filestatus command is used to display information about all connected and preconnected FORTRAN units. For units explicitly connected with a FORTRAN OPEN statement, this command displays the unit number, file name, the state of the ACCESS=, FORM=, ACTION=, STATUS= I/O control specifiers used to connect the unit, and the current record number. For preconnected units, this command displays the unit number, and the state of the ACCESS=, FORM=, ACTION= I/O control specifiers.
Usage:
filestatus [ -p process_list ] [ -u unit_number ]
where –p process_list is a comma separated list of process ids. Specifying the word “all” as the process list will apply the command to all processes currently under debugger control. If a process_list is not specified, the current active process is used by default.
–u unit_number is an integer used to limit the information displayed to a particular FORTRAN unit number. If a unit number is not specified, information is displayed for all connected units.
Notes:
This command will only work for programs that use the Absoft FORTRAN runtime library.
frame Specifying current stack frame
Description:
The frame command is used to specify the current stack frame for displaying variables and arguments.
Usage:
frame [ -p process_list ] [ frame_number ]
where –p process_list is a comma separated list of process ids. Specifying the word “all” as the process list will apply the command to all processes currently under debugger control. If a process_list is not specified, the current active process is used by default.
frame_number is a positive integer specifying a frame in the current call stack. If a not specifed, the command will display information about the currently active stack frame.
Notes:
Stack frames are numbered from 0 to n, where 0 is the frame for the current procedure (i.e. the last routine that was called) and n is the total number of stack frames.
Related commands:
down, stacktrace, up
handle Controlling signal actions
Description:
The handle command controls the actions taken when a signal is presented to a process during a debugging session. It can also be used to send a signal to a process or list of processes.
Usage:
handle [ -p process_list ] signal [ pass | nopass ] [ stop | nostop ]
where –p process_list is a comma separated list of process ids. Specifying the word “all” as the process list will apply the command to all processes currently under debugger control. If a process_list is not specified, the current active process is used by default.
signal is the positive integer that represents the signal you wish to control. Specifying only a signal number will cause that signal to be presented to your program the next time execution is resumed. You can remove any pending signal by specifying zero instead of a signal number.
pass | nopass indicates whether or not a process should be allowed to see a particular signal. Specify pass if the signal should be passed to the process or nopass to prevent the process from receiving the signal.
stop | nostop indicates whether or not a signal should stop execution of a process. Specify stop if execution of the process should stop when the signal occurs and nostop if the process should be allowed to continue executing.
Examples:
The following command will prevent the process with process id 4 from seeing future occurrences of the floating point exception signal:
handle –p p4 8 nopass
Related commands:
list signals
if Conditionally executing debugger commands
Description:
The if command is used to conditionally execute debugger commands.
Usage:
if ( condition ) { command_list; }
where condition is a valid expression for the source language that is currently active. Multiple conditions can be expressed using the logical operators provided by a given source language.
command_list is a list of valid debugger commands separated by semi-colons.
Example:
The following command prints the value of the C array values if it’s first element is not zero:
if ( values[0] != 0) { print values; }
Notes:
Related commands:
cycle, exit, while
info Displaying information about the current debugging session
Description:
The info command is used to display information about various aspects of the current debugging session.
Usage:
info subcommand
where subcommand is one of the arguments described below: all-registers - display the contents of all machine registers args – display the names and values of the arguments to the current function breakpoints – display all breakpoints classes – display the names of C++ classes display – display all auto-display expressions float – display the contents of the floating point machine registers frame – display information about the active stack frame functions – display the names of all functions line- display information about the current source line locals – display the names and values of all local variables in the current function modules – display the names of all Fortran90 modules paths – display a list of all source paths known to the debugger proc – display the current process state program – display information about the program being debugged registers – display the general purpose machine registers signals – display the actions associated with for signals source – display information about the current source file sources – display all the source files known to the debugger threads – display a list of threads in the current program types – display the names of user defined types variables – display the names and values of all global and static variables vector – display the contents of the vector machine registers
Notes:
Much of the information available by using the info command can also be displayed in more detail using various list commands described elsewhere.
istepinto Executing single instructions
Description:
The istepinto command executes one or more assembly language instructions, starting with the next instruction to be executed. If one of the instructions to be executed is a call to a procedure, the procedure will be entered.
Usage:
istepinto [ -p process_list ] [ -c count ]
where –p process_list is a comma separated list of process ids. Specifying the word “all” as the process list will apply the command to all processes currently under debugger control. If a process_list is not specified, the current active process is used by default.
-c count is an integer expression that specifies the number of instructions to execute. If count is not specified, one instruction will be executed.
Default Alias:
i,si,stepi
Examples:
The following command executes the next five instructions of the current procedure:
istepinto 5
Related commands:
istepover, stepinto, stepover
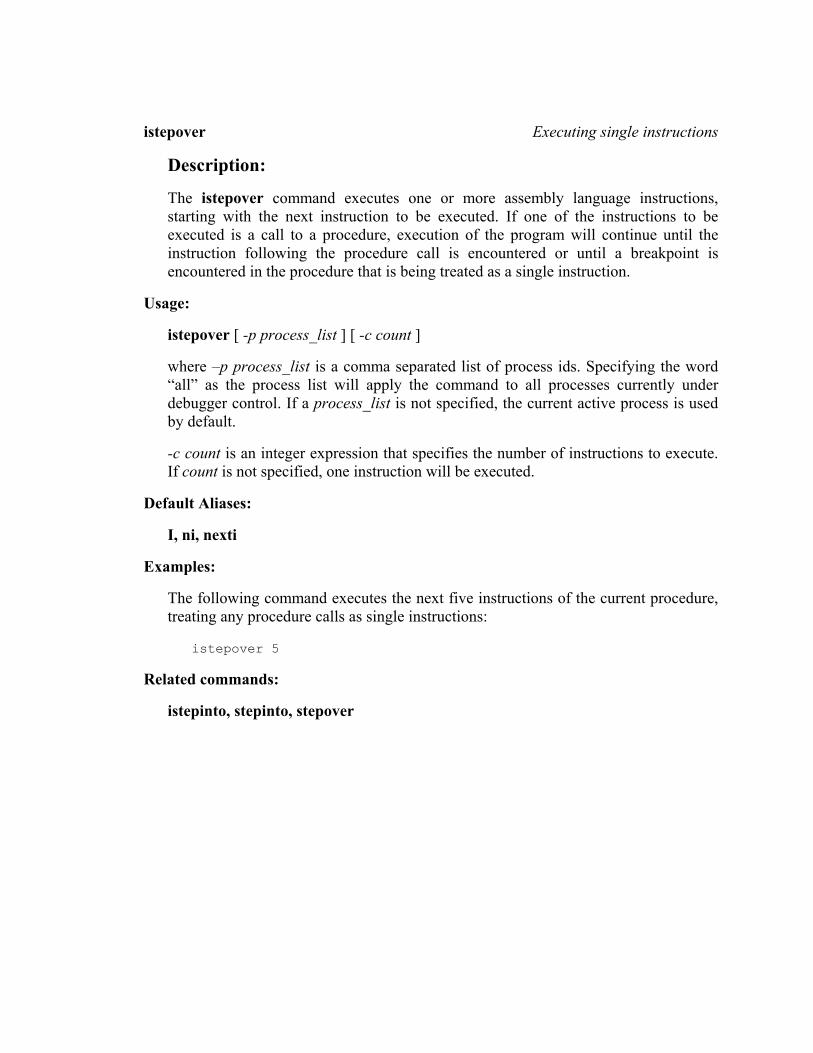
istepover Executing single instructions
Description:
The istepover command executes one or more assembly language instructions, starting with the next instruction to be executed. If one of the instructions to be executed is a call to a procedure, execution of the program will continue until the instruction following the procedure call is encountered or until a breakpoint is encountered in the procedure that is being treated as a single instruction.
Usage:
istepover [ -p process_list ] [ -c count ]
where –p process_list is a comma separated list of process ids. Specifying the word “all” as the process list will apply the command to all processes currently under debugger control. If a process_list is not specified, the current active process is used by default.
-c count is an integer expression that specifies the number of instructions to execute. If count is not specified, one instruction will be executed.
Default Aliases:
I, ni, nexti
Examples:
The following command executes the next five instructions of the current procedure, treating any procedure calls as single instructions:
istepover 5
Related commands:
istepinto, stepinto, stepover
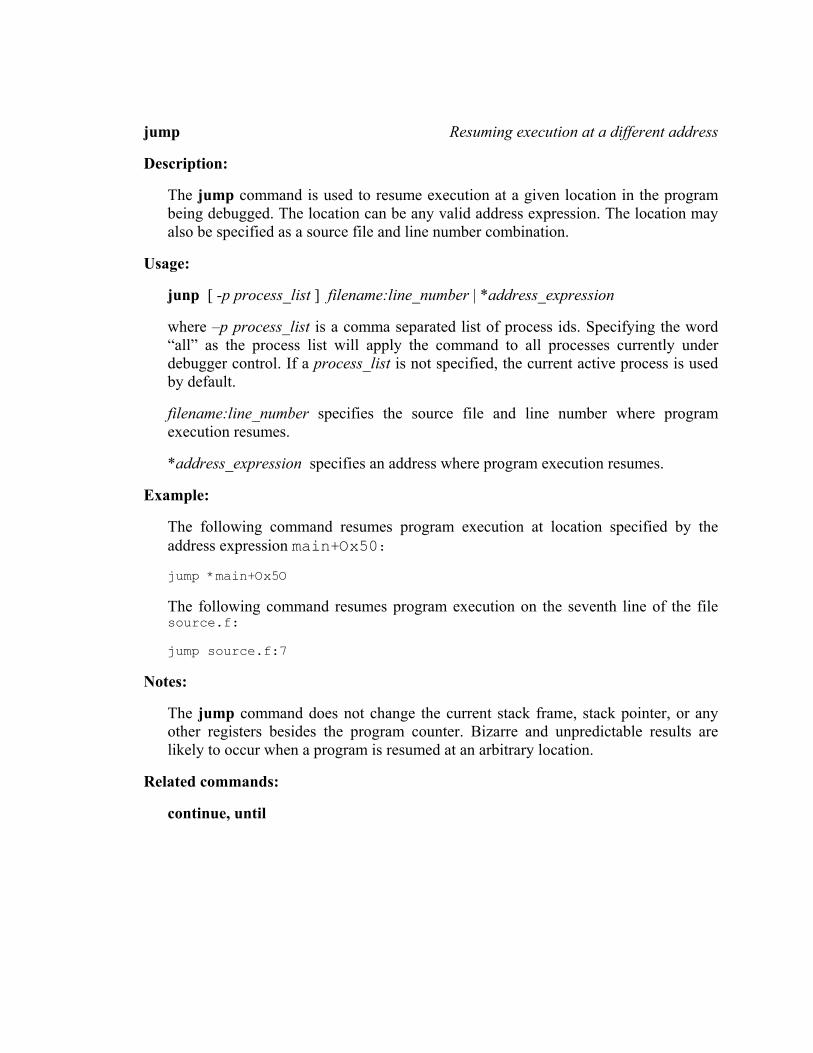
jump Resuming execution at a different address
Description:
The jump command is used to resume execution at a given location in the program being debugged. The location can be any valid address expression. The location may also be specified as a source file and line number combination.
Usage:
junp [ -p process_list ] filename:line_number | *address_expression
where –p process_list is a comma separated list of process ids. Specifying the word “all” as the process list will apply the command to all processes currently under debugger control. If a process_list is not specified, the current active process is used by default.
filename:line_number specifies the source file and line number where program execution resumes.
*address_expression specifies an address where program execution resumes.
Example:
The following command resumes program execution at location specified by the address expression main+Ox50:
jump *main+Ox5O
The following command resumes program execution on the seventh line of the file source.f:
jump source.f:7
Notes:
The jump command does not change the current stack frame, stack pointer, or any other registers besides the program counter. Bizarre and unpredictable results are likely to occur when a program is resumed at an arbitrary location.
Related commands:
continue, until
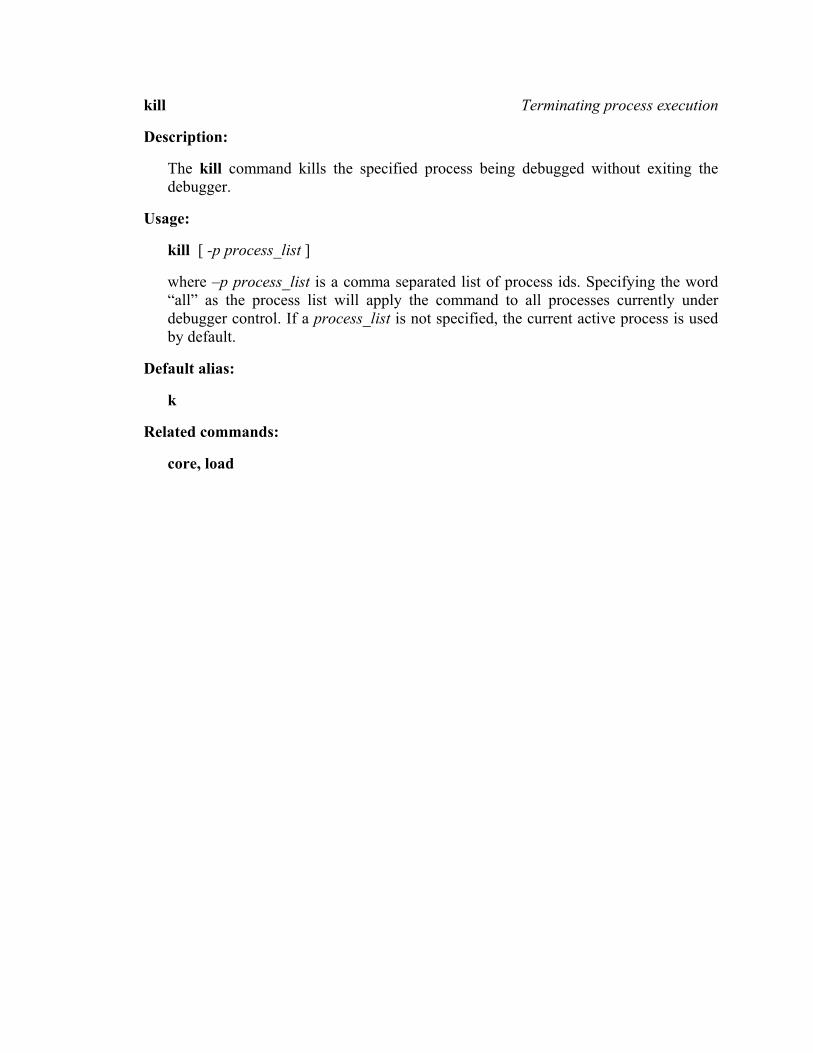
kill Terminating process execution
Description:
The kill command kills the specified process being debugged without exiting the debugger.
Usage:
kill [ -p process_list ]
where –p process_list is a comma separated list of process ids. Specifying the word “all” as the process list will apply the command to all processes currently under debugger control. If a process_list is not specified, the current active process is used by default.
Default alias:
k
Related commands:
core, load
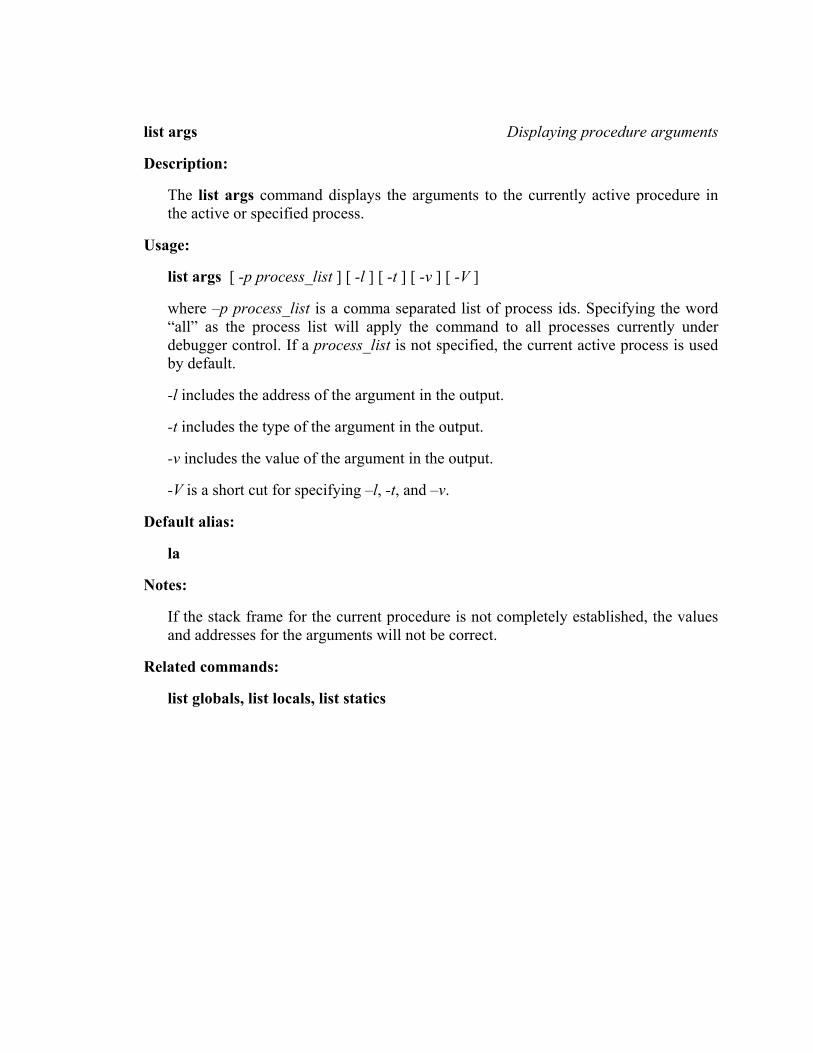
list args Displaying procedure arguments
Description:
The list args command displays the arguments to the currently active procedure in the active or specified process.
Usage:
list args [ -p process_list ] [ -l ] [ -t ] [ -v ] [ -V ]
where –p process_list is a comma separated list of process ids. Specifying the word “all” as the process list will apply the command to all processes currently under debugger control. If a process_list is not specified, the current active process is used by default.
-l includes the address of the argument in the output.
-t includes the type of the argument in the output.
-v includes the value of the argument in the output.
-V is a short cut for specifying –l, -t, and –v.
Default alias:
la
Notes:
If the stack frame for the current procedure is not completely established, the values and addresses for the arguments will not be correct.
Related commands:
list globals, list locals, list statics
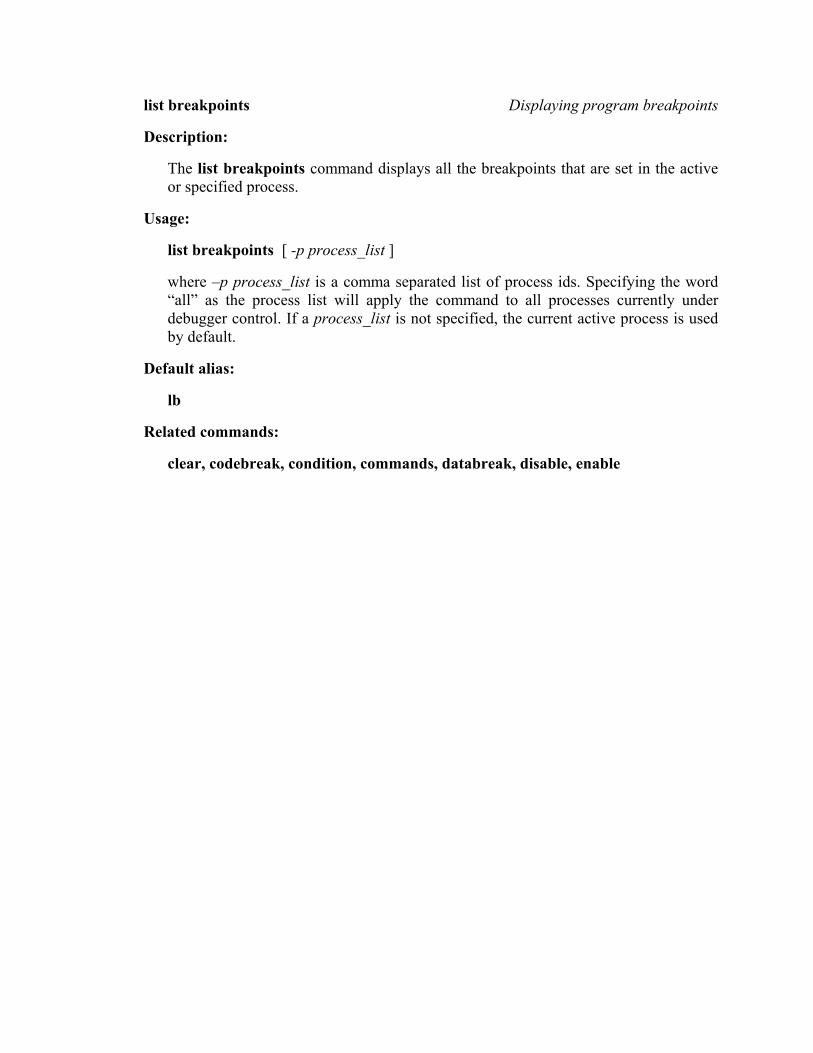
list breakpoints Displaying program breakpoints
Description:
The list breakpoints command displays all the breakpoints that are set in the active or specified process.
Usage:
list breakpoints [ -p process_list ]
where –p process_list is a comma separated list of process ids. Specifying the word “all” as the process list will apply the command to all processes currently under debugger control. If a process_list is not specified, the current active process is used by default.
Default alias:
lb
Related commands:
clear, codebreak, condition, commands, databreak, disable, enable
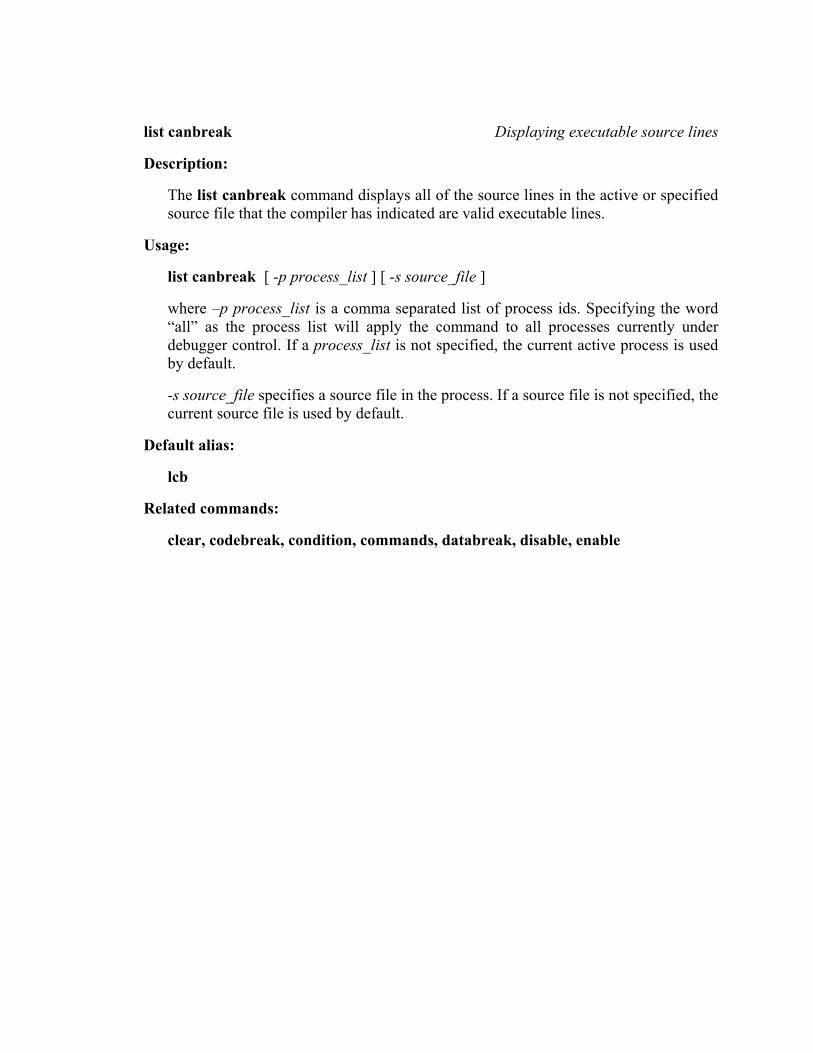
list canbreak Displaying executable source lines
Description:
The list canbreak command displays all of the source lines in the active or specified source file that the compiler has indicated are valid executable lines.
Usage:
list canbreak [ -p process_list ] [ -s source_file ]
where –p process_list is a comma separated list of process ids. Specifying the word “all” as the process list will apply the command to all processes currently under debugger control. If a process_list is not specified, the current active process is used by default.
-s source_file specifies a source file in the process. If a source file is not specified, the current source file is used by default.
Default alias:
lcb
Related commands:
clear, codebreak, condition, commands, databreak, disable, enable
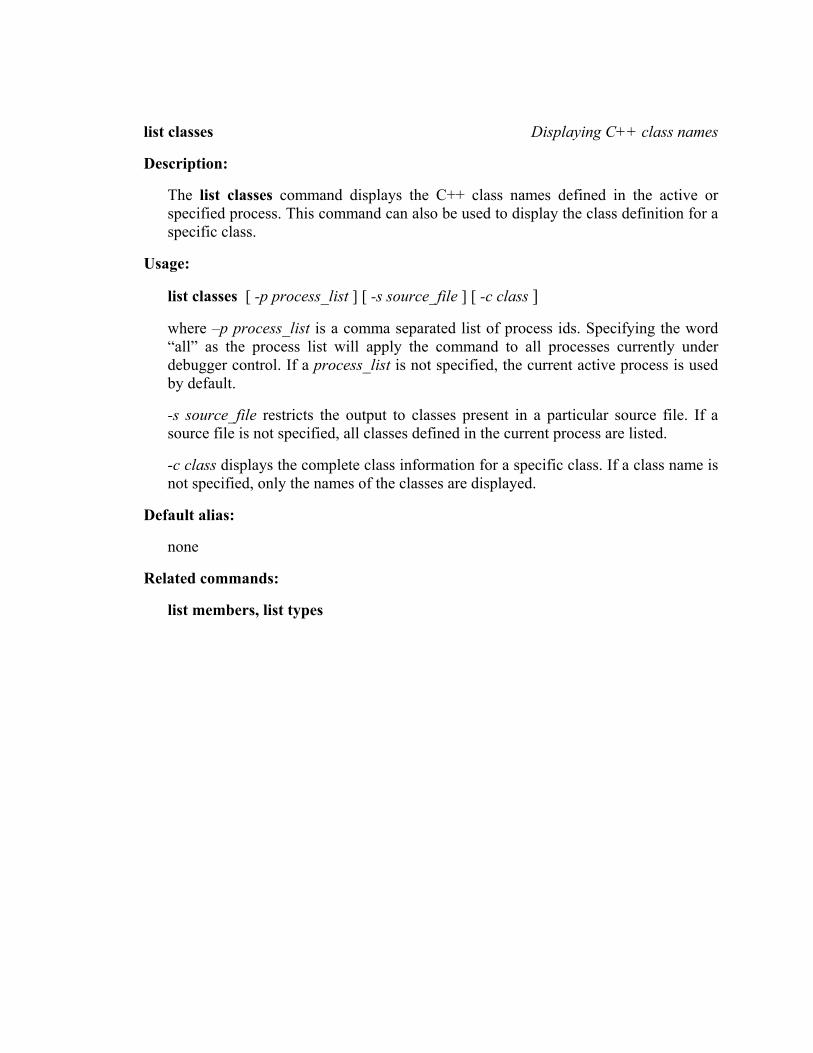
list classes Displaying C++ class names
Description:
The list classes command displays the C++ class names defined in the active or specified process. This command can also be used to display the class definition for a specific class.
Usage:
list classes [ -p process_list ] [ -s source_file ] [ -c class ]
where –p process_list is a comma separated list of process ids. Specifying the word “all” as the process list will apply the command to all processes currently under debugger control. If a process_list is not specified, the current active process is used by default.
-s source_file restricts the output to classes present in a particular source file. If a source file is not specified, all classes defined in the current process are listed.
-c class displays the complete class information for a specific class. If a class name is not specified, only the names of the classes are displayed.
Default alias:
none
Related commands:
list members, list types
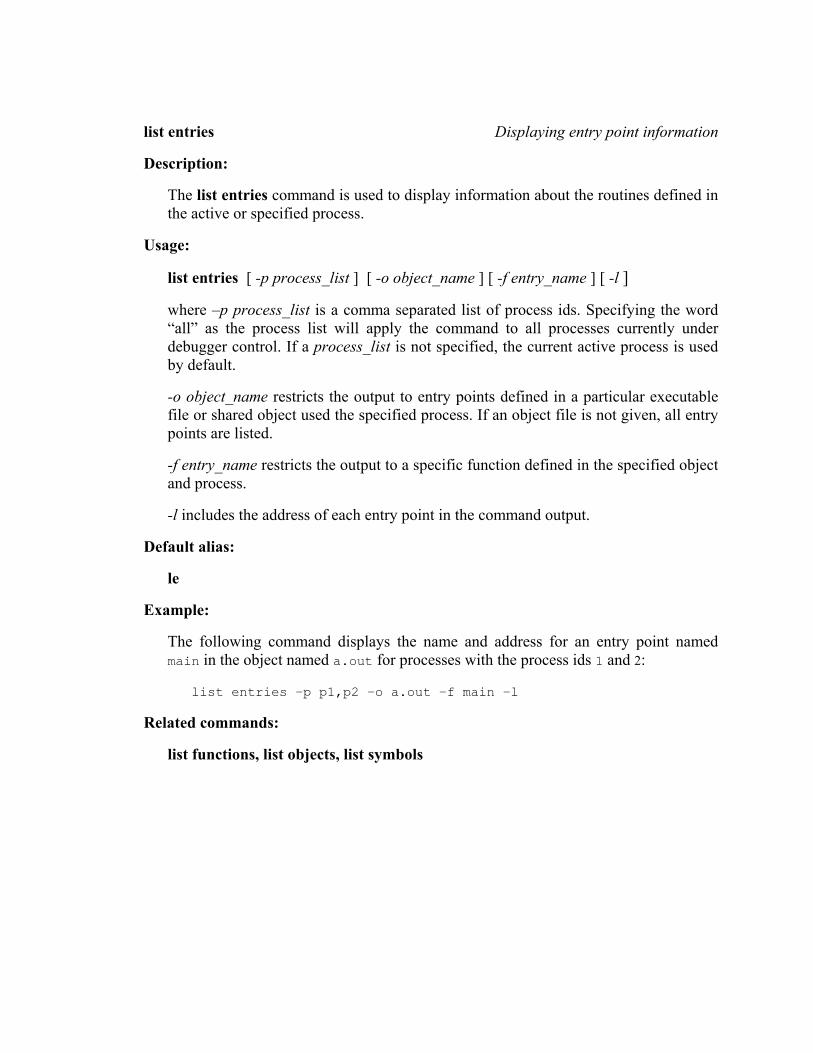
list entries Displaying entry point information
Description:
The list entries command is used to display information about the routines defined in the active or specified process.
Usage:
list entries [ -p process_list ] [ -o object_name ] [ -f entry_name ] [ -l ]
where –p process_list is a comma separated list of process ids. Specifying the word “all” as the process list will apply the command to all processes currently under debugger control. If a process_list is not specified, the current active process is used by default.
-o object_name restricts the output to entry points defined in a particular executable file or shared object used the specified process. If an object file is not given, all entry points are listed.
-f entry_name restricts the output to a specific function defined in the specified object and process.
-l includes the address of each entry point in the command output.
Default alias:
le
Example:
The following command displays the name and address for an entry point named main in the object named a.out for processes with the process ids 1 and 2:
list entries –p p1,p2 –o a.out –f main –l
Related commands:
list functions, list objects, list symbols
list frame Displaying the active stack frame
Description:
The list frame command displays the active stack frame for the current or specified process.
Usage:
list frame [ -p process_list ]
where –p process_list is a comma separated list of process ids. Specifying the word “all” as the process list will apply the command to all processes currently under control of the debugger. If a process_list is not specified, the current active process is used by default.
Notes:
Stack frames are numbered from 0 to n, where 0 is the frame for the current procedure (i.e. the last routine that was called) and n is the total number of stack frames.
Related commands:
down, frame, stacktrace, up
list functions Displaying program functions and procedures
Description:
The list functions command displays information on the functions and procedures defined in the current or specified process.
Usage:
list functions [ -p process_list ] [ -o object_file ] [ -s source_file] [ -t ] [ -l ] [ -V ]
where –p process_list is a comma separated list of process ids. Specifying the word “all” as the process list will apply the command to all processes currently under debugger control. If a process_list is not specified, the current active process is used by default.
-o object_file specifies an executable file or shared object file that is used in the current or specified process.
-s source_file restricts the output to functions present in a particular source file.
-l includes the address of the function in the output.
-t includes the return type of the function in the output.
-V is a short cut for specifying –l and –t.
Default alias:
lf
Example:
The following command lists all the functions present in a source file names eigen.f in the object named libmath.so in the process with the process id p5:
list functions –p p5 –o libmath.so –s eigen.f
Related commands:
list entries, list objects, list source
list globals Displaying global symbol information
Description:
The list globals command is used to display the global symbols for the current or specified process.
Usage:
list globals [ -p process_list ] [ -l ] [ -t ] [ -v ] [ -V ]
where –p process_list is a comma separated list of process ids. Specifying the word “all” as the process list will apply the command to all processes currently under debugger control. If a process_list is not specified, the current active process is used by default.
-l includes the address of the global in the output.
-t includes the type of the global in the output.
-v includes the value of the global in the output.
-V is a short cut for specifying –l, -t, and –v.
Default alias:
lg
Related commands:
list args, list locals, list statics
list locals Displaying local variable information
Description:
The list locals command displays the local variables for the currently active procedure in the active or specified process.
Usage:
list locals [ -p process_list ] [ -l ] [ -t ] [ -v ] [ -V ]
where –p process_list is a comma separated list of process ids. Specifying the word “all” as the process list will apply the command to all processes currently under debugger control. If a process_list is not specified, the current active process is used by default.
-l includes the address of the variable in the output.
-t includes the type of the variable in the output.
-v includes the value of the variable in the output.
-V is a short cut for specifying –l, -t, and –v.
Default alias:
ll
Notes:
If the stack frame for the current procedure is not completely established, the values and addresses for the locals will not be correct.
Related commands:
list args, list globals, list statics
list members Displaying C++ class member information
Description:
The list members command is used to display information about a C++ class in the current or specified process.
Usage:
list members [ -p process_list ] [ -base ] [ -data ] [ -friends ] [ -function ] [ -private ] [ -protected ] [ - public ] [ -l ] class_name
where –p process_list is a comma separated list of process ids. Specifying the word “all” as the process list will apply the command to all processes currently under debugger control. If a process_list is not specified, the current active process is used by default.
class_name is the name of the class for which the information is desired.
-base includes the base classes (if any) for the specified class.
-data includes the specified class’s data members.
-friends includes the specified class’s friends.
-function includes the specified class’s member functions.
-private includes the output to the specified class’s private members.
-protected includes the output to the specified class’s protected members.
-public includes the output to the specified class’s public members.
-l includes the address of the specified class’s member functions in the output.
Notes:
If none of the access specifier options are specified, all public, protected and private members are displayed. If none of the member filter options are specified, all types of class are displayed. The amount of information available for a class may vary depending upon the type and quality of the debug information produced by a given compiler.
Related commands:
list classes, list types
list objects Displaying process object information
Description:
The list objects command is used to display the executable and shared object files that are contained in the current or specified process..
Usage:
list objects [ -p process_list ]
where –p process_list is a comma separated list of process ids. Specifying the word “all” as the process list will apply the command to all processes currently under debugger control. If a process_list is not specified, the current active process is used by default.
Default alias:
lo
Related commands:
list entries, list source, list symbols
list processes Displaying processes under debugger control
Description:
The list processes command is used to display the processes that are currently being debugged. The output for each process includes the debugger assigned process id, the host operating system’s process id, the name of the process’s executable image, and the process’s current state.
Usage:
list processes
Default alias:
lp
Related commands:
list threads, thread, use
list signals Displaying current signal status
Description:
The list signals command displays the action that will be taken when signals are presented to the current or specified process.
Usage:
list signals [ -p process_list ]
where –p process_list is a comma separated list of process ids. Specifying the word “all” as the process list will apply the command to all processes currently under debugger control. If a process_list is not specified, the current active process is used by default.
Related commands:
signal
list source Displaying source file information
Description:
The list source command is used to display the names of the source files that were compiled with debug information for the current or specified process.
Usage:
list source [ -p process_list ] [ -o file_name ]
where –p process_list is a comma separated list of process ids. Specifying the word “all” as the process list will apply the command to all processes currently under debugger control. If a process_list is not specified, the current active process is used by default.
-o file_name specifies an executable file or shared object file that is used in the current or specified process.
Related commands:
list objects
list statics Displaying static variable information
Description:
The list statics command displays the file static variables for the currently active source file in the active or specified process.
Usage:
list locals [ -p process_list ] [ -l ] [ -t ] [ -v ] [ -V ]
where –p process_list is a comma separated list of process ids. Specifying the word “all” as the process list will apply the command to all processes currently under debugger control. If a process_list is not specified, the current active process is used by default.
-l includes the address of the variable in the output.
-t includes the type of the variable in the output.
-v includes the value of the variable in the output.
-V is a short cut for specifying –l, -t, and –v.
Default alias:
ls
Related commands:
list args, list globals, list locals
list symbols Display process data symbol information
Description:
The list symbols command is used to display the global data symbols for the specified or active process.
Usage:
list symbols [ -p process_list ] [ -o object_name ]
where –p process_list is a comma separated list of process ids. Specifying the word “all” as the process list will apply the command to all processes currently under debugger control. If a process_list is not specified, the current active process is used by default.
-o object_name restricts the output to symbols defined in a particular executable file or shared object used the specified process. If an object file is not given, all data symbols are listed.
Example:
The following command displays the global data symbols in the object named a.out for processes with the process ids 1 and 2:
list symbols –p p1,p2 –o a.out
Related commands:
list functions, list entries, list objects
list threads Displaying process thread information
Description:
The list thread command is used to display thread information for the specified or active process.
Usage:
list threads [ -p process_list ]
where –p process_list is a comma separated list of process ids. Specifying the word “all” as the process list will apply the command to all processes currently under debugger control. If a process_list is not specified, the current active process is used by default.
Default alias:
lt
Notes:
Thread debugging support is operating system dependent and may not be available in all debuggers.
Related commands:
list processes, thread, use
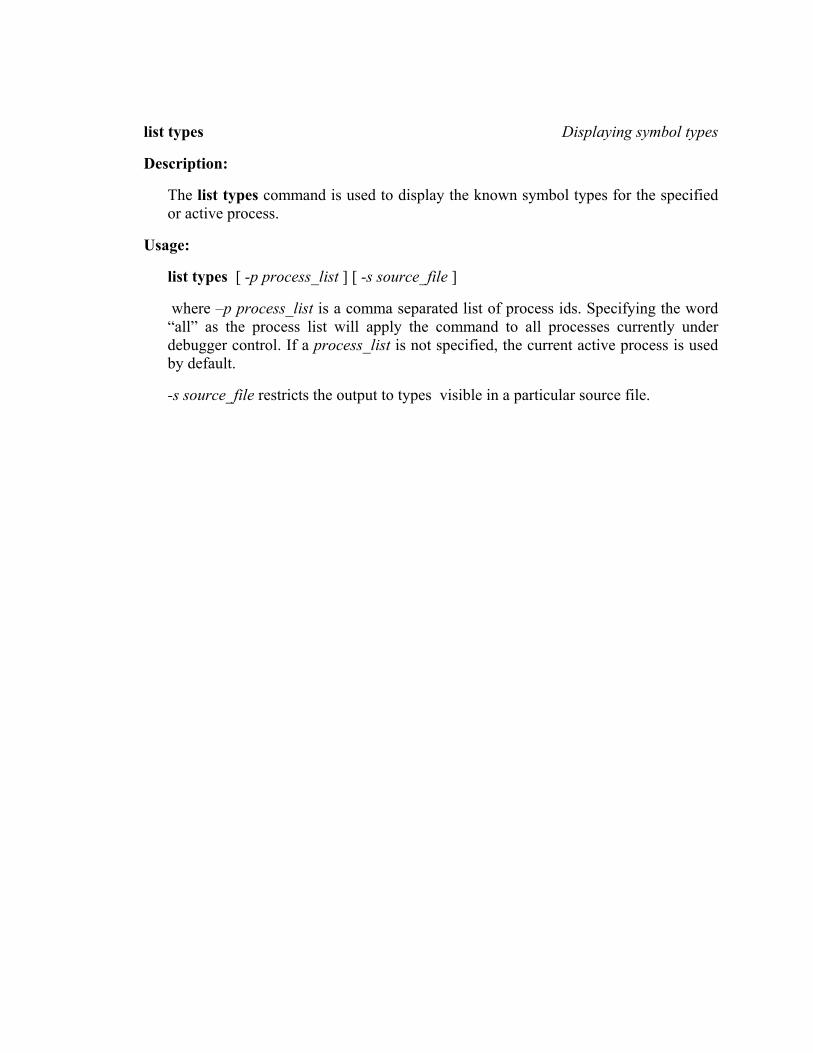
list types Displaying symbol types
Description:
The list types command is used to display the known symbol types for the specified or active process.
Usage:
list types [ -p process_list ] [ -s source_file ]
where –p process_list is a comma separated list of process ids. Specifying the word “all” as the process list will apply the command to all processes currently under debugger control. If a process_list is not specified, the current active process is used by default.
-s source_file restricts the output to types visible in a particular source file.
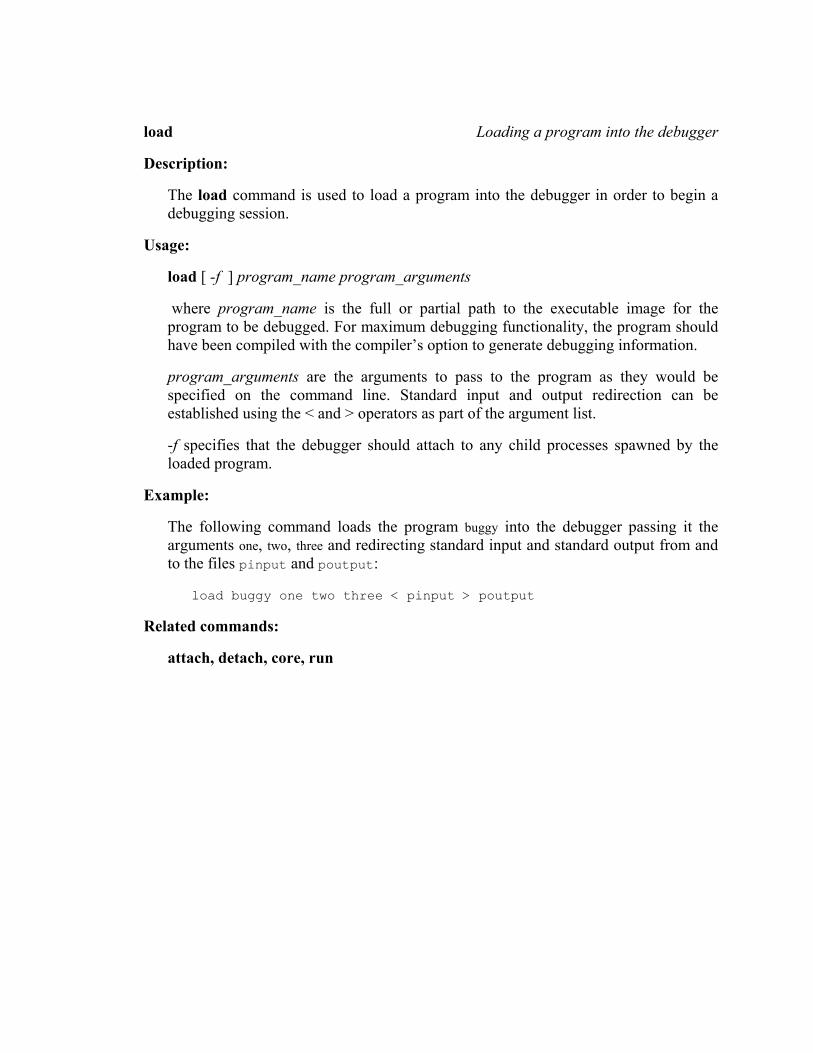
load Loading a program into the debugger
Description:
The load command is used to load a program into the debugger in order to begin a debugging session.
Usage:
load [ -f ] program_name program_arguments
where program_name is the full or partial path to the executable image for the program to be debugged. For maximum debugging functionality, the program should have been compiled with the compiler’s option to generate debugging information.
program_arguments are the arguments to pass to the program as they would be specified on the command line. Standard input and output redirection can be established using the < and > operators as part of the argument list.
-f specifies that the debugger should attach to any child processes spawned by the loaded program.
Example:
The following command loads the program buggy into the debugger passing it the arguments one, two, three and redirecting standard input and standard output from and to the files pinput and poutput:
load buggy one two three < pinput > poutput
Related commands:
attach, detach, core, run
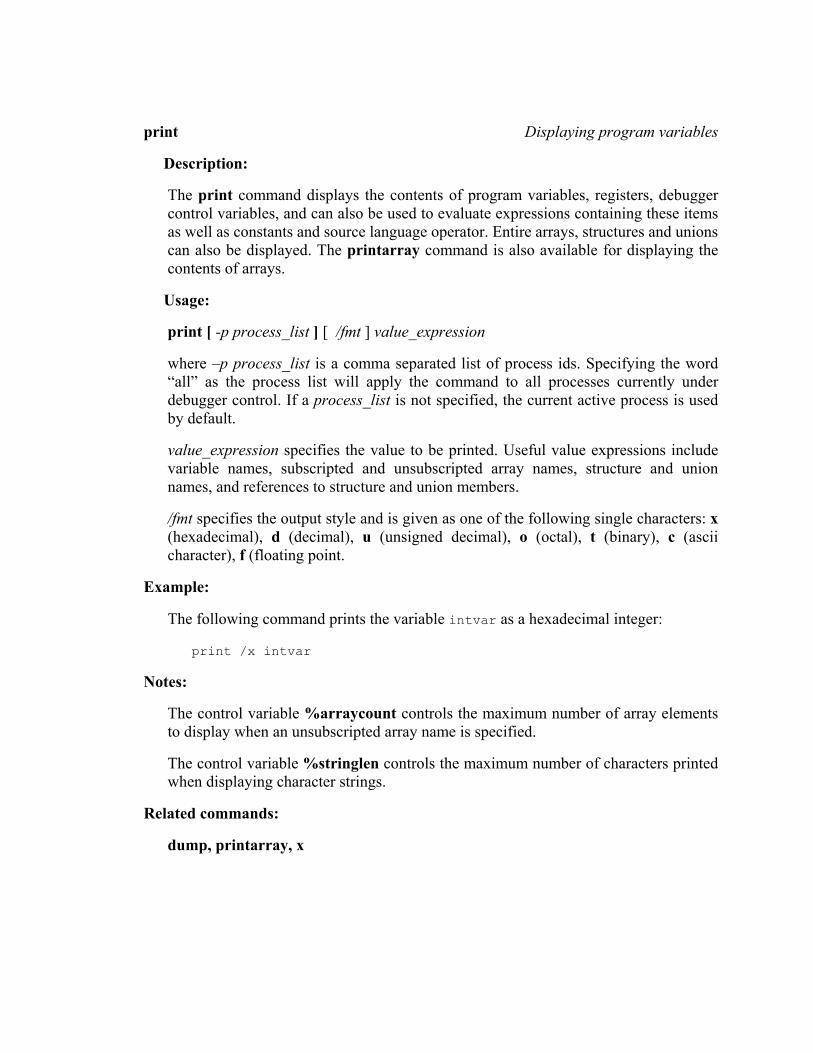
print Displaying program variables
Description:
The print command displays the contents of program variables, registers, debugger control variables, and can also be used to evaluate expressions containing these items as well as constants and source language operator. Entire arrays, structures and unions can also be displayed. The printarray command is also available for displaying the contents of arrays.
Usage:
print [ -p process_list ] [ /fmt ] value_expression
where –p process_list is a comma separated list of process ids. Specifying the word “all” as the process list will apply the command to all processes currently under debugger control. If a process_list is not specified, the current active process is used by default.
value_expression specifies the value to be printed. Useful value expressions include variable names, subscripted and unsubscripted array names, structure and union names, and references to structure and union members.
/fmt specifies the output style and is given as one of the following single characters: x (hexadecimal), d (decimal), u (unsigned decimal), o (octal), t (binary), c (ascii character), f (floating point.
Example:
The following command prints the variable intvar as a hexadecimal integer:
print /x intvar
Notes:
The control variable %arraycount controls the maximum number of array elements to display when an unsubscripted array name is specified.
The control variable %stringlen controls the maximum number of characters printed when displaying character strings.
Related commands:
dump, printarray, x
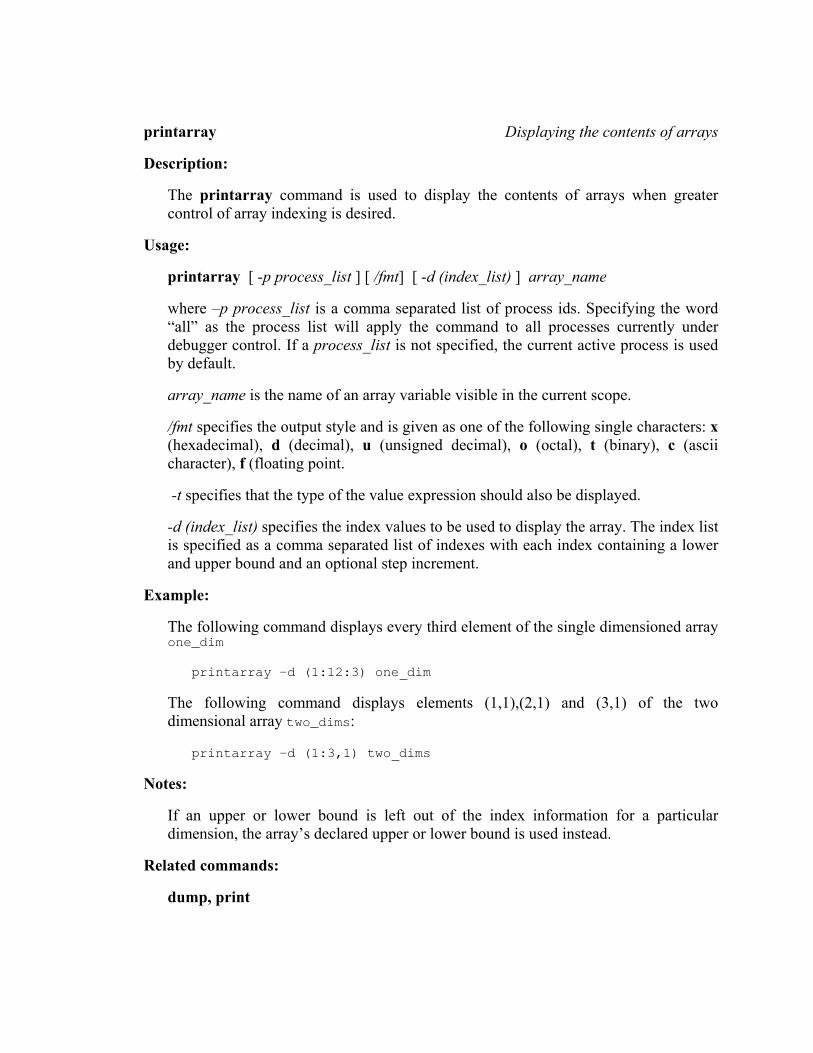
printarray Displaying the contents of arrays
Description:
The printarray command is used to display the contents of arrays when greater control of array indexing is desired.
Usage:
printarray [ -p process_list ] [ /fmt] [ -d (index_list) ] array_name
where –p process_list is a comma separated list of process ids. Specifying the word “all” as the process list will apply the command to all processes currently under debugger control. If a process_list is not specified, the current active process is used by default.
array_name is the name of an array variable visible in the current scope.
/fmt specifies the output style and is given as one of the following single characters: x (hexadecimal), d (decimal), u (unsigned decimal), o (octal), t (binary), c (ascii character), f (floating point.
-t specifies that the type of the value expression should also be displayed.
-d (index_list) specifies the index values to be used to display the array. The index list is specified as a comma separated list of indexes with each index containing a lower and upper bound and an optional step increment.
Example:
The following command displays every third element of the single dimensioned array one_dim
printarray –d (1:12:3) one_dim
The following command displays elements (1,1),(2,1) and (3,1) of the two dimensional array two_dims:
printarray –d (1:3,1) two_dims
Notes:
If an upper or lower bound is left out of the index information for a particular dimension, the array’s declared upper or lower bound is used instead.
Related commands:
dump, print
quit Ending a debugging session
Description:
The quit command terminates the current debugging session.
Usage:
quit
Default alias:
q
Related commands:
kill
read Reading commands from a file
Description:
The read command allows debugger commands to be read from a text file. This command can be used to automate frequently executed commands or to automatically load a predefined debugging session. The file may be created in any text editor as long as is saved as plain ASCII text without additional formatting.
Usage:
read {“filename”}
where filename is the name of a file that contains valid debugger commands. If an error occurs while commands are being read from the specified file, the remaining commands in the file will be ignored.
Example:
The following command will cause the debugger to execute the commands in the file fxsetup:
read fxsetup
Notes:
It is permissible to nest read commands. That is, a file specified with the read command may contain other read commands. It should be noted that use of this feature might lead to infinite execution if the file used in a nested read command contains a read command specifying the original file.
registers Displaying hardware registers
Description:
The registers command is used display the current contents of hardware registers for the current or specified process.
Usage:
registers [ -p process_list ] [ -g ] [ -f ] [ -Vf ] [ -Vd ] [ -Vai ] [ -Vaf ] [ -Vad ]
where –p process_list is a comma separated list of process ids. Specifying the word “all” as the process list will apply the command to all processes currently under debugger control. If a process_list is not specified, the current active process is used by default.
-g displays the process general purpose registers.
-f displays the process dedicated floating point registers
-Vf displays the process vector registers in single precision floating point mode
-Vd displays the process vector registers in double precision floatint point mode
-Vai displays the process vector registers in integer format
-Vaf displays the process vector registers in single precision floating point format
-Vad display the process vector registers in double precision floating point format
Default alias:
r
Notes:
The contents of individual registers can be displayed in a variety of formats using the print command.
Vector and floating point registers are system specific and may not be available on all systems.
Related commands:
print, set
return Returning from the current subroutine
Description:
The return command resumes execution of the program being debugged until the current procedure returns to its calling procedure or a breakpoint is encountered. If the current procedure never returns to its calling procedure, execution will continue until a breakpoint is encountered, an error occurs, or the program runs to completion.
Usage:
return [ -p process_list ]
where –p process_list is a comma separated list of process ids. Specifying the word “all” as the process list will apply the command to all processes currently under debugger control. If a process_list is not specified, the current active process is used by default.
Default alias:
R
Related commands:
continue, istepinto, istepover, stepinto, stepover
run Restarting program execution
Description:
The run command is used restart execution of a program optionally specifying different arguments from those that were used when the program was initially loaded with the load command.
Usage:
run program_arguments
where program_arguments are the arguments to pass to the program as they would be specified on the command line. Standard input and output redirection can be established using the < and > operators as part of the argument list.
Example:
The following command restarts program execution the arguments one, two, three and redirecting standard input and standard output from and to the files pinput and poutput:
run one two three < pinput > poutput
Related commands:
attach, detach, core, kill, load
set Changing variable values
Description:
The set command is used change the value of a variable in the active or specified process. It is also used to assign values to debugger control variables and debugger convenience variables.
Usage:
set [ -p process_list ] variable = value
where –p process_list is a comma separated list of process ids. Specifying the word “all” as the process list will apply the command to all processes currently under debugger control. If a process_list is not specified, the current active process is used by default.
variable is the name of a variable visible in the current scope of the current or specified process, a hardware register, a debugger control variable, or a debugger convenience variable.
value is the new value to assign to the specified variable. The new value can be specified as a constant or an expression to be evaluated before the assignment is performed.
Example:
The following command changes the value of the array element node_valid[4] in the current active process to 1:
set node_valid[4] = 1
signal Resuming execution with a specific signal
Description:
The signal command resumes program execution and present a specified signal the program being debugged.
Usage:
signal [ -p process_list ] signal
where –p process_list is a comma separated list of process ids. Specifying the word “all” as the process list will apply the command to all processes currently under debugger control. If a process_list is not specified, the current active process is used by default.
signal is the positive integer that represents the signal you wish to control. Specifying only a signal number will cause that signal to be presented to your program the next time execution is resumed. You can remove any pending signal by specifying zero instead of a signal number.
Default alias:
sig
Examples:
The following command will cause the process with process id 4 to receive a floating point exception signal the next time execution is resumed:
signal –p p4 8
Related commands:
handle, list signals
stacktrace Displaying a stack trace
Description:
The stacktrace command is used to display the chain of procedure calls that produced the current process state. Each procedure in the current chain is listed along with the procedure that called it and the calling procedure's file and line number if available. Optionally, the arguments to each procedure in the call stack can also be displayed.
Usage:
stacktrace [ -p process_list ] [ -a ]
where –p process_list is a comma separated list of process ids. Specifying the word “all” as the process list will apply the command to all processes currently under debugger control. If a process_list is not specified, the current active process is used by default.
-a enables the display of the arguments passed to each procedure in the call chain.
Default alias:
t
Notes:
This command may not function correctly if the program being debugged is stopped during execution of the entry code for a procedure or if the call chain contains one or more procedures that do not follow the standard calling conventions.
Related commands:
down, frame, up
stepinto Executing single source statements
Description:
The stepinto command executes one or more source statements, starting with the next statement to be executed. If one of the statements to be executed is a call to a procedure, the procedure will be entered if complete symbol information is available for it. If complete symbol information is not available, execution of the program will continue until the statement following the procedure call is encountered.
Usage:
stepinto [ -p process_list ] [ -c count ]
where –p process_list is a comma separated list of process ids. Specifying the word “all” as the process list will apply the command to all processes currently under debugger control. If a process_list is not specified, the current active process is used by default.
-c count is an integer expression that specifies the number of statements to execute. If count is not specified, one statement will be executed.
Default alias:
s
Example:
The following command executes the next five statements of the current procedure:
stepinto 5
Notes:
The stepinto command will ignore any breakpoints set on instructions that are part of the source statement being executed.
Related commands:
istepinto, istepover, stepover
stepover Stepping over procedure calls
Description:
The stepover command executes one or more source statements, starting with the next statement to be executed. If one of the statements to be executed is a call to a procedure, execution of the program will continue until the statement following the procedure call is encountered or a breakpoint is encountered.
Usage:
stepover [ -p process_list ] [ -c count ]
where –p process_list is a comma separated list of process ids. Specifying the word “all” as the process list will apply the command to all processes currently under debugger control. If a process_list is not specified, the current active process is used by default.
-c count is an integer expression that specifies the number of statements to execute. If count is not specified, one statement will be executed.
Default alias:
S
Example:
The following command executes the next five statements of the current procedure, treating any procedure calls as single statements:
stepover 5
Notes:
The stepover command will only stop for breakpoints set in a procedure which is being treated as a single statement. It will ignore any breakpoints set on the instructions that are part of the source statement being executed.
Related commands:
istepinto, istepover, stepinto
stop Stopping process execution
Description:
The stop command is used to interrupt execution of the active or specified process.
Usage:
stop [ -p process_list ]
where –p process_list is a comma separated list of process ids. Specifying the word “all” as the process list will apply the command to all processes currently under debugger control. If a process_list is not specified, the current active process is used by default.
Related commands:
continue
tbreak Setting a temporary breakpoint
Description:
The tbreak command is used to place a breakpoint at a given location in the program being debugged. The location can be any valid address expression. The location may also be specified as a source file and line number combination. When a breakpoint is installed with the tbreak command, it will automatically be removed the first time it stops program execution.
Usage:
tbreak [ -p process_list ] filename:line_number | *address_expression
where –p process_list is a comma separated list of process ids. Specifying the word “all” as the process list will apply the command to all processes currently under debugger control. If a process_list is not specified, the current active process is used by default.
filename:line_number specifies the source file and line number where the breakpoint is set.
*address_expression specified an address where the breakpoint is set.
Example:
The following command sets a breakpoint on the location specified by the address expression main+Ox50:
tbreak main+Ox5O
The following command sets a breakpoint on the seventh line of the file source.f:
tbreak source.f:7
Related commands:
break, clear, codebreak, commands, condition, databreak, delete, disable, enable, info breakpoints
thread Specifying the active thread
Description:
The thread command is used to make a thread the default active thread for the active or specified process. The default active thread is used by other debugger commands, such as print and registers, as the process context for retrieving register and memory contents.
Usage:
thread [ -p process_list ] thread_id
where –p process_list is a comma separated list of process ids. Specifying the word “all” as the process list will apply the command to all processes currently under debugger control. If a process_list is not specified, the current active process is used by default.
thread_id is the integer thread identifier assigned by the debugger when the thread is created.
Example:
Notes:
Thread debugging support is operating system dependent and may not be available in all debuggers.
Related commands:
list processes, list threads, use
typeof Displaying the type of a symbol
Description:
The typeof command is used to display the type of a symbol in the active or specified process. The symbol can be a variable, an aggregate data type, a function, or an expression involving source language operators.
Usage:
typeof [ -p process_list ] [-v] symbol_name
where –p process_list is a comma separated list of process ids. Specifying the word “all” as the process list will apply the command to all processes currently under debugger control. If a process_list is not specified, the current active process is used by default.
-v displays the members of aggregate or derived data types.
symbol_name is the name of a variable, the name of a function or a source language expression.
Example:
The following command displays the type of the variable simple:
typeof simple
The following command displays the type of the array element node[5] inside a variable named node_stack:
typeof node_stack.node[5]
Related commands:
list classes, list members, list types
until Resuming execution until a specified location
Description:
The until command is used to resume execution at a given source line or program address is encountered. This command is a short cut for setting a breakpoint, executing a continue command, and then removing the breakpoint.
Usage:
until [ -p process_list ] filename:line_number | *address_expression
where –p process_list is a comma separated list of process ids. Specifying the word “all” as the process list will apply the command to all processes currently under debugger control. If a process_list is not specified, the current active process is used by default.
filename:line_number specifies the source file and line number where program execution resumes.
*address_expression specifies an address where program execution resumes.
Example:
The following command resumes program execution at location specified by the address expression main+Ox50:
until *main+Ox5O
The following command resumes program execution on the seventh line of the file source.f:
until source.f:7
Related commands:
continue, jump
up Specifying the active stack frame
Description:
The up command is used to change the active stack frame in the active or specified process.
Usage:
up [ -p process_list ] [ count ]
where –p process_list is a comma separated list of process ids. Specifying the word “all” as the process list will apply the command to all processes currently under debugger control. If a process_list is not specified, the current active process is used by default.
count is the integer specifying the number of frames to move up in the current call stack. If count is not given, the default value 1 is used.
Notes:
Stack frames are numbered from 0 to n, where 0 is the frame for the current procedure (i.e. the last routine that was called) and n is the total number of stack frames.
Related commands:
down, frame, stacktrace
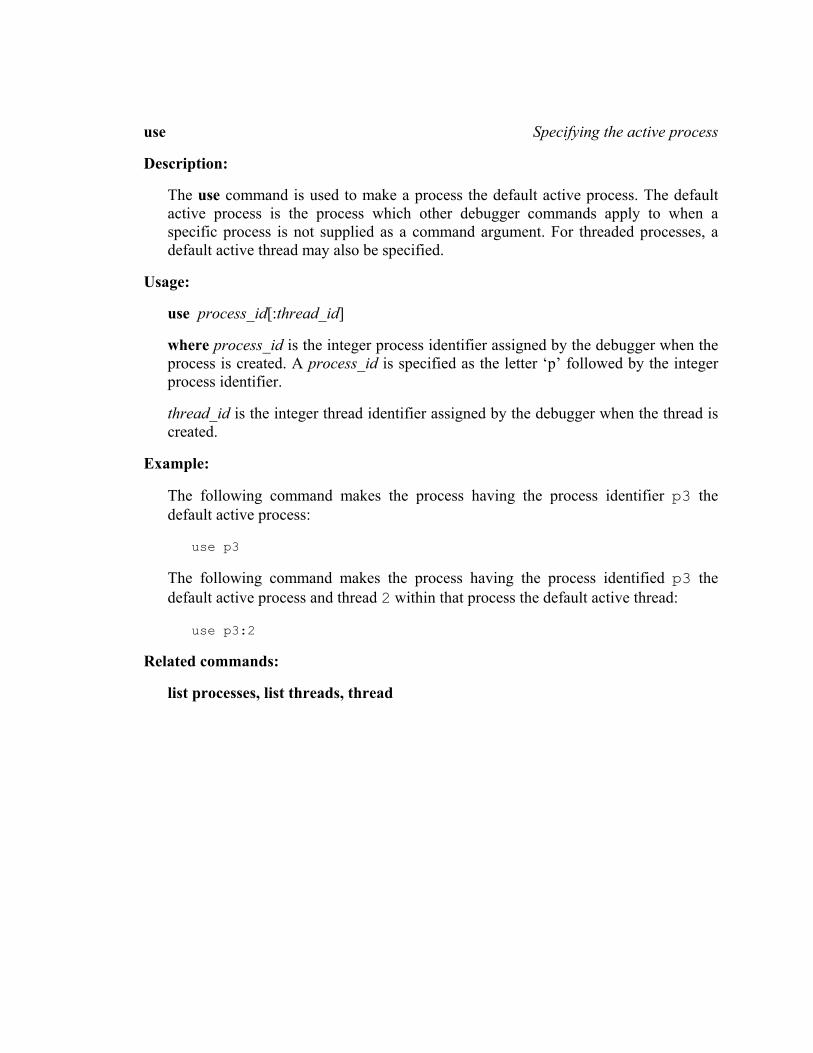
use Specifying the active process
Description:
The use command is used to make a process the default active process. The default active process is the process which other debugger commands apply to when a specific process is not supplied as a command argument. For threaded processes, a default active thread may also be specified.
Usage:
use process_id[:thread_id]
where process_id is the integer process identifier assigned by the debugger when the process is created. A process_id is specified as the letter ‘p’ followed by the integer process identifier.
thread_id is the integer thread identifier assigned by the debugger when the thread is created.
Example:
The following command makes the process having the process identifier p3 the default active process:
use p3
The following command makes the process having the process identified p3 the default active process and thread 2 within that process the default active thread:
use p3:2
Related commands:
list processes, list threads, thread
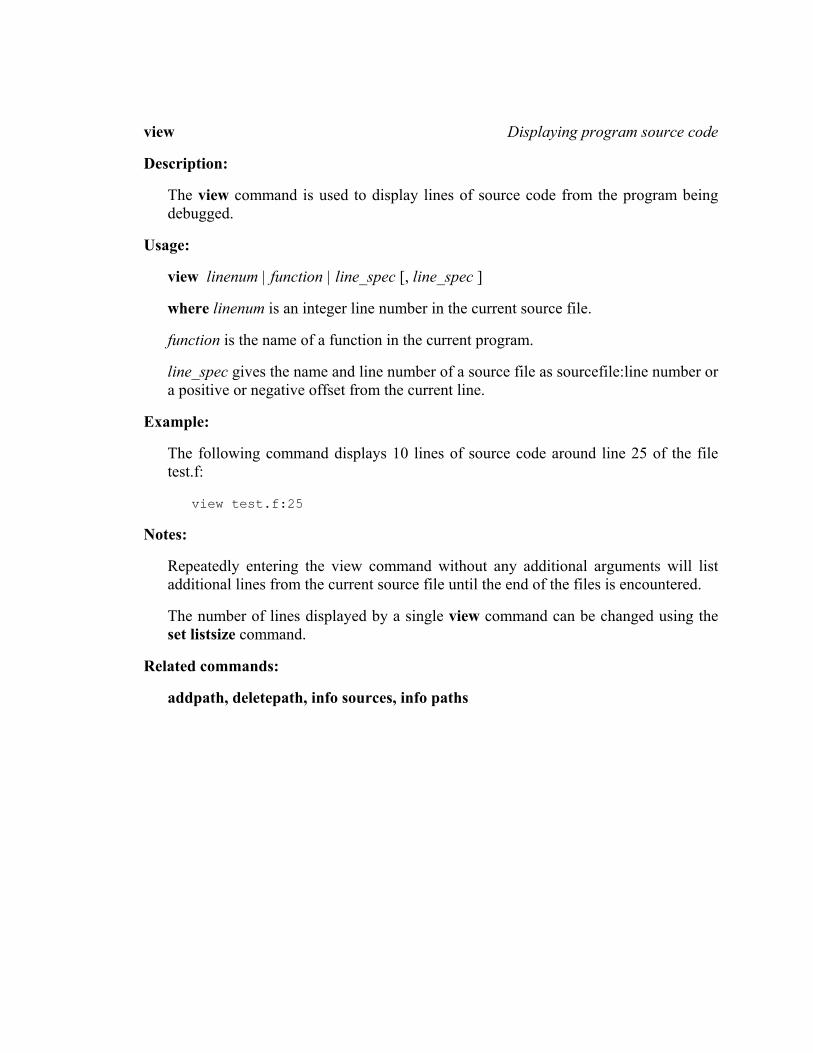
view Displaying program source code
Description:
The view command is used to display lines of source code from the program being debugged.
Usage:
view linenum | function | line_spec [, line_spec ]
where linenum is an integer line number in the current source file.
function is the name of a function in the current program.
line_spec gives the name and line number of a source file as sourcefile:line number or a positive or negative offset from the current line.
Example:
The following command displays 10 lines of source code around line 25 of the file test.f:
view test.f:25
Notes:
Repeatedly entering the view command without any additional arguments will list additional lines from the current source file until the end of the files is encountered.
The number of lines displayed by a single view command can be changed using the set listsize command.
Related commands:
addpath, deletepath, info sources, info paths
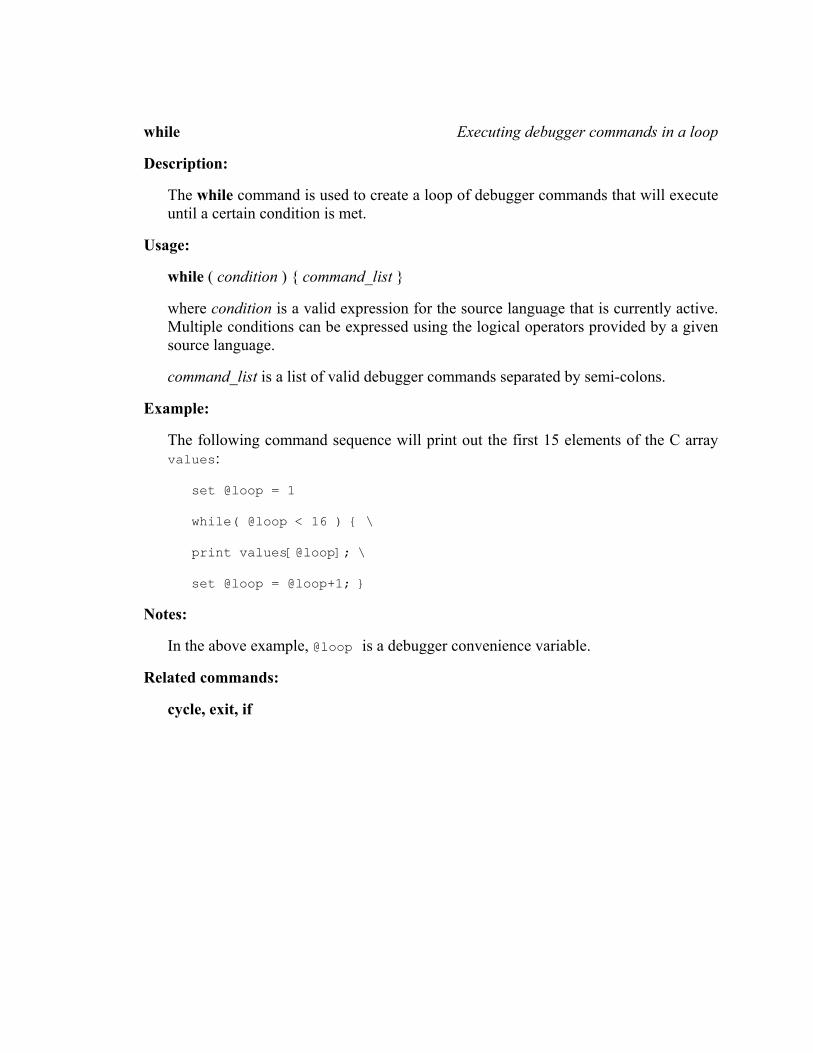
while Executing debugger commands in a loop
Description:
The while command is used to create a loop of debugger commands that will execute until a certain condition is met.
Usage:
while ( condition ) { command_list }
where condition is a valid expression for the source language that is currently active. Multiple conditions can be expressed using the logical operators provided by a given source language.
command_list is a list of valid debugger commands separated by semi-colons.
Example:
The following command sequence will print out the first 15 elements of the C array values:
set @loop = 1
while( @loop < 16 ) { \
print values[@loop]; \
set @loop = @loop+1; }
Notes:
In the above example, @loop is a debugger convenience variable.
Related commands:
cycle, exit, if
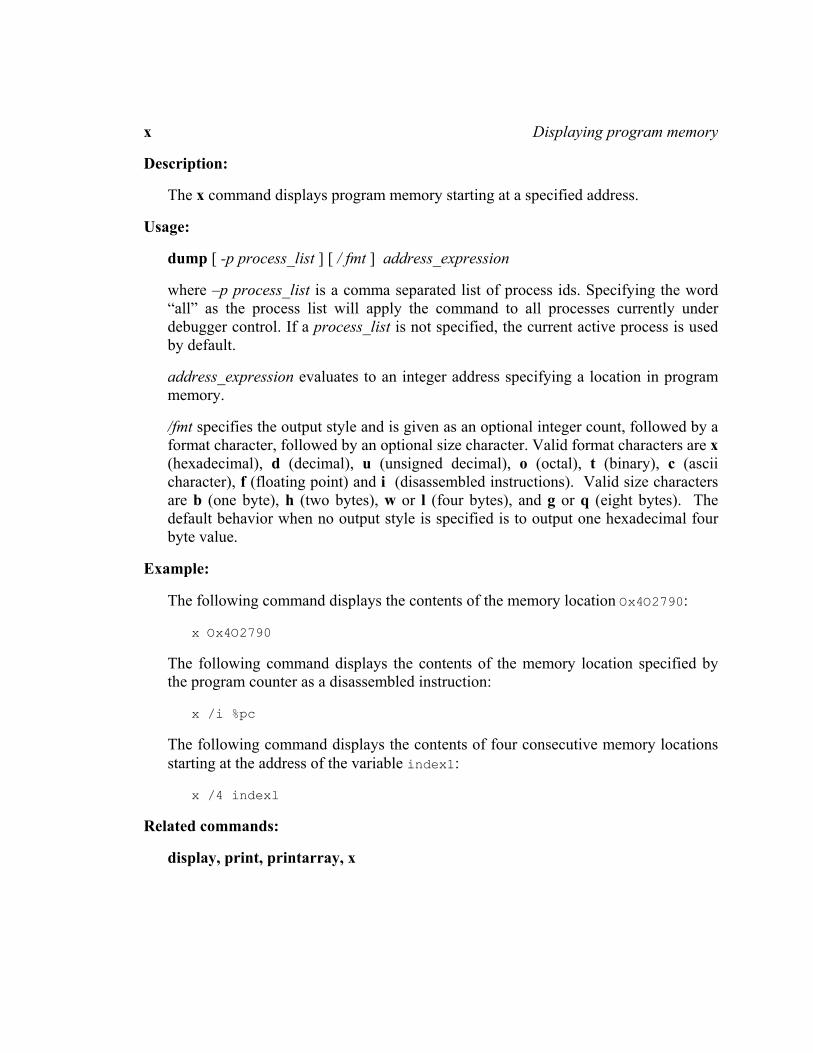
x Displaying program memory
Description:
The x command displays program memory starting at a specified address.
Usage:
dump [ -p process_list ] [ / fmt ] address_expression
where –p process_list is a comma separated list of process ids. Specifying the word “all” as the process list will apply the command to all processes currently under debugger control. If a process_list is not specified, the current active process is used by default.
address_expression evaluates to an integer address specifying a location in program memory.
/fmt specifies the output style and is given as an optional integer count, followed by a format character, followed by an optional size character. Valid format characters are x (hexadecimal), d (decimal), u (unsigned decimal), o (octal), t (binary), c (ascii character), f (floating point) and i (disassembled instructions). Valid size characters are b (one byte), h (two bytes), w or l (four bytes), and g or q (eight bytes). The default behavior when no output style is specified is to output one hexadecimal four byte value.
Example:
The following command displays the contents of the memory location Ox4O2790:
x Ox4O2790
The following command displays the contents of the memory location specified by the program counter as a disassembled instruction:
x /i %pc
The following command displays the contents of four consecutive memory locations starting at the address of the variable index1:
x /4 indexl
Related commands:
display, print, printarray, x
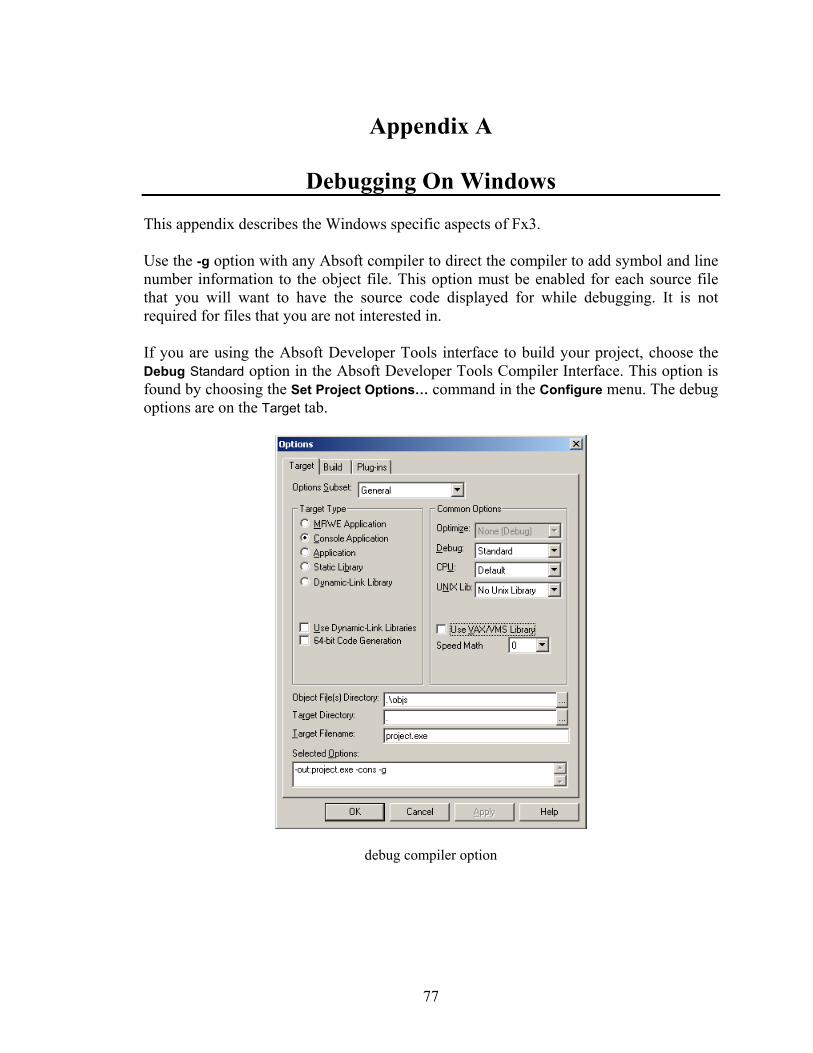
Appendix A
Debugging On Windows This appendix describes the Windows specific aspects of Fx3. Use the -g option with any Absoft compiler to direct the compiler to add symbol and line number information to the object file. This option must be enabled for each source file that you will want to have the source code displayed for while debugging. It is not required for files that you are not interested in. If you are using the Absoft Developer Tools interface to build your project, choose the Debug Standard option in the Absoft Developer Tools Compiler Interface. This option is found by choosing the Set Project Options… command in the Configure menu. The debug options are on the Target tab.
debug compiler option
77

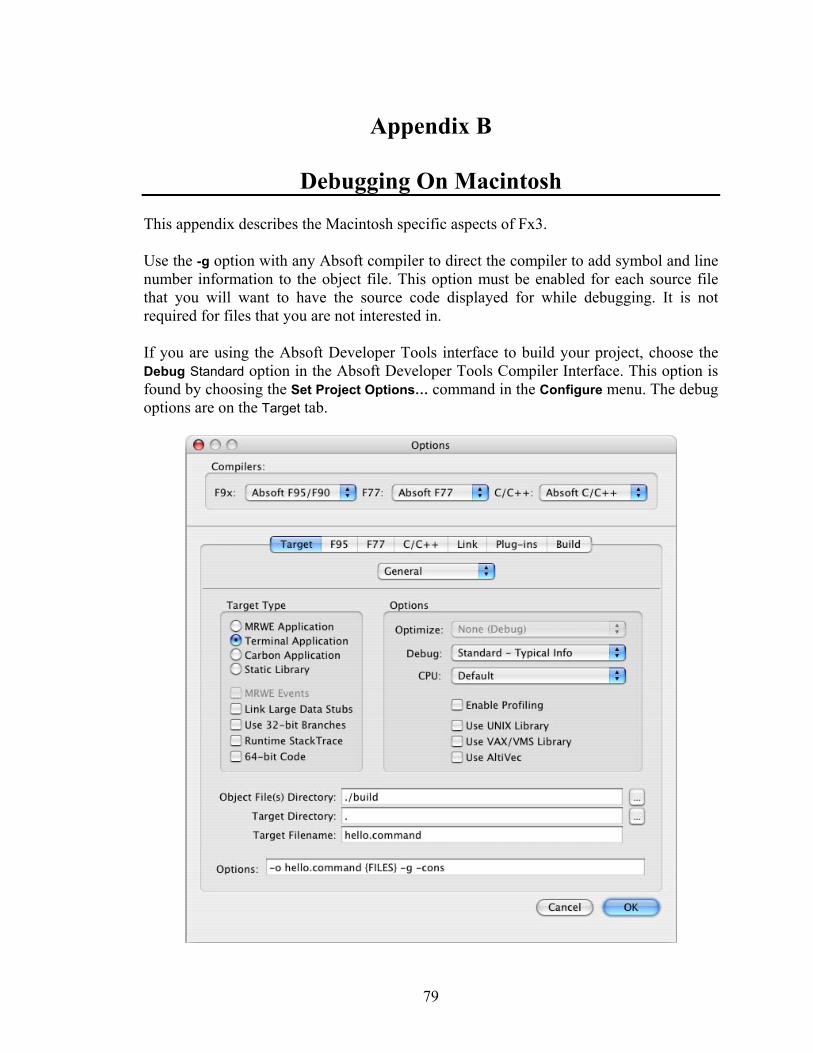
Appendix B
Debugging On Macintosh This appendix describes the Macintosh specific aspects of Fx3. Use the -g option with any Absoft compiler to direct the compiler to add symbol and line number information to the object file. This option must be enabled for each source file that you will want to have the source code displayed for while debugging. It is not required for files that you are not interested in. If you are using the Absoft Developer Tools interface to build your project, choose the Debug Standard option in the Absoft Developer Tools Compiler Interface. This option is found by choosing the Set Project Options… command in the Configure menu. The debug options are on the Target tab.
79

81
Appendix C
Debugging On Linux This appendix describes the Linux specific aspects of Fx3. Use the -g option with any Absoft compiler to direct the compiler to add symbol and line number information to the object file. This option must be enabled for each source file that you will want to have the source code displayed for while debugging. It is not required for files that you are not interested in.

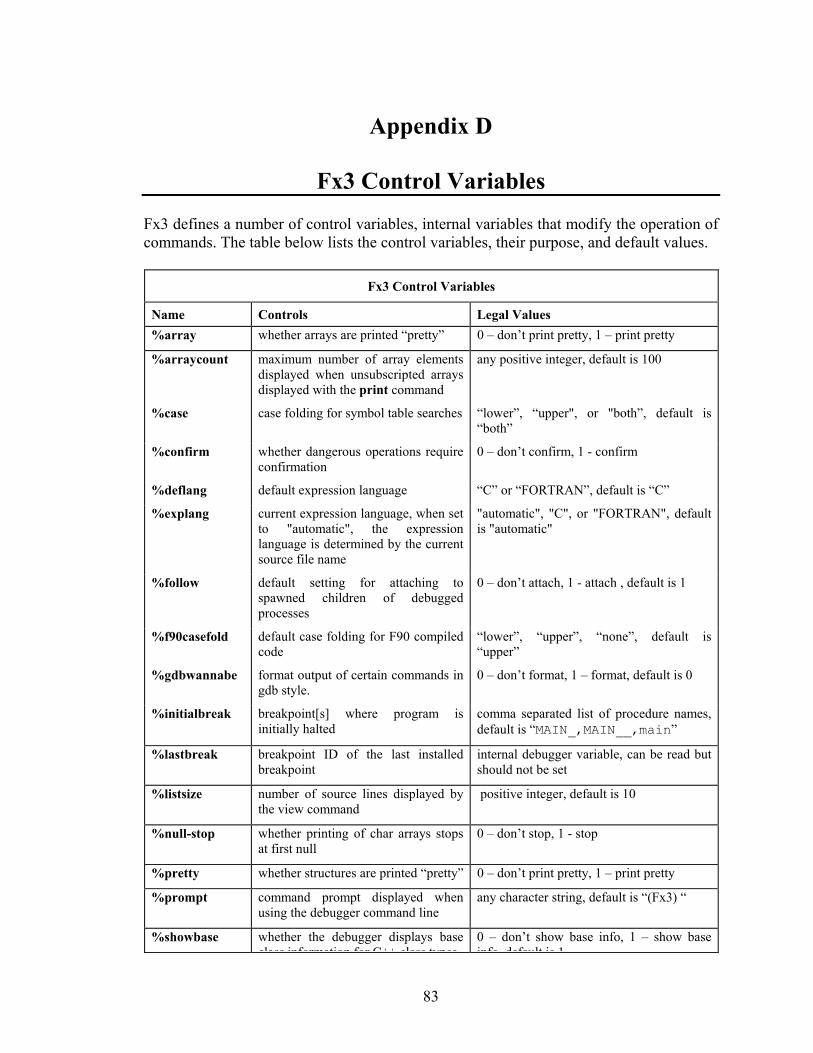
83
Appendix D
Fx3 Control Variables Fx3 defines a number of control variables, internal variables that modify the operation of commands. The table below lists the control variables, their purpose, and default values.
Fx3 Control Variables
Name Controls Legal Values %array whether arrays are printed “pretty” 0 – don’t print pretty, 1 – print pretty
%arraycount maximum number of array elements displayed when unsubscripted arrays displayed with the print command
any positive integer, default is 100
%case case folding for symbol table searches “lower”, “upper", or "both”, default is “both”
%confirm whether dangerous operations require confirmation
0 – don’t confirm, 1 - confirm
%deflang default expression language “C” or “FORTRAN”, default is “C”
%explang current expression language, when set to "automatic", the expression language is determined by the current source file name
"automatic", "C", or "FORTRAN", default is "automatic"
%follow default setting for attaching to spawned children of debugged processes
0 – don’t attach, 1 - attach , default is 1
%f90casefold default case folding for F90 compiled code
“lower”, “upper”, “none”, default is “upper”
%gdbwannabe format output of certain commands in gdb style.
0 – don’t format, 1 – format, default is 0
%initialbreak breakpoint[s] where program is initially halted
comma separated list of procedure names, default is “MAIN_,MAIN__,main”
%lastbreak breakpoint ID of the last installed breakpoint
internal debugger variable, can be read but should not be set
%listsize number of source lines displayed by the view command
positive integer, default is 10
%null-stop whether printing of char arrays stops at first null
0 – don’t stop, 1 - stop
%pretty whether structures are printed “pretty” 0 – don’t print pretty, 1 – print pretty
%prompt command prompt displayed when using the debugger command line
any character string, default is “(Fx3) “
%showbase whether the debugger displays base class information for C++ class types
0 – don’t show base info, 1 – show base info default is 1
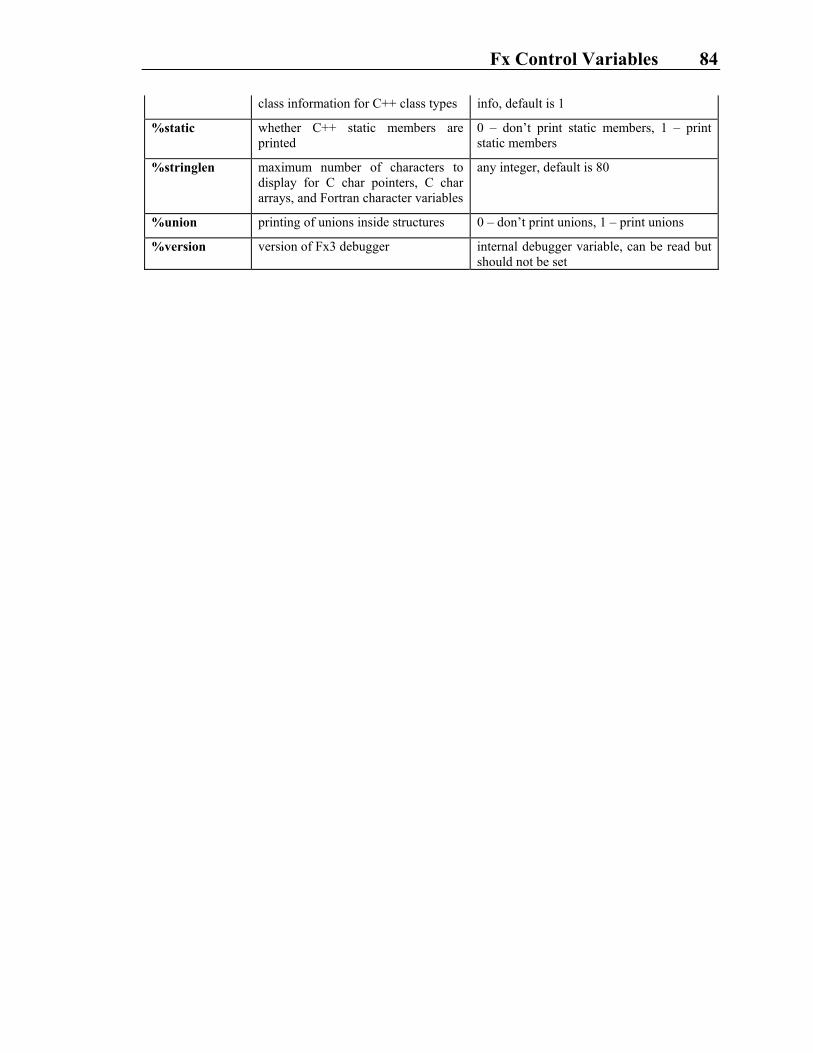
Fx Control Variables 84
class information for C++ class types info, default is 1
%static whether C++ static members are printed
0 – don’t print static members, 1 – print static members
%stringlen maximum number of characters to display for C char pointers, C char arrays, and Fortran character variables
any integer, default is 80
%union printing of unions inside structures 0 – don’t print unions, 1 – print unions
%version version of Fx3 debugger internal debugger variable, can be read but should not be set
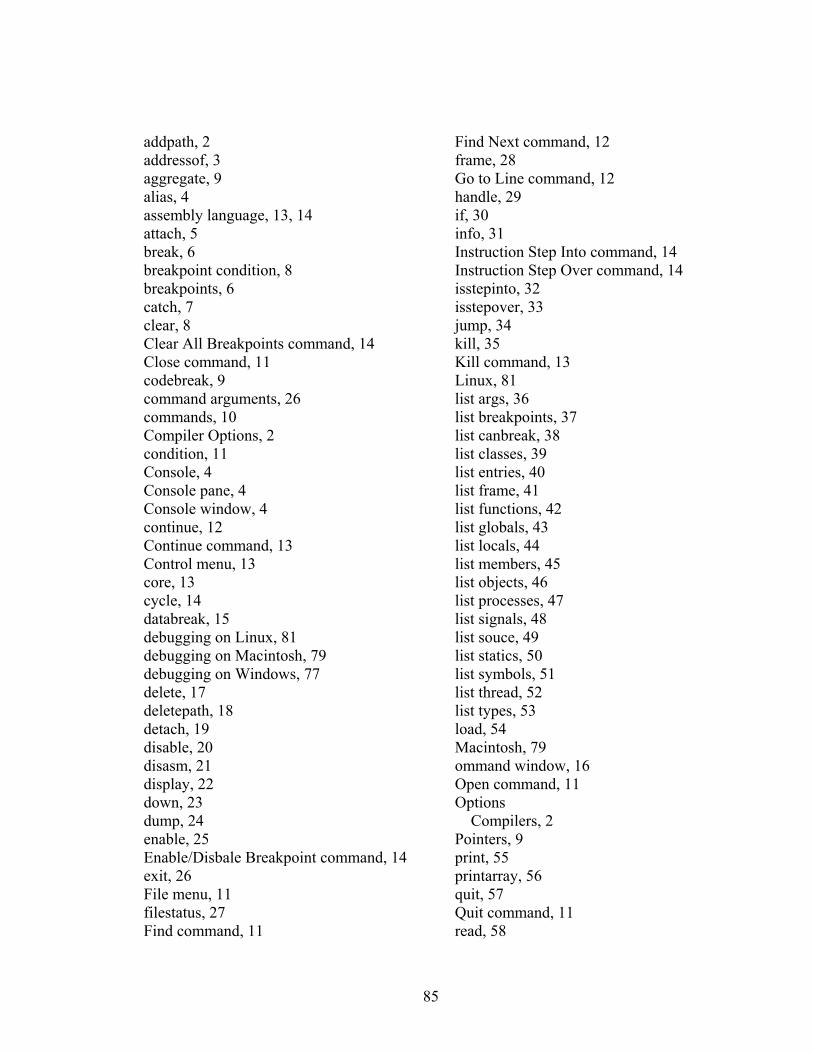
85
addpath, 2 addressof, 3 aggregate, 9 alias, 4 assembly language, 13, 14 attach, 5 break, 6 breakpoint condition, 8 breakpoints, 6 catch, 7 clear, 8 Clear All Breakpoints command, 14 Close command, 11 codebreak, 9 command arguments, 26 commands, 10 Compiler Options, 2 condition, 11 Console, 4 Console pane, 4 Console window, 4 continue, 12 Continue command, 13 Control menu, 13 core, 13 cycle, 14 databreak, 15 debugging on Linux, 81 debugging on Macintosh, 79 debugging on Windows, 77 delete, 17 deletepath, 18 detach, 19 disable, 20 disasm, 21 display, 22 down, 23 dump, 24 enable, 25 Enable/Disbale Breakpoint command, 14 exit, 26 File menu, 11 filestatus, 27 Find command, 11
Find Next command, 12 frame, 28 Go to Line command, 12 handle, 29 if, 30 info, 31 Instruction Step Into command, 14 Instruction Step Over command, 14 isstepinto, 32 isstepover, 33 jump, 34 kill, 35 Kill command, 13 Linux, 81 list args, 36 list breakpoints, 37 list canbreak, 38 list classes, 39 list entries, 40 list frame, 41 list functions, 42 list globals, 43 list locals, 44 list members, 45 list objects, 46 list processes, 47 list signals, 48 list souce, 49 list statics, 50 list symbols, 51 list thread, 52 list types, 53 load, 54 Macintosh, 79 ommand window, 16 Open command, 11 Options
Compilers, 2 Pointers, 9 print, 55 printarray, 56 quit, 57 Quit command, 11 read, 58
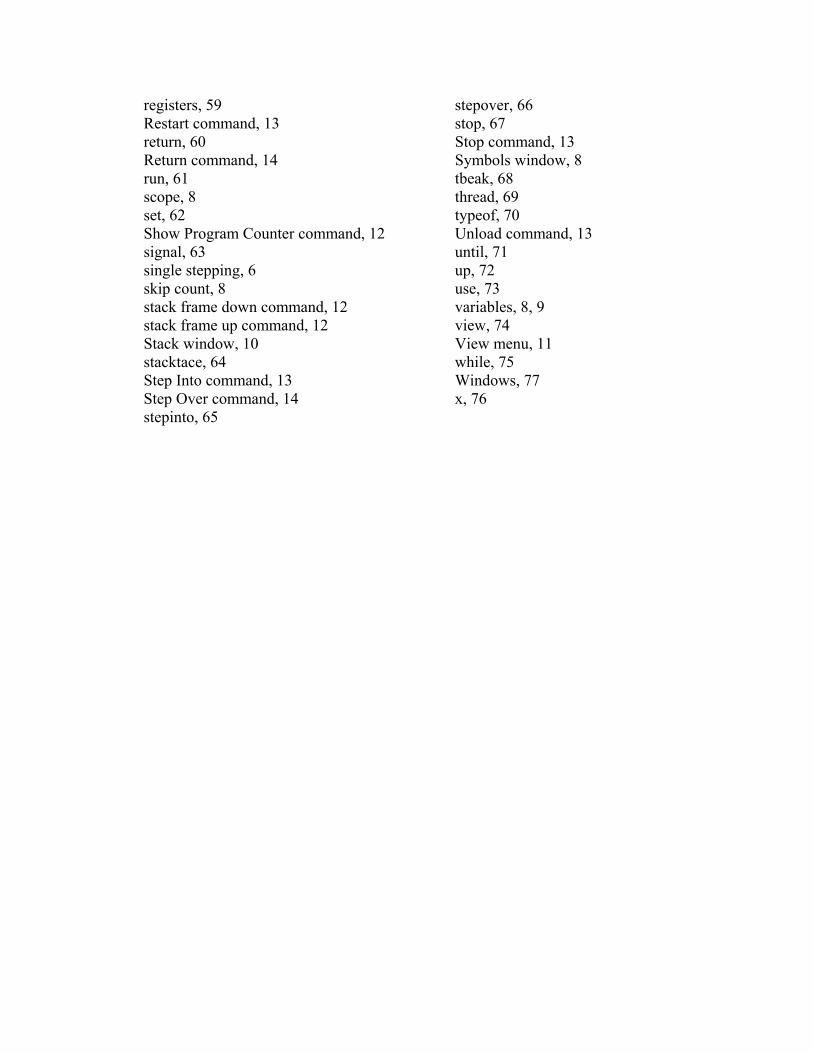
registers, 59 Restart command, 13 return, 60 Return command, 14 run, 61 scope, 8 set, 62 Show Program Counter command, 12 signal, 63 single stepping, 6 skip count, 8 stack frame down command, 12 stack frame up command, 12 Stack window, 10 stacktace, 64 Step Into command, 13 Step Over command, 14 stepinto, 65
stepover, 66 stop, 67 Stop command, 13 Symbols window, 8 tbeak, 68 thread, 69 typeof, 70 Unload command, 13 until, 71 up, 72 use, 73 variables, 8, 9 view, 74 View menu, 11 while, 75 Windows, 77 x, 76