Embed Size (px)
Citation preview

Absa Single Manager : Fund Map
December 2010

Absa Single Manager : Fund Map
FIXED INTEREST EQUITY
INVESTMENT OBJECTIVE Duration Capital RISK TERM
90 day Bankers Acceptance Rate L 3 mnths +
Tax efficiency (See Fund Fact Sheet) L 6 mnths +
1 Year Fixed Deposit L ↔ M 6 mnths +
BESA All Bond Index L ↔ M 24 mnths +
CPI + 3% p.a. 36 month rolling L 2 yrs +
CPI + 4% p.a. 36 month rolling L ↔ M 3 yrs +
CPI + 5% p.a. 5 yr rolling M 4 yrs +
CPI + 6% p.a. 5 yr rolling M ↔ H 5 yrs +
FTSE/JSE SA Listed Prop. Index M ↔ H 5 yrs +
FTSE/JSE All Share Index H 5 yrs +
FTSE/JSE All Share Index H 5 yrs +
FTSE/JSE Top 40 Index H 5 yrs +
Currencies 90 Day Deposit Rate L ↔ M *** open
Citigroup World Gov. Bond 3-7 yrs M 3 yrs +
MSCI World Index Dollars H 5 yrs +
x x
M Q BI
M
10 - 20
10 - 50
40 - 65
75 - 95
75 - 95
75 - 95
LOW MED HIGH
M
Q
x x
45 - 75
LOW MED HIGH
Q
Q
BI
BI
Q
BI
75 - 95
75 - 95
BI
FIXED INTEREST
Absa Money Market
Absa Dividend Income *
Absa Income Enhancer *
Absa Bond
ASSET ALLOCATION
Absa Inflation Beater
Absa Absolute **
Absa Balanced*
Absa Managed
Absa Currency Income
Funds ****
Absa Global Bond
Absa International
Absa Property **
Absa General
Absa Select
Absa Rand Protector
OFFSHORE #
EQUITY
INVESTMENT OBJECTIVE - Targeted funds benchmark aligned to the Funds mandate, risk profile and term - merely a guide. Refer to Fund Fact Sheet for additional info.
DURATION -Sensitivity to interest rate movement of the underlying fixed interest instruments | INCOME based. Distribution frequency M=Monthly Q=Quarterly BI=Bi-annually
CAPITAL - Risk / exposure to equity securities | GROWTH based. Bands represent the funds exposure to underlying equity instruments.
RISK - Funds overall risk rating | Low (L) to High (H) - refer to relevant fund fact sheet
TERM - In-line with product mandate & specific investment objective. In-line with industry guidelines based on sector.
Equity Funds distribute bi-annually baring the Property Fund which is quarterly.
* Underlying capital secure however valuations may fluctuate inline with unit price (NAV) and fund mandate.
** Quarterly distributions generated from rental income and not from fixed interest instruments.
*** Currency income funds benchmarked against respective deposits. Used for short to long term currency hedge (Dollar, Euro, Pound).
# Offshore Funds subject to capital fluctuation inline with unit price (NAV) - currency & underlying asset.
DISCLAIMER - The Single Manager Fund Map provides factual insight into the funds particular mandate and management parameters, conceptualizing Absa Single Managers product offering into a structured
framework. The Fund Fact Sheet must be consulted for further detailed and up-to date information as this is a static overview for illustration purposes only as it does NOT provide financial advice.
The Map doesn't constitute any recommendation or proposal to enter into any transaction. AFM does not accept any liability, responsibility for any loss, damage or expense whatsoever direct or indirect or
consequential incurred in relying on the information or in the use thereof. Any person making use of the information does so entirely at their own accord. All information is subject to change without notice.
Q
10 - 20
M Q BIBI M Q BI
M Q BI
10 - 95

Absa Money Market Fund 31 December 2010
Fund objectives
This fund aims to deliver a higher level of income compared to fixed deposits
and call deposits over the short to long term within stringent credit and
liquidity parameters, while protecting the initial capital and providing
immediate liquidity. The Fund achieves this by investing in high quality (of at
least A1 rated) short-term money market instruments. The Fund has a
maximum weighted term of 90 days.
Fund facts
Industry category Domestic - Fixed Income -Money Market
Performance target STeFI Composite Index
Inception date 2 May 1997
Fund size R 66,7 billion
JSE code ABMM
Fund manager Rehana Rungasamy - BCom, SAIFM
Asset management
company
Absa Asset Management (Pty) Ltd
Fund details
Minimum lump sum
investment
R 100 000
Minimum monthly
debit order
R 1 000
Income declaration The last day of every month
Income distribution The first day of the following month
Performance: total returns to 31 December 2010 (%)
Term
Absa
Money Market
Fund
Sector
Average Rank
Since inception 10.72 9.58 1/22
1 year 6.76 6.87 15/22
3 years 9.06 9.25 17/21
5 years 8.82 8.88 14/18
* Figures are annualised Source: Morningstar
Fees and total expense ratio
Initial fees: Absa Fund Managers: 0.16% (VAT incl.)
Adviser: 0.24% (VAT incl.)
Annual management fee**: 0.57% (VAT incl.)
Total expense ratio: 0.58%
Low Low-Medium Medium Medium-High High
3 Months + 6 Months + 2 Years + 3 Years + 5 Years +
Risk profile and advisable minimum term
X
X
Absa Money Market Fund vs Benchmark
Absa Bank 20.37
Firstrand Limited 4.20
Investec Bank 6.30
Nedbank 28.50
Rand Merchant Bank 3.71
Republic of SA 4.57
Standard Bank 29.29
Major exposures (%)
Duration analysis
Average nominal yield for the month (annualised) 5.79%
Nominal Yield
Absa Money Market Fund / page 1 of 2
31 January 2010 0.60
28 February 2010 0.54
31 March 2010 0.59
30 April 2010 0.55
31 May 2010 0.56
30 June 2010 0.55
31 July 2010 0.56
31 August 2010 0.56
30 September 2010 0.52
31 October 2010 0.53
30 November 2010 0.50
31 December 2010 0.49
Total 6.55
Monthly distributions (c.p.u)
100120140160180200220240260280
Feb-2
000
No
v-2
000
Aug
-2001
May-2
002
Mar-
2003
Dec-2
003
Sep
-2004
Jun
-2005
Mar-
2006
Dec-2
006
Sep
-2007
Jun
-2008
Mar-
2009
Dec-2
009
Sep
-2010
Jun
-2011
ABSA Money Market STeFI Composite Index
5.20%
1.69%
14.56%
73.92%
4.63%
9 - 12 Months
6 - 9 Months
3 - 6 Months
0 - 3 Months
Cash

Fund commentary
Consumer Price inflation (CPI) for the month of November accelerated slightly to 3.5% from 3.4% in October emanating from some
upside risk in food prices. This dampened the hopes for further monetary policy easing next year.
Bond yields came under pressure in the middle of the month on the back of the sell-off in US Treasuries, but recovered towards the
end of the month as year-end buying supported bond yields. The yield on the benchmark R157 bond closed 10 basis points lower at
7.31%
The market now expects the Monetary Policy Committee Bank to keep the Repo rate at 5.5% in 2011. The money market yield curve
thus remained flat over the month. The 1 year NCD rate closed at 5.875%, while the 3 month NCD rate closed unchanged at 5.55%.
DISCLAIMER
The Absa Money Market Fund is a low risk fund. The maximum initial charge is 0.40% (incl. VAT) of consideration received and will include a maximum
of 0.24% (incl. VAT) payable for commissions and incentives. An annual service charge of 0.57% (incl. VAT) will be calculated and accrued daily
against the assets of the fund. **The annual management fee does not include the financial adviser‟s ongoing fee. This fund has a maximum weighted
term to maturity of 90 days. The Absa Money Market Fund requires a minimum opening balance of R100 000. The price of each unit is aimed at a con-
stant value (R1). The total return to the investor is primarily made up of interest received but, may also include any gain or loss made on any particular
instrument. The effect will be an increase or decrease of the daily yield and in extreme circumstances there can be a reduction of the capital value of
the fund. Past performance is not necessarily a guide to future performance. Income is distributed monthly and any income may be paid out into an
account as nominated by the investor or be represented by additional units. All requests for transactions received on or before 16:00 every day will be
traded at ruling prices and valued after 16:00 on that day. Unit trusts are traded at ruling prices and can engage in borrowing and scrip lending. The
yield is calculated using an annualized seven day rolling average as at 31/12/2010. Figures quoted are from Morningstar. This product is not for sale to
USA persons. The Total Expense Ratio (TER) is expressed as an annualised percentage of the charges, levies and fees incurred by the portfolio re-
lated to its management, for the period from 1 October 2009 to 30 September 2010 against the average NAV of the portfolio over this period. A higher
TER does not necessarily imply a poor return, nor does a lower TER imply a good return. The current TER cannot be regarded as an indication of fu-
ture TER's. Consult the Management Company for details. Absa Fund Managers is a member of the Association for Savings and Investment SA.
Absa Money Market Fund 31 December 2010
Contact details
Absa Fund Managers Limited Contact Centre: 0860 111 456 / Fax: (011) 480 5440
Reg no 1991/000881/06 Email: [email protected] / Website: www.absainvestments.co.za
Authorised Financial Services Provide - Reg No 330 Trustees
Absa Investment Campus, 65 Empire Road, Parktown, 2193 Standard Bank Trustees Services
PO Box 6115, Johannesburg, 2000 PO Box 54, Cape Town, 8000
Absa Money Market Fund / page 2 of 2
Absa Dividend Income Fund 31 December 2010
Fund objectives
The fund aims to offer investors short to medium term competitive after tax
return, capital preservation and liquidity. The fund invests in assets that
deliver a high level of income, primarily in the form of dividends but may
include some interest.
Fund facts
Industry category Domestic - Fixed Interest -
Varied Specialist
Performance target 50% of Prime
Inception date 31 July 2002
Fund size R 7,9 billion
JSE code ABFI
Fund manager Greg Kettles - B Com (Hons), CA(SA),
CFA
Asset management
company
Absa Asset Management (Pty) Ltd
Fund details
Minimum lump sum
investment
R 50 000
Minimum monthly
debit order
R 2 000
Income declaration 31 March, 30 June, 30 September
& 31 December
Income distribution 1 April, 1 July, 1 October & 1 January
Major exposures
Performance: total returns to 31 December 2010 (%)
Term Absa Dividend
Income Fund*
Since inception 6.61
1 year 3.93
3 years 6.27
5 years 6.26
* Figures are annualised Source: Morningstar
Income distributions
Quarter ending Distribution c.p.u NAV
31 March 2010 1.15 101.2680
30 June 2010 0.79 101.1147
30 September 2010 1.01 101.2851
31 December 2010 0.88 101.0996
Fees and total expense ratio
Initial fees: Absa Fund Managers: 0.23% (VAT incl.)
Adviser: 0 - 0.34% (VAT incl.)
Annual management fee**: 1.71% (VAT incl.)
Total expense ratio: 1.72%
Low Low-Medium Medium Medium-High High
3 Months + 6 Months + 2 Years + 3 Years + 5 Years +
Risk profile and advisable minimum term
X
X
Absa Dividend Income Fund yield (%)
Note : The NAV for the Absa Dividend Income Fund as at 31 December
2010: 101.0996 c.p.u
Absa Dividend Income Fund / page 1 of 2
3%
33%
17%
17%
30%
Absa Bank Firstrand Bank Investec Limited
Nedbank Limited Standard Bank
0
2
4
6
8
10
12
De
c-0
2
Jun
-03
De
c-0
3
Jun
-04
De
c-0
4
Jun
-05
De
c-0
5
Jun
-06
De
c-0
6
Jun
-07
De
c-0
7
Jun
-08
De
c-0
8
Jun
-09
De
c-0
9
Jun
-10
De
c-1
0
Jun
-11
De
c-1
1
Absa Dividend Income Fund

Investment universe
The fund primarily invests in instruments issued and/or underwritten by banks and similar financial institutions such as the large life
insurers. The primary returns received from the instruments are dividends. The fund is permitted to invest in instruments that are
linked to interest rate cycles in the market.
Key features
The fund offers a regular income in the form of dividends as opposed to interest or rental income.
The fund will have a similar risk profile to that of money market unit trusts, however, it will aim to deliver a better net after tax yield.
The fund will to a large extent track the local interest rate cycles.
The risk profile of the fund is low.
Why invest in this fund?
If you wish to receive a better net after tax yield in a money market type investment offering liquidity and capital protection, the Absa
Dividend Income Fund is your answer.
DISCLAIMER
The Absa Dividend Income Fund is a low risk fund. The maximum initial charge is 0.57% (incl. VAT) of consideration received and will include a maxi-
mum of 0.34% (incl. VAT) payable for commissions and incentives. An annual service charge of 1.71% (incl. VAT) against the assets of the fund will be
calculated and accrued daily. **The annual management fee includes the financial adviser‟s ongoing fee of 0.285% (incl. VAT). The investor may in-
struct Absa Fund Managers in writing at any time to stop the ongoing adviser fee. The Absa Dividend Income Fund requires a minimum balance of R50
000. The primary objective of the Fund is to invest in assets that deliver a high level of income, primarily in the form of dividends but including some
interest, and are consistent with capital preservation and liquidity. Capital gains will be of an incidental nature. Forward pricing is used. Unit trust prices
are calculated on a net asset value basis, which is the total value of all assets in the portfolio including any income accrual and less any permissible
deductions from the portfolio. Income is distributed quarterly and any income will be represented by additional units. Past performance is not necessar-
ily a guide to future performance. All requests for transactions received on or before 16:00 every day will be traded at ruling prices and valued after
16:00 on that day. Unit trusts are generally medium to long-term investments. Figures quoted are from Morningstar, for the period ending 31/12/2010.
Where no figures appear this is due to the fund not being in existence over the specified period. Unit trust portfolios maybe affected by uncertainties
such as changes in government and taxation policies and other regulatory developments, the effect of which could result in the closure of unit trust
portfolios for new investments. The tax-exempt status of dividend income may at sometime in the future be changed by SARS. This product is not for
sale to USA persons. The Total Expense Ratio (TER) is expressed as an annualised percentage of the charges, levies and fees incurred by the portfo-
lio related to its management, for the period from 1 October 2009 to 30 September 2010 against the average NAV of the portfol io over this period. A
higher TER does not necessarily imply a poor return, nor does a lower TER imply a good return. The current TER cannot be regarded as an indication
of future TER's. Consult the Management Company for details. Absa Fund Managers is a registered member of the Association for Savings and
Investment SA.
Absa Dividend Income Fund 31 December 2010
Contact details
Absa Fund Managers Limited Contact Centre: 0860 111 456 / Fax: (011) 480 5440
Reg no 1991/000881/06 Email: [email protected] / Website: www.absainvestments.co.za
Authorised Financial Services Provide - Reg No 330 Trustees
Absa Investment Campus, 65 Empire Road, Parktown, 2193 Standard Bank Trustees Services
PO Box 6115, Johannesburg, 2000 PO Box 54, Cape Town, 8000
Absa Dividend Income Fund / page 2 of 2

*Index performance of Fund & Benchmark based to 100 at April 2004
Absa Income Enhancer Fund 31 December 2010
Fund objectives
The Absa Income Enhancer aims to provide investors with a high interest
income return over the short to medium term. The investable universe of the
fund will include interest bearing and non-equity securities, including but not
limited to bonds, cash deposits and money market instruments. Modified
duration of the fund will not exceed 2 years.
Fund facts
Industry category Domestic - Fixed Interest -Varied
Specialist
Performance target 1 year Fixed Deposit Index
Inception date 1 April 1993
Fund size R 1,5 billion
JSE code ABSC
Fund manager Rehana Rungasamy - BCom, SAIFM
Asset management
company
Absa Asset Management (Pty) Ltd
Fund details
Minimum lump sum R 10 000
Minimum monthly R 500
Income declaration The last day of every month
Income distribution The 2nd working day of the following
month
Duration analysis
Cumulative performance
Performance: total returns to 31 December 2010 (%)
Term Absa Income Enhancer
Fund
Since inception 11.39
1 year 7.17 *
3 years 9.64
5 years 8.82
* Figures are annualised Source: Morningstar
Fees and total expense ratio
Initial fees: Absa Fund Managers: 0% (VAT incl.)
Adviser: 0 - 1.14% (VAT incl.)
Annual management fee**: 0.75% (VAT incl.)
Total expense ratio: 0.76%
Low Low-Medium Medium Medium-High High
3 Months + 6 Months + 2 Years + 3 Years + 5 Years +
Risk profile and advisable minimum term
X
X
Absa Income Enhancer Fund / page 1 of 2
100
110
120
130
140
150
160
170
180
Ap
r-0
4
Oct
-04
Ap
r-0
5
Oct
-05
Ap
r-0
6
Oct
-06
Ap
r-0
7
Oct
-07
Ap
r-0
8
Oct
-08
Ap
r-0
9
Oct
-09
Ap
r-1
0
Oct
-10
Ap
r-1
1
Absa Income Enhancer Fund
Risk statistics
Modified duration 0.14
Date c.p.u
Nominal
distribution as a %
of clean price
Monthly %
clean price
movement
Jan 2010 0.69 0.64% 0.03%
Feb 2010 0.62 0.57% 0.01%
Mar 2010 0.69 0.63% 0.07%
Apr 2010 0.64 0.59% -0.02%
May 2010 0.66 0.61% -0.01%
Jun 2010 0.61 0.56% 0.03%
Jul 2010 0.63 0.58% 0.04%
Aug 2010 0.61 0.56% 0.07%
Sept 2010 0.56 0.51% 0.03%
Oct 2010 0.55 0.51% 0.01%
Nov 2010 0.53 0.49% 0.01%
Dec 2010 0.53 0.49% -0.04%
Total 7.32 6.73% 0.23%
Analysis of Absa Income Enhancer Fund’s 1 year return
1 year income return on the reinvestment of
monthly interest 6.94%
1 year capital return of the clean price 0.23%
Absa Income Enhancer Fund 7.17% *
1.40%
0.00%
19.74%
76.45%
2.41%
9 - 12 Months
6 - 9 Months
3 - 6 Months
0 - 3 Months
Cash

Fund commentary
Consumer Price inflation (CPI) for the month of November accelerated slightly to 3.5% from 3.4% in October emanating from some
upside risk in food prices. This dampened the hopes for further monetary policy easing next year.
Bond yields came under pressure in the middle of the month on the back of the sell-off in US Treasuries, but recovered towards the
end of the month as year-end buying supported bond yields. The yield on the benchmark R157 bond closed 10 basis points lower at
7.31%
The market now expects the Monetary Policy Committee Bank to keep the Repo rate at 5.5% in 2011. The money market yield curve
thus remained flat over the month. The 1 year NCD rate closed at 5.875%, while the 3 month NCD rate closed unchanged at 5.55%.
DISCLAIMER
The Absa Income Enhancer Fund is a low risk fund. No initial charge is levied though investments through intermediaries could include a maximum of
1.14% (incl. VAT) payable for commissions and incentives. An annual service charge of 0.75% (incl.VAT) against the assets of the Fund will be calcu-
lated and accrued daily. **The annual management fee includes the financial adviser‟s ongoing fee of 0.17% (incl. VAT). The investor may instruct
Absa Fund Managers in writing at any time to stop the ongoing adviser fee. The Absa Income Enhancer Fund requires a minimum balance of R10 000.
Collective Investment Schemes in Securities (Unit Trusts) are generally medium to long term investments. The value of participatory interests (units)
may go down as well as up and past performance is not necessarily a guide to the future. Forward pricing is used. Unit trust prices are calculated on a
net asset value basis, which is the total value of all assets in the portfolio including any income accrual and less any permissible deductions from the
portfolio. Income is distributed monthly and any income may be paid out into an account as nominated by the investor or be represented by additional
units. All requests for transactions received on or before 16:00 every day will be traded at ruling prices and valued after 16:00 on that day. Unit trusts
are traded at ruling prices and can engage in borrowing and scrip lending. This Fund may be closed to new investments. The Fund Manager may bor-
row up to 10% of the market value of the portfolio to bridge insufficient liquidity. Fluctuations or movements in exchange rates may cause the value of
underlying international investments to go up or down. Foreign interest and dividends as well as foreign currency movements affecting capital may be
fully taxable under current legislation. Figures quoted are from Morningstar, for the period ending 31/12/2010, using NAV-NAV prices, with income
distributions reinvested. This product is not for sale to USA persons. The Total Expense Ratio (TER) is expressed as an annualised percentage of the
charges, levies and fees incurred by the portfolio related to its management, for the period from 1 October 2009 to 30 September 2010 against the
average NAV of the portfolio over this period. A higher TER does not necessarily imply a poor return, nor does a lower TER imply a good return. The
current TER cannot be regarded as an indication of future TER's. Consult the Management Company for details. Absa Fund Managers is a member of
the Association for Savings and Investment SA.
Absa Income Enhancer Fund 31 December 2010
Contact details
Absa Fund Managers Limited Contact Centre: 0860 111 456 / Fax: (011) 480 5440
Reg no 1991/000881/06 Email: [email protected] / Website: www.absainvestments.co.za
Authorised Financial Services Provide - Reg No 330 Trustees
Absa Investment Campus, 65 Empire Road, Parktown, 2193 Standard Bank Trustees Services
PO Box 6115, Johannesburg, 2000 PO Box 54, Cape Town, 8000
Absa Income Enhancer Fund / page 2 of 2

Fund objectives
The fund aims to offer investors medium to long-term return, capital and
income growth by exploiting anticipated changes in the pattern of interest
rates. The funds invests in interest bearing securities of differing terms to
maturity, taking into account changes in interest rates, credit risk and liquidity.
Fund facts
Industry category Domestic - Fixed Income - Bond
Performance target BESA All Bond Index
Inception date 14 May 2002
Fund size R 69 million
JSE code ABBA
Fund manager Errol Shear - B.Bus.Sc. (Finance) (Hon),
CA (SA), CFA
Asset management
Company
Absa Asset Management (Pty) Ltd
*Index performance of Fund & Benchmark based to 100 at inception of fund
Absa Bond Fund 31 December 2010
Top holdings (%)
Absa Bank Ltd Bond 5.86
First Rand Bank Ltd Bond 7.86
RSA R157 13.5% 150915 20.47
RSA R186 10.5% 211226 11.72
RSA R201 8.7% 211214 6.14
RSA R203 8.2% 150917 4.53
RSA R204 8.0% 211218 4.35
RSA R206 7.5% 150114 3.06
RSA R207 7.2% 150120 5.68
RSA R208 6.7% 310321 2.67
Performance: total returns to 31 December 2010 (%)
Term
Absa
Bond
Fund
Benchmark Sector
Average Rank
Since inception 10.58 8.40 10.98 11/13
1 year 13.41 14.97 14.70 14/16
3 years 8.35 10.01 10.12 16/16
5 years 6.74 7.91 8.03 15/15
*Figures are annualised Source: Morningstar
Fees and total expense ratio
Initial fees: Absa Fund Managers: 0.57% (VAT incl.)
Adviser: 0 - 0.57% (VAT incl.)
Annual management fee**: 0.86% (VAT incl.)
Total expense ratio: 0.99 %
Asset allocation
Cumulative performance since inception*
Risk statistics
Additional Information Fund since inception
Number of positive months 69/103
Maximum rolling 3 month gain 10.50%
Maximum rolling 3 month loss -5.38%
Risk profile and advisable minimum term
Low Low-Medium Medium Medium-High High
3 Months + 6 Months + 2 Years + 3 Years + 5 Years +
X
X
Income distributions
Income distribution for the 3 months ended 31 Mar 2010 2.51 c.p.u
Income distribution for the 3 months ended 30 Jun 2010 2.16 c.p.u
Income distribution for the 3 months ended 30 Sep 2010 2.46 c.p.u
Income distribution for the 3 months ended 31 Dec 2010 2.17 c.p.u
Fund details
Minimum lump sum
investment R 1 000
Minimum monthly
debit order R 500
Income declaration 31 March, 30 June, 30 September &
31 December
Income distribution 15 April, 15 July, 15 October &
15 January
Absa Bond Fund / page 1 of 2
5.60%
94.40%
Cash
Bonds
100
120
140
160
180
200
220
240
260
Ju
n-0
2
No
v-0
2
Ap
r-0
3
Se
p-0
3
Fe
b-0
4
Ju
l-0
4
De
c-0
4
Ma
y-0
5
Oct-
05
Ma
r-0
6
Au
g-0
6
Ja
n-0
7
Ju
n-0
7
No
v-0
7
Ap
r-0
8
Se
p-0
8
Fe
b-0
9
Ju
l-0
9
De
c-0
9
Ma
y-1
0
Oct-
10
Ma
r-1
1
Au
g-1
1
Absa Bond Fund BESA All Bond Index

Fund commentary
The ALBI was strong in 2010, and gained a further 1.73% in December, with gains coming across all durations of the yield curve. The 1 to 3 year area
gained 0.62% in the month, the3 to 7 year area 0.62%, the 7 to 12 year area1.93% and the 12+ segment 2.14%. The yield on the benchmark R157
decreased from 7.46% at the beginning of the month to 7.31% at the end of the month. The yield on the longer dated R186 decreased from 8.43% at
the beginning of the month to 8.29% at the end of the month.
Cash, as measured by the STEFI, yielded 0.49%, the low yield being a result of the Reserve Bank‟s numerous past interest rate cuts. After the Mone-
tary Policy Committee of the South African Reserve Bank (SARB) cut interest rates by a further 50 basis points in November, in aggregate interest
rates have now been cut by 650 basis points since their peak. Whilst high petrol, food and administered prices kept CPI above the SA Reserve Bank‟s
upper limit of 6% for a long time, the generally slowing economy and substantially stronger Rand has provided significant abatement on the inflation
front. Inflation is now well below the 6% mark. Although interest rates have come down strongly, sustained cost-push pressures, and future weakness
in the Rand may still be a potential problem area for future inflation, and the SARB will continue to monitor the situation closely.
Currency volatility has traditionally been a significant aspect for South African investors to consider, and the local currency has been exceptionally
strong of late. In December, the Rand strengthened from 7.09 to 6.62 against the Dollar, from 11.04 to 10.30 against the Pound, and from 9.22 to 8.84
against the Euro. History has shown that the Rand can sell off strongly in a short space of time, and we do point out that the significant capital inflows
experienced by South Africa over the past 18 months could reverse at some stage in the future. This should be borne in mind by bond investors, par-
ticularly in light of South Africa‟s current account deficit. Other factors which could influence the bond market include inf lation expectations, yield differ-
entials and prospects for future periods of risk aversion.
We do not feel that bonds generally offer very compelling value at this stage - with massive fiscal deficits and debt issuances around the world, we
have felt for some time that there is upside risk to real global bond yields. A key issue is the extent to which further bond issuances can be absorbed by
market participants However, there is a “tug-of-war” between the significant global disinflationary forces (particularly slowing economies and the reduc-
tion of private sector debt), and the continued issuance of sovereign debt (which should ultimately drive bond yields higher) .
The ABSA Bond Fund remains cautiously positioned, with a duration that is slightly shorter than the All Bond duration.
DISCLAIMER
The Absa Bond Fund is a medium to low risk fund. The maximum initial charge is 1.14% (incl. VAT) of consideration received and will include a maxi-
mum of 0.57% (incl. VAT) payable for commissions and incentives. An annual service charge of 0.86% (incl. VAT) against the assets of the fund will be
calculated and accrued daily. **The annual management fee includes the financial adviser‟s ongoing fee of 0.17% (incl. VAT). The investor may instruct
Absa Fund Managers in writing at any time to stop the ongoing adviser fee. The Absa Bond Fund requires a minimum balance of R1000. Collective
Investment Schemes in Securities (Unit Trusts) are generally medium to long term investments. The value of participatory interests (units) may go
down as well as up and past performance is not necessarily a guide to the future. Forward pricing is used. Unit trust prices are calculated on a net as-
set value basis, which is the total value of all assets in the portfolio including any income accrual and less any permissible deductions from the portfolio.
Income is distributed quarterly and any income may be paid out into an account as nominated by the investor or be represented by additional units. All
requests for transactions received on or before 16:00 every day will be traded at ruling prices and valued after 16:00 on that day. Unit trusts are traded
at ruling prices and can engage in borrowing and scrip lending. This Fund may be closed to new investments. The Fund Manager may borrow up to
10% of the market value of the portfolio to bridge insufficient liquidity. Fluctuations or movements in exchange rates may cause the value of underlying
international investments to go up or down. Foreign interest and dividends as well as foreign currency movements affecting capital may be fully taxable
under current legislation. Figures quoted are from Morningstar, for the period ending 31/12/2010, using NAV-NAV prices, with income distributions
reinvested. This product is not for sale to USA persons. The Total Expense Ratio (TER) is expressed as an annualised percentage of the charges,
levies and fees incurred by the portfolio related to its management, for the period from 1 October 2009 to 30 September 2010 against the average NAV
of the portfolio over this period. A higher TER does not necessarily imply a poor return, nor does a lower TER imply a good return. The current TER
cannot be regarded as an indication of future TER's. Consult the Management Company for details. Absa Fund Managers is a member of the
Association for Savings and Investment SA.
Absa Bond Fund 31 December 2010
Contact details
Absa Fund Managers Limited Contact Centre: 0860 111 456 / Fax: (011) 480 5440
Reg no 1991/000881/06 Email: [email protected] / Website: www.absainvestments.co.za
Authorised Financial Services Provide - Reg No 330 Trustees
Absa Investment Campus, 65 Empire Road, Parktown, 2193 Standard Bank Trustees Services
PO Box 6115, Johannesburg, 2000 PO Box 54, Cape Town, 8000
Absa Bond Fund / page 2 of 2

Fund objectives
The fund aims to offer investors a consistent return of 3% above inflation as
measured by the SA Consumer Price Index over rolling 36 month periods.
The fund invests in shares, income bearing instruments and fixed interest
instruments, with major exposure to inflation linked bonds. Shares are limited
to a maximum of 20% of the portfolio.
Fund facts
Industry category Domestic - Asset Allocation - Targeted
Absolute & Real Return
Performance target CPI + 3%
Inception date 1 September 2002
Fund size R 493 million
JSE code ABIB
Fund manager Errol Shear - B.Bus.Sc. (Finance)
(Hons), CA (SA), CFA
Asset management
company
Absa Asset Management (Pty) Ltd
*Index performance of Fund & Benchmark based to 100 at inception of fund
Absa Inflation Beater Fund 31 December 2010
Top share holdings (%)
Performance: total returns to 31 December 2010 (%)
Term Absa Inflation
Beater Fund
Sector
Average Rank
Since inception 9.75 10.23 25/48
1 year 8.73 9.77 24/46
3 years 9.39 7.75 11/41
5 years 8.46 9.48 14/27
*Figures are annualised Source: Morningstar
Fees and total expense ratio
Initial fees: Absa Fund Managers: 0%
Adviser: 0 - 3.42% (VAT incl.)
Annual management fee**: 1.43% (VAT incl.)
Total expense ratio: 1.46%
Asset allocation
Cumulative performance since inception*
Low Low-Medium Medium Medium-High High
3 Months + 6 Months + 2 Years + 3 Years + 5 Years +
Risk profile and advisable minimum term
X
X
Income distributions
Income distribution for the 3 months ended 31 Mar 2010 1.40 c.p.u
Income distribution for the 3 months ended 30 Jun 2010 1.24 c.p.u
Income distribution for the 3 months ended 30 Sep 2010 1.58 c.p.u
Income distribution for the 3 months ended 31 Dec 2010 1.33 c.p.u
Fund details
Minimum lump sum
investment R 1 000
Minimum monthly debit
order R 200
Income declaration 31 March, 30 June, 30 September &
31 December
Income distribution 1 April, 1 July, 1 October &
1 January
Risk statistics
Additional information Since inception
Number of positive months 91/99
Sharpe ratio* 0.51%
Maximum rolling 3 month gain 6.74%
Maximum rolling 3 month loss -0.76%
*Risk Free Rate used: 5.52%
Absa Inflation Beater Fund / page 1 of 2
Anglo American Plc 0.70
AVI Ltd 0.40
BHP Billiton Plc 0.44
Growthpoint Properties Ltd 1.17
MMI Holdings Ltd 0.41
Mr Price Group Ltd 0.55
Pick n Pay Holdings 0.42
Remgro Ltd 0.41
SAB Miller Plc 0.39
Spar Group Ltd 0.60
3.13%
27.43%
49.50%
7.12%
12.82%
Preference Shares
Money Market
Inflation Linked Bonds
Floating Rate Bonds
Equity
100.00
120.00
140.00
160.00
180.00
200.00
220.00
240.00
Sep
-02
Jan
-03
May-0
3
Sep
-03
Jan
-04
May-0
4
Sep
-04
Jan
-05
May-0
5
Sep
-05
Jan
-06
May-0
6
Sep
-06
Jan
-07
May-0
7
Sep
-07
Jan
-08
May-0
8
Sep
-08
Jan
-09
May-0
9
Sep
-09
Jan
-10
May-1
0
Sep
-10
Jan
-11
May-1
1
Absa Inflation Beater Fund CPI Inflation +3%

Fund commentary
The Absa Inflation Beater Fund has returned 8.5% p.a. for the 5 years to 31 December 2010, comfortably ahead of Headline CPI over this period of
6.8% p.a. The Fund has also returned 9.4% p.a. over the past 3 years.
Whilst high petrol, food and administered prices kept CPI above the SA Reserve Bank‟s upper limit of 6% for a long time, the generally slowing econ-
omy and substantially stronger Rand has provided significant abatement on the inflation front. Inflation is now well below the 6% mark. Although inter-
est rates have come down strongly, sustained cost-push pressures, and future weakness in the Rand may still be a potential problem area for future
inflation, and the SARB will continue to monitor the situation closely. With the Monetary Policy Committee of the South Afric an Reserve Bank (SARB)
cutting interest rates by a further 50 basis points in November, in aggregate interest rates have now been cut by 650 basis points since their peak.
Currency volatility has traditionally been a significant aspect for South African investors to consider, and the local currency has been exceptionally
strong of late. In December, the Rand strengthened from 7.09 to 6.62 against the Dollar, from 11.04 to 10.30 against the Pound, and from 9.22 to 8.84
against the Euro.
Equities were strong in December, with the All Share Index gaining over 6%. Amongst the major sectors, Telecommunications gained over 11%, and
Oil and Gas almost 10%. Health Care was the one major sector that underperformed in the month, gaining only 1%.
Over the last couple of years, there has been dramatic stimulus by central banks and governments worldwide, and there is increasing recognition in
many circles that fiscal consolidation will be needed over the coming years. Growth in many European countries will be very s luggish for the next num-
ber of years, and there is increasing concern that China‟s growth has also started to slow. A key issue is the extent to which a real business recovery
will be able to “carry the baton” once governmental stimulus programmes start to wane. Whilst profit growth by companies has rebounded off very low
base levels, we continue to feel that the prospects for a sustained economic recovery at a “main street” level remain unclear .
The equity market as a whole is not in cheap territory. Whilst there are still pockets of value amongst some local stocks, they are fairly difficult to find.
Nonetheless, some stocks are trading at parity (or at a discount) with the market at large, yet have higher earnings and dividend yields, strong business
franchises and balance sheets, and better visibility of cash flow. The Absa Inflation Beater Fund continues to be positioned so as to minimize the risk of
capital loss, while targeting a return in excess of inflation.
DISCLAIMER
The Absa Inflation Beater Fund is a low risk fund. No initial fee is levied though investments through intermediaries could include a maximum of 3.42%
(incl. VAT) payable for commissions and incentives. An annual service charge of 1.43% (incl.VAT) against the assets of the Fund will be calculated and
accrued daily. **The annual management fee includes the financial adviser‟s ongoing fee of 0.285% (incl. VAT). The investor may instruct Absa Fund
Managers in writing at any time to stop the ongoing adviser fee. The Absa Inflation Beater Fund requires a minimum balance of R1000. Collective In-
vestment Schemes in Securities (Unit Trusts) are generally medium to long term investments. The value of participatory interests (units) may go down
as well as up and past performance is not necessarily a guide to the future. Forward pricing is used. Unit trust prices are calculated on a net asset
value basis, which is the total value of all assets in the portfolio including any income accrual and less any permissible deductions from the portfolio.
Income is distributed quarterly and any income may be paid out into an account as nominated by the investor or be represented by additional units. All
requests for transactions received on or before 16:00 every day will be traded at ruling prices and valued after 16:00 on that day. Unit trusts are traded
at ruling prices and can engage in borrowing and scrip lending. This Fund may be closed to new investments. The Fund Manager may borrow up to
10% of the market value of the portfolio to bridge insufficient liquidity. Fluctuations or movements in exchange rates may cause the value of underlying
international investments to go up or down. Foreign interest and dividends as well as foreign currency movements affecting capital may be fully taxable
under current legislation. Figures quoted are from Morningstar, for the period ending 31/12/2010, using NAV-NAV prices, with income distributions
reinvested. This product is not for sale to USA persons. The Total Expense Ratio (TER) is expressed as an annualised percentage of the charges,
levies and fees incurred by the portfolio related to its management, for the period from 1 October 2009 to 30 September 2010 against the average NAV
of the portfolio over this period. A higher TER does not necessarily imply a poor return, nor does a lower TER imply a good return. The current TER
cannot be regarded as an indication of future TER's. Consult the Management Company for details. Absa Fund Managers is a member of the
Association for Savings and Investments SA.
Absa Inflation Beater Fund 31 December 2010
Absa Inflation Beater Fund / page 2 of 2
Contact details
Absa Fund Managers Limited Contact Centre: 0860 111 456 / Fax: (011) 480 5440
Reg no 1991/000881/06 Email: [email protected] / Website: www.absainvestments.co.za
Authorised Financial Services Provide - Reg No 330 Trustees
Absa Investment Campus, 65 Empire Road, Parktown, 2193 Standard Bank Trustees Services
PO Box 6115, Johannesburg, 2000 PO Box 54, Cape Town, 8000
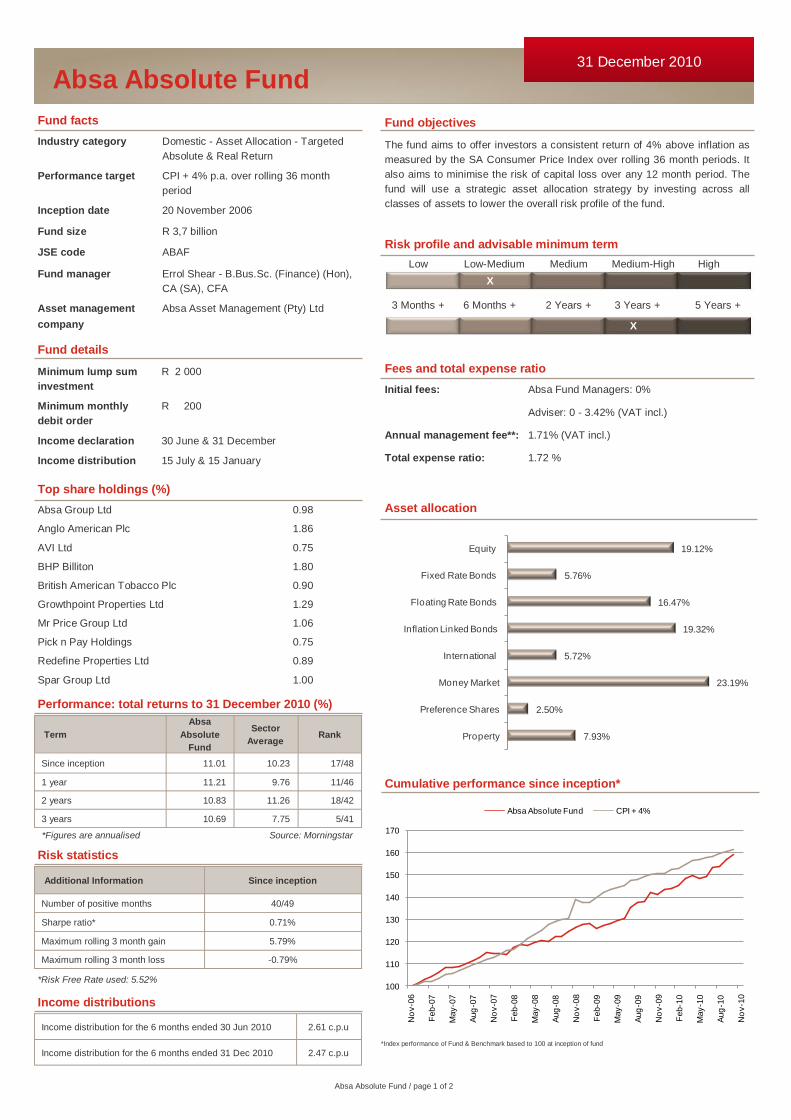
Fund objectives
The fund aims to offer investors a consistent return of 4% above inflation as
measured by the SA Consumer Price Index over rolling 36 month periods. It
also aims to minimise the risk of capital loss over any 12 month period. The
fund will use a strategic asset allocation strategy by investing across all
classes of assets to lower the overall risk profile of the fund.
Fund facts
Industry category Domestic - Asset Allocation - Targeted
Absolute & Real Return
Performance target CPI + 4% p.a. over rolling 36 month
period
Inception date 20 November 2006
Fund size R 3,7 billion
JSE code ABAF
Fund manager Errol Shear - B.Bus.Sc. (Finance) (Hon),
CA (SA), CFA
Asset management
company
Absa Asset Management (Pty) Ltd
Absa Absolute Fund 31 December 2010
Performance: total returns to 31 December 2010 (%)
Term
Absa
Absolute
Fund
Sector
Average Rank
Since inception 11.01 10.23 17/48
1 year 11.21 9.76 11/46
2 years 10.83 11.26 18/42
3 years 10.69 7.75 5/41
*Figures are annualised Source: Morningstar
Fees and total expense ratio
Initial fees: Absa Fund Managers: 0%
Adviser: 0 - 3.42% (VAT incl.)
Annual management fee**: 1.71% (VAT incl.)
Total expense ratio: 1.72 %
Income distributions
Income distribution for the 6 months ended 30 Jun 2010 2.61 c.p.u
Income distribution for the 6 months ended 31 Dec 2010 2.47 c.p.u
Low Low-Medium Medium Medium-High High
3 Months + 6 Months + 2 Years + 3 Years + 5 Years +
Risk profile and advisable minimum term
X
X
Fund details
Minimum lump sum
investment
R 2 000
Minimum monthly
debit order
R 200
Income declaration 30 June & 31 December
Income distribution 15 July & 15 January
Additional Information Since inception
Number of positive months 40/49
Sharpe ratio* 0.71%
Maximum rolling 3 month gain 5.79%
Maximum rolling 3 month loss -0.79%
Risk statistics
*Risk Free Rate used: 5.52%
*Index performance of Fund & Benchmark based to 100 at inception of fund
Cumulative performance since inception*
Top share holdings (%)
Asset allocation
Absa Absolute Fund / page 1 of 2
100
110
120
130
140
150
160
170
No
v-0
6
Feb-0
7
May-0
7
Aug
-07
No
v-0
7
Feb-0
8
May-0
8
Aug
-08
No
v-0
8
Feb-0
9
May-0
9
Aug
-09
No
v-0
9
Feb-1
0
May-1
0
Aug
-10
No
v-1
0
Absa Absolute Fund CPI + 4%
Absa Group Ltd 0.98
Anglo American Plc 1.86
AVI Ltd 0.75
BHP Billiton 1.80
British American Tobacco Plc 0.90
Growthpoint Properties Ltd 1.29
Mr Price Group Ltd 1.06
Pick n Pay Holdings 0.75
Redefine Properties Ltd 0.89
Spar Group Ltd 1.00
7.93%
2.50%
23.19%
5.72%
19.32%
16.47%
5.76%
19.12%
Property
Preference Shares
Money Market
International
Inflation Linked Bonds
Floating Rate Bonds
Fixed Rate Bonds
Equity

Fund commentary
The Absa Absolute Fund invests in a strategic mix of assets which is designed with the objective of generating a return of CPI plus 4% per annum over
a rolling 3 year term, while trying to minimize the risk of losing money in any one year. Assets invested in include inflation linked assets, fixed-interest
bonds, money market, equity, property and offshore assets.
Assets selected for this fund are chosen carefully, based not only on return, but also with a view to minimize the potential downside risk of the portfolio.
The Fund has returned a positive 11.2% over the past year and 10.7% p.a. over the past 3 years. CPI inflation has been running at 3.6% over the past
year.
Over the last couple of years, there has been dramatic stimulus by central banks and governments worldwide, and there is increasing recognition from
various circles that fiscal consolidation will be required for years to come. Consequently, we feel that a key issue is the extent to which a real business
recovery will be able to “carry the baton” once governmental stimulus programmes start to wane. We continue to feel that the prospects for a sustained
economic recovery at a “main street” level remain unclear. Whilst there are still pockets of value amongst some local stocks, the equity market as a
whole is not in cheap territory. Accordingly, our equity exposure is focused on stocks that are trading at parity (or at a discount) with the market at large,
yet have higher earnings and dividend yields, strong business franchises and balance sheets, and better visibility of cash flows.
With the Monetary Policy Committee of the South African Reserve Bank (SARB) cutting interest rates by a further 50 basis points in November, in ag-
gregate interest rates have now been cut by 650 basis points since their peak. However, the high indebtedness of local consumers, coupled with the
effects of the National Credit Act, job losses and the generally tough economic environment, will likely mean that despite rate cuts, personal consump-
tion figures will remain subdued for some time.
Our first aim is always to protect our clients‟ money, and to achieve a satisfactory return over time.
DISCLAIMER
The Absa Absolute Fund is a low to medium risk fund. No initial fee is charged but investments through intermediaries could require a commission of
up to 3.42% (VAT Incl.). An annual service charge of 1.71% (incl. VAT) against the assets of the fund will be calculated and accrued daily. **The an-
nual management fee includes the financial adviser‟s ongoing fee of 0.285% (incl. VAT). The investor may instruct Absa Fund Managers in writing at
any time to stop the ongoing adviser fee. The Absa Absolute Fund requires a minimum balance of R2000. Collective Investment Schemes in Securi-
ties (Unit Trusts) are generally medium to long term investments. The value of participatory interests (units) may go down as well as up and past per-
formance is not necessarily a guide to the future. Forward pricing is used. Unit trust prices are calculated on a net asset value basis, which is the total
value of all assets in the portfolio including any income accrual and less any permissible deductions from the portfolio. Inc ome is distributed half-yearly
and any income may be paid out into an account as nominated by the investor or be represented by additional units. All requests for transactions re-
ceived on or before 16:00 every day will be traded at ruling prices and valued after 16:00 on that day. Unit trusts are traded at ruling prices and can
engage in borrowing and scrip lending. This Fund may be closed to new investments. The Fund Manager may borrow up to 10% of the market value of
the portfolio to bridge insufficient liquidity. Fluctuations or movements in exchange rates may cause the value of underlying international investments to
go up or down. Foreign interest and dividends as well as foreign currency movements affecting capital may be fully taxable under current legislation.
Figures quoted are from Morningstar, for the period ending 31/12/2010, using NAV-NAV prices, with income distributions reinvested. This product is not
for sale to USA persons. The Total Expense Ratio (TER) is expressed as an annualised percentage of the charges, levies and fees incurred by the
portfolio related to its management, for the period from 1 October 2009 to 30 September 2010 against the average NAV of the portfolio over this pe-
riod. A higher TER does not necessarily imply a poor return, nor does a lower TER imply a good return. The current TER cannot be regarded as an
indication of future TER's. Consult the Management Company for details. Absa Fund Managers is a member of the Association for Savings and
Investment SA.
Absa Absolute Fund 31 December 2010
Contact details
Absa Fund Managers Limited Contact Centre: 0860 111 456 / Fax: (011) 480 5440
Reg no 1991/000881/06 Email: [email protected] / Website: www.absainvestments.co.za
Authorised Financial Services Provide - Reg No 330 Trustees
Absa Investment Campus, 65 Empire Road, Parktown, 2193 Standard Bank Trustees Services
PO Box 6115, Johannesburg, 2000 PO Box 54, Cape Town, 8000
Absa Absolute Fund / page 2 of 2

Fund objectives
The fund aims to offer investors a consistent return of 5% above inflation as
measured by the SA Consumer Price Index over rolling 60 month periods.
The fund will use an active asset allocation strategy by investing in selected
JSE listed shares, quoted property trusts, bonds, money market and
international assets. The equity content may range from 40% to 65%. The
fund is managed according to the guidelines as set out in Regulation 28 of
the Pension Fund Act and is suitable for retirement funds investments.
Fund facts
Industry category Domestic - Asset Allocation - Prudential
Medium Equity
Performance target CPI + 5% p.a. over rolling 60 month
periods (effective 1 October 2009)
Inception date 1 June 1994
Fund size R 964 million
JSE code ABBF
Fund manager Errol Shear - B.Bus.Sc. (Finance) (Hon),
CA (SA), CFA
Asset management
company
Absa Asset Management (Pty) Ltd
*Index performance of Fund & Benchmark based to 100 at inception of fund
Absa Balanced Fund 31 December 2010
Performance: total returns to 31 December 2010 (%)
Term
Absa
Balanced
Fund
Sector
Average Rank
Since inception 12.74 9.71 9/33
1 year 14.54 12.54 6/33
3 years 8.37 4.96 2/31
5 years 11.7 10.0 2/19
*Figures are annualised Source: Morningstar
Fees and total expense ratio
Initial fees: Absa Fund Managers: 2.28% (VAT incl.)
Adviser: 0 - 3.42% (VAT incl.)
Annual management fee**: 1.71% (VAT incl.)
Total expense ratio: 1.73 %
Cumulative performance since inception*
Low Low-Medium Medium Medium-High High
3 Months + 6 Months + 2 Years + 3 Years + 5 Years +
Risk profile and advisable minimum term
X
X Fund details
Minimum lump sum
investment
R 1 000
Minimum monthly
debit order
R 100
Income declaration 30 June & 31 December
Income distribution 15 July & 15 January
Income distributions
Income distribution for the 6 months ended 30 June 2010 4.81 c.p.u
Income distribution for the 6 months ended 31 Dec 2010 4.84 c.p.u
Asset allocation
Risk statistics
Additional information Data since January 2000
Number of positive months 89/132
Sharpe ratio* 0.65%
Maximum rolling 3 month gain 15.56%
Maximum rolling 3 month loss -9.54%
*Risk Free Rate used: 5.52%
Absa Balanced Fund / page 1 of 2
Top share holdings (%)
Anglo American Plc 4.27
Adcock Ingram Holdings Ltd 1.53
BHP Billiton Plc 4.13
British American Tobacco Plc 1.73
JD Group Ltd 1.72
Naspers Ltd 2.04
SAB Miller Plc 1.96
Sasol Ltd 1.62
Standard Bank Group Ltd 2.23
Tiger Brands Ltd 1.81
100
200
300
400
500
600
700
800
Ma
y-9
4
Ma
y-9
5
Ma
y-9
6
Ma
y-9
7
Ma
y-9
8
Ma
y-9
9
Ma
y-0
0
Ma
y-0
1
Ma
y-0
2
Ma
y-0
3
Ma
y-0
4
Ma
y-0
5
Ma
y-0
6
Ma
y-0
7
Ma
y-0
8
Ma
y-0
9
Ma
y-1
0
Ma
y-1
1
Absa Balanced Fund Benchmark
53.63%
23.91%
1.05%
2.12%
14.48%
3.01%
1.80%
Equities
Fixed Rate Bonds
Floating Rate Bonds
Inflation Linked Bonds
Money Market
International
Preference Shares

Fund commentary
Though market conditions have been challenging over the past few years, we constantly stress the importance of investing with a longer-term perspec-
tive, and over the last 5 years, the Absa Balanced Fund has returned 11.7% p.a., making it the 2ndbest performing fund in its category over this period.
The Fund is also the 2ndbest-performing fund over the past 3 years, and has returned 14.5% over the past year.
In December the cash, fixed income, inflation-linked bonds, equity and property components within the Fund contributed positively to the Fund‟s return,
whilst the foreign components contributed negatively. Currency volatility has traditionally been a significant aspect for South African investors to consider,
and the local currency has been exceptionally strong of late. In December, the Rand strengthened from 7.09 to 6.62 against the Dollar, from 11.04 to
10.30 against the Pound, and from 9.22 to 8.84 against the Euro. History has shown that the Rand can sell off strongly in a short space of time, and we
do point out that the significant capital inflows experienced by South Africa over the past 18 months could reverse at some stage in the future.
The ALBI was strong in 2010, and gained a further 1.73% in December. After the Monetary Policy Committee of the South African Reserve Bank (SARB)
cut interest rates by a further 50 basis points in November, in aggregate interest rates have now been cut by 650 basis points since their peak. The high
indebtedness of local consumers, coupled with the effects of the National Credit Act, job losses and the generally tough economic environment, will likely
mean that despite rate cuts, personal consumption figures will remain subdued for some time.
Over the last couple of years, there has been dramatic stimulus by central banks and governments worldwide, and there is increasing recognition from
various circles that fiscal consolidation will be required for years to come. Consequently, we expect that growth in many European countries will be very
sluggish for the foreseeable future, and feel that a key issue is the extent to which a real business recovery will be able to “carry the baton” once govern-
mental stimulus programmes start to wane. A very important consideration is the extent to which the global economy will see employment growth over
the next few years. With some uncertainty surrounding the economic fundamentals within South Africa, and equity markets in fairly expensive territory,
we have attempted to keep our equity exposures to companies where we are comfortable with future earnings prospects.
Whilst there are still pockets of value amongst some local stocks, they are fairly difficult to find. Nonetheless, some stocks are trading at parity (or at a
discount) with the market at large, yet have higher earnings and dividend yields, strong business franchises and balance sheets, and better visibility of
cash flows. We will continue to seek out such shares and position the fund appropriately.
DISCLAIMER
The Absa Balanced Fund is a medium risk fund. The maximum initial charge is 5.70% (incl. VAT) of consideration received and will include a maximum
of 3.42% (incl. VAT) payable for commissions and incentives. An annual service charge of 1.71% (incl. VAT) against the assets of the fund will be cal-
culated and accrued daily. **The annual management fee includes the financial adviser‟s ongoing fee of 0.285% (incl. VAT). The investor may instruct
Absa Fund Managers in writing at any time to stop the ongoing adviser fee. The Absa Balanced Fund requires a minimum balance of R1000. Collective
Investment Schemes in Securities (Unit Trusts) are generally medium to long term investments. The value of participatory interests (units) may go
down as well as up and past performance is not necessarily a guide to the future. Forward pricing is used. Unit trust prices are calculated on a net as-
set value basis, which is the total value of all assets in the portfolio including any income accrual and less any permissible deductions from the portfolio.
Income is distributed half-yearly and any income may be paid out into an account as nominated by the investor or be represented by additional units.
All requests for transactions received on or before 16:00 every day will be traded at ruling prices and valued after 16:00 on that day. Unit trusts are
traded at ruling prices and can engage in borrowing and scrip lending. This Fund may be closed to new investments. The Fund Manager may borrow
up to 10% of the market value of the portfolio to bridge insufficient liquidity. Fluctuations or movements in exchange rates may cause the value of un-
derlying international investments to go up or down. Foreign interest and dividends as well as foreign currency movements affecting capital may be fully
taxable under current legislation. This Fund may invest in Financial instruments. Figures quoted are from Morningstar, for the period ending
31/12/2010, using NAV-NAV prices, with income distributions reinvested. This product is not for sale to USA persons. The Total Expense Ratio (TER)
is expressed as an annualised percentage of the charges, levies and fees incurred by the portfolio related to its management, for the period from 1
October 2009 to 30 September 2010 against the average NAV of the portfolio over this period. A higher TER does not necessaril y imply a poor return,
nor does a lower TER imply a good return. The current TER cannot be regarded as an indication of future TER's. Consult the Management Company
for details. Absa Fund Managers is a member of the Association for Savings and Investment SA.
Absa Balanced Fund 31 December 2010
Contact details
Absa Fund Managers Limited Contact Centre: 0860 111 456 / Fax: (011) 480 5440
Reg no 1991/000881/06 Email: [email protected] / Website: www.absainvestments.co.za
Authorised Financial Services Provide - Reg No 330 Trustees
Absa Investment Campus, 65 Empire Road, Parktown, 2193 Standard Bank Trustees Services
PO Box 6115, Johannesburg, 2000 PO Box 54, Cape Town, 8000
Absa Balanced Fund / page 2 of 2

Fund objectives
The fund aims to offer investors return of 6% above inflation as measured by
the SA Consumer Price Index over rolling 60 month periods. The fund will
use an active asset allocation strategy by investing in selected JSE listed
shares, quoted property, bonds, money market and international assets. The
fund is managed according to the guidelines as set out in Regulation 28 of
the Pension Fund Act and is suitable for retirement funds investments.
Fund facts
Industry category Domestic - Asset Allocation - Prudential
Variable Equity
Performance target CPI + 6% p.a. over rolling 60 month
periods
Inception date 25 February 2010
Fund size R 271 million
JSE code AMFCA
Fund manager Errol Shear - B.Bus.Sc. (Finance)
(Hons), CA (SA), CFA
Asset management
company
Absa Asset Management (Pty) Ltd
Absa Managed Fund 31 December 2010
Top share holdings (%)
Performance: total returns to 31 December 2010 (%)
Term Absa Managed
Fund
Sector
Average Rank
1 month 2.99 2.34 15/63
3 months 5.62 4.44 14/62
6 months 14.70 11.01 9/59
*Figures are monthly Source: Morningstar
Fees and total expense ratio
Initial fees: Absa Fund Managers: 0%
Adviser: 0 - 3.42% (VAT incl.)
Annual management fee**: 1.71% (VAT incl.)
Total expense ratio: 1.72%
Asset allocation
Cumulative performance since inception*
Risk statistics
Additional Information Since inception
Number of positive months 4/8
Sharpe ratio* 0.45%
Maximum rolling 3 month gain 8.59%
Maximum rolling 3 month loss -0.36%
*The graph below illustrates the back tested performance of a portfolio constructed using the asset allocation
methodology of the Absa Managed Fund against the back tested performance of the actual benchmark of the fund.
Low Low-Medium Medium Medium-High High
3 Months + 6 Months + 2 Years + 3 Years + 5 Years +
Risk profile and advisable minimum term
X
X
Income distributions
Income distribution for the 6 months ended 30 Jun 2010 0.60 c.p.u
Income distribution for the 6 months ended 31 Dec 2010 1.54 c.p.u
Fund details
Minimum lump sum R 2 000
Minimum monthly R 200
Income declaration 30 June & 31 December
Income distribution 15 July & 15 January
*Risk Free Rate used: 5.52%
Absa Managed Fund / page 1 of 2
Anglo American Plc 6.33
BHP Billiton 5.39
British American Tobacco Plc 2.84
Foschini Ltd 1.99
JD Group Ltd 2.14
Lewis Group Ltd 1.95
Remgro Ltd 2.50
Spar Group Ltd 1.62
Standard Bank Group Ltd 1.98
Vodacom Group Ltd 1.83
4.45%
7.83%
25.59%
62.14%
Money Market
International
Fixed Rate Bonds
Equities
100
120
140
160
180
200
220
240
Jan
-05
May-0
5
Sep
-05
Jan
-06
May-0
6
Sep
-06
Jan
-07
May-0
7
Sep
-07
Jan
-08
May-0
8
Sep
-08
Jan
-09
May-0
9
Sep
-09
Back Tested Portfolio Managed Back Tested Performance Target

Fund commentary
The Absa Managed Fund was launched on 25 February 2010. This Fund is an ideal savings vehicle for long term investors and complies with pruden-
tial guidelines applicable to retirement funds. The Absa Managed Fund is positioned in the Prudential Variable Equity category as the Fund has the
ability to vary its allocation to asset classes based on current economic conditions and the manager‟s view. Over the longer term, the Fund will have an
equity allocation towards the higher end of its mandate up to a maximum of 75%.
In line with prudential guidelines, the Absa Managed Fund also has the ability to invest a portion of its assets offshore. This international exposure is
currently limited to 20% of total assets. We are mindful that currency volatility has traditionally been a significant aspect for South African investors to
consider. Although the local currency has been very strong of late, history has shown that the Rand can sell off strongly in a short space of time. This
should be borne in mind, particularly in light of South Africa‟s current account deficit, along with strong capital inflows experienced over the past 18
months, which could reverse at some stage in the future.
Over the last couple of years, there has been dramatic stimulus by central banks and governments worldwide, and there is increasing recognition in
various circles that fiscal consolidation will be required for years to come. Consequently, we expect that growth in many European countries will be very
sluggish for the foreseeable future, and feel that a key issue is the extent to which a real business recovery will be able to “carry the baton” once gov-
ernmental stimulus programmes start to wane. There is also increasing concern that China‟s growth has started to slow.
Whilst there are still pockets of value amongst some local stocks, they are fairly difficult to find. Nonetheless, some stocks are trading at parity (or at a
discount) with the market at large, yet have higher earnings and dividend yields, strong business franchises and balance sheets, and better visibility of
cash flows. We will continue to seek out such shares and position the fund appropriately.
The ALBI has was strong in 2010, and gained a further 1.73% in December, with gains coming across all durations of the yield curve. The Monetary
Policy Committee of the South African Reserve Bank (SARB) cut interest rates by a further 50 basis points in November, meaning that in aggregate
interest rates have now been cut by 650 basis points since their peak. With massive deficits and debt issuances sure to characterize global bond mar-
kets for quite some time, we do not find bonds to be a particularly attractive asset class at this stage.
Investors who may find the Managed Fund suitable include individuals who wish to save for retirement as well as serious long term investors seeking to
maximise capital growth and income. We are confident that the Fund will achieve its stated goals over the longer term.
Absa Managed Fund 31 December 2010
Contact details
Absa Fund Managers Limited Contact Centre: 0860 111 456 / Fax: (011) 480 5440
Reg no 1991/000881/06 Email: [email protected] / Website: www.absainvestments.co.za
Authorised Financial Services Provide - Reg No 330 Trustees
Absa Investment Campus, 65 Empire Road, Parktown, 2193 Standard Bank Trustees Services
PO Box 6115, Johannesburg, 2000 PO Box 54, Cape Town, 8000
Absa Managed Fund / page 2 of 2
DISCLAIMER
The Absa Managed Fund is a medium to high risk fund. No initial fee is charged but investments through intermediaries could incur a commission of up
to 3.42% (VAT Incl.). An annual service charge of 1.71% (incl. VAT) against the assets of the fund will be calculated and accrued daily. **The annual
management fee includes the financial adviser‟s ongoing fee of 0.285% (incl. VAT). The investor may instruct Absa Fund Managers in writing at any
time to stop the ongoing adviser fee. The Absa Managed Fund requires a minimum balance of R2000. Collective Investment Schemes in Securities
(Unit Trusts) are generally medium to long term investments. The value of participatory interests (units) may go down as well as up and past perform-
ance is not necessarily a guide to the future. Forward pricing is used. Unit trust prices are calculated on a net asset value basis, which is the total value
of all assets in the portfolio including any income accrual and less any permissible deductions from the portfolio. Income is distributed half yearly and
any income may be paid out into an account as nominated by the investor or be represented by additional units. All requests for transactions received
on or before 16:00 every day will be traded at ruling prices and valued after 16:00 on that day. Unit trusts are traded at ru ling prices and can engage in
borrowing and scrip lending. This Fund may be closed to new investments. The Fund Manager may borrow up to 10% of the market value of the portfo-
lio to bridge insufficient liquidity. Fluctuations or movements in exchange rates may cause the value of underlying international investments to go up or
down. Foreign interest and dividends as well as foreign currency movements affecting capital may be fully taxable under current legislation. The Fund
may invest in Financial instruments. Figures quoted are from Morningstar, for the period ending 31/12/2010, using NAV-NAV prices, with income distri-
butions reinvested. This product is not for sale to USA persons. The Total Expense Ratio (TER) is expressed as an annualised percentage of the
charges, levies and fees incurred by the portfolio related to its management, for the period from 1 October 2009 to 30 September 2010 against the
average NAV of the portfolio over this period. A higher TER does not necessarily imply a poor return, nor does a lower TER imply a good return. The
current TER cannot be regarded as an indication of future TER's. Consult the Management Company for details. Absa Fund Managers is a member of
the Association for Savings and Investment SA.

Fund objectives
The fund aims to offer investors medium to long-term capital and income
growth through investments in the SA property market, sector listed shares
and unit trusts in property.
Fund facts
Industry category Domestic - Real Estate - General
Performance target FTSE/JSE SA Listed Property Index
Inception date 14 August 2006
Fund size R 73 million
JSE code ABPE
Fund manager Thabo Ramushu - Bcom, MSc (Property
Investments)
Jay Padayatchi - BSc (Quantity
Surveying), Post Graduate Diploma in
Tax, CA (SA)
Asset management Meago (Pty) Ltd
Absa Property Equity Fund 31 December 2010
Top holdings (%)
Acumen Property Capl 3.98
Capital Property Fund 5.22
Emira Property Fund 4.55
Fountainhead Property Trust 5.45
Growthpoint Properties Ltd 20.07
Hyprop Investments Ltd 5.87
Pangbourne Properties Ltd 7.86
Resilient Property Income Fund 7.31
Redifine Property Ltd 19.72
SA Corporate Real Estate Fund 5.90
Performance: total returns to 31 December 2010 (%)
Term Absa Property
Equity Fund Benchmark
Sector
Average Rank
Since inception 16.90 20.24 19.54 17/22
1 year 25.15 29.64 24.08 11/21
3 years 8.74 12.20 9.85 14/21
5 years N/A N/A N/A N/A
*Figures are annualised Source: Morningstar
Fees and total expense ratio
Initial fees: Absa Fund Managers: 0.57% (VAT incl.)
Adviser: 0 - 0.57% (VAT incl.)
Annual management fee**: 1.43% (VAT incl.) + performance fee (see dis-
Total expense ratio: 1.47%
*Index performance of Fund & Benchmark based to 100 at inception of fund
Cumulative performance since inception*
Asset allocation
Low Low-Medium Medium Medium-High High
3 Months + 6 Months + 2 Years + 3 Years + 5 Years +
Risk profile and advisable minimum term
X
X
Income distributions
Income distribution for the 3 months ended 31 Mar 2010 3.05 c.p.u
Income distribution for the 3 months ended 30 Jun 2010 1.25 c.p.u
Income distribution for the 3 months ended 30 Sep 2010 3.14 c.p.u
Income distribution for the 3 months ended 31 Dec 2010 0.79 c.p.u
Fund details
Minimum lump sum
Investment
R 2 000
Minimum monthly
debit order
R 500
Income declaration 31 March, 30 June, 30 September &
31 December
Income distribution 15 April, 15 July, 15 October &
15 January
Absa Property Equity Fund / page 1 of 2
80
100
120
140
160
180
Aug
-06
No
v-0
6
Feb-0
7
May-0
7
Aug
-07
No
v-0
7
Feb-0
8
May-0
8
Aug
-08
No
v-0
8
Feb-0
9
May-0
9
Aug
-09
No
v-0
9
Feb-1
0
May-1
0
Aug
-10
No
v-1
0
Feb-1
1
May-1
1
Absa Property Equity Fund FTSE/JSE Africa SA Listed Propety Index
95.46%
4.54%
Property
Cash

Fund commentary
The FTSE/JSE Listed Property Total Return Index was up 2.23% for the month of December 2010, up 3.13% for 3 months, up 15.84% for 9 months. The SA
Listed Property sector outperformed all asset classes delivering 29.62%, against 20.90% for the All Share Index, 15.30% for B onds and 7.8% for Cash.
Outlook for the property and Sector Fundamentals in 2011
The rally in the listed property market in 2010 was fuelled by a decline in bond yields given the strong correlation between the two. Yields on the 10 year have
fallen considerably on the back of investor appetite for Emerging Markets (“EM”) sentiment. United States (“US”) economic fundamentals are improving at the
moment and there is the likelihood that the Federal Bank of the US might increase rates in the second half of the year, in which case we could a reversal of in-
flows out of bonds from the US and EM into equities which will cause the local listed property market to de-rate in line with the weakening bonds yields. The
operational concern going into 2011 is the rising cost pressures that are likely to squeeze profit margins for tenants and constrain rental growth for the landlords.
Main drivers of escalating costs in the past were electricity tariffs and rates. Electricity tariffs are expected to increase by 25% per annum over the next 3 years,
which will constitute 37% of total cost in the next 3 years from 27%.Administered costs i.e. electricity, rates and taxes, and other municipal charges constitute
54% of total operating costs.
Retail - Retailers margins, and consequently vacancies and rentals, may come under pressure because of cost pressures and rental growth will be subdued.
Office - The office sector was the hardest hit in the past year, with vacancy rates in decentralized office markets rising sharply on the back of excess supply.
SAPOA recorded office vacancy of 9.73% for 2010, however this rate does not account for pockets of underutilized space which will place a drag on net absorp-
tion generated in the near term and impact negatively on rental growth.
Industrial - Industrial property suffered through 2010, partly due to weak export volumes and tighter access to credit but recent signs show an improved outlook
Outlook for 2011 - Meago‟s expected total return for the sector for the next twelve months is anticipated at 11% comprising a clean forward yield of 8% and capi-
tal growth of 3%
DISCLAIMER
The Absa Property Equity Fund is a medium to high-risk Fund. The maximum initial charge is 1.14% (incl. VAT) of the consideration received and in-
cludes a maximum of 0.57% (incl. VAT) payable for commissions and incentives. An annual service charge of 1.43% (incl. VAT) plus a performance-
based fee will be calculated and accrued daily against the assets of the Fund. The performance fee is 10% of the portfolio‟s out performance of its
stated benchmark plus 4% (benchmark is the FTSE/JSE Africa Listed Property Index [J253]). This fee is calculated and accrued daily on a twelve
month rolling basis and deducted from income of the Fund. **The annual management fee includes the financial adviser‟s ongoing fee of 0.285% (incl.
VAT). The investor may instruct Absa Fund Managers in writing at any time to stop the ongoing adviser fee. The Absa Property Equity Fund requires a
minimum balance of R2 000. Collective Investment Schemes in Securities (Unit Trusts) are generally medium to long-term investments. The value of
participatory interests (units) may go down as well as up and past performance is not necessarily a guide to the future. Forward pricing is used. Unit
trust prices are calculated on a net asset value basis, which is the total value of all assets in the portfolio including any income accrual and less any
permissible deductions from the portfolio. Income is distributed quarterly and any income may be paid out into an account as nominated by the investor
or be represented by additional units. All requests for transactions received on or before 16:00 every day will be traded at ruling prices and valued after
16:00 on that day. Unit trusts are traded at ruling prices and can engage in borrowing and scrip lending. This Fund may be closed to new investments.
Fluctuations or movements in exchange rates may cause the value of underlying international investments to go up or down. Foreign interest and divi-
dends as well as foreign currency movements affecting capital may be fully taxable under current legislation. Figures quoted are from Morningstar, for
the period ending 31/12/2010, using NAV-NAV prices, with income distributions reinvested. The Fund Manager may borrow up to 10% of the market
value of the portfolio to bridge insufficient liquidity. This product is not for sale to USA persons. The Total Expense Ratio (TER) is expressed as an
annualised percentage of the charges, levies and fees incurred by the portfolio related to its management, for the period from 1 October 2009 to 30
September 2010 against the average NAV of the portfolio over this period. A higher TER does not necessarily imply a poor return, nor does a lower
TER imply a good return. The current TER cannot be regarded as an indication of future TER's. Consult the Management Company for details. Absa
Fund Managers is a member of the Association for Savings and Investment SA.
Absa Property Equity Fund 31 December 2010
Contact details
Absa Fund Managers Limited Contact Centre: 0860 111 456 / Fax: (011) 480 5440
Reg no 1991/000881/06 Email: [email protected] / Website: www.absainvestments.co.za
Authorised Financial Services Provide - Reg No 330 Trustees
Absa Investment Campus, 65 Empire Road, Parktown, 2193 Standard Bank Trustees Services
PO Box 6115, Johannesburg, 2000 PO Box 54, Cape Town, 8000
Absa Property Equity Fund / page 2 of 2

Fund objectives
The fund aims to offer investors medium to long-term capital growth by
delivering a higher rate of return than the FTSE/JSE All Share Index through
investments in selected JSE listed companies. Exposure to shares will
exceed 75% of the fund at all times.
Fund facts
Industry category Domestic - Equity - General
Performance target FTSE/JSE All Share Index
Inception date 1 April 1991
Fund size R 1.4 billion
JSE code ABSA
Fund manager Errol Shear - B.Bus.Sc. (Finance)
(Hons), CA (SA), CFA
Asset management
company
Absa Asset Management (Pty) Ltd
*Index performance of Fund & Benchmark based to 100 at inception of fund
Absa General Fund 31 December 2010
Top holdings (%)
Performance: total returns to 31 December 2010 (%)
Term
Absa
General
Fund
Benchmark Sector
Average Rank
Since inception 14.54 13.00 15.16 51/84
1 year 18.81 16.11 18.08 35/84
3 years 7.61 3.51 4.66 11/73
5 years 14.46 12.15 12.79 16/55
*Figures are annualised Source: Morningstar
Fees and total expense ratio
Initial fees: Absa Fund Managers: 2.28% (VAT incl.)
Adviser: 0 - 3.42% (VAT incl.)
Annual management fee**: 1.71% (VAT incl.)
Total expense ratio: 1.72%
Sector allocation
Cumulative performance since inception*
Low Low-Medium Medium Medium-High High
3 Months + 6 Months + 2 Years + 3 Years + 5 Years +
Risk profile and advisable minimum term
X
X
Income distributions
Income distribution for the 6 months ended 30 Jun 2010 0.00 c.p.u
Income distribution for the 6 months ended 31 Dec 2010 2.84 c.p.u
Fund details
Minimum lump sum R 500
Minimum monthly R 100
Income declaration 30 June & 31 December
Income distribution 15 July & 15 January
Risk statistics
Additional information Data since January 2000
Number of positive months 83/132
Sharpe ratio* 0.37%
Maximum rolling 3 month gain 23.01%
Maximum rolling 3 month loss -16.95%
*Risk Free Rate used: 5.52%
Absa General Fund / page 1 of 2
Adcock Ingram Holdings Ltd 4.14
Anglo American Plc 6.52
BHP Billiton 5.68
Bidvest Group Ltd 3.57
British American Tobacco Plc 5.05
Compagnie Financiere Richemont SA 4.31
Naspers Ltd 5.63
Remgro Ltd 3.75
Sasol Ltd 5.98
Standard Bank Ltd 4.46
100
200
300
400
500
600
700
800
900
1000
1100
Oct-
93
Oct-
94
Oct-
95
Oct-
96
Oct-
97
Oct-
98
Oct-
99
Oct-
00
Oct-
01
Oct-
02
Oct-
03
Oct-
04
Oct-
05
Oct-
06
Oct-
07
Oct-
08
Oct-
09
Oct-
10
Oct-
11
Absa General Fund FTSE/JSE All Share Index
4.33%
0.29%
1.39%
5.98%
12.24%
1.36%
18.98%
17.58%
8.65%
2.21%
26.99%
Telecommunications
Technology
Preference Shares
Oil & Gas
Industrial
Healthcare
Financials
Consumer Services
Consumer Goods
Cash
Basic Materials

Fund commentary
Equities were strong in December, with the All Share Index gaining over 6%. Amongst the major sectors, Telecommunications gained over 11%, and
Oil and Gas almost 10%. Health Care was the one major sector that underperformed in the month, gaining only 1%.
We constantly stress the importance of investing with a longer-term perspective, and over the last 5 years, the Absa General Fund has returned14.5%
p.a. The Fund gained 18.8% over calendar year 2010, and is in the top quartile amongst its peers over the 3 year period to the end of December.
Over the last couple of years, there has been dramatic stimulus by central banks and governments worldwide, and there is increasing recognition in
various circles that fiscal consolidation will be required for years to come. We expect that growth in many European countries will be very sluggish for
the foreseeable future, and feel that a key issue is the extent to which a real business recovery will be able to “carry the baton” once governmental
stimulus programmes start to wane. A very important consideration is the extent to which the global economy will see employment growth over the next
few years.
Currency volatility has traditionally been a significant aspect for South African investors to consider, and the local currency has been exceptionally
strong of late. In December, the Rand strengthened from 7.09 to 6.62 against the Dollar, from 11.04 to 10.30 against the Pound, and from 9.22 to 8.84
against the Euro. History has shown that the Rand can sell off strongly in a short space of time, and we do point out that the significant capital inflows
experienced by South Africa over the past 18 months could reverse at some stage in the future.
With the Monetary Policy Committee of the South African Reserve Bank (SARB) cutting interest rates by a further 50 basis points in November, in ag-
gregate interest rates have now been cut by 650 basis points since their peak. However, the high indebtedness of local consumers, coupled with the
effects of the National Credit Act, job losses and the generally tough economic environment, will likely mean that despite rate cuts, personal consump-
tion figures will remain subdued for some time.
Furthermore there is still some uncertainty surrounding the economic fundamentals within South Africa, and the equity market as a whole is certainly
not in cheap territory. The Fund remains cautiously positioned, and we have tried to keep our equity exposures to companies where we are comfortable
with future earnings prospects.
We remind you that we are long term investors and short term fluctuations in share prices neither excite nor depress us. All the stocks in the portfolio
are held because they offer long term value, and we expect that value to be unlocked over time.
DISCLAIMER
The Absa General Fund is a high risk fund. The maximum initial charge is 5.70% (incl. VAT) of consideration received and wil l include a maximum of
3.42% (incl. VAT) payable for commissions and incentives. An annual service charge of 1.71% (incl. VAT) against the assets of the fund will be calcu-
lated and accrued daily. **The annual management fee includes the financial adviser‟s ongoing fee of 0.285% (incl. VAT). The investor may instruct
Absa Fund Managers in writing at any time to stop the ongoing adviser fee. The Absa General Fund requires a minimum balance of R500. Collective
Investment Schemes in Securities (Unit Trusts) are generally medium to long term investments. The value of participatory interests (units) may go
down as well as up and past performance is not necessarily a guide to the future. Forward pricing is used. Unit trust prices are calculated on a net as-
set value basis, which is the total value of all assets in the portfolio including any income accrual and less any permissible deductions from the portfolio.
Income is distributed half yearly and any income may be paid out into an account as nominated by the investor or be represented by additional units.
All requests for transactions received on or before 16:00 every day will be traded at ruling prices and valued after 16:00 on that day. Unit trusts are
traded at ruling prices and can engage in borrowing and scrip lending. This Fund may be closed to new investments. Fluctuations or movements in
exchange rates may cause the value of underlying international investments to go up or down. Foreign interest and dividends as well as foreign cur-
rency movements affecting capital may be fully taxable under current legislation. The Fund Manager may borrow up to 10% of the market value of the
portfolio to bridge insufficient liquidity. Figures quoted are from Morningstar, for the period ending 31/12/2010, using NAV-NAV prices, with income
distributions reinvested. This product is not for sale to USA persons. The Total Expense Ratio (TER) is expressed as an annualised percentage of the
charges, levies and fees incurred by the portfolio related to its management, for the period from 1 October 2009 to 30 September 2010 against the
average NAV of the portfolio over this period. A higher TER does not necessarily imply a poor return, nor does a lower TER imply a good return. The
current TER cannot be regarded as an indication of future TER's. Consult the Management Company for details. Absa Fund Managers is a member of
the Association for Savings and Investment SA.
Absa General Fund 31 December 2010
Contact details
Absa Fund Managers Limited Contact Centre: 0860 111 456 / Fax: (011) 480 5440
Reg no 1991/000881/06 Email: [email protected] / Website: www.absainvestments.co.za
Authorised Financial Services Provide - Reg No 330 Trustees
Absa Investment Campus, 65 Empire Road, Parktown, 2193 Standard Bank Trustees Services
PO Box 6115, Johannesburg, 2000 PO Box 54, Cape Town, 8000
Absa General Fund / page 2 of 2
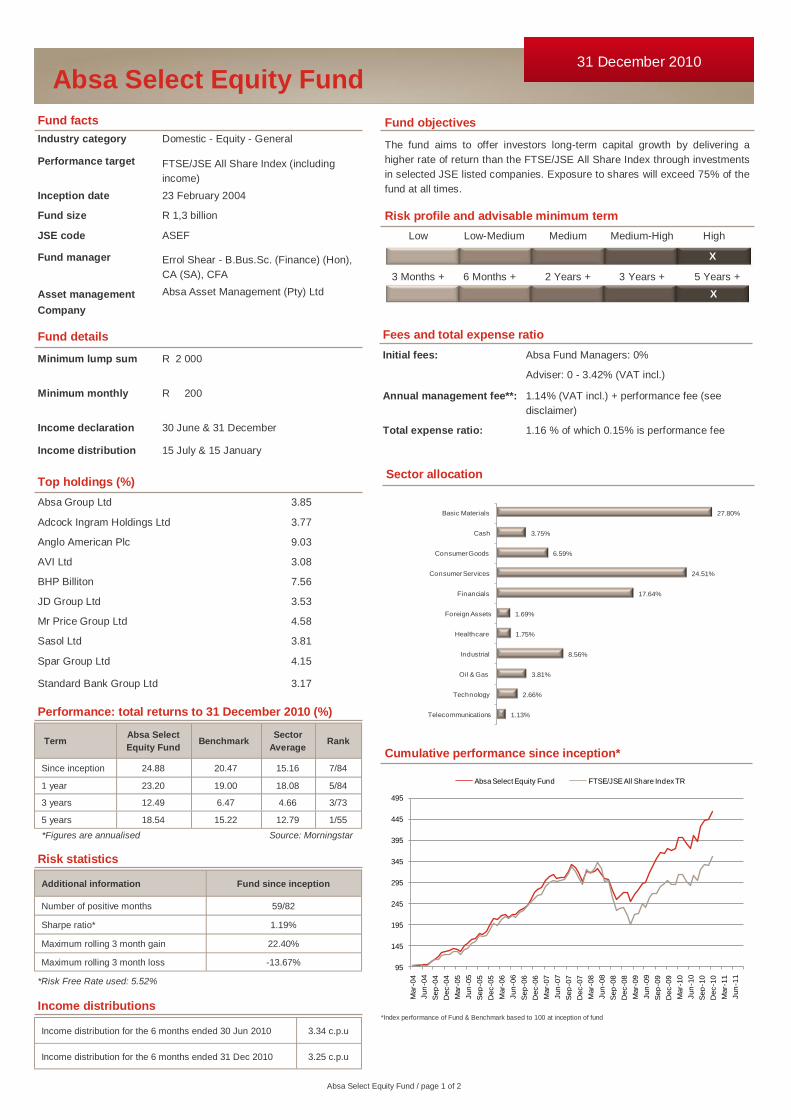
Fund objectives
The fund aims to offer investors long-term capital growth by delivering a
higher rate of return than the FTSE/JSE All Share Index through investments
in selected JSE listed companies. Exposure to shares will exceed 75% of the
fund at all times.
Fund facts
Industry category Domestic - Equity - General
Performance target FTSE/JSE All Share Index (including
income)
Inception date 23 February 2004
Fund size R 1,3 billion
JSE code ASEF
Fund manager Errol Shear - B.Bus.Sc. (Finance) (Hon),
CA (SA), CFA
Asset management
Company
Absa Asset Management (Pty) Ltd
*Index performance of Fund & Benchmark based to 100 at inception of fund
Absa Select Equity Fund 31 December 2010
Performance: total returns to 31 December 2010 (%)
Term Absa Select
Equity Fund Benchmark
Sector
Average Rank
Since inception 24.88 20.47 15.16 7/84
1 year 23.20 19.00 18.08 5/84
3 years 12.49 6.47 4.66 3/73
5 years 18.54 15.22 12.79 1/55
*Figures are annualised Source: Morningstar
Fees and total expense ratio
Initial fees: Absa Fund Managers: 0%
Adviser: 0 - 3.42% (VAT incl.)
Annual management fee**: 1.14% (VAT incl.) + performance fee (see
disclaimer)
Total expense ratio: 1.16 % of which 0.15% is performance fee
Cumulative performance since inception*
Low Low-Medium Medium Medium-High High
3 Months + 6 Months + 2 Years + 3 Years + 5 Years +
Risk profile and advisable minimum term
X
X
Income distributions
Income distribution for the 6 months ended 30 Jun 2010 3.34 c.p.u
Income distribution for the 6 months ended 31 Dec 2010 3.25 c.p.u
Fund details
Minimum lump sum R 2 000
Minimum monthly R 200
Income declaration 30 June & 31 December
Income distribution 15 July & 15 January
Risk statistics
Additional information Fund since inception
Number of positive months 59/82
Sharpe ratio* 1.19%
Maximum rolling 3 month gain 22.40%
Maximum rolling 3 month loss -13.67%
*Risk Free Rate used: 5.52%
Sector allocation
Absa Select Equity Fund / page 1 of 2
Absa Group Ltd 3.85
Adcock Ingram Holdings Ltd 3.77
Anglo American Plc 9.03
AVI Ltd 3.08
BHP Billiton 7.56
JD Group Ltd 3.53
Mr Price Group Ltd 4.58
Sasol Ltd 3.81
Spar Group Ltd 4.15
Standard Bank Group Ltd 3.17
Top holdings (%)
95
145
195
245
295
345
395
445
495
Mar-
04
Jun
-04
Sep
-04
Dec-0
4
Mar-
05
Jun
-05
Sep
-05
Dec-0
5
Mar-
06
Jun
-06
Sep
-06
Dec-0
6
Mar-
07
Jun
-07
Sep
-07
Dec-0
7
Mar-
08
Jun
-08
Sep
-08
Dec-0
8
Mar-
09
Jun
-09
Sep
-09
Dec-0
9
Mar-
10
Jun
-10
Sep
-10
Dec-1
0
Mar-
11
Jun
-11
Absa Select Equity Fund FTSE/JSE All Share Index TR
1.13%
2.66%
3.81%
8.56%
1.75%
1.69%
17.64%
24.51%
6.59%
3.75%
27.80%
Telecommunications
Technology
Oil & Gas
Industrial
Healthcare
Foreign Assets
Financials
Consumer Services
Consumer Goods
Cash
Basic Materials

Fund commentary
Equities were strong in December, with the All Share Index gaining over 6%. Amongst the major sectors, Telecommunications gai ned over 11%, and Oil and Gas
almost 10%. Health Care was the one major sector that underperformed in the month, gaining only 1%.
We constantly stress the importance of investing with a longer-term perspective, and over the last 5 years, the Absa Select Equity Fund has returned 18.5% p.a.,
outperforming the JSE All Share Index by more than 3% p.a. over this period. As at 31 December 2010, this means that the Absa Select Equity Fund is the top
performing fund in the General Equity category for the 5 year period, and the 3rd best performing fund for the three year period. The Fund is also in the top quar-
tile amongst its peers for the calendar year 2010. Examples of shares that have performed well over the last 12 months, and where we have been overweight,
have been Mr Price (+98%), The Foschini Group (+55%) and AVI (+54%).
Over the last couple of years, there has been dramatic stimulus by central banks and governments worldwide, and there is increasing recognition in various cir-
cles that fiscal consolidation will be required for years to come. We expect that growth in many European countries will be very sluggish for the foreseeable fu-
ture, and feel that a key issue is the extent to which a real business recovery will be able to “carry the baton” once governmental stimulus programmes start to
wane. A very important consideration is the extent to which the global economy will see employment growth over the next few years.
Whilst profit growth by companies has rebounded off very low base levels, we continue to feel that the prospects for a sustained economic recovery at a “main
street” level remain unclear. Wage increases, coupled with the strong rand, will likely eat into the margins of exporters and mining companies. Some counterbal-
ance has been provided by commodity prices, which have increased sharply from their lows. We will closely monitor global economic conditions, and particularly
the demand coming from China, in assessing the sustainability of commodity prices at these levels.
There are still pockets of value amongst some local stocks, though they are fairly difficult to find. Some stocks are trading at parity (or at a discount) with the
market at large, yet have higher earnings and dividend yields, strong business franchises and balance sheets, and better visibility of cash flows, and we have
attempted to keep our equity exposures to companies where we are comfortable with future earnings prospects.
As long-term investors, we constantly remind ourselves neither to become too flustered nor too excited by short-term fluctuations in share prices. Our long term
objective is to grow and protect the fund‟s capital by investing in financially sound companies, run by competent management and trading at a price that offers
long term value. We believe that this long term value will be unlocked over time.
DISCLAIMER
The Absa Select Equity Fund is a high risk fund. No initial charge is levied, though investments through intermediaries could include a maximum of
3.42% (incl. VAT) payable for commissions and incentives. An annual service charge of 1.14% (incl. VAT) is applicable to the Select Equity Fund to-
gether with an additional performance fee. *The performance fee is 15% of the portfolio‟s outperformance of the benchmark plus 2% (benchmark is the
JSE/FTSE All Share Index plus income thereto), is calculated and accrued daily on a twelve month rolling basis and deducted f rom income to the Fund.
**The annual management fee includes the financial adviser‟s ongoing fee of 0.285% (incl. VAT). The investor may instruct Absa Fund Managers in
writing at any time to stop the ongoing adviser fee. The Absa Select Equity Fund requires a minimum balance of R2000. Collective Investment
Schemes in Securities (Unit Trusts) are generally medium to long term investments. The value of participatory interests (units) may go down as well as
up and past performance is not necessarily a guide to the future. Forward pricing is used. Unit trust prices are calculated on a net asset value basis,
which is the total value of all assets in the portfolio including any income accrual and less any permissible deductions from the portfolio. Income is dis-
tributed half yearly and any income may be paid out into an account as nominated by the investor or be represented by additional units. All requests for
transactions received on or before 16:00 every day will be traded at ruling prices and valued after 16:00 on that day. Unit trusts are traded at ruling
prices and can engage in borrowing and scrip lending. This Fund may be closed to new investments. The Fund Manager may borrow up to 10% of the
market value of the portfolio to bridge insufficient liquidity. Fluctuations or movements in exchange rates may cause the value of underlying interna-
tional investments to go up or down. Foreign interest and dividends as well as foreign currency movements affecting capital may be fully taxable under
current legislation. This fund may invest in Financial instruments. Figures quoted are from Morningstar, for the period ending 31/12/2010, using NAV-
NAV prices, with income distributions reinvested. This product is not for sale to USA persons. The Total Expense Ratio (TER) is expressed as an annu-
alised percentage of the charges, levies and fees incurred by the portfolio related to its management, for the period from 1 October 2009 to 30 Septem-
ber 2010 against the average NAV of the portfolio over this period. A higher TER does not necessarily imply a poor return, nor does a lower TER imply
a good return. The current TER cannot be regarded as an indication of future TER's. Consult the Management Company for details. Absa Fund
Managers is a member of the Association for Savings and Investment SA.
Absa Select Equity Fund 31 December 2010
Contact details
Absa Fund Managers Limited Contact Centre: 0860 111 456 / Fax: (011) 480 5440
Reg no 1991/000881/06 Email: [email protected] / Website: www.absainvestments.co.za
Authorised Financial Services Provide - Reg No 330 Trustees
Absa Investment Campus, 65 Empire Road, Parktown, 2193 Standard Bank Trustees Services
PO Box 6115, Johannesburg, 2000 PO Box 54, Cape Town, 8000
Absa Select Equity Fund / page 2 of 2

Fund objectives
Absa Rand Protector Fund aims to offers investors long-term capital growth
as well as hedging against a depreciating rand by investing in approximately
20 large capitalisation shares that derive a significant part of their earnings in
foreign currencies. Exposure to shares will exceed 75% at all times.
Performance: total returns to 31 December 2010 (%)
Risk statistics
Additional information Fund since inception
Number of positive months 70/111
Sharpe ratio* 0.58%
Maximum rolling 3 month gain 25.62%
Maximum rolling 3 month loss -21.31%
Income distributions
Income distribution for the 6 months ended 30 Jun 2010 0.74 c.p.u
Income distribution for the 6 months ended 31 Dec 2010 2.95 c.p.u
Fund facts
Industry category Domestic - Equity - Large Cap
Performance target FTSE/JSE Top 40 Index
Inception date 28 September 2001
Fund size R 171 million
JSE code ABRF
Fund manager Stephen Arthur - B.Sc. Eng Mining, CFA
Asset management
company
Absa Asset Management (Pty) Ltd
Term
Absa
Rand
Protector
Fund
Benchmark Sector
Average Rank
Since inception 19.40 18.70 15.67 2/8
1 year 14.26 17.23 16.64 8/8
3 years 9.19 5.67 6.48 2/8
5 years 17.87 14.61 14.82 2/7
*Figures are annualised Source: Morningstar
*Index performance of Fund & Benchmark based to 100 at inception of fund
Absa Rand Protector Fund 31 December 2010
Top holdings (%)
Anglo American Plc 10.06
BHP Billiton Plc 9.37
British American Tobacco Plc 4.68
Compagnie Financiere Richemont SA 4.13
Exxaro Resources Ltd 4.49
Investec Plc 4.67
MTN Group 4.51
Naspers Ltd 3.88
SAB Miller Plc 9.42
Sasol Ltd 7.60
Fees and total expense ratio
Initial fees: Absa Fund Managers: 2.28% (VAT incl.)
Adviser: 0 - 3.42% (VAT incl.)
Annual management fee**: 1.14% (VAT incl.)
Total expense ratio: 1.19%
Cumulative performance since inception*
Low Low-Medium Medium Medium-High High
3 Months + 6 Months + 2 Years + 3 Years + 5 Years +
Risk profile and advisable minimum term
X
X Fund details
Minimum lump sum
investment
R 2 000
Minimum monthly
debit order
R 200
Income declaration 30 June & 31 December
Income distribution 15 July & 15 January
*Risk Free Rate used: 5.52%
Sector allocation
Absa Rand Protector Fund / page 1 of 2
90
140
190
240
290
340
390
440
490
540
Oct-
01
Ap
r-02
Oct-
02
Ap
r-03
Oct-
03
Ap
r-04
Oct-
04
Ap
r-05
Oct-
05
Ap
r-06
Oct-
06
Ap
r-07
Oct-
07
Ap
r-08
Oct-
08
Ap
r-09
Oct-
09
Ap
r-10
Oct-
10
Ap
r-11
Absa Rand Protector Fund FTSE/JSE Africa Top 40
4.51%
1.37%
7.60%
4.70%
2.30%
1.36%
15.37%
8.01%
9.42%
2.31%
42.23%
Telecommunications
Technology
Oil & Gas
Industrial
Holdings in CIS
Healthcare
Financials
Consumer Services
Consumer Goods
Cash
Basic Materials

Fund commentary
The Rand Protector Fund returned 14.3% for 2010 relative to 17% for the ALSI40. The Rand strengthened by 10.5% to R/$ 6.6. The performance for
the year was disappointing, however the three and five year returns are substantially above benchmark.
The developed world continues to muddle along. Pockets of strength are emerging with Germany doing particularly well. Concern over the „PIGS‟ con-
tinue, but at this stage seems well contained. The latest job data out of the US showed encouraging signs of improvement. China‟s economic growth is
still relatively robust. Commodity imports into China over the second half of the year shows no signs of weakening. Copper reached new highs, while
iron ore imports and prices remain strong. We believe that inflation will be the number one problem in China and other emerging markets this year.
Already there has been policy response with higher interest rates in most Asian countries. Hopefully this response will moderate inflationary pressures,
and growth can continue at an elevated level. Despite the good news on the Asian economic front there is a concern about world growth on the back of
the European and US situation. It will take time for these excesses to work through the system.
The reasonable economic news resulted in the equity markets doing well in 2010. There has been less talk of a double dip in the developed economies
with below trend economic growth the most likely scenario. Our view is that the market is on the expensive side, with only modest equity returns this
year.
The Rand has surprised by its strength relative to the dollar. Longer term we are of the opinion that the Rand is over-valued and will require some real
term depreciation for South Africa to remain competitive. The risk is that as more confidence returns to the US, that the dollar carry trade reverses, and
the Rand weakens quite quickly.
The portfolios resources exposure is currently50.5%. This is in line with our benchmark. We believe that good earnings growth have come through in
the second half of 2010. The weak dollar has resulted in commodity prices in dollar terms moving upwards but if the strong Rand persists it could have
a negative impact on resource company‟s earnings. We still see upside in the sector although recent price appreciation brings the valuations closer to
fair value.
In comparing the performance of this Trust with other funds, investors should be aware that this Trust is listed under the domestic large capitalization
category. The Rand Protector is managed against a benchmark that consists of 25 shares from the Alsi 40 with good Rand hedge qualities, and will
have lower weightings in financials and domestic industrial companies relative to the other funds in this category.
DISCLAIMER
The Absa Rand Protector Fund is a medium to high risk fund. The maximum initial charge is 5.70% (incl. VAT) of consideration received and will in-
clude a maximum of 3.42% (incl. VAT) payable for commissions and incentives. An annual service charge of 1.14% (incl. VAT) against the assets of
the fund will be calculated and accrued daily. **The annual management fee includes the financial adviser‟s ongoing fee of 0.285% (incl. VAT). The
investor may instruct Absa Fund Managers in writing at any time to stop the ongoing adviser fee. The Absa Rand Protector Fund requires a minimum
balance of R2000. Collective Investment Schemes in Securities (Unit Trusts) are generally medium to long term investments. The value of participatory
interests (units) may go down as well as up and past performance is not necessarily a guide to the future. Forward pricing is used. Unit trust prices are
calculated on a net asset value basis, which is the total value of all assets in the portfolio including any income accrual and less any permissible deduc-
tions from the portfolio. Income is distributed half yearly and any income may be paid out into an account as nominated by the investor or be repre-
sented by additional units. All requests for transactions received on or before 16:00 every day will be traded at ruling pric es and valued after 16:00 on
that day. Unit trusts are traded at ruling prices and can engage in borrowing and scrip lending. This Fund may be closed to new investments. The Fund
Manager may borrow up to 10% of the market value of the portfolio to bridge insufficient liquidity. Fluctuations or movements in exchange rates may
cause the value of underlying international investments to go up or down. Foreign interest and dividends as well as foreign c urrency movements affect-
ing capital may be fully taxable under current legislation. Figures quoted are from Morningstar, for the period ending 31/12/2010, using NAV-NAV
prices, with income distributions reinvested. This product is not for sale to USA persons. The Total Expense Ratio (TER) is expressed as an annualised
percentage of the charges, levies and fees incurred by the portfolio related to its management, for the period from 1 October 2009 to 30 September
2010 against the average NAV of the portfolio over this period. A higher TER does not necessarily imply a poor return, nor does a lower TER imply a
good return. The current TER cannot be regarded as an indication of future TER's. Consult the Management Company for details. Absa Fund Manag-
ers is a member of the Association for Savings and Investment SA.
Absa Rand Protector Fund 31 December 2010
Contact details
Absa Fund Managers Limited Contact Centre: 0860 111 456 / Fax: (011) 480 5440
Reg no 1991/000881/06 Email: [email protected] / Website: www.absainvestments.co.za
Authorised Financial Services Provide - Reg No 330 Trustees
Absa Investment Campus, 65 Empire Road, Parktown, 2193 Standard Bank Trustees Services
PO Box 6115, Johannesburg, 2000 PO Box 54, Cape Town, 8000
Absa Rand Protector Fund / page 2 of 2

*Index performance of Fund & Benchmark based to 100 at inception of fund
Absa US Dollar Income Fund 31 December 2010
Fund objectives
This rand denominated offshore fund aims to offer investors a consistent
foreign income as well as hedging against a depreciating rand. Securities to
be included in the fund will mainly consist of US Dollar denominated interest
bearing securities. Both capital and interest will be exposed to currency
fluctuations.
Fund facts
Industry category Foreign -Fixed Income -Varied Specialist
Performance target US Dollar 90 Day Deposit Rate
Inception date 20 November 2006
Fund size R 240 million
JSE code ABUD
Fund manager Greg Kettles - B Com (Hons), CA(SA),
CFA
Asset management
company
Absa Asset Management (Pty) Ltd
Fund details
Minimum lump sum R 2 000
Minimum monthly R 200
Income declaration 31 March, 30 June, 30 September &
31 December
Income distribution 15 April, 15 July, 15 October &
15 January
Credit exposure (%)
AAA 30.68
AA 49.60
A 19.72
Fees and total expense ratio
Initial fees: Absa Fund Managers: 0.57% (VAT incl.)
Adviser: 0.57% (VAT incl.)
Annual management fee**: 0.86% (VAT incl.)
Total expense ratio: 0.88%
Asset allocation
Cumulative performance since inception*
Performance: total returns to 31 December 2010 (%)
Term
Absa US
Dollar
Income Fund
Benchmark ZAR/USD
1 year -9.66 -10.23 -10.55
3 years 0.41 0.34 -0.95
5 years N/A N/A N/A
* Figures are annualised Source: Morningstar
Income distributions
Distribution for the 3 months ended 31 Mar 2010 0.00 c.p.u
Distribution for the 3 months ended 30 Jun 2010 0.00 c.p.u
Distribution for the 3 months ended 30 Sept 2010 0.00 c.p.u
Distribution for the 3 months ended 31 Dec 2010 0.00 c.p.u
*Used for short to long term currency hedge.
Low Low-Medium Medium Medium-High High
3 Months + 6 Months + 2 Years + 3 Years + Varies*
Risk profile and advisable minimum term
X
X
Absa US Dollar Income Fund / page 1 of 2
88
98
108
118
128
138
148
158
168
178
No
v-0
6
Feb-0
7
May-0
7
Aug
-07
No
v-0
7
Feb-0
8
May-0
8
Aug
-08
No
v-0
8
Feb-0
9
May-0
9
Aug
-09
No
v-0
9
Feb-1
0
May-1
0
Aug
-10
No
v-1
0
Feb-1
1
May-1
1
Aug
-11
Absa US Dollar Income Fund Benchmark Rand / Dollar
47.22%
46.22%
6.56%
Dollar fixed deposits
Dollar cash
RSA cash
Fund commentary
As the market digested the announcement in November of the introduction of a further round of quantitative easing by the Federal
Reserve, whereby it will purchase $600 billion of government bonds by 30 June 2011, equity markets recovered their November
losses during December. Data releases continued to be positive on balance, yet employment data remains of concern, particularly in
the consumer driven market of the USA. Debt concerns in Europe continue to bubble just below the surface. The underlying current,
however, is that corporate results for the quarter ended 31 December 2010 will be very good. Global bond yields rose quite sharply
during the first half of the month before declining slightly before month end. The outlook for inflation remains unclear in the short term,
but fears of deflation do appear to be receding. The Rand strengthened significantly against the US Dollar over the month, closing at
R6.62/USD at the end of December 2010 from R7.09/USD at the end of November 2010.
Short term yields were volatile but range bound during December, closing the month near the bottom of the range.
The effective interest yield earned on the fund as at end of the month was 0.49%.
Investments will continue to be concentrated as close to the benchmark as possible, keeping duration at the short end of the
mandated range.
DISCLAIMER
The Absa US Dollar Income Fund is a low to medium risk fund. The maximum initial charge is 1.14% (incl. VAT) of consideration received and will in-
clude a maximum of 0.57% (incl. VAT) payable for commissions and incentives. An annual service charge of 0.86% (incl. VAT) against the assets of
the fund will be calculated and accrued daily. **The annual management fee includes the financial adviser‟s ongoing fee of 0.17% (incl. VAT). The in-
vestor may instruct Absa Fund Managers in writing at any time to stop the ongoing adviser fee. The Absa US Dollar Income Fund requires a minimum
balance of R2000. Collective Investment Schemes in Securities (Unit Trusts) are generally medium to long term investments. The value of participatory
interests (units) may go down as well as up and past performance is not necessarily a guide to the future. Fluctuations or movements in exchange
rates may cause the value of underlying international investments to go up or down. Forward pricing is used. Unit trust prices are calculated on a net
asset value basis, which is the total value of all assets in the portfolio including any income accrual and less any permissible deductions from the port-
folio. Income is distributed quarterly and any income may be paid out into an account as nominated by the investor or be represented by additional
units. All requests for transactions received on or before 16:00 every day will be traded at ruling prices and valued after 16:00 on that day. Unit trusts
are traded at ruling prices and can engage in borrowing and scrip lending. This Fund may be closed to new investments. The Fund Manager may bor-
row up to 10% of the market value of the portfolio to bridge insufficient liquidity. Fluctuations or movements in exchange rates may cause the value of
underlying international investments to go up or down. Foreign interest and dividends as well as foreign currency movements affecting capital may be
fully taxable under current legislation. Figures quoted are from Morningstar, for the period ending 31/12/2010, using NAV-NAV prices, with income
distributions reinvested. This product is not for sale to USA persons. The Total Expense Ratio (TER) is expressed as an annualised percentage of the
charges, levies and fees incurred by the portfolio related to its management, for the period from 1 October 2009 to 30 September 2010 against the
average NAV of the portfolio over this period. A higher TER does not necessarily imply a poor return, nor does a lower TER imply a good return. The
current TER cannot be regarded as an indication of future TER's. Consult the Management Company for details. Absa Fund Managers is a member of
the Association for Savings and Investment SA.
Absa US Dollar Income Fund 31 December 2010
Contact details
Absa Fund Managers Limited Contact Centre: 0860 111 456 / Fax: (011) 480 5440
Reg no 1991/000881/06 Email: [email protected] / Website: www.absainvestments.co.za
Authorised Financial Services Provide - Reg No 330 Trustees
Absa Investment Campus, 65 Empire Road, Parktown, 2193 Standard Bank Trustees Services
PO Box 6115, Johannesburg, 2000 PO Box 54, Cape Town, 8000
Absa US Dollar Income Fund / page 2 of 2

*Index performance of Fund & Benchmark based to 100 at inception of fund
Absa Euro Income Fund 31 December 2010
Fund objectives
This rand denominated offshore fund aims to offer investors a consistent
foreign income as well as hedging against a depreciating rand. Securities to
be included in the fund will mainly consist of Euro denominated interest
bearing securities. Both capital and interest will be exposed to currency
fluctuations.
Fund facts
Industry category Foreign -Fixed Income -Varied Specialist
Performance target Euro 90 Day Deposit Rate
Inception date 20 November 2006
Fund size R 101 million
JSE code ABEI
Fund manager Greg Kettles - B Com (Hons), CA(SA),
CFA
Asset management
company
Absa Asset Management (Pty) Ltd
Fund details
Minimum lump sum R 2 000
Minimum monthly R 200
Income declaration 31 March, 30 June, 30 September &
31 December
Income distribution 15 April, 15 July, 15 October &
Credit exposure (%)
AAA 24.84
AA 52.33
A 22.83
Asset allocation
Cumulative performance since inception*
Performance: total returns to 31 December 2010 (%)
Term Absa Euro
Income Fund Benchmark ZAR/EURO
1 year -15.51 -15.24 -15.76
3 years -2.48 -1.87 -3.92
5 years N/A N/A N/A
* Figures are annualised Source: Morningstar
Income distributions
Distribution for the 3 months ended 31 Mar 2010 0.00 c.p.u
Distribution for the 3 months ended 30 Jun 2010 0.00 c.p.u
Distribution for the 3 months ended 30 Sep 2010 0.00 c.p.u
Distribution for the 3 months ended 31 Dec 2010 0.00 c.p.u
Fees and total expense ratio
Initial fees: Absa Fund Managers: 0.57% (VAT incl.)
Adviser: 0.57% (VAT incl.)
Annual management fee**: 0.86% (VAT incl.)
Total expense ratio: 0.89%
*Used for short to long term currency hedge.
Low Low-Medium Medium Medium-High High
3 Months + 6 Months + 2 Years + 3 Years + Varies*
Risk profile and advisable minimum term
X
X
Absa Euro Income Fund / page 1 of 2
93
103
113
123
133
143
153
163
No
v-0
6
Jan
-07
Mar-
07
May-0
7
Jul-
07
Sep
-07
No
v-0
7
Jan
-08
Mar-
08
May-0
8
Jul-
08
Sep
-08
No
v-0
8
Jan
-09
Mar-
09
May-0
9
Jul-
09
Sep
-09
No
v-0
9
Jan
-10
Mar-
10
May-1
0
Jul-
10
Sep
-10
No
v-1
0
Jan
-11
Mar-
11
May-1
1
Absa Euro Income Fund Benchmark Rand / Euro
42.37%
52.32%
5.31%
Euro fixed deposits
Euro cash
RSA cash

Fund commentary
As the market digested the announcement in November of the introduction of a further round of quantitative easing by the Federal
Reserve, whereby it will purchase $600 billion of government bonds by 30 June 2011, equity markets recovered their November
losses during December. Data releases continued to be positive on balance, yet employment data remains of concern, particularly in
the consumer driven market of the USA. Debt concerns in Europe continue to bubble just below the surface. The underlying current,
however, is that corporate results for the quarter ended 31 December 2010 will be very good. Global bond yields rose quite sharply
during the first half of the month before declining slightly before month end. The outlook for inflation remains unclear in the short term,
but fears of deflation do appear to be receding. The Rand again strengthened meaningfully against the Euro over the month, closing at
R8.84/EUR at the end of December 2010 from R9.22/EUR at the end of November 2010.
Short term yields again remained flat during the month.
The effective interest yield earned on the fund as at end of the month was 0.85%.
Investments will continue to be concentrated as close to the benchmark as possible, keeping duration at the short end of the man-
dated range.
DISCLAIMER
The Absa Euro Income Fund is a low to medium risk fund. The maximum initial charge is 1.14% (incl. VAT) of consideration received and will include a
maximum of 0.57% (incl. VAT) payable for commissions and incentives. An annual service charge of 0.86% (incl. VAT) against the assets of the fund
will be calculated and accrued daily. **The annual management fee includes the financial adviser‟s ongoing fee of 0.17% (incl. VAT). The investor may
instruct Absa Fund Managers in writing at any time to stop the ongoing adviser fee. The Absa Euro Income Fund requires a minimum balance of
R2000. Collective Investment Schemes in Securities (Unit Trusts) are generally medium to long term investments. The value of participatory interests
(units) may go down as well as up and past performance is not necessarily a guide to the future. Fluctuations or movements in exchange rates may
cause the value of underlying international investments to go up or down. Forward pricing is used. Unit trust prices are calculated on a net asset value
basis, which is the total value of all assets in the portfolio including any income accrual and less any permissible deductions from the portfolio. Income
is distributed quarterly and any income may be paid out into an account as nominated by the investor or be represented by additional units. All requests
for transactions received on or before 16:00 every day will be traded at ruling prices and valued after 16:00 on that day. Unit trusts are traded at ruling
prices and can engage in borrowing and scrip lending. This Fund may be closed to new investments. The Fund Manager may borrow up to 10% of the
market value of the portfolio to bridge insufficient liquidity. Fluctuations or movements in exchange rates may cause the value of underlying interna-
tional investments to go up or down. Foreign interest and dividends as well as foreign currency movements affecting capital may be fully taxable under
current legislation. Figures quoted are from Morningstar, for the period ending 31/12/2010, using NAV-NAV prices, with income distributions reinvested.
This product is not for sale to USA persons. The Total Expense Ratio (TER) is expressed as an annualised percentage of the charges, levies and fees
incurred by the portfolio related to its management, for the period from 1 October 2009 to 30 September 2010 against the average NAV of the portfolio
over this period. A higher TER does not necessarily imply a poor return, nor does a lower TER imply a good return. The current TER cannot be re-
garded as an indication of future TER's. Consult the Management Company for details. Absa Fund Managers is a member of the Association for Sav-
ings and Investment SA.
Absa Euro Income Fund 31 December 2010
Contact details
Absa Fund Managers Limited Contact Centre: 0860 111 456 / Fax: (011) 480 5440
Reg no 1991/000881/06 Email: [email protected] / Website: www.absainvestments.co.za
Authorised Financial Services Provide - Reg No 330 Trustees
Absa Investment Campus, 65 Empire Road, Parktown, 2193 Standard Bank Trustees Services
PO Box 6115, Johannesburg, 2000 PO Box 54, Cape Town, 8000
Absa Euro Income Fund / page 2 of 2

*Index performance of Fund & Benchmark based to 100 at inception of fund
Absa Pound Sterling Income Fund 31 December 2010
Fund objectives
This rand denominated offshore fund aims to offer investors a consistent
foreign income as well as hedging against a depreciating rand. Securities to
be included in the fund will mainly consist of British Pound denominated
interest bearing securities. Both capital and interest will be exposed to
currency fluctuations.
Fund facts
Industry category Foreign -Fixed Income -Varied Specialist
Performance target Pound Sterling 90 Day Deposit Rate
Inception date 20 November 2006
Fund size R 88 million
JSE code ABPS
Fund manager Greg Kettles - B Com (Hons), CA(SA),
CFA
Asset management
company
Absa Asset Management (Pty) Ltd
Fund details
Minimum lump sum
investment
R 2 000
Minimum monthly
debit order
R 200
Income declaration 31 March, 30 June, 30 September &
31 December
Income distribution 15 April, 15 July, 15 October &
15 January
Credit exposure (%)
AAA 24.66
AA 48.64
A 26.70
Asset allocation
Cumulative performance since inception*
Performance: total returns to 31 December 2010 (%)
Term
Absa Pound
Sterling
Income Fund
Benchmark ZAR/GBP
1 year -12.82 -12.66 -13.14
3 years -7.56 -6.76 -8.92
5 years N/A N/A N/A
* Figures are annualised Source: Morningstar
Income distributions
Distribution for the 3 months ended 31 Mar 2010 0.00 c.p.u
Distribution for the 3 months ended 30 Jun 2010 0.00 c.p.u
Distribution for the 3 months ended 30 Sep 2010 0.00 c.p.u
Distribution for the 3 months ended 31 Dec 2010 0.00 c.p.u
Fees and total expense ratio
Initial fees: Absa Fund Managers: 0.57% (VAT incl.)
Adviser: 0.57% (VAT incl.)
Annual management fee**: 0.86% (VAT incl.)
Total expense ratio: 0.92%
*Used for short to long term currency hedge.
Low Low-Medium Medium Medium-High High
3 Months + 6 Months + 2 Years + 3 Years + Varies*
Risk profile and advisable minimum term
X
X
Absa Pound Sterling Income Fund / page 1 of 2
73
83
93
103
113
123
133
No
v-0
6
Feb-0
7
May-0
7
Aug
-07
No
v-0
7
Feb-0
8
May-0
8
Aug
-08
No
v-0
8
Feb-0
9
May-0
9
Aug
-09
No
v-0
9
Feb-1
0
May-1
0
Aug
-10
No
v-1
0
Feb-1
1
May-1
1
Absa Pound Sterling Income Fund Benchmark Rand/Pound
45.77%
48.63%
5.60%
Sterling fixed deposits
Sterling cash
RSA cash

Fund commentary
As the market digested the announcement in November of the introduction of a further round of quantitative easing by the Federal
Reserve, whereby it will purchase $600 billion of government bonds by 30 June 2011, equity markets recovered their November
losses during December. Data releases continued to be positive on balance, yet employment data remains of concern, particularly in
the consumer driven market of the USA. Debt concerns in Europe continue to bubble just below the surface. The underlying current,
however, is that corporate results for the quarter ended 31 December 2010 will be very good. Global bond yields rose quite sharply
during the first half of the month before declining slightly before month end. The outlook for inflation remains unclear in the short term,
but fears of deflation do appear to be receding. The Rand strengthened strongly against Sterling over the month, closing R10.31/GBP
at the end of December 2010 from R11.04/GBP at the end of November 2010.
Short term yields rose marginally during the course of December.
The effective interest yield earned on the fund as at end of the month was 0.97%.
Investments will continue to be concentrated as close to the benchmark as possible, keeping duration at the short end of the man-
dated range.
DISCLAIMER
The Absa Pound Sterling Income Fund is a low to medium risk fund. The maximum initial charge is 1.14% (incl. VAT) of consideration received and will
include a maximum of 0.57% (incl. VAT) payable for commissions and incentives. An annual service charge of 0.86% (incl. VAT) against the assets of
the fund will be calculated and accrued daily. **The annual management fee includes the financial adviser‟s ongoing fee of 0.17% (incl. VAT). The in-
vestor may instruct Absa Fund Managers in writing at any time to stop the ongoing adviser fee. The Absa Pound Sterling Income Fund requires a mini-
mum balance of R2000. Collective Investment Schemes in Securities (Unit Trusts) are generally medium to long term investments. The value of partici-
patory interests (units) may go down as well as up and past performance is not necessarily a guide to the future. Fluctuations or movements in ex-
change rates may cause the value of underlying international investments to go up or down. Forward pricing is used. Unit trus t prices are calculated on
a net asset value basis, which is the total value of all assets in the portfolio including any income accrual and less any permissible deductions from the
portfolio. Income is distributed quarterly and any income may be paid out into an account as nominated by the investor or be represented by additional
units. All requests for transactions received on or before 16:00 every day will be traded at ruling prices and valued after 16:00 on that day. Unit trusts
are traded at ruling prices and can engage in borrowing and scrip lending. This Fund may be closed to new investments. The Fund Manager may bor-
row up to 10% of the market value of the portfolio to bridge insufficient liquidity. Fluctuations or movements in exchange rates may cause the value of
underlying international investments to go up or down. Foreign interest and dividends as well as foreign currency movements affecting capital may be
fully taxable under current legislation. Figures quoted are from Morningstar, for the period ending 31/12/2010, using NAV-NAV prices, with income
distributions reinvested. This product is not for sale to USA persons. The Total Expense Ratio (TER) is expressed as an annualised percentage of the
charges, levies and fees incurred by the portfolio related to its management, for the period from 1 October 2009 to 30 September 2010 against the
average NAV of the portfolio over this period. A higher TER does not necessarily imply a poor return, nor does a lower TER imply a good return. The
current TER cannot be regarded as an indication of future TER's. Consult the Management Company for details. Absa Fund Managers is a member of
the Association for Savings and Investment SA.
Absa Pound Sterling Income Fund 31 December 2010
Contact details
Absa Fund Managers Limited Contact Centre: 0860 111 456 / Fax: (011) 480 5440
Reg no 1991/000881/06 Email: [email protected] / Website: www.absainvestments.co.za
Authorised Financial Services Provide - Reg No 330 Trustees
Absa Investment Campus, 65 Empire Road, Parktown, 2193 Standard Bank Trustees Services
PO Box 6115, Johannesburg, 2000 PO Box 54, Cape Town, 8000
Absa Pound Sterling Income Fund / page 2 of 2

*Index performance of Fund & Benchmark based to 100 at inception of fund
Absa Global Bond Fund 31 December 2010
Fund objectives
This rand denominated fund offers investors medium to long-term income
growth while at the same time displaying rand-hedge qualities. The full
spectrum of investments includes interest bearing securities of differing terms
to maturity, taking into account changes in international interest rates, credit
risk and liquidity.
Fund facts
Industry category Foreign - Fixed Interest - Bond
Performance target Citigroup World Government Bond 3-7
years
Inception date 1 November 2000
Fund size R 82 million
JSE code ABDB
Fund manager Greg Kettles - B Com (Hons), CA(SA),
CFA
Asset management
company
Absa Asset Management (Pty) Ltd
Fund details
Minimum lump sum
investment
R 2 000
Minimum monthly
debit order
R 500
Income declaration 31 March, 30 June, 30 September &
31 December
Income distribution 15 April, 15 July, 15 October &
15 January
Astrazeneca Plc 4.43
Diago Capital BV 4.78
E on International 3.37
GDF Suez 3.75
Germany 4 BDS 8.02
KFW Bankengruppe 4.68
Mcdonalds Corp 4.14
New Zealand (Gov) 4.44
Toyota Finance Australia 4.48
Unilever NV 4.15
Top holdings (%)
Asset allocation
Cumulative performance since inception*
Income distributions
Distribution for the 3 months ended 31 Mar 2010 0.41 c.p.u
Distribution for the 3 months ended 30 Jun 2010 0.80 c.p.u
Distribution for the 3 months ended 30 Sep 2010 0.00 c.p.u
Distribution for the 3 months ended 31 Dec 2010 0.00 c.p.u
Fees and total expense ratio
Initial fees: Absa Fund Managers: 0.57% (VAT incl.)
Adviser: 0 - 0.57% (VAT incl.)
Annual management fee**: 1.43% (VAT incl.)
Total expense ratio: 1.46%
Low Low-Medium Medium Medium-High High
3 Months + 6 Months + 2 Years + 3 Years + 5 Years +
Risk profile and advisable minimum term
X
X
Performance: total returns to 31 December 2010 (%)
Term
Absa
Global Bond
Fund
Sector
Average Rank
Since inception 4.79 4.44 5/8
1 year -11.78 -6.9 8/8
3 years 3.6 3.59 6/8
5 years 7.03 6.44 4/8
* Figures are annualised Source: Morningstar
Absa Global Bond Fund / page 1 of 2
100
120
140
160
180
200
220
240
260
280
No
v-0
0
May-0
1
No
v-0
1
May-0
2
No
v-0
2
May-0
3
No
v-0
3
May-0
4
No
v-0
4
May-0
5
No
v-0
5
May-0
6
No
v-0
6
May-0
7
No
v-0
7
May-0
8
No
v-0
8
May-0
9
No
v-0
9
May-1
0
No
v-1
0
Absa Global Bond Fund Citigroup World Government Bond
25.37%
74.63%
Cash
Bonds

Fund commentary
As the market digested the announcement in November of the introduction of a further round of quantitative easing by the Federal
Reserve, whereby it will purchase $600 billion of government bonds by 30 June 2011, equity markets recovered their November
losses during December. Data releases continued to be positive on balance, yet employment data remains of concern, particularly in
the consumer driven market of the USA. Debt concerns in Europe continue to bubble just below the surface. The underlying current,
however, is that corporate results for the quarter ended 31 December 2010 will be very good.
Global bond yields rose quite sharply during the first half of the month before declining slightly before month end. The outlook for infla-
tion remains unclear in the short term, but fears of deflation do appear to be receding.
While equities appear to have a little bit of “froth” built into their prices, bond yields had anticipated the worst. The dec line in yields
experienced recently was brought about by a so-called “flight to quality” by investors, coupled with purchases ahead of the quantitative
easing mentioned above. Yields now appear to be on an upward trajectory and, barring any surprises, the duration of the fund will
remain short at this time.
DISCLAIMER
The Absa Global Bond Fund is a low to medium risk fund. The maximum initial charge is 1.14% (incl. VAT) of consideration received and will include a
maximum of 0.57% (incl. VAT) payable for commissions and incentives. An annual service charge of 1.43% (incl. VAT) against the assets of the fund
will be calculated and accrued daily. **The annual management fee includes the financial adviser‟s ongoing fee of 0.17% (incl. VAT). The investor may
instruct Absa Fund Managers in writing at any time to stop the ongoing adviser fee. The Absa Global Bond Fund requires a minimum balance of
R2000. Collective Investment Schemes in Securities (Unit Trusts) are generally medium to long term investments. The value of participatory interests
(units) may go down as well as up and past performance is not necessarily a guide to the future. Forward pricing is used. Uni t trust prices are calcu-
lated on a net asset value basis, which is the total value of all assets in the portfolio including any income accrual and less any permissible deductions
from the portfolio. Income is distributed quarterly and any income may be paid out into an account as nominated by the investor or be represented by
additional units. All requests for transactions received on or before 16:00 every day will be traded at ruling prices and valued after 16:00 on that day.
Unit trusts are traded at ruling prices and can engage in borrowing and scrip lending. This Fund may be closed to new investments. The Fund Manager
may borrow up to 10% of the market value of the portfolio to bridge insufficient liquidity. Fluctuations or movements in exchange rates may cause the
value of underlying international investments to go up or down. Foreign interest and dividends as well as foreign currency movements affecting capital
may be fully taxable under current legislation. Figures quoted are from Morningstar, for the period ending 31/12/2010, using NAV-NAV prices, with
income distributions reinvested. This product is not for sale to USA persons. The Total Expense Ratio (TER) is expressed as an annualised percentage
of the charges, levies and fees incurred by the portfolio related to its management, for the period from 1 October 2009 to 30 September 2010 against
the average NAV of the portfolio over this period. A higher TER does not necessarily imply a poor return, nor does a lower TER imply a good return.
The current TER cannot be regarded as an indication of future TER's. Consult the Management Company for details. Absa Fund Managers is a mem-
ber of the Association for Savings and Investment SA.
Absa Global Bond Fund 31 December 2010
Contact details
Absa Fund Managers Limited Contact Centre: 0860 111 456 / Fax: (011) 480 5440
Reg no 1991/000881/06 Email: [email protected] / Website: www.absainvestments.co.za
Authorised Financial Services Provide - Reg No 330 Trustees
Absa Investment Campus, 65 Empire Road, Parktown, 2193 Standard Bank Trustees Services
PO Box 6115, Johannesburg, 2000 PO Box 54, Cape Town, 8000
Absa Global Bond Fund / page 2 of 2

*Index performance of Fund & Benchmark based to 100 at base year 2000
Absa International Fund 31 December 2010
Fund objectives
This rand denominated offshore general equity fund aims investors long-term
capital growth as well as hedging against a depreciating rand by investing
mainly in developed markets (United States of America, Europe, United
Kingdom and Japan) companies, with bias to large capitalisation shares.
Exposure to shares will exceed 75% at all times.
Fund facts
Industry category Foreign - Equity - General
Performance target MSCI $ World Index
Inception date 1 November 1994
Fund size R 153 million
JSE code ABIF
Fund manager Greg Kettles - B Com (Hons), CA(SA),
CFA
Asset management
company
Absa Asset Management (Pty) Ltd
Fund details
Minimum lump sum
investment
R 1 000
Minimum monthly
debit order
R 100
Income declaration 30 June & 31 December
Income distribution 15 July & 15 January
Top holdings (%)
Exxon Mobil Corp Com 3.83
Essilor International 3.08
Glaxosmithkline Plc 2.74
General Electric Co 2.80
Goodrich Corp 3.85
Johnson & Johnson Co 3.11
Microsoft Corp USD 3.05
Nestle SA 3.96
Reckitt Benckiser Plc 2.86
Reinet Investments SCA NPV 2.64
Asset allocation
Cumulative performance since inception*
Performance: total returns to 31 December 2010 (%)
Term
Absa
International
Fund
Sector
Average Rank
Since inception 5.20 2.72 11/24
1 year -7.21 -2.2 24/24
3 years -11.04 -7.58 21/22
5 years -0.85 1.97 18/20
* Figures are annualised Source: Morningstar
Income distributions
Distribution for the 6 months ended 30 Jun 2010 0.47 c.p.u
Distribution for the 6 months ended 31 Dec 2010 0.00 c.p.u
Fees and total expense ratio
Initial fees: Absa Fund Managers: 2.28% (VAT incl.)
Adviser: 0 - 3.42% (VAT incl.)
Annual management fee**: 1.71% (VAT incl.)
Total expense ratio: 1.74%
Low Low-Medium Medium Medium-High High
3 Months + 6 Months + 2 Years + 3 Years + 5 Years +
Risk profile and advisable minimum term
X
X
Absa International Fund / page 1 of 2
55
65
75
85
95
105
115
125
135
145
No
v-0
0
Jun
-01
Jan
-02
Au
g-0
2
Mar
-03
Oct
-03
May
-04
De
c-0
4
Jul-
05
Feb
-06
Sep
-06
Ap
r-0
7
No
v-0
7
Jun
-08
Jan
-09
Au
g-0
9
Mar
-10
Oct
-10
May
-11
Absa International Fund MSCI$ World Index
1.05%
12.45%
82.35%
4.15%
Local Equity
Local Cash
International Equities
International Cash
Fund commentary
As the market digested the announcement in November of the introduction of a further round of quantitative easing by the Federal
Reserve, whereby it will purchase $600 billion of government bonds by 30 June 2011, equity markets recovered their November
losses during December. Data releases continued to be positive on balance, yet employment data remains of concern, particularly in
the consumer driven market of the USA. Debt concerns in Europe continue to bubble just below the surface. The underlying current,
however, is that corporate results for the quarter ended 31 December 2010 will be very good.
Global bond yields rose quite sharply during the first half of the month before declining slightly before month end. The outlook for infla-
tion remains unclear in the short term, but fears of deflation do appear to be receding.
While the current environment leads us to remain cautious in our outlook, we believe that solid investment opportunities will continue
to present themselves.
DISCLAIMER
The Absa International Fund is a high risk fund. The maximum initial charge is 5.70% (incl. VAT) of consideration received and will include a maximum
of 3.42% (incl. VAT) payable for commissions and incentives. An annual service charge of 1.71% (incl.VAT) against the assets of the Fund will be cal-
culated and accrued daily. **The annual management fee includes the financial adviser‟s ongoing fee of 0.285% (incl. VAT). The investor may instruct
Absa Fund Managers in writing at any time to stop the ongoing adviser fee. The Absa International Fund requires a minimum balance of R1000. Collec-
tive Investment Schemes in Securities (Unit Trusts) are generally medium to long term investments. The value of participatory interests (units) may go
down as well as up and past performance is not necessarily a guide to the future. Forward pricing is used. Unit trust prices are calculated on a net as-
set value basis, which is the total value of all assets in the portfolio including any income accrual and less any permissible deductions from the portfolio.
Income is distributed half yearly and any income may be paid out into an account as nominated by the investor or be represented by additional units.
All requests for transactions received on or before 16:00 every day will be traded at ruling prices and valued after 16:00 on that day. Unit trusts are
traded at ruling prices and can engage in borrowing and scrip lending. This Fund may be closed to new investments. The Fund Manager may borrow
up to 10% of the market value of the portfolio to bridge insufficient liquidity. Fluctuations or movements in exchange rates may cause the value of un-
derlying international investments to go up or down. Foreign interest and dividends as well as foreign currency movements affecting capital may be fully
taxable under current legislation. Figures quoted are from Morningstar, for the period ending 31/12/2010, using NAV-NAV prices, with income distribu-
tions reinvested. This product is not for sale to USA persons. The Total Expense Ratio (TER) is expressed as an annualised percentage of the
charges, levies and fees incurred by the portfolio related to its management, for the period from 1 October 2009 to 30 September 2010 against the
average NAV of the portfolio over this period. A higher TER does not necessarily imply a poor return, nor does a lower TER imply a good return. The
current TER cannot be regarded as an indication of future TER's. Consult the Management Company for details. Absa Fund Managers is a member of
the Association for Savings and Investment SA.
Absa International Fund 31 December 2010
\
Absa Fund Managers Limited Contact Centre: 0860 111 456 / Fax: (011) 480 5440
Reg no 1991/000881/06 Email: [email protected] / Website: www.absainvestments.co.za
Authorised Financial Services Provide - Reg No 330 Trustees
Absa Investment Campus, 65 Empire Road, Parktown, 2193 Standard Bank Trustees Services
PO Box 6115, Johannesburg, 2000 PO Box 54, Cape Town, 8000
Absa International Fund / page 2 of 2

Head Office : Absa Investments Campus
65 Empire Road, Parktown, Johannesburg
Telephone : 011 480 5000
[email protected] www.absainvestments.co.za
Unit Trusts
Telephone : 0860 111 456