Embed Size (px)
Citation preview
LETTERdoi:10.1038/nature13472
Abrupt pre-Bølling–Allerød warming andcirculation changes in the deep oceanNivedita Thiagarajan1, Adam V. Subhas1, John R. Southon2, John M. Eiler1 & Jess F. Adkins1
Several large and rapid changes in atmospheric temperature and thepartial pressure of carbon dioxide in the atmosphere1—probably linkedto changes in deep ocean circulation2—occurred during the last degla-ciation. The abrupt temperature rise in the Northern Hemisphereand the restart of the Atlantic meridional overturning circulationat the start of the Bølling–Allerød interstadial, 14,700 years ago, areamong the most dramatic deglacial events3, but their underlying phys-ical causes are not known. Here we show that the release of heat fromwarm waters in the deep North Atlantic Ocean probably triggered theBølling–Allerød warming and reinvigoration of the Atlantic meridi-onal overturning circulation. Our results are based on coupled radiocar-bon and uranium-series dates, along with clumped isotope temperatureestimates, from water column profiles of fossil deep-sea corals in alimited area of the western North Atlantic. We find that during Hein-rich stadial 1 (the cool period immediately before the Bølling–Allerødinterstadial), the deep ocean was about three degrees Celsius warmerthan shallower waters above. This reversal of the ocean’s usual ther-mal stratification pre-dates the Bølling–Allerød warming and musthave been associated with increased salinity at depth to preserve thestatic stability of the water column. The depleted radiocarbon contentof the warm and salty water mass implies a long-term disconnect fromrapid surface exchanges, and, although uncertainties remain, is mostconsistent with a Southern Ocean source. The Heinrich stadial 1 oceanprofile is distinct from the modern water column, that for the LastGlacial Maximum and that for the Younger Dryas, suggesting thatthe patterns we observe are a unique feature of the deglacial climatesystem. Our observations indicate that the deep ocean influenceddramatic Northern Hemisphere warming by storing heat at depththat preconditioned the system for a subsequent abrupt overturn-ing event during the Bølling–Allerød interstadial.
Understanding the cause of abrupt terminations of glacial periods isa central question in palaeoclimate as these rapid warmings character-ize the ‘sawtooth’ nature of glacial cycles4. The last deglaciation started,18 kyr ago in the Southern Hemisphere with an increase in temperature1
and greenhouse gas concentration1 and a retreat of sea ice5. For over 3 kyrAntarctica warmed while Greenland and the North Atlantic remainedcold. This period, known as Heinrich stadial 1 (HS1), ended abruptly14.7 kyr ago at the start of the Bølling–Allerød, when sea ice retreatedin the north5, the Atlantic meridional overturning circulation (AMOC)restarted2 and the Northern hemisphere dramatically warmed1, with acorresponding return to cold conditions in the south1. Explanations forthe Bølling–Allerød shift have focused on the AMOC restart and includea variety of triggers6–9. Here we use coupled U-series and 14C ages andclumped isotope (D47; Methods) temperature measurements on deep-sea corals from the New England seamounts to reconstruct ocean tem-peratures and circulation along a depth transect (Methods). We find thatthe deep ocean at our site was characterized by warmer waters under-neath colder waters ,800 yr before the beginning of the Bølling–Allerød.This unusual scenario implies that salt stratification of the water columnstored potential energy at depth, giving the deep ocean a fundamentalrole in the restart of the AMOC at the beginning of the Bølling–Allerød.
Figure 1 shows new and previously published10,11 D14C values for theYounger Dryas and two time slices during HS1. Prior to 15.6 kyr ago, theD14C of the water column was offset from the contemporaneous atmo-sphere by 110–195%. This value is much larger than the modern NorthAtlantic offset of ,70%, implying that the HS1 ocean was less well ven-tilated (older) than the modern ocean. At that time,D14C decreased fromtop to bottom in the profile. At 15.6 kyr ago there was a sudden, largeshift to even more 14C-depleted waters at intermediate depths. This ‘mid-15-kyr’ event is observed within the skeletons of two separate corals,JFA 24.8 and JFA 24.19, both found at 1,784 m. As previously reported,this large shift, contemporaneous with a constantD14C at greater depths(2,000–2,400 m), is consistent with a lateral influx of very 14C-depleted,southern-sourced intermediate waters10,11, implying a water mass bound-ary at depth between rapidly changing upper waters and less variantdeep waters.
The timing of this change in D14C is surprising because these mid-15-kyr changes do not appear to correlate in time with either the airtemperature records from Greenland ice cores or the largest changes inatmospheric gas concentration1. However, mid-HS1 variability has previ-ously been observed and was first described in the character and sourceregion of icebergs reaching the Iberian margin12 (called the HS1a–HS1btransition), and pre- Bølling–Allerød changes have been seen in othermarine records (Methods). Here we propose a scenario where the mid-15-kyr changes are unique to the intermediate and upper portions ofthe deep ocean.
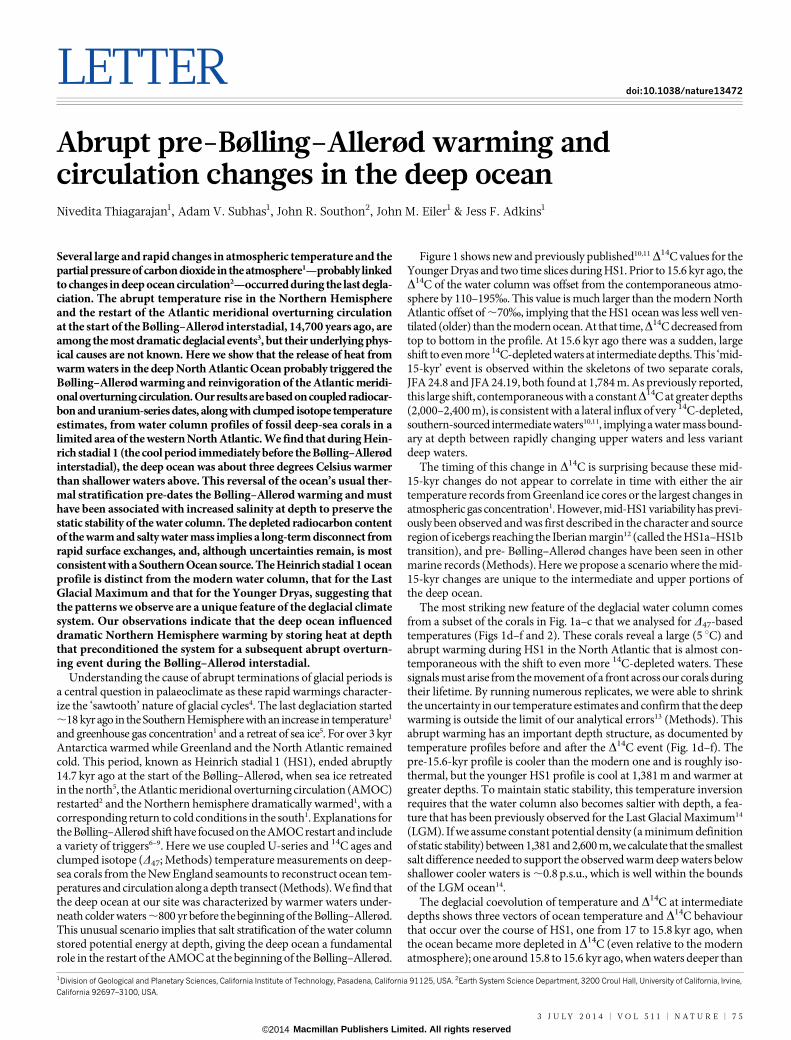
The most striking new feature of the deglacial water column comesfrom a subset of the corals in Fig. 1a–c that we analysed for D47-basedtemperatures (Figs 1d–f and 2). These corals reveal a large (5 uC) andabrupt warming during HS1 in the North Atlantic that is almost con-temporaneous with the shift to even more 14C-depleted waters. Thesesignals must arise from the movement of a front across our corals duringtheir lifetime. By running numerous replicates, we were able to shrinkthe uncertainty in our temperature estimates and confirm that the deepwarming is outside the limit of our analytical errors13 (Methods). Thisabrupt warming has an important depth structure, as documented bytemperature profiles before and after the D14C event (Fig. 1d–f). Thepre-15.6-kyr profile is cooler than the modern one and is roughly iso-thermal, but the younger HS1 profile is cool at 1,381 m and warmer atgreater depths. To maintain static stability, this temperature inversionrequires that the water column also becomes saltier with depth, a fea-ture that has been previously observed for the Last Glacial Maximum14
(LGM). If we assume constant potential density (a minimum definitionof static stability) between 1,381 and 2,600 m, we calculate that the smallestsalt difference needed to support the observed warm deep waters belowshallower cooler waters is ,0.8 p.s.u., which is well within the boundsof the LGM ocean14.
The deglacial coevolution of temperature and D14C at intermediatedepths shows three vectors of ocean temperature and D14C behaviourthat occur over the course of HS1, one from 17 to 15.8 kyr ago, whenthe ocean became more depleted in D14C (even relative to the modernatmosphere); one around 15.8 to 15.6 kyr ago, when waters deeper than
1Division of Geological and Planetary Sciences, California Institute of Technology, Pasadena, California 91125, USA. 2Earth System Science Department, 3200 Croul Hall, University of California, Irvine,California 92697–3100, USA.
3 J U L Y 2 0 1 4 | V O L 5 1 1 | N A T U R E | 7 5
Macmillan Publishers Limited. All rights reserved©2014
M
0 100 200 300 400 0 100 200 300 400 0 100 200 300 400
Δ14C (‰) Δ14C (‰) Δ14C (‰)
15.8–15.61 kyr ago 15.6–15.1 kyr ago 12.2–11.7
kyr ago
Temperature (oC) Temperature (oC) Temperature (oC)
15.8–15.6
kyr ago15.6–15.1
kyr ago 12.2–11.7
kyr ago
–4 –2 0 2 4 6 8 10 –4 –2 0 2 4 6 8 10 –4 –2 0 2 4 6 8 10
1,000
a cb
d fe
1,400
1,800
2,200
2,600
Dep
th (m
)
1,000
1,400
1,800
2,200
2,600
1,000
1,400
1,800
2,200
2,600
1,000
1,400
1,800
2,200
2,600
Dep
th (m
)
1,000
1,400
1,800
2,200
2,600
1,000
1,400
1,800
2,200
2,600
Schematic of coral: JFA 24.8
TopBottom
30 mm
g
Co
nte
mp
ora
neo
us a
tmo
sp
here
Co
nte
mp
ora
neo
us a
tmo
sp
here
Co
nte
mp
ora
neo
us a
tmo
sp
here
Mo
dern
Tem
pera
ture
B
B
B
M
T
T
T
M B
T B
T
B B
MT
JFA 24.8 and
24.19 (see g)
JFA 24.19:
3.4 ± 0.9 oC
Temperature
3.8 ± 1.4 oC
58 ± 34
Δ14C
60 ± 16
JFA 24.8:
JFA 24.19:
2.9 ± 1.0 oC
Temperature
3.6 ± 1.2 oC
164 ± 25
Δ14C
146 ± 32
JFA 24.8:
Figure 1 | Ocean profiles of D14C and temperature during three differenttime intervals. a–c, D14C profiles. Points outlined in black have alsobeen measured for temperature. There is an abrupt shift in D14C(D14C~1,000|(e{14Cage=8,033=e{Calage=8,266{1), where 14Cage and Calage
are respectively the radiocarbon age and the calendar age of the coral) atmid-15-kyr. T, M and B refer to analyses made on the top, middle and bottom
of a coral sample, respectively. Symbols with no letters refer to the top of thecoral. Error bars are 1 s.e.m. d–f, Temperature profiles. Unlike the D14Cprofiles, the bottoms of JFA 24.8 and JFA 24.19 are on the 15.6–15.1-kyr panel(e). The value of n for each measurement is given in Source Data. g, Sketch ofcoral transects. D14C shows an abrupt shift between the tops and bottoms ofthe two corals, but there is little change in temperature.
Tem
pera
ture
(oC
)
Calendar age (yr)
Heinrich stadial 1Bølling–Allerød Heinrich stadial 1Younger Dryas
Calendar age (yr)
–2
–1
–2
–1
0
1
2
3
4
5
11,000 12,000 13,000 14,000 15,000 16,000 17,000 18,000
0
1
2
3
4
5
15,000 15,200 15,400 15,600 15,800 16,000
T
TB
B
T
T B
B
*
**
*
1,000–1,500 m
1,500–2,000 m
2,000–2,600 m
a b
Figure 2 | Temperature versus calendar age based on clumped isotopes indeep-sea corals across the deglaciation. a, The dashed lines connect the topsand bottoms of JFA 24.8 and JFA 24.19. T and B refer to the top and bottom of acoral, respectively. Error bars are 1 s.e.m. Asterisks indicate corals that haveeither a high d234Ui (which is the initial 234U/238U isotope ratio at the time of
coral growth) or a D14C greater than the atmosphere value. In both cases, thisopen-system behaviour changes the D14C values but does not change calendarages much on this plot. The value of n for each measurement is given inSource Data. b, The abrupt warming is encapsulated by the two oldest andyoungest corals within this time frame, and these corals are outlined in black.
RESEARCH LETTER
7 6 | N A T U R E | V O L 5 1 1 | 3 J U L Y 2 0 1 4
Macmillan Publishers Limited. All rights reserved©2014
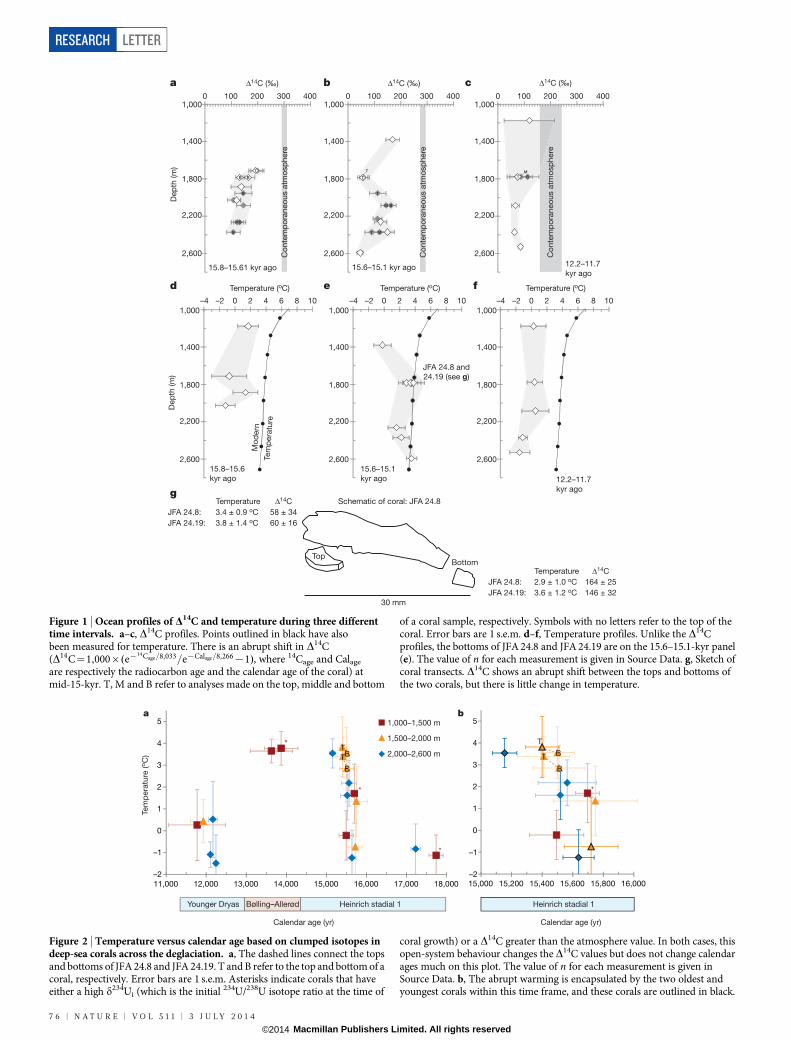
1,600 m warmed; and one from 15.6 to 15.1 kyr ago, when those samedeeper waters became even more depleted in D14C (Fig. 3). The tem-perature and D14C transitions are not simultaneous (Fig. 1g); both thetops and the bottoms of corals JFA 24.8 and JFA 24.19 are already warm,and the D14C switch occurs during their lifetime. This offset, althoughunusual, has several possible explanations. During the deglaciation, theocean–atmosphere system was not at steady state, and it is therefore pos-sible that multiple reservoirs with different heat and radiocarbon contentsinfluenced our site during HS1. Even for a single water mass, tempera-ture and carbon isotopes have different timescales for exchange at theiroutcrop region, so they may have been decoupled from each other for,100 yr during deglaciation. Regardless of the cause of the offset, thewarm, D14C-depleted water that existed by 15.4 6 0.2 kyr ago, below acolder upper layer, is a uniquely deglacial feature, with no equivalent ineither the modern or the LGM oceans.
The observation of warming at intermediate depths in the Atlanticduring HS1 has been controversial. Several regional benthic foramini-fera records show depleted d18O values that were initially interpretedas a signature of brine rejection in the Nordic Seas15, but other temper-ature records attribute the same signal to intermediate or deep oceanwarming16,17. On the basis of our clumped isotope data, at least ,1%of the benthic d18O depletion seen in these records is due to warming.Several modelling studies7,16,18 also show intermediate or deep NorthAtlantic warming during deglaciation, due to diffusion of tropical oceanheat across the main thermocline during times of slow North Atlanticoverturning. If the downward diffusion of heat were local, this scenariowould predict monotonically decreasing temperature profiles with depth16,but we see cold shallow waters above warm deeper waters at the mid-15kyr event. Given the abrupt nature of the warming in our corals, thesignal is most probably that of heat that is accumulated elsewhere andquickly brought to ,2,000 m water depth by movement of a deep front.
Other possible sources of heat to the intermediate or deep ocean includegeothermal heating19 and warming of the outcrop region for isopycnalsthat occupied our site: either could lead to the temperature inversionwe observe. Several water masses have been found during Heinrich eventsto have either warmed or exhibited depletedD14C values, and, althoughnone of these show both signatures simultaneously (Methods), an influxof southern-sourced water to our site could explain our results (ExtendedData Figs 6 and 7), because inefficient carbon isotope exchange in theoutcrop regions tends to produce low initialD14C values. Heating at thedeep-water formation zones in the Southern Hemisphere could be trans-ferred to near our site by the deep circulation. Then a pre-Bølling–Allerødshift in deep-water structure (potentially caused by winds or buoyancy
fluxes in the Southern Ocean, or both) could cause this warm front tocross our site from deeper waters to shallower.
Although the geographic origin of the warm deep waters is an impor-tant issue, the most significant feature of our new results is that the pres-ence of warm waters below colder waters, supported by salt stratification,is a natural way to build capacitance in the climate system. Warming ofthe deep ocean can explain the polar records of deglaciation and helpsus understand how the ocean moved between the stable glacial and inter-glacial states of deep circulation.
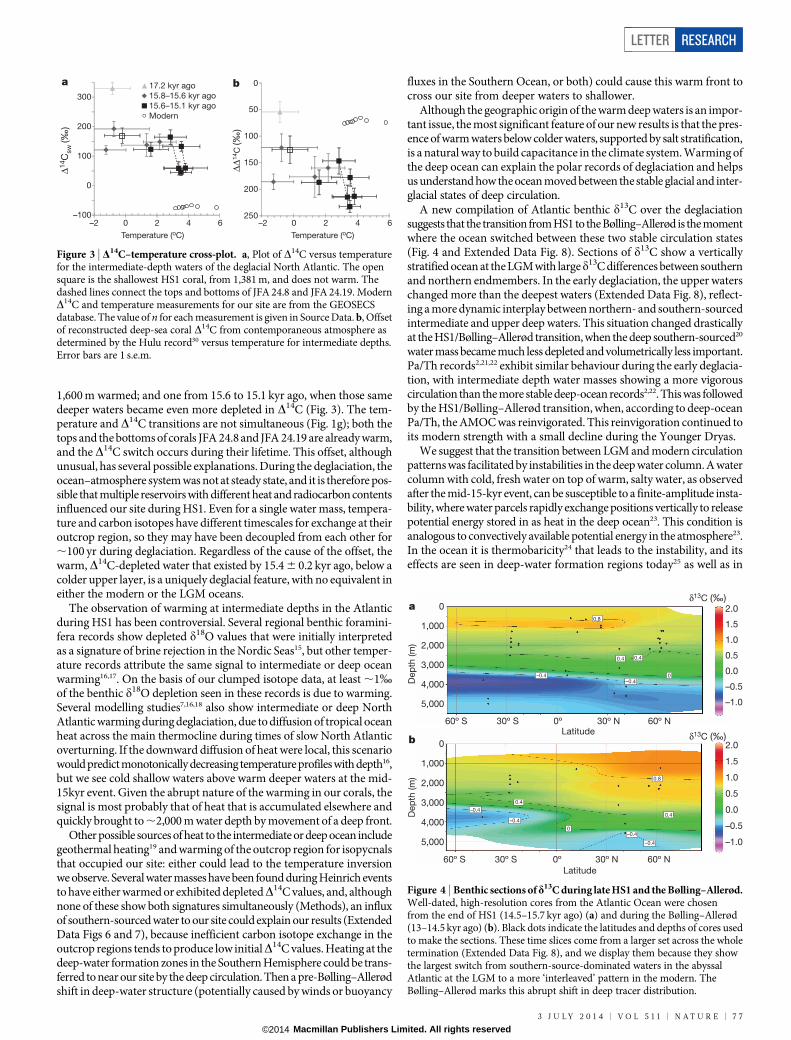
A new compilation of Atlantic benthic d13C over the deglaciationsuggests that the transition from HS1 to the Bølling–Allerød is the momentwhere the ocean switched between these two stable circulation states(Fig. 4 and Extended Data Fig. 8). Sections of d13C show a verticallystratified ocean at the LGM with larged13C differences between southernand northern endmembers. In the early deglaciation, the upper waterschanged more than the deepest waters (Extended Data Fig. 8), reflect-ing a more dynamic interplay between northern- and southern-sourcedintermediate and upper deep waters. This situation changed drasticallyat the HS1/Bølling–Allerød transition, when the deep southern-sourced20
water mass became much less depleted and volumetrically less important.Pa/Th records2,21,22 exhibit similar behaviour during the early deglacia-tion, with intermediate depth water masses showing a more vigorouscirculation than the more stable deep-ocean records2,22. This was followedby the HS1/Bølling–Allerød transition, when, according to deep-oceanPa/Th, the AMOC was reinvigorated. This reinvigoration continued toits modern strength with a small decline during the Younger Dryas.
We suggest that the transition between LGM and modern circulationpatterns was facilitated by instabilities in the deep water column. A watercolumn with cold, fresh water on top of warm, salty water, as observedafter the mid-15-kyr event, can be susceptible to a finite-amplitude insta-bility, where water parcels rapidly exchange positions vertically to releasepotential energy stored in as heat in the deep ocean23. This condition isanalogous to convectively available potential energy in the atmosphere23.In the ocean it is thermobaricity24 that leads to the instability, and itseffects are seen in deep-water formation regions today25 as well as in
–100
0
100
200
300
–2 0 2 4 6
0
50
100
150
200
250–2 0 2 4 6
17.2 kyr ago
15.8–15.6 kyr ago
15.6–15.1 kyr ago
Modern
a b
Δ14C
sw
(‰)
ΔΔ1
4C
(‰)
Temperature (oC) Temperature (oC)
Figure 3 | D14C–temperature cross-plot. a, Plot of D14C versus temperaturefor the intermediate-depth waters of the deglacial North Atlantic. The opensquare is the shallowest HS1 coral, from 1,381 m, and does not warm. Thedashed lines connect the tops and bottoms of JFA 24.8 and JFA 24.19. ModernD14C and temperature measurements for our site are from the GEOSECSdatabase. The value of n for each measurement is given in Source Data. b, Offsetof reconstructed deep-sea coral D14C from contemporaneous atmosphere asdetermined by the Hulu record30 versus temperature for intermediate depths.Error bars are 1 s.e.m.
0
1,000
2,000
3,000
4,000
5,000
60º S 30º S 0º 30º N 60º N
Dep
th (m
)
0
–0.4
–0.4
–0.4
–0.4
–0.4
–0.4
0.4 0.4
0.4
0.4
0
0
0.8
0.8
1,000
2,000
3,000
4,000
5,000
60º S 30º S 0º 30º N 60º N
Dep
th (m
)
a
bLatitude
Latitude
2.0
1.5
1.0
0.5
0.0
–0.5
–1.0
2.0
1.5
1.0
0.5
0.0
–0.5
–1.0
δ13C (‰)
δ13C (‰)
Figure 4 | Benthic sections of d13C during late HS1 and the Bølling–Allerød.Well-dated, high-resolution cores from the Atlantic Ocean were chosenfrom the end of HS1 (14.5–15.7 kyr ago) (a) and during the Bølling–Allerød(13–14.5 kyr ago) (b). Black dots indicate the latitudes and depths of cores usedto make the sections. These time slices come from a larger set across the wholetermination (Extended Data Fig. 8), and we display them because they showthe largest switch from southern-source-dominated waters in the abyssalAtlantic at the LGM to a more ‘interleaved’ pattern in the modern. TheBølling–Allerød marks this abrupt shift in deep tracer distribution.
LETTER RESEARCH
3 J U L Y 2 0 1 4 | V O L 5 1 1 | N A T U R E | 7 7
Macmillan Publishers Limited. All rights reserved©2014
large eddy simulation models of ocean convection26. In this scenario,the ‘trigger’ for the Bølling–Allerød AMOC restart and abrupt warm-ing was not the removal of fresh water from the surface of the NorthAtlantic27, but was instead the release of deep-ocean warmth that builtup over time. A trigger for the release can always be found by the cli-mate system (breaking internal waves that initiate vertical water move-ment, and small changes in the buoyancy budget of the surface oceanare two examples) but it is less fundamental to the physics than the build-up of the potential energy itself. Rather than being merely a response tofresh water forcing at the surface28, the deep ocean circulation has animportant role in the forcing of the dramatic Northern Hemispherewarming at the start of the Bølling–Allerød and in the bipolar nature ofdeglaciations generally. On this view, the Bølling–Allerød represents afundamental change in the density structure of the deep ocean, whenthe thermobaric instability of the whole deep water column allowed thesystem to ‘punch through’ the LGM stratification and move towardsthe modern deep Atlantic structure of warm, salty North Atlantic deepwater and cold, fresh Antarctic bottom water (Fig. 4). Whereas theYounger Dryas water column in the North Atlantic is often thought ofas a return to Heinrich-like water masses, we show that it is structuredvery differently than the HS1 water column in temperature, d13C andD14C. Mid-depth warming in the North Atlantic has also been observedat many Heinrich events16, but only HS1 led to a deglaciation. Futurework will have to establish whether salt stratification accompanied theseprevious temperature changes.
METHODS SUMMARYSamples examined in this study were obtained from the California Institute of Tech-nology deep-sea coral fossil collection. The deep-sea coral species Desmophyllumdianthus from the New England (34–40uN, 60–68uW) and Corner Rise seamounts(34–36uN, 47–53uW) (Extended Data Fig. 1) were collected in 2003–2005 usingthe deep submergence vehicles Alvin and Hercules. Collection by remotely oper-ated underwater vehicle and submarine ensured that the depth of each coral wasprecisely known and that corals were collected near growth positions. All samplesin this study were cleaned and analysed for U/Th ages, 14C ages and D47 tempera-tures (Supplementary Information).
All samples analysed for 14C and U/Th were physically cleaned and chemicallycleaned following previously established procedures11,29 (Methods). Radiocarbonages were measured at the UC-Irvine Keck-CCAMS facility on an accelerator massspectrometer. Uranium-series ages were run on a multi-collector inductively coupledplasma mass spectrometer at Caltech. All samples were bracketed by an instrumentalstandard of known isotopic composition to correct for mass bias and mass drift.
Clumped isotope measurements were made on the deep-sea corals at the CaliforniaInstitute of Technology following previously established procedures13. Deep-seacorals, unlike modern corals, have a Fe–Mn crust, and a cleaning study determinedthat physical cleaning alone gave accurate clumped isotope temperatures (ExtendedData Fig. 2). Samples were analysed multiple times (n 5 3–20) to ensure low externalstandard errors.
Benthic d 13C sections were made by compiling well-dated, high-resolution ben-thic d13C records (Methods).
Online Content Methods, along with any additional Extended Data display itemsandSourceData, are available in the online version of the paper; references uniqueto these sections appear only in the online paper.
Received 19 August 2013; accepted 7 May 2014.
1. Petit, J.-R. et al. Climate and atmospheric history of the past 420,000 years fromthe Vostok ice core, Antarctica. Nature 399, 429–436 (1999).
2. McManus, J., Francois, R., Gherardi, J., Keigwin, L. & Brown-Leger, S. Collapse andrapid resumption of Atlantic meridional circulation linked to deglacial climatechanges. Nature 428, 834–837 (2004).
3. Clark, P. U. et al. Global climate evolution during the last deglaciation. Proc. NatlAcad. Sci. USA 109, E1134–E1142 (2012).
4. Broecker, W. S. & van Donk, J. Insolation changes, ice volumes, and the O18 recordin deep-sea cores. Rev. Geophys. 8, 169–198 (1970).
5. Denton, G. H., Alley, R. B., Comer, G. C. & Broecker, W. S. The role of seasonality inabrupt climate change. Quat. Sci. Rev. 24, 1159–1182 (2005).
6. Weaver, A. J., Saenko, O. A., Clark, P. U. & Mitrovica, J. X. Meltwater pulse 1A fromAntarctica as a trigger of the Bølling-Allerød warm interval. Science 299,1709–1713 (2003).
7. Liu, Z. et al. Transient simulation of last deglaciation with a new mechanism forBølling-Allerød warming. Science 325, 310–314 (2009).
8. Rogerson, M. et al. Enhanced Mediterranean-Atlantic exchange during Atlanticfreshening phases. Geochem. Geophys. Geosyst. 11, Q08013 (2010).
9. Knorr, G. & Lohmann, G. Southern Ocean origin for the resumption of Atlanticthermohaline circulation during deglaciation. Nature 424, 532–536 (2003).
10. Adkins, J. F., Cheng, H., Boyle, E. A., Druffel, E. R. M. & Edwards, L. Deep-sea coralevidence for rapid change in ventilation of the deep North Atlantic 15,400 yearsago. Science 280, 725–728 (1998).
11. Robinson, L. F. et al. Radiocarbon variability in the western North Atlantic duringthe last deglaciation. Science 310, 1469–1473 (2005).
12. Bard, E., Rostek, F., Turon, J.-L. & Gendreau, S. Hydrological impact ofHeinrich events in the subtropical Northeast Atlantic. Science 289, 1321–1324(2000).
13. Thiagarajan, N., Adkins, J. & Eiler, J. Carbonate clumped isotope thermometry ofdeep-sea corals and implications for vital effects. Geochim. Cosmochim. Acta 75,4416–4425 (2011).
14. Adkins, J. F., McIntyre, K. & Schrag, D. P. The salinity, temperature, and d18O of theglacial deep ocean. Science 298, 1769–1773 (2002).
15. Dokken, T. & Jansen, E. Rapid changes in the mechanism of ocean convectionduring the last glacial period. Nature 401, 458–461 (1999).
16. Marcott, S. A. et al. Ice-shelf collapse from subsurface warming as a trigger forHeinrich events. Proc. Natl Acad. Sci. 108, 13415–13419 (2011).
17. Rasmussen, T. L., Thomsen, E., Labeyrie, L. & van Weering, T. C. E. Circulationchanges in the Faeroe-Shetland Channel correlating with cold events during thelast glacial period (58–10 ka). Geology 24, 937–940 (1996).
18. Shaffer, G., Olsen, S. M. & Bjerrum, C. J. Ocean subsurface warming as amechanism for coupling Dansgaard-Oeschger climate cycles and ice-raftingevents. Geophys. Res. Lett. 31, L24202 (2004).
19. Stein, C. A. & Stein, S. A model for the global variation in oceanic depth andheat-flow with lithospheric age. Nature 359, 123–129 (1992).
20. Kwon, E. Y. et al. North Atlantic ventilation of ‘‘southern-sourced’’ deep water in theglacial ocean. Paleoceanography 27, PA2208 (2012).
21. Gherardi, J.-M. et al. Evidence from the Northeastern Atlantic basin for variability inthe rate of the meridional overturning circulation through the last deglaciation.Earth Planet. Sci. Lett. 240, 710–723 (2005).
22. Gherardi, J. et al. Glacial–interglacial circulation changes inferred from231Pa/230Th sedimentary record in the North Atlantic region. Paleoceanography24, PA2204 (2009).
23. Adkins, J. F., Ingersoll, A. P. & Pasquero, C. Rapid climate change and conditionalinstability of the glacial deep ocean from the thermobaric effect and geothermalheating. Quat. Sci. Rev. 24, 581–594 (2005).
24. McDougall, T. Thermobaricity, cabbeling, and water-mass conversion. J. Geophys.Res. 92, 5448–5464 (1987).
25. Denbo, D. W. & Skyllingstad, E. D. An ocean large-eddy simulation model withapplication to deep convection in the Greenland Sea. J. Geophys. Res. 101,1095–1110 (1996).
26. Akitomo, K. Open-ocean deep convection due to thermobaricity 1. Scalingargument. J. Geophys. Res. 104, 5225–5234 (1999).
27. Ganopolski, A. & Rahmstorf, S. Rapid changes of glacial climate simulated in acoupled climate model. Nature 409, 153–158 (2001).
28. Rahmstorf, S. Bifurcations of the Atlantic thermohaline circulation in response tochanges in the hydrological cycle. Nature 378, 145–149 (1995).
29. Adkins, J. F.et al. Radiocarbondatingofdeep-sea corals. Radiocarbon 44, 567–580(2002).
30. Southon, J., Noronha, A. L., Cheng, H., Edwards, R. L. & Wang, Y. A high-resolutionrecordof atmospheric 14C based onHuluCave speleothemH82.Quat. Sci. Rev. 33,32–41 (2012).
Supplementary Information is available in the online version of the paper.
Acknowledgements We thank J.McManus andM. Miller for discussions. We also thankthe captain and crew of the RV Atlantis cruise AT7-35 and the WHOI DeepSubmergence Alvin and ABE groups.
Author Contributions N.T. and J.F.A. designed the study. N.T. collected the 14C and D47data and compiled the benthic d13C sections. J.R.S. facilitated and oversaw the 14Cmeasurements and J.M.E. facilitated and oversaw the D47 measurements. A.V.S.collected the U-series data. J.F.A. facilitated and oversaw the U-series measurements.N.T. and J.F.A. wrote the first draft of the manuscript. All authors contributed to theinterpretation and preparation of the final manuscript.
Author Information Reprints and permissions information is available atwww.nature.com/reprints. The authors declare no competing financial interests.Readers are welcome to comment on the online version of the paper. Correspondenceand requests for materials should be addressed to N.T. ([email protected]).
RESEARCH LETTER
7 8 | N A T U R E | V O L 5 1 1 | 3 J U L Y 2 0 1 4
Macmillan Publishers Limited. All rights reserved©2014
METHODSSample collection. Samples examined in this study were obtained from the Caltechdeep-sea coral fossil collection. The deep-sea coral species Desmophyllum dianthusfrom the New England (34–40uN, 60–68uW) and Corner Rise seamounts (34–36uN, 47–53uW) (Extended Data Fig. 1) were collected in 2003–2005 using thedeep submergence vehicles Alvin and Hercules. Collection by remotely operatedunderwater vehicle and submarine ensured that the depth of each coral was pre-cisely known and that corals were collected near growth positions. We selected forthe study on the basis of the reconnaissance age screening31, which yielded sufficientspecimens to form depth transects spanning 1,200–2,600 m in the water columnduring HS1 and the Younger Dryas. Two additional corals, JFA 24.8 and JFA 24.1910,were analysed for D47 temperatures along the top and bottom of each sample.Radiocarbon dating method. All samples analysed for 14C and U/Th were pre-cleaned according to established methods1. Briefly, the corals were first physicallycleaned with a Dremel tool followed by chemical cleaning: ultrasonicating alternatelyin NaOH/H2O2 and MILLI Q water, and then rinsing with methanol and brieflyleaching in HClO4/H2O2
29. After pre-cleaning, 1 g of coral was removed for U/Thanalysis. Twenty milligrams of coral was then taken to UC-Irvine for radiocarbonanalysis. There, immediately before phosphoric acid dissolution and graphitization,each sample was leached in HCl to remove ,50% of its total mass. The resultingcoral was hydrolysed in phosphoric acid, and the evolved CO2 was graphitized underH2 on an iron catalyst for 14C analysis29. Radiocarbon ages were measured at the UC-Irvine-Keck-CCAMS facility on an accelerator mass spectrometer. Radiocarbon resultsare normalized to a d13C 5 –25% and are reported as fraction modern (Fm), where‘modern’ is defined as 95% of the radiocarbon concentration of NBS Oxalic Acid I(NIST-SRM-4990) normalized to a d13C 5 219% and reported as radiocarbonage using the following equation: 14C age 5 28,033ln(Fm).Uranium-series methods. One gram of pre-cleaned coral was processed to extractU and Th following established methods32. Corals were dissolved in concentratedSeastar nitric acid and spiked with a 229Th-236U double spike. Uranium and thoriumwere scavenged from the resulting solution by iron co-precipitation. The iron pelletwas then dissolved in 8 N Seastar nitric acid. Uranium and thorium fractions wereseparated using trace-metal-clean Teflon columns and a Bio Rad AG-1X-8 cationexchange resin. Eluted fractions were dried down several times after successive drop-wise additions of concentrated perchloric acid and Seastar nitric acid.
Uranium fractions were brought up in ,500ml 5% Seastar nitric acid. Samples(but not chemistry blanks) were then intensity-matched for 234U to within 5–10%of the instrumental standard (CRM-145, opened and diluted in winter 2010). 234Uwas measured on the centre SEM with a retarding potential quadrupole to mini-mize abundance sensitivity effects. All samples were bracketed by CRM-145 to cor-rect for mass bias and mass drift. Procedural blanks for 238U and 234U accountedfor less than 0.04% of the sample signal (76 pg and 3.6 fg, respectively).
Thorium fractions were run separately, also in 5% Seastar nitric acid. 229Th and230Th were measured on Channeltron ion counters; 232Th was measured on a Fara-day cup. The 229Th and 230Th beams were kept below 35,000 c.p.s. in order to maintainthe lifetime and linearity of the ion counters. All Th samples were sample–standard-bracketed with an in-house SGS (cross-calibrated in 2010 with an older SGS andCRM-145). No significant errors were introduced by calibrating the Th SGS with auranium standard, with either a linear or an exponential mass biasing law. In orderto determine the amount of initial 230Th originating from the Th-rich ferroman-ganese crust, a 230Th/232Th ratio of (80 6 80) 3 1026 was applied to the measured232Th concentration33. Procedural blanks for 230Th and 232Th measured 4 and 22 pg,respectively. 232Th originating from the ferromanganese crust also contributed sig-nificantly to the uncertainty in the age measurement, with an average value of 611 pgfor all measured corals.d234U values were determined for the corals to test for closed-system behaviour.
The reference frame for d234U is secular equilibrium (that is, an activity ratio of 1).If the d234Ui of the coral is not within the error of modern seawater d234U (147%)then open-system behaviour is assumed and the coral is not used for theD14C calcu-lation. Seawater d234U might have been lower during the last glacial period (142%),so we checked whether our corald234U values were consistent with a step change inthed234U of sea water to lower values before 17 kyr ago, following the recommenda-tions of INTCAL0934. All but two corals lie within the d234U measurement uncer-tainty of the error envelope of the two potential d234U seawater curves determinedby INTCAL0934. These corals are not included withD14C plots but are included intemperature plots and are indicated with a star. We chose to keep them out of theD14C calculation because this number is very sensitive to the errors in the U-seriesand radiocarbon dates, but the age errors for comparison with the temperature his-tory are relatively small.D47 analysis. Deep-sea corals were first physically cleaned with a Dremel tool. Fossilcorals, unlike modern corals, typically have a Fe–Mn crust surrounding them. Thiscrust contains trapped organic matter, and can skew isotopic measurements of thebulk coral. In order to determine the best method for removing the Fe–Mn crust, a
cleaning study was performed on a modern coral and a coral with an Fe–Mn crustfrom Tasmania that had the same radiocarbon age as the modern ocean water fromwhich it was collected (Extended Data Fig. 2). Corals were cleaned in four differentways. The first was only physical cleaning with a Dremel tool, the second was phy-sical cleaning and chemical cleaning with 1:1 H2O2:NaOH, the third was physicalcleaning and chemical cleaning with 1:1 H2O2:NaOH and MeOH, and the fourthwas physical cleaning and chemical cleaning with 1:1 H2O2:NaOH, MeOH and 2%HClO4. All the chemical cleaning procedures dissolve part of the coral skeleton aswell as the Fe–Mn crust and reorganize the clumped signature. Physical cleaningwith a Dremel tool was the only method that yielded expected temperatures.
Corals were analysed for D47 temperatures using previously established methods35.Fossil corals were first cleaned with a Dremel tool and powdered with a mortarand pestle. Samples were dissolved in 105% H3PO4 at 90 uC. The evolved CO2 wasseparated from H2O using a dry-ice/ethanol trap. The CO2 was further purifiedfrom other incondensable gases using a Porapak Q 120/80 mesh column held at220 uC. The resulting CO2 was again purified using dry-ice/ethanol and nitrogentraps and expanded into the bellows of the mass spectrometer. The evolved CO2
was analysed in a dual-inlet Finnigan MAT-253 mass spectrometer with the simul-taneous collection of ion beams corresponding to cardinal masses 44–49 to obtainD47, D48, D49,d13C andd18O values13. The mass-47 beam is composed of 17O13C17O,17O12C18O and predominantly 18O13C16O, and we define R47 as the abundance ofmass 47 isotopologues divided by the mass-44 isotopologue (R47 5 [17O13C17O 117O12C18O 1 18O13C16O]/[16O12C16O]). D47 is reported relative to a stochastic dis-tribution of isotopologues for the same bulk isotopic composition (D47 5 (((R47
measured/R47
stochastic) 2 1) 2 ((R46measured/R46
stochastic) 2 1) 2 ((R45measured/R45
stochastic) 2 1))3 1,000). Mass 48 was monitored to detect any hydrocarbon contamination. Mea-surements of each gas were analysed at 16 V of mass 44 and consisted of eight acqui-sitions, each of which involved seven cycles of sample–standard comparison withan ion integration time of 26 s per cycle. Internal standard errors of this for D47
ranged from 0.004% to 0.02%, while external standard errors ranged from 0.003%to 0.011% (0.5–2.3 uC). The internal standard error for d13C ranged from 0.5 to80 p.p.m., and the internal standard error for d18O ranged from 0.9 to 36 p.p.m.The D47 raw data was corrected for instrument nonlinearity, scale compressionand acid reaction temperature35,36. The samples were then normalized to carbonatestandards run in each session. Samples were corrected for instrument nonlinearityby normalizing sample D47 to a ‘heated gas line’ evaluated at D47SA-WG. This nor-malization was done using D47,SA-HG 5 D47,SA-WG 2 D47,HG-WG, where D47HG-WG
5 md47SA-WG 1 b and m and b are respectively the slope and intercept of a heatedgas line. Several heated gases of various bulk isotopic compositions were run duringeach session. Samples were corrected for ‘scale compression’ by multiplying D47SA-HG
by a factor proportional to the intercept of the heated gas line: D47SA-HGuncompressed 5
D47,SA-HG(20.8453/b), where b is the intercept of the heated gas line (20.8453 isthe value of heated gas intercept of the heated gas line during the T–D47 calibrationreported in ref. 37). This scale compression changes over the course of time and isdifferent for different instruments. Samples were also corrected for the differentacid digestion bath temperatures. This study was conducted at a phosphoric acidtemperature of 90 uC, as opposed to the 25 uC temperature used for the inorganic37
and deep-sea coral calibration studies38. Samples were then corrected in the follow-ing way: D47SA-HG,acid 5 D47SA-HG,uncompressed 1 0.081. The additive term 0.081%is based on replicate analyses of carbonate standards at 90 uC, which can be tracedto the original calibration35. Finally, samples were normalized to carbonate stan-dards with previously determined D47, which were run and corrected in the sameway as unknown samples. Samples were corrected using the following equation:D47SA-HG,acidtrue 5 mSTDD47SA-HG,acidmeas 1 bSTD. Here mSTD and bSTD are determinedfrom the carbonate standards: D47STD-HG,acidtrue 5 mSTDD47STD-HG,acidmeas 1 bSTD.Several carbonate standards as well as 45923, a modern deep-sea coral from 7uN,56uW, 1,318 m, whose temperature of growth is 4.7 uC, were used for the standardcorrection scheme. In three sessions, the modern deep-sea coral standard was notrun, and the average of the remaining carbonate standards was used instead of usinga regression of all carbonate standards. Neither standard correction scheme changesour interpretations.Benthic d13C. Benthic d13C sections were made by compiling well-dated, high-resolution benthic d13C records39–43. The published age models were used to deter-mine ages, and sections were made using ODV.Pre-Bølling–Allerød changes (mid-HS1 variability) seen in other records. Mid-HS1 variability has previously been seen and was first described in the characterand source region of icebergs reaching the Iberian margin12 (called the HS1a–HS1btransition). Other pre-Bølling–Allerød changes, consistent with the timing of ourmid-15-kyr event, are seen in sea surface temperature records from the subpolarNorth Pacific44, and benthic temperature records from the deep North Atlantic45
and Southern Ocean46. An Atlantic compilation of D14C records also shows thatdeep cores in the South Atlantic and corals from the Drake passage all converged toa value of ,50% before the Bølling–Allerød, a value very close to what we measure
LETTER RESEARCH
Macmillan Publishers Limited. All rights reserved©2014
at the New England seamounts (Extended Data Fig. 6f). U-series dates from sta-lagmites in China show that the maximum extent of drying occurred at 16.1 6
0.6 kyr ago47, several hundred years earlier than the changes seen at our site. Thelink between mid-HS1 changes seen in terrestrial and marine records is an avenuefor further research.Calculation of D14C and DD14C. Coupled U-series and 14C ages give a directmeasure of the past D14C (ref. 48), a measurement of the time a water mass hasbeen isolated from the atmosphere. Both the radiocarbon age of the coral and thecalendar age of the coral (U/Th age) are needed to reconstruct the D14C of sea-water: D14Csw~1,000|(e{14Cage=8,033=e{Calage=8,266{1) (ref. 48).
To calculate DD14C, D14Csw was subtracted from the contemporaneous atmo-sphere value:DD14C 5D14Catmosphere 2D14Csw. The Hulu atmosphericD14C record,interpolated to the calendar age of the corals, was used as the reference frame30. Theatmospheric D14C record was also examined over 62s around the calendar age ofthe coral to determine the range ofD14Catmosphere at this time in the past. The stan-dard error of this range was then propagated through the calculation of DD14C todetermine the uncertainty in the finalD14C value. For corals whereD14C andDD14Cwas measured along a transect of the coral (JFA 24.8 and JFA 24.19), the corals areassumed to have a growth rate of 1 mm yr21 (ref. 33) with a lifetime of 100 yr. There-fore ‘‘Top’’, ‘‘Middle’’ and ‘‘Bottom’’ are assumed to be ,50 yr offset from each other.Estimation of D47 uncertainty. A typical internal standard error in a clumped iso-tope measurement for 16V of mass-44 CO2 measured for eight acquisitions withan ion integration time of 26 s per cycle is ,0.01%, which corresponds to 2 uC (1s).We wanted much smaller standard errors for our measurements than the 62 uCcorresponding to a single measurement, because deep-sea temperature changes wereexpected to be small. We have previously determined that for deep-sea corals38,increasing the number of replicate measurements can drive down the errors to aslow as ,1 uC. Therefore, we measured each deep-sea coral at least three times. Mostcoral samples were analysed at least seven times and some as many as 20. Theselarge numbers of replicate measurements of corals run over three years resulted invery small errors, as low as 60.5 uC. For the entire population of deep-sea corals,the external standard error ranged from 0.5 to 2.3 uC, with an average of 1.2 uC.
For each individual measurement we also propagated the uncertainty in the acidtemperature correction (0.0024%)35, the uncertainty for the D47 temperature equa-tion (0.005%)37 and errors from the corresponding heated gas line. The D47 tem-perature equation error may be an overestimate, as several other calibration studiesagree with the original Caltech D47 temperature equation37 and have significantlyreduced the errors of the equation.Appropriateness of the inorganic D47–temperature calibration for deep-seacorals. Deep-sea corals have previously been calibrated to the clumped isotope ther-mometer using a suite of modern corals from a variety of depths and ocean basinsat temperatures from 2 to 25 uC (ref. 13). In the current study, the coldest calculatedtemperatures are 21 uC. We think it is appropriate to extrapolate the clumped iso-tope thermometer to 21 uC because of the short range of extrapolation from thecalibration curve. The functional dependence of clumping reactions on temperatureis not arbitrary. There have been several different calibration studies of carbonates49,50
with D47–T relationships essentially identical to the inorganic clumped isotope cal-ibration curve. This means that the constraint on the D47–T slope is very tight andthe permitted extrapolations to 21 uC all give the same result.Calculation of the rate of warming at the mid-15-kyr event. Our data show arapid warming of several degrees occurring over a few hundred years (Fig. 2b). Wesee that there is temporal structure in this data outside the age error bars thatclearly shows the rapid warming is not just a cloud of points. This warming is seenbetween 1,500 and 2,600 m water column depth. Between 1,500 and 2,000 m, thewarming is spanned by two corals, JFA 24.8 top and NT 012 (whose error bars donot overlap in temperature and age), that show an increase of 4.7 6 2.7 uC over321 6 208 yr. Between 2,000 and 2,600 m, the warming is spanned by NT 022 andNT 016 (whose error bars do not overlap in temperature and age), which show asimilar warming of 4.8 6 1.5 uC over 484 6 130 yr. These warming rates must occuras a result of the movement of a front across our corals during their lifetime. We donot mean to imply that these data support heating rates of deep ocean water of thismagnitude.Calculation of timescales for various processes to cause heating at our site.Away from spreading centres with hydrothermal activity, where the heat flux ismuch higher, there is ,100 mW m22 of heat diffusing out of the Earth’s crust19.Given the heat capacity of sea water, it will take ,2,500 yr for this heat to warm a2 km-thick water mass at the bottom of the ocean by 1 uC. This is too slow a heatingrate, over too thick a water mass, to be the direct cause of heating we see in the deep-sea corals. However, this calculation assumes the heat is accumulating in a stagnantwater mass. In reality the bottom temperature is a balance of diffusive fluxes andthe advective flux of heat from the overturning circulation, such that the steady-state temperature of geothermally heated bottom water will scale inversely with theoverturning rate. We construct a simple box model of this system in Extended Data
Fig. 3. Steady-state results for a range of southern cell overturning rates and verticaldiffusivities are shown in Extended Data Fig. 4a. For a well-flushed southern cell(10 Sv of overturning) the bottom water is warmed by about 0.8 uC relative to therestoring temperature in the atmosphere, which is roughly equivalent to observa-tions51. For very slow overturning (1 Sv) this temperature increase can reach over8 uC. We then look at the effect of increasing the Southern Ocean restoring tem-perature relative to the Northern Hemisphere restoring temperature (to simulatewarming in the Southern hemisphere, which is known to have happened in theearly deglaciation1) (Extended Data Fig. 4b). We find that the temperature increasecan be as much as 11 uC for low overturning rates. We finally look at the transientsolution (Extended Data Fig. 5), where we keep the vertical diffusivity constant andthe Southern Hemisphere restoring temperature at 277 K (four degrees warmer thanthe northern restoring temperature). We find that there is a rapid warming withinthe first few thousand years. In each case there is large amount of heat storage indeep waters, which requires salt stratification, and this heat storage could be partof the high temperatures brought to our site during HS1.
Another possible heat source for intermediate or deep waters is solar heat mov-ing across the main thermocline by vertical diffusion. To calculate this heat flux, weuse Fick’s first law of diffusion (J 5 2DdC/dx), where J is the diffusion flux, D is thediffusion coefficient (1025 m s22),dC is the temperature change across the thermo-cline (,15 uC) and dx is the thickness of the main thermocline (1,000 m). Thesenumbers give a tropical thermocline heat flux to the intermediate-depth ocean of,0.6 W m22. While larger than the geothermal heating flux, solar heating wouldsimilarly require a large change in deep-water residence time to raise the temper-ature of a 2 km-thick parcel of water by 5 uC. Additionally, our observed warming isat depth, opposite to the profile predicted for diffusion across the main thermocline,making this unlikely to be the direct cause of the warmth. However, like geothermalheat, diffusion of solar heat at low latitudes could accumulate in slowly overturningwater and then be advected to our site during HS1.Comparison of D14C with other Atlantic D14C records. In the literature there areother Atlantic water masses that have either warmed or have a depletedD14C duringthe deglaciation. We explore these water masses and find the Southern Ocean isprobably the most likely to explain theD14C depletion and warmth seen at our site.In Extended Data Fig. 6a, the deep-sea coral and foraminifera data from the NewEngland seamounts are plotted and the three corals showing a warm and D14C-depleted signature at 15 kyr ago are circled in red. The water masses that have beenproposed to have either warmed or have aD14C-depleted signature are the tropicalAtlantic52, brines from Iceland53, the Mediterranean (as seen in the Mediterraneanrecords54,55 and in the Iberian Margin56,57) and the Southern Ocean58–61. First, it wouldbe difficult for tropical and Mediterranean waters to reach the deeper depths at oursite. TheD14C of thermocline and deep-dwelling planktonic foraminifera in the trop-ical Atlantic has been previously measured and determined to be almost constantlyoffset from the atmosphere by only ,100% during HS162 (Extended Data Fig. 6b).Therefore, despite the tropical Atlantic being warm, it cannot explain the D14C-depleted signature seen at the mid-15-kyr event at our site. The D14C of surfacecorals55 and foraminifera54 in the Mediterranean has been measured and in generaltheD14C is similar to the atmospheric curve (Extended Data Fig. 6d). The Mediter-ranean was not as depleted inD14C as our site, as it has aD14C of ,150% at 15 kyrago while the warm andD14C-depleted deep-sea corals have aD14C of ,0%. Dur-ing Heinrich stadials 3 and 4, a benthic Mg/Ca record from the Iberian margin showedevidence of mid-Heinrich stadial warming56. This warming was attributed to an influxof Mediterranean overflow waters to the site in question. Our data does not makeany statements about mid-HS3 and mid-HS4 warning; however, during HS1, althoughthere are D14C-depleted waters bathing the Iberian margin at 3,200 m (ExtendedData Fig. 6e), temperatures remain much cooler and there is no pre-Bølling–Allerødabrupt warming event. Instead the Iberian margin warms only several hundred yearslater at the start of the Bølling–Allerød (Extended Data Fig. 7). Therefore, althoughthe Iberian margin has previously been used to argue mid-Heinrich stadial warm-ings caused by an increase in Mediterranean overflow waters, we do not see any evi-dence for an increase in Mediterranean overflow waters to the Iberian margin orto our site. Finally, the Iceland margin has also been previously examined forD14Cduring the deglaciation53. TheD14C seen at two depths are extremely depleted, whichhas been explained as being a result of brine formation in the Nordic seas (ExtendedData Fig. 6c). Indeed at 15 kyr ago, the Icelandic margin hadD14C values similar toour D14C-depleted deep-sea corals. However it is unlikely that brines travelled toour site to impart this D14C-depleted signature, as brine formation will producecold waters and not the warm waters that we see. Extended Data Fig. 5f shows acompilation ofD14C from the Southern ocean (AAIW58,61, UCDW58, LCDW59 andAABW60). At the mid-15-kyr event, UCDW, LCDW, AABW, the corals at our siteand the Icelandic records all converge to ,50%. It has been suggested that Arcticoverflow waters are influencing theD14C signature at our site. Although that is pos-sible, the Arctic is unlikely to be able to affect theD14C of our site as well as UCDW,LCDW and AABW. Therefore, we believe it is much more likely that some vertical
RESEARCH LETTER
Macmillan Publishers Limited. All rights reserved©2014
convection is causing Southern Ocean waters all to have similar D14C values, andsome southern-sourced waters are influencing the D14C of our site as well as per-haps waters near Iceland (as previously suggested63).Evidence and mechanism for southern sourced waters to our site. Owing toinefficient carbon isotope exchange in the outcrop regions, southern-sourced waterstend to be D14C depleted. Both the D14C and heating at the deep-water formationzones in the Southern Hemisphere could be transferred to near our site by the deepcirculation. Then a pre-Bølling–Allerød shift in deep-water structure (potentiallycaused by winds or buoyancy fluxes in the Southern Ocean, or both) could havecaused this warm front to cross our site from deeper waters to shallower. Indeed,Antarctic ice cores and Southern Ocean sea surface temperature records show asustained temperature rise from ,17.8 kyr ago to the start of the Bølling–Allerød1,64.
Further evidence ofsouthern-sourced water isseeninpreviousCd/Ca measurements10
made on two of the corals in our study, which show the pre-Bølling–Allerød warmthandD14C-depletion signature. These data show that the warmth andD14C-depletionsignature is associated with an increase in Cd/Ca by a factor of two, which is con-sistent with an influx of high-nutrient or Southern-sourced waters coming to oursite. This increase in Cd/Ca during HS1 has also previously been seen in benthicforaminifera from a core off Iceland63.
Northward penetration of southern-sourced intermediate waters during degla-ciation has been controversial. Several studies report increased northward penetra-tion during the Younger Dryas and HS110,63,65, while others suggest that there was aweakening of penetration of AAIW during the deglaciation66,67. Sites that have reportedincreased northward penetration are in general deeper than the modern expressionof AAIW, while shallower sites (,1,000 m) do not see AAIW during the deglacia-tion. Our data suggest increased northward penetration of southern-sourced watersat much greater depths than seen today, consistent with previous studies and severalmodelling studies6,68.Comparison with other Atlantic d13C records. High-resolution records from theAtlantic were compiled for the past 20 kyr (refs 39–43, 53; Extended Data Fig. 8).Similar to previous compilations39, sections ofd13C show a vertically stratified oceanat the LGM with very large d13C differences between southern and northern end-members compared with the modern d13C of DIC39. Our new compilations of fourother time slices during the last deglaciation provide a view into when the oceanreorganized from an LGM to a modern-like circulation state. In the early part of thedeglaciation the upper waters changed more than the deepest waters, reflecting amore dynamic interplay between northern- and southern-sourced intermediate andupper deep waters. These data are consistent with a deep stratification at ,2,000 mwater depth at the LGM and during the early deglaciation69,70. This comparable lackof circulation dynamics in the abyssal Atlantic altered drastically at the HS1/Bølling–Allerød transition, when the very deep southern-sourced20 water mass became muchless depleted and volumetrically less important. Thus, we characterize the Bølling–Allerød as the moment when a modern-like configuration first appears. The YoungerDryas has previously been thought to reflect a return to Heinrich-like conditions;however, the d13C sections indicate that, rather than being similar to HS1, over timeduring the Younger Dryas the deep two-cell circulation structure changed to a moremodern interleaving of northern and southern water masses.
31. Thiagarajan, N. et al. Movement of deep-sea coral populations on climatictimescales. Paleoceanography 28, 227–236 (2013).
32. Robinson, L. F.et al.Deep-sea scleractiniancoral ageanddepthdistributions in thenorthwest Atlantic for the last 225,000 years. Bull. Mar. Sci. 81, 371–391 (2007).
33. Cheng, H., Adkins, J. F., Edwards, R. L. & Boyle, E. A. U-Th dating of deep-sea corals.Geochim. Cosmochim. Acta 64, 2401–2416 (2000).
34. Reimer, P. J. et al. IntCal09 and Marine09 radiocarbon age calibration curves,0-50,000 years cal BP. Radiocarbon 51, 1111–1150 (2009).
35. Passey, B. H., Levin, N. E., Cerling, T. E., Brown, F. H. & Eiler, J. M. High-temperatureenvironments of human evolution in East Africa based on bond ordering inpaleosol carbonates. Proc. Natl Acad. Sci. 107, 11245–11249 (2010).
36. Huntington, K. W. et al. Methods and limitations of ‘clumped’ CO2 isotope (D47)analysis by gas-source isotope ratio mass spectrometry. J. Mass Spectrom. 44,1318–1329 (2009).
37. Ghosh, P. et al. 13C-18O bonds in carbonate minerals: a new kind ofpaleothermometer. Geochim. Cosmochim. Acta 70, 1439–1456 (2006).
38. Thiagarajan, N., Guo, W. F., Adkins, J. & Eiler, J. Clumped isotope calibration ofmodern deep sea corals and implications for vital effects. Geochim. Cosmochim.Acta 75 4416–4425 (2009).
39. Curry, W. B.& Oppo, D. Glacial water mass geometry and the distribution of d13C oftotal CO2 in the Western Atlantic Ocean. Paleoceanography 20, PA1017 (2005).
40. Waelbroeck, C. et al. The timing of deglacial circulation changes in the Atlantic.Paleoceanography 26, PA3213 (2011).
41. Oppo, D. W. & Curry, W. B. Deep Atlantic circulation during the Last GlacialMaximum and deglaciation. Nature Edu. Knowl. 3, 1 (2012).
42. Marchal, O. & Curry, W. B. On the abyssal circulation in the glacial Atlantic. J. Phys.Oceanogr. 38, 2014–2037 (2008).
43. Tessin, A. C. & Lund, D. C. Isotopically depleted carbon in the mid-depth SouthAtlantic during the last deglaciation. Paleoceanography 28, 296–306 (2013).
44. Kiefer, T. & Kienast, M. Patterns of deglacial warming in the Pacific Ocean: a reviewwith emphasis on the time interval of Heinrich event 1. Quat. Sci. Rev. 24,1063–1081 (2005).
45. Dwyer, G. S., Cronin, T. M., Baker, P. A. & Rodriguez-Lazaro, J. Changes in NorthAtlantic deep-sea temperature during climatic fluctuations of the last 25,000years based on ostracode Mg/Ca ratios. Geochem. Geophys. Geosyst. 1, 1028(2000).
46. Chiessi, C. M. et al. SouthAtlantic interocean exchange as the trigger for the Bøllingwarm event. Geology 36, 919–922 (2008).
47. Wang, Y. J.et al. A high-resolutionabsolute-dated latePleistocenemonsoon recordfrom Hulu Cave, China. Science 294, 2345–2348 (2001).
48. Adkins, J. F.& Boyle, E. A. Changingatmospheric Delta C-14and the recordofdeepwater paleoventilation ages. Paleoceanography 12, 337–344 (1997).
49. Came, R. et al. Coupling of surface temperatures and atmospheric CO2
concentrations during the Palaeozoic era. Nature 449, 198–201 (2007).50. Tripati, A., Thiagarajan, N. & Eiler, J. ‘Clumped isotope’ thermometry in
foraminifera. Geochim. Cosmochim. Acta 72, A956 (2008).51. Emile-Geay, J. & Madec, G. Geothermal heating, diapycnal mixing and the abyssal
circulation. Ocean Sci. 5, 203–217 (2009).52. Ruhlemann,C., Mulitza, S., Muller, P. J., Wefer, G.& Zahn, R. Warming of the tropical
Atlantic Ocean and slowdown of thermohaline circulation during the lastdeglaciation. Nature 402, 511–514 (1999).
53. Thornalley, D. J. R., Elderfield, H. & McCave, I. N. Intermediate and deep waterpaleoceanography of the northern North Atlantic over the past 21,000 years.Paleoceanography 25, PA1211 (2010).
54. Siani, G. et al. Mediterranean Sea surface radiocarbon reservoir age changes sincethe last glacial maximum. Science 294, 1917–1920 (2001).
55. McCulloch, M. et al. Proliferation and demise of deep-sea corals in theMediterranean during the Younger Dryas. Earth Planet. Sci. Lett. 298, 143–152(2010).
56. Skinner, L. & Elderfield, H. Rapid fluctuations in the deep North Atlantic heatbudget during the last glacial period. Paleoceanography 22, PA1205 (2007).
57. Skinner, L. & Shackleton, N. J. Rapid transient changes in northeast Atlantic deepwater ventilationage across Termination 1. Paleoceanography 19, PA2005 (2004).
58. Burke, A. & Robinson, L. F. The Southern Ocean’s role in carbon exchange duringthe Last Deglaciation. Science 335, 557–561 (2012).
59. Skinner, L. C., Fallon, S., Waelbroeck, C., Michel, E. & Barker, S. Ventilation of thedeep Southern Ocean and deglacial CO2 rise. Science 328, 1147–1151 (2010).
60. Barker, S., Knorr, G., Vautravers, M. J., Diz, P. & Skinner, L. C. Extreme deepening oftheAtlantic overturningcirculationduringdeglaciation.NatureGeosci.3,567–571(2010).
61. De Pol-Holz, R., Keigwin, L., Southon, J., Hebbeln, D. & Mohtadi, M. No signature ofabyssal carbon in intermediate waters off Chile during deglaciation. Nature Geosci3, 192–195 (2010).
62. Cleroux,C., deMenocal, P.&Guilderson, T.Deglacial radiocarbon historyof tropicalAtlantic thermocline waters: absence of CO2 reservoir purging signal. Quat. Sci.Rev. 30, 1875–1882 (2011).
63. Rickaby, R. E. M. & Elderfield, H. Evidence from the high-latitude North Atlantic forvariations in Antarctic Intermediate water flow during the last deglaciation.Geochem. Geophys. Geosyst. 6, Q05001 (2005).
64. Sachs, J. P., Anderson, R. F. & Lehman, S. J. Glacial surface temperatures of theSoutheast Atlantic Ocean. Science 293, 2077–2079 (2001).
65. Pahnke, K., Goldstein, S. & Hemming, S. Abrupt changes in Antarctic IntermediateWater circulation over the past 25,000 years. Nature Geosci. 1, 870–874 (2008).
66. Xie, R. C., Marcantonio, F. & Schmidt, M. W. Deglacial variability of AntarcticIntermediate Water penetration into the North Atlantic from authigenicneodymium isotope ratios. Paleoceanography 27, PA3221 (2012).
67. Came, R. E., Oppo, D. W., Curry, W. B. & Lynch-Stieglitz, J. Deglacial variability in thesurface return flow of the Atlantic meridional overturning circulation.Paleoceanography 23, PA1217 (2008).
68. Saenko, O. A., Weaver, A. J. & Gregory, J. M. On the link between the two modes ofthe ocean thermohaline circulation and the formation of global-scale watermasses. J. Clim. 16, 2797–2801 (2003).
69. Lund, D. C., Adkins, J. F. & Ferrari, R. Abyssal Atlantic circulation during the LastGlacial Maximum: constraining the ratio between transport and vertical mixing.Paleoceanography 26, PA1213 (2011).
70. Adkins, J. F. The role of deep ocean circulation in setting glacial climates.Paleoceanography 28, 539–561 (2013).
71. Eltgroth, S. F., Adkins, J. F., Robinson, L., Southon, J. & Kashgarian, M. A deep-seacoral record of North Atlantic radiocarbon through the Younger Dryas: Evidencefor Intermediate/Deep water reorganization. Paleoceanography 21, PA4207(2006).
72. Keigwin, L. D. Radiocarbon and stable isotope constraints on Last GlacialMaximum and Younger Dryas ventilation in the western North Atlantic.Paleoceanography 19, PA4012 (2004).
LETTER RESEARCH
Macmillan Publishers Limited. All rights reserved©2014
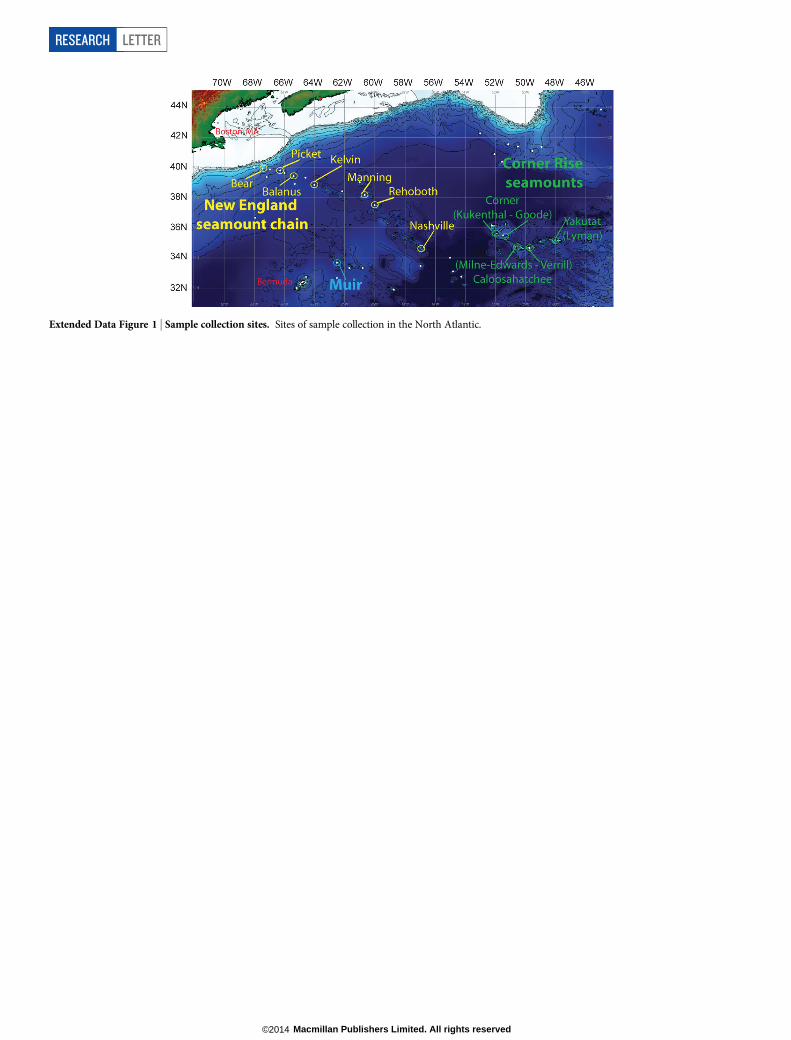
Extended Data Figure 1 | Sample collection sites. Sites of sample collection in the North Atlantic.
RESEARCH LETTER
Macmillan Publishers Limited. All rights reserved©2014
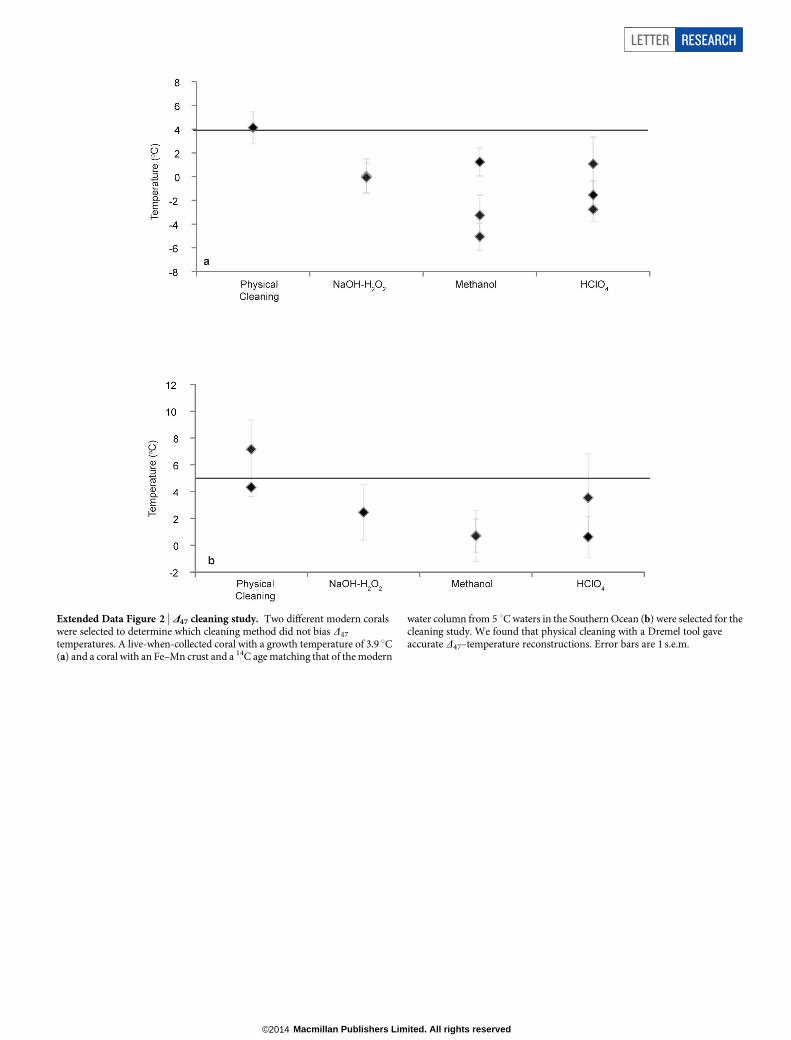
Extended Data Figure 2 | D47 cleaning study. Two different modern coralswere selected to determine which cleaning method did not bias D47
temperatures. A live-when-collected coral with a growth temperature of 3.9 uC(a) and a coral with an Fe–Mn crust and a 14C age matching that of the modern
water column from 5 uC waters in the Southern Ocean (b) were selected for thecleaning study. We found that physical cleaning with a Dremel tool gaveaccurate D47–temperature reconstructions. Error bars are 1 s.e.m.
LETTER RESEARCH
Macmillan Publishers Limited. All rights reserved©2014
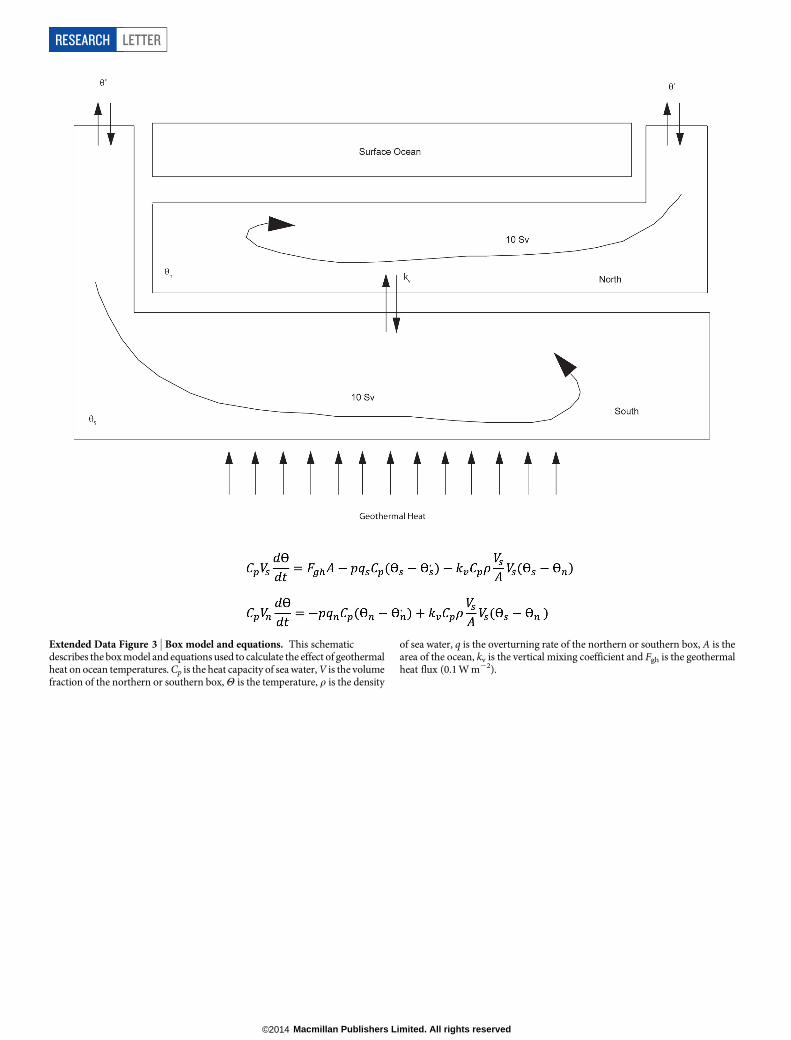
Extended Data Figure 3 | Box model and equations. This schematicdescribes the box model and equations used to calculate the effect of geothermalheat on ocean temperatures. Cp is the heat capacity of sea water, V is the volumefraction of the northern or southern box, H is the temperature, r is the density
of sea water, q is the overturning rate of the northern or southern box, A is thearea of the ocean, kv is the vertical mixing coefficient and Fgh is the geothermalheat flux (0.1 W m22).
RESEARCH LETTER
Macmillan Publishers Limited. All rights reserved©2014

Extended Data Figure 4 | Steady-state temperature change with oceanoverturning and mixing. The steady-state solutions for the box modelin Extended Data 3. a, If there is a well-flushed southern cell (10 Sv ofoverturning), the bottom water is only warmed by about 0.8 uC relative to therestoring temperature in the atmosphere. However, for a very slow overturning
(1 Sv) this temperature increase can reach over 8 uC, well above the temperaturechange seen at our site. b, Increasing the difference between the restoringtemperature in the south relative to the north can increase the warming by asmuch as 11 uC (Supplementary Fig. 4b).
LETTER RESEARCH
Macmillan Publishers Limited. All rights reserved©2014
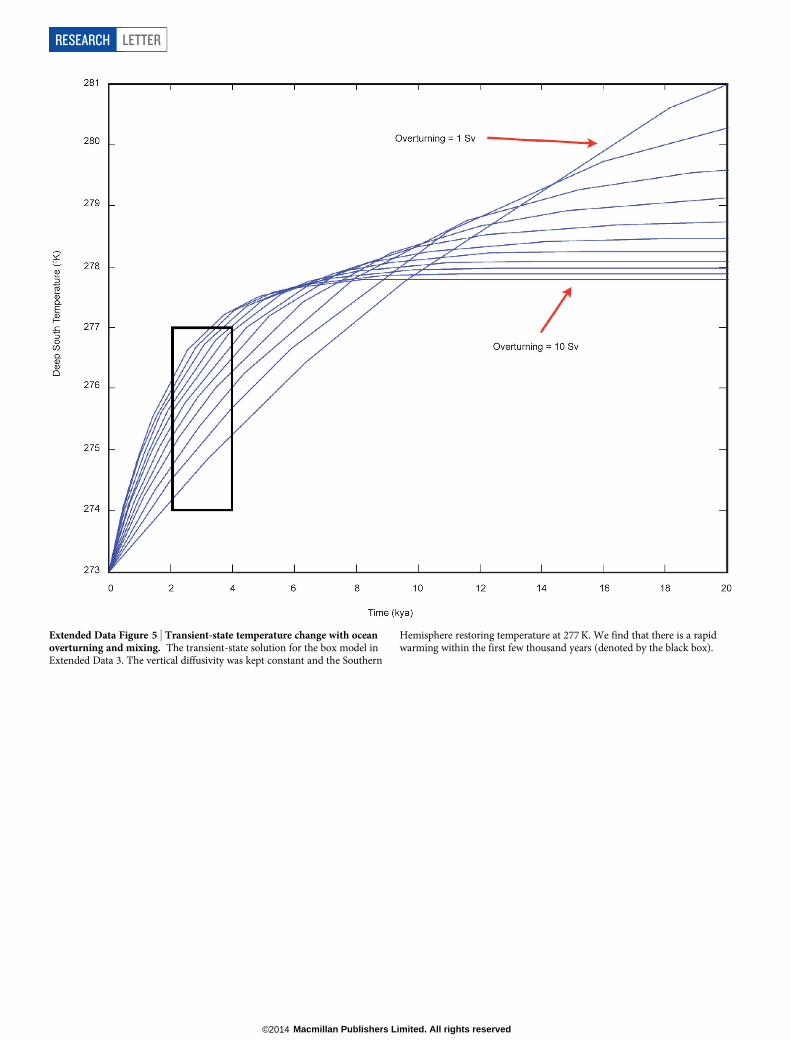
Extended Data Figure 5 | Transient-state temperature change with oceanoverturning and mixing. The transient-state solution for the box model inExtended Data 3. The vertical diffusivity was kept constant and the Southern
Hemisphere restoring temperature at 277 K. We find that there is a rapidwarming within the first few thousand years (denoted by the black box).
RESEARCH LETTER
Macmillan Publishers Limited. All rights reserved©2014
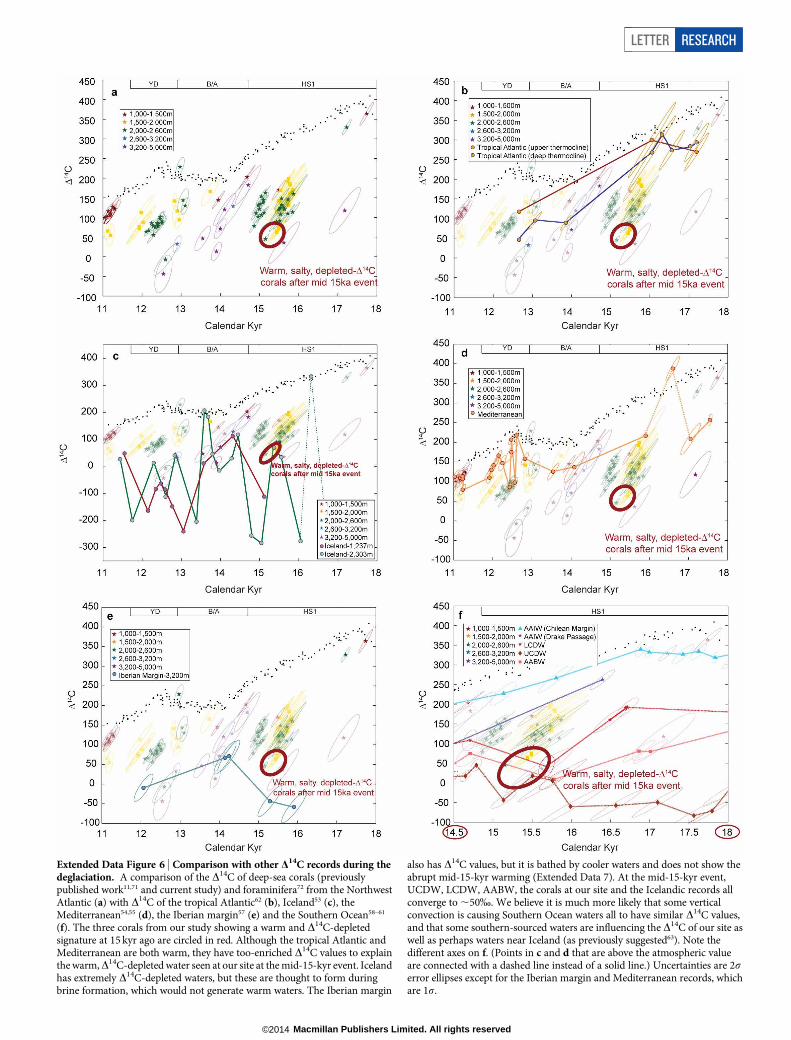
Extended Data Figure 6 | Comparison with other D14C records during thedeglaciation. A comparison of the D14C of deep-sea corals (previouslypublished work11,71 and current study) and foraminifera72 from the NorthwestAtlantic (a) with D14C of the tropical Atlantic62 (b), Iceland53 (c), theMediterranean54,55 (d), the Iberian margin57 (e) and the Southern Ocean58–61
(f). The three corals from our study showing a warm and D14C-depletedsignature at 15 kyr ago are circled in red. Although the tropical Atlantic andMediterranean are both warm, they have too-enriched D14C values to explainthe warm,D14C-depleted water seen at our site at the mid-15-kyr event. Icelandhas extremely D14C-depleted waters, but these are thought to form duringbrine formation, which would not generate warm waters. The Iberian margin
also has D14C values, but it is bathed by cooler waters and does not show theabrupt mid-15-kyr warming (Extended Data 7). At the mid-15-kyr event,UCDW, LCDW, AABW, the corals at our site and the Icelandic records allconverge to ,50%. We believe it is much more likely that some verticalconvection is causing Southern Ocean waters all to have similar D14C values,and that some southern-sourced waters are influencing the D14C of our site aswell as perhaps waters near Iceland (as previously suggested63). Note thedifferent axes on f. (Points in c and d that are above the atmospheric valueare connected with a dashed line instead of a solid line.) Uncertainties are 2serror ellipses except for the Iberian margin and Mediterranean records, whichare 1s.
LETTER RESEARCH
Macmillan Publishers Limited. All rights reserved©2014
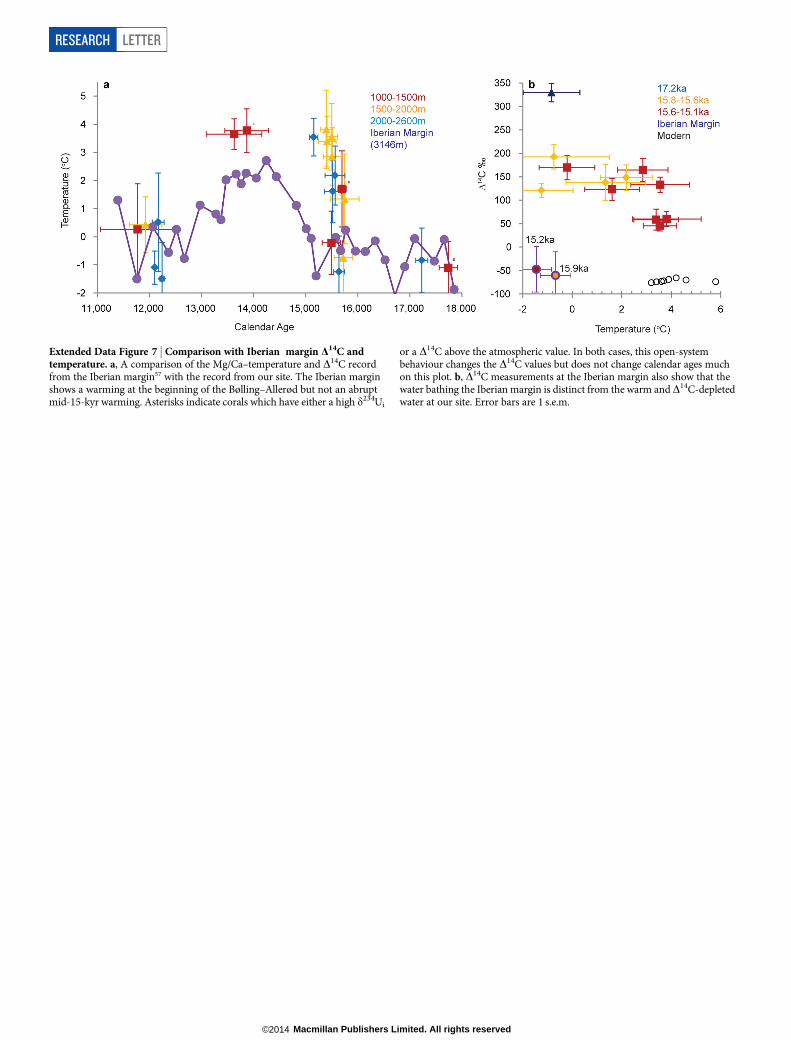
Extended Data Figure 7 | Comparison with Iberian margin D14C andtemperature. a, A comparison of the Mg/Ca–temperature and D14C recordfrom the Iberian margin57 with the record from our site. The Iberian marginshows a warming at the beginning of the Bølling–Allerød but not an abruptmid-15-kyr warming. Asterisks indicate corals which have either a high d234Ui
or a D14C above the atmospheric value. In both cases, this open-systembehaviour changes the D14C values but does not change calendar ages muchon this plot. b, D14C measurements at the Iberian margin also show that thewater bathing the Iberian margin is distinct from the warm and D14C-depletedwater at our site. Error bars are 1 s.e.m.
RESEARCH LETTER
Macmillan Publishers Limited. All rights reserved©2014
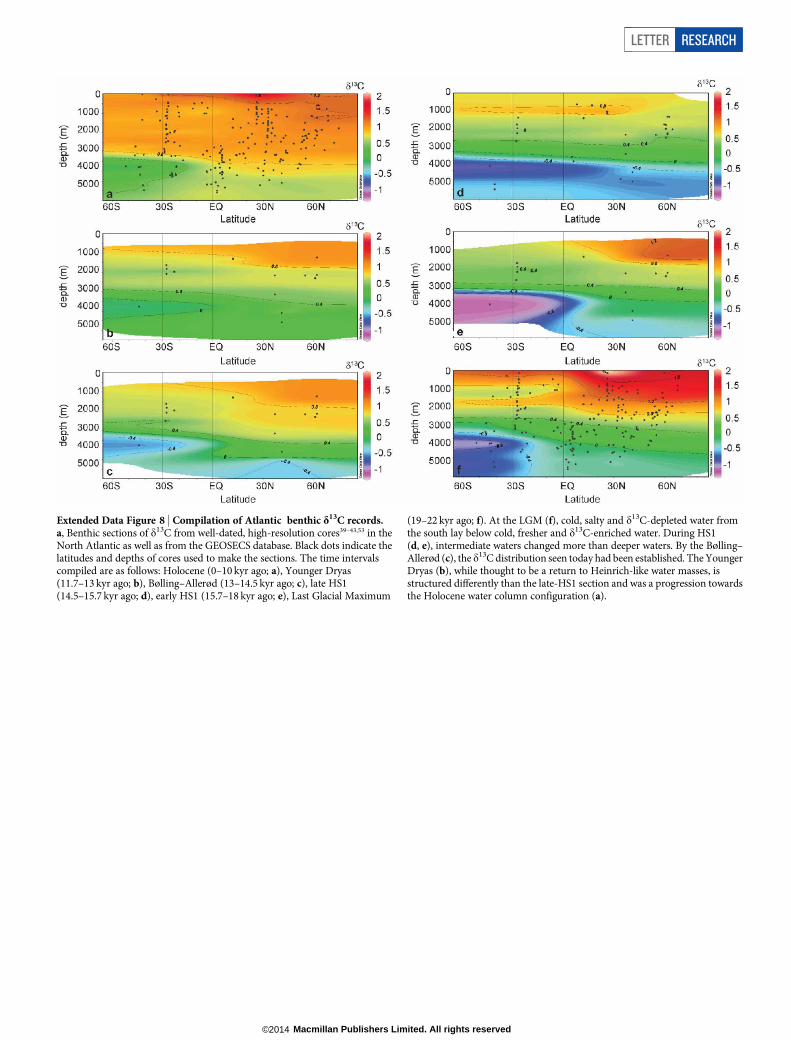
Extended Data Figure 8 | Compilation of Atlantic benthic d13C records.a, Benthic sections of d13C from well-dated, high-resolution cores39–43,53 in theNorth Atlantic as well as from the GEOSECS database. Black dots indicate thelatitudes and depths of cores used to make the sections. The time intervalscompiled are as follows: Holocene (0–10 kyr ago; a), Younger Dryas(11.7–13 kyr ago; b), Bølling–Allerød (13–14.5 kyr ago; c), late HS1(14.5–15.7 kyr ago; d), early HS1 (15.7–18 kyr ago; e), Last Glacial Maximum
(19–22 kyr ago; f). At the LGM (f), cold, salty and d13C-depleted water fromthe south lay below cold, fresher and d13C-enriched water. During HS1(d, e), intermediate waters changed more than deeper waters. By the Bølling–Allerød (c), the d13C distribution seen today had been established. The YoungerDryas (b), while thought to be a return to Heinrich-like water masses, isstructured differently than the late-HS1 section and was a progression towardsthe Holocene water column configuration (a).
LETTER RESEARCH
Macmillan Publishers Limited. All rights reserved©2014